Article

Estimation of Winter Wheat Production Potential Based on Remotely-Sensed Imagery and Process-Based Model Simulations

1
Institute of Geographic Sciences and Natural Resources Research, Chinese Academy of Sciences, Beijing 100101, China
2
College of Resources and Environment, University of Chinese Academy of Sciences, Beijing 100049, China
*
Author to whom correspondence should be addressed.
Remote Sens. 2020, 12(17), 2857; https://doi.org/10.3390/rs12172857
Submission received: 23 July 2020 / Revised: 28 August 2020 / Accepted: 1 September 2020 / Published: 3 September 2020

Abstract

:
Crop production potential is an index used to evaluate crop productivity capacity in one region. The spatial production potential can help give the maximum value of crop yield and visually clarify the prospects of agricultural development. The DSSAT (Decision Support System for Agrotechnology Transfer) model has been used in crop growth analysis, but spatial simulation and analysis at high resolution have not been widely performed for exact crop planting locations. In this study, the light-temperature production potential of winter wheat was simulated with the DSSAT model in the winter wheat planting area, extracted according to Remote Sensing (RS) image data in the Jing-Jin-Ji (JJJ) region. To obtain the precise study area, a Decision Tree (DT) classification was used to extract the winter wheat planting area. Geographic Information System (GIS) technology was used to process spatial data and provide a map of the spatial distribution of the production potential. The production potential of winter wheat was estimated in batches with the DSSAT model. The results showed that the light-temperature production potential is between 4238 and 10,774 kg/ha in JJJ. The production potential in the central part of the planting area is higher than that in the south and north in JJJ due to the influences of light and temperature. These results can be useful for crop model simulation users and decision makers in JJJ.

Graphical Abstract

1. Introduction

Crop production potential is the basic and important information in agriculture used to interpret production trends and evaluate land resource carrying capacity, especially in China, where there is a contradiction between the population and natural resources [1,2,3,4]. In China, winter wheat is one of the main food crops, and the Jing-Jin-Ji (JJJ) region is an important region for winter wheat cultivation [5,6,7]. In recent years, resources and the environment have become seriously affected by human activities, especially crop land coverage [8,9]. As the statistical data shows, the planting acreage of winter wheat has presented a decreasing trend in JJJ, declining from 2611 hectares in 2010 to 2454 hectares in 2018. However, the population has increased from 105 million in 2010 to 113 million in 2018. Obviously, there exists a contradiction between the population and crop land area. To sustain the lives of more people and ensure food security, it is necessary to study the production potential of winter wheat to figure out the maximum yield and help analyze the growth prospects of winter wheat in JJJ, where the population is large. This will provide references for decision making and give data support in other related studies.
Since the 1970s, with the development of computer technology, methods to obtain and estimate crop growth information based on Remote Sensing (RS), Geographic Information System (GIS), and crop growth models have become increasingly popular in studies, and are helpful for decision making in agriculture and policies [10,11,12,13,14]. Crop planting areas can be identified and extracted according to spectral, temporal, and spatial features reflected in RS images [15,16,17]. GIS has the function of geographic data processing and analysis, and has been widely applied to many fields, including agriculture [18,19,20]. The crop growth model provides an important means to quantify agricultural production. It can simulate physiological processes such as crop growth stage, organ formation, biomass accumulation, matter distribution, yield, and the relationship between physiological processes and the environment [21,22,23]. It has been widely used in climate change, precision agriculture, and other agricultural fields [24,25,26]. By coupling crop growth models with GIS technology, the spatial simulation problem can be solved considering the spatial heterogeneity of the soil, weather, and management. Priya and Shibasaki [27] simulated crop yield in India on a national scale with the EPIC model and GIS technology. Shi [28] estimated the productivity of winter wheat in Jiangsu Province with the WheatGrow model and GIS; Kadiyala et al. [29] simulated the spatial distribution of groundnut yields with the DSSAT model and GIS in the Anantapur district of India; Lv et al. [30] estimated wheat yield gaps and analyzed the relationships of water use efficiency of wheat using the WheatGrow and DSSAT model coupled with GIS in China. Although their studies solved the problem of spatial simulation processing, some of these studies did not obtain high-resolution soil and climate data, and none of them extracted the exact crop planting area to study the production potential of winter wheat.
In this study, the objective is to estimate the production potential of winter wheat in the planting area in JJJ at a resolution of 250 m using the DSSAT model and GIS. First, we extracted the winter wheat planting area by interpreting MODIS (Moderate Resolution Imaging Spectroradiometer) image data to define the planting region. Second, under high resolution, we estimated the production potential with the DSSAT model using soil, weather, and management data processed by GIS. Third, we analyzed the spatial distribution of the production potential of winter wheat in JJJ.

2. Materials and Methods
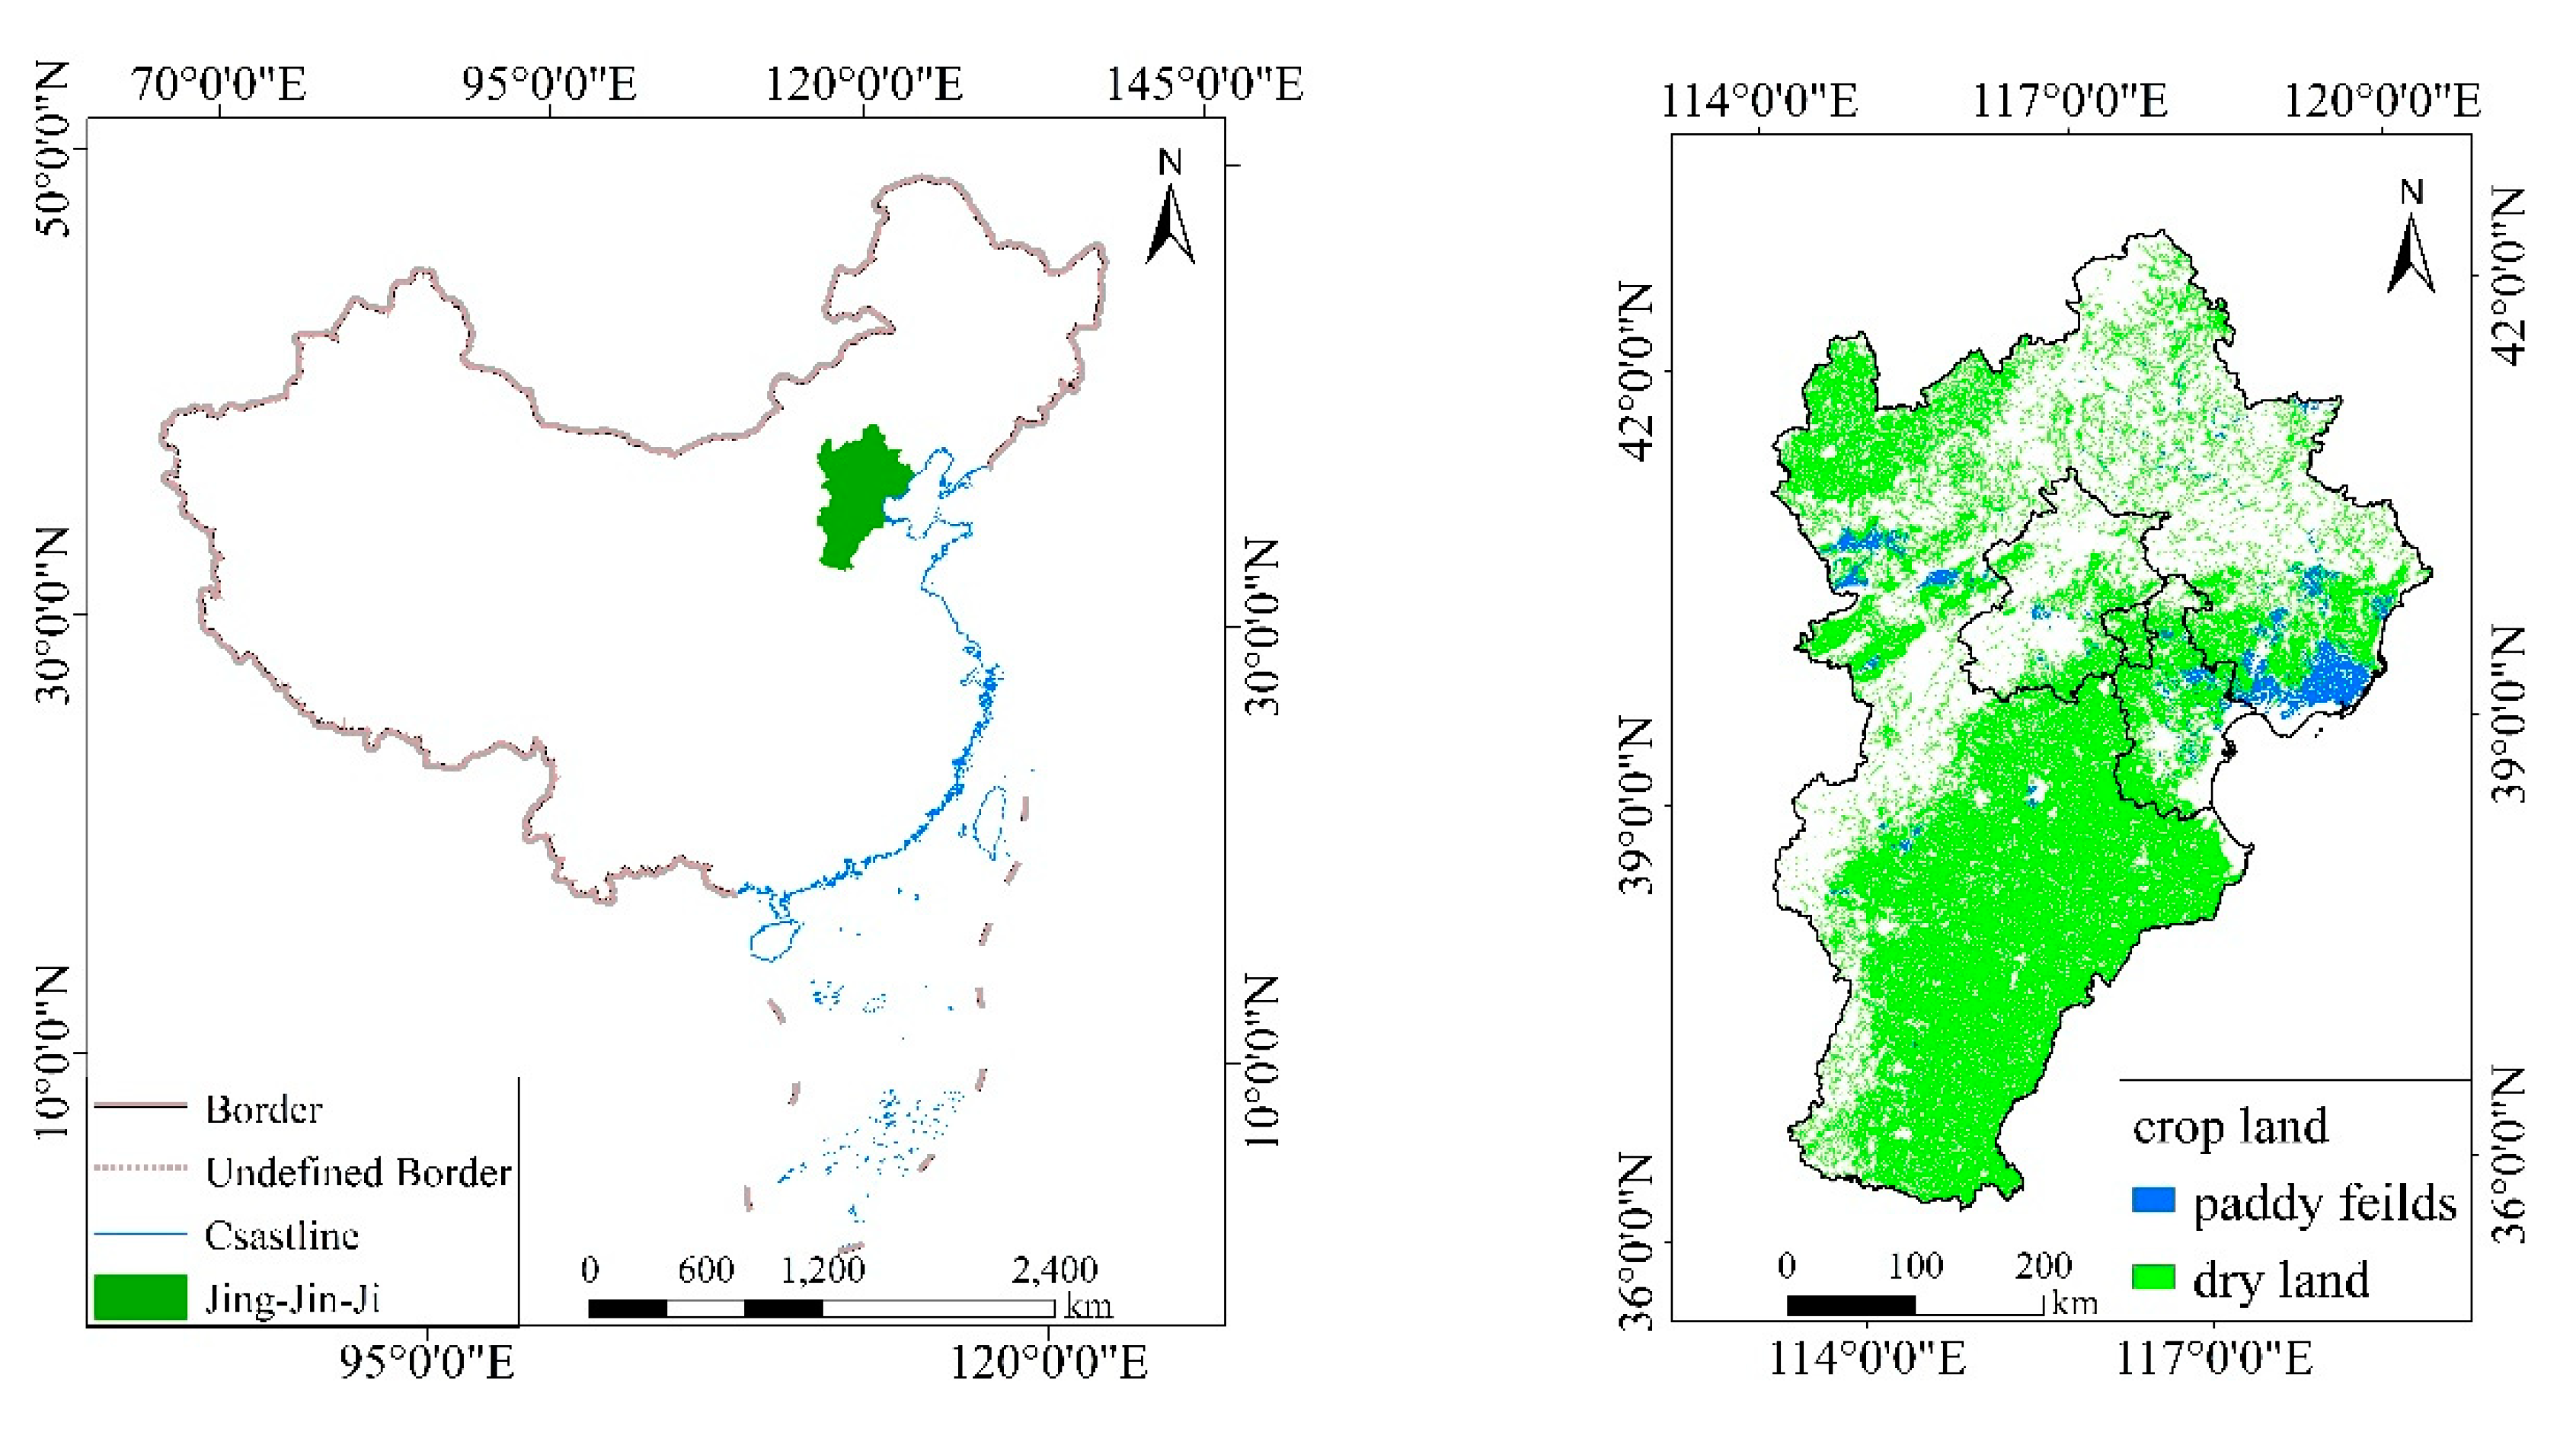
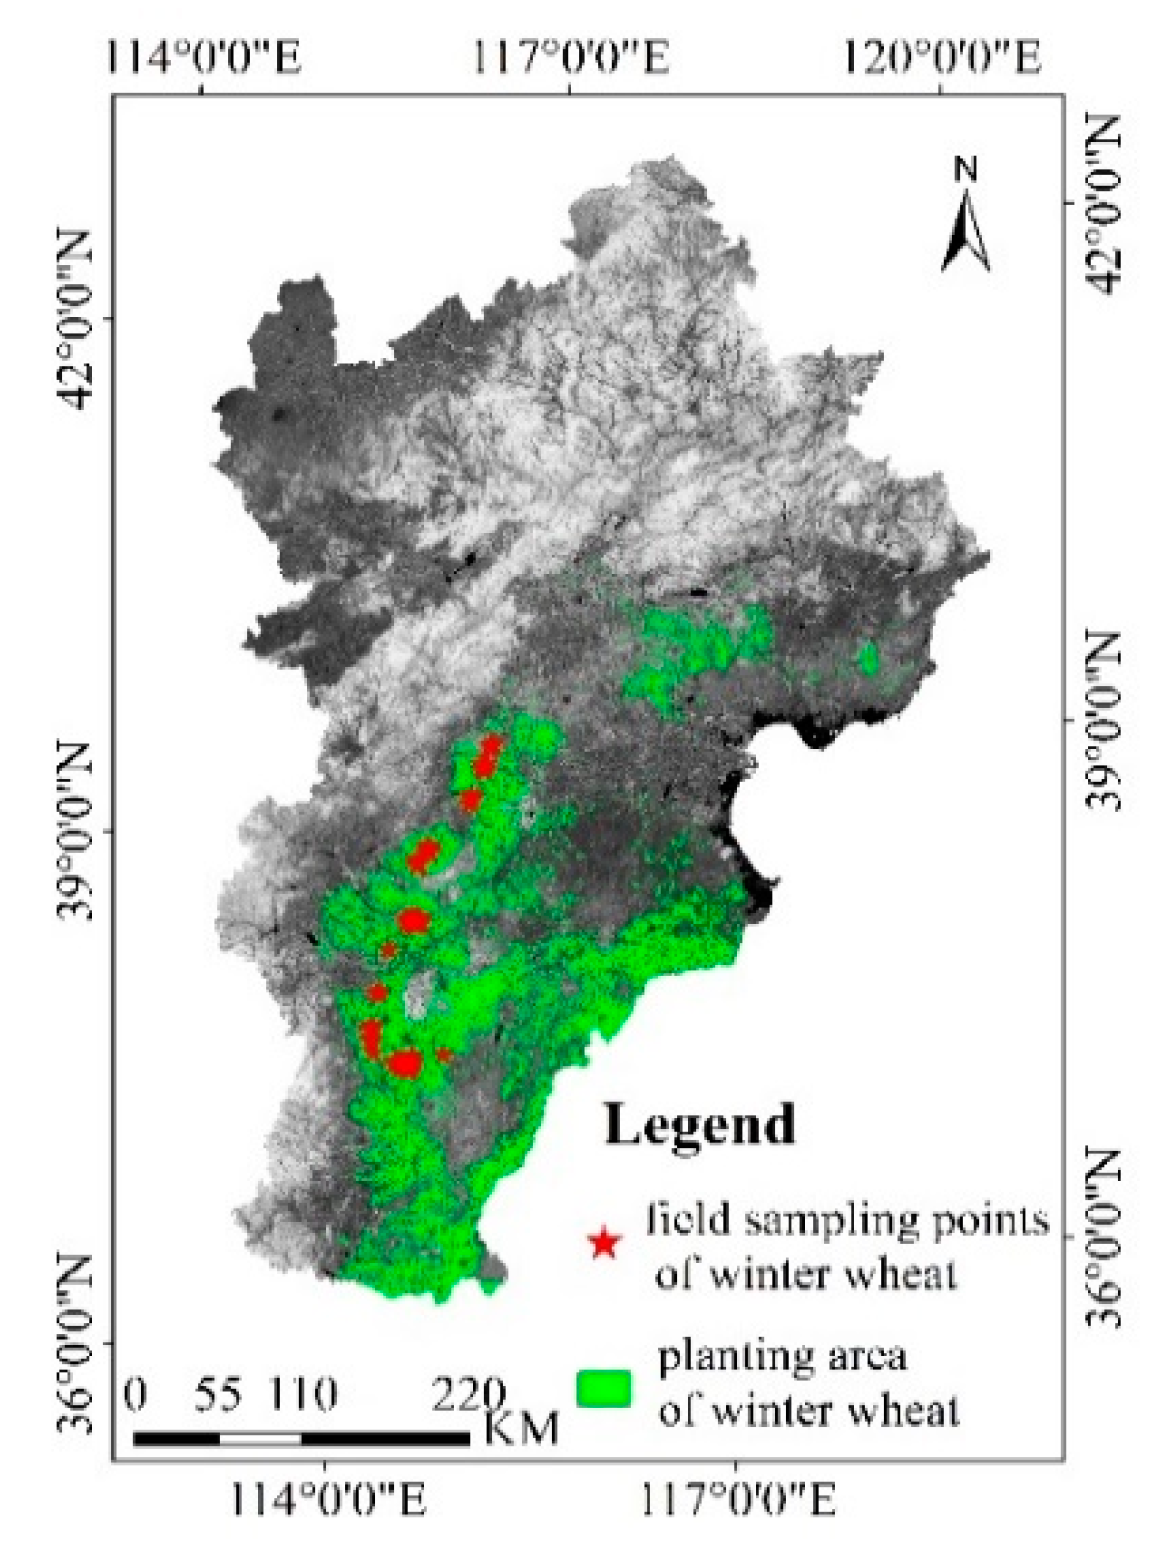
2.1. Study Area

The JJJ region is located in the eastern part of China, between 36°05′ and 42°40′N and 113°27′ and 119°50′E (Figure 1). It includes Beijing, Tianjin, and Hebei Province. It has a temperate humid semi-arid continental monsoon climate. The annual precipitation is approximately 540 mm and is mainly concentrated in June to September, when the maximum daily precipitation can reach 360 mm. There are paddy fields and dry land in JJJ (Figure 1). The main crops are cereals, beans, tubers, and cotton. The cereals include wheat, maize, and rice. The planting area of winter wheat is approximately 24,220 km2, accounting for 11.2% of the total area of the JJJ region.

2.2. Data Collection and Pre-Processing

2.2.1. MODIS Data

MODIS data were selected to extract the area of winter wheat over a large area scope, considering the cost, processing, and resolution of remote sensing data [31]. Every 8-day time series of MOD09Q1 data products with 250 m spatial resolution spanning from the 313rd day of 2016 to the 305th of 2017 were downloaded from NASA (http://modis.gsfc.nasa.gov). Data were obtained from four MODIS tiles (h26v04, h26v05, h27v04, and h27v05) covering the JJJ region. The four tiles of the MOD09Q1 data products were mosaicked, resampled, and re-projected to the Albers Equal Area (AEA) projection [32].
To define the study area, the data of national boundaries and prefecture-level city boundaries were collected from the Key Laboratory for Resource Use and Environmental Remediation, Institute of Geographic Sciences and National Resources Research, Chinese Academy of Sciences. Field sites were sampled to help interpret the features of winter wheat in images and verify the location accuracy of the winter wheat. In this study, 215 winter wheat field sites, 28 building field sites, and 19 forest field sites were sampled with field surveys. The field sites were distributed in Baoding, Shijiazhuang, and Xingtai, all of which are the main planting area of winter wheat in JJJ. Among these field sampling sites, 20 winter wheat field sites, 10 building field sites, and 5 forest field sites were used as reference points. On the basis of heterogeneity of the three types of ground reference points, the classification can be done. The remaining 195 winter wheat field sampling sites were used for accuracy verification.

2.2.2. Weather Data

The daily weather data from 2014 to 2018 were obtained from 157 weather stations covering the JJJ region. These were downloaded from the China Meteorological Administration (http://data.cma.cn). The daily weather data included maximum temperature (Tmax, °C), minimum temperature (Tmin, °C), precipitation (Pre, mm), and hours of sunshine. Solar radiation was calculated from the hours of sunshine according to the Angstrom–Prescott equation [33]. Due to the spatial simulation, the daily weather data were interpolated with the ANUSPLIN 4.3 software [34]. And these weather data were resampled to 250 m resolution and calculated to an average value from 5 years with ArcGIS 10.1 software.

2.2.3. Soil Data

The soil data were downloaded from the GSDE (Global Soil Data Set for Earth System Modeling) database with eight layers to a depth of 2.296 m, provided by the Scientific Data Center of Cold and Dry Areas. These data are developed from the soil database of the HWSD (Harmonized World Soil Database), and provide information on gridded soil textural parameters, including the depth of layers, organic carbon, pH, total N, nutrients, soil particle size, and most other information required in the DSSAT model. In addition, soil albedo and drainage were estimated by 1:1,000,000 soil type from the China Soil Database (http://vdb3.soil.csdb.cn/). The soil data were processed to 250 m resolution with ArcGIS 10.1 software.

2.2.4. Experimental and Crop Management Data

The experimental data in field and crop management data were required in DSSAT crop model. Among these data, the experimental data were used to modify the cultivar coefficients in DSSAT for the purpose of parameter localization and calibration. The crop management data were the crop growth data, which the DSSAT model needed to simulate the crop growth process.
Field experimental data from 2014 and 2015 were collected from the Tongzhou district of Beijing. The winter wheat cultivar ZhongMai 175 was planted in this field. The growth period of this cultivar is 175 to 251 days. This cultivar can generally be planted in the Beijing, Tianjin, central Hebei, and Shanxi regions under moderate fertility. The dry matter accumulation data and leaf area index (LAI) data at the emergence stage, overwintering stage, green returned stage, erecting stage, jointing stage, heading stage, anthesis stage, and mature stage were obtained through investigation, measurements, and a household survey (Table 1). In addition, the yield of winter wheat from 2014 to 2016 were provided by the annual statistical data of Tongzhou (Table 2). Field management information about planting, irrigation, fertilizers, tillage, and pest control were collected on the basis of farmer and expert experience (Table 3).

2.3. Production Potential Definition

Crop production potential is defined as the productivity of a cultivar when the nutrient supply is sufficient, pests and weeds are fully controlled, and tillage technology and the management level are in the best state [35]. It is an important reference index for the scientific study of regional crop production capacity and population carrying capacity [36]. Crop production potential is specifically divided into photosynthetic production potential, light-temperature production potential, and climate production potential [37]. The light-temperature production potential is the maximum yield achieved under the condition of optimal management, and it is obtained only with the light and temperature injected. The general formula for the calculation of the light-temperature production potential is as follows [38,39]:
Y ( Q ) = K E Q i
Y ( Q , T ) = K E Q i f ( T )
As for winter wheat, f(T) is as follows:
f ( T ) = exp ( α ( T T 0 10 ) 2 )
α = { 2 , T > T 0 1 , T T 0
where Y(Q) is the photosynthetic production potential (unit: kg/ha), K is the conversion coefficient, E is the efficiency of solar energy utilization (unit: %), Qi is the effective radiation at a certain time per unit area (unit: J/cm2), Y(Q, T) is the light-temperature production potential (unit: kg/ha), f(T) is the correction coefficient of temperature, α is the parameter, T is the actual temperature, and T0 is the optimum temperature.

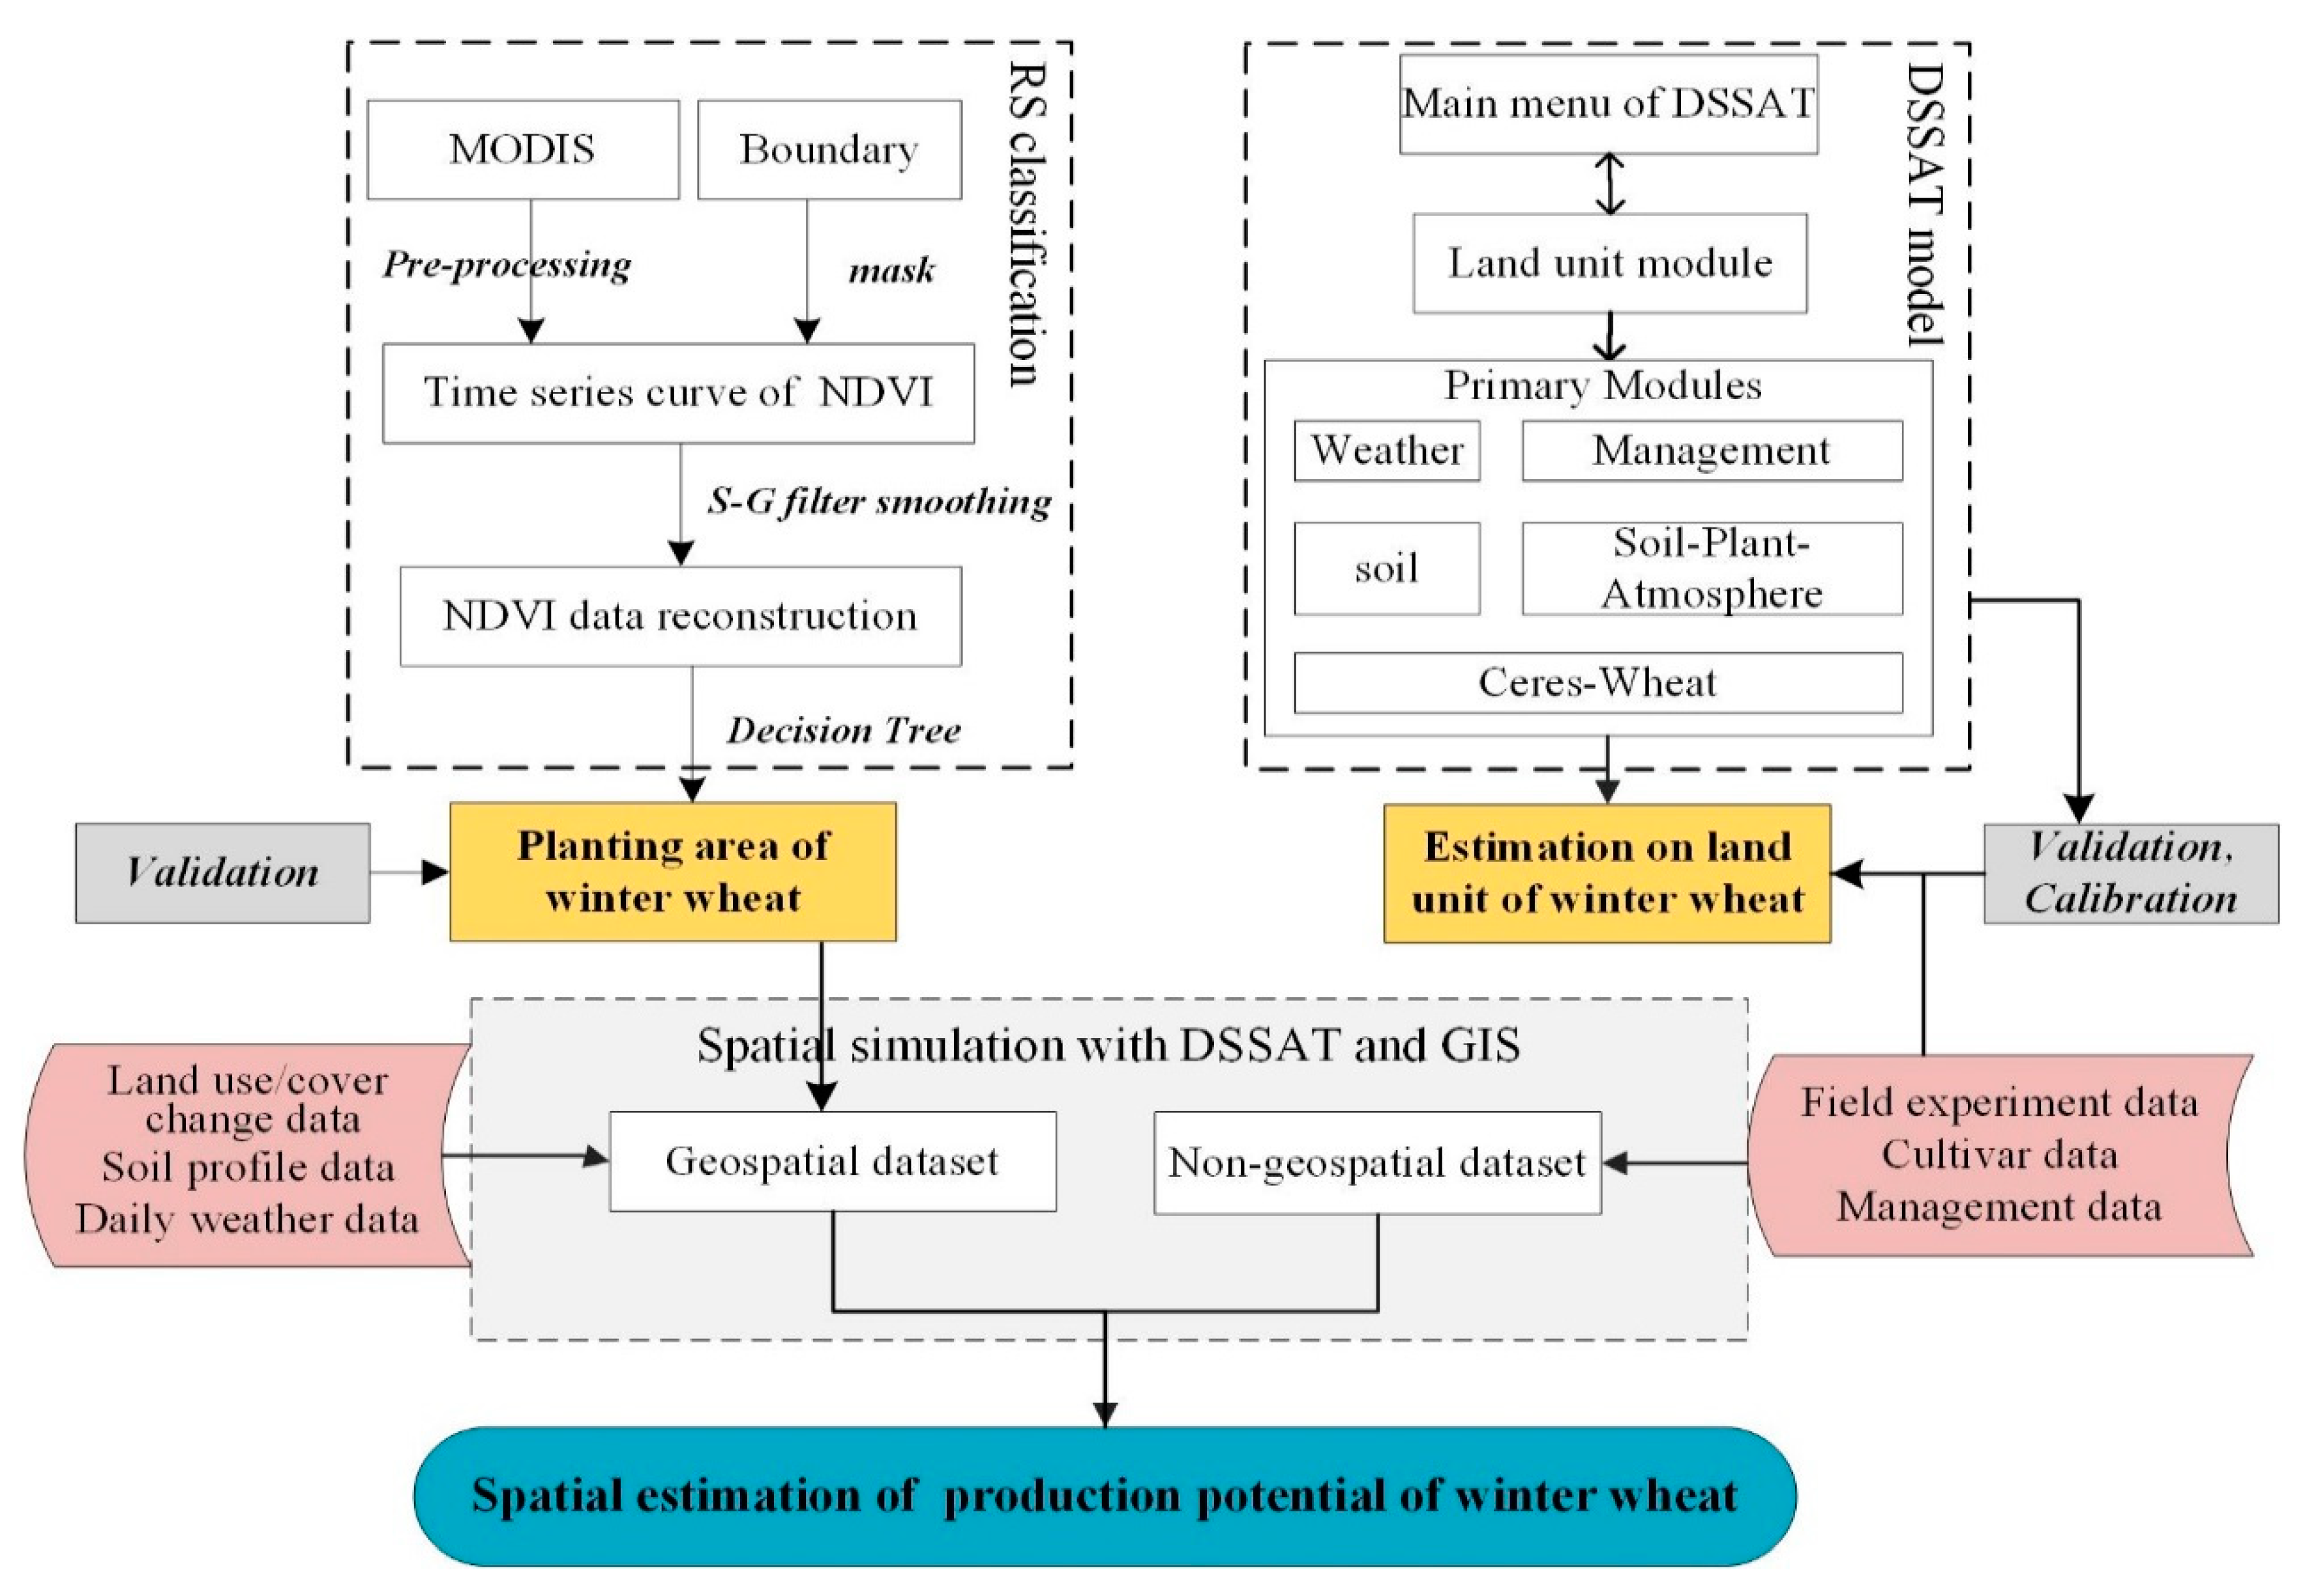
2.4. Crop Simulation with DSSAT Model and GIS

The DSSAT model can match the biological requirements of crops to the physical characteristics of the land so that crop growth information specified by the user can be obtained [21]. It integrates the environmental and field management data to simulate crop growth processes with a set of validated crop models and helps policy makers and farmers make decisions.
In this study, the regional simulation was realized with the DSSAT crop model coupled with GIS technology. Meanwhile, RS was also required to define the boundary of the winter wheat planting region. To obtain the exact and high-spatial-resolution potential yield in JJJ, the process was divided into two parts, and the technical process is shown in Figure 2. First, the MODIS image data were interpreted to obtain the exact planting area at high resolution with Decision Tree (DT) classification. Second, we calibrated the DSSAT model with the experimental and management data in a single land unit, and then performed a spatial simulation in the DSSAT model with spatial input data processed by GIS.

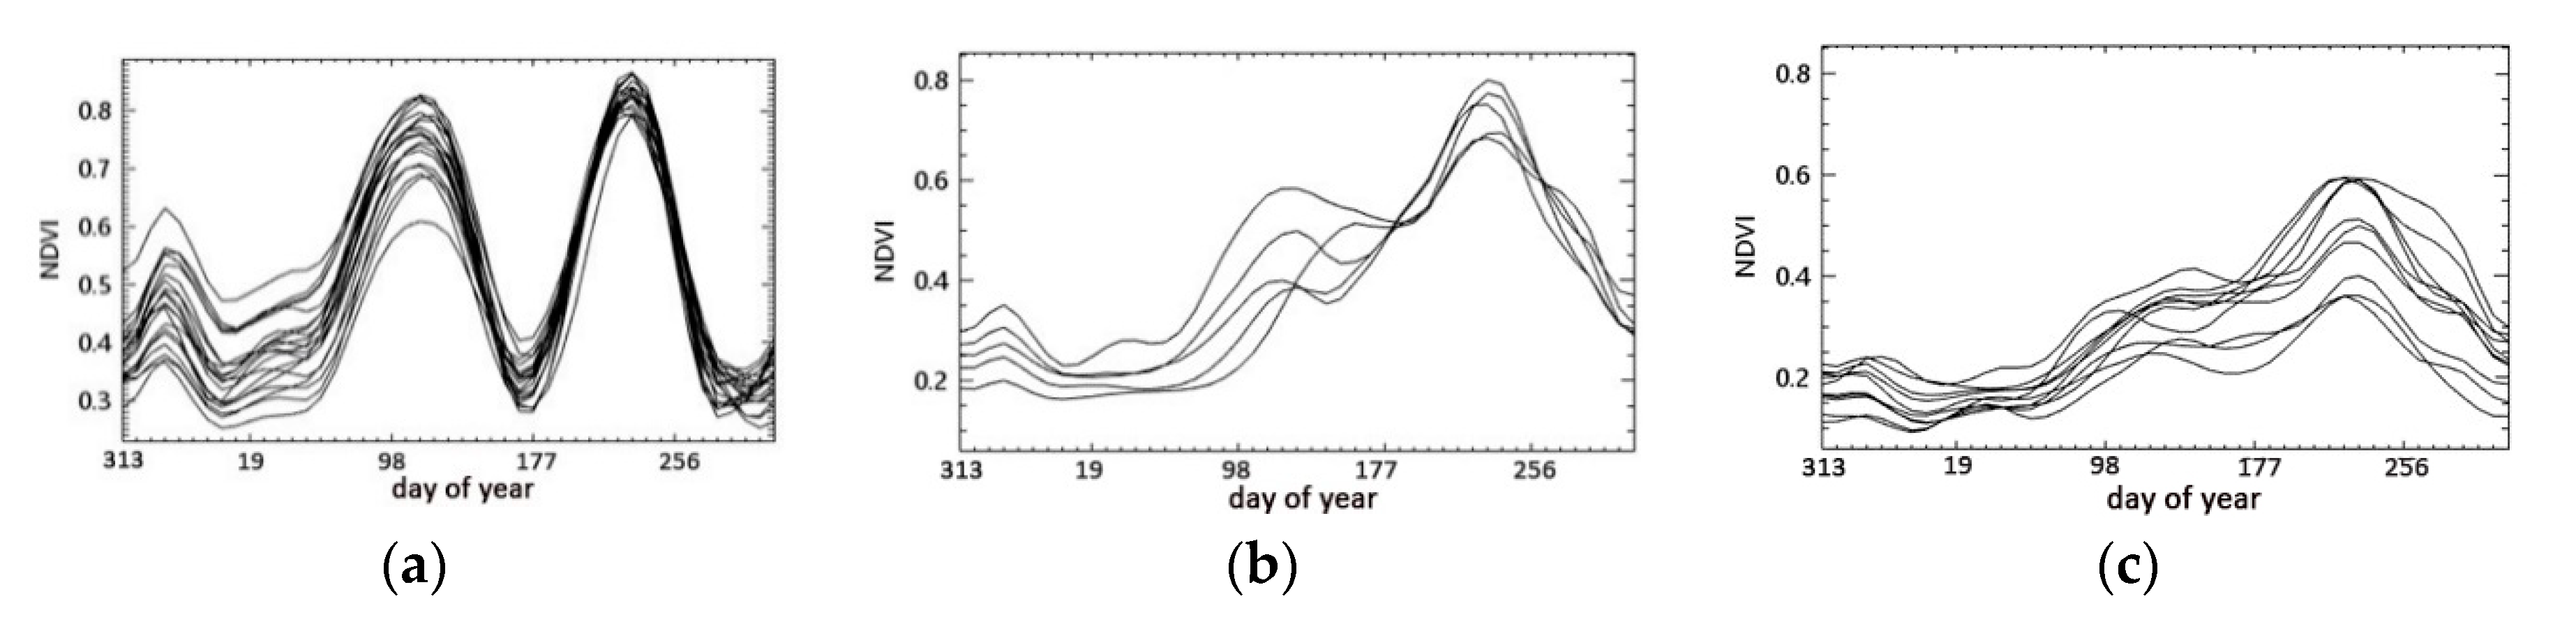
2.4.1. Extraction of Winter Wheat Planting Area Based on RS

To obtain the exact planting area in JJJ, it is necessary to extract the exact spatial distribution and latitude and longitude of the planting area. Based on RS technology, the winter wheat planting areas can be estimated more conveniently. The collected pre-processing MOD09Q1 data were used to calculate the NDVI (Normalized Difference Vegetation Index), which was used to identify the regional- or global-scale vegetation coverage [32,40,41]. To express the characteristics of ground features on NDVI curves, the Savitzky–Golay filter was chosen to smooth the original NDVI time series curves to better reflect the trends of the three types of NDVI time series curves of ground features [42,43]. A DT method for crop classification in RS monitoring was applied to extract the winter wheat planting area according to the NDVI differences of three ground features [44]. Besides, to recognize the feature of winter wheat on the MODIS images, some of the field sampling points were analyzed: 20, 5, and 10 sampling points for winter wheat, forest, and buildings, respectively.

2.4.2. Model Calibration and Validation

In DSSAT model, a variety of parameters pertaining to cultivars and genotypes are defined to control and simulate the growth of crops. Therefore, the variety of parameters in the model should be calibrated to confirm that the simulation values are consistent with the measured values.
The collected data of dry matter accumulation data and LAI data of winter wheat in 2014 (Table 1 and Table 2) were used to estimate genotype-specific coefficients using the Trial-and-Error by GLUE (Generalized Likelihood Uncertainty Estimation) program in DSSAT model. In this study, a kind of genotype of winter wheat (in WHCER047.CUL and WHCER047.ECO) was selected for cultivar calibration, and then the GLUE tool was used to estimate the cultivar parameters with 10,000 runs.
The yields of winter wheat in 2015 and 2016 and the growth dates were used to validate the DSSAT crop model. The nRMSE (Normalized Root Mean Square of Error, a model evaluation statistic) was used to assess the fitness of the validated cultivars [26,45,46]. The equation for the nRMSE is as follows:
nRMSE = i = 1 n ( S i M i ) 2 n × 100 M ¯
where Si is the simulated value, Mi is the measured value, M ¯ is the mean of the measured value, and n is the number of values. Generally, we consider nRMSE < 15%, 15% < nRMSE < 30%, and nRMSE > 30% as good, moderate, and poor agreement, respectively.

2.4.3. Spatial Simulation with DSSAT Model and GIS

The DSSAT model is usually applied in a single land unit. When it comes to the regional scope, it should be extrapolated with GIS technology. In this study, to complete the spatial simulation, the single land unit experimental file was built with the management data and calibrated cultivars. Then, ArcGIS 10.1 software was used to process and generate soil and weather raster data, including clipping, projection, and resampling to 250 m resolution. It should be emphasized that one raster point data represented a land unit. After processing in ArcGIS, the extracted soil and weather values were individually written into *.SOL files and *.WTH files by Python. For the FILEX (the experimental file), the crop growth data were set to be the same at every land unit, but the corresponding soil and weather data were varied with the different land units. Meanwhile, the water and nutrient stress were removed in this simulation by turning off the water, nitrogen, phosphorus, and potassium simulations. With all the input files created, the simulation was run in batch.

3. Results

3.1. Area Validation and Model Validation

3.1.1. Area Validation

After analyzing the NDVI time series curves of three sampling ground features (Figure 3), the planting area of winter wheat in JJJ was extracted (Figure 4) by DT classification. The remaining 195 field sampling points for winter wheat were used to evaluate the accuracy of planting location, and the statistical data of planting acreage were used to calculate the accuracy of the extracted winter wheat planting acreage. The results show that the accuracy in spatial location is 93.33%, with 182 of the 195 points classified correctly (Figure 4). The accuracy in planting acreage is 91.18%, which the extracted acreage is 2205.88 hectares compared with the 2419.20 hectares in the statistical data. The accuracy in each city is shown to be reliable in Table 4.

3.1.2. Model Validation

After 10,000 trial-and-error runs, the final genotype parameter results at the experimental site were estimated, as shown in Table 5. The simulated values are in good agreement, as shown in Table 6. The error in seeding and harvest date between the simulated and measured values was 1 day. The simulated flowering date was the same as the measured value. The nRMSE values of winter wheat yield in 2014, 2015, and 2016 were all less than 15%.

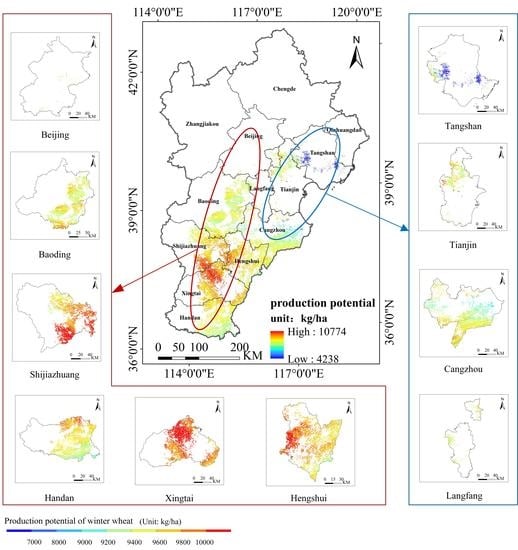
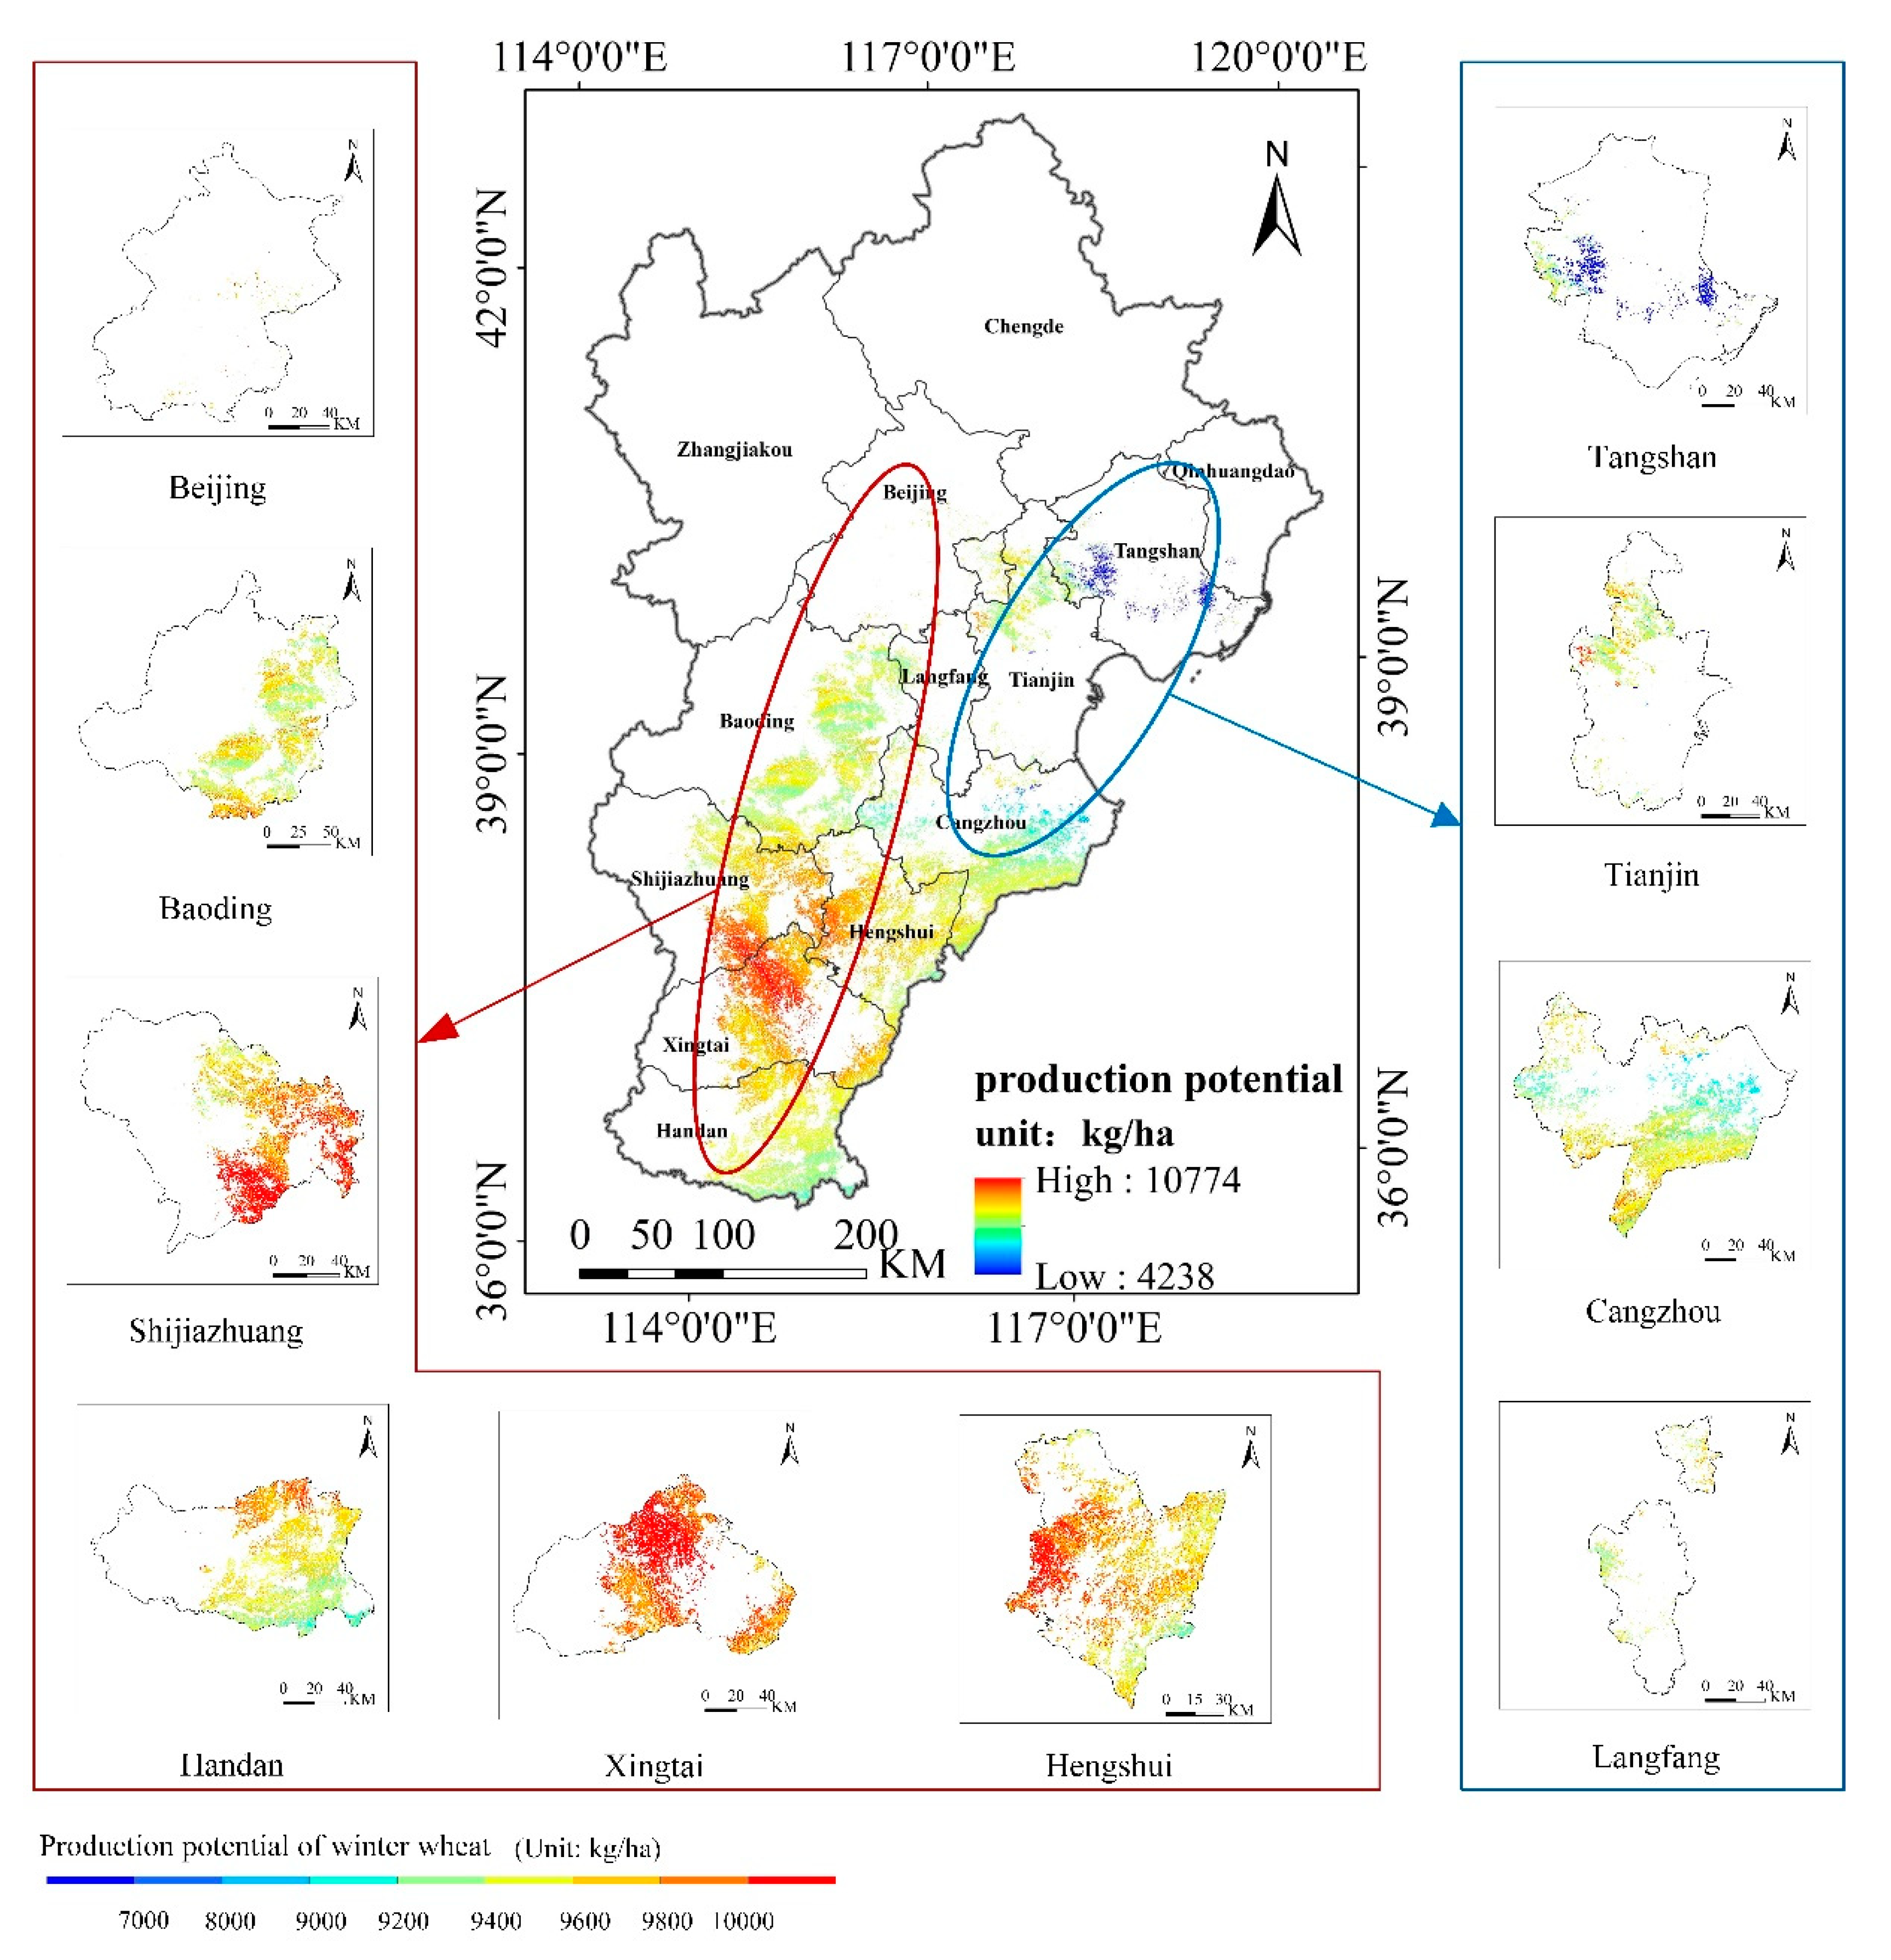
3.2. Production Potential of Winter Wheat

The results of the spatial distribution and the production potential values are shown in Figure 5 and Table 7. The spatial distribution map (Figure 5) is a raster data. Each pixel records the production potential value. The map shows an increasing trend from north to south gradually in JJJ, and the production potential values range from 4238 to 10,774 kg/ha. The production potential is highest in the south-western area of the winter wheat planting area, and it can reach 10,774 kg/ha. The production potential is lowest in the north-eastern winter wheat planting area, with a minimum of 4238 kg/ha.
In Xingtai, the production potential of winter wheat ranges from 9064 kg/ha to 10,774 kg/ha, with the average value of 9848 kg/ha. The production potential in the north is higher than that in the south. In Shijiazhuang, the production potential of winter wheat ranges from 8302 kg/ha to 10,626 kg/ha, with the mean value of 9672 kg/ha. The production potential values in southeast are higher than that in northwest. In Hengshui, the production potential of winter wheat is between 8214 kg/ha and 10,328 kg/ha, with the mean value of 9517 kg/ha. The production potential values in the west are higher than that in the east. In Baoding, the production potential is between 7999 kg/ha and 10,088 kg/ha, with the average production potential of 9433 kg/ha. However, there is no significant variation in the spatial distribution. Both north and south regions have high and low production potential. In Handan, the values range from 8692 kg/ha to 10,354 kg/ha, and the average value is 9408 kg/ha. The production potential values in the north are higher than that in the south. In Beijing, the production potential ranges from 6506 kg/ha to 9998 kg/ha, and its mean production potential value is 9390 kg/ha. Because of the smaller planting area, the spatial distribution result is not clear. In Langfang, the production potential ranges from 8262 kg/ha to 9827 kg/ha, with the mean production potential value of 9344 kg/ha, and there are few changes in values, so that spatial variation is not obvious. In Tianjin, the production potential ranges from 5575 kg/ha to 9998 kg/ha, with the mean production potential value of 9223 kg/ha. There are relatively high production potential areas in a small part of the western region. In Cangzhou, the value ranges from 7999 kg/ha to 9937 kg/ha, and the average value is 9030 kg/ha. In the south and north, the values are higher than those in the middle. In Tangshan, the highest production potential is 9516 kg/ha. But the lowest production potential is 4238 kg/ha. The average is only 6747 kg/ha. The overall production potential of winter wheat in JJJ is 4238–10,774 kg/ha, and the average value is 7865 kg/ha.
To show the production potential ability at a city level, the number of pixels in different intervals of production potential in each city was counted (Table 8). The intervals of winter wheat pixels were set to be <7000 kg/ha, 7000–9000 kg/ha, 9000–10,000 kg/ha, and >10,000 kg/ha. In addition, the percentage of pixels in each city where production potential values were more than 9000 kg/ha were calculated. The table shows that the range of winter wheat production potential in JJJ is widely distributed, ranging from less than 7000 kg/ha to more than 10,000 kg/ha. Most production potential values were above 9000 kg/ha, with a pixel ratio of 93.65%.
According to Table 8 above, Xingtai has the highest winter wheat production potential, with all the values being above 9000 kg/ha. Additionally, the percentages in Xingtai, Shijiazhuang, Hengshui, Baoding, Langfang, Tianjin, and Handan are more than 90%, with percentages of 99.66%, 98.93%, 97.98%, 97.24%, 96.63%, 95.46%, and 94.33%, respectively. There are no production potential values of >10,000 kg/ha in Beijing, Langfang, or Tianjin. In addition, pixel values under 7000 kg/ha existed in Beijing and Tianjin, but the proportion is low. The percentage in Cangzhou is 83.45%, which is lower than that in most cities. The production potential in Tangshan is the lowest, with only 30.17% of the production potential greater than 9000 kg/ha, and the values of more than half of the pixels are under 7000 kg/ha.

4. Discussion

4.1. The Analysis of Production Potential of Winter Wheat Estimation

The production potential of winter wheat was simulated on a spatial scale using the DSSAT model and GIS technology. The simulated production potential values were in 4238–10,774 kg/ha, which were different from the results in other studies conducted in the same region.
Wang Hong et al. [47] showed that the production potential of winter wheat was 13,150 kg/ha in Hebei during 1998–2007 using the AEZ (Agro-Ecological Zone) model. The production potential with DSSAT model is lower than that with AEZ model. The reason for the lower level may be that the DSSAT model, which is a process-based crop growth model, was used. The process-based crop model took the growth environment data and crop management data into account, which differs from the empirical formula methods. Generally, the light-temperature production potential values were calculated in AEZ model step by step according to impact factors of light and temperature. However, in DSSAT model, not only the light and temperature data were asked input, the soil data were required. When the soil data were input, the growth environment became a kind of impact factor though the water, and nutrition was sufficient by removing water, nitrogen, phosphorus, and potassium limitation.
Wu Dingrong et al. [48] simulated the production potential of winter wheat during 1991–2006 with WOFOST (World Food Studies) model, and the production potential values were 6160–13,730 kg/ha in North China. Wang Tao et al. [36] simulated the production potential in JJJ with WOFOST model, and the values were 6934–9143 kg/ha. The lowest production potential simulated with DSSAT model was less than the WOFOST. The highest production potential simulated with DSSAT model was between these two studies of WOFOST. The reason for these differences may be the difference of cultivars. Besides, the soil and weather data recorded in each unit are different because of the spatial resolution.

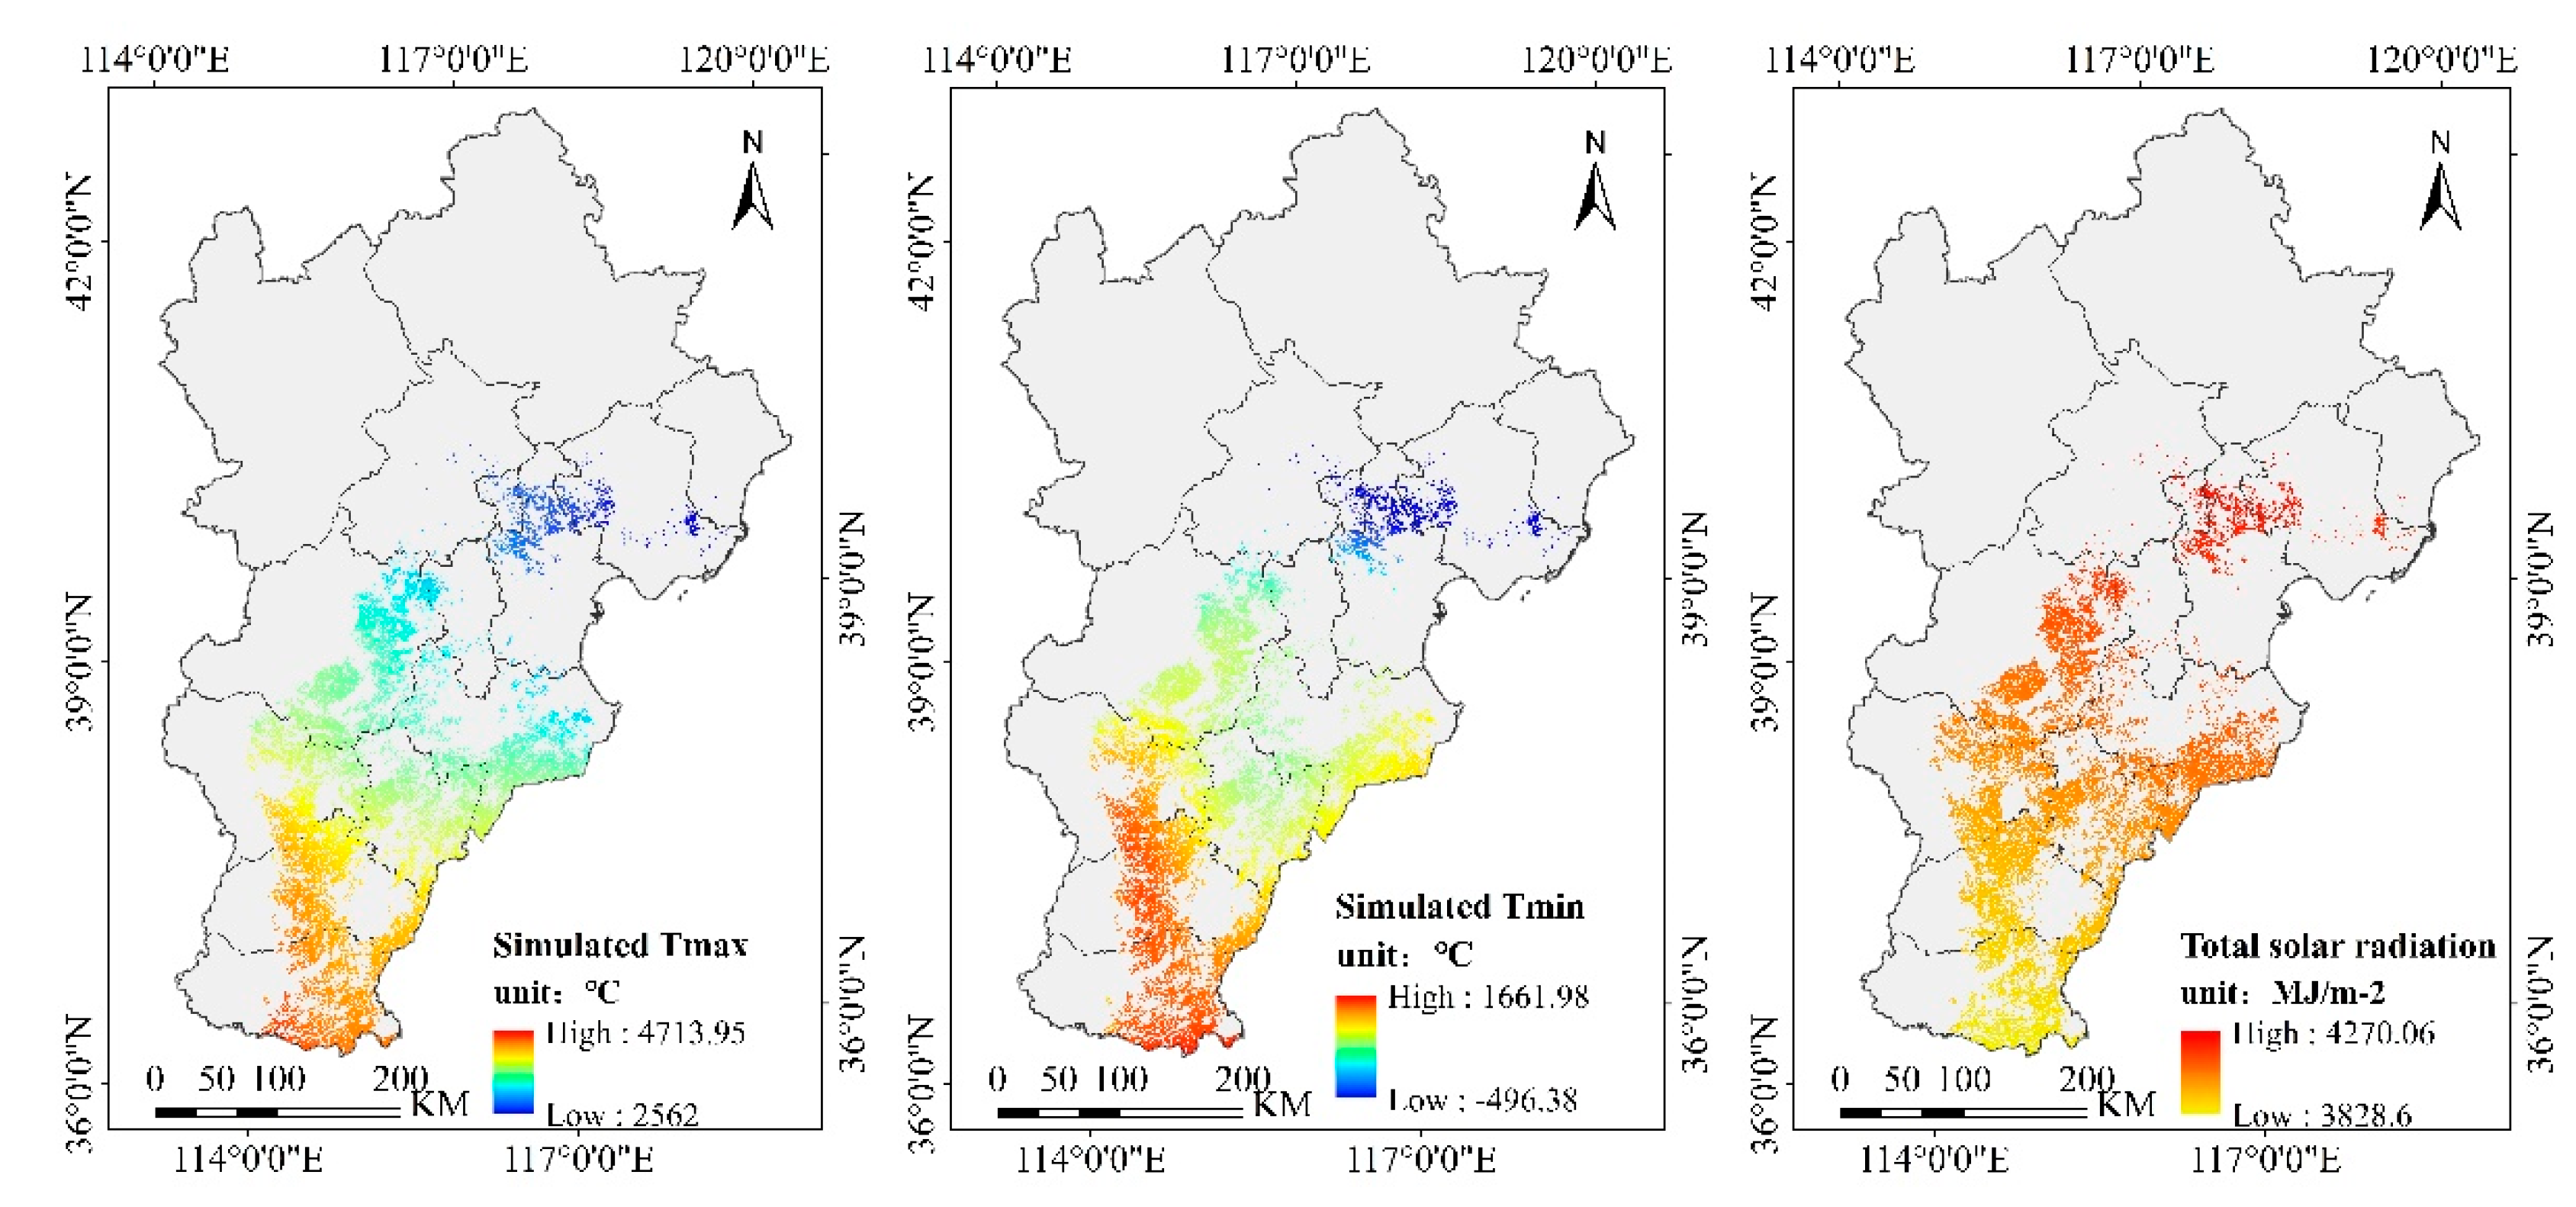
4.2. Light and Temperature Effects on Production Potential

In this paper, the light-temperature production potential of winter wheat was calculated. According to the definition of light-temperature production potential, the light and temperature are influential factors for production. Therefore, the accumulated maximum temperature (accumulated Tmax), the accumulated minimum temperature (accumulated Tmin), and the total solar radiation during the growth period of winter wheat were quantified (Figure 6). As shown in Figure 6, the total solar radiation in the winter wheat planting area ranges from 3828.60 to 4270.06 MJ/m2, and it decreases from north to south. The accumulated Tmax in the winter wheat planting area is between 256 and 4713.95 °C, and the accumulated Tmin is −496.38 to 1661.98 °C. The solar radiation in the north is higher than that in the south, but the accumulated temperature in the north is lower than that in the south.
The production potential of winter wheat was obtained under the influence of light and temperature. Taking Xingtai as an example, the production potential is the highest in JJJ in the common influence of the solar radiation and temperature, although the solar radiation and temperature are not the highest in the study area. The production potential of winter wheat in the central part of the planting area is higher than that in the south and north in JJJ (Figure 5). The reason for this phenomenon is that the temperature plays a more important role than light in yield. Taking Tangshan as an example, the low production potential of winter wheat may be due to the low temperature, although the solar radiation is very high. Wang Hong et al. [47] performed a nonlinear fitting analysis of solar radiation and temperature data corresponding to the production potential of winter wheat in the Huanghuaihai agricultural area. The results also showed that the fitting degree (R2=0.7298) between temperature and yield was higher than that for solar radiation. The production potential distribution map in this study is consistent with the study of Wang Hong.

5. Conclusions

In this paper, the growth process of winter wheat was simulated on a large scale by integrating the DSSAT crop growth model and GIS technology, and the spatial distribution of production potential in JJJ was visualized at high spatial resolution. The DSSAT model makes up for the deficiency of the traditional mathematical model with its simulation modules. The application of GIS technology facilitates the data management and data processing. It helps to realize the spatial expansion for the DSSAT model. Furthermore, the spatial results of winter wheat production potential are more intuitive.
According to the results, the winter wheat production potential in JJJ varies from north to south due to the heterogeneity in weather and soil across different land units. Although high-yield areas and low-yield areas exist, the winter wheat production potential in JJJ is at a high level overall. The correct decision should be made by farmers and decision makers according to the spatial distribution of production potential.
In this study, only a single cultivar was used in this simulation in JJJ. However, in actual field planting, different kinds of cultivars are planted in JJJ due to local topographic factors and climatic conditions. Therefore, different kinds of genotype parameters should be applied in the DSSAT model. In the next step, more research and field experiments should be carried out to obtain more genotypes by calibration. In addition, years of meteorological data collection and simulation should be performed to obtain a more stable result on a temporal scale.

Author Contributions

Conceptualization, T.L.; methodology, T.L.; software, T.L. and K.J.; validation, T.L.; formal analysis, T.L. and Y.Y.; investigation, Y.L.; resources, C.Z. and Z.Y.; data curation, T.L., K.J. and C.Z.; writing—original draft preparation, T.L.; writing—review and editing, T.L.; visualization, Z.Y.; supervision, Y.Y.; project administration, K.J.; funding acquisition, K.J. All authors have read and agreed to the published version of the manuscript.

Funding

This research was funded by the Strategic Priority Research Program of the Chinese Academy of Sciences, grant number XDA20010201; the “Second Tibetan Plateau Scientific Expedition and Research” program, grant number 2019QZKK1006. The APC was funded by XDA20010201.

Acknowledgments

We are grateful to our team for their advice and encouragement. We would also like to thank National Tibetan Plateau Data Center and other websites for providing data. Special thanks to Xiaoxi Yan for her guidance about the DSSAT software.

Conflicts of Interest

The authors declare no conflict of interest.

References

  1. Yang, Y.Z.; Zhang, J.; Zhang, P.T. A GIS based study on the potential land productivity and population carrying capacity in Inner Mongolia. J. Arid Land Resour. Environ. 2008, 22, 1–5. [Google Scholar]
  2. Wart, J.V.; Kersebaum, K.C.; Peng, S.; Milner, M.; Cassman, K.G. Estimating crop yield potential at regional to national scales. Field Crop. Res. 2013, 143, 34–43. [Google Scholar] [CrossRef] [Green Version]
  3. Merlos, F.A.; Monzon, J.P.; Mercau, J.L.; Taboada, M.; Andrade, F.H.; Hall, A.J.; Jobbagy, E.; Cassman, K.G.; Grassini, P. Potential for crop production increase in Argentina through closure of existing yield gaps. Field Crops Res. 2015, 184, 145–154. [Google Scholar] [CrossRef]
  4. Feng, Z.M.; Yang, Y.Z.; Yan, H.M.; Pan, T.; Li, P. A review of resources and environment carrying capacity research since the 20th Century: From theory to practice. Resour. Sci. 2017, 39, 379–395. [Google Scholar]
  5. Huang, J.X.; Jia, S.L.; Ma, H.Y.; Hou, Y.Y.; He, L. Dynamic simulation of growth process of winter wheat in main production areas of China based on WOFOST model. Trans. Chin. Soc. Agric. Eng. 2017, 33, 230–236. [Google Scholar]
  6. Wang, X.L.; Huang, J.X.; Feng, Q.L.; Yin, D.Q. Winter wheat yield prediction at county level and uncertainty analysis in main Wheat-Producing regions of China with Deep Learning approaches. Remote Sens. 2020, 12, 1744. [Google Scholar] [CrossRef]
  7. Dong, Q.; Chen, X.H.; Chen, J.; Zhang, C.S.; Liu, L.C.; Cao, X.; Zang, Y.Z.; Zhu, X.F.; Cui, X.H. Mapping winter wheat in North China using Sentinel 2A/B data: A method based on Phenology-Time Weighted Dynamic Time Warping. Remote Sens. 2020, 12, 1274. [Google Scholar] [CrossRef] [Green Version]
  8. Dai, D.; Sun, M.; Xu, X.; Lei, K. Assessment of the water resource carrying capacity based on the ecological footprint: A case study in Zhangjiakou City, North China. Environ. Sci. Pollut. Res. 2019, 26, 11000–11011. [Google Scholar] [CrossRef]
  9. Deng, X.Z.; Gibson, J.; Wang, P. Relationship between landscape diversity and crop production: A case study in the Hebei Province of China based on multi-source data integration. J. Clean. Prod. 2017, 142, 985–992. [Google Scholar] [CrossRef]
  10. Brown, R.A.; Rosenberg, N.J. Climate change impacts on the potential productivity of corn and winter wheat in their primary United States growing regions. Clim. Chang. 1999, 41, 73–107. [Google Scholar] [CrossRef]
  11. Mkhabela, M.S.; Bullock, P.; Raj, S.; Wang, S.; Yang, Y. Crop yield forecasting on the Canadian Prairies using MODIS NDVI data. Agric. For. Meteorol. 2011, 151, 385–393. [Google Scholar] [CrossRef]
  12. Sun, H.; Xu, A.; Lin, H.; Zhang, L.; Mei, Y. Winter wheat mapping using temporal signatures of MODIS vegetation index data. Int. J. Remote Sens. 2012, 33, 5026–5042. [Google Scholar] [CrossRef]
  13. Xu, X.; Conrad, C.; Doktor, D. Optimising phenological metrics extraction for different crop types in Germany using the Moderate Resolution Imaging Spectrometer (MODIS). Remote Sens. 2017, 9, 254. [Google Scholar] [CrossRef] [Green Version]
  14. Lollato, R.P.; Edwards, J.T.; Ochsner, T.E. Meteorological limits to winter wheat productivity in the U.S. southern Great Plains. Field Crops Res. 2017, 203, 212–226. [Google Scholar] [CrossRef]
  15. HU, Q.; Wu, W.B.; Song, X.; Yu, Q.Y.; Yang, P.; Tang, H.J. Recent progresses in research of crop patterns mapping by using Remote Sensing. Sci. Agric. Sin. 2015, 10, 34–48. [Google Scholar]
  16. Sonobe, R. Combining ASNARO-2 XSAR HH and Sentinel-1 C-SAR VH/VV Polarization Data for Improved Crop Mapping. Remote Sens. 2019, 11, 1920. [Google Scholar] [CrossRef] [Green Version]
  17. Meng, S.; Zhong, Y.; Luo, C.; Hu, X.; Wang, X.; Huang, S. Optimal Temporal Window Selection for Winter Wheat and Rapeseed Mapping with Sentinel-2 Images: A Case Study of Zhongxiang in China. Remote Sens. 2020, 12, 226. [Google Scholar] [CrossRef] [Green Version]
  18. Wang, L.; Zhai, Y.X.; Wang, F. Development of Theory and Application in Agriculture of GIS. J. Agro-Environ. Sci. 2005, 24, 362–366. [Google Scholar]
  19. Rohit, S.; Sachin, S.K.; Angappa, G. Big GIS analytics framework for agriculture supply chains: A literature review identifying the current trends and future perspectives. Comput. Electron. Agric. 2018, 155, 103–120. [Google Scholar]
  20. Thakkar, A.K.; Desai, V.R.; Patel, A.; Potdar, M.B. Post-classification corrections in improving the classification of Land Use/Land Cover of arid region using RS and GIS: The case of Arjuni watershed, Gujarat, India. Egypt. J. Remote Sens. Space Sci. 2017, 20, 79–89. [Google Scholar] [CrossRef] [Green Version]
  21. Jones, J.W.; Hoogenboom, G.; Porter, C.H.; Boote, K.J.; Batchelor, W.D.; Hunt, L.A.; Wilkens, P.W.; Singh, U.; Gijsman, A.J.; Ritchie, J.T. The DSSAT cropping system model. Eur. J. Agron. 2003, 18, 235–265. [Google Scholar] [CrossRef]
  22. Negm, L.M.; Youssef, M.A.; Skaggs, R.W.; Chescheir, G.M.; Jones, J. DRAINMOD–DSSAT model for simulating hydrology, soil carbon and nitrogen dynamics, and crop growth for drained crop land. Agric. Water Manag. 2014, 137, 30–45. [Google Scholar] [CrossRef]
  23. Boote, K.J.; Prasad, V.; Allen, L.H.; Singh, P.; Jones, J.W. Modeling sensitivity of grain yield to elevated temperature in the DSSAT crop models for peanut, soybean, dry bean, chickpea, sorghum, and millet. Eur. J. Agron. 2018, 100, 99–109. [Google Scholar] [CrossRef]
  24. Rezzoug, W.; Gabrielle, B.; Suleiman, A.; Benabdeli, K. Application and evaluation of the DSSAT-wheat in the Tiaret region of Algeria. Afr. J Agric. Res. 2008, 3, 284–296. [Google Scholar]
  25. Liu, H.L.; Yang, J.Y.; Drury, C.F.; Reynolds, W.D.; Tan, C.S.; Bai, Y.L.; He, P.; Jin, J.; Hoogenboom, G. Using the DSSAT-CERES-Maize model to simulate crop yield and nitrogen cycling in fields under long-term continuous maize production. Nutr. Cycl. Agroecosys. 2011, 89, 313–328. [Google Scholar] [CrossRef]
  26. Araya, A.; Kisekka, I.; Gowda, P.H.; Prasad, P.V.V. Evaluation of water-limited cropping systems in a semi-arid climate using DSSAT-CSM. Agric. Syst. 2017, 150, 86–98. [Google Scholar] [CrossRef] [Green Version]
  27. Priya, S.; Shibasaki, R. National spatial crop yield simulation using GIS-based crop production model. Ecol. Model. 2001, 136, 113–129. [Google Scholar] [CrossRef]
  28. Shi, X.Y.; Tang, L.; Liu, X.J.; Cao, W.X.; Zhu, Y. Predicting spatial productivity in wheat based on model and GIS. Sci. Agric. Sin. 2009, 42, 3828–3835. [Google Scholar]
  29. Kadiyala, M.D.M.; Nedumaran, S.; Singh, P.; Chukka, S.; Irshad, M.A.; Bantilan, M.C.S. An integrated crop model and GIS decision support system for assisting agronomic decision making under climate change. Sci. Total Environ. 2015, 521–522, 123–134. [Google Scholar] [CrossRef] [Green Version]
  30. Lv, Z.; Liu, X.; Cao, W.; Zhu, Y. A model-based estimate of regional wheat yield gaps and water use efficiency in main winter wheat production regions of China. Sci. Rep. 2017, 7, 1–15. [Google Scholar] [CrossRef] [Green Version]
  31. Wardlow, B.D.; Egbert, S.L. Large-area crop mapping using time-series MODIS 250 m NDVI data: An assessment for the U.S. Central Great Plains. Remote Sens. Environ. 2008, 112, 1096–1116. [Google Scholar] [CrossRef]
  32. Skakun, S.; Franch, B.; Vermote, E.; Roger, J.C.; Beckerreshef, I.; Justice, C.; Kussul, N. Early season large-area winter crop mapping using MODIS NDVI data, growing degree days Information and a Gaussian Mixture Model. Remote Sens. Environ. 2017, 195, 244–258. [Google Scholar] [CrossRef]
  33. Mavromatis, T. Estimation of solar radiation and its application to crop simulation models in Greece. Clim. Res. 2008, 36, 219–230. [Google Scholar] [CrossRef]
  34. Zhang, X.; Shao, J.A.; Luo, H. Spatial interpolation of air temperature with ANUSPLIN in Three Gorges Reservoir Area. In Proceedings of the International Conference on Remote Sensing, Nanjing, China, 24–26 June 2011; IEEE: Los Alamitos, CA, USA, 2011. [Google Scholar]
  35. Evans, L.T.; Fischer, R.A. Yield potential: Its definition, measurement and significance. Crop Sci. 1999, 39, 1544–1551. [Google Scholar] [CrossRef]
  36. Wang, T.; Lv, C.H.; Yu, B.H. Assessing the potential productivity of winter wheat using WOFOST in the Beijing-Tianjin-Hebei region. J. Nat. Resour. 2010, 25, 475–487. [Google Scholar]
  37. Qiu, D.C. Land Resources Science; Southwest China Normal University Press: Chongqing, China, 2005; pp. 132–154. [Google Scholar]
  38. Chang, Q.R. Land Resources Science; Northwest A&F University Press: Xianyang, China, 2002; pp. 153–159. [Google Scholar]
  39. Zhang, J.J.; Miao, J.F. Effects of climate change on light and temperature conditions of agricultural production in China. Chin. J. Agrometeorol. 1993, 14, 11–16. [Google Scholar]
  40. Vintrou, E.; Desbrosse, A.; Bégué, A.; Traoré, S.; Baron, C.; Seen, D.L. Crop area mapping in West Africa using landscape stratification of MODIS time series and comparison with existing global land products. Int. J. Appl. Earth Obs. 2012, 14, 83–93. [Google Scholar] [CrossRef]
  41. Rimal, B.; Zhang, L.; Rijal, S. Crop cycles and crop land classification in Nepal using MODIS NDVI. Remote Sens. Earth Syst. Sci. 2018, 1, 14–28. [Google Scholar] [CrossRef]
  42. Pan, Z.; Huang, J.; Zhou, Q.; Wang, L.; Cheng, Y.; Zhang, H.; Blackburn, G.A.; Jing, Y.; Liu, J. Mapping crop phenology using NDVI time-series derived from HJ-1 A/B data. Int. J. Appl. Earth Obs. 2015, 34, 188–197. [Google Scholar] [CrossRef] [Green Version]
  43. Chen, J.; Jönsson, P.; Tamura, M.; Gu, Z.; Matsushita, B.; Eklundh, L. A simple method for reconstructing a high-quality NDVI time-series data set based on the Savitzky–Golay filter. Remote Sens. Environ. 2004, 91, 332–344. [Google Scholar] [CrossRef]
  44. Liu, J.K.; Zhong, S.Q.; Liang, W.H. Extraction on crops plangting structure based on Multi-temporal Landsat8 OLI images. Remote Sens. Technol. Appl. 2015, 30, 775–783. [Google Scholar]
  45. Li, Z.; Yang, J.; Drury, C.; Hoogenboom, G. Evaluation of the DSSAT-CSM for simulating yield and soil organic C and N of a long-term maize and wheat rotation experiment in the Loess Plateau of Northwestern China. Agric. Syst. 2015, 135, 90–104. [Google Scholar] [CrossRef]
  46. Attia, A.; Rajan, N.; Xue, Q.; Nair, S.; Ibrahim, A.; Hays, D. Application of DSSAT-CERES-Wheat model to simulate winter wheat response to irrigation management in the Texas High Plains. Agric. Water Manag. 2016, 165, 50–60. [Google Scholar] [CrossRef]
  47. Wang, H.; Chen, F.; Shi, Q.H.; Fan, S.C.; Chu, Q.Q. Analysis of factors on impacting potential productivity of winter wheat in Huanghuaihai agricultural area over 30 years. Trans. Chin. Soc. Agric. Eng. 2010, 26, 90–95. [Google Scholar]
  48. Wu, D.R.; Yu, Q.; Lu, C.; Hengsdijk, H. Quantifying production potentials of winter wheat in the North China Plain. Eur. J. Agron. 2006, 24, 226–235. [Google Scholar] [CrossRef]
Figure 1. Study area and the crop land distribution.
Remotesensing 12 02857 g001
Figure 2. Technical flowchart.
Remotesensing 12 02857 g002
Figure 3. The Normalized Difference Vegetation Index (NDVI) time series curves of sample points (a) represents the winter wheat; (b) represents the forest; (c) represents buildings.
Remotesensing 12 02857 g003
Figure 4. The spatial distribution of the extracted planting location and the field sampling points of winter wheat in the Jing-Jin-Ji (JJJ) region.
Remotesensing 12 02857 g004
Figure 5. The distribution of the production potential of winter wheat in JJJ.
Remotesensing 12 02857 g005
Figure 6. Temperature and total solar radiation distribution during the winter wheat growth period in JJJ.
Remotesensing 12 02857 g006
Table 1. Information on winter wheat phenology during 2014–2015.
Growth StateEmergence StageOverwintering StageGreen Returned StageErecting StageJointing StageHeading StageAnthesis StageMature Stage
Date10.511.303.114.104.235.135.176.20
Dry matter accumulation (g/per plant)-0.50.30.40.7-22.8
LAI-3.3-2.64.2-4.6-
Table 2. Yield of winter wheat (2014–2016).
Year201420152016
Yield (kg/ha)561358265814
Table 3. Experimental management data.
Management InformationDateOperations
Planting2014.9.28Sow in row, 16 cm (row space), 4 cm (seeding depth), 250 kg/hm2 (population)
Chemical applications2015.3.12Herbicide and pesticide
Irrigation2014.9.29Border irrigation, 70 mm
2014.11.9Border irrigation, 75 mm
2015.4.10Border irrigation, 80 mm
2015.5.10Border irrigation, 80 mm
Fertilizers2014.9.27Base fertilizer: urea 220 kg/hm2, diammonium phosphate 300 kg/hm2, potassium nitrate 220 kg/hm2
2015.4.18Additional fertilizer, urea 200 kg/hm2
Table 4. The accuracy of the extracted area of winter wheat in each city (unit: Hectares).
CityExtracted AreaArea in Statistical DataAccuracy
Xingtai346.92342.8798.83%
Tianjin96.01101.3094.78%
Cangzhou361.39382.3294.53%
Baoding364.81386.1694.47%
Handan332.11375.3988.47%
Shijiazhuang276.96319.1786.78%
Hengshui318.87257.4380.73%
Beijing7.6911.2068.66%
Tangshan62.72107.4858.36%
Langfang37.8366.3757.00%
Jing-Jin-Ji2205.882419.2091.18%
Note: Three cities whose acreage was below 5 hectares are not included in the table, they were Zhangjiakou, Chengde, and Qinhuangdao.
Table 5. Cultivar coefficient localization results of the DSSAT-CERES-Wheat model.
ParameterDefinitionValueUnit
P1VDays required for vernalization, optimum vernalizing temperature42.1Days
P1DPhotoperiod response58.9%
P5Grain filling (excluding lag) phase duration585°C·d
PHINTInterval between successive leaf tip appearances105°C·d
PARUEPAR conversion to dm ratio, before last leaf stage2.5g/mJ
PARU2PAR conversion to dm ratio, after last leaf3.42g/mJ
G1Kernel number per unit canopy weight at anthesis28Kernels/g
G2Standard kernel size under optimum conditions30Mg
G3Standard, non-stressed mature tiller wt (incl. grain)1.2G
LA1SArea of standard first leaf3.1cm2
GN%SStandard grain N2.85%
LAFVIncrease in potential area of leaves, vegetative phase0.4fr/leaf
LAFRIncrease in potential area of leaves, reproductive phase1.1fr/leaf
SLASSpecific leaf area, standard first leaf220cm2/g
LSPHSFinal leaf senescence starts5.0Growth stage
LSPHEFinal leaf senescence ends6.5Growth stage
Table 6. Simulation error after calibration in the (Decision Support System for Agrotechnology Transfer) DSSAT model.
ItemMeasured ValueSimulated ValueError/nRMSE
Seeding date (day)561 day
Anthesis date (day)2292290 day
Harvest (day)2632621 day
Yield in 2014 (kg/hm2)56135605.713.02%
Yield in 2015 (kg/hm2)58265834.013.71%
Yield in 2016 (kg/hm2)58145821.112.20%
Table 7. Production potential of winter wheat in each city (unit: kg/ha).
CityThe Range of Production PotentialThe Average of Production PotentialCityThe Range of Production PotentialThe Average of Production Potential
Xingtai9064~10,7749848Beijing6506~99989390
Shijiazhuang8302~10,6269672Langfang8262~98279344
Hengshui8214~10,3289517Tianjin5575~99989223
Baoding7999~10,0889433Cangzhou7999~99379030
Handan8692~10,3549408Tangshan4238~95166747
Jing-Jin-Ji4238~10,7747865---
Table 8. Statistics of the production potential of winter wheat in each city.
City<70007000~90009000~10,000>10,000TotalPercentage (>9000)
Xingtai0041,74713,75955,506100%
Shijiazhuang015137,168699444,31399.66%
Hengshui054748,531194051,01898.93%
Baoding0117957,1207058,36997.98%
Beijing62811960123097.24%
Langfang020458490605396.63%
Tianjin8161614,665015,36295.46%
Handan0301149,93219453,13794.33%
Cangzhou0957248,250057,82283.45%
Tangshan64755333028010,03630.17%
Jing-Jin-Ji641115,841307,48622,957352,84693.65%

