Article

Radiometric Calibration for Incidence Angle, Range and Sub-Footprint Effects on Hyperspectral LiDAR Backscatter Intensity

1
The State Key Laboratory of Remote Sensing Science, Aerospace Information Research Institute, Chinese Academy of Sciences, Beijing 100101, China
2
University of Chinese Academy of Sciences, Beijing 100049, China
*
Author to whom correspondence should be addressed.
Remote Sens. 2020, 12(17), 2855; https://doi.org/10.3390/rs12172855
Submission received: 29 July 2020 / Revised: 30 August 2020 / Accepted: 1 September 2020 / Published: 2 September 2020
(This article belongs to the Special Issue Advances in LiDAR Remote Sensing for Forestry and Ecology)

Abstract

:
Terrestrial hyperspectral LiDAR (HSL) sensors could provide not only spatial information of the measured targets but also the backscattered spectral intensity signal of the laser pulse. The raw intensity collected by HSL is influenced by several factors, among which the range, incidence angle and sub-footprint play a significant role. Further studies on the influence of the range, incidence angle and sub-footprint are needed to improve the accuracy of backscatter intensity data as it is important for vegetation structural and biochemical information estimation. In this paper, we investigated the effects on the laser backscatter intensity and developed a practical correction method for HSL data. We established a laser ratio calibration method and a reference target-based method for HSL and investigated the calibration procedures for the mixed measurements of the effects of the incident angle, range and sub-footprint. Results showed that the laser ratio at the red-edge and near-infrared laser wavelengths has higher accuracy and simplicity in eliminating range, incident angle and sub-footprint effects and can significantly improve the backscatter intensity discrepancy caused by these effects.

Graphical Abstract

1. Introduction

Light detection and ranging (LiDAR) has been acknowledged as a powerful survey tool to obtain surface geometry and to perform target characterization since its appearance over 20 years ago [1].
In addition to 3D spatial geometric measurements, most LiDAR systems measure the returned laser signal power of the scanned object surfaces and record it as the intensity value at the same time. The backscattered intensity recorded by current LiDAR systems, including the discrete and full-waveform laser signal, has been utilized for land cover classification [2,3,4,5], e.g., trees and snow in glaciers, and plant structure and physiological information estimation, e.g., leaf area distribution [6,7,8], leaf water content [9,10], nitrogen content [11,12] and chlorophyll content [13,14,15].
The LiDAR backscatter intensity is regarded as a crucial source of spectral information related to the surface properties of the measured object [16]. However, the backscatter intensity is influenced by at least four essential factors [17], such as instrumental effects, atmospheric effects, scanning geometry and target scattering characteristics. In practice, the backscatter intensity is mainly influenced by scanning geometry, involving the incidence angle, range and sub-footprint, given that the instrumental influence is kept constant and atmospheric attenuation is negligible [18]. Considering such cases, a more comprehensive and robust intensity correction is needed to eliminate the effects of incidence angle, range and sub-footprint effects for the different applications of intensity data. The scanning geometry influence has been previously studied on intensity data.
The incident angle has a significant influence on the backscatter intensity data. The size of the laser footprint changes with the incidence angle and increases in the incidence angle result in less backscatter signal into the LiDAR sensor [16]. The basis of the theoretical model is the radar range equation which is used for incidence angle effect correction [19]. According to the radar range equation, the backscatter intensity is a function of the cosine of the incidence angle [20]. Given that target surfaces are isotropically reflecting surfaces, Lambert’s cosine law can provide a competent explanation of light reflection modeling for ordered surfaces; therefore, it is widely applied in many intensity correction applications [21]. However, these corrections assume that target surfaces are perfect diffuse reflectors (i.e., Lambertian reflectors), which are not always valid in many natural objects with complex surface properties [22]. Some new correction models are proposed to combine a physical model based on the bidirectional reflectance distribution function (BRDF), e.g., Lommel–Seeliger law model [23], Phong model [24,25,26], Lambertian model, Beckmann law model [10,27] and Oren–Nayar reflectance model [22,28]. These models allow the correction of Lambertian as well as non-Lambertian reflectors. In practice, the models’ parameters (e.g., surface roughness, grain size) are difficult to obtain accurately and therefore the physical models have some limitations in correcting the angle effect on the backscatter intensity of the complex target surface.
The scanning range is one of the crucial factors that influence the backscatter intensity. The primary effect of range on backscatter intensity is the fact that the laser pulse power diminishes (i.e., laser spreading loss) while the laser beam propagates through the atmosphere. Increases in range also give rise to enlarging the size of the laser spot and backscatter cross-section area [16]. The range effect on backscatter intensity is mainly dependent on instrumental factors (e.g., near-distances reducer, aperture size, transmitted power, amplifier control and photodetector sensor) and varies significantly over different LiDAR systems. There are many methods for compensating the range effect that have been reported [29,30,31,32,33,34,35]. The correction for the range effect could be divided into two categories: the reference target method and the empirical method. The former calibrates the return intensity of the target to the backscattered reflectance using reference targets of known reflectance. The selected reference targets are diverse, such as natural targets and standard panels with different reflectance. The changes in reference targets will result in differences in intensity correction results. The latter eliminates the range effect by empirical range relation models (e.g., 1/R2 and 1/R3) based on the radar range equation. In general, the backscatter intensity data are multiplied by the empirical range relation model and then normalized by dividing by a pre-defined reference range to improve the range effect. Each empirical method is developed and applied to the intensity correction of a specific LiDAR system, and the method might not be suitable for various LiDAR with different instrumental properties.
Another complicating factor is known as the “sub-footprint” effect [12,36,37]. The sub-footprint effect, also named the edge effect, occurs when the laser beam is illuminated on the edge of a target so the laser return signal is shared by multiple targets, e.g., the edge of a leaf and soil background. In such a case, the intensity data acquired from the multi-return signal tend to be much lower compared with that of a single-return signal due to the “sub-footprint” effect. Jan U.H. Eitel [13] investigated the edge effect on laser return intensity using a dual-wavelength laser system and removed lower edge returns directly on a leaf edge based on a threshold value to examine chlorophyll content and leaf area. Qin [37] introduced a reflectance-like indicator which was named normalized reflective factor to improve the sub-footprint effect on the laser return intensity. The proposed approaches only considered the single- and double-return wavelength signals. For the laser pulse signal with more than two wavelengths, the radiative transfer is more complicated due to the multiple scattering.
Previous studies have focused on calibration approaches for correcting the intensity discrepancy of single-wavelength LiDAR systems and have subsequently presented the effectiveness of such calibration methods. However, existing calibration methods usually vary and are restricted to some extent as mentioned above. Calibration for hyperspectral LiDAR intensity data is especially difficult due to the increase in the number of wavelengths. Apart from the incidence angle, range and sub-footprint, the wavelength dependency on these effects is needed to further analyze for HSL intensity data.
Therefore, this study is aimed to explore the incidence angle, range and sub-footprint effects on various laser wavelength intensities for different leaf surfaces observed by a newly developed HSL system and search for a practical hyperspectral laser backscatter intensity correction method for these effects. Experiments are conducted to evaluate the performance of the proposed method. The paper is organized as follows: intensity data correction procedures and experiments setup are introduced in Section 2. Section 3 presents the experimental and correction results. Discussion and conclusions are provided in Section 4 and Section 5, respectively.

2. Materials and Methods

2.1. HSL System

The HSL system is a novel type of remote sensor which combines the spectral sensing ability of passive images and the spatial detecting ability of point clouds [14,15,38]. Both spectral and spatial information can be obtained in one laser shot. The HSL system consists of five units, including a supercontinuum laser, achromatic refractor telescope, grating spectrograph, linear array multianode photomultiplier, oscilloscope and computer control unit [39]. The supercontinuum laser emits a broadband spectrum laser beam with a wide range of wavelength. The backscattered laser beam of the scanned target is collected by the achromatic refractor telescope with an 80 mm aperture diameter and then is focused onto the grating spectrograph (with a spectral sampling interval of 17 nm) and split into multiple wavelengths. The spectrally divided light is converted to an analog voltages signal using the photomultiplier. Lastly, the backscattered signals can be acquired by the oscilloscope under the control of the computer. The effective spectral range of the HSL system is 540–849 nm (spectral sampling interval of 17 nm).

2.2. Proposed Model for Intensity Correction

2.2.1. Radar Equation

The laser scanning system emits laser beams to the object and acquires the returned laser signals after being backscattered from the object surfaces. Under the assumption of a target with Lambertian reflectance, the radar equation [40] describes the amount of the received signal power with respect to the transmitted power and involves parameters relating to the instrumental factor, the object surface reflectance and the atmosphere:
P r = P t D 2 ρ cos θ 4 R 2 η s y s η a t m ,
where Pr is received laser power in watts, Pt is the transmitted power (W) in watts, D is the receiver aperture diameter in meters, R is the range from the scanner to the target in meters, ηsys is the system losses, ηatm is the atmospheric losses, ρ is the target surface reflectance and θ is the incident angle of the laser beam.
The radar equation defines instrumental parameters (Pt, ηsys), atmospheric factors (ηatm) and target properties (ρ), as a function of the received signal power. This equation can also be applied for the HSL system. According to Equation (1), the wavelength-dependent backscatter intensity can be provided by
P r λ = P t λ D 2 ρ λ cos θ λ 4 R λ 2 η s y s λ η a t m λ ,
where λ is the laser wavelength of the HSL system. With the increase in the number of wavelengths, additional information about the target features can be obtained.

2.2.2. The Reference Target-Based Model

The laser pulse signal emitted by the HSL illuminates on the target surface and is reflected back to the sensor. The process results in a similar influence on the footprint of the laser beam by the incident angle, distance and sensor factors at each laser wavelength. Thus, the calculation of backscatter intensity is primarily affected by the target properties and should be insensitive to scanning geometry and sensor factors. According to Equation (2), the wavelength-dependent laser spectral ratio is calculated as follows:
ρ λ = P t λ ρ 1 λ η s y s λ η a t m λ P t r e f λ ρ r e f λ η s y s λ η a t m λ · R r e f λ 2 R λ 2 · cos θ λ cos θ r e f λ ,
Given that the laser spot is utterly aligned, the effects of the incidence angle, distance and size of the target surface within the laser spot should be similar at the same scanning geometry and wavelength. In addition, the parameters Pt, D, ηsys and ηatm can be considered as four constants for the same wavelength channel, which depend on the instrument and atmospheric effect. Thus, the calibrated laser intensity can be expressed by
ρ c o r λ = P r λ P r r e f λ · ρ r e f λ ,
In practice, the backscatter intensity at each laser wavelength λ is collected using a 99% standard reflectance panel as a reference target. Each wavelength backscatter intensity of the measured target is normalized with the same wavelength intensity of the reference target at the same distance and incidence angle. The calibrated reflectance of the measured target can be derived once the backscatter intensity of the reference target is determined in the laboratory.

2.2.3. Laser Ratio Index Extended by Spectral Index

The received laser intensity data at each wavelength generated from a multi-return signal tend to be much lower compared with that of a single-return signal due to the “sub-footprint” effect [12,37], e.g., when the laser beam partially occupies a leaf edge, the returned laser beam contains multiple returned signals from mixed objects (Figure 1).
If the backscatter intensities of both wavelengths are similarly affected by the incidence angle and range, the effects can be partially eliminated by the ratio of the two wavelengths, as it should be insensitive to the incidence angle and range [9]. Laser spectral ratios at multiwavelengths also might be employed to the calibration method for the sub-footprint effect. Thus, several laser ratio indices associated with backscatter intensities at different wavelengths were calculated as follows. These laser ratio indices listed below were based on previously published spectral vegetation indices [41,42,43,44,45].
Normalized   Difference   Laser   Index near - infrared , red ( NDLI nr ) = I 784 I 670 I 784 + I 670 ,
Normalized   Difference   Laser   Index near - infrared , red - edge ( NDLI ne ) = I 784 I 719 I 784 + I 719 ,
Difference   Laser   Ratio   Index near - infrared ,   red - edge ,   red ( DLR ner ) = I 751 I 703 I 703 I 686 ,
Sample   Laser   Ratio   Index near - infrared , red - edge ( SLR ne ) = I 768 I 719 ,
Sample   Laser   Ratio   Index near - infrared , green ( SLR ng ) = I 784 I 556 1 .

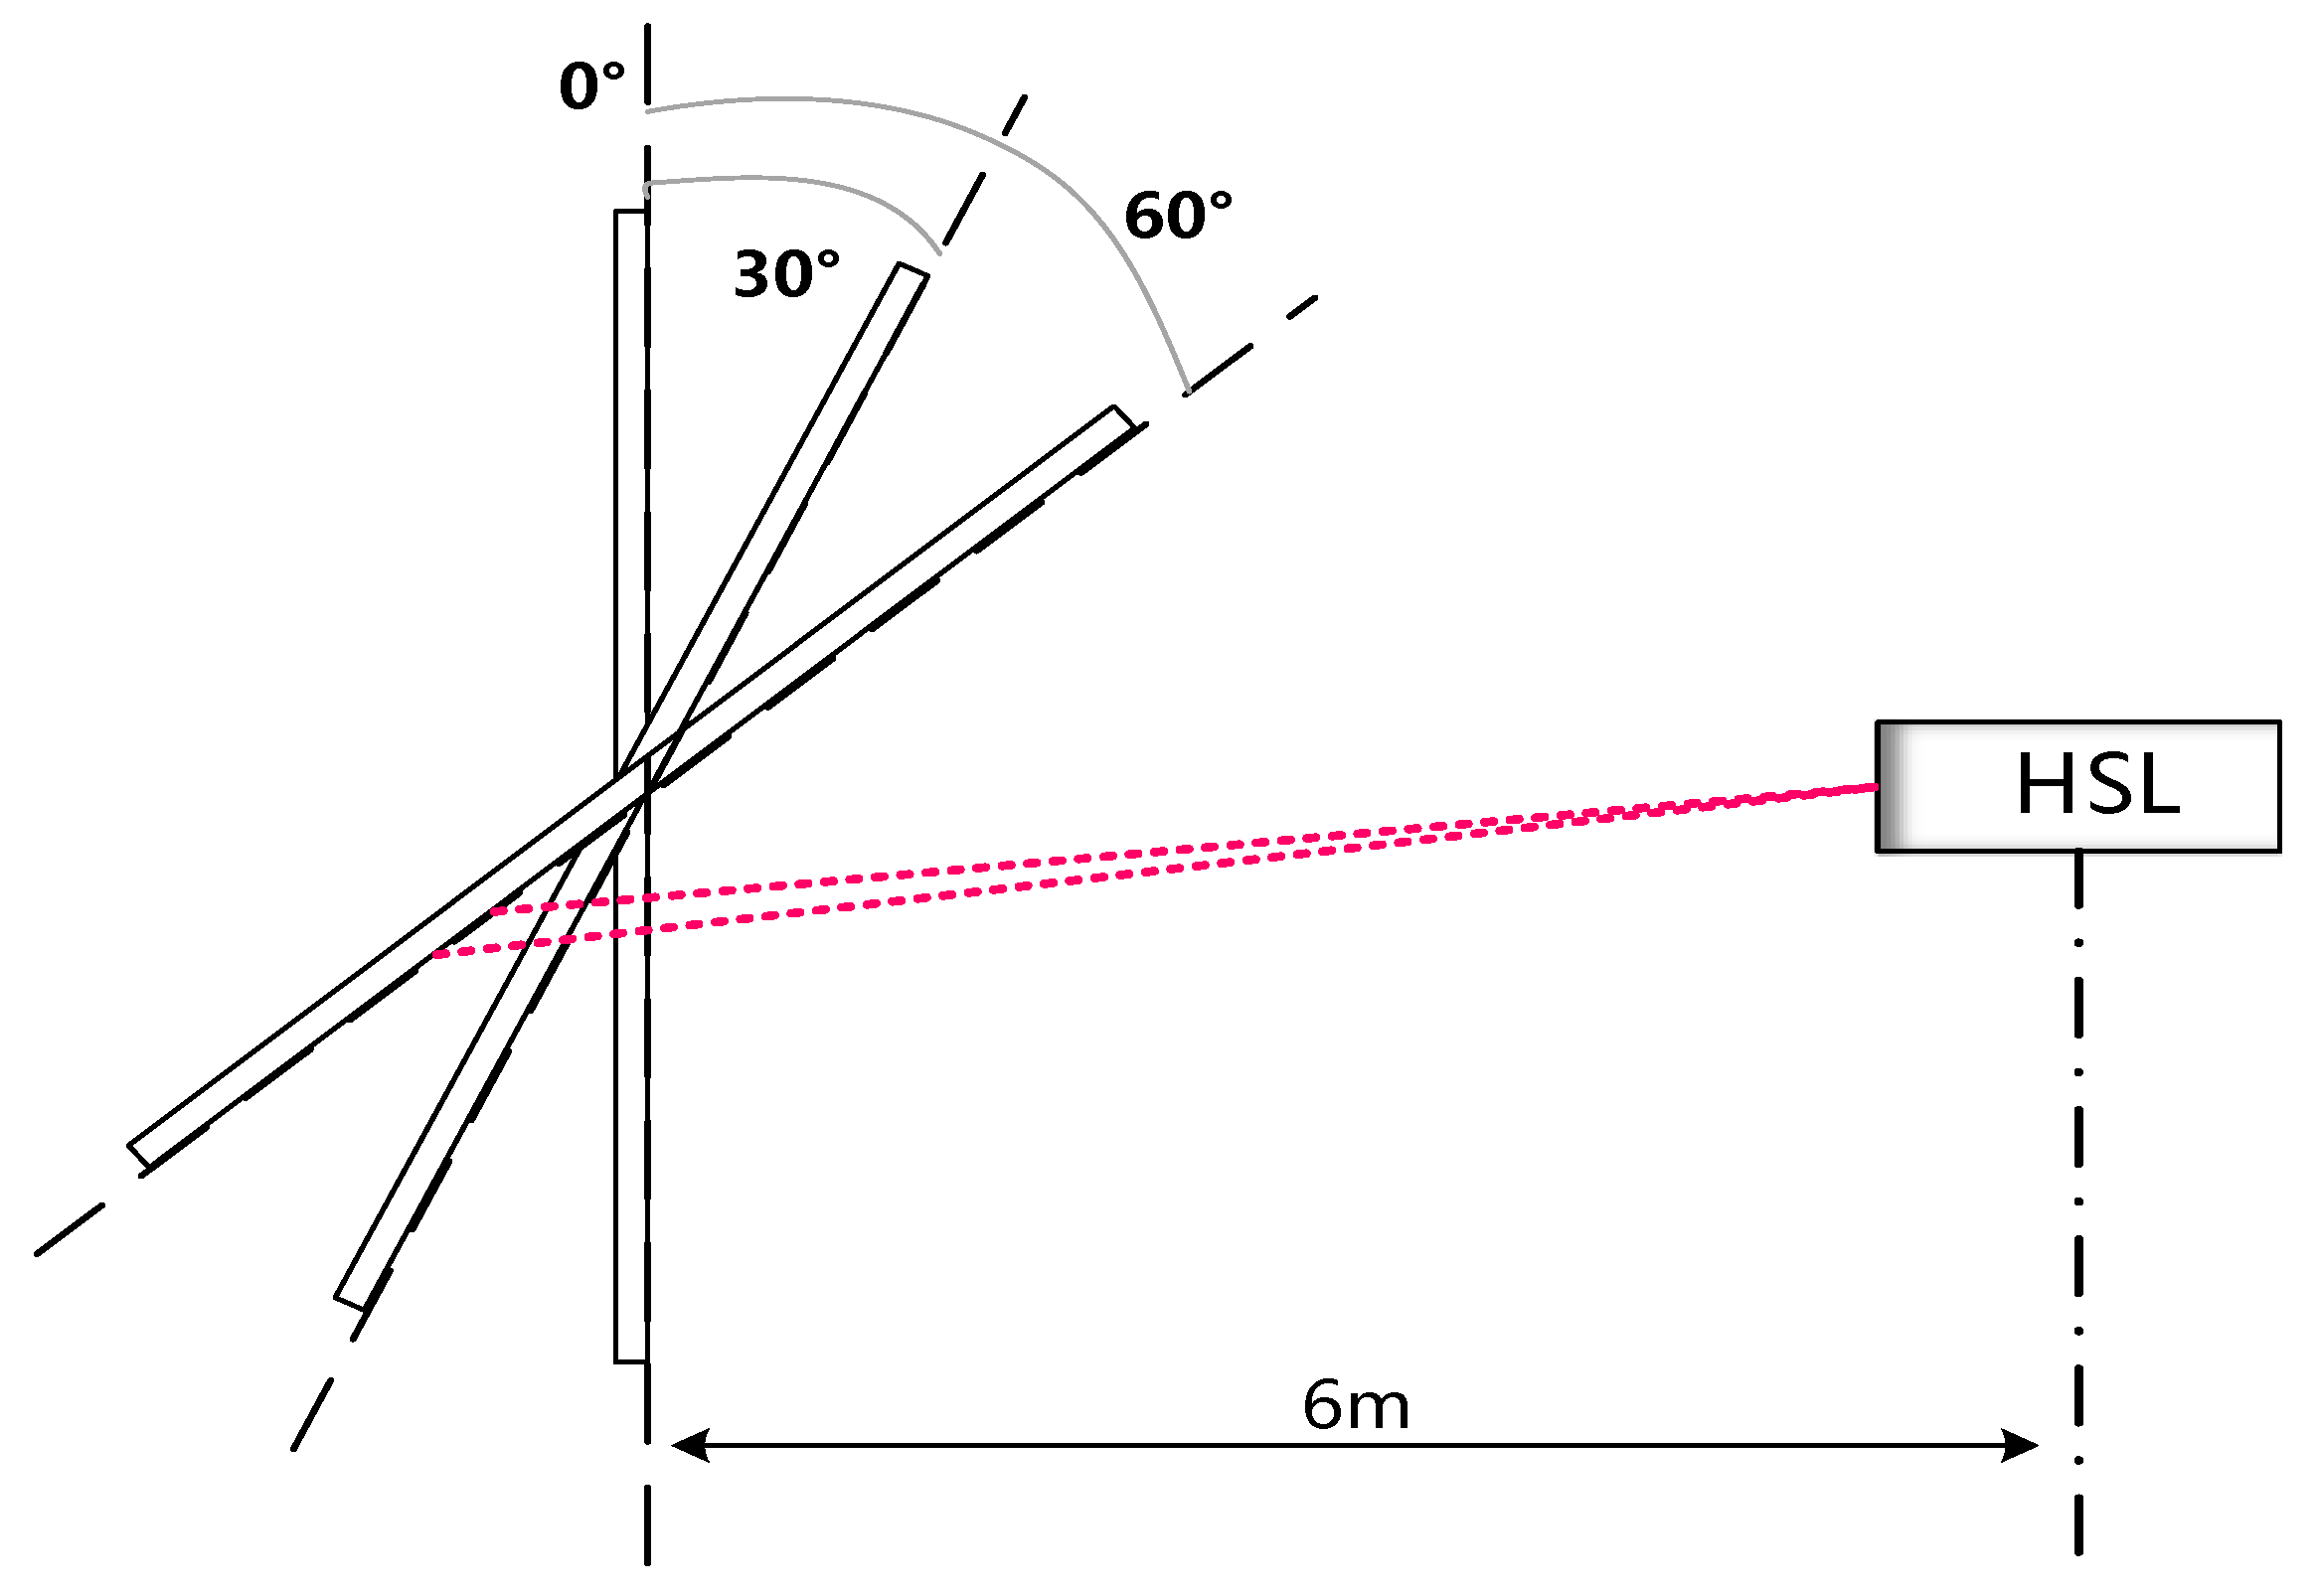
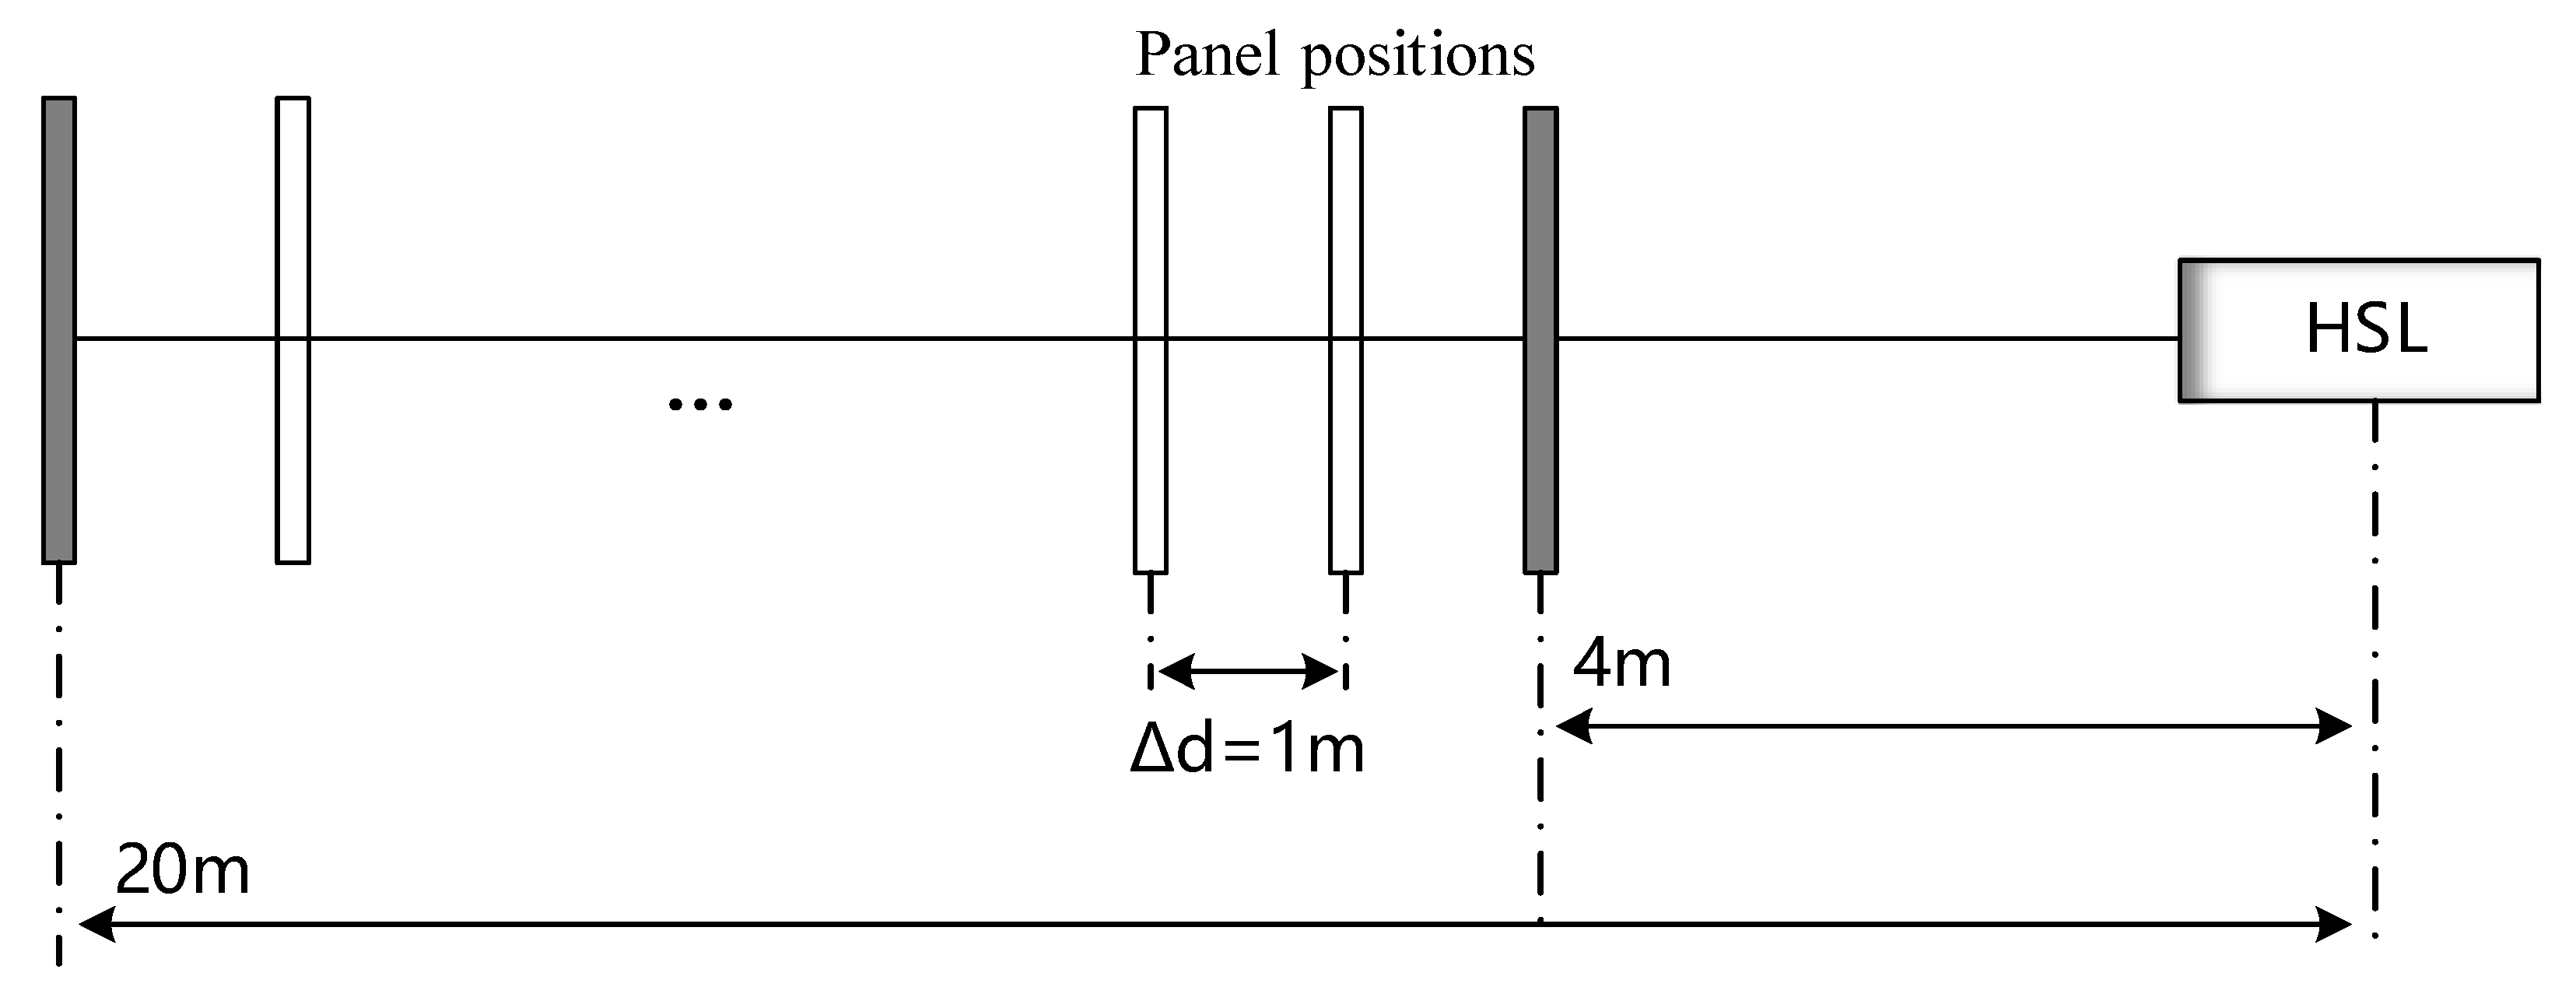
2.3. Experiment Design

To investigate the effect of the incidence angle and range on the laser backscatter intensity, two experiments were performed with the HSL. The first setup was designed to evaluate the incidence angle effect, whereas the second setup evaluates the range effect. The backscatter intensity of the continuous light source was recorded at twenty laser wavelength channels (540~849 nm) for various samples. Leaf samples were collected from six common broadleaf plant species (Table 1), including Ficus elastica, Epipremnum aureum, Aglaonema modestum, Hibiscus rosa-sinensis Linn, Spathiphyllum kochii and Kalanchoe blossfeldiana Poelln. The leaf lengths of the healthy samples from six species range from 9 to 15 cm and the leaf thicknesses are between 0.1 and 0.2 cm. Besides, to improve the signal to noise ratio and to avoid a signal miss, as might occur with a single measurement, one position was selected and scanned at various angles or distances for each target (each representative plant leaf and standard reflectance panel), and the average of ten returned laser pulses was used for each target measurement.
In the first set of experiments, the incidence angle was changed in 10° increments, and a two-dimensional scan over the sample was performed to produce a point cloud at each incidence angle. Leaf samples were measured at different incidence angles, and the experimental setup and scene of the incidence angle measurement are shown in Figure 2. The samples were flattened to the panel and were measured at a position 6 m from the HSL system and rotated to change the angle between 0° and 70°.
In the second set of experiments, the samples were measured at a position 4 m away and were moved away from the HSL at a step interval of 1 m up to the 20 m range. The experimental setup of the range experiment is shown in Figure 3. To cancel the influence of the incident angle on the backscatter intensity, the incident angle was fixed at 0° during the experiment process. While the target was moved along its main axis of the sensor view, we visually ensured that the entire laser footprint illuminated onto the target surface.

3. Results

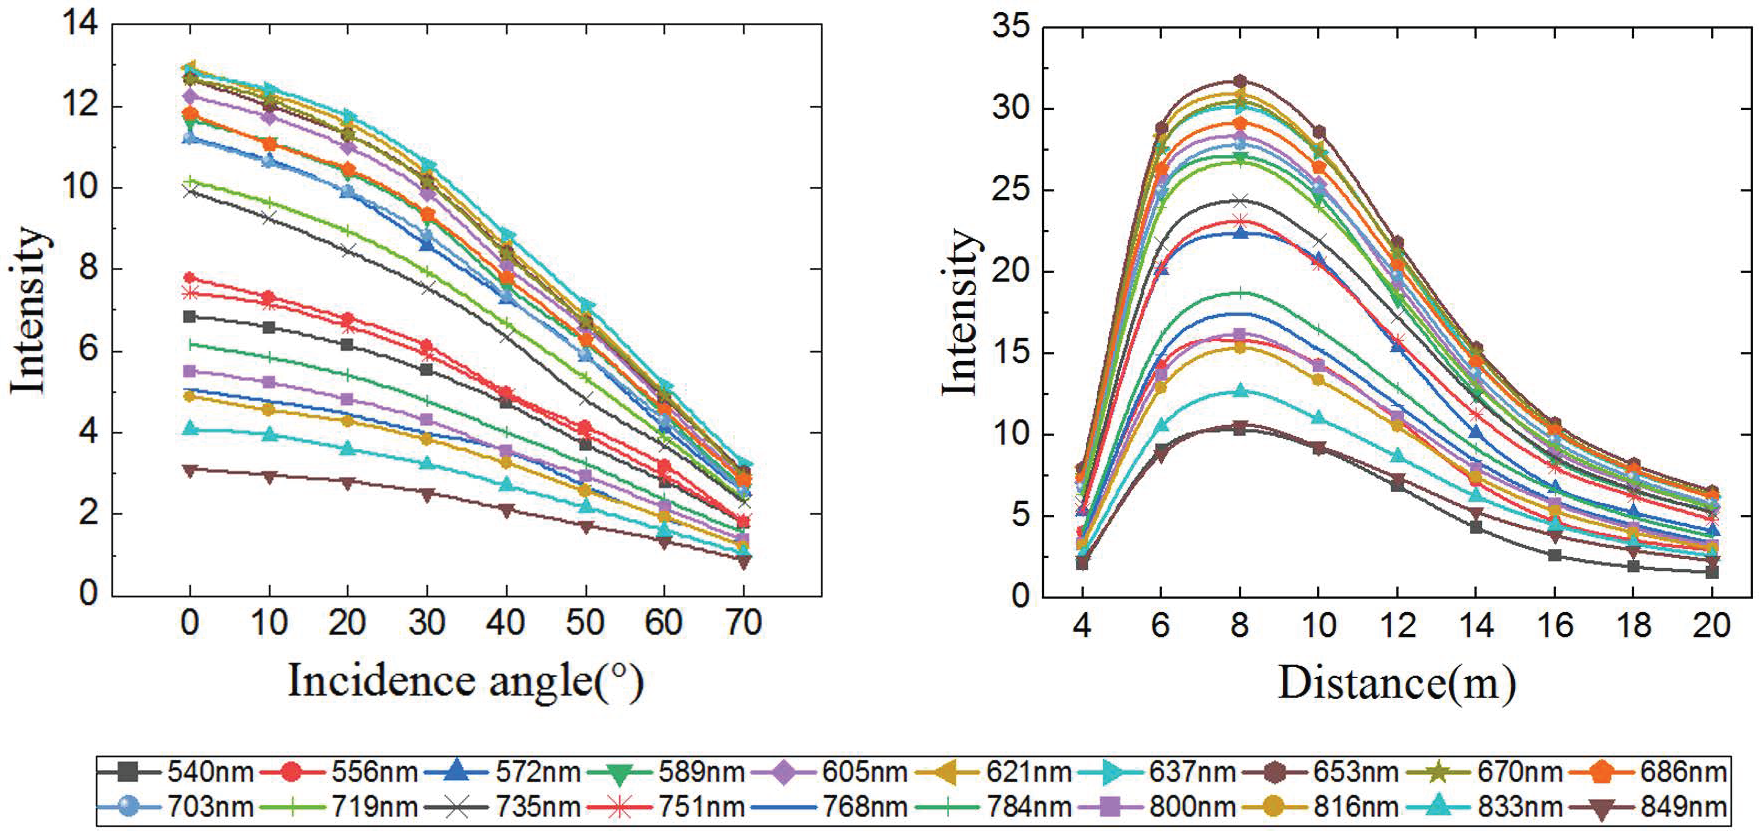
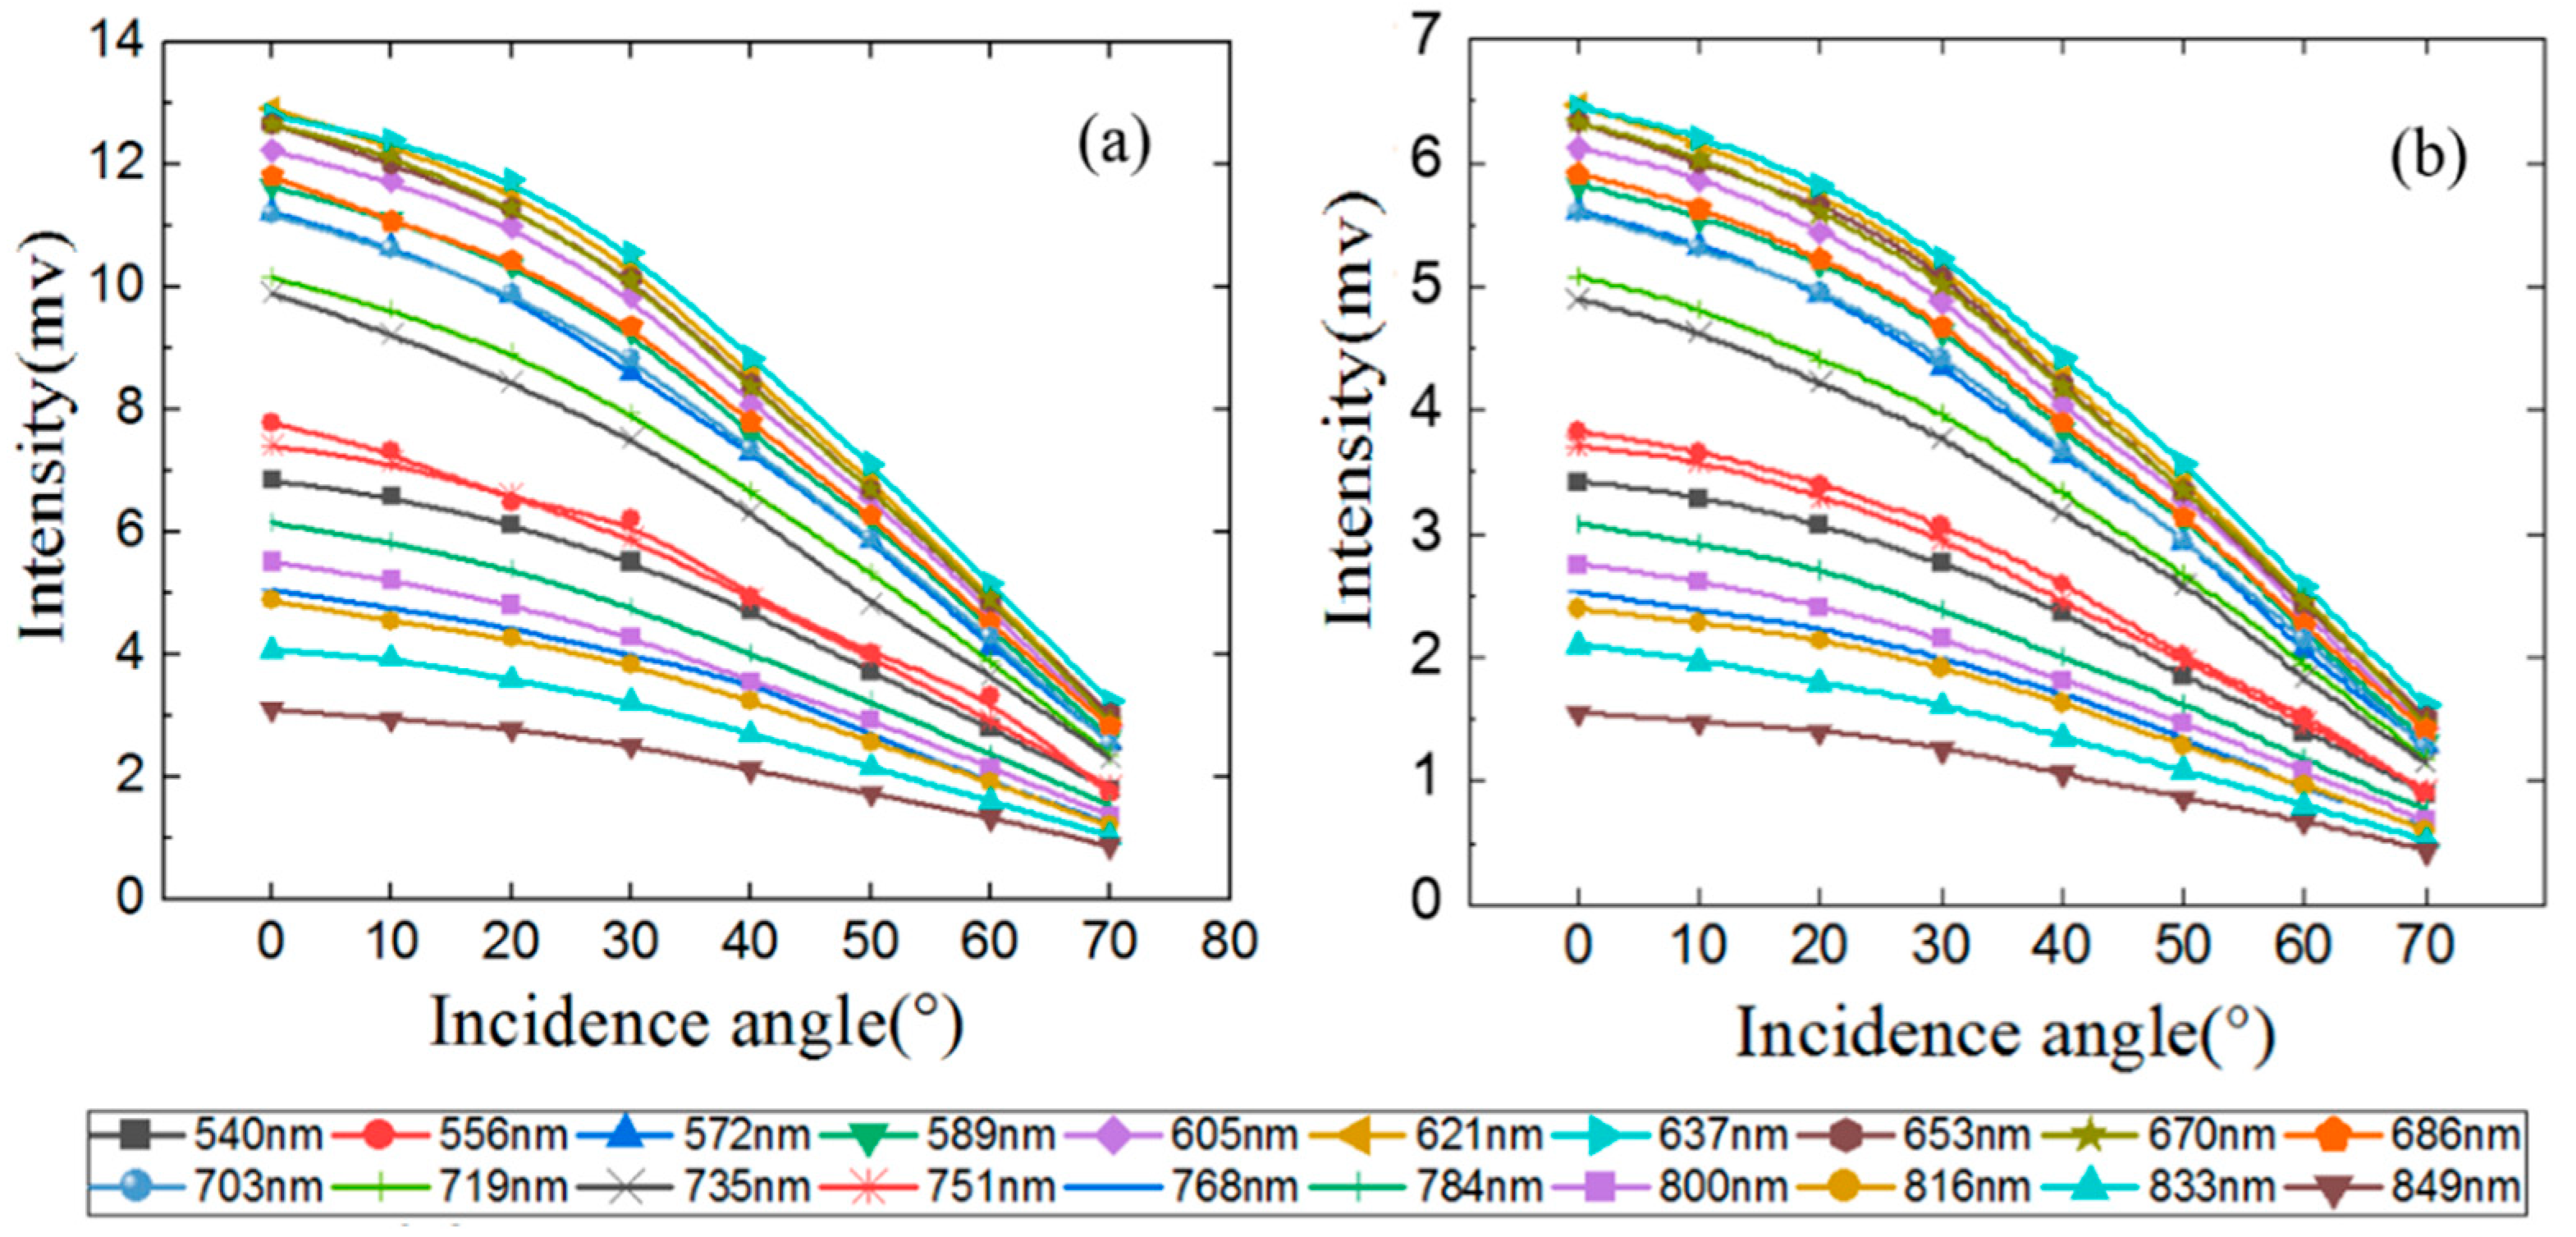
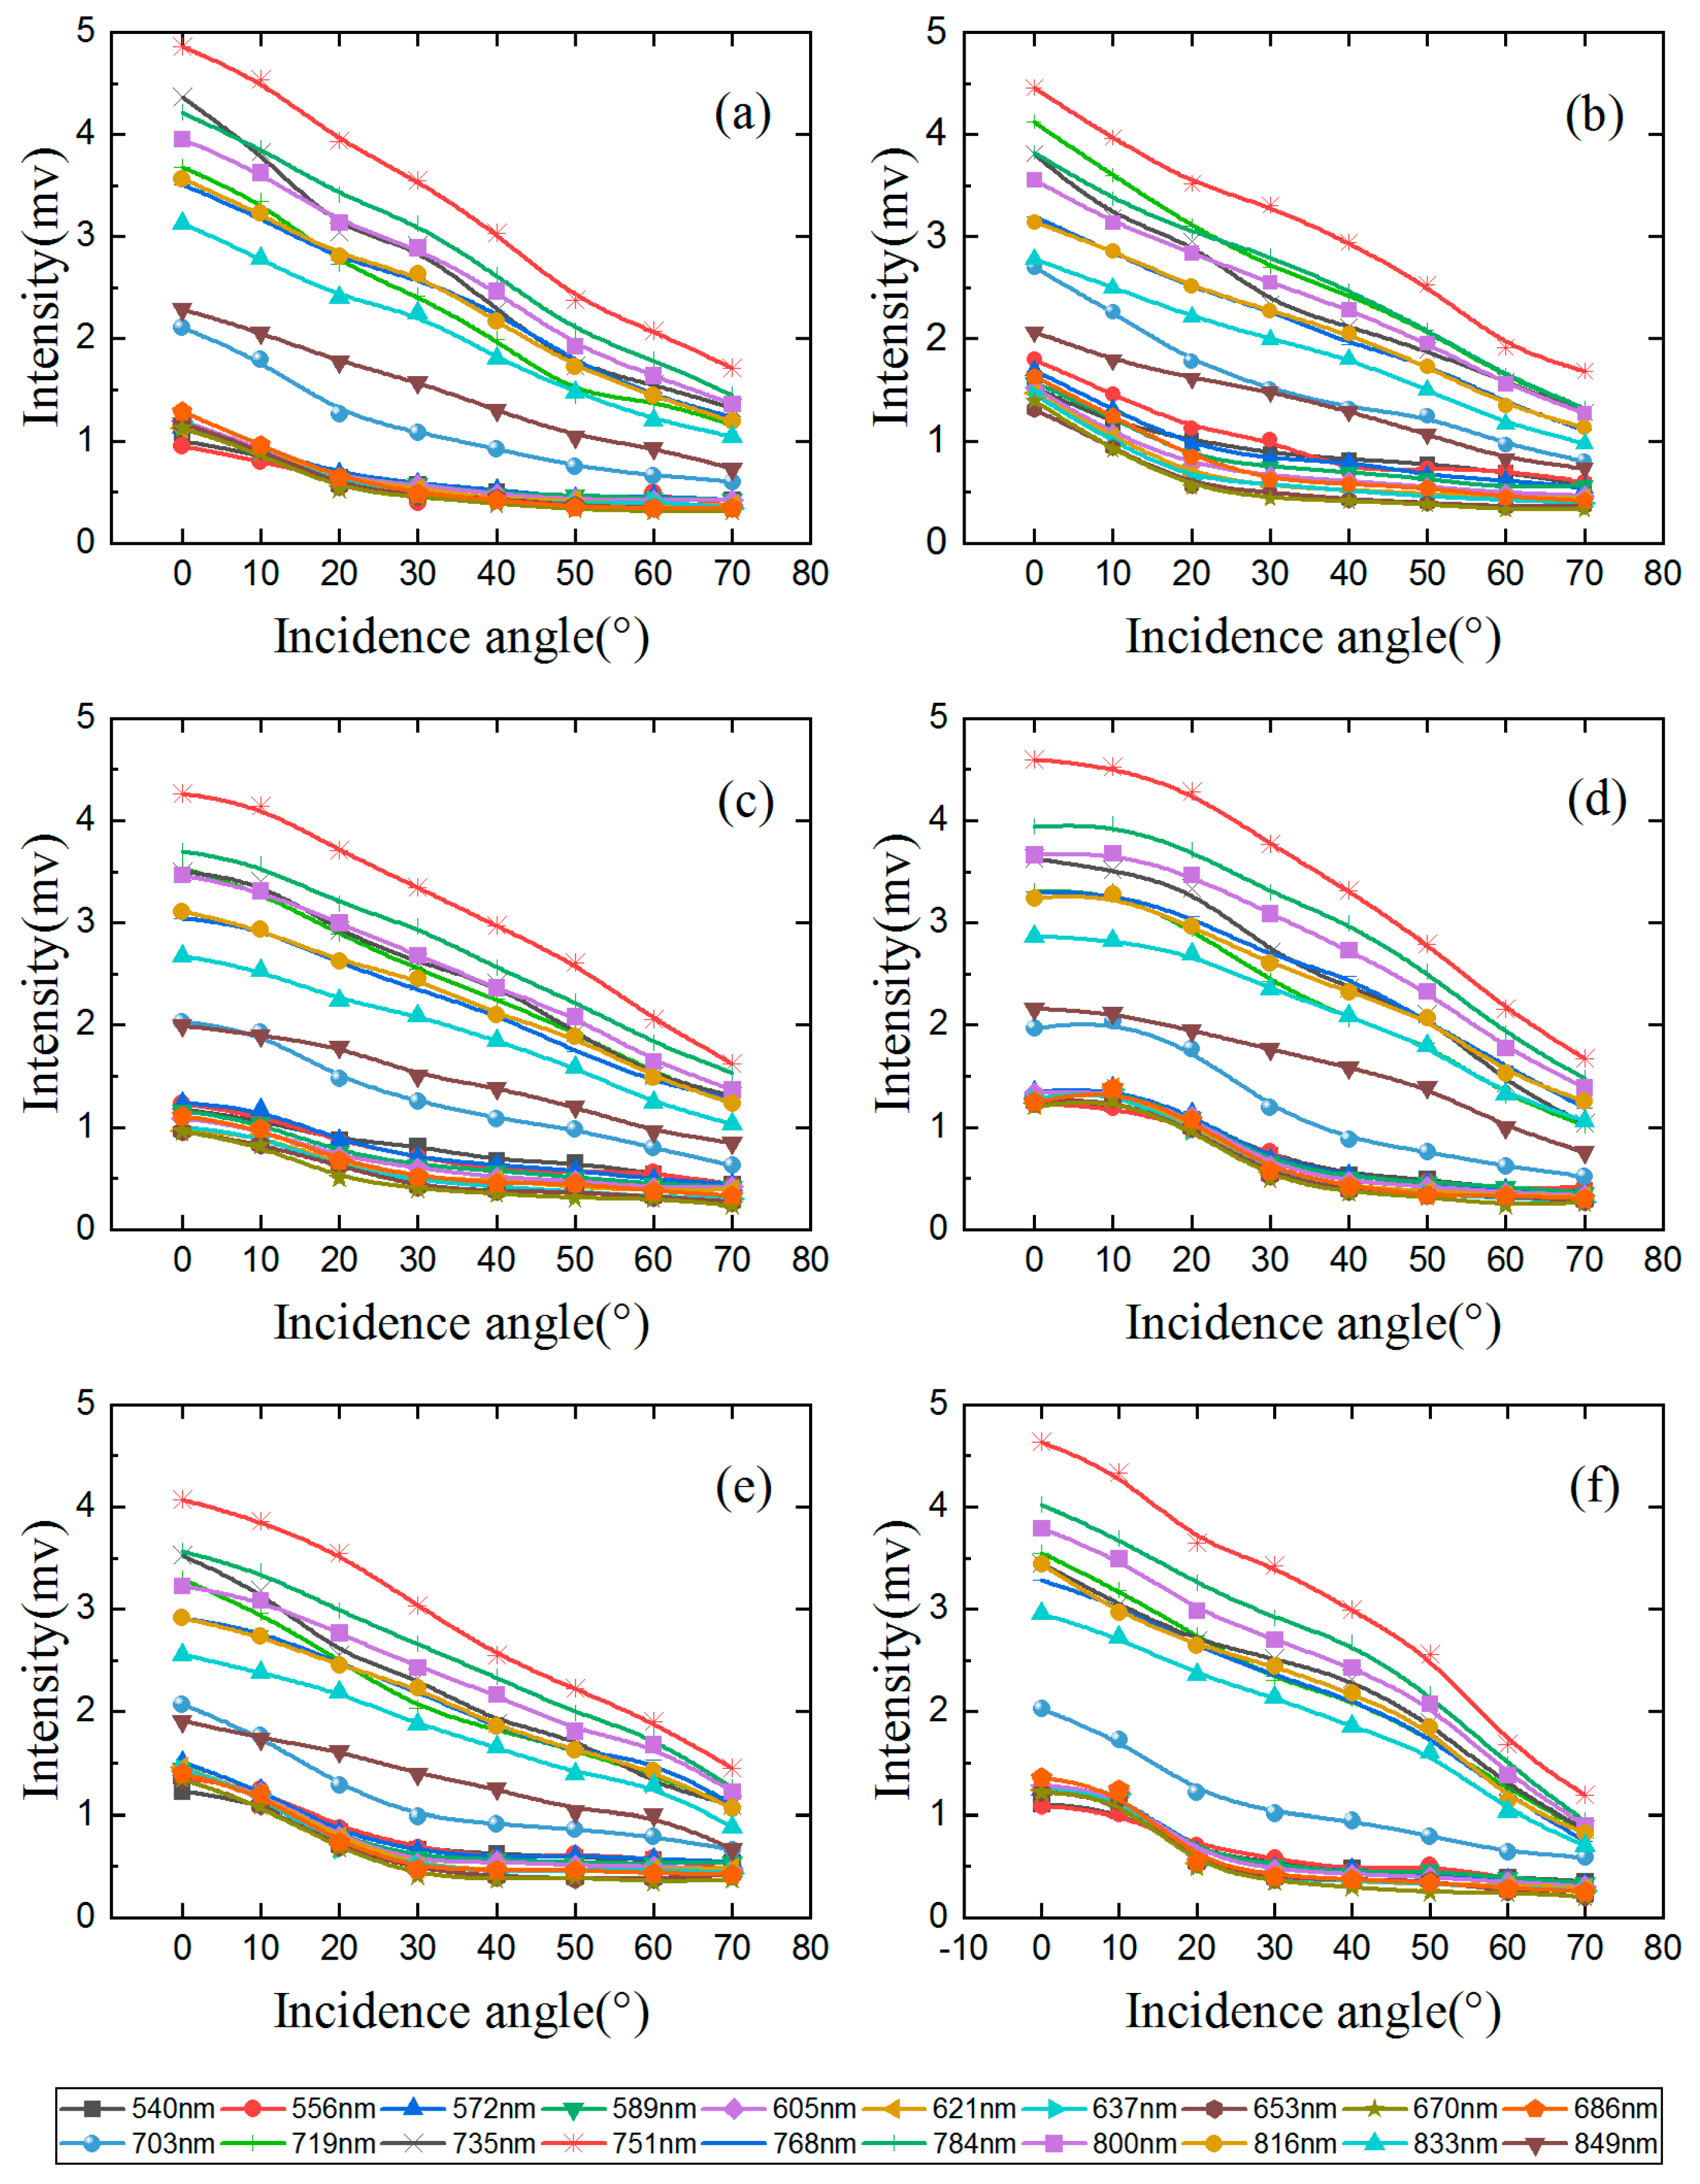
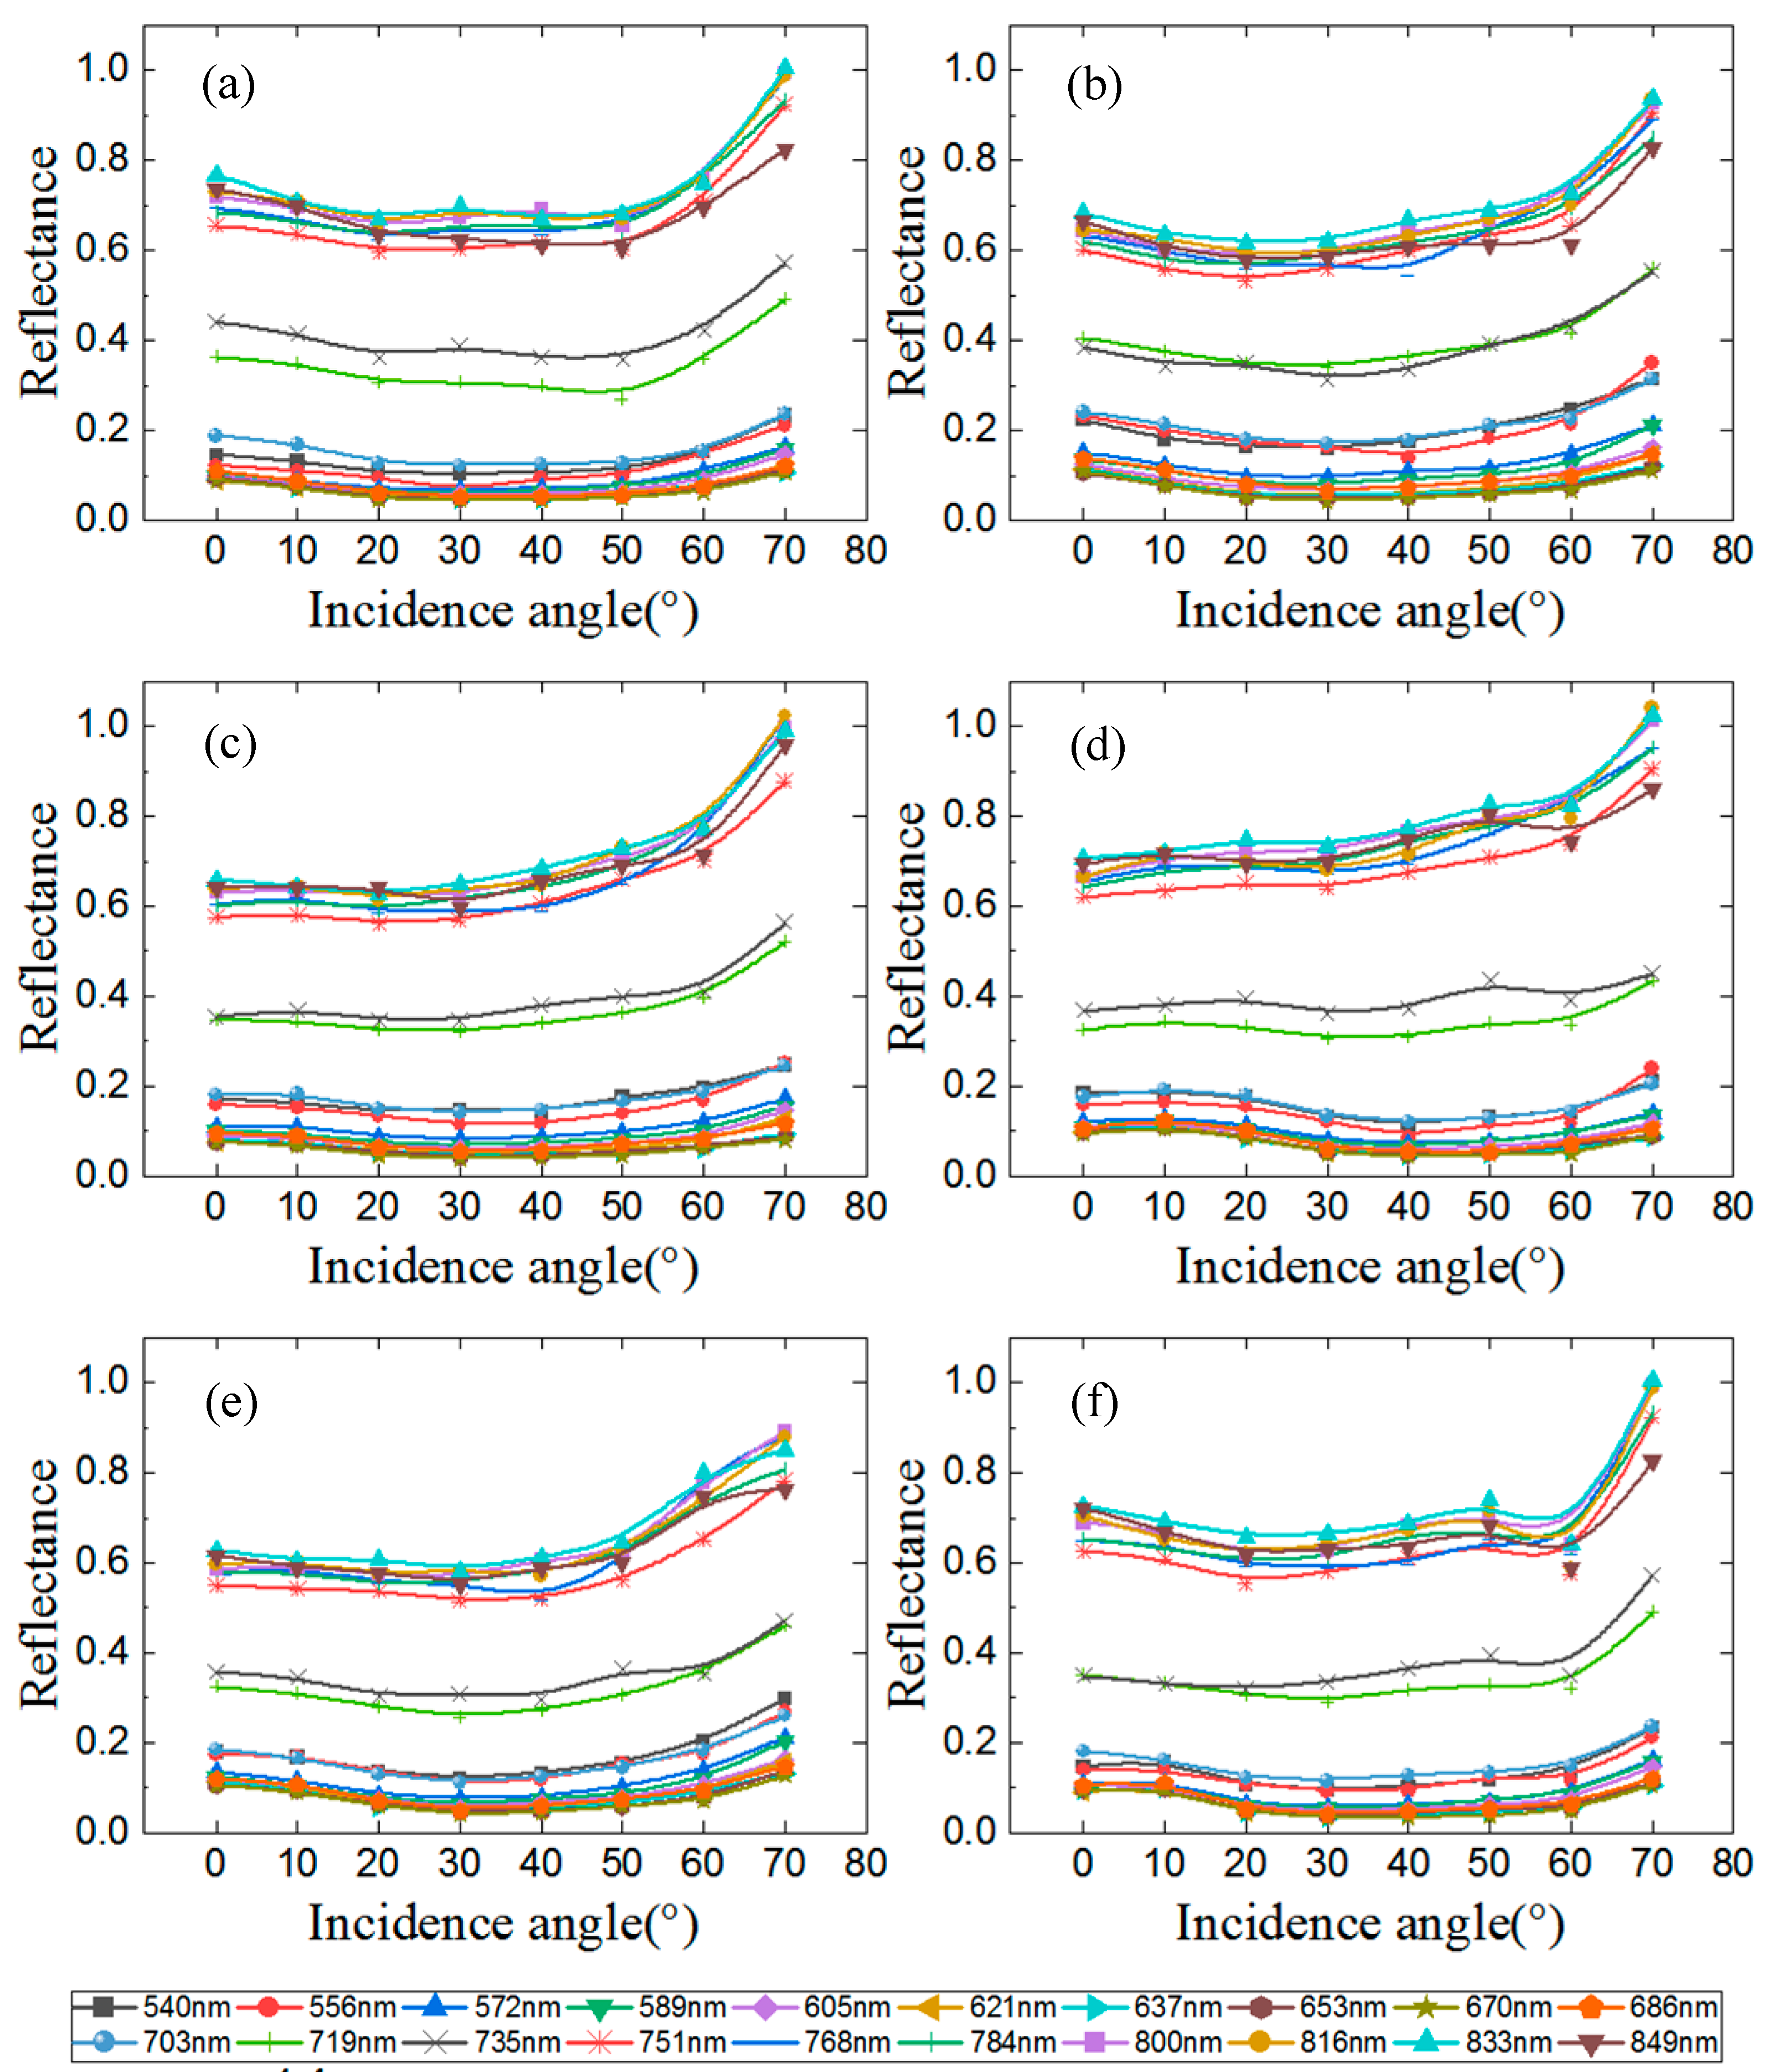
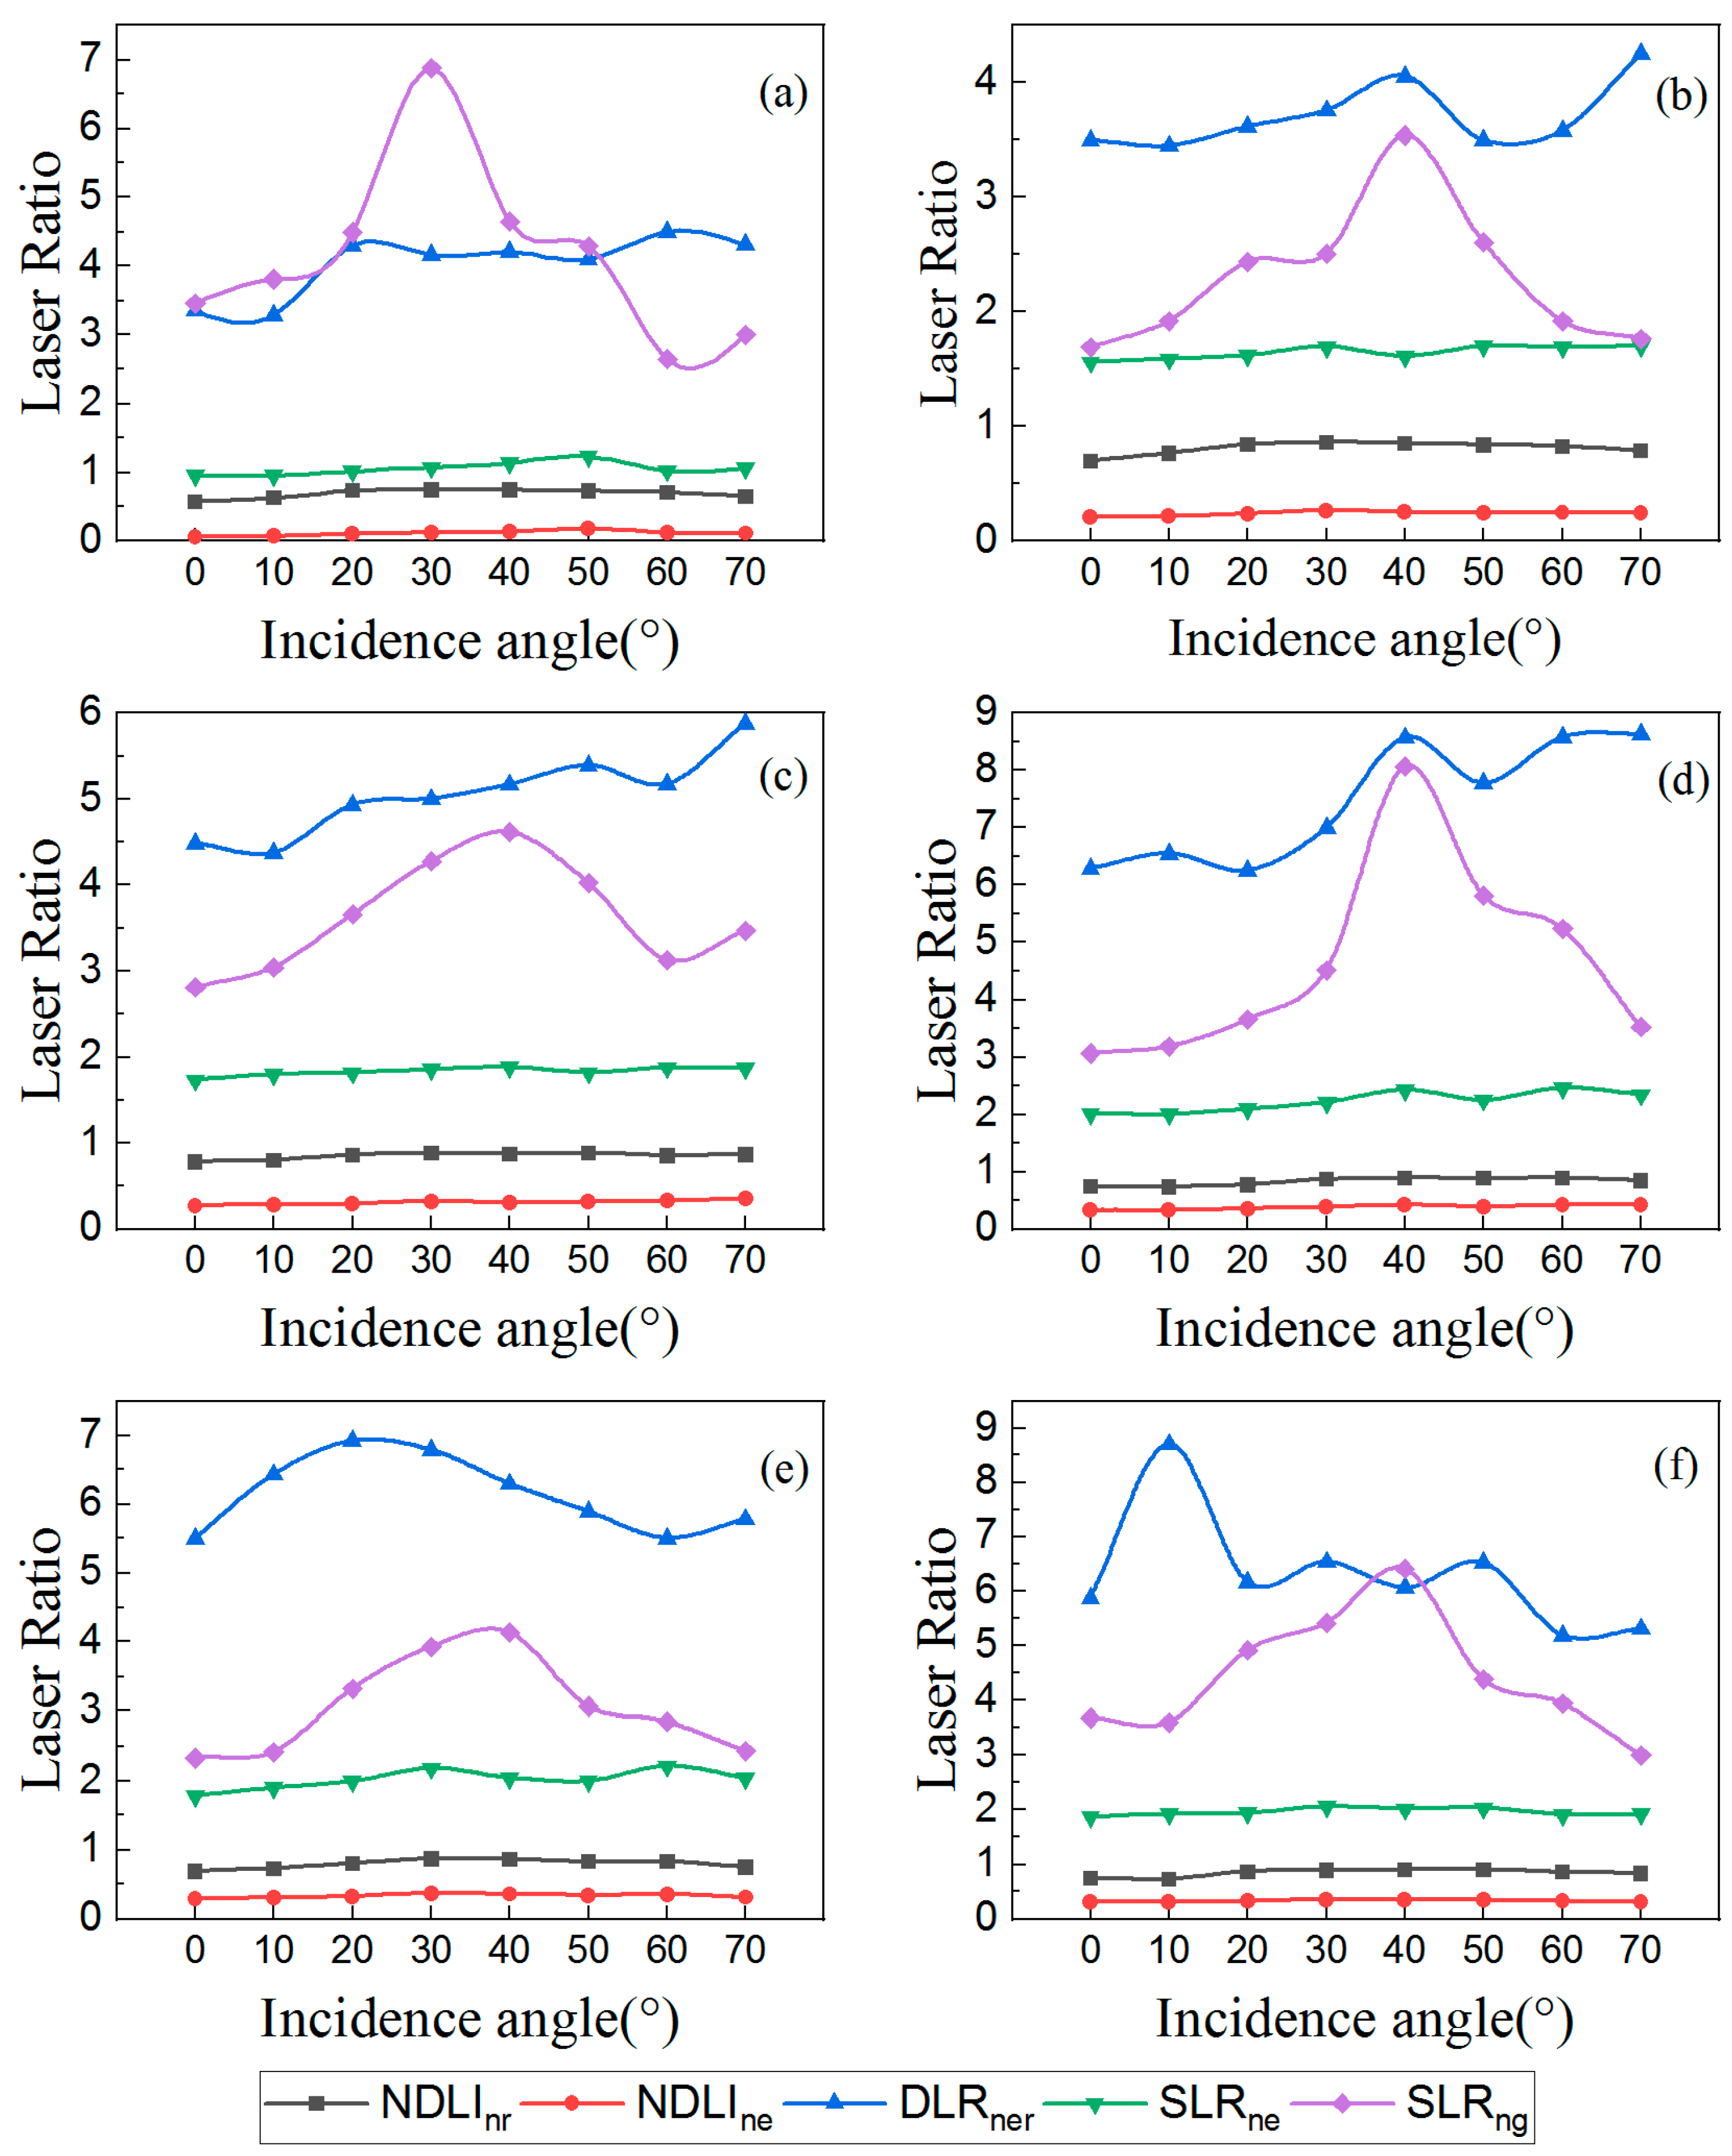
3.1. Incidence Angle Effect
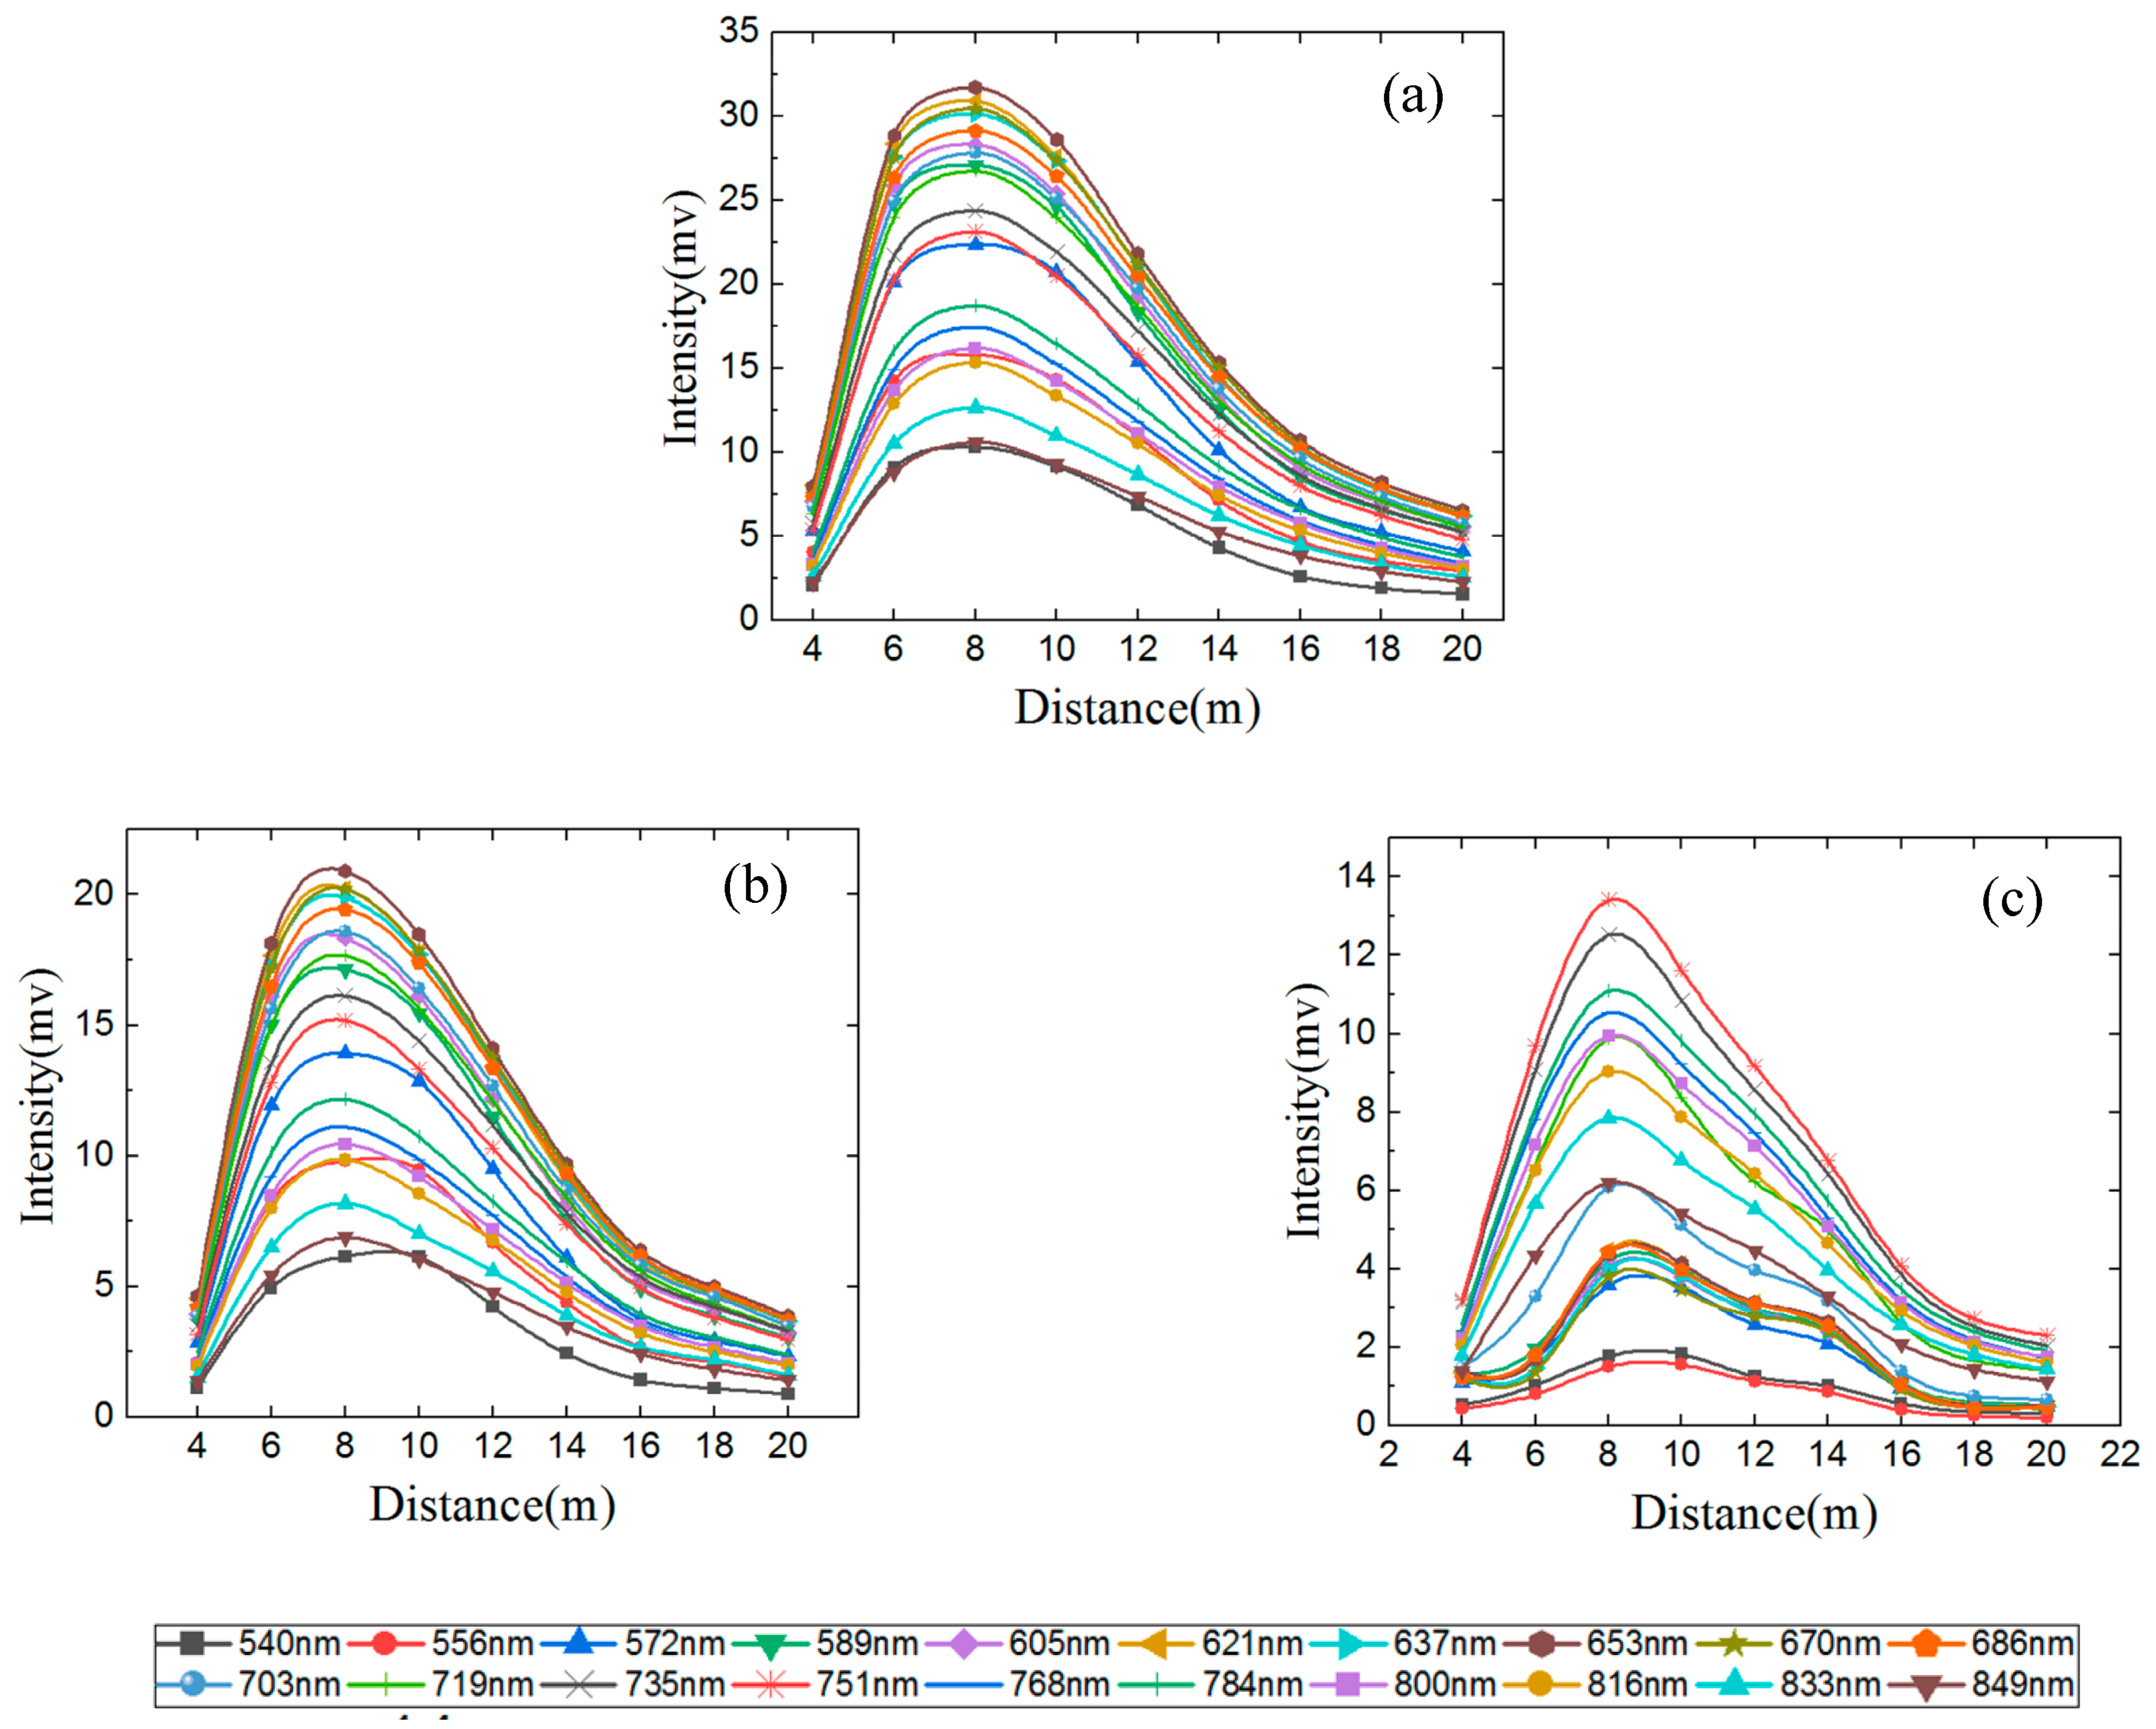
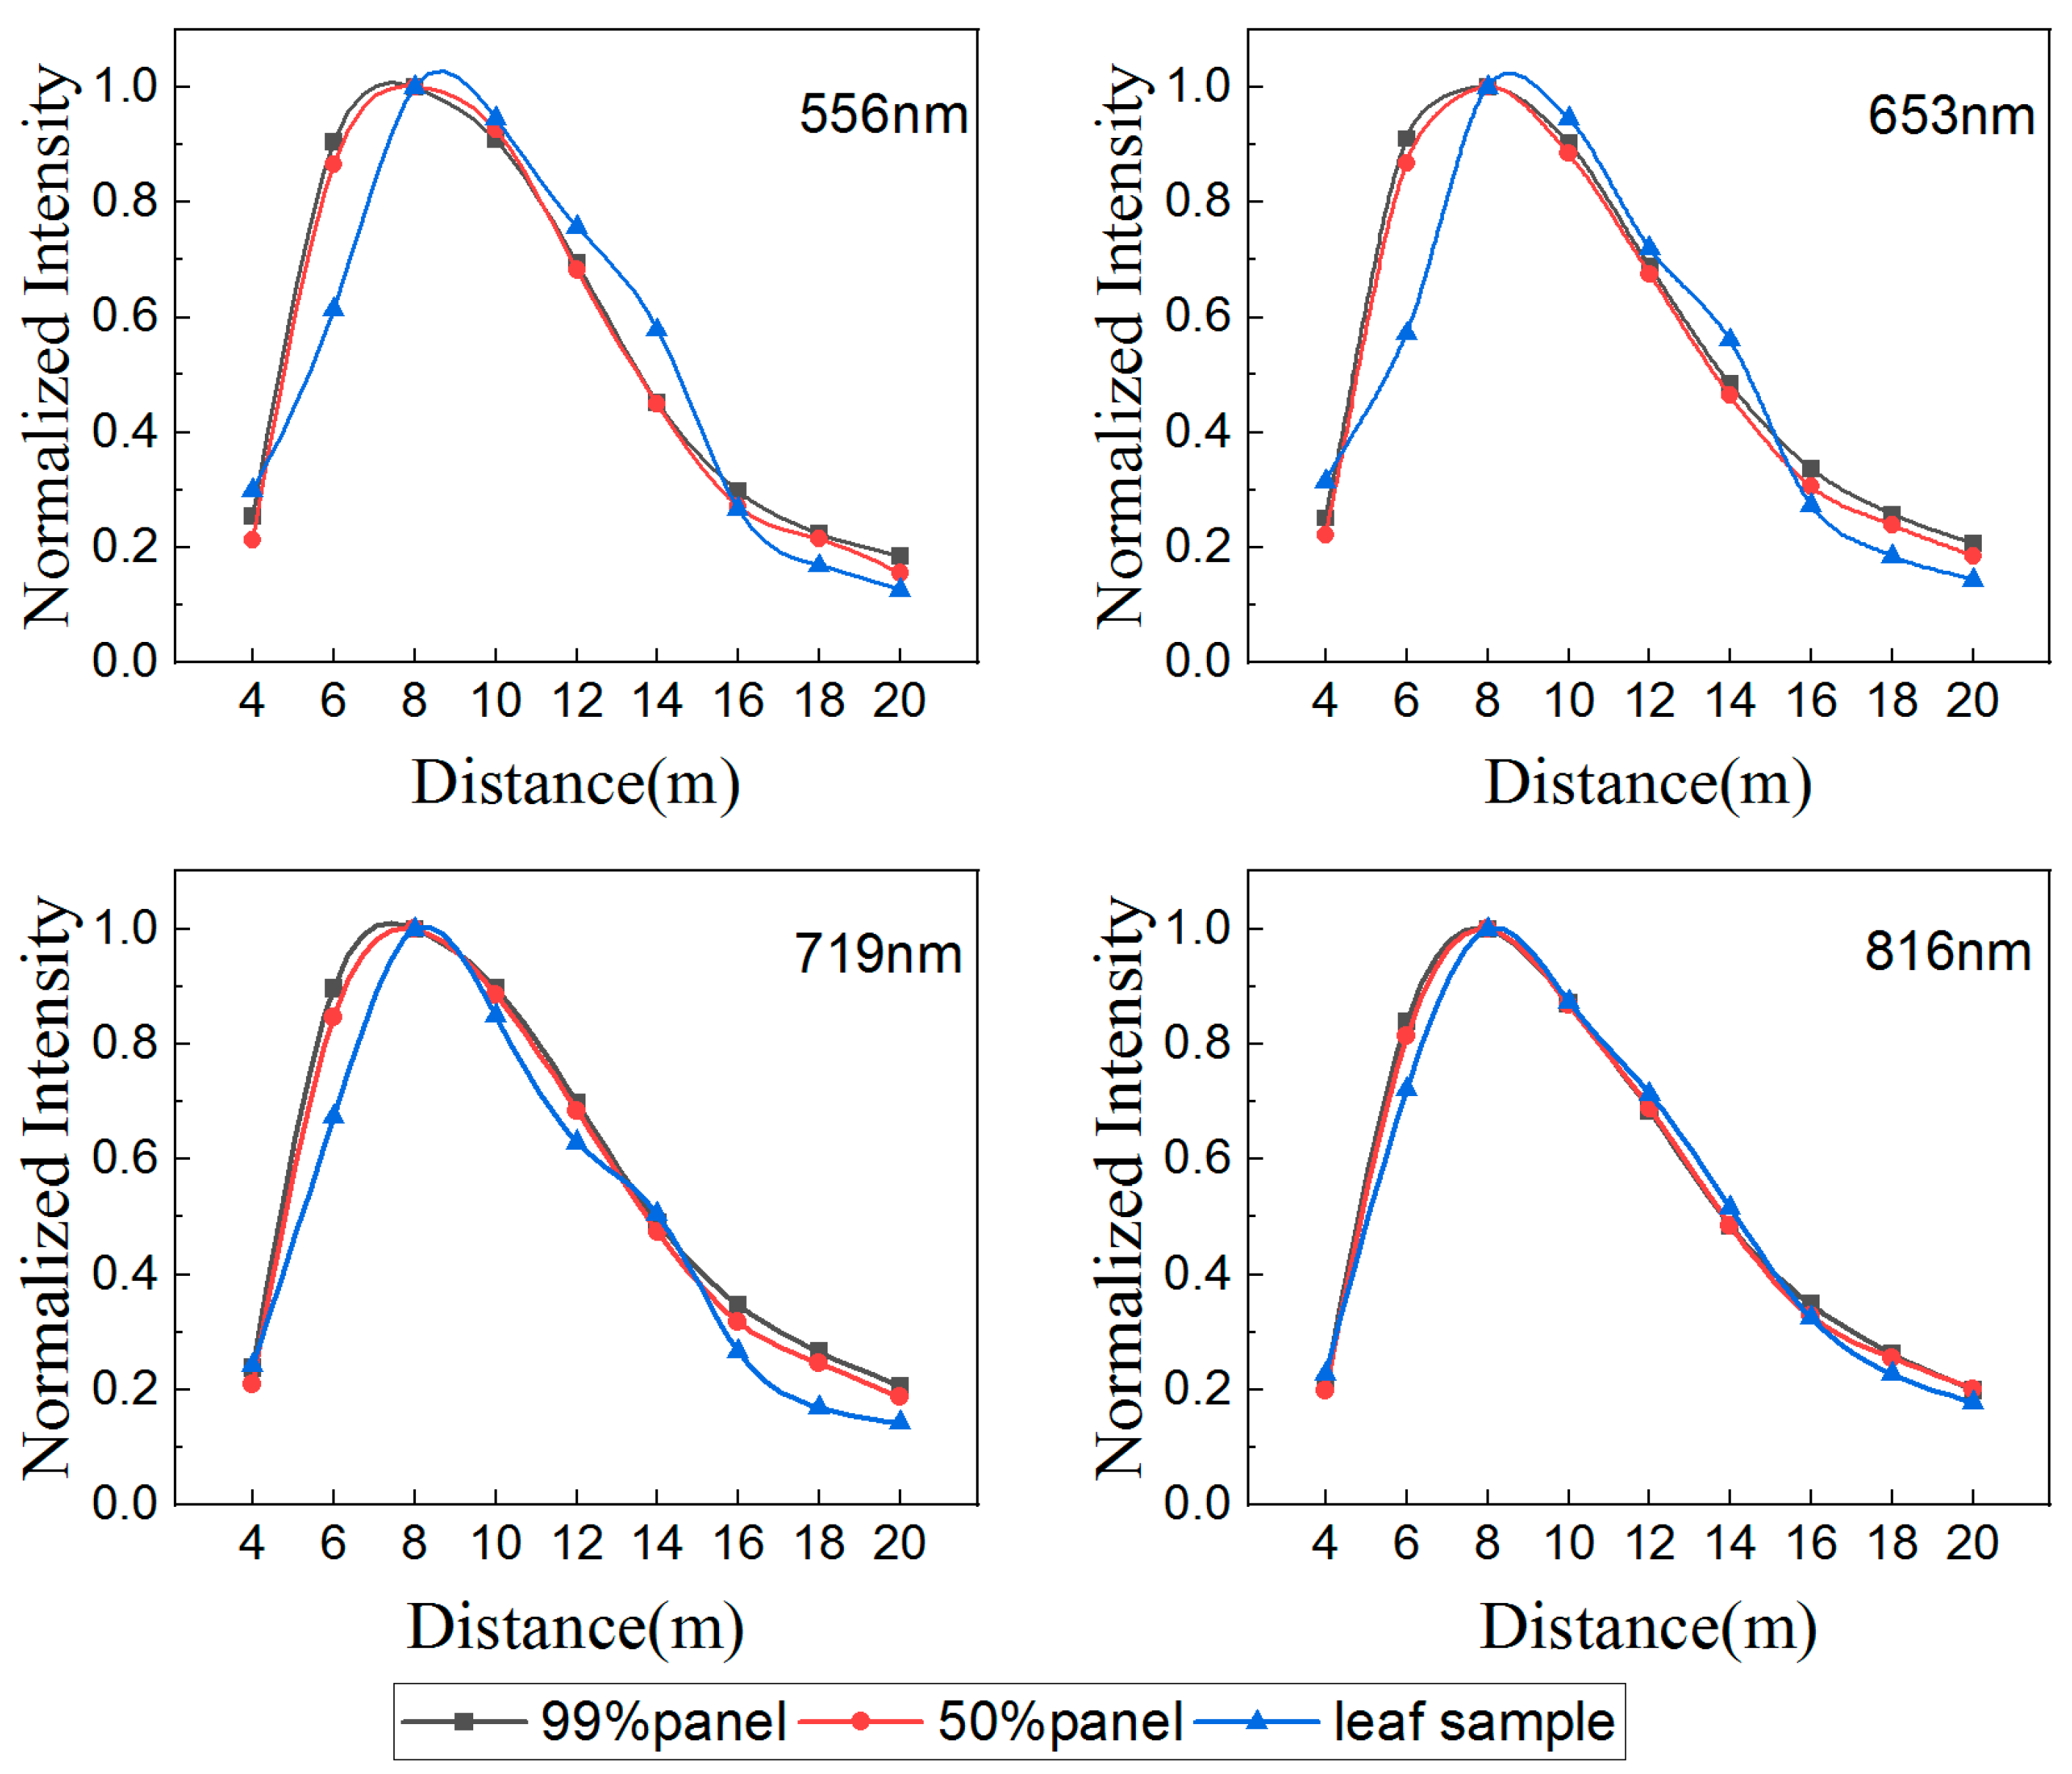
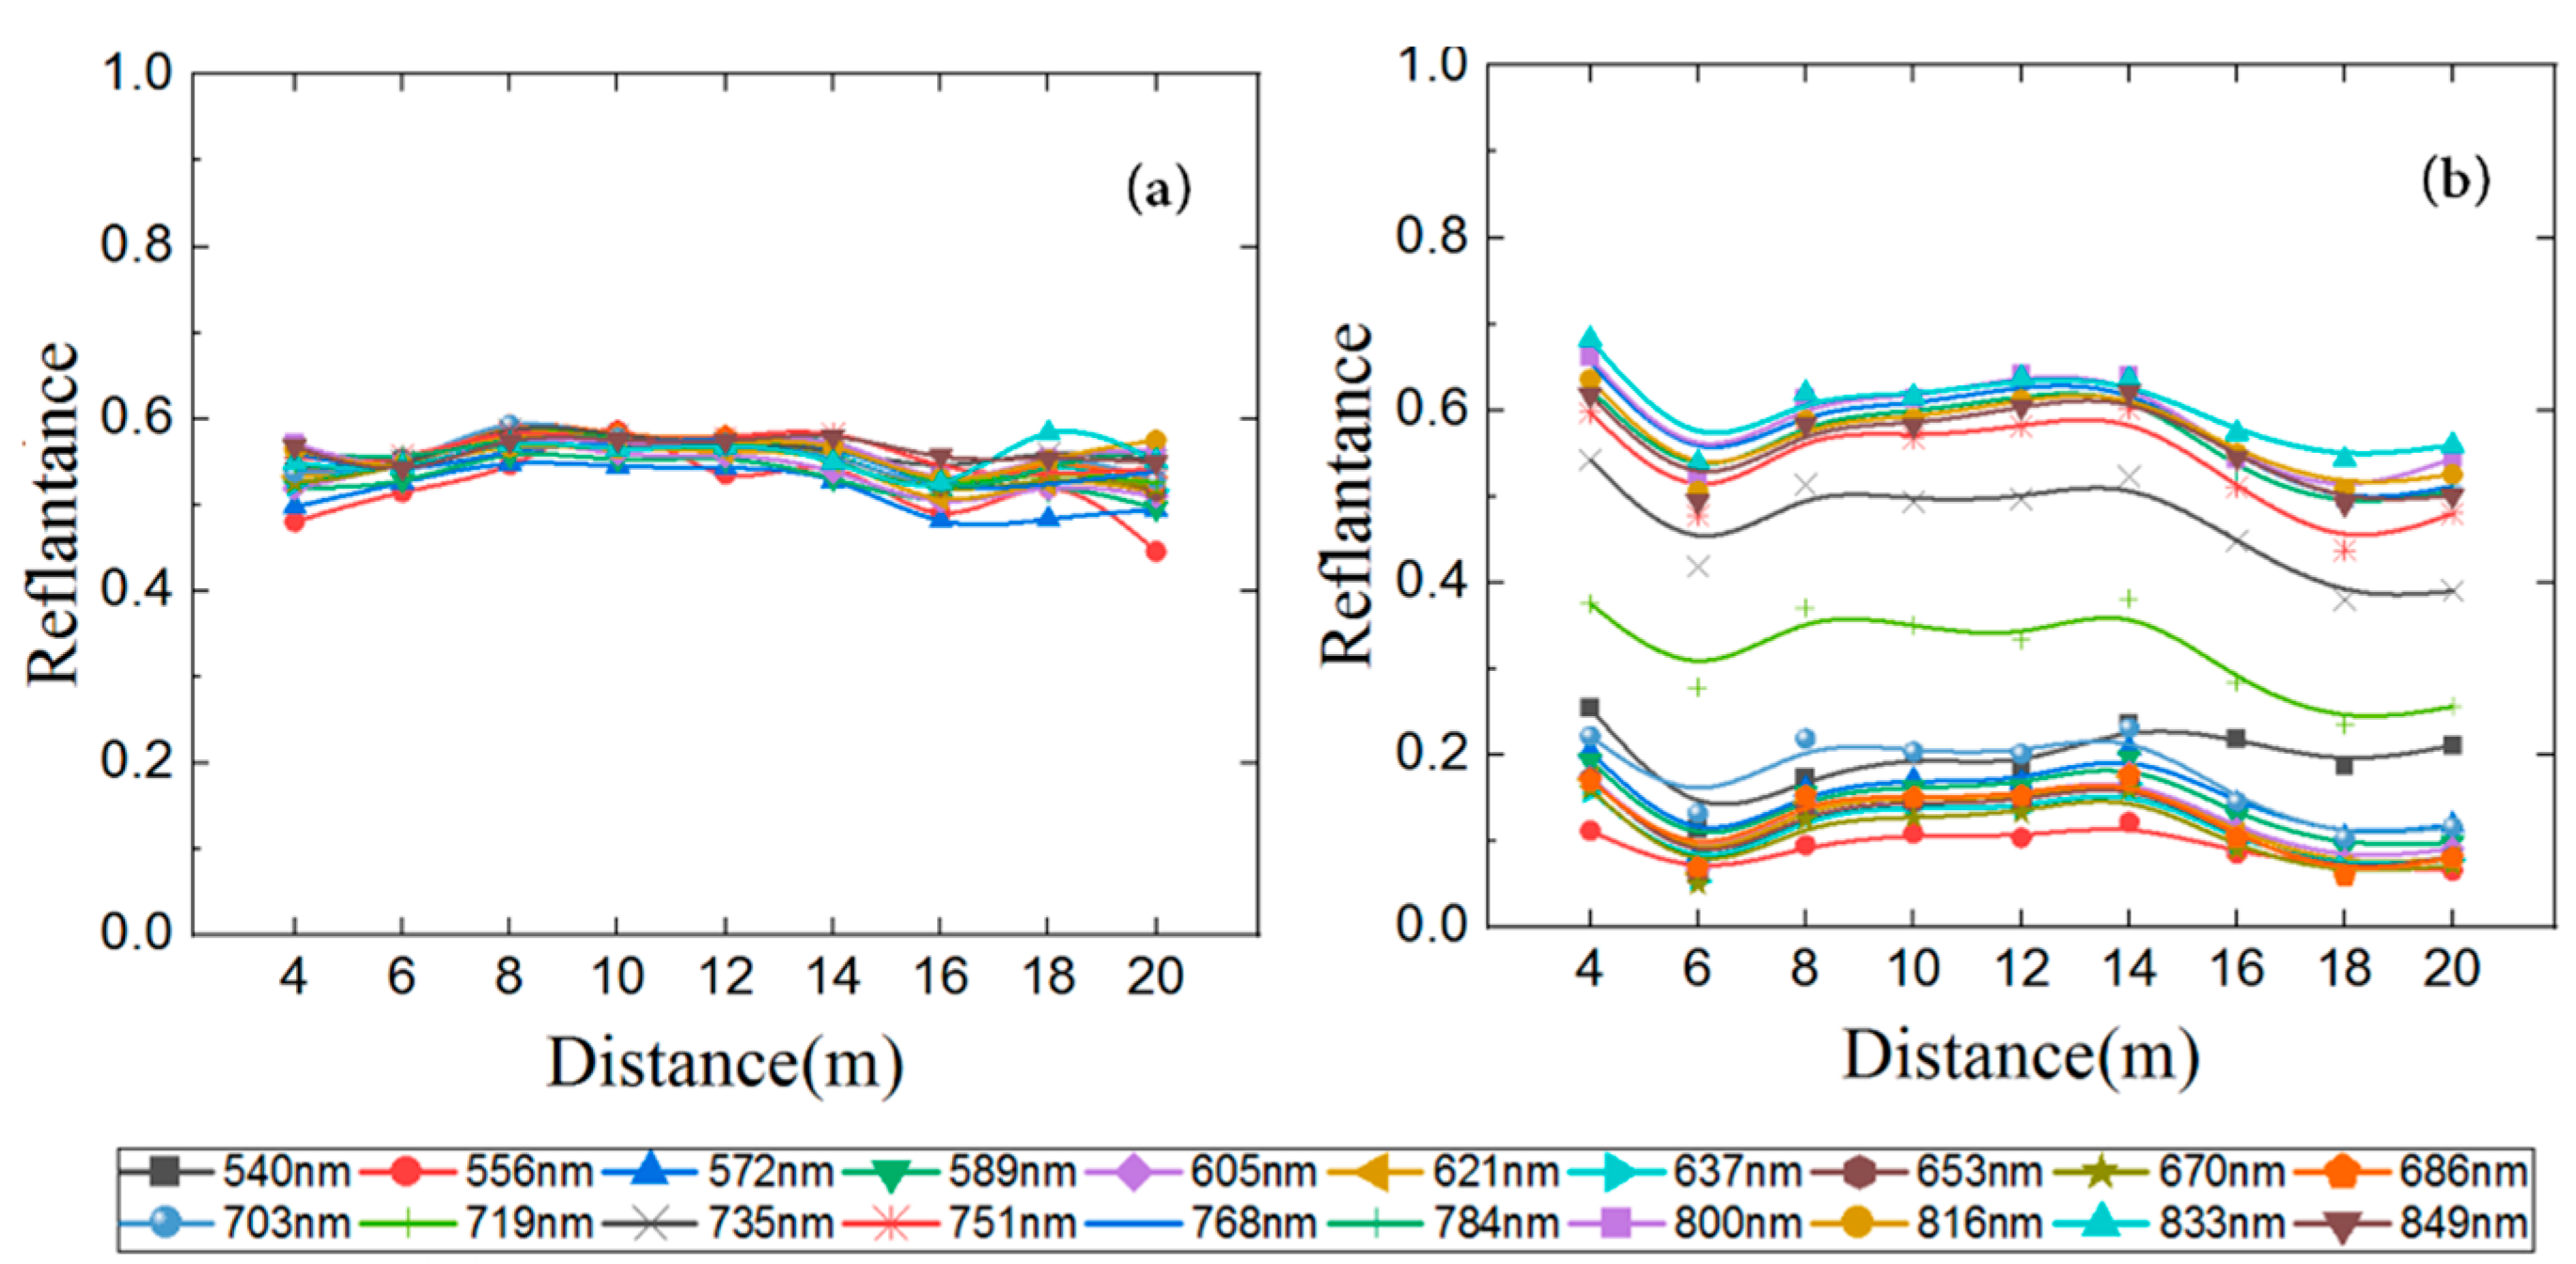
The incidence angle dependency at different wavelengths measured with the HSL for the standard reflectance panel and leaf targets can be seen in Figure 4 and Figure 5. The incidence angle effect is obvious, and the intensity curves of twenty laser wavelengths have similar features. The overall trend presents that the backscatter intensity value decreases as the incidence angle increases for the target at a constant distance. However, we found some discrepancy between the standard panel and leaf targets. The angle dependence of the curve of the leaf targets is not curved as one would expect physically, like that of the standard reflectance panel. This is probably caused by leaf surface characteristics in the measurement such as the more pronounced effect of the surface roughness. Some of the variability might also be explained by sensor noise.
To compare more easily the backscatter intensity versus the incidence angle effect of different targets, the intensity value of each wavelength has been normalized to I (0°) = 1 (Figure 6). The incidence angle dependency of the intensities of all wavelengths is very consistent for the standard reflectance panel with isotropic reflection characteristics. In contrast, the normalized results of the leaf sample indicated that there seems to be wavelength dependency on the incidence angle effect. Besides, we analyzed the relationship between the intensity of each wavelength and incidence angle and observed that the relationship seems to not dissatisfy the Lambert cosine law, in particular for the leaf targets. This means that the targets with isotropically reflecting surfaces tend to be essentially Lambert’s cosine law-dependent with no wavelength dependency on the incidence angle effect.
The incidence angle effect appears to be similar at different wavelengths for different targets, at least with a similar attenuation trend. Therefore, the incidence angle effect on the HSL intensity can be calibrated based on the reference target at the same incidence angle (see Equation (4)). Theoretically, the effect of the incidence angle can be eliminated by multiplying the intensity with the reciprocal of the reference target intensity with the same wavelength and incidence angle at a constant range. The results of the reference target model based on a single wavelength calibration procedure at twenty wavelengths of leaf targets are shown in Figure 7. With the increase in the incidence angle, the value of reflectance shows small fluctuations versus the incidence angle until up to ~60°. When the incidence angle is larger than 60°, the value of reflectance changes obviously and the maximum difference value of reflectance is greater than 20% for the same wavelength. The preliminary results suggest that the incidence angle effect might possibly be eliminated by the reference target-based model approach for small incidence angles.

3.2. Range Effect

The raw intensities of twenty laser wavelengths are strongly influenced by changes in distance (Figure 8). With increasing distance (where the leaf is perpendicular to the laser beam at 0°), the raw intensities increase first and then decrease. We can see that the intensity at each laser wavelength of the measured targets increases more rapidly at a distance from 4 to 8 m and then decreases less rapidly greater than that. When the measured range is shorter than around 8 m, the instrumental properties, such as the near-distance reducer or the refractor telescope’s defocusing effect, have a significant influence on the raw intensities, and this makes the intensities disaccord with the radar range equation. In the case such as in Figure 8c, the range dependence of the curve of the leaf sample is not curved as one would expect physically, like that of the standard reflectance panels. This is mainly caused by the attenuation of the signal to noise ratio due to the absorption of the leaf in the red and green wavelengths.
To compare more easily the intensity versus the range behavior of different targets, the intensity value of each wavelength has been normalized to 1 at 8 m (Figure 9). The range dependency of intensities appears to be similar at the same wavelength for different targets, so it is possible to calibrate the effect on the hyperspectral LiDAR intensity with the reference target at the same distance according to Equation (4). The calibrated results are shown in Figure 10. We observed that with the increase in the distance, the value of reflectance of all laser wavelengths for the 50% standard reflectance panel showed small fluctuations compared with the distance. This result indicated the effectiveness of the reference target-based calibration method based on a single wavelength in calibrating the range effect for the targets with isotropically reflecting surfaces. However, the value of reflectance of all laser wavelengths for the leaf target only showed great agreement with distance between 8 and 14 m. As discussed above, some of the reflectance variability between measurements might have been caused by near-distance reducers. In addition, considering the influence of scanning geometry on the signal to noise ratio, the signal noise increased with increasing distances.

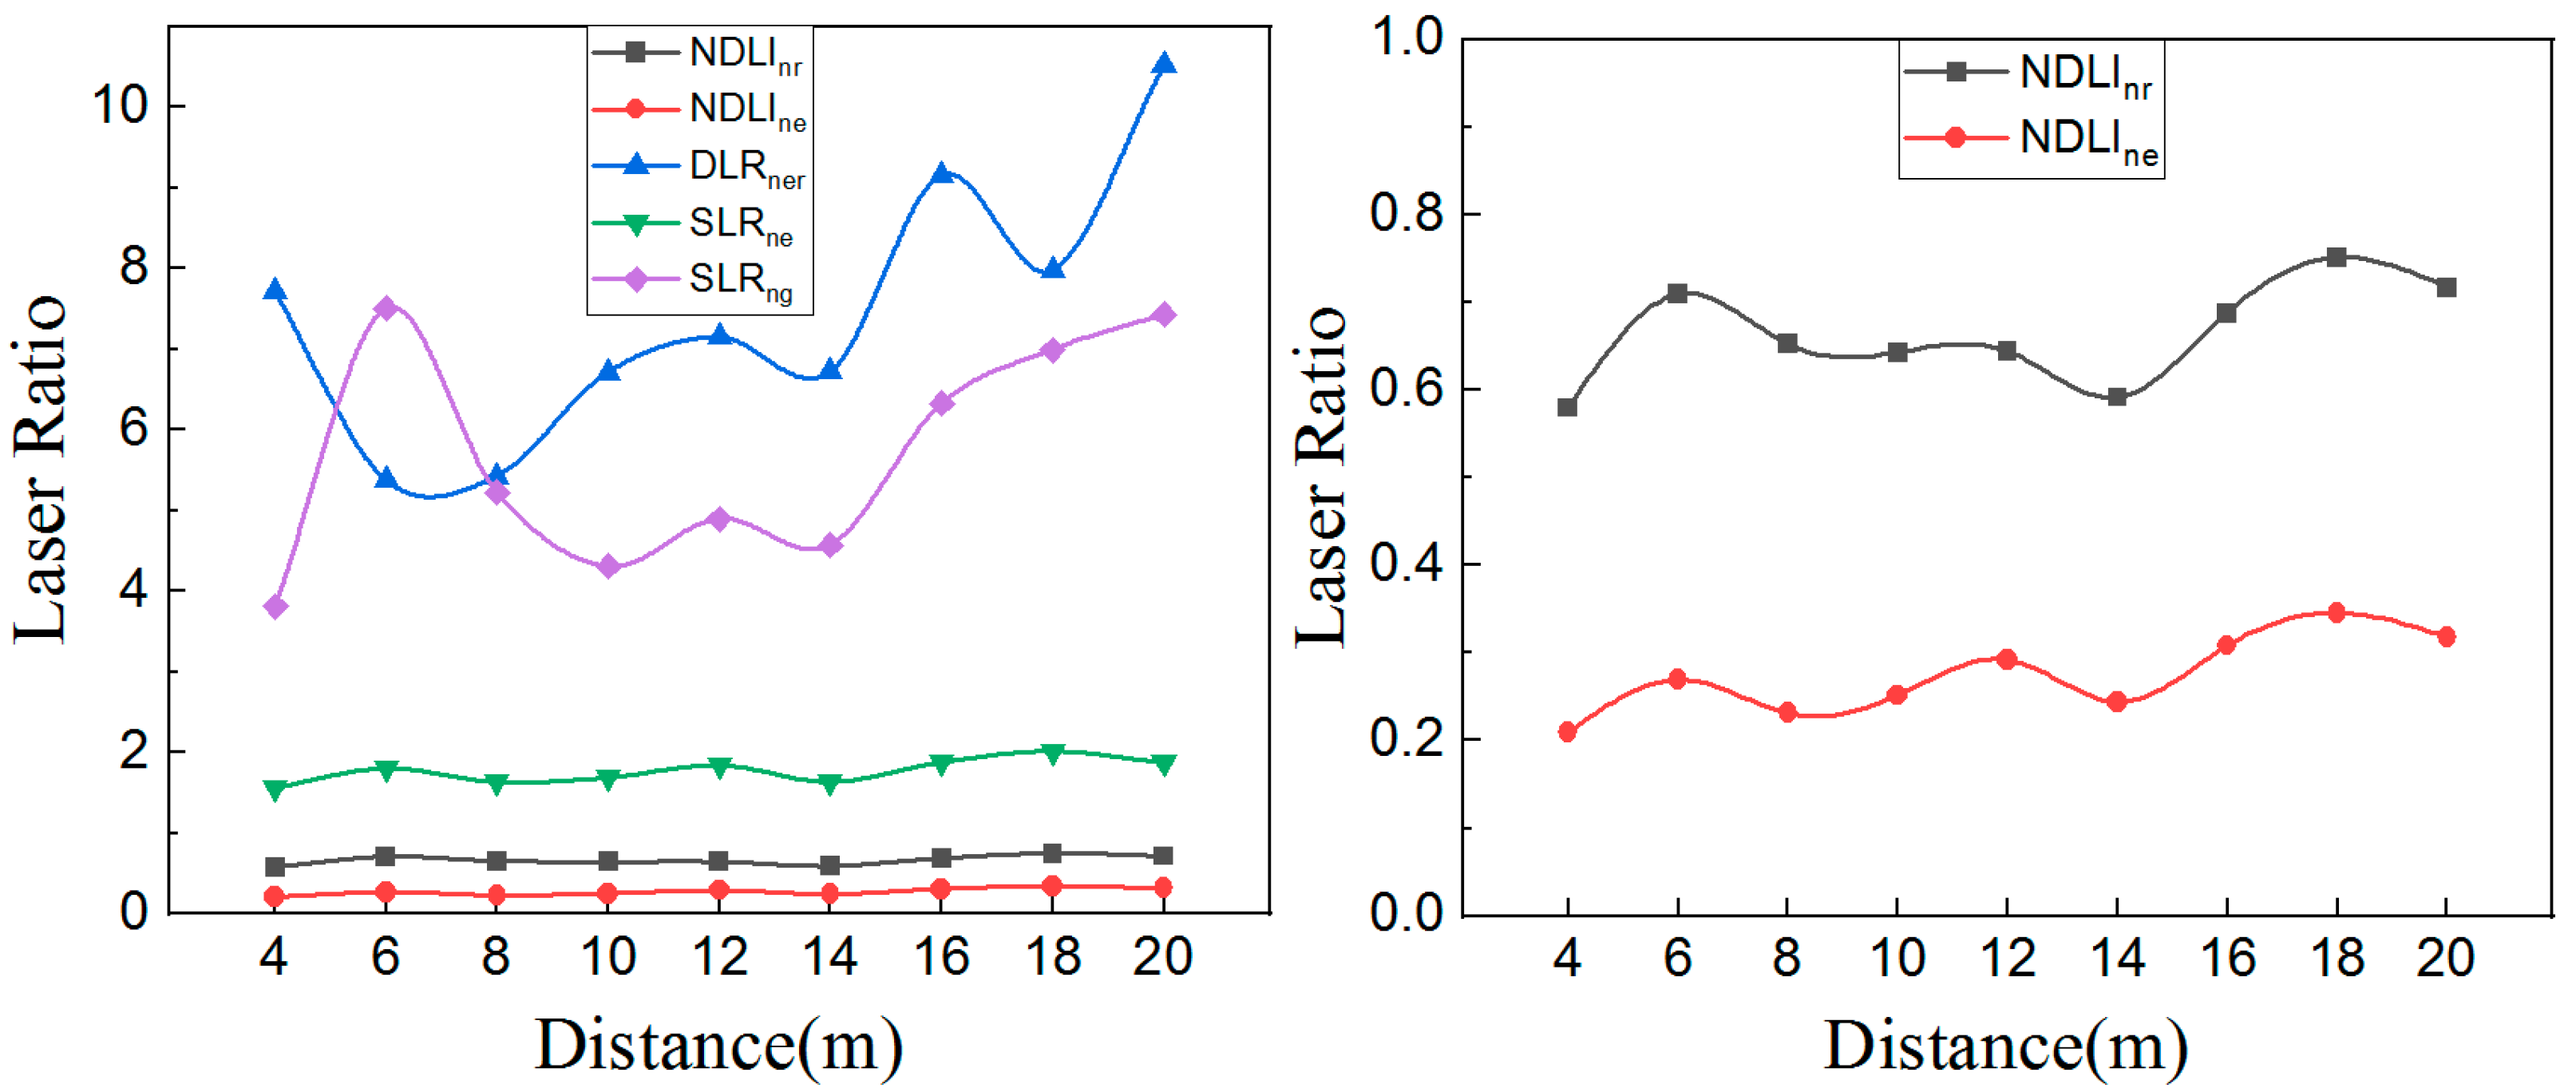
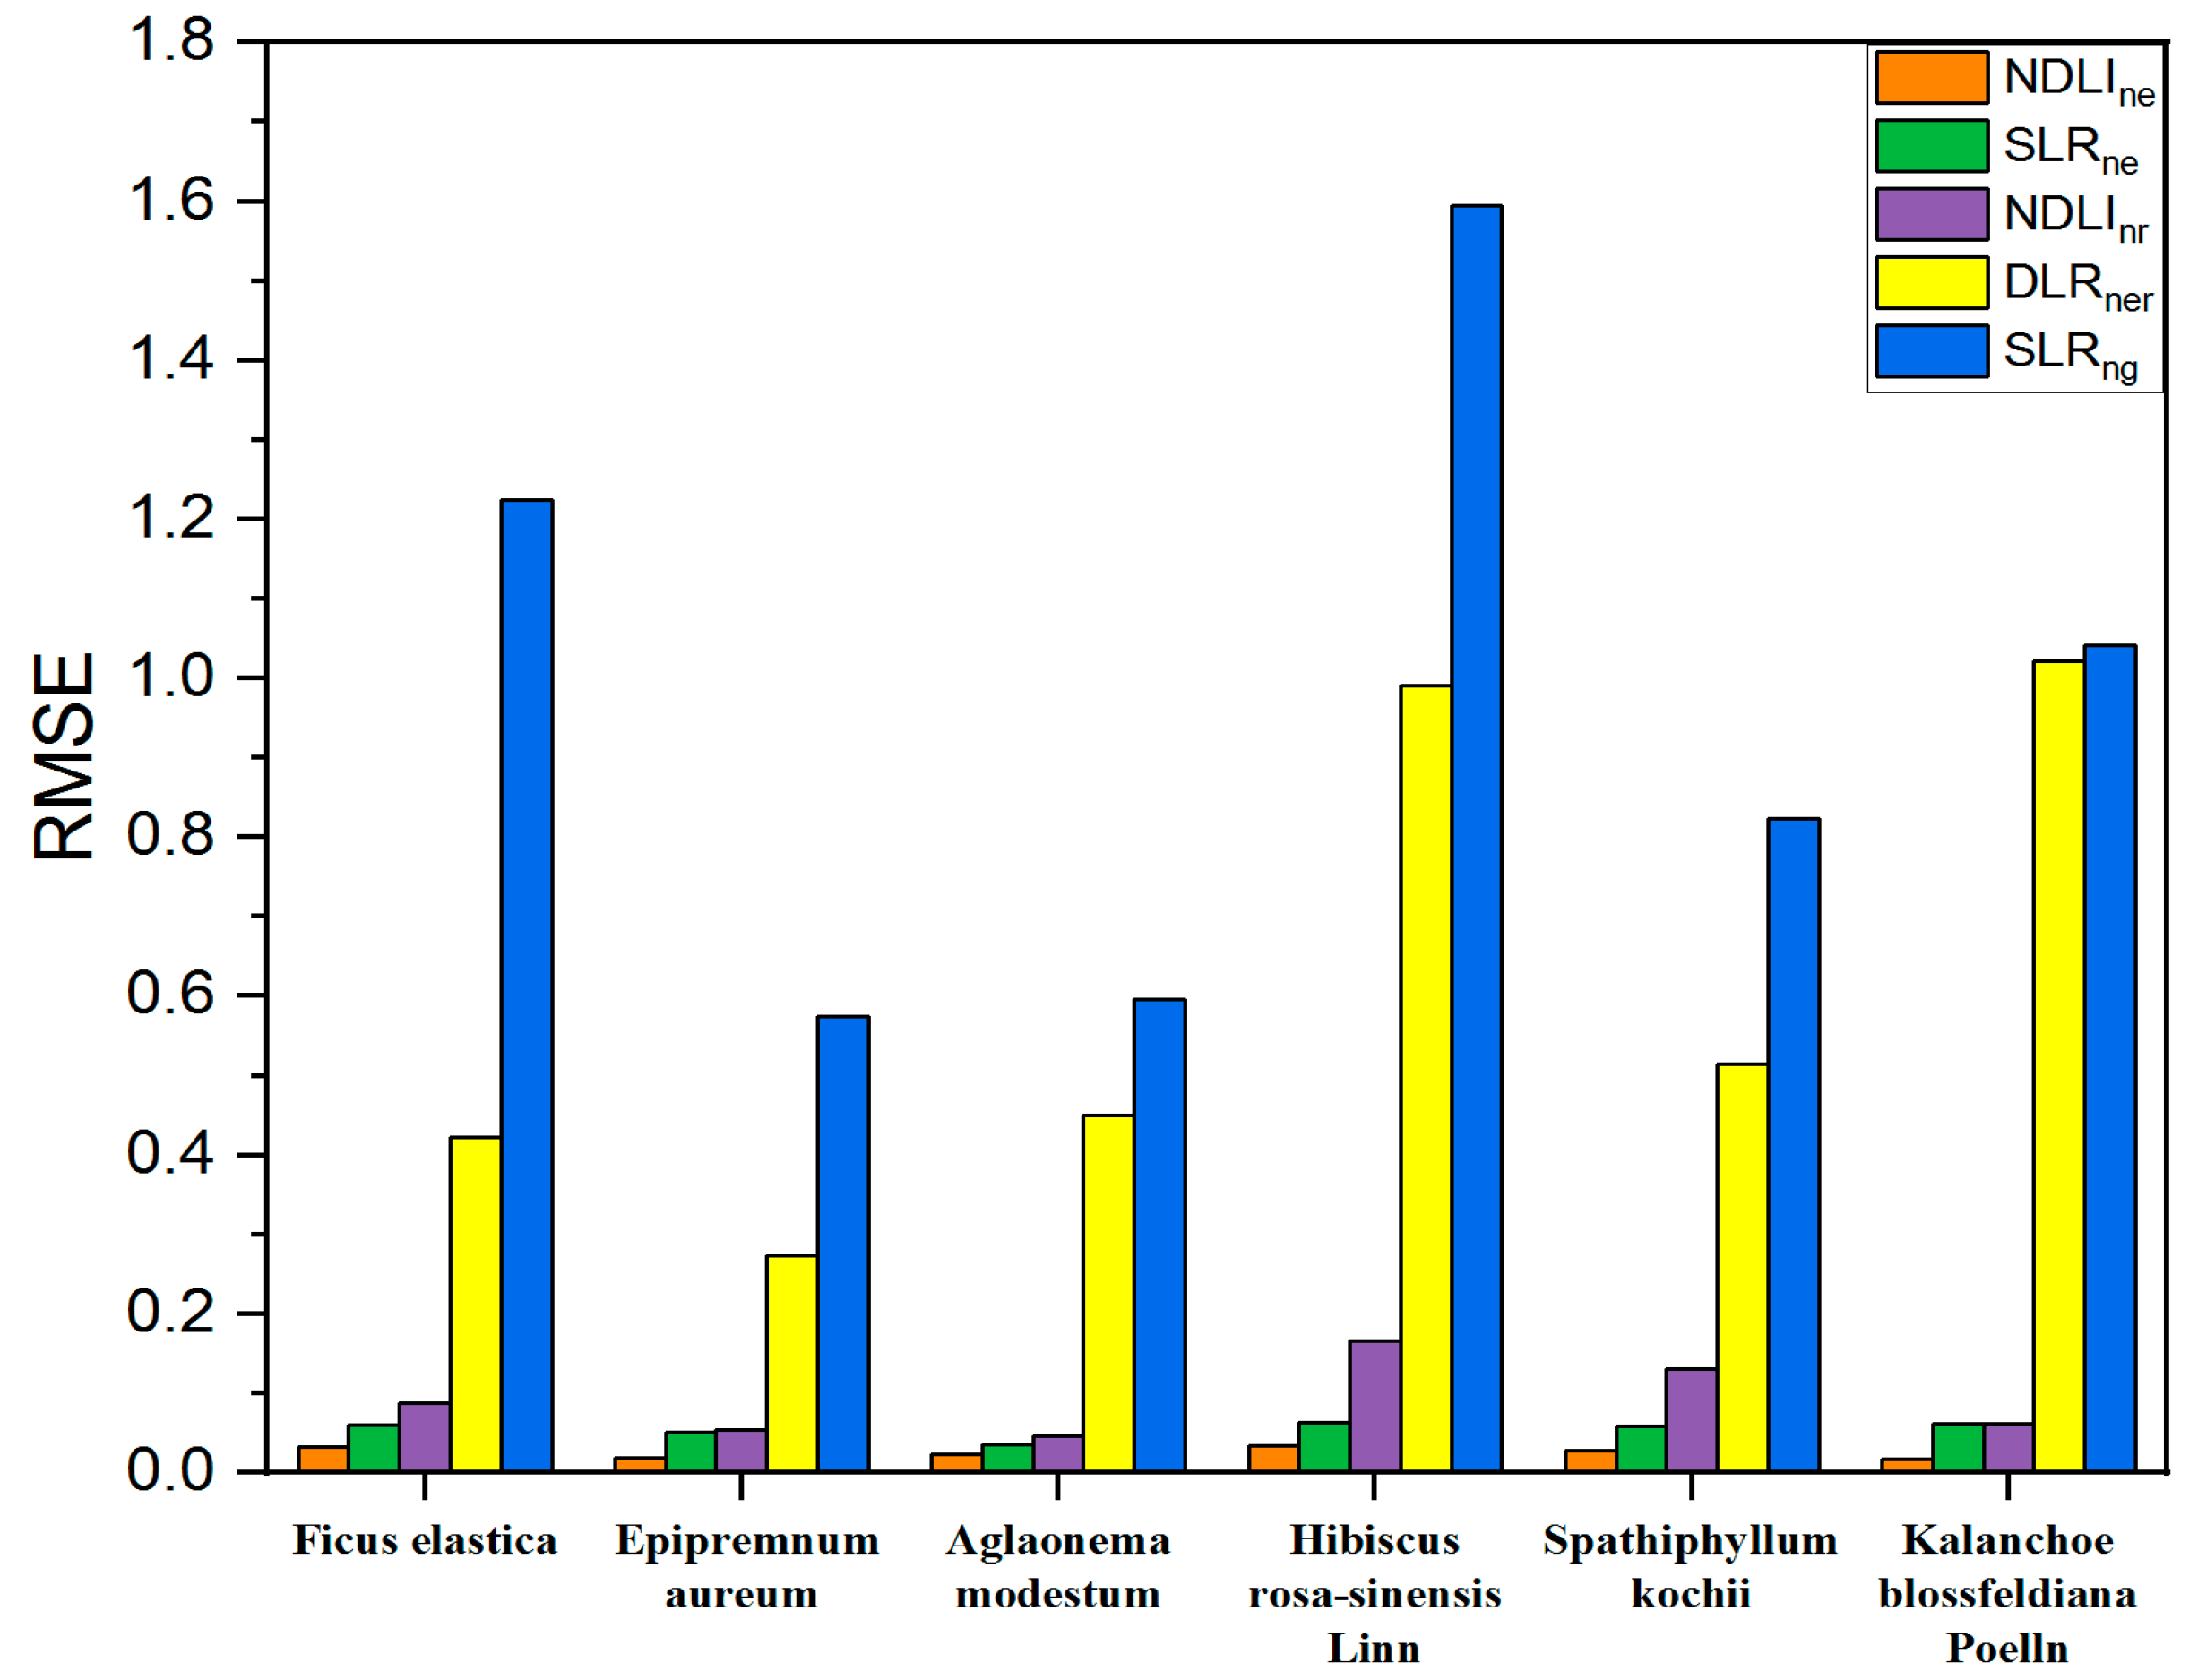
3.3. Laser Ratio Correction

The incidence angle and range behavior demonstrated similar effects on the backscatter intensities of different wavelengths (Figure 5 and Figure 8). Thus, HSL can correct these effects with laser ratio-associated backscatter intensities at multiple wavelengths. The laser ratio is calculated using laser backscatter intensity values at two or three wavelengths in near-infrared and visible, i.e., both sides of the spectral red edge. In this section, we used several empirical vegetation indices that are ratio-related which were selected for incidence angle and range effect correction on the backscatter intensity.
The results showed that not all selected laser ratios can be used for backscatter intensity correction (Figure 11 and Figure 12). The values of the laser ratio index of the green and near-infrared laser wavelengths (SLRng) and the value of the laser ratio index of three wavelengths (DLRner) showed obvious fluctuations compared with the incidence angle and distance, which means the laser ratios cannot be applied to cancel the incidence angle and range effects on the HSL backscatter intensity. In contrast, with the increase in the incidence angle and distance, the values of the laser ratio index of red-edge and near-infrared laser wavelengths (SLRne) and normalized difference laser index (e.g., NDLInr and NDLIne) have good consistency over the incidence angle and distance. These results revealed the effectiveness of the HSL calibration procedure based on the normalized difference laser index and the sample ratio index of red-edge and near-infrared laser wavelengths in calibrating the incidence angle and range effects. This would simplify the calibration of HSL vegetation intensity data.
To evaluate the performance of the laser ratio indices, the differences between the correction results based on different laser ratio indices were quantified using the root mean squared error (RMSE). The RMSE details the standard deviation of the residuals between the estimated and predicted values. The residuals are the approximation of how far away from the regression line data points (predicted values) are. In the experiment, the average value of each laser ratio index at various incidence angles and distances was chosen as the predicted values (as regression line points). A comparison of the RMSE of the six laser ratio indices is shown in Figure 13. The results show that the RMSE of NDLRne was the lowest, followed by SLRne and NDLInr. Both DLRner and SLRng had larger RMSEs.

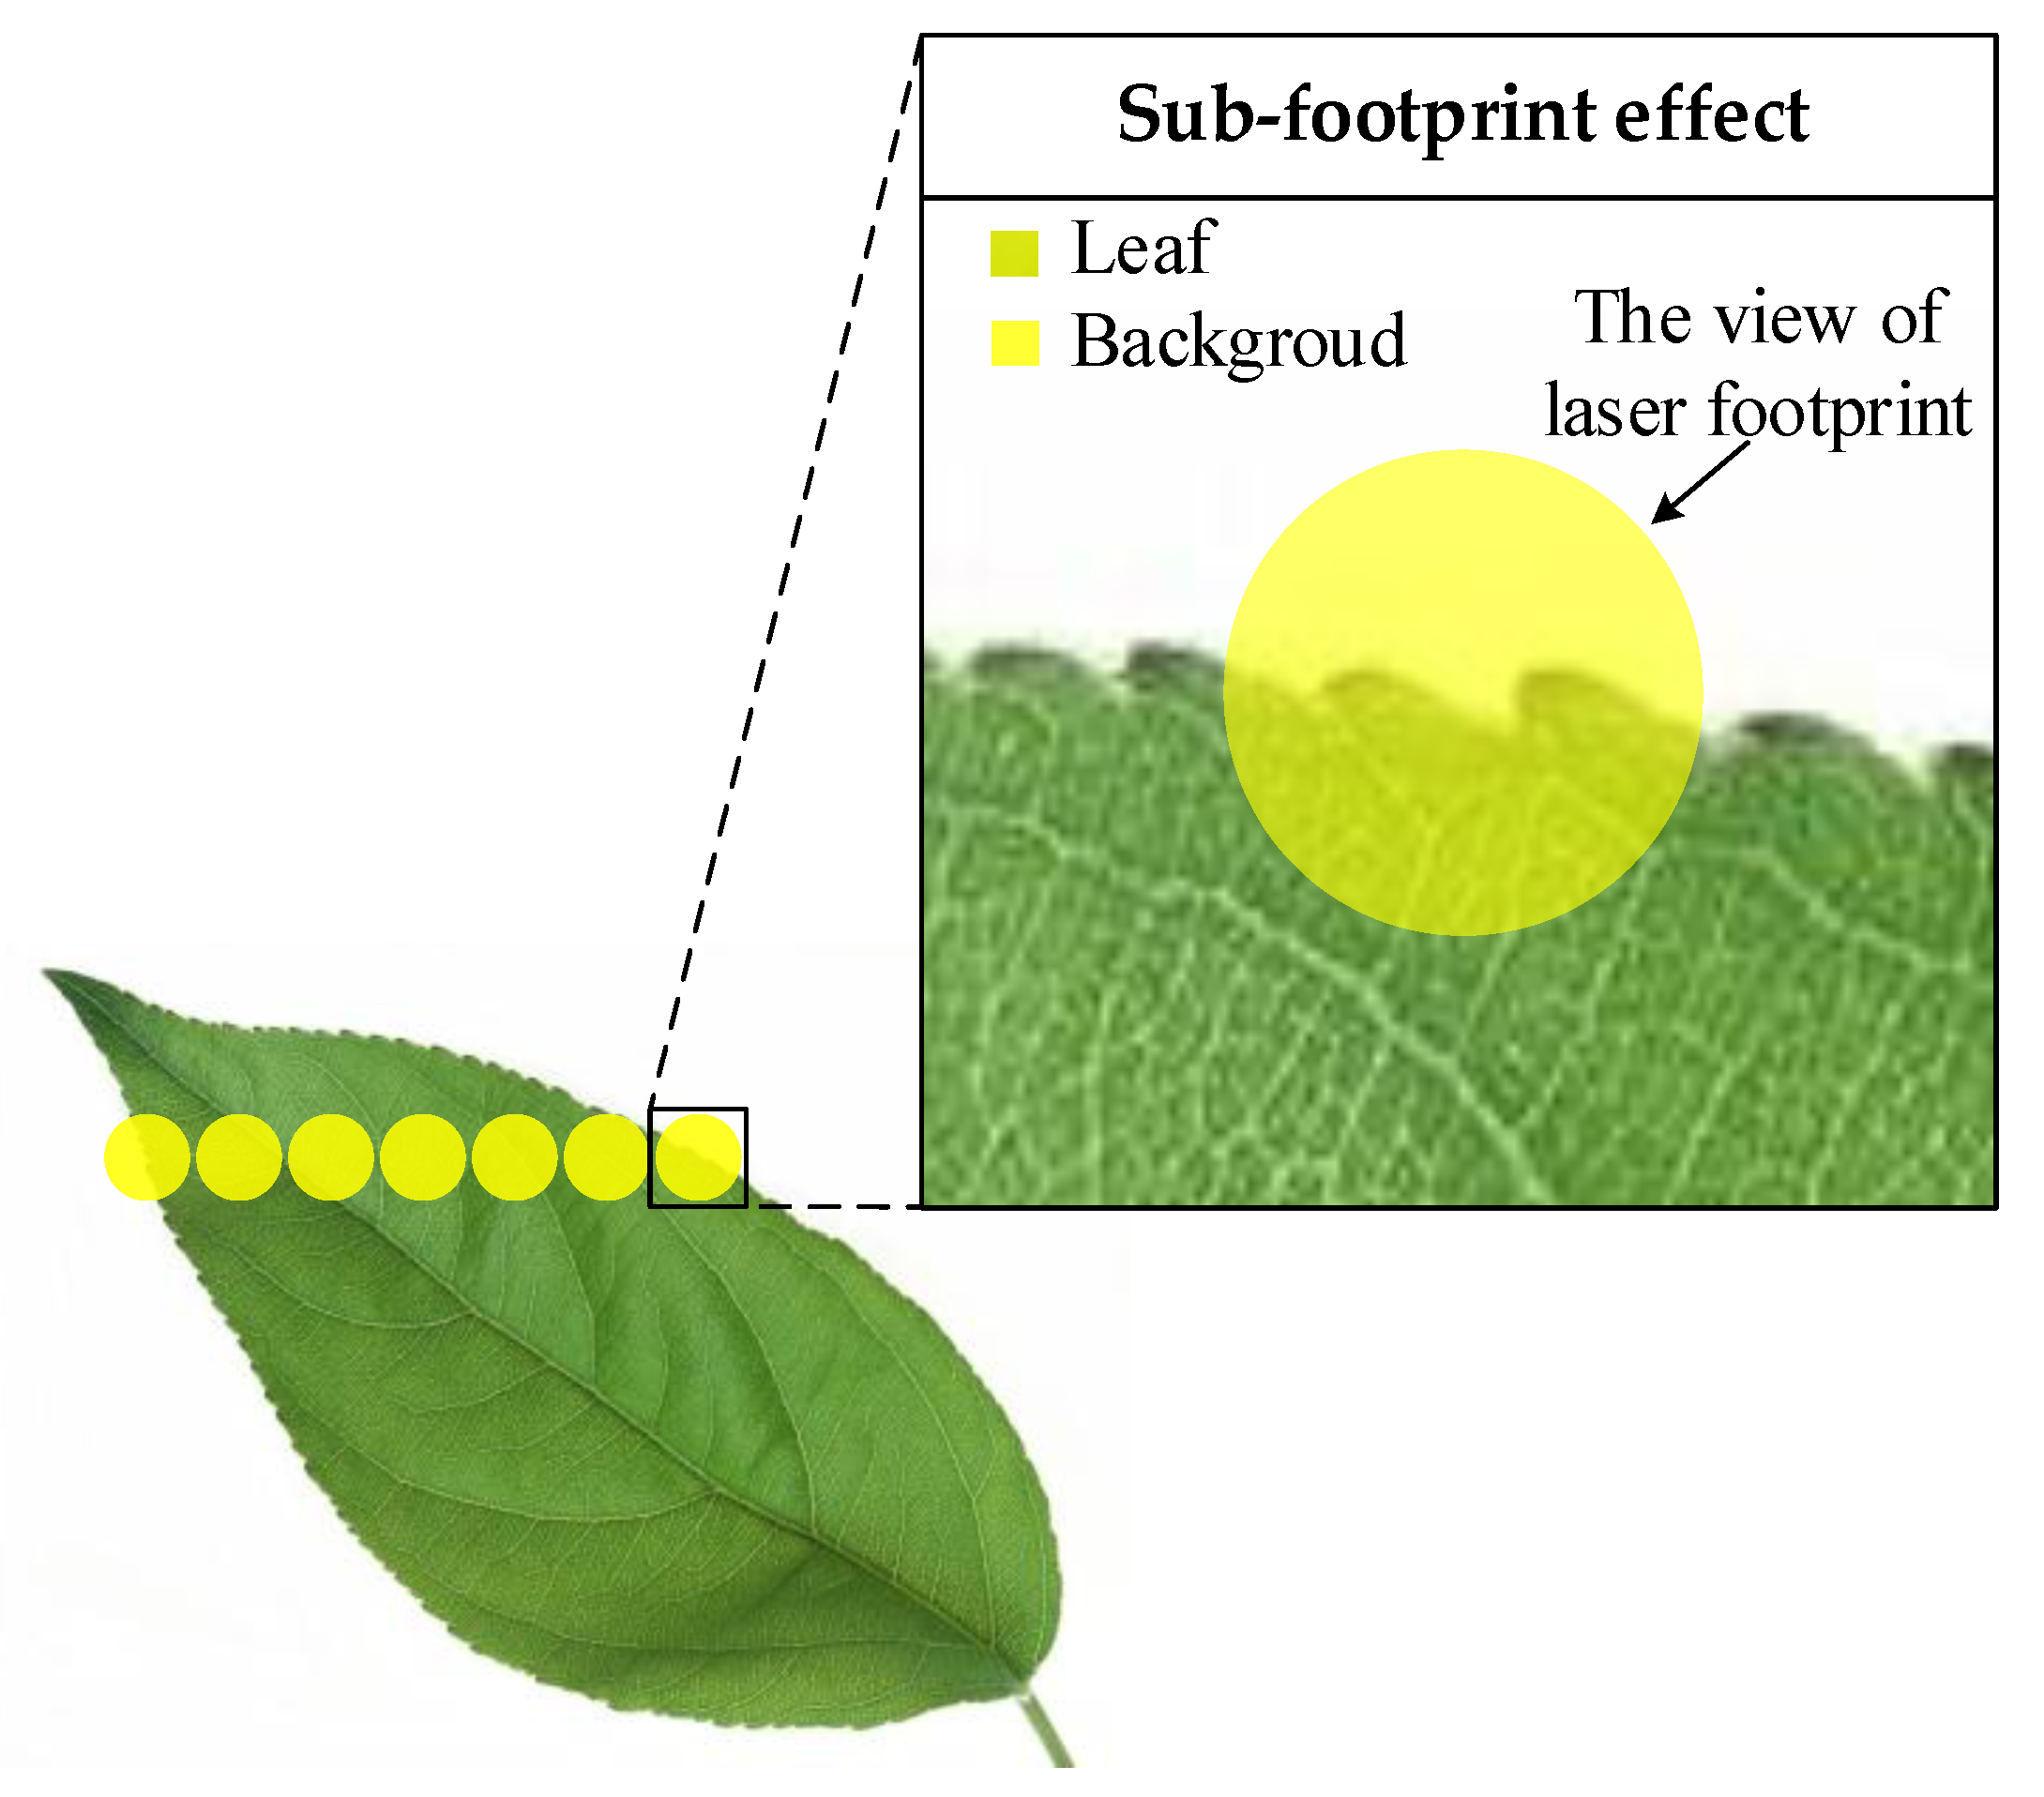
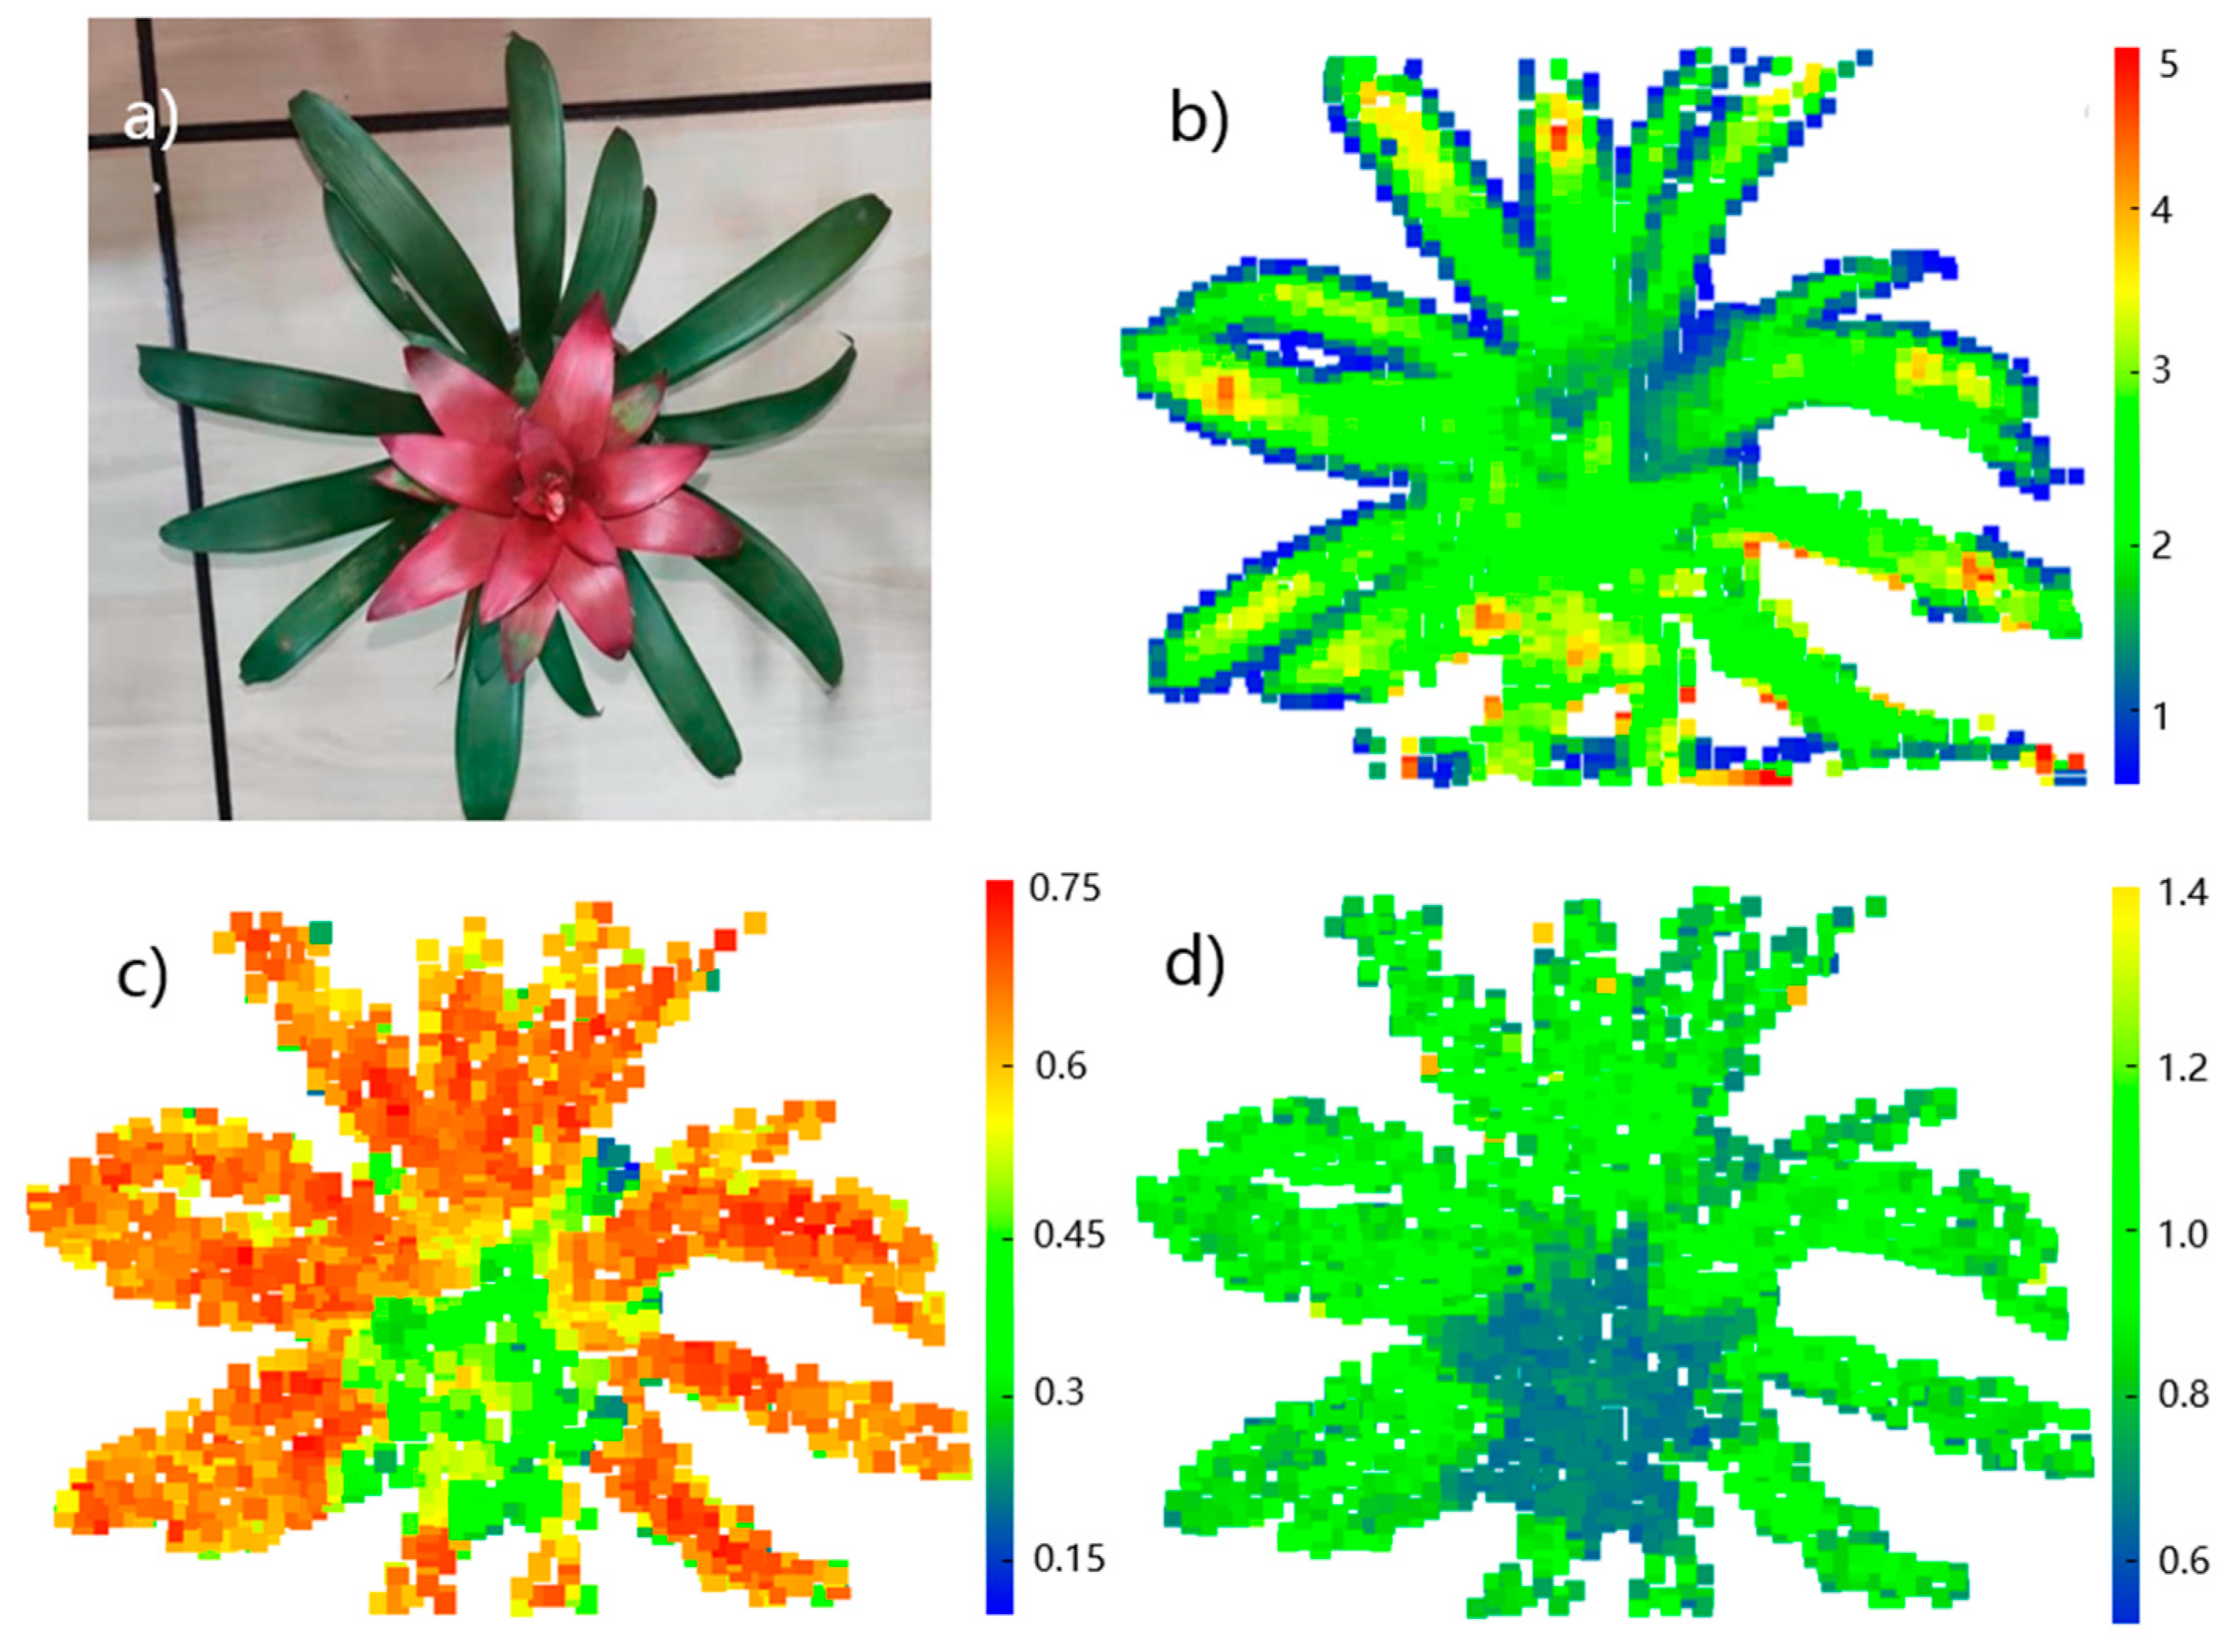
3.4. Sub-Footprint Effect

The visualization of the backscattered laser intensity of a Kniphofia in Figure 14 demonstrates the differences in backscatter intensity in the 3D plant structure. On the leaf edge, multiple returns are more likely to occur, because a laser beam could be split and form multiple laser footprints so that the energy of the laser return is shared by multiple objects. The backscatter intensity on the leaf edge is therefore attenuated, resulting in an inaccurate estimation of the biochemical content. In Figure 14b, we observed that the backscatter intensity of the leaf edge is much lower than that of the leaves, suggesting that the leaf backscatter intensity with sub-footprints needs to be considered as a factor for backscatter intensity correction.
Correcting the sub-footprint effect on the laser backscatter intensity improved the difference in the backscatter intensity on leaves’ edges (Figure 14c,d). We used the normalized difference laser index (NDLInr) and the sample laser ratio at red-edge and near-infrared laser wavelengths (SLRne) to correct the sub-footprint effect on the laser backscatter intensity. The two laser indices are insensitive to the sub-footprint effect since the effect is partially eliminated when the backscatter intensity of both wavelengths is similarly influenced by the scanning geometry. There appeared to be a statistically significant difference between the leaf returns and leaf edge returns in the red-edge laser wavelength. The difference also exists in the near-infrared laser wavelength. In Figure 15, the spectral separability of the red-edge and near-infrared laser intensity values measured from the green leaf and leaf edge returns can be explained by the strong return energy attenuation caused by the sub-footprint effect. Our results suggested that the sub-footprint effect can be improved by calculating laser ratio indices that employ the NDLInr or SLRne.

4. Discussion

With the development of hyperspectral LiDAR, new HSL radiometric calibration technology is required for exploiting the potential of backscatter intensities at multiple wavelengths in the field of remote sensing application [6,7,8,9,10]. The spectral laser light of the HSL could penetrate canopies through small gaps and provide a range-versus-spectrum profile of the vegetation involving incidence angle, range and sub-footprint effects. More accurate and detailed spatial distributions of biophysical and biochemical information can be revealed from calibrated backscatter intensity data [12,13,14,15]. Backscatter intensity calibration of HSL is essential in detecting the characteristics of scanned targets.
In this study, the incidence angle, range and sub-footprint effects on the HSL backscatter intensity are further analyzed and two correction schemes are introduced. The laser ratio indices based on HSL are used to test its potential for incidence angle, range and sub-footprint effects correction on the HSL backscatter intensity, while the reference target-based model is used as a baseline to compare the results.
The relationship between the backscatter intensity of the HSL and the incident angle and range is explored. The incidence angle and range experiments’ results, carried out with different targets, demonstrated that the backscatter intensity recorded by the HSL (Figure 6 and Figure 9) cannot follow the theoretical model, including the Lambertian model and the 1/R2 relation model, which is consistent with some previous studies [27,46,47]. The laser backscatter intensities of targets with isotropically reflecting reflectance surfaces share a similar trend in the incidence angle and distance behavior and there seems to be no wavelength dependency on the scanning geometry effect. In contrast to the standard reflectance panel, the laser backscatter intensity of the leaf targets appears to be wavelength-dependent on these effects. The laser backscatter intensity of the leaf targets changed with the incidence angle, distance and wavelength. This can be explained by leaf surface characteristics in the measurement such as the more pronounced effect of the surface roughness and the attenuation of the signal to noise ratio due to the absorption of the leaf in the red and green wavelengths. In addition, considering the influence of the scanning geometry on the signal to noise ratio, the signal noise increased with increasing incidence angles and distances.
In terms of correction methods, the reference target-based model (Equation (4)) showed that the incidence angle and range effect on each laser backscatter intensity could be improved based on the same wavelength intensity of the reference target at the same incidence angle and distance (Figure 7 and Figure 10). However, there are some limitations for the reference target-based approach. When the incidence angle or distance is too large (e.g., the angle >60°, the distance >14 m), the correction error cannot be eliminated. Besides, for the reference target-based approach, even if we were able to record the signal and leaf behavior perfectly, it is not enough to correct the incidence angle and range effect as we do not know the incidence angle of the measured target accurately because the incidence angle is usually difficult to retrieve in the measurement of large targets, such as tree canopies.
The laser ratio of two wavelengths should be insensitive to the incidence angle and range, since the effects are partially eliminated when the backscatter intensity of both wavelengths is similarly affected by the incidence angle and range [9]. However, the results showed that the laser ratio index of green and near-infrared laser wavelengths (SLRng) and the laser ratio index of three wavelengths (DLRner) cannot eliminate the incidence angle and range effect on the HSL laser backscatter intensity (Figure 11 and Figure 12). Candidate wavelengths for reducing the scanning geometry effects could be red-edge wavelengths (RE, 700–730 nm) and near-infrared laser wavelengths (NIR, 780–850 nm) as index wavelengths that are highly sensitive to a wide range of foliar nitrogen and chlorophyll [12]. In both the RE and NIR spectral regions, the isotropic reflectance component can be assumed to be higher due to the lower leaf absorption when compared to the green and red spectral regions. The correction results confirmed that the normalized difference laser indices (e.g., NDLIne and NDLInr) and the sample laser ratio index of RE and NIR laser wavelengths (SLRne) lessened the scanning geometry effect on the HSL laser backscatter intensity. Moreover, the laser ratio index in the RE and NIR laser wavelengths improved the sub-footprint effect on the leaf edge.
However, the results of the present research are based on broadleaf species with small, simple canopies and should not be implicitly extended to larger, more complex canopies. Further studies on the sub-footprint effect in complex canopies are needed for HSL, particularly for investigating the effect of multiple scattering on different wavelengths in canopies. Besides, additional research is needed to investigate surface roughness or grain size effects and their correction [16,17]. In summary, based on this study, HSL radiometric calibration technology can be further improved. Due to obtaining accurate and abundant spectral intensity and spatial information, HSL can be capable of providing vegetation structural information along with biochemical components [6,13,15], thus better characterizing vegetation properties.

5. Conclusions

We explored the effects of the incidence angle, range and sub-footprint on HSL backscatter intensity measurements and proposed a practical correction method that maximizes the performance of hyperspectral LiDAR for different application fields of remote sensing. We observed that (a) the increases in the incident angle decrease the backscatter intensity, while increasing the distance increases the backscatter intensity first and then decreases; (b) all laser wavelengths that backscatter intensities of the target with ordered surfaces share a similar trend in the incidence angle and distance behavior. The backscatter intensities of leaf targets appear to be wavelength-dependent on these effects; (c) significant discrepancy exists in the leaf return and leaf edge return derived from the same laser footprint.
This study showed that the proposed laser ratio indices at red-edge and near-infrared laser wavelengths (e.g., NDLIne and SLRne) are insensitive to incidence angle and range effects. The laser ratio method based on the specific laser wavelengths can be employed to eliminate these effects, which is more accurate and efficient than the reference target-based model. The reference target-based model approach is only suitable for correcting these effects with a small incidence angle and range. Moreover, the laser ratio index produced by the HSL calibration procedure improved the sub-footprint effect on the HSL backscatter intensity. By establishing an HSL calibration procedure based on a laser ratio at specific laser wavelengths, hyperspectral LiDAR provides a unique advantage in eliminating incidence angle, range and sub-footprint effects compared with single-wavelength LiDAR. Furthermore, the proposed method can be extended to other multi-wavelength or hyperspectral LiDAR and to exploit the great potential for detecting target properties with a specific laser wavelength combination.

Author Contributions

Conceptualization, S.G. and Z.N.; methodology, C.Z.; validation, C.Z. and S.G.; formal analysis, S.G., W.L. and G.S.; investigation, C.Z.; data curation, C.Z. and K.B.; writing—original draft preparation, C.Z.; writing—review and editing, W.L., S.G., and N.H.; supervision, S.G.; funding acquisition, S.G. and Z.N. All authors have read and agreed to the published version of the manuscript.

Funding

This research was funded by the National Natural Science Foundation of China (No. 41730107), the project of the National Key R&D Program of China (No. 2017YFA0603004) and the Strategic Priority Research Program of Chinese Academy of Sciences (No. XDA19030304).

Acknowledgments

We greatly appreciate the constructive comments from the all anonymous reviewers.

Conflicts of Interest

The authors declare no conflict of interest.

References

  1. Tan, K.; Cheng, X. Correction of incidence angle and distance effects on TLS intensity data based on reference targets. Remote Sens. 2016, 8, 251. [Google Scholar] [CrossRef] [Green Version]
  2. Alexander, C.; Tansey, K.; Kaduk, J.; Holland, D.A.; Tate, N.J. Backscatter coefficient as an attribute for the classification of full-waveform airborne laser scanning data in urban areas. ISPRS J. Photogramm. 2010, 65, 423–432. [Google Scholar] [CrossRef] [Green Version]
  3. Hofle, B. Radiometric Correction of terrestrial LiDAR point cloud data for individual maize plant detection. IEEE Geosci. Remote Sens. Lett. 2014, 11, 94–98. [Google Scholar] [CrossRef]
  4. Chen, B.; Shi, S.; Gong, W.; Zhang, Q.; Yang, J.; Du, L.; Sun, J.; Zhang, Z.; Song, S. Multispectral LiDAR point cloud classification: A two-step approach. Remote Sens. 2017, 9, 373. [Google Scholar] [CrossRef] [Green Version]
  5. Kukkonen, M.; Maltamo, M.; Korhonen, L.; Packalen, P. Comparison of multispectral airborne laser scanning and stereo matching of aerial images as a single sensor solution to forest inventories by tree species. Remote Sens. Environ. 2019, 231, 111208. [Google Scholar] [CrossRef]
  6. Morsdorf, F.; Nichol, C.; Malthus, T.J.; Woodhouse, I.H. Assessing forest structural and physiological information content of multi-spectral LiDAR waveforms by radiative transfer modelling. Remote Sens. Environ. 2009, 113, 2152–2163. [Google Scholar] [CrossRef] [Green Version]
  7. Hopkinson, C.; Lovell, J.; Chasmer, L.; Jupp, D.L.; Kljun, N.; Van Gorsel, E. Integrating terrestrial and airborne lidar to calibrate a 3D canopy model of effective leaf area index. Remote Sens. Environ. 2013, 136, 301–314. [Google Scholar] [CrossRef]
  8. Lin, Y.; West, G. Retrieval of effective leaf area index (LAIe) and leaf area density (LAD) profile at individual tree level using high density multi-return airborne LiDAR. Int. J. Appl. Earth Obs. 2016, 50, 150–158. [Google Scholar] [CrossRef]
  9. Gaulton, R.; Danson, F.M.; Ramirez, F.A.; Gunawan, O. The potential of dual-wavelength laser scanning for estimating vegetation moisture content. Remote Sens. Environ. 2013, 132, 32–39. [Google Scholar] [CrossRef]
  10. Zhu, X.; Wang, T.; Darvishzadeh, R.; Skidmore, A.K.; Niemann, K.O. 3D leaf water content mapping using terrestrial laser scanner backscatter intensity with radiometric correction. ISPRS J. Photogramm. 2015, 110, 14–23. [Google Scholar] [CrossRef]
  11. Du, L.; Shi, S.; Gong, W.; Yang, J.; Sun, J.; Mao, F. Wavelength selection of hyperspectral lidar based on feature weighting for estimation of leaf nitrogen content in rice. Int. Arch. Photogramm. Remote Sens. 2016, 41, 9–13. [Google Scholar] [CrossRef] [Green Version]
  12. Eitel, J.U.; Magney, T.S.; Vierling, L.A.; Dittmar, G. Assessment of crop foliar nitrogen using a novel dual-wavelength laser system and implications for conducting laser-based plant physiology. ISPRS J. Photogramm. 2014, 97, 229–240. [Google Scholar] [CrossRef]
  13. Eitel, J.U.; Vierling, L.A.; Long, D.S. Simultaneous measurements of plant structure and chlorophyll content in broadleaf saplings with a terrestrial laser scanner. Remote Sens. Environ. 2010, 114, 2229–2237. [Google Scholar] [CrossRef]
  14. Li, W.; Niu, Z.; Sun, G.; Gao, S.; Wu, M. Deriving backscatter reflective factors from 32-channel full-waveform LiDAR data for the estimation of leaf biochemical contents. Opt. Express. 2016, 24, 4771–4785. [Google Scholar] [CrossRef] [PubMed]
  15. Bi, K.; Xiao, S.; Gao, S.; Zhang, C.; Huang, N.; Niu, Z. Estimating vertical chlorophyll concentrations in maize in different health states using hyperspectral LiDAR. IEEE Trans. Geosci. Remote Sens. 2020, 99, 1–9. [Google Scholar] [CrossRef]
  16. Kashani, A.G.; Olsen, M.J.; Parrish, C.; Wilson, N. A review of LIDAR radiometric processing: From ad hoc intensity correction to rigorous radiometric calibration. Sensors 2015, 15, 28099–28128. [Google Scholar] [CrossRef] [Green Version]
  17. Soudarissanane, S.S.; Lindenbergh, R.C.; Menenti, M.; Teunissen, P.J. Scanning geometry: Influencing factor on the quality of terrestrial laser scanning points. ISPRS J. Photogramm. 2011, 66, 389–399. [Google Scholar] [CrossRef]
  18. Yan, W.Y.; Shaker, A.; Habib, A.; Kersting, A.P. Improving classification accuracy of airborne LiDAR intensity data by geometric calibration and radiometric correction. ISPRS J. Photogramm. 2012, 67, 35–44. [Google Scholar] [CrossRef]
  19. Jelalian, A.V. Laser Radar Systems; Artech House: Norwood, NJ, USA, 1992; pp. 3–10. [Google Scholar]
  20. Fang, W.; Huang, X.; Zhang, F.; Li, D. Intensity correction of terrestrial laser scanning data by estimating laser transmission function. IEEE Trans. Geosci. Remote Sens. 2014, 53, 942–951. [Google Scholar] [CrossRef]
  21. Mallet, C.; Bretar, F. Full-waveform topographic lidar: State-of-the-art. ISPRS J. Photogramm. 2009, 64, 1–16. [Google Scholar] [CrossRef]
  22. Carrea, D.; Abellan, A.; Humair, F.; Matasci, B.; Derron, M.; Jaboyedoff, M. Correction of terrestrial LiDAR intensity channel using Oren–Nayar reflectance model: An application to lithological differentiation. ISPRS J. Photogramm. 2016, 113, 17–29. [Google Scholar] [CrossRef]
  23. Wagner, W. Radiometric calibration of small-footprint full-waveform airborne laser scanner measurements: Basic physical concepts. ISPRS J. Photogramm. 2010, 65, 505–513. [Google Scholar] [CrossRef]
  24. Li, X.L.; Ma, L.; Xu, L.J. Empirical modeling for non-Lambertian reflectance based on full-waveform laser detection. Opt. Eng. 2013, 52, 116110. [Google Scholar] [CrossRef] [Green Version]
  25. Ding, Q.; Chen, W.; King, B. Combination of overlap-driven adjustment and Phong model for LIDAR intensity correction. ISPRS J. Photogramm. 2013, 75, 40–47. [Google Scholar] [CrossRef]
  26. Tan, K.; Cheng, X.J. Specular Reflection Effects elimination in terrestrial laser scanning intensity data using phong model. Remote Sens. 2017, 9, 853. [Google Scholar] [CrossRef] [Green Version]
  27. Kaasalainen, S.; Akerblom, M.; Nevalainen, O.; Hakala, T.; Kaasalainen, M. Uncertainty in multispectral lidar signals caused by incidence angle effects. Interface Focus. 2018, 8, 20170033. [Google Scholar] [CrossRef] [Green Version]
  28. Tan, P. Oren-Nayar Reflectance Model. Available online: https://link.springer.com/content/pdf/10.1007%2F978-0-387-31439-6_535.pdf (accessed on 1 September 2020).
  29. Vain, A.; Kaasalainen, S.; Pyysalo, U.; Krooks, A.; Litkey, P. Use of naturally available reference targets to calibrate airborne laser scanning intensity data. Sensors. 2009, 9, 2780–2796. [Google Scholar] [CrossRef]
  30. Kaasalainen, S.; Pyysalo, U.; Krooks, A.; Vain, A.; Kukko, A.; Hyyppa, J.; Kaasalainen, M. Absolute radiometric calibration of Als intensity data: Effects on accuracy and target classification. Sensors 2011, 11, 10586–10602. [Google Scholar] [CrossRef]
  31. Kaasalainen, S.; Jaakkola, A.; Kaasalainen, M.; Krooks, A.; Kukko, A. Analysis of incidence angle and distance effects on terrestrial laser scanner intensity: Search for correction methods. Remote Sens. 2011, 3, 2207–2221. [Google Scholar] [CrossRef] [Green Version]
  32. Tan, K.; Cheng, X.; Ding, X.; Zhang, Q. Intensity data correction for the distance effect in terrestrial laser scanners. IEEE J. Sel. Top. Appl. Earth Obs. Remote Sens. 2016, 9, 304–312. [Google Scholar] [CrossRef]
  33. Xu, T.; Xu, L.; Yang, B.; Li, X.; Yao, J. Terrestrial laser scanning intensity correction by piecewise fitting and overlap-driven adjustment. Remote Sens. 2017, 9, 1090. [Google Scholar] [CrossRef] [Green Version]
  34. Yu, X.; Hyyppa, J.; Litkey, P.; Kaartinen, H.; Vastaranta, M.; Holopainen, M. Single-sensor solution to tree species classification using multispectral airborne laser scanning. Remote Sens. 2017, 9, 108. [Google Scholar] [CrossRef] [Green Version]
  35. Tan, K.; Zhang, W.; Shen, F.; Cheng, X. Investigation of TLS intensity data and distance measurement errors from target specular reflections. Remote Sens. 2018, 10, 1077. [Google Scholar] [CrossRef] [Green Version]
  36. Der Zande, D.V.; Jonckheere, I.; Stuckens, J.; Verstraeten, W.; Coppin, P. Sampling design of ground-based lidar measurements of forest canopy structure and its effect on shadowing. Can. J. Remote Sens. 2008, 34, 526–538. [Google Scholar] [CrossRef]
  37. Qin, Y.; Yao, W.; Vu, T.T.; Li, S.; Niu, Z.; Ban, Y. Characterizing radiometric attributes of point cloud using a normalized reflective factor derived from small footprint LiDAR waveform. IEEE J. Sel. Top. Appl. Earth Obs. Remote Sens. 2015, 8, 740–749. [Google Scholar] [CrossRef]
  38. Niu, Z.; Xu, Z.; Sun, G.; Huang, W.; Wang, L.; Feng, M.; Li, W.; He, W.; Gao, S. Design of a new multispectral waveform LiDAR instrument to monitor vegetation. IEEE Geosci. Remote Sens. Lett. 2015, 12, 1506–1510. [Google Scholar]
  39. Zhang, C.S.; Gao, S.; Niu, Z.; Pei, J.; Bi, K.Y.; Sun, G. Calibration of the pulse signal decay effect of full-waveform hyperspectral LiDAR. Sensors 2019, 19, 5263. [Google Scholar] [CrossRef] [Green Version]
  40. Hofle, B.; Pfeifer, N. Correction of laser scanning intensity data: Data and model-driven approaches. ISPRS J. Photogramm. 2007, 62, 415–433. [Google Scholar] [CrossRef]
  41. Gitelson, A.A.; Merzlyak, M.N. Spectral reflectance changes associated with autumn senescence of aesculus hippocastanum L. And acer platanoides L. Leaves. Spectral features and relation to chlorophyll estimation. J. Plant. Physiol. 1994, 143, 286–292. [Google Scholar] [CrossRef]
  42. Barnes, E.M.; Clarke, T.R.; Richards, S.E.; Colaizzi, P.D.; Haberland, J.; Kostrzewski, M.; Waller, P.; Choi, C.; Riley, E.; Thompson, T.; et al. Coincident detection of crop water stress, nitrogen status and canopy density using ground-based multispectral data. In Proceedings of the Fifth International Conference on Precision Agriculture, Bloomington, MN, USA, 16–19 July 2000. [Google Scholar]
  43. Dash, J.; Curran, P.J. The MERIS terrestrial chlorophyll index. Int. J. Remote Sens. 2004, 25, 5403–5413. [Google Scholar] [CrossRef]
  44. Zarcotejada, P.J.; Miller, J.R.; Noland, T.L.; Mohammed, G.H.; Sampson, P.H. Scaling-up and model inversion methods with narrowband optical indices for chlorophyll content estimation in closed forest canopies with hyperspectral data. IEEE Trans. Geosci. Remote Sens. 2001, 39, 1491–1507. [Google Scholar] [CrossRef] [Green Version]
  45. Gitelson, A.A.; Keydan, G.P.; Merzlyak, M.N. Three-band model for noninvasive estimation of chlorophyll, carotenoids, and anthocyanin contents in higher plant leaves. Geophys. Res. Lett. 2006, 33. [Google Scholar] [CrossRef] [Green Version]
  46. Krooks, A.; Kaasalainen, S.; Hakala, T.; Nevalainen, O. Correction of intensity incidence angle effect in terrestrial laser scanning. Int. Arch. Photogramm. Remote Sens. 2013, 2, 145–150. [Google Scholar] [CrossRef] [Green Version]
  47. Hu, P.; Huang, H.; Chen, Y.; Qi, J.; Li, W.; Jiang, C.; Wu, H.; Tian, W.; Hyyppä, J. Analyzing the angle effect of leaf reflectance measured by indoor hyperspectral light detection and ranging (LiDAR). Remote Sens. 2020, 12, 919. [Google Scholar] [CrossRef] [Green Version]
Figure 1. Illustration of the sub-footprint effect. The laser beam is emitted by a supercontinuum laser with a 3 mrad divergence angle.
Remotesensing 12 02855 g001
Figure 2. Measurement setup of experiment 1 with a fixed distance of 6 m is scanned at varying incidence angles. A representative laser beam is depicted in red.
Remotesensing 12 02855 g002
Figure 3. Measurement setup of experiment 2 with distance from 4 to 20 m, and a step interval of 1 m.
Remotesensing 12 02855 g003
Figure 4. Backscatter intensities of twenty wavelengths of the standard reflectance panels versus incidence angle. (a) Raw intensities of the 99% standard reflectance panel; (b) raw intensities of the 50% standard reflectance panel.
Remotesensing 12 02855 g004
Figure 5. Backscatter intensities of twenty wavelengths of the six leaf targets versus incidence angle: (a) Ficus elastica, (b) Epipremnum aureum, (c) Aglaonema modestum, (d) Hibiscus rosa-sinensis Linn, (e) Spathiphyllum kochii and (f) Kalanchoe blossfeldiana Poelln.
Remotesensing 12 02855 g005
Figure 6. Backscattered intensities of the twenty wavelengths are normalized to 1 at 0°. (a) Normalized intensities of the 99% standard reflectance panel; (b) normalized intensities of a leaf sample. Lambertian cosine law is depicted in black.
Remotesensing 12 02855 g006
Figure 7. Relative correction results of all wavelengths for the six leaf targets versus incidence angle, the 99% standard reflectance panel is used as a reference. (a) Ficus elastica, (b) Epipremnum aureum, (c) Aglaonema modestum, (d) Hibiscus rosa-sinensis Linn, (e) Spathiphyllum kochii and (f) Kalanchoe blossfeldiana Poelln.
Remotesensing 12 02855 g007
Figure 8. Backscatter intensities of twenty wavelengths versus distance. (a) Raw intensities of the 99% standard reflectance panel versus distance. (b) Raw intensities of 50% standard reflectance panel versus distance. (c) Raw intensities of a leaf sample versus distance.
Remotesensing 12 02855 g008
Figure 9. Backscattered intensities of the four laser wavelengths for the standard panels and leaf sample are normalized to 1 at 8 m.
Remotesensing 12 02855 g009
Figure 10. Relative correction results of all wavelengths for (a) the 50% standard reflectance panel and (b) leaf target versus distance, the 99% standard reflectance panel is used as a reference.
Remotesensing 12 02855 g010
Figure 11. Laser ratio correction results for the leaf targets versus incidence angle. (a) Ficus elastica, (b) Epipremnum aureum, (c) Aglaonema modestum, (d) Hibiscus rosa-sinensis Linn, (e) Spathiphyllum kochii and (f) Kalanchoe blossfeldiana Poelln.
Remotesensing 12 02855 g011
Figure 12. Laser ratio correction results for the leaf sample versus distance.
Remotesensing 12 02855 g012
Figure 13. The RMSE deviation results of the laser ratio indices of the leaf samples.
Remotesensing 12 02855 g013
Figure 14. Hyperspectral LiDAR backscatter intensity correction visualization. (a) Kniphofia; (b) before correction (near-infrared wavelength intensity-784 nm); (c) after correction (NDLInr); (d) after correction (SLRne).
Remotesensing 12 02855 g014
Figure 15. Spectral separability of leaf returns and mixed-edge returns associated with the red-edge (719 nm) and near-infrared (784 nm) laser backscatter intensities; sub-footprint effect adjusted with the normalized difference laser index (NDLInr) and sample laser ratio (SLRne).
Remotesensing 12 02855 g015
Table 1. Leaf samples and corresponding pictures.
Leaf SamplesFicus elasticaEpipremnum aureumAglaonema modestumHibiscus rosa-sinensis LinnSpathiphyllum kochiiKalanchoe blossfeldiana Poelln
Photos Remotesensing 12 02855 i001 Remotesensing 12 02855 i002 Remotesensing 12 02855 i003 Remotesensing 12 02855 i004 Remotesensing 12 02855 i005 Remotesensing 12 02855 i006

