Abstract
No accurate global lowland digital terrain model (DTM) exists to date that allows reliable quantification of coastal lowland flood risk, currently and with sea-level rise. We created the first global coastal lowland DTM that is derived from satellite LiDAR data. The global LiDAR lowland DTM (GLL_DTM_v1) at 0.05-degree resolution (~5 × 5 km) is created from ICESat-2 data collected between 14 October 2018 and 13 May 2020. It is accurate within 0.5 m for 83.4% of land area below 10 m above mean sea level (+MSL), with a root-mean-square error (RMSE) value of 0.54 m, compared to three local area DTMs for three major lowland areas: the Everglades, the Netherlands, and the Mekong Delta. This accuracy is far higher than that of four existing global digital elevation models (GDEMs), which are derived from satellite radar data, namely, SRTM90, MERIT, CoastalDEM, and TanDEM-X, that we find to be accurate within 0.5 m for 21.1%, 12.9%, 18.3%, and 37.9% of land below 10 m +MSL, respectively, with corresponding RMSE values of 2.49 m, 1.88 m, 1.54 m, and 1.59 m. Globally, we find 3.23, 2.12, and 1.05 million km2 of land below 10, 5, and 2 m +MSL. The 0.93 million km2 of land below 2 m +MSL identified between 60N and 56S is three times the area indicated by SRTM90 that is currently the GDEM most used in flood risk assessments, confirming that studies to date are likely to have underestimated areas at risk of flooding. Moreover, the new dataset reveals extensive forested land areas below 2 m +MSL in Papua and the Amazon Delta that are largely undetected by existing GDEMs. We conclude that the recent availability of satellite LiDAR data presents a major and much-needed step forward for studies and policies requiring accurate elevation models. GLL_DTM_v1 is available in the public domain, and the resolution will be increased in later versions as more satellite LiDAR data become available.
1. Introduction
Coastal flood risk assessments typically require a DTM accuracy of at least 0.5 m [1], given that the range of tidal fluctuations and sea-level rise is measured in a few meters only [2]. The uncertainties resulting from lower DTM accuracy have profound impacts on the usability of coastal land suitability assessments and on the confidence in sea-level rise impact projections, amongst others.
At present, DTMs that present the true bare ground surface with such accuracy exist for only a few coastal lowland regions, mostly in affluent countries because of the high cost involved. For most of the world’s coastal lowlands, global digital elevation models (GDEMs) are used instead, with SRTM being the oldest and most commonly applied [3,4,5,6,7]. The vertical accuracy of SRTM is, however, very low at 16 m (90% confidence level; RMSE = 9.73 m; [8]) at the global level and higher but still too low at local to regional level e.g., [9,10,11,12,13,14]. While the global vertical accuracy of the recent TanDEM-X GDEM, as determined by comparison with ICESat-1 data, is better at 3.49 m (90% confidence level; RMSE = 2.12 m; [15]), this remains too low for flood risk assessment applications. Both SRTM and TanDEM-X are created from satellite radar data that only partially penetrate vegetation canopy [8,16,17] and, therefore, do not represent the actual bare ground surface [18]. As a result, land elevations, as presented in such GDEMs, tend to be too high, as recently demonstrated for the Mekong Delta by Minderhoud et al. [19] showing SRTM being 1.8 m higher than a local DTM, inevitably resulting in an underestimation of current and future flood risk [20,21,22,23].
It is widely acknowledged that only LiDAR can penetrate vegetation canopy sufficiently to create reliable DTMs, with RMSE values of typically less than 0.30 m [24,25,26], where full coverage airborne LiDAR is present. On 15 September 2018, NASA launched ICESat-2 (ice, cloud, and land elevation satellite-2) with onboard the advanced topographic laser altimetry system (ATLAS) instrument that utilizes photon counting technology for altimetry observations. Data from this satellite LiDAR instrument started to become available for public use in 2019 [27] and are expected to achieve an equatorial ground track spacing of less than 2 km over two years [28].
The objectives of this study are to (i) create the first global satellite LiDAR-based lowland DTM, using ICESat-2 data (hereafter named GLL_DTM_v1), (ii) determine the accuracy of this DTM in comparison to existing local DTMs that are considered to be accurate, and (iii) compare GLL_DTM_v1 with existing radar-based GDEMs that have been used in global and local flood risk assessments to date. We determine land areas in the low elevation coastal zone (LECZ), defined as the contiguous area along the coast that is below 10 m +MSL [29,30]. We also present accuracy and extent numbers for land below 2 m, which is most susceptible to river floods and inundation from tropical storms [31], and below 5 m as this is around the maximum rate of sea-level rise projected by 2300 in a high carbon emission scenario [2], which can put lowlands at risk of permanent inundation.
2. Datasets and Methods
The methodology, as described in detail in the following sections, is summarized in the flowchart below (Figure 1).
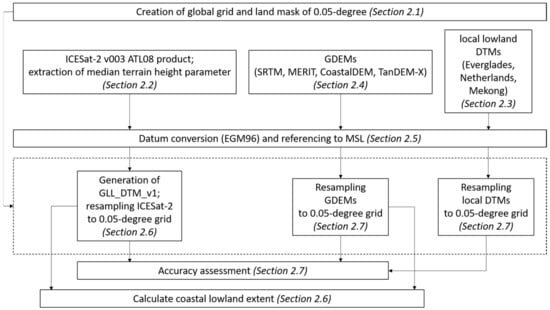
Figure 1.
Flow chart of the methodology applied in this study.
2.1. Generating a Global Grid and Land Mask at 0.05-Degree Resolution
A global grid of 0.05 × 0.05 degrees is created that measures ~5.6 × 5.6 km near the equator and ~2.8 × 5.6 km at 60 degrees latitude, i.e., roughly 5 × 5 km overall. We use version 3.6 of the global administrative vector file available from the gadm database (www.gadm.org) to create a land mask. A grid cell that contained more than 50% ‘land’ is fully considered land. Furthermore, only when cells consisted of water for less than 50% according to the SRTM water body dataset [32], they are considered land. All maps used and presented in this study are resampled to this grid and corrected for this land mask before further analysis.
2.2. ICESat-2 Data
Version 3 of the ICESat-2 ATL08 geophysical data product over the period 14 October 2018–13 May 2020 is obtained from the National Snow and Ice Data Center [33]. The algorithm producing the ATL08 product extracts terrain and canopy heights from the ATLAS point clouds [27]. Photons are classified as ground, canopy, or noise. After classification, parameters, such as terrain and canopy height, are calculated along fixed 100 m data segments. A minimum of 50 signal photons (i.e., photons reflected off a surface) are required within the 100 m data segment for the algorithm to return the terrain parameters [27]. We have extracted the median terrain height (h_te_median; median of the photon heights above the WGS84 ellipsoid, classified as terrain within the segment) at 100 m segments from each of the 88,127 currently available ground tracks.
2.3. Local DTMs
To determine the accuracy of the GLL_DTM_v1 created in this study, existing well-described and accurate DTMs for major lowland regions across three continents are used: (1) The Everglades in the USA, (2) The Netherlands, and (3) the Mekong Delta in Vietnam (Figure 2).
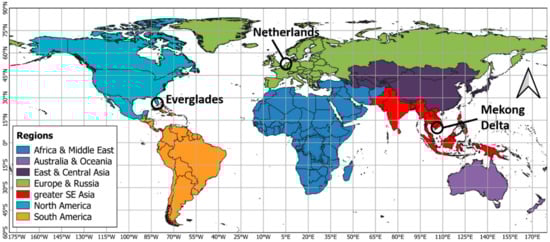
Figure 2.
Region definition used in this study with the location of local DTMs shown.
For the Everglades, we use the NOAA sea-level rise DEM, a LiDAR-derived DEM for coastal areas at 5 m resolution, which is available from [34].
For the Netherlands, we use the national DTM (Actueel Hoogtebestand Nederland), AHN3 [35] that is created from LiDAR data at a 5 m resolution, which is available from [36].
The Mekong Delta dataset [19] is a non-LiDAR DTM that is generated from a topographic map at 500 m resolution, using nearly 20,000 ground elevation measurements, which is available from [37].
2.4. Global Digital Elevation Models (GDEMs)
Four near-global DEMs that have been applied in global and local assessments of flood risk [3,5,7,38,39,40] are compared with the GLL_DTM_v1 created in this study: SRTM 4.1 [41], MERIT [42], CoastalDEM 1.1 [43], and TanDEM-X [15]. All these GDEMs are radar-based and have a spatial resolution of 3 arc seconds (~90 m at the equator). They cover areas varying from 60N–56S (SRTM and CoastalDEM), 90N–60S (MERIT) to 84N–84S (TanDEM-X). The MERIT and CoastalDEM DEMs are largely derived from SRTM data [42,43].
2.5. Datum Conversion and Referencing to MSL
Both ICESat-2 and TanDEM-X data are referenced to the WGS84 ellipsoid, while SRTM, MERIT, and CoastalDEM elevations are orthometric heights referenced to the EGM96 geoid. For comparison, ICESat-2 and TanDEM-X elevations are transformed to the EGM96 geoid using the 5-min version available from https://sourceforge.net/projects/geographiclib/files/geoids-distrib/.
Datum levels for the local reference DTMs are also transformed. For the Everglades dataset, the GEOID12B [44] correction is used in the VDATUM software, version 4.0.1 [45]. For the AHN3, the RDNAPTRANS 2018 parameters, in combination with PROJ6 [46], are used. Following these local transformations to the WGS84 ellipsoid, the DTMs are referenced to the EGM96 geoid.
To convert the vertical datum from the EGM96 geoid to MSL, we use the mean dynamic topography (MDT), which is the difference between the mean sea surface and the geoid. We use an estimate by [47], who calculated the MDT by combining geodetic data (i.e., altimetric mean sea surface over the period 1993–2012 and an accurate geoid) with in situ data, at 0.25-degree resolution (http://www.aviso.altimetry.fr/). For referencing to MDT on land, the closest value at sea is used. The Mekong Delta dataset is already referenced to local MSL, so no further conversion is necessary.
2.6. Generating GLL_DTM_v1
We observe that some of the ICESat-2 ground tracks contain erroneous extreme outlier values. Since the ATL08 algorithm is still in development, and such values are likely to be removed in the future [27], we do not attempt to correct for these erroneous data, but rather apply a hard cut-off value to exclude them. All data segments with a median terrain height below −7 m +MSL are removed because they are considered unrealistic in coastal lowland, noting that −7 m +MSL is the lowest land elevation value found in pumped polders in the Netherlands. Visual inspection confirms that nearly all erroneous data segments are indeed removed in this way.
Since ICESat-2 data coverage is insufficient to create a DTM of similar resolution as the GDEMs, we resample the 100 m data segment elevation values to a 0.05-degree land grid by taking the median of 100 m data segments within each grid cell. The 0.05-degree grid resolution is found to be the most suitable resolution at the moment, given that nearly all (98.8%) of such cells have terrain elevation data from at least one ICESat-2 data segment. A total of 97.6% of 0.05-degree grid cells have more than five data segments. The distribution of the number of data segments within each 0.05-degree lowland cell is provided in Figure 3. To create an approximate full coverage lowland DTM, values in ‘no data’ cells (1.2% of the cell total) are interpolated between data cell values through inverse distance interpolation. This interpolation method is applicable in areas where landscape features are gradual, as is usually the case in lowlands that tend to be very flat [25].
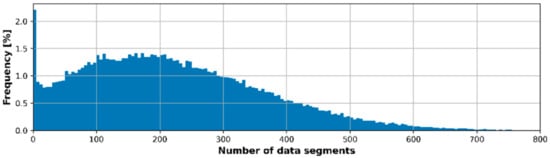
Figure 3.
Frequency distribution of ICESat-2 data segments within 0.05-degree global coastal (<10 m +MSL) grid cells. Bin size is 5 data segments.
For each region in the world, excluding Antarctica (Figure 2), areas within specified elevation classes are calculated applying the equal area projection [48,49] and compared with the different GDEMs.
2.7. Accuracy Assessment by Comparison with Local DTMs
After transformations, both the local DTMs and GDEMs are resampled to the same 0.05-degree grid as the ICESat-2 data, by determining the median value within cells. The difference between GLL_DTM_v1 and the local DTMs at 0.05-degree resolution is mapped for each area, and the mean error (Equation (1)), mean absolute error (Equation (2)), and RMSE (Equation (3)) are calculated and tabulated. This is done separately for land, that is, below 2, 5, and 10 m +MSL according to the local DTMs. Similarly, also the GDEMs are compared with the local DTMs at 0.05-degree resolution.
where N is the total number of samples, Δhi = elevation difference between assessed DTM and reference DTM at sample point (i).
3. Results
3.1. GLL_DTM_v1 Accuracy Compared to GDEMs
The accuracy assessment covers 74,604 km2 of the lowland area (<10 m +MSL). The GLL_DTM_v1 is found to be accurate within 1 m for 95.5% and within 0.5 m for 83.4% of land area below 10 m +MSL, with a mean error of 0.06 m, a mean absolute error of 0.32 m, and an RMSE of 0.54 m, when compared with three local DTMs (Table 1, Figure 4). The RMSE is similar for the three comparison areas (range 0.44–0.67 m), indicating a high degree of consistency across regions in the GLL_DTM_v1 product.

Table 1.
Accuracy of GLL_DTM_v1 and existing GDEMs for areas lower than 2, 5, and 10 m +MSL (as compared to local DTMs). Presented are mean elevation differences between the local DTM, GLL_DTM_v1, and existing GDEMs, as well as RMSE and the area percentage differences within ranges −1–+1 m and −0.5–+0.5 m.
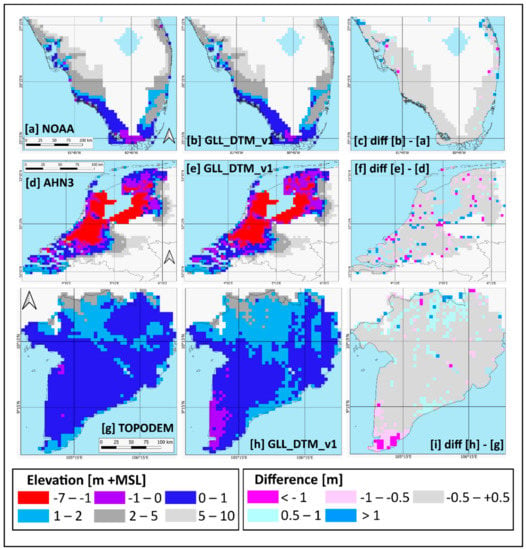
Figure 4.
Comparison of GLL_DTM_v1 DTM with local DTMs for 3 areas. From top to bottom: (a–c) Everglades in USA, (d–f) Netherlands, and (g–i) Mekong Delta in Vietnam. From left to right: (a,d,g) local DTM, (b,e,h) GLL_DTM_v1, (c,f,i) difference between local DTM and GLL_DTM_v1. Differences only shown where local DTM is lower than 10 m +MSL.
The accuracies within 0.5 m of SRTM90, MERIT, CoastalDEM, and TanDEM-X are substantially lower at 19.9%, 12.3%, 16.6%, and 37.9%, while RMSE values are far higher at 2.43 m, 1.74 m, 1.44 m, and 1.39 m, respectively (Table 1, Figure 5, Figures S1 and S2). Mean errors are similar to mean absolute errors across GLL_DTM_v1 and GDEMs, except for CoastalDEM, where the mean error averaged over the three areas is negative at −0.32 m.
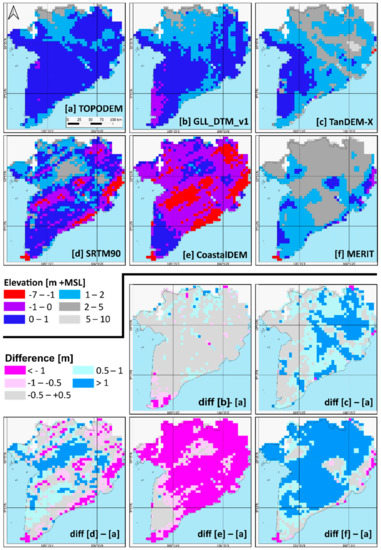
Figure 5.
Comparison of GLL_DTM_v1 and GDEMs with the local DTM for the Mekong Delta in Vietnam (TOPODEM; [37]). Top two panels: (a) TOPODEM, (b) GLL_DTM_v1, (c) TanDEM-X, (d) SRTM90, (e) CoastalDEM, (f) MERIT. Bottom two panels: Difference maps between TOPODEM and GLL_DTM_v1, TanDEM-X, SRTM90, CoastalDEM, and MERIT. Comparison for Everglades and Netherlands is provided in Figures S1 and S2, respectively.
3.2. Coastal Lowland Extent Comparison with GDEMs
The full global extent of coastal lowland below 10, 5, and 2 m +MSL, as determined from GLL_DTM_v1, is 3.23, 2.12, and 1.05 million km2, respectively. The SRTM extent measured between 60N and 56S latitude is 2.78, 1.85, and 0.93 million km2 (Table 2).
Table 2.
Coastal lowland areas (in 103 km2) below 2, 5, and 10 m +MSL in different regions (60N–56S, as covered by SRTM), applying the GLL_DTM_v1 generated from ICESat-2 data in this study and other GDEMs. The region definition is shown in Figure 2.
For areas below 2 m +MSL, the difference between GLL_DTM_v1 and existing GDEMs is greatest, with extent according to GLL_DTM_v1 being 295% of that of SRTM90, 208% of MERIT, 111% of CoastalDEM, and 158% of TanDEM-X (Table 2, Figure 6). For global land below 10 and 5 m +MSL, the GLL_DTM_v1 extent is also greater at 151–201%, 105–121%, 108–109%, and 117–132%, respectively (Table 2, Figure 6).
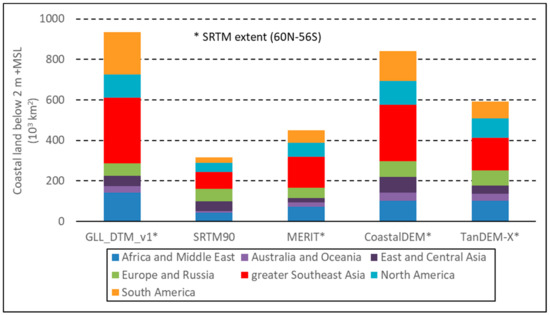
Figure 6.
Coastal lowland areas below 2 m +MSL in different regions (60N to 56S, as covered by SRTM), applying the GLL_DTM_v1 generated from ICESat-2 data in this study and other GDEMs. The region definition is shown in Figure 2.
The coastal lowland extent, as determined from GLL_DTM_v1, is largest in the greater Southeast Asia region, at 36%, 36%, and 35% of the global total at elevations below 10, 5, and 2 m +MSL. For land below 2 m +MSL, this is followed by South America at 22%, Africa and the Middle East at 15%, North America at 12%, Europe and Russia at 6%, East and Central Asia at 5%, and Australia and Oceania at 4% (Table 2).
The variation between sources in lowland area below 2 m +MSL is greatest in South America, with the extent of SRTM90, MERIT, CoastalDEM, and TanDEM-X being 14%, 29%, 71%, and 39% that of GLL_DTM_v1. For Europe and Russia, these numbers are 101%, 85%, 129%, and 125%, presenting the smallest variation between sources (Table 2).
The lowland area in all of Asia, i.e., along the coastlines of greater Southeast Asia and East and Central Asia combined, is 44% of global extent below 10 m and 5 m +MSL and 40% of extent below 2 m +MSL, according to GLL_DTM_v1.
4. Discussion
4.1. Impact of DTM Accuracy on Lowland Extent Estimation
The low errors and high consistency across regions in GLL_DTM_v1 compared to radar-based GDEMs demonstrates that the ICESat-2 satellite LiDAR data provide a unique opportunity to improve global lowland area mapping with substantially higher accuracy than has been possible so far and, therefore, will allow more accurate environmental and climate impact assessments relying on such data products.
The higher global extent of coastal lowland below 10, 5, and 2 m +MSL, determined by GLL_DTM_v1 compared to other GDEMs (Table 2), confirms that earlier radar-based GDEMs have underestimated lowland area because of higher apparent land surface elevation, caused at least in part by radar being unable to fully penetrate the vegetation canopy [8,16,17]. The difference between the sources is greatest at the lowest elevation range, below 2 m +MSL, because there the relative effect of vegetation and referencing inaccuracies in GDEMs may be most pronounced.
Of the four radar-based GDEMs assessed, TanDEM-X has the highest accuracy, as has also been found in other recent studies comparing TanDEM-X with SRTM and MERIT [17,50], but the error within 0.5 m over 37.9% of extent is still far below that of GLL_DTM_v1 at 83.4%.
The advantage of using satellite LiDAR data for creating DTMs is especially clear when considering densely vegetated areas. The lowlands of Papua and West Papua Provinces in Indonesia, for instance, that are still largely covered with forest, cover 29,180 km2 of land below 2 +MSL according to GLL_DTM_v1 (Figure 7), but only 10.0% of that (2911 km2) according to TanDEM-X, and 0.7–72.8% (215–21,233 km2) according to SRTM90 and derived products MERIT and CoastalDEM. Similarly, for the Amazon Delta, GLL_DTM_v1 finds 61,217 km2 of land below 2 m +MSL, but only 19.0% of that (11,626 km2) according to TanDEM-X, and 2.8–44.3% (1723–27,097 km2) according to the other three GDEMs. Where the radar-based GDEMs detect lowland in these areas, it is generally in gaps in the forest cover, as is clear in Figure 7. Of the GDEMs, MERIT best approaches the shape of lowland areas presented by GLL_DTM_v1 in Papua and Amazon Delta, but it presents a land surface that is several meters too high.
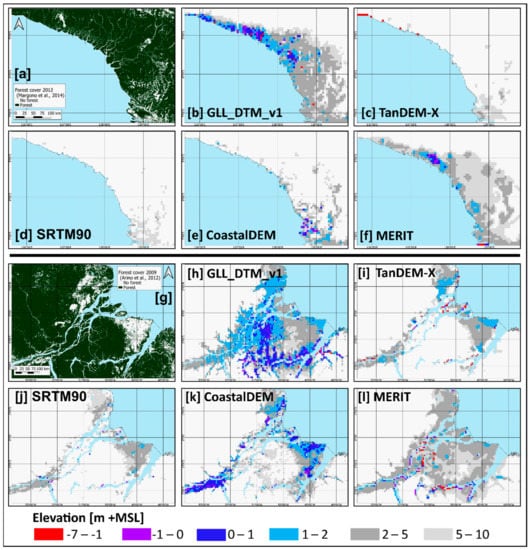
Figure 7.
Visual comparison of GLL_DTM_v1 and existing GDEMs for selected lowland areas in Papua Province in Indonesia (top) and Amazon Delta in Brazil (bottom). (a) forest cover in 2012 [51], (g) forest cover in 2009 [52], (b,h) GLL_DTM_v1, (c,i) TanDEM-X, (d,j) SRTM90, (e,k) CoastalDEM, and (f,l) MERIT.
4.2. Effect of Resolution on the Accuracy
To test the effect on the accuracy of aggregating data at 0.05-degree spatial resolution, we compare the result with that at the native (original to source) resolution. The distribution of differences between the GDEMs compared in this study and the three local DTMs at both native and 0.05-degree resolutions are shown in Figure 8. Similar to GLL_DTM_v1, the original ICESat-2 segment data have far higher accuracy than the other GDEMs compared to the three local DTMs with average differences ranging between −0.11 and 0.10 m and RMSE between 0.92 and 1.17 m (Table 3). These RMSE values are similar to the RMSE of 0.85 m found by Neuenschwander and Magruder [53] for ATL08 terrain heights when comparing an ICESat-2 track over vegetation in Finland with spatially coincident airborne LiDAR data.
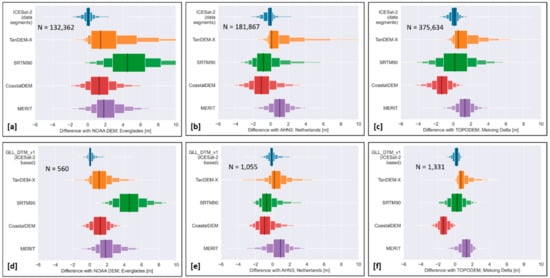
Figure 8.
Boxen plots [54] of difference between terrain height of ICESat-2 data segments, GDEMs (TanDEM-X, SRTM90, CoastalDEM, MERIT), and local DTMs at (a–c) native (90–100 m) spatial resolution and (d–f) resampled to 0.05-degree resolution. N = number of data points.
Table 3.
Accuracy of ICESat-2 data segments and existing GDEMs at native (90–100 m) spatial resolution for areas lower than 10 m +MSL (as determined from the local DTMs). Presented are mean elevation differences between the local DTM and ICESat-2 data segments and existing GDEMs as well as RMSE. Differences for SRTM90, MERIT, CoastalDEM, and TanDEM-X are computed only when coinciding with ICESat-2 data segments.
The tails of the boxen plots (Figure 8) show that outlier values occur in the original ICESat-2 data segments. This illustrates that direct interpolation between individual segments to generate a DTM would result in erroneous DTM cell values and that the impact of outlier values on the DTM is reduced by aggregating to larger cells.
From Figure 8, it is also clear that the GDEMs at native resolution all display much longer tails, i.e., contain more outlier values, than the ICESat-2 data. This confirms that the ICESat-2 LiDAR data is intrinsically more accurate than radar-based sources. Aggregated to 0.05-degree resolution in GLL_DTM_v1, the range of ICESat-2-based DTM difference values is several times smaller than that of any GDEM for any of the three local comparison areas.
4.3. Impact of DTM Accuracy on Flood Risk Assessments
An indication of the impact of differences between DTMs and GDEMs on assessing flood risk is obtained by demonstrating the depth of inundation that would occur if water levels are 2 m above current MSL (Figure 9). Where the local TOPODEM DTM and GLL_DTM_v1 yield limited land area with a flood depth more than 2 m, at 0.5% and 4.7% of the Mekong Delta extent, respectively, this is 24.8%, 1.8%, 79.1%, and 0.3% for SRTM90, MERIT, CoastalDEM, and TanDEM-X. Such large differences are meaningful to flood risk assessments as risk is not only determined from flood extent but also the depth of inundation. Flood depths of 2 m or more are generally considered life-threatening, whereas depths of 1 m or less will mostly damage infrastructure and crops.
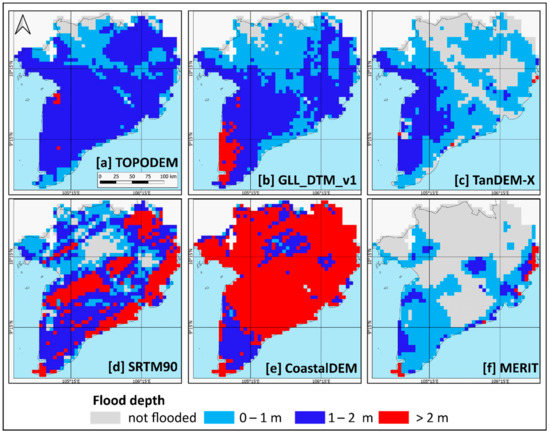
Figure 9.
Flood depth map with 2 m high water level applied to 6 elevation maps for the Mekong Delta. (a) TOPODEM, (b) GLL_DTM_v1, (c) TanDEM-X, (d) SRTM90, (e) CoastalDEM, (f) MERIT.
5. Conclusions
We show that satellite LiDAR data can yield a global lowland DTM that closely matches three local DTMs, across three continents, within 0.5 m over 83.4% of their area lower than 10 m +MSL, and far exceeds the accuracy of existing radar-based GDEMs below 10 m +MSL that are accurate within 0.5 m for 37.9% (TanDEM-X) at best. This confirms that satellite LiDAR data presents a way forward towards creating accurate global lowland DTMs that will be suitable for assessments of current and future flood risk and land management options.
We demonstrate that the availability of a more accurate global lowland DTM will have major implications for flood risk assessments, in terms of the extent and nature of land at the highest risk. The global land area below 2 m +MSL, often defined as land that is already inundated periodically, even without sea-level rise, is around 1 million square kilometers, which is equivalent to 25 times the land area of the Netherlands. This is more than is calculated using any other source and almost three times more than what is found using SRTM90 data that are used in most flood risk assessments to date.
The greatest underestimation of lowland extent by existing radar-based GDEMs occurs in remaining forested areas, such as Papua and Amazon Delta. With GLL_DTM_v1, it is possible to more accurately determine the societal, economic, and ecological risks of forest clearing for the development of agriculture or urban expansion in such areas.
The result presented here applies to a relatively coarse 0.05-degree (~5 × 5 km) resolution DTM, based on 19 months of ICESat-2 data collection. As additional satellite LiDAR will become available, from ICESat-2 and other sources, such as GEDI [55], it will be possible to further improve both the resolution and accuracy of DTMs, increasing usability in detailed assessments. However, for the application of identifying large lowland areas at the regional and global scale, the current resolution is appropriate.
We recommend a shift from radar-based DEMs to LiDAR-based DTMs for lowland areas. The GLL_DTM_v1 product can be downloaded from https://doi.org/10.17632/v5x4vpnzds.1. GLL_DTM updates at a higher resolution will be uploaded at this location.
Supplementary Materials
The following are available online at https://www.mdpi.com/2072-4292/12/17/2827/s1, Figure S1: Comparison of GLL_DTM_v1 and GDEMs with the local DTM for the Everglades, Figure S2: Comparison of GLL_DTM_V1 and GDEMs with the local DTM for the Netherlands.
Author Contributions
Conceptualization: R.V. and A.H.; methodology: R.V., A.H., and M.P.; data curation: R.V. and M.P.; formal analysis: R.V., A.H., and M.P.; writing—original draft: R.V. and A.H.; writing—review and editing: M.P.; visualization: R.V., A.H., and M.P. All authors have read and agreed to the published version of the manuscript.
Funding
This research received no external funding.
Acknowledgments
The idea to create GLL_DTM_v1 originated in discussions with Marcus Wishart, George Stirrett Wood, and Abedalrazq Khalil at the World Bank. We acknowledge the use of ICESat-2 data from the National Snow and Ice Data Center. Bregje van Wesenbeeck is gratefully acknowledged for constructive comments on an earlier version of the manuscript. We wish to thank the anonymous reviewers for their constructive and useful comments and suggestions that enabled us to improve the content of this paper.
Conflicts of Interest
The authors declare no conflict of interest.
Abbreviations
The following abbreviations are used in this manuscript:
| AHN3 | DTM of the Netherlands Version 3 (Dutch: Actueel Hoogtebestand Nederland) |
| ATLAS | Advanced Topographic Laser Altimetry System |
| CoastalDEM | Coastal Digital Elevation Model |
| DEM | Digital Elevation Model |
| DTM | Digital Terrain Model |
| EGM96 | Earth Gravitation Model 96 |
| GDEM | Global DEM |
| GEDI | Global Ecological Dynamics Investigation |
| GLL_DTM_v1 | Global LiDAR Lowland DTM Version 1 |
| ICESat-2 | Ice, Cloud, and Land Elevation Satellite-2 |
| IPCC | Intergovernmental Panel on Climate Change |
| LECZ | Low Elevation Coastal Zone |
| LiDAR | Light Detection And Ranging |
| MDT | Mean Dynamic Topography |
| MERIT | Multi-Error-Removed Improved-Terrain DEM |
| MSL | Mean Sea Level |
| NOAA | National Oceanic and Atmospheric Administration |
| RMSE | Root Mean Square Error |
| SRTM | Shuttle Radar Topography Mission |
| TanDEM-X | TerraSAR-X add-on for Digital Elevation Measurement |
References
- Schumann, G.J.-P.; Bates, P.D. The Need for a High-Accuracy, Open-Access Global DEM. Front. Earth Sci. 2018, 6, 225. [Google Scholar] [CrossRef]
- IPCC. Special Report on the Ocean and Cryosphere in a Changing Climate. In Summary for Policymakers; IPCC: Geneva, Switzerland, 2019. [Google Scholar]
- Brown, S.; Nicholls, R.J.; Lázár, A.N.; Hornby, D.D.; Hill, C.; Hazra, S.; Appeaning Addo, K.; Haque, A.; Caesar, J.; Tompkins, E.L. What are the implications of sea-level rise for a 1.5, 2 and 3 °C rise in global mean temperatures in the Ganges-Brahmaputra-Meghna and other vulnerable deltas? Reg. Environ. Chang. 2018, 18, 1829–1842. [Google Scholar] [CrossRef]
- Gebremichael, E.; Sultan, M.; Becker, R.; El Bastawesy, M.; Cherif, O.; Emil, M. Assessing Land Deformation and Sea Encroachment in the Nile Delta: A Radar Interferometric and Inundation Modeling Approach. J. Geophys. Res. Solid Earth 2018, 123, 3208–3224. [Google Scholar] [CrossRef]
- Jevrejeva, S.; Jackson, L.P.; Grinsted, A.; Lincke, D.; Marzeion, B. Flood damage costs under the sea level rise with warming of 1.5 °C and 2 °C. Environ. Res. Lett. 2018, 13, 074014. [Google Scholar] [CrossRef]
- Runting, R.K.; Lovelock, C.E.; Beyer, H.L.; Rhodes, J.R. Costs and Opportunities for Preserving Coastal Wetlands under Sea Level Rise: Preserving coastal wetlands under sea level rise. Conserv. Lett. 2017, 10, 49–57. [Google Scholar] [CrossRef]
- Schuerch, M.; Spencer, T.; Temmerman, S.; Kirwan, M.L.; Wolff, C.; Lincke, D.; McOwen, C.J.; Pickering, M.D.; Reef, R.; Vafeidis, A.T.; et al. Future response of global coastal wetlands to sea-level rise. Nature 2018, 561, 231–234. [Google Scholar] [CrossRef]
- Farr, T.G.; Rosen, P.A.; Caro, E.; Crippen, R.; Duren, R.; Hensley, S.; Kobrick, M.; Paller, M.; Rodriguez, E.; Roth, L.; et al. The Shuttle Radar Topography Mission. Rev. Geophys. 2007, 45, RG2004. [Google Scholar] [CrossRef]
- Miliaresis, G.C.; Paraschou, C.V.E. Vertical accuracy of the SRTM DTED level 1 of Crete. Int. J. Appl. Earth Obs. Geoinf. 2005, 7, 49–59. [Google Scholar] [CrossRef]
- Gorokhovich, Y.; Voustianiouk, A. Accuracy assessment of the processed SRTM-based elevation data by CGIAR using field data from USA and Thailand and its relation to the terrain characteristics. Remote Sens. Environ. 2006, 104, 409–415. [Google Scholar] [CrossRef]
- Weydahl, D.J.; Sagstuen, J.; Dick, Ø.B.; Rønning, H. SRTM DEM accuracy assessment over vegetated areas in Norway. Int. J. Remote Sens. 2007, 28, 3513–3527. [Google Scholar] [CrossRef]
- Mouratidis, A.; Ampatzidis, D. European Digital Elevation Model Validation against Extensive Global Navigation Satellite Systems Data and Comparison with SRTM DEM and ASTER GDEM in Central Macedonia (Greece). ISPRS Int. J. Geo Inf. 2019, 8, 108. [Google Scholar] [CrossRef]
- Mouratidis, A.; Briole, P.; Katsambalos, K. SRTM 3″ DEM (versions 1, 2, 3, 4) validation by means of extensive kinematic GPS measurements: A case study from North Greece. Int. J. Remote Sens. 2010, 31, 6205–6222. [Google Scholar] [CrossRef]
- Mukul, M.; Srivastava, V.; Jade, S.; Mukul, M. Uncertainties in the Shuttle Radar Topography Mission (SRTM) Heights: Insights from the Indian Himalaya and Peninsula. Sci. Rep. 2017, 7, 41672. [Google Scholar] [CrossRef]
- Rizzoli, P.; Martone, M.; Gonzalez, C.; Wecklich, C.; Borla Tridon, D.; Bräutigam, B.; Bachmann, M.; Schulze, D.; Fritz, T.; Huber, M.; et al. Generation and performance assessment of the global TanDEM-X digital elevation model. ISPRS J. Photogramm. Remote Sens. 2017, 132, 119–139. [Google Scholar] [CrossRef]
- LaLonde, T.; Shortridge, A.; Messina, J. The Influence of Land Cover on Shuttle Radar Topography Mission (SRTM) Elevations in Low-relief Areas: Influence of Land Cover on SRTM Elevations. Trans. GIS 2010, 14, 461–479. [Google Scholar] [CrossRef]
- Hawker, L.; Neal, J.; Bates, P. Accuracy assessment of the TanDEM-X 90 Digital Elevation Model for selected floodplain sites. Remote Sens. Environ. 2019, 232, 111319. [Google Scholar] [CrossRef]
- Carabajal, C.C.; Harding, D.J. SRTM C-Band and ICESat Laser Altimetry Elevation Comparisons as a Function of Tree Cover and Relief. Photogramm. Eng. Remote Sens. 2006, 72, 287–298. [Google Scholar] [CrossRef]
- Minderhoud, P.S.J.; Coumou, L.; Erkens, G.; Middelkoop, H.; Stouthamer, E. Mekong delta much lower than previously assumed in sea-level rise impact assessments. Nat. Commun. 2019, 10, 3847. [Google Scholar] [CrossRef]
- Griffin, J.; Latief, H.; Kongko, W.; Harig, S.; Horspool, N.; Hanung, R.; Rojali, A.; Maher, N.; Fuchs, A.; Hossen, J.; et al. An evaluation of onshore digital elevation models for modeling tsunami inundation zones. Front. Earth Sci. 2015, 3. [Google Scholar] [CrossRef]
- Kulp, S.; Strauss, B.H. Global DEM Errors Underpredict Coastal Vulnerability to Sea Level Rise and Flooding. Front. Earth Sci. 2016, 4. [Google Scholar] [CrossRef]
- Van de Sande, B.; Lansen, J.; Hoyng, C. Sensitivity of Coastal Flood Risk Assessments to Digital Elevation Models. Water 2012, 4, 568–579. [Google Scholar] [CrossRef]
- Smith, A.; Sampson, C.; Neal, J.; Bates, P.D.; Trigg, M.; Freer, J.; Porter, R.; Kappes, M.; Simpson, A.; Jongman, B.; et al. Modeling and Mapping of Global Flood Hazard Layers. In Geophysical Monograph Series; Schumann, G.J.-P., Bates, P.D., Apel, H., Aronica, G.T., Eds.; John Wiley & Sons Inc.: Hoboken, NJ, USA, 2018; pp. 131–155. ISBN 978-1-119-21788-6. [Google Scholar]
- Hodgson, M.E.; Bresnahan, P. Accuracy of Airborne Lidar-Derived Elevation. Photogram. Eng. Remote Sens. 2004, 70, 331–339. [Google Scholar] [CrossRef]
- Vernimmen, R.; Hooijer, A.; Yuherdha, A.T.; Visser, M.; Pronk, M.; Eilander, D.; Akmalia, R.; Fitranatanegara, N.; Mulyadi, D.; Andreas, H.; et al. Creating a Lowland and Peatland Landscape Digital Terrain Model (DTM) from Interpolated Partial Coverage LiDAR Data for Central Kalimantan and East Sumatra, Indonesia. Remote Sens. 2019, 11, 1152. [Google Scholar] [CrossRef]
- Adams, J.; Chandler, J. Evaluation of Lidar and Medium Scale Photogrammetry for Detecting Soft-Cliff Coastal Change. Photogramm. Rec. 2002, 17, 405–418. [Google Scholar] [CrossRef]
- Neuenschwander, A.; Pitts, K. The ATL08 land and vegetation product for the ICESat-2 Mission. Remote Sens. Environ. 2019, 221, 247–259. [Google Scholar] [CrossRef]
- Markus, T.; Neumann, T.; Martino, A.; Abdalati, W.; Brunt, K.; Csatho, B.; Farrell, S.; Fricker, H.; Gardner, A.; Harding, D.; et al. The Ice, Cloud, and land Elevation Satellite-2 (ICESat-2): Science requirements, concept, and implementation. Remote Sens. Environ. 2017, 190, 260–273. [Google Scholar] [CrossRef]
- McGranahan, G.; Balk, D.; Anderson, B. The rising tide: Assessing the risks of climate change and human settlements in low elevation coastal zones. Environ. Urban 2007, 19, 17–37. [Google Scholar] [CrossRef]
- Gesch, D.B. Best Practices for Elevation-Based Assessments of Sea-Level Rise and Coastal Flooding Exposure. Front. Earth Sci. 2018, 6, 230. [Google Scholar] [CrossRef]
- Syvitski, J.P.M.; Kettner, A.J.; Overeem, I.; Hutton, E.W.H.; Hannon, M.T.; Brakenridge, G.R.; Day, J.; Vörösmarty, C.; Saito, Y.; Giosan, L.; et al. Sinking deltas due to human activities. Nat. Geosci. 2009, 2, 681–686. [Google Scholar] [CrossRef]
- LP DAAC NASA Shuttle Radar Topography Mission Water Body Data Shapefiles and Raster Files v003 2019. Available online: https://lpdaac.usgs.gov/products/srtmswbdv003/ (accessed on 27 July 2020). [CrossRef]
- Neuenschwander, A.; Popescu, S.; Nelson, R.; Harding, D.; Pitts, K.; Robbins, J. ATLAS/ICESat-2 L3A Land and Vegetation Height, Version 2. ATL08 Data ProductBoulder, Colorado USANSIDC: National Snow and Ice Data Center. 2019. Available online: https://doi.org/10.5067/ATLAS/ATL08.002 (accessed on 3 January 2020).
- NOAA. Available online: https://coast.noaa.gov/htdata/raster2/elevation/SLR_viewer_DEM_6230/FL/FL_MFL_dems/ (accessed on 23 March 2020).
- AHN. 2019. Available online: https://www.ahn.nl (accessed on 27 July 2020).
- PDOK AHN3 Downloads 2019. Available online: https://downloads.pdok.nl/ahn3-downloadpage/ (accessed on 27 July 2020).
- Minderhoud, P.; Coumou, L.; Erkens, G.; Middelkoop, H.; Stouthamer, E. Digital elevation model of the Vietnamese Mekong delta based on elevation points from a national topographical map, supplement to: Minderhoud, Philip; Coumou, Laura; Erkens, Gilles; Middelkoop, Hans; Stouthamer, Esther (2019): Mekong delta much lower than previously assumed in sea-level rise impact assessments. Nat. Commun. 2019, 10, 3847. [Google Scholar]
- Koks, E.E.; Rozenberg, J.; Zorn, C.; Tariverdi, M.; Vousdoukas, M.; Fraser, S.A.; Hall, J.W.; Hallegatte, S. A global multi-hazard risk analysis of road and railway infrastructure assets. Nat. Commun. 2019, 10, 2677. [Google Scholar] [CrossRef] [PubMed]
- Kulp, S.A.; Strauss, B.H. New elevation data triple estimates of global vulnerability to sea-level rise and coastal flooding. Nat. Commun. 2019, 10, 4844. [Google Scholar] [CrossRef]
- Zhang, K.; Gann, D.; Ross, M.; Robertson, Q.; Sarmiento, J.; Santana, S.; Rhome, J.; Fritz, C. Accuracy assessment of ASTER, SRTM, ALOS, and TDX DEMs for Hispaniola and implications for mapping vulnerability to coastal flooding. Remote Sens. Environ. 2019, 225, 290–306. [Google Scholar] [CrossRef]
- Jarvis, A.; Reuter, H.; Nelson, A.; Guevara, E. Hole-Filled SRTM for the Globe Version 4. 2008. Available online: http://srtm.csi.cgiar.org (accessed on 23 March 2020).
- Yamazaki, D.; Ikeshima, D.; Tawatari, R.; Yamaguchi, T.; O’Loughlin, F.; Neal, J.C.; Sampson, C.C.; Kanae, S.; Bates, P.D. A high-accuracy map of global terrain elevations: Accurate Global Terrain Elevation map. Geophys. Res. Lett. 2017, 44, 5844–5853. [Google Scholar] [CrossRef]
- Kulp, S.A.; Strauss, B.H. CoastalDEM: A global coastal digital elevation model improved from SRTM using a neural network. Remote Sens. Environ. 2018, 206, 231–239. [Google Scholar] [CrossRef]
- NOAA GEOID12B 2014. Available online: https://www.ngs.noaa.gov/GEOID/GEOID12B/ (accessed on 27 July 2020).
- Parker, B.; Milbert, D.; Hess, K.; Gill, S. National VDATUM—The Implementation Of A National Vertical Datum Transformation Database. In Proceedings of the US Hydrographic Conference, Biloxi, MS, USA, 24–27 March 2003. [Google Scholar]
- NSGI RDNAPTRANSTM2018. 2018. Available online: https://www.nsgi.nl/geodetische-infrastructuur/producten/coordinatentransformatie (accessed on 27 July 2020).
- Rio, M.-H.; Mulet, S.; Picot, N. Beyond GOCE for the ocean circulation estimate: Synergetic use of altimetry, gravimetry, and in situ data provides new insight into geostrophic and Ekman currents: Ocean circulation beyond GOCE. Geophys. Res. Lett. 2014, 41, 8918–8925. [Google Scholar] [CrossRef]
- Brodzik, M.J.; Billingsley, B.; Haran, T.; Raup, B.; Savoie, M.H. EASE-Grid 2.0: Incremental but Significant Improvements for Earth-Gridded Data Sets. ISPRS Int. J. Geo Inf. 2012, 1, 32–45. [Google Scholar] [CrossRef]
- Brodzik, M.; Billingsley, B.; Haran, T.; Raup, B.; Savoie, M. Correction: Brodzik, M.J., et al. EASE-Grid 2.0: Incremental but Significant Improvements for Earth-Gridded Data Sets. ISPRS Int. J. Geo-Inf. 2014, 3, 1154–1156. [Google Scholar] [CrossRef]
- Vassilaki, D.I.; Stamos, A.A. TanDEM-X DEM: Comparative performance review employing LIDAR data and DSMs. ISPRS J. Photogramm. Remote Sens. 2020, 160, 33–50. [Google Scholar] [CrossRef]
- Margono, B.A.; Potapov, P.V.; Turubanova, S.; Stolle, F.; Hansen, M.C. Primary forest cover loss in Indonesia over 2000–2012. Nat. Clim. Chang. 2014, 4, 730–735. [Google Scholar] [CrossRef]
- Arino, O.; Ramos Perez, J.J.; Kalogirou, V.; Bontemps, S.; Defourny, P.; Van Bogaert, E. Global Land Cover Map for 2009 (GlobCover 2009). European Space Agency (ESA) & Université Catholique de Louvain (UCL), PANGAEA. 2012. Available online: https://doi.pangaea.de/10.1594/PANGAEA.787668 (accessed on 27 July 2020).
- Neuenschwander, A.L.; Magruder, L.A. Canopy and Terrain Height Retrievals with ICESat-2: A First Look. Remote Sens. 2019, 11, 1721. [Google Scholar] [CrossRef]
- Hofmann, H.; Wickham, H.; Kafadar, K. Letter-Value Plots: Boxplots for Large Data. J. Comput. Graph. Stat. 2017, 26, 469–477. [Google Scholar] [CrossRef]
- Stysley, P.R.; Coyle, D.B.; Clarke, G.B.; Frese, E.; Blalock, G.; Morey, P.; Kay, R.B.; Poulios, D.; Hersh, M. Laser Production for NASA’s Global Ecosystem Dynamics Investigation (GEDI) Lidar; Turner, M.D., Kamerman, G.W., Eds.; International Society for Optics and Photonics: Baltimore, MD, USA, 2016; p. 983207. [Google Scholar]


© 2020 by the authors. Licensee MDPI, Basel, Switzerland. This article is an open access article distributed under the terms and conditions of the Creative Commons Attribution (CC BY) license (http://creativecommons.org/licenses/by/4.0/).