Sensitivity Analysis and Validation of Daytime and Nighttime Land Surface Temperature Retrievals from Landsat 8 Using Different Algorithms and Emissivity Models


Abstract

1. Introduction
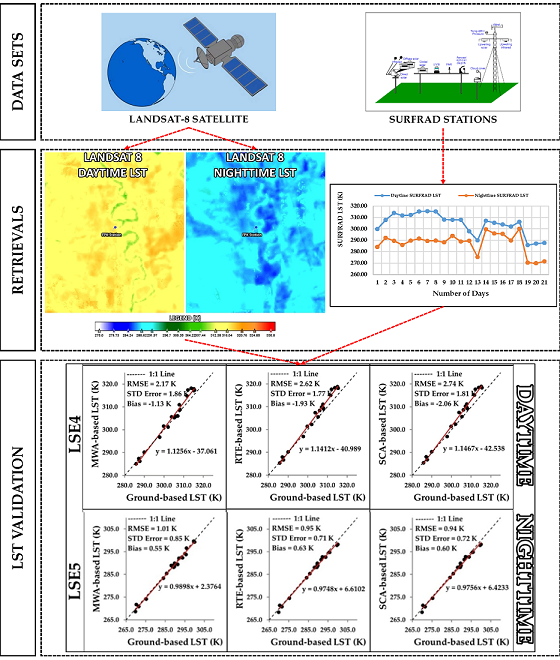
2. Datasets
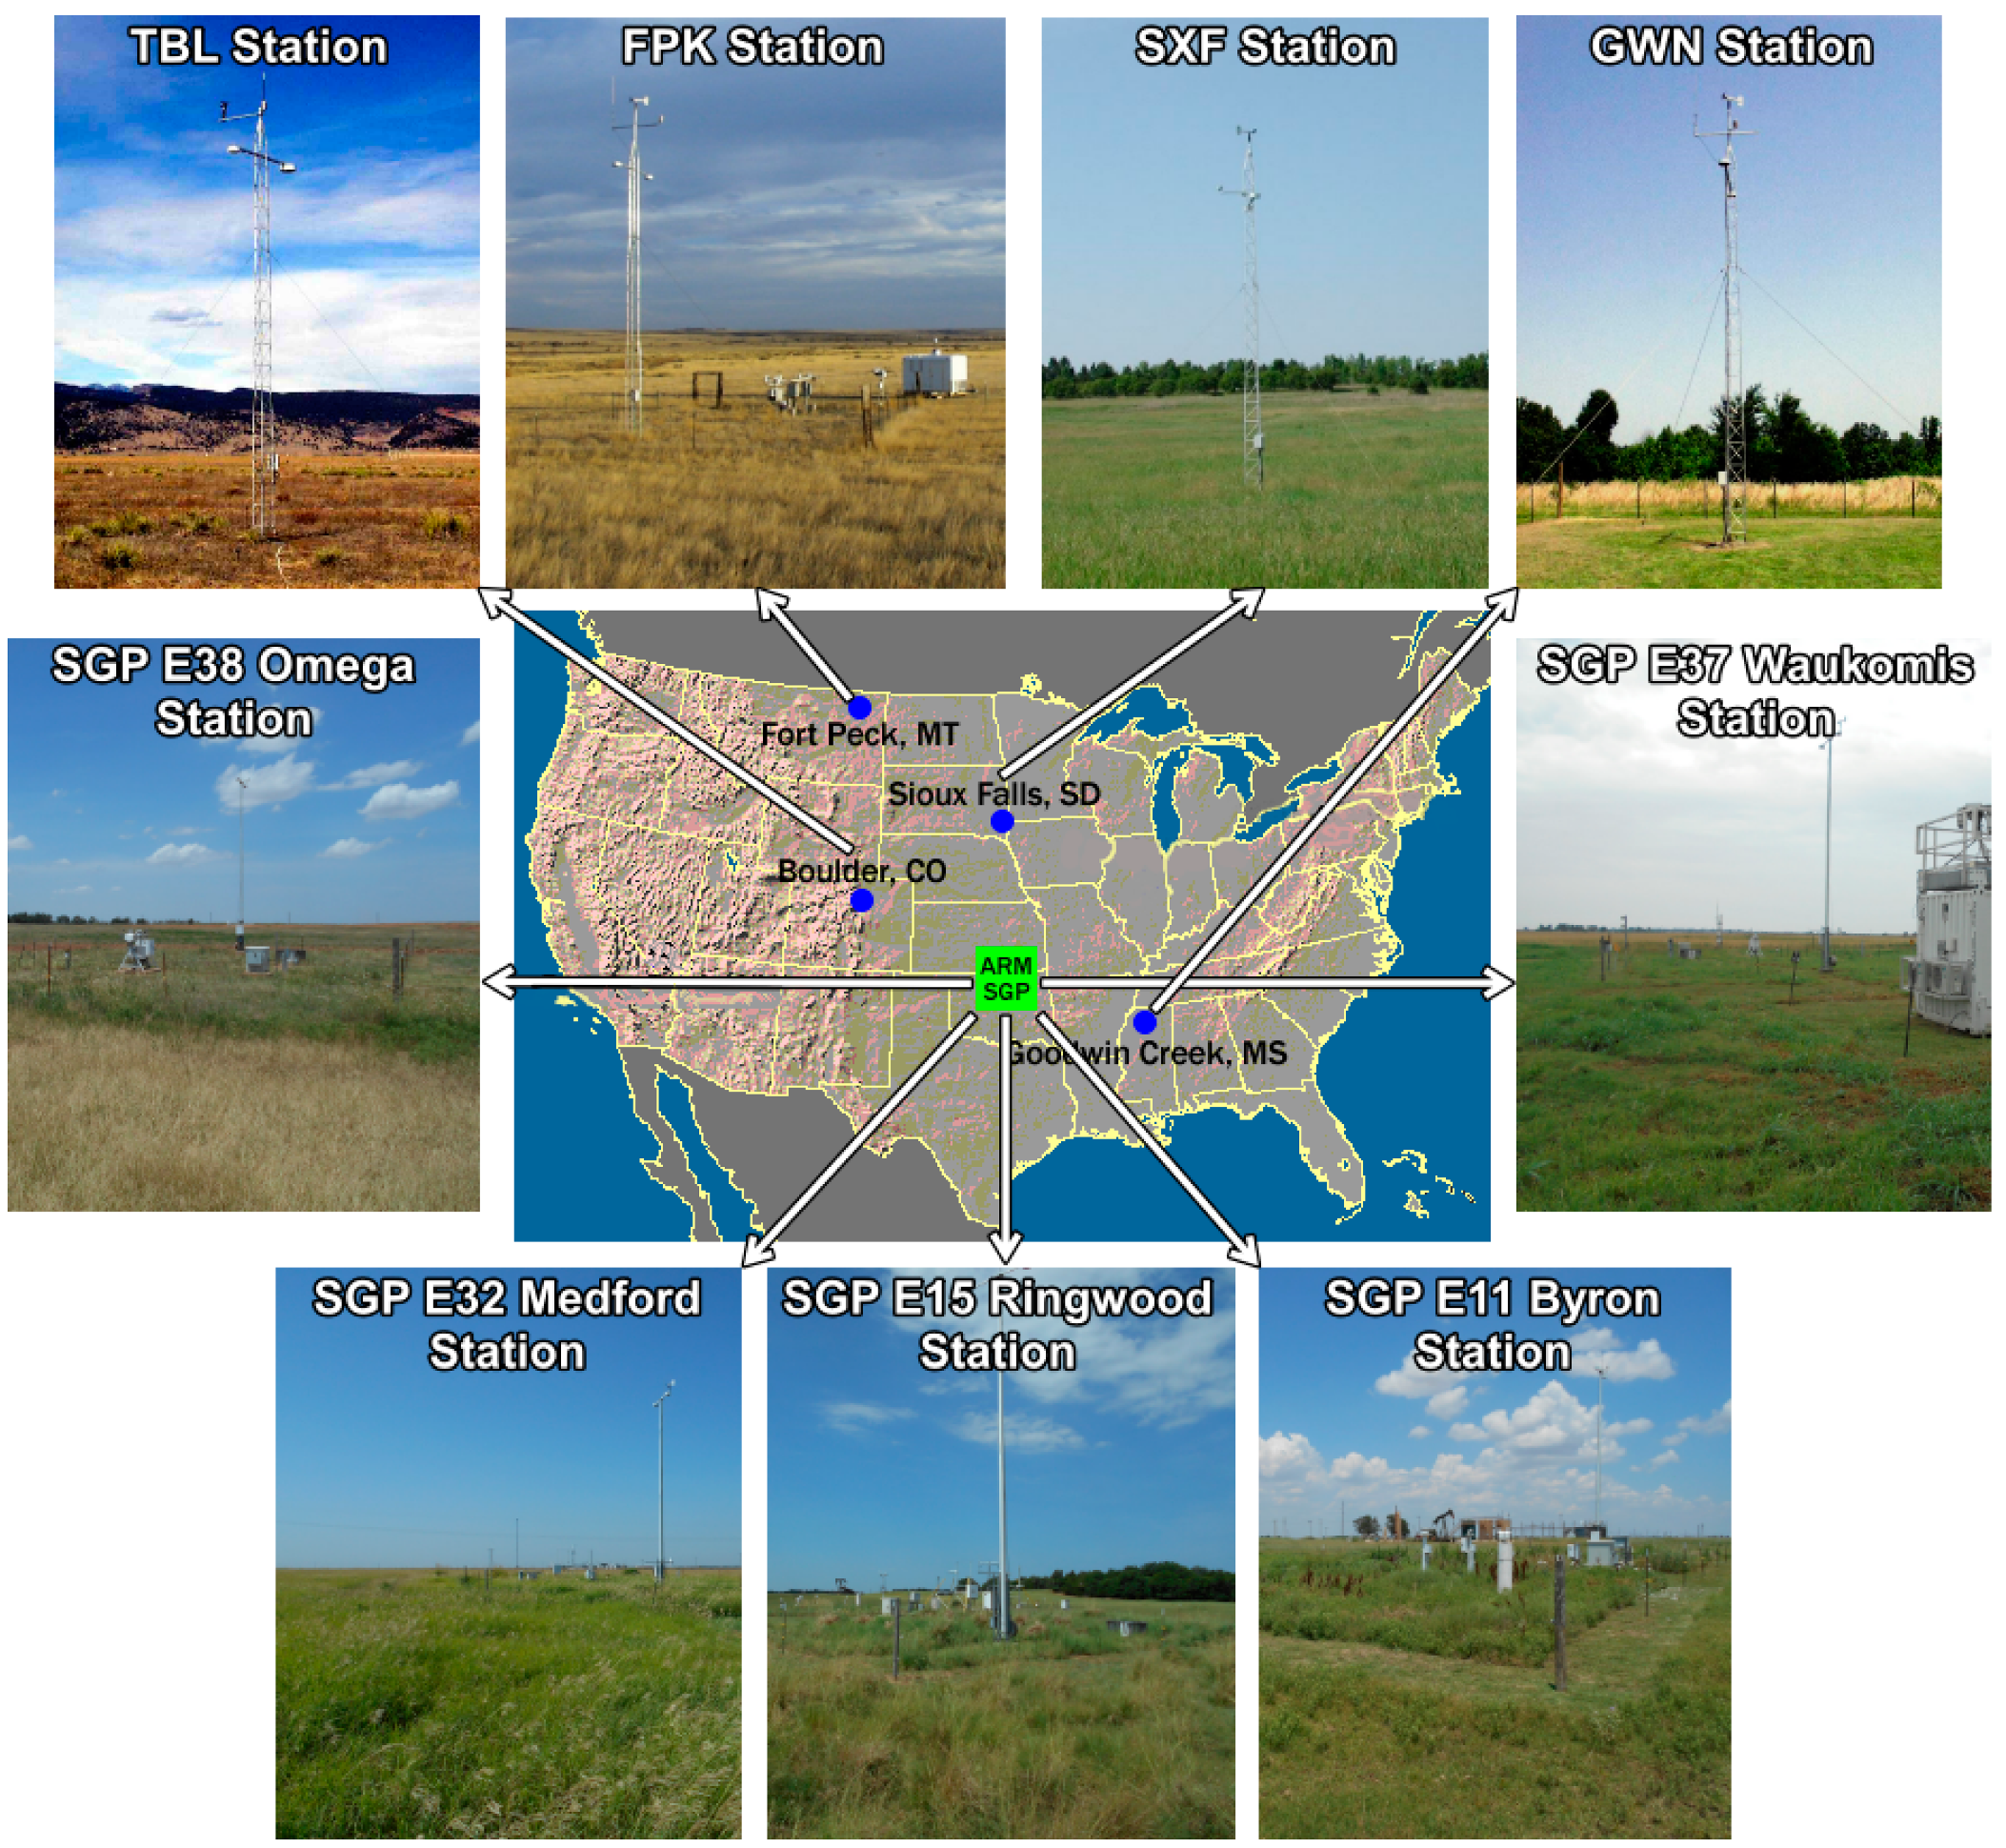
2.1. In-Situ LST Measurements and Validation Sites
2.2. Satellite Data
3. Methodologies
3.1. Satellite LST Retrieval Methods
3.1.1. Brightness Temperature (Tb) Calculation
3.1.2. Radiative Transfer Equation Method
3.1.3. Mono Window Algorithm
3.1.4. Single-Channel Algorithm
3.2. NDVI-Based Land Surface Emissivity (LSE) Models
3.3. In-Situ LST Estimation
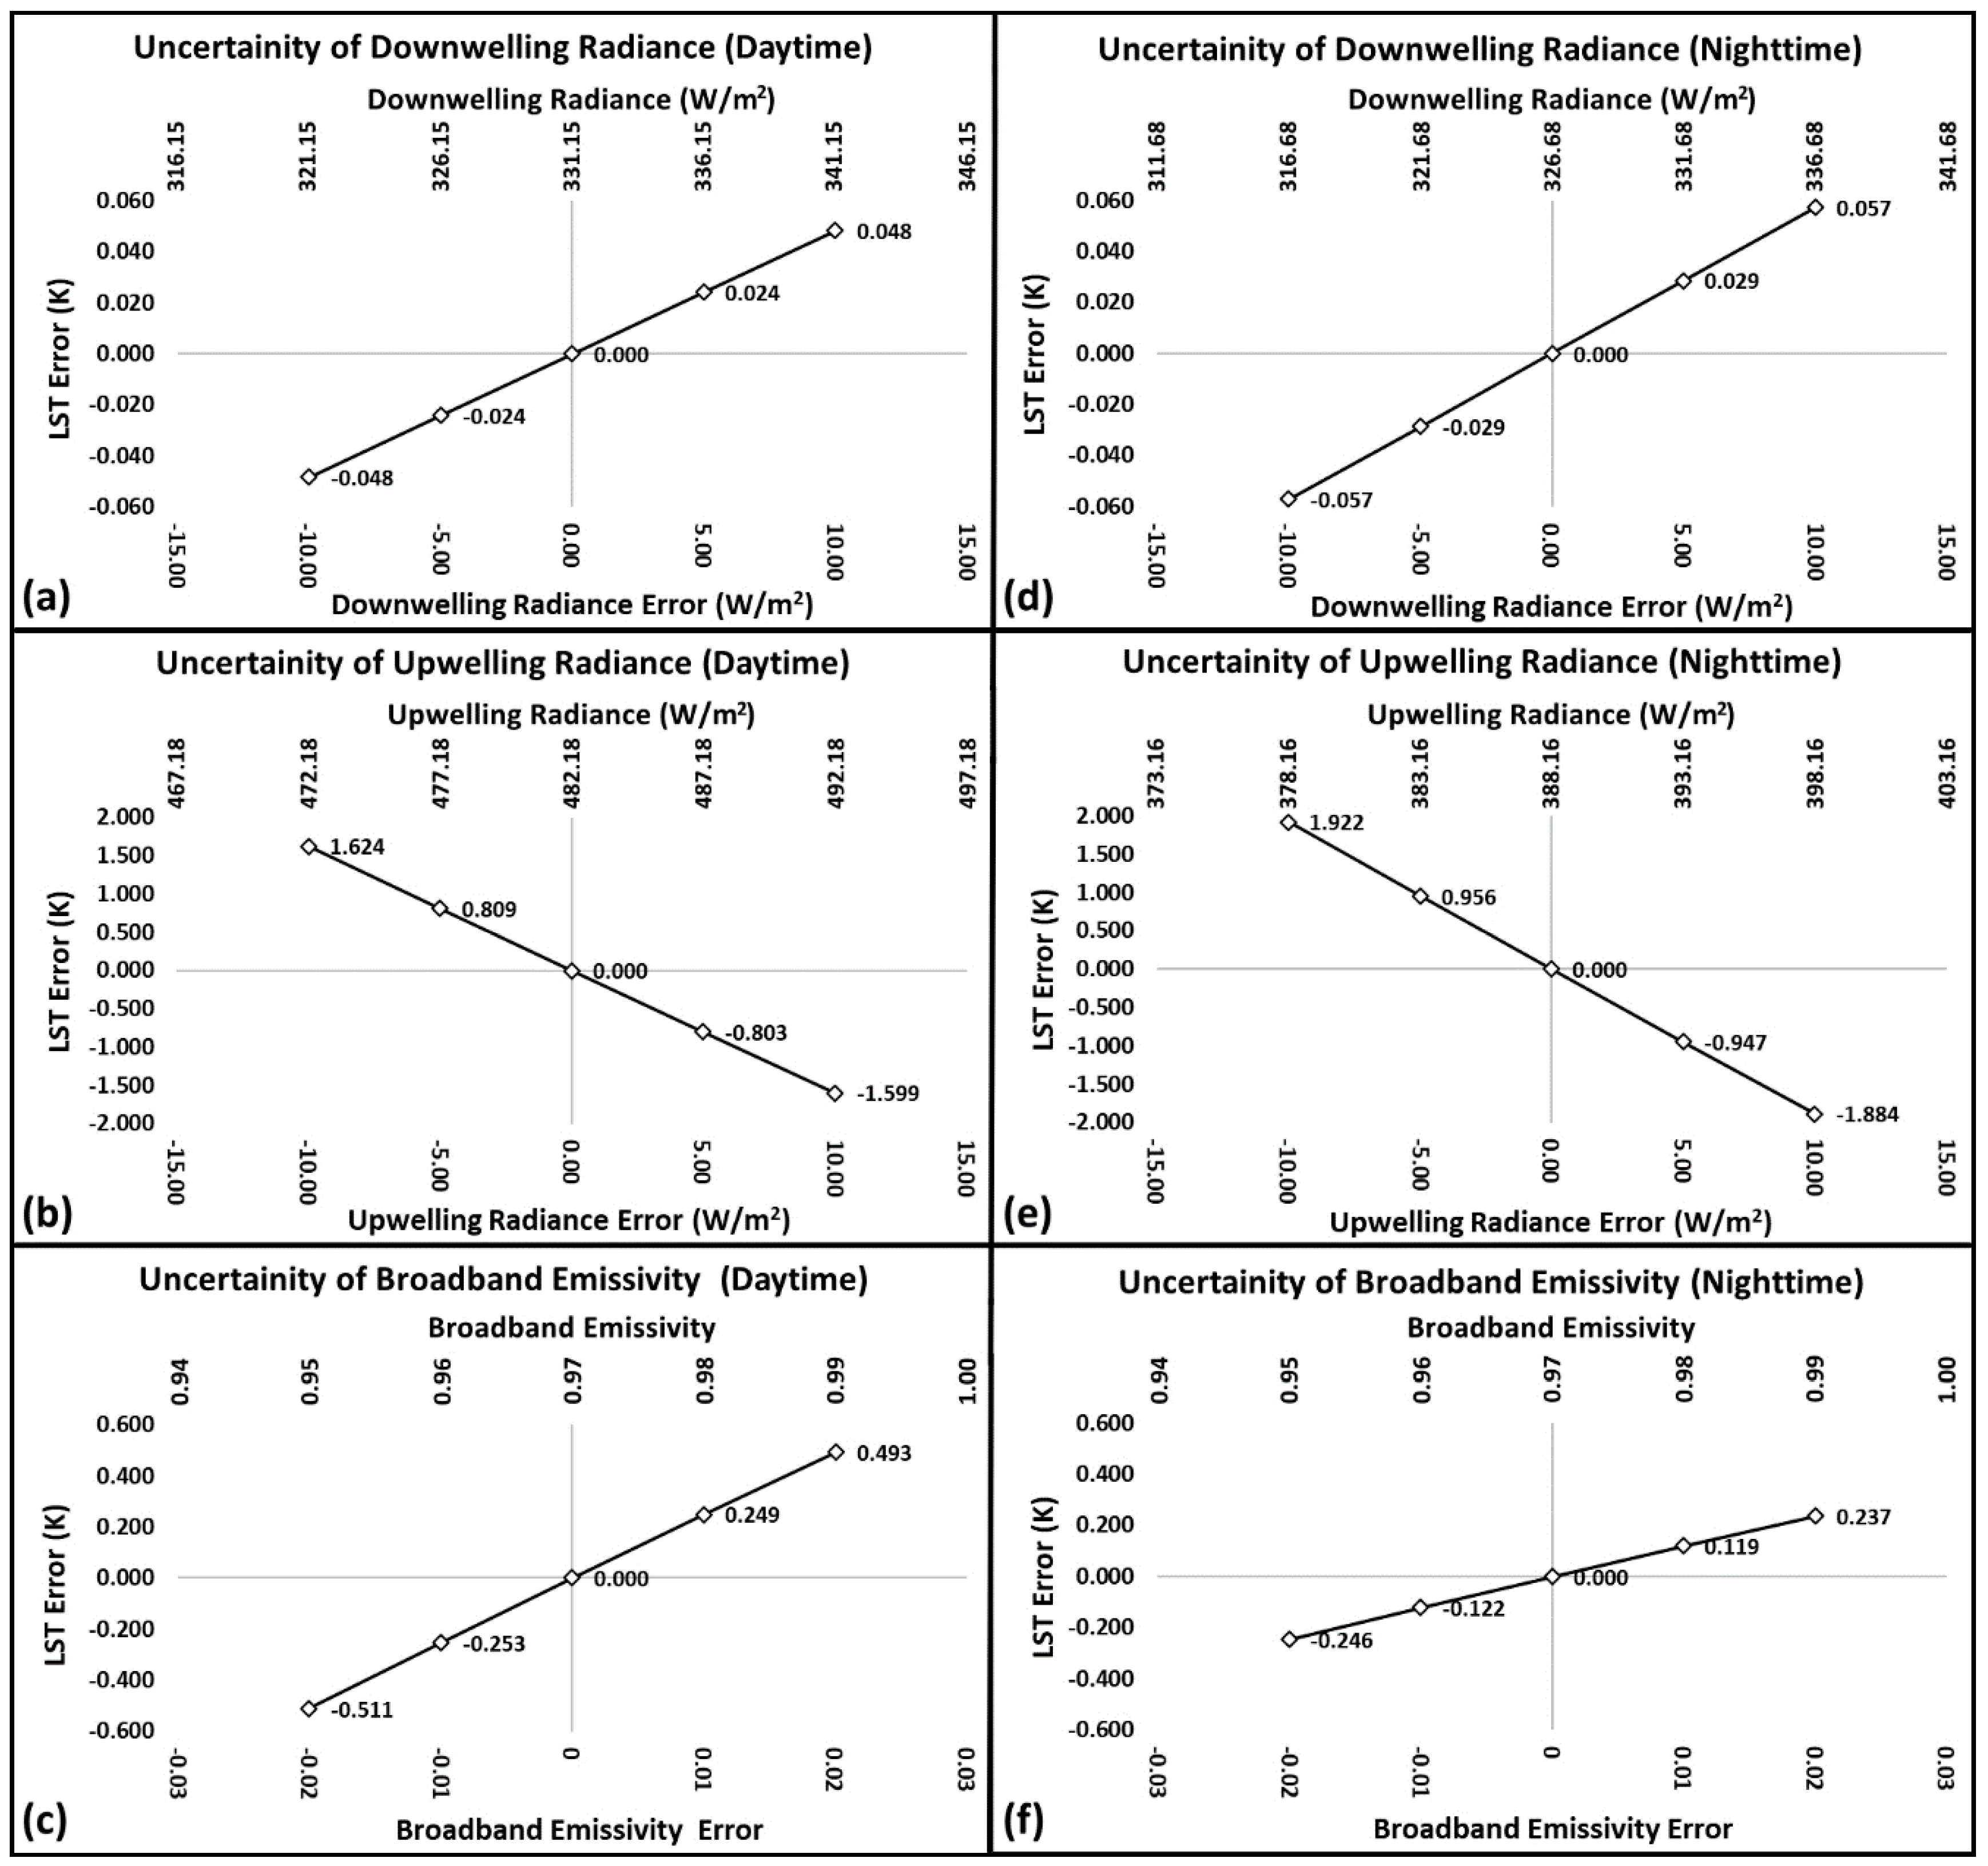
3.4. Sensitivity Analysis of In-Situ LST Measurements and LST Retrieval Methods
3.5. Temperature-Based (T-Based) Validation Method and Performance Metrics
4. Results
4.1. Sensitivity Results of In-Situ LST Measurements
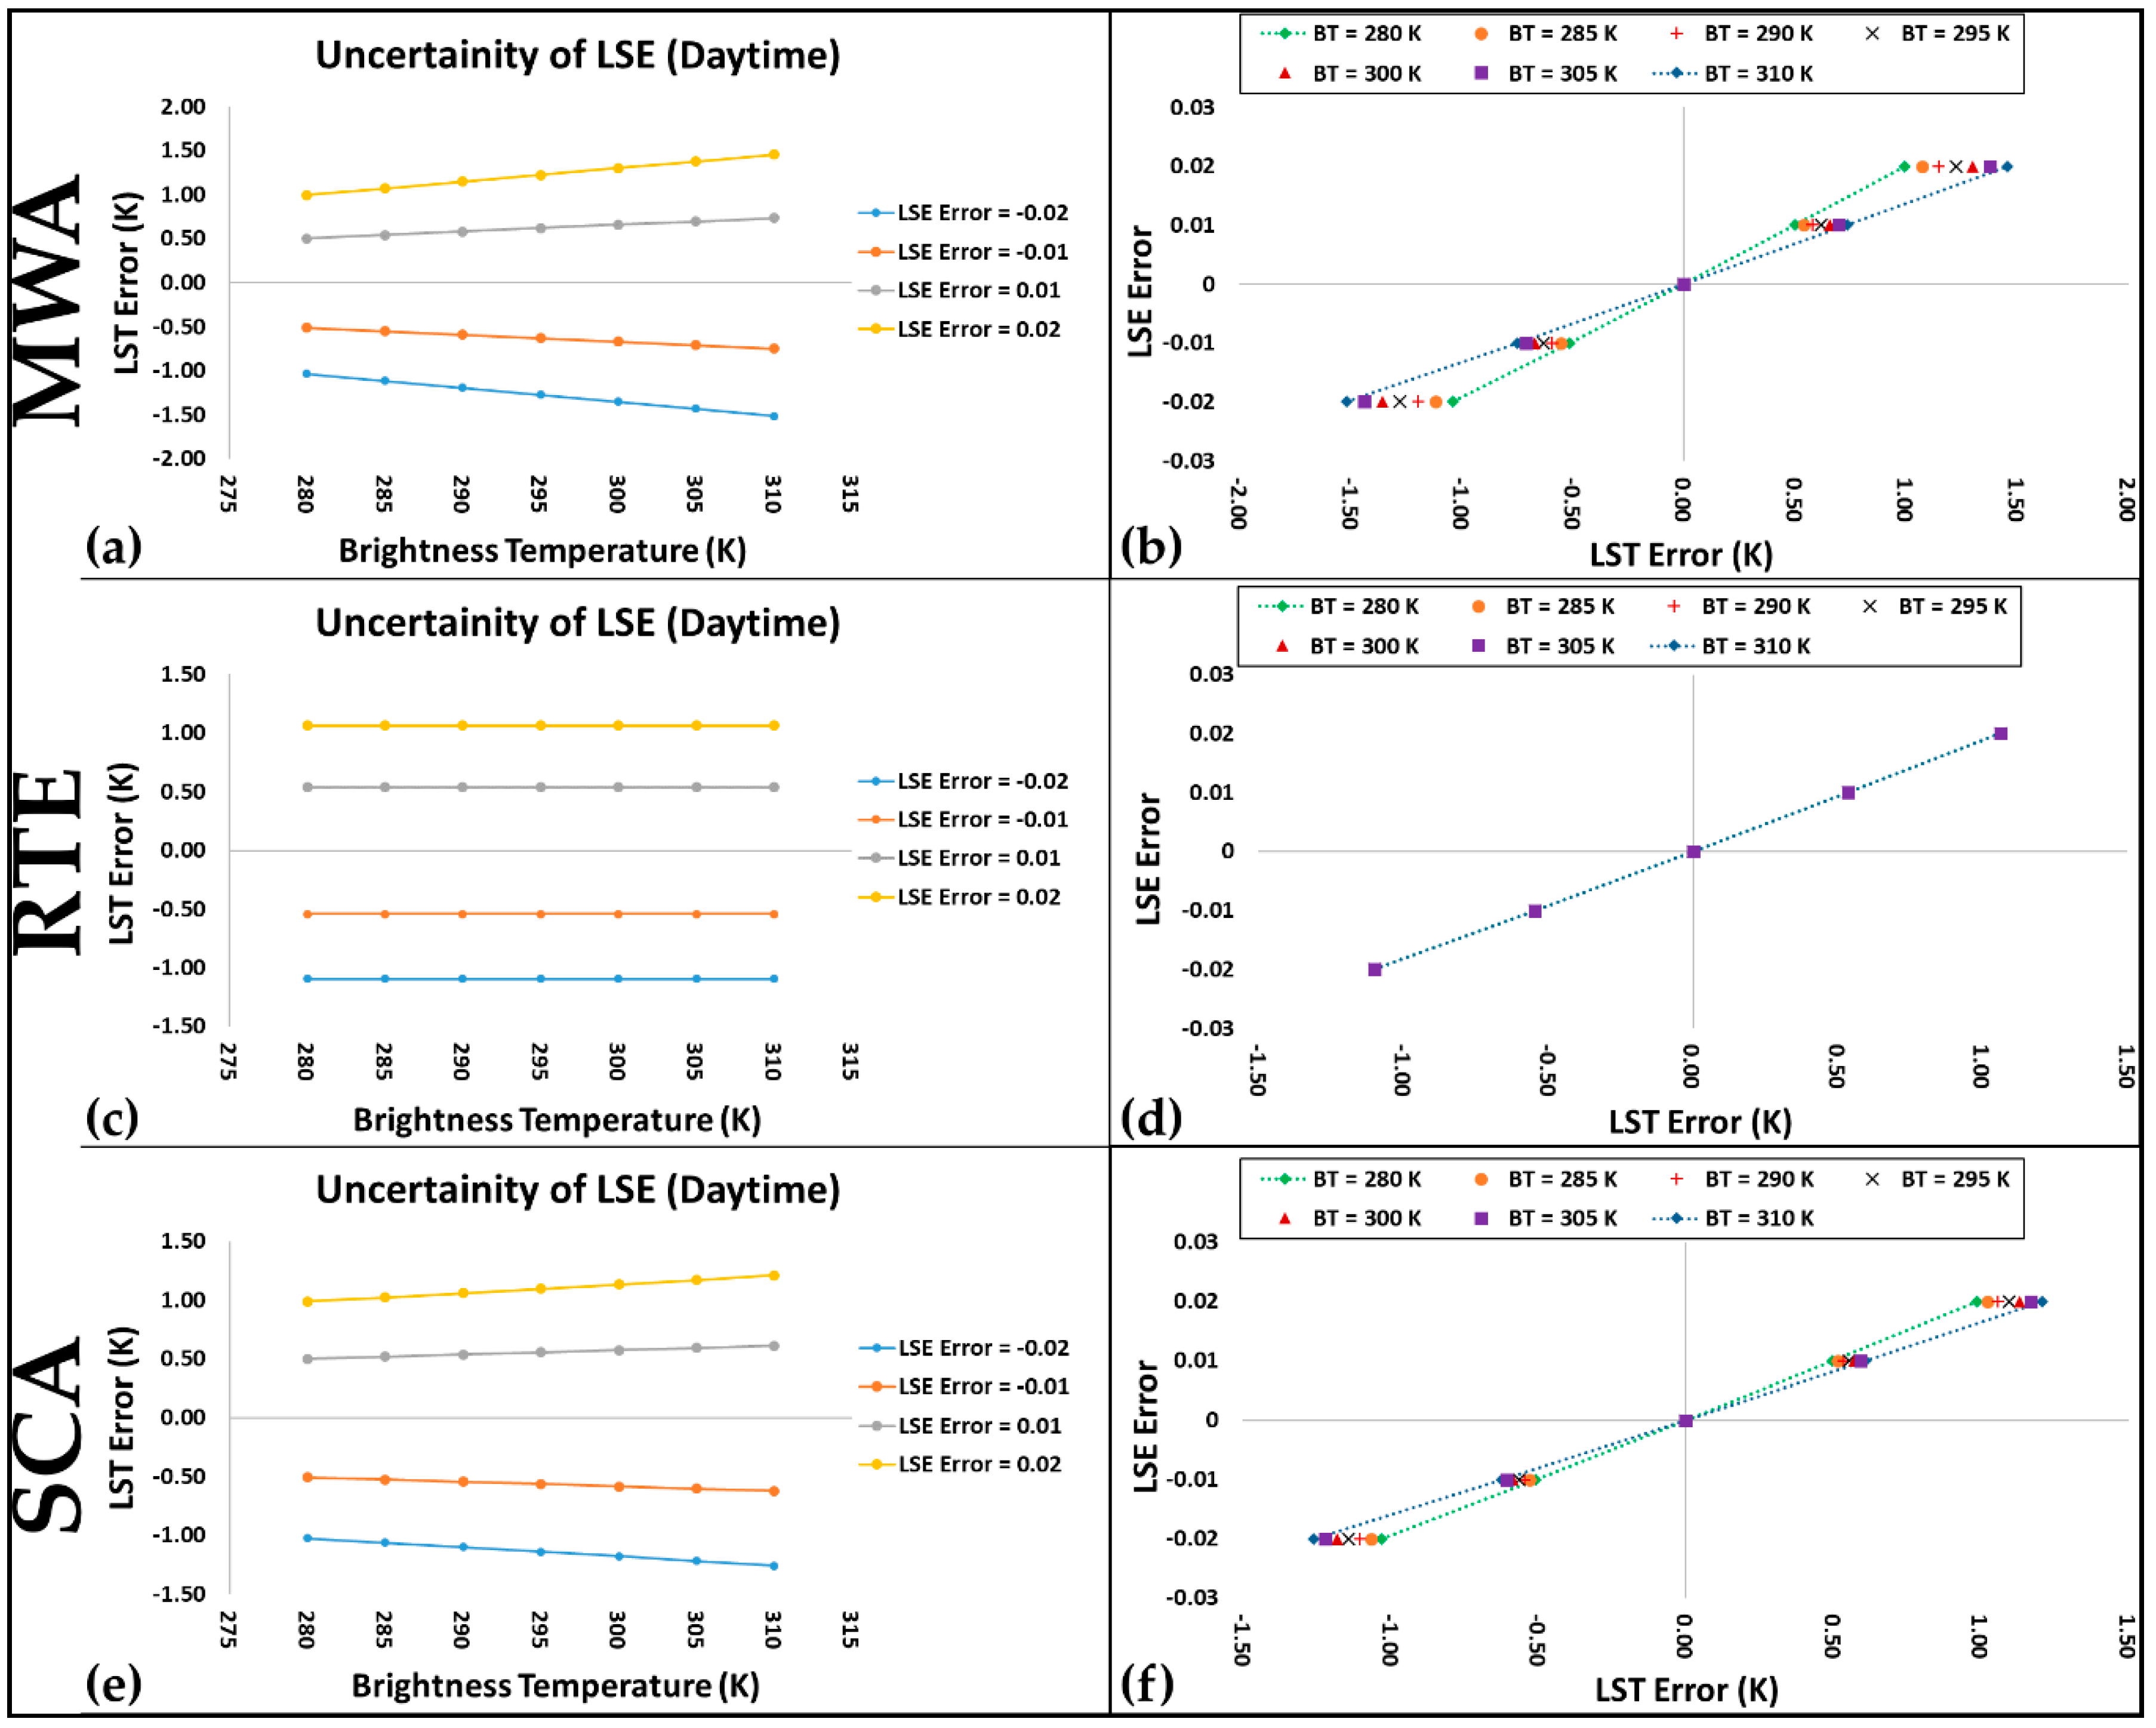
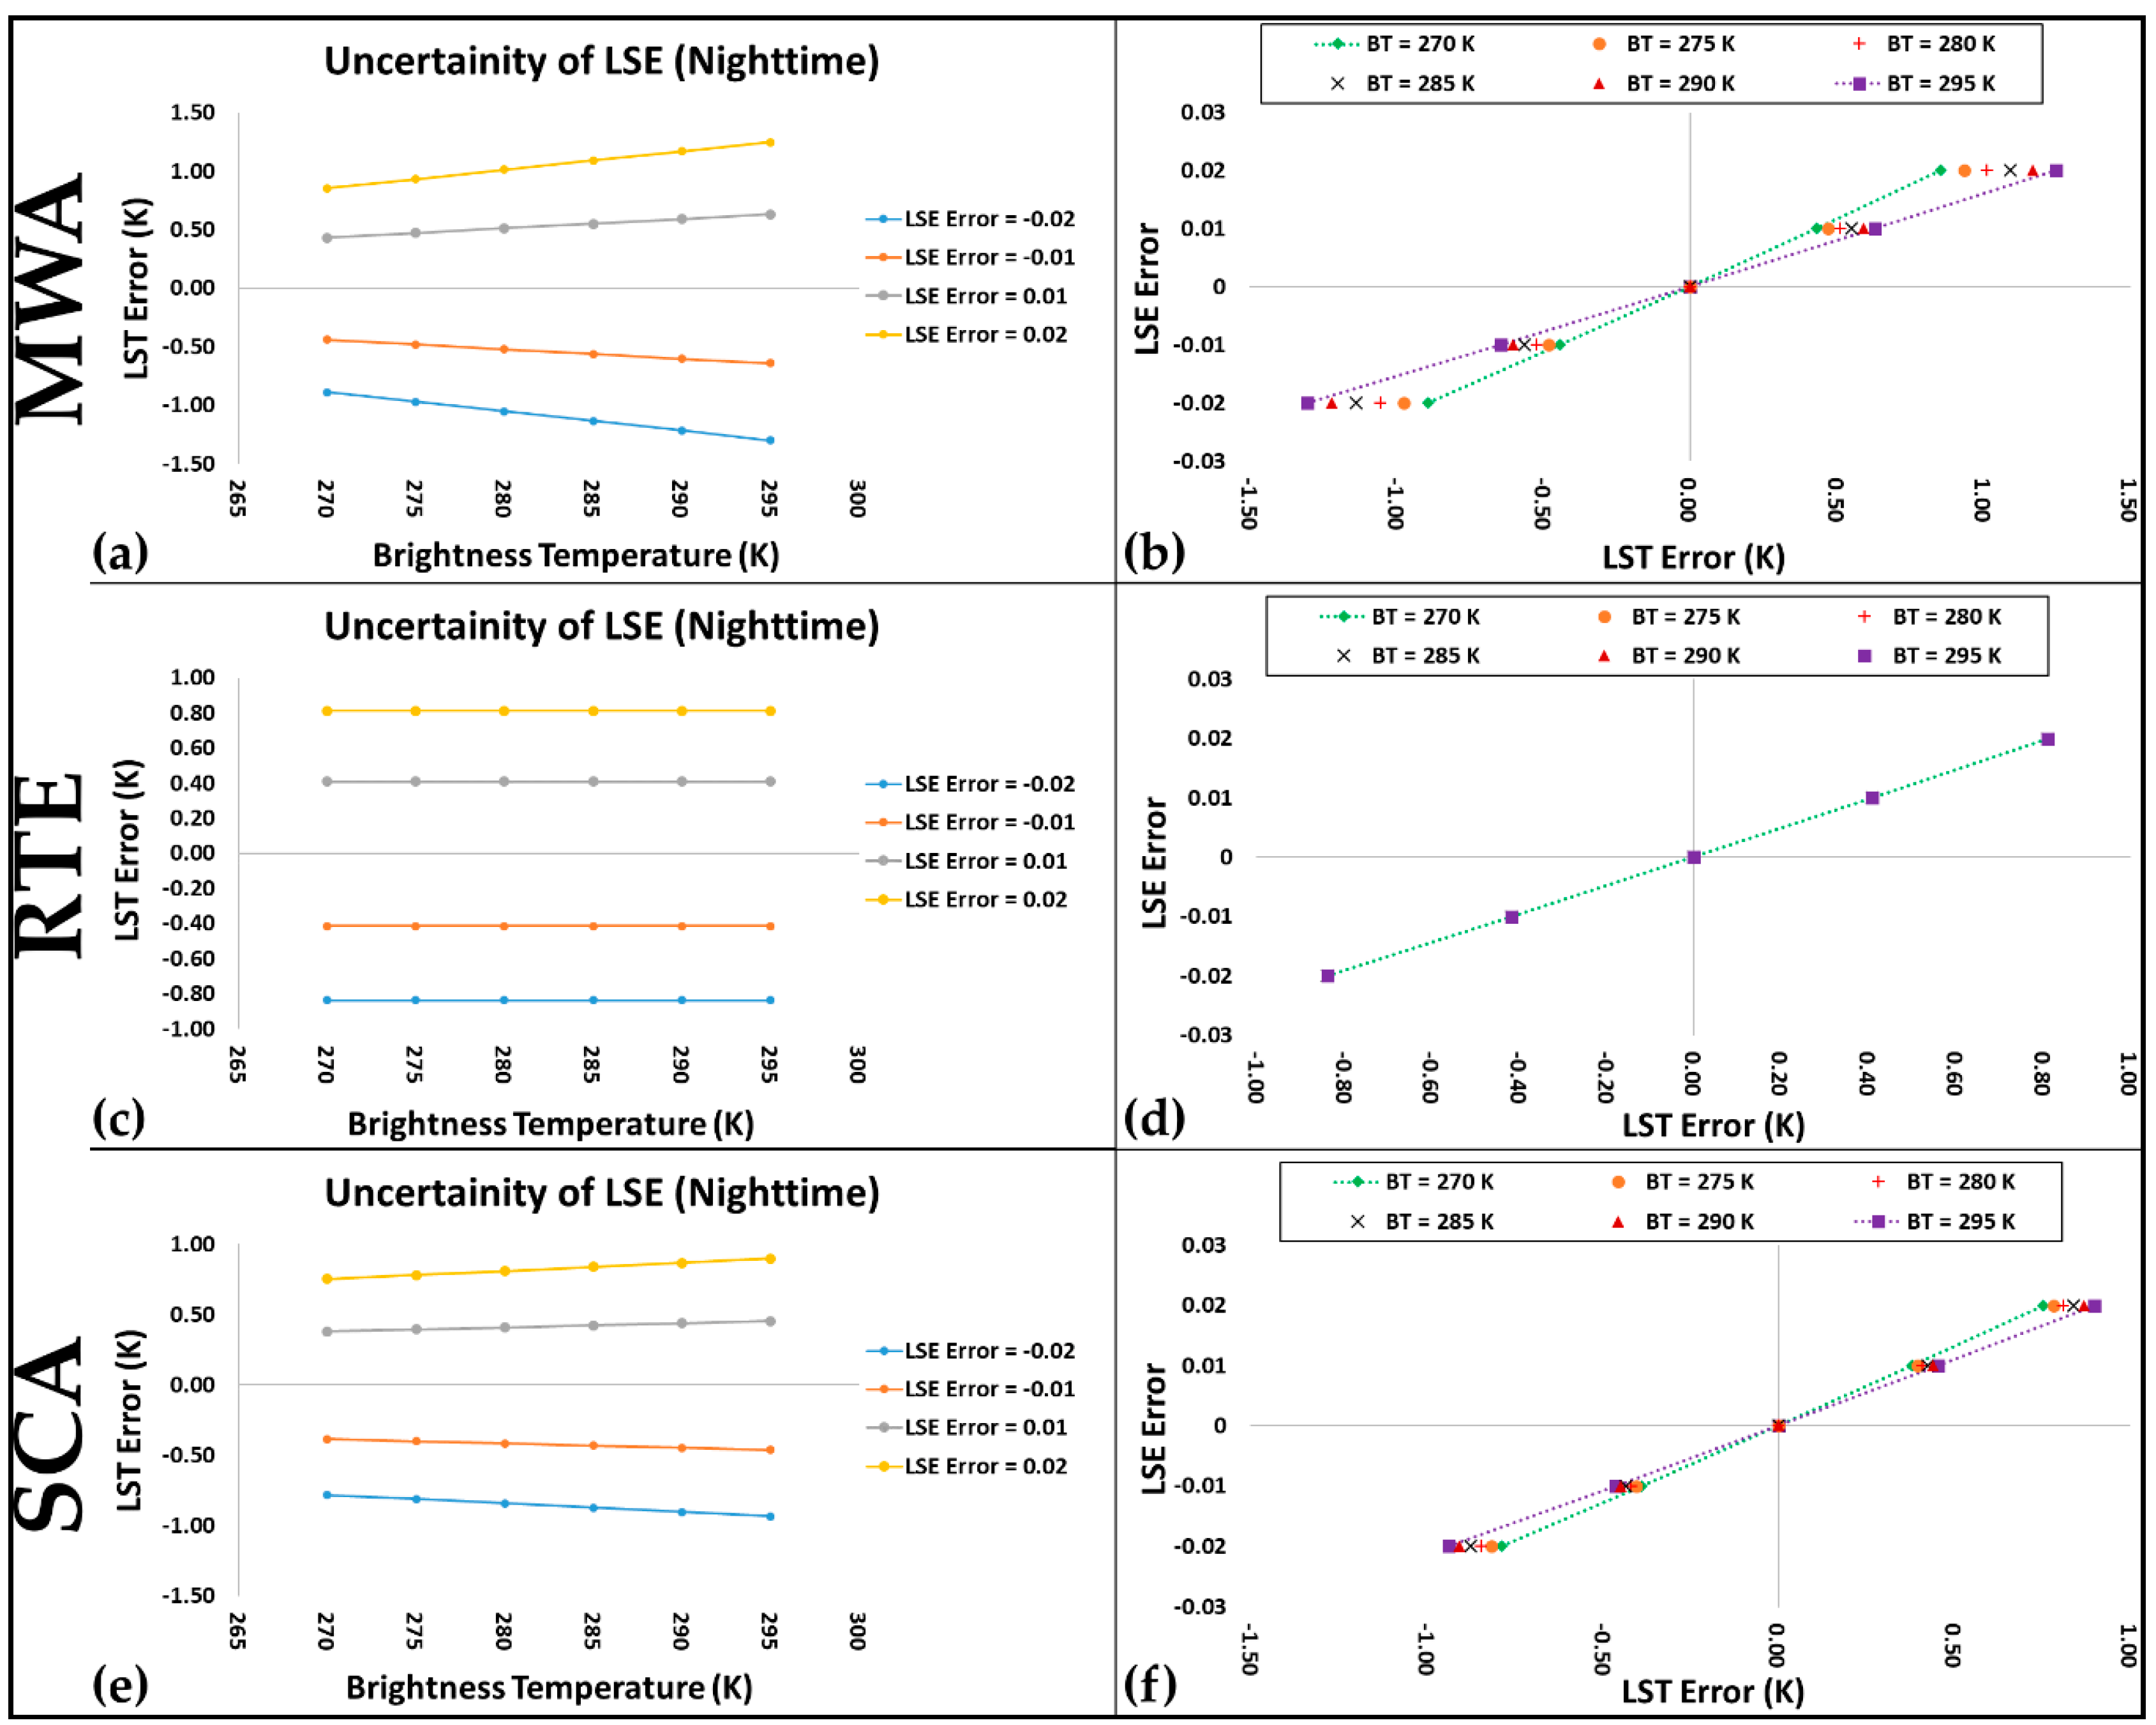
4.2. Sensitivity Results of LST Retrieval Methods to LSE
4.3. Accuracy of LST Retrieval Algorithms and LSE Models for Daytime
4.4. Accuracy of LST Retrieval Algorithms and LSE Models for Nighttime
5. Discussion
6. Conclusions
Author Contributions
Funding
Acknowledgments
Conflicts of Interest
Appendix A

| Acquisition Time | Scene ID | Scene Acquisition Date and Hour (UTC) | Site ID |
|---|---|---|---|
| Daytime | LC80330322013269LGN01 | 26.09.2013—17:40 | TBL |
| LC80340322015170LGN01 | 19.06.2015—17:43 | ||
| LC80340322017239LGN00 | 27.08.2017—17:44 | ||
| LC80340322017255LGN00 | 12.09.2017—17:44 | ||
| LC80330322017264LGN00 | 21.09.2017—17:38 | ||
| LC80340322018258LGN00 | 15.09.2018—17:44 | ||
| LC80350262017198LGN00 | 17.07.2017—17:48 | FPK | |
| LC80360262017205LGN00 | 24.07.2017—17:54 | ||
| LC80350262017230LGN00 | 18.08.2017—17:48 | ||
| LC80350262017246LGN00 | 03.09.2017—17:48 | ||
| LC80350262017246LGN00 | 03.09.2017—17:48 | ||
| LC80230362019296LGN00 | 23.10.2019—16:38 | GWN | |
| LC80290292019290LGN00 | 17.10.2019—17:12 | SXF | |
| LC80280352017229LGN00 | 17.08.2017—17:08 | SGP E32 Medford | |
| LC80280342019203LGN00 | 22.07.2019—17:08 | ||
| LC80280352017229LGN00 | 17.08.2017—17:08 | SGP E11 Byron | |
| LC80280342017245LGN00 | 02.09.2017—17:08 | ||
| LC80280342019203LGN00 | 22.07.2019—17:08 | ||
| LC80280352019027LGN00 | 27.01.2019—17:08 | SGP E37 Waukomis | |
| LC80280352019027LGN00 | 27.01.2019—17:08 | SGP E15 Ringwood | |
| LC80280352019027LGN00 | 27.01.2019—17:08 | SGP E38 Omega | |
| Nighttime | LC81292122013270LGN01 | 27.09.2013—04:45 | TBL |
| LC81302122015171LGN01 | 20.06.2015—04:48 | ||
| LC81302122017240LGN00 | 28.08.2017—04:49 | ||
| LC81302122017256LGN00 | 13.09.2017—04:49 | ||
| LC81292122017265LGN00 | 22.09.2017—04:43 | ||
| LC81302122018259LGN00 | 16.09.2018—04:49 | ||
| LC81282182017194LGN00 | 13.07.2017—04:39 | FPK | |
| LC81272182017203LGN00 | 22.07.2017—04:33 | ||
| LC81282182017226LGN00 | 14.08.2017—04:39 | ||
| LC81282182017242LGN00 | 30.08.2017—04:39 | ||
| LC81272182017251LGN00 | 08.09.2017—04:33 | ||
| LT81212082019295LGN00 | 22.10.2019—03:52 | GWN | |
| LT81232142019293LGN00 | 20.10.2019—04:07 | SXF | |
| LC81262102017228LGN00 | 16.08.2017—04:24 | SGP E32 Medford | |
| LC81262092019202LGN00 | 21.07.2019—04:23 | ||
| LC81262102017228LGN00 | 16.08.2017—04:24 | SGP E11 Byron | |
| LC81262102017244LGN00 | 01.09.2017—04:24 | ||
| LC81262092019202LGN00 | 21.07.2019—04:23 | ||
| LC81262092019026LGN00 | 26.01.2019—04:23 | SGP E37 Waukomis | |
| LC81262092019026LGN00 | 26.01.2019—04:23 | SGP E15 Ringwood | |
| LC81262092019026LGN00 | 26.01.2019—04:23 | SGP E38 Omega |
References
- Townshend, J.R.G.R.; Justice, C.O.O.; Skole, D.; Malingreau, J.-P.P.; Cihlar, J.; Teillet, P.; Sadowski, F.; Ruttenberg, S. The 1 km resolution global data set: Needs of the international geosphere biosphere programme! Int. J. Remote Sens. 1994, 15, 3417–3441. [Google Scholar] [CrossRef]
- GCOS. The Global Observing System for Climate: Implementation Needs. Available online: https://library.wmo.int/doc_num.php?explnum_id=3417 (accessed on 26 May 2020).
- Yu, Y.; Liu, Y.; Yu, P. Land Surface Temperature Product Development for JPSS and GOES-R Missions. In Comprehensive Remote Sensing; Elsevier: Berlin/Heidelberg, Germany, 2018; pp. 284–303. [Google Scholar]
- Becker, F.; Li, Z.-L. Surface temperature and emissivity at various scales: Definition, measurement and related problems. Remote. Sens. Rev. 1995, 12, 225–253. [Google Scholar] [CrossRef]
- Dash, P.; Göttsche, F.-M.; Olesen, F.; Fischer, H. Retrieval of land surface temperature and emissivity from satellite data: Physics, theoretical limitations and current methods. J. Indian Soc. Remote Sens. 2001, 29, 23–30. [Google Scholar] [CrossRef]
- Qin, Z.; Karnieli, A. Progress in the remote sensing of land surface temperature and ground emissivity using NOAA-AVHRR data. Int. J. Remote Sens. 1999, 20, 2367–2393. [Google Scholar] [CrossRef]
- Anderson, M.C.; Norman, J.M.; Kustas, W.P.; Houborg, R.; Starks, P.J.; Agam, N. A thermal-based remote sensing technique for routine mapping of land-surface carbon, water and energy fluxes from field to regional scales. Remote Sens. Environ. 2008, 112, 4227–4241. [Google Scholar] [CrossRef]
- Dash, P.; Göttsche, F.-M.; Olesen, F.-S.; Fischer, H. Land surface temperature and emissivity estimation from passive sensor data: Theory and practice-current trends. Int. J. Remote Sens. 2002, 23, 2563–2594. [Google Scholar] [CrossRef]
- Dickinson, R.E. Land Surface Processes and Climate—Surface Albedos and Energy Balance. In Theory of Climate; Saltzman, B., Ed.; Elsevier: Berlin/Heidelberg, Germany, 1983; pp. 305–353. [Google Scholar]
- Cammalleri, C.; Vogt, J. On the Role of land surface temperature as proxy of soil moisture status for drought monitoring in Europe. Remote Sens. 2015, 7, 16849–16864. [Google Scholar] [CrossRef]
- Wan, Z.; Wang, P.; Li, X. Using MODIS Land Surface Temperature and Normalized Difference Vegetation Index products for monitoring drought in the southern Great Plains, USA. Int. J. Remote Sens. 2004, 25, 61–72. [Google Scholar] [CrossRef]
- Coates, A.; Dennison, P.; Roberts, D.; Roth, K. Monitoring the impacts of severe drought on southern california chaparral species using hyperspectral and thermal infrared imagery. Remote Sens. 2015, 7, 14276–14291. [Google Scholar] [CrossRef]
- Wesley, E.J.; Brunsell, N.A. Greenspace pattern and the surface urban heat island: A biophysically-based approach to investigating the effects of urban landscape configuration. Remote Sens. 2019, 11, 2322. [Google Scholar] [CrossRef]
- Granero-Belinchon, C.; Michel, A.; Lagouarde, J.-P.; Sobrino, J.A.; Briottet, X. Night thermal unmixing for the study of microscale surface urban heat islands with TRISHNA-Like data. Remote Sens. 2019, 11, 1449. [Google Scholar] [CrossRef]
- Zhou, D.; Xiao, J.; Bonafoni, S.; Berger, C.; Deilami, K.; Zhou, Y.; Frolking, S.; Yao, R.; Qiao, Z.; Sobrino, J. Satellite remote sensing of surface urban heat islands: Progress, challenges, and perspectives. Remote Sens. 2019, 11, 48. [Google Scholar] [CrossRef]
- Keeratikasikorn, C.; Bonafoni, S. Urban Heat Island Analysis over the Land Use Zoning Plan of Bangkok by Means of Landsat 8 Imagery. Remote Sens. 2018, 10, 440. [Google Scholar] [CrossRef]
- Sobrino, J.A.; Oltra-Carrió, R.; Sòria, G.; Jiménez-muñoz, J.C.; Franch, B.; Hidalgo, V.; Mattar, C.; Julien, Y.; Cuenca, J.; Romaguera, M.; et al. Evaluation of the surface urban heat island effect in the city of Madrid by thermal remote sensing. Int. J. Remote Sens. 2013, 34, 3177–3192. [Google Scholar] [CrossRef]
- Sun, J.; Salvucci, G.D.; Entekhabi, D. Estimates of evapotranspiration from MODIS and AMSR-E land surface temperature and moisture over the Southern Great Plains. Remote Sens. Environ. 2012, 127, 44–59. [Google Scholar] [CrossRef]
- Galleguillos, M.; Jacob, F.; Prévot, L.; French, A.; Lagacherie, P. Comparison of two temperature differencing methods to estimate daily evapotranspiration over a Mediterranean vineyard watershed from ASTER data. Remote Sens. Environ. 2011, 115, 1326–1340. [Google Scholar] [CrossRef]
- Candy, B.; Saunders, R.W.; Ghent, D.; Bulgin, C.E. The impact of satellite-derived land surface temperatures on numerical weather prediction analyses and forecasts. J. Geophys. Res. Atmos. 2017, 122, 9783–9802. [Google Scholar] [CrossRef]
- Meng, C.L.; Li, Z.-L.; Zhan, X.; Shi, J.C.; Liu, C.Y. Land surface temperature data assimilation and its impact on evapotranspiration estimates from the Common Land Model. Water Resour. Res. 2009, 45, 2. [Google Scholar] [CrossRef]
- Qin, J.; Liang, S.; Liu, R.; Zhang, H.; Hu, B. A Weak-constraint-based data assimilation scheme for estimating surface turbulent fluxes. IEEE Geosci. Remote Sens. Lett. 2007, 4, 649–653. [Google Scholar] [CrossRef]
- Dousset, B.; Gourmelon, F.; Laaidi, K.; Zeghnoun, A.; Giraudet, E.; Bretin, P.; Mauri, E.; Vandentorren, S. Satellite monitoring of summer heat waves in the Paris metropolitan area. Int. J. Climatol. 2011, 31, 313–323. [Google Scholar] [CrossRef]
- Sekertekin, A.; Inyurt, S.; Yaprak, S. Pre-seismic ionospheric anomalies and spatio-temporal analyses of MODIS Land surface temperature and aerosols associated with Sep, 24 2013 Pakistan Earthquake. J. Atmos. Sol. Terr. Phys. 2020, 200, 105218. [Google Scholar] [CrossRef]
- Pavlidou, E.; van der Meijde, M.; van der Werff, H.; Hecker, C. Time series analysis of land surface temperatures in 20 earthquake cases worldwide. Remote Sens. 2018, 11, 61. [Google Scholar] [CrossRef]
- Maffei, C.; Alfieri, S.; Menenti, M. Relating spatiotemporal patterns of forest fires burned area and duration to diurnal land surface temperature anomalies. Remote Sens. 2018, 10, 1777. [Google Scholar] [CrossRef]
- Sekertekin, A.; Arslan, N. Monitoring thermal anomaly and radiative heat flux using thermal infrared satellite imagery –A case study at Tuzla geothermal region. Geothermics 2019, 78, 243–254. [Google Scholar] [CrossRef]
- Mia, M.; Fujimitsu, Y.; Nishijima, J. Monitoring of Thermal Activity at the Hatchobaru–Otake Geothermal Area in Japan Using Multi-Source Satellite Images—With Comparisons of Methods, and Solar and Seasonal Effects. Remote Sens. 2018, 10, 1430. [Google Scholar] [CrossRef]
- Prata, A.J.; Caselles, V.; Coll, C.; Sobrino, J.A.; Ottlé, C. Thermal remote sensing of land surface temperature from satellites: Current status and future prospects. Remote Sens. Rev. 1995, 12, 175–224. [Google Scholar] [CrossRef]
- Wark, D.Q.; Yamamoto, G.; Lienesch, J.H. Methods of Estimating Infrared Flux and Surface Temperature from Meteorological Satellites. J. Atmos. Sci. 1962, 19, 369–384. [Google Scholar] [CrossRef]
- Li, Z.; Tang, B.-H.; Wu, H.; Ren, H.; Yan, G.; Wan, Z.; Trigo, I.F.; Sobrino, J.A. Satellite-derived land surface temperature: Current status and perspectives. Remote Sens. Environ. 2013, 131, 14–37. [Google Scholar] [CrossRef]
- Li, Z.-L.; Becker, F. Feasibility of land surface temerature and emissivity determination from AVHRR data. Remote Sens. Environ. 1993, 43, 67–85. [Google Scholar] [CrossRef]
- Sobrino, J.A.; Caselles, V.; Becker, F. Significance of the remotely sensed thermal infrared measurements obtained over a citrus orchard. ISPRS J. Photogramm. Remote Sens. 1990, 44, 343–354. [Google Scholar] [CrossRef]
- Sekertekin, A.; Bonafoni, S. Land Surface Temperature Retrieval from Landsat 5, 7, and 8 over Rural Areas: Assessment of Different Retrieval Algorithms and Emissivity Models and Toolbox Implementation. Remote Sens. 2020, 12, 294. [Google Scholar] [CrossRef]
- Becker, F.; Li, Z.L. Temperature-independent spectral indices in thermal infrared bands. Remote Sens. Environ. 1990, 32, 17–33. [Google Scholar] [CrossRef]
- Mao, K.; Qin, Z.; Shi, J.; Gong, P. A practical split-window algorithm for retrieving land-surface temperature from MODIS data. Int. J. Remote Sens. 2005, 26, 3181–3204. [Google Scholar] [CrossRef]
- Wan, Z.; Dozier, J. A generalized split-window algorithm for retrieving land-surface temperature from space. IEEE Trans. Geosci. Remote Sens. 1996, 34, 892–905. [Google Scholar]
- Coll, C.; Caselles, V. A split-window algorithm for land surface temperature from advanced very high resolution radiometer data: Validation and algorithm comparison. J. Geophys. Res. Atmos. 1997, 102, 16697–16713. [Google Scholar] [CrossRef]
- Qin, Z.; Karnieli, A.; Berliner, P. A mono-window algorithm for retrieving land surface temperature from Landsat TM data and its application to the Israel-Egypt border region. Int. J. Remote Sens. 2001, 22, 3719–3746. [Google Scholar] [CrossRef]
- Jiménez-muñoz, J.C.; Cristóbal, J.; Sobrino, J.A.; Sòria, G.; Ninyerola, M.; Pons, X. Revision of the single-channel algorithm for land surface temperature retrieval from landsat thermal-infrared data. IEEE Trans. Geosci. Remote Sens. 2009, 47, 339–349. [Google Scholar] [CrossRef]
- Jimenez-Munoz, J.C.; Sobrino, J.A. A Single-Channel Algorithm for Land-Surface Temperature Retrieval From ASTER Data. IEEE Geosci. Remote Sens. Lett. 2010, 7, 176–179. [Google Scholar] [CrossRef]
- Price, J.C. Estimating surface temperatures from satellite thermal infrared data-A simple formulation for the atmospheric effect. Remote Sens. Environ. 1983, 13, 353–361. [Google Scholar] [CrossRef]
- Susskind, J.; Rosenfield, J.; Reuter, D.; Chahine, M.T. Remote sensing of weather and climate parameters from HIRS2/MSU on TIROS-N. J. Geophys. Res. 1984, 89, 4677. [Google Scholar] [CrossRef]
- Gillespie, A.; Rokugawa, S.; Matsunaga, T.; Steven Cothern, J.; Hook, S.; Kahle, A.B. A temperature and emissivity separation algorithm for advanced spaceborne thermal emission and reflection radiometer (ASTER) images. IEEE Trans. Geosci. Remote Sens. 1998, 36, 1113–1126. [Google Scholar] [CrossRef]
- Wan, Z.; Zhang, Y.; Zhang, Q.; Li, Z. liang Validation of the land-surface temperature products retrieved from Terra Moderate Resolution Imaging Spectroradiometer data. Remote Sens. Environ. 2002, 83, 163–180. [Google Scholar] [CrossRef]
- Yu, Y.; Tarpley, D.; Privette, J.L.; Flynn, L.E.; Xu, H.; Chen, M.; Vinnikov, K.Y.; Sun, D.; Tian, Y. Validation of GOES-R Satellite Land Surface Temperature Algorithm Using SURFRAD Ground Measurements and Statistical Estimates of Error Properties. IEEE Trans. Geosci. Remote Sens. 2012, 50, 704–713. [Google Scholar] [CrossRef]
- Sekertekin, A. Validation of Physical Radiative Transfer Equation-Based Land Surface Temperature Using Landsat 8 Satellite Imagery and SURFRAD in-situ Measurements. J. Atmos. Sol. Terr. Phys. 2019, 196, 105161. [Google Scholar] [CrossRef]
- Malakar, N.K.; Hulley, G.C.; Hook, S.J.; Laraby, K.; Cook, M.; Schott, J.R. An Operational Land Surface Temperature Product for Landsat Thermal Data: Methodology and Validation. IEEE Trans. Geosci. Remote Sens. 2018, 56, 5717–5735. [Google Scholar] [CrossRef]
- Wang, L.; Lu, Y.; Yao, Y. Comparison of Three Algorithms for the Retrieval of Land Surface Temperature from Landsat 8 Images. Sensors 2019, 19, 5049. [Google Scholar] [CrossRef]
- Parastatidis, D.; Mitraka, Z.; Chrysoulakis, N.; Abrams, M. Online Global Land Surface Temperature Estimation from Landsat. Remote Sens. 2017, 9, 1208. [Google Scholar] [CrossRef]
- Yu, X.; Guo, X.; Wu, Z. Land surface temperature retrieval from landsat 8 TIRS-comparison between radiative transfer equation-based method, split window algorithm and single channel method. Remote Sens. 2014, 6, 9829–9852. [Google Scholar] [CrossRef]
- Zhang, Z.; He, G.; Wang, M.; Long, T.; Wang, G.; Zhang, X. Validation of the generalized single-channel algorithm using landsat 8 imagery and SURFRAD ground measurements. Remote Sens. Lett. 2016, 7, 810–816. [Google Scholar] [CrossRef]
- Vanhellemont, Q. Combined land surface emissivity and temperature estimation from Landsat 8 OLI and TIRS. ISPRS J. Photogramm. Remote Sens. 2020, 166, 390–402. [Google Scholar] [CrossRef]
- Guo, J.; Ren, H.; Zheng, Y.; Lu, S.; Dong, J. Evaluation of Land Surface Temperature Retrieval from Landsat 8/TIRS Images before and after Stray Light Correction Using the SURFRAD Dataset. Remote Sens. 2020, 12, 1023. [Google Scholar] [CrossRef]
- García-Santos, V.; Cuxart, J.; Martínez-Villagrasa, D.; Jiménez, M.; Simó, G. Comparison of Three Methods for Estimating Land Surface Temperature from Landsat 8-TIRS Sensor Data. Remote Sens. 2018, 10, 1450. [Google Scholar] [CrossRef]
- Zheng, Y.; Ren, H.; Guo, J.; Ghent, D.; Tansey, K.; Hu, X.; Nie, J.; Chen, S. Land Surface Temperature Retrieval from Sentinel-3A Sea and Land Surface Temperature Radiometer, Using a Split-Window Algorithm. Remote Sens. 2019, 11, 650. [Google Scholar] [CrossRef]
- Pinker, R.T.; Ma, Y.; Chen, W.; Hulley, G.; Borbas, E.; Islam, T.; Hain, C.; Cawse-Nicholson, K.; Hook, S.; Basara, J. Towards a Unified and Coherent Land Surface Temperature Earth System Data Record from Geostationary Satellites. Remote Sens. 2019, 11, 1399. [Google Scholar] [CrossRef]
- Martin, M.; Ghent, D.; Pires, A.; Göttsche, F.-M.; Cermak, J.; Remedios, J. Comprehensive In Situ Validation of Five Satellite Land Surface Temperature Data Sets over Multiple Stations and Years. Remote Sens. 2019, 11, 479. [Google Scholar] [CrossRef]
- Niclòs, R.; Galve, J.M.; Valiente, J.A.; Estrela, M.J.; Coll, C. Accuracy assessment of land surface temperature retrievals from MSG2-SEVIRI data. Remote Sens. Environ. 2011, 115, 2126–2140. [Google Scholar] [CrossRef]
- Wan, Z. New refinements and validation of the collection-6 MODIS land-surface temperature/emissivity product. Remote Sens. Environ. 2014, 140, 36–45. [Google Scholar] [CrossRef]
- Wang, W.; Liang, S.; Meyers, T. Validating MODIS land surface temperature products using long-term nighttime ground measurements. Remote Sens. Environ. 2008, 112, 623–635. [Google Scholar] [CrossRef]
- Coll, C.; Caselles, V.; Galve, J.; Valor, E.; Niclos, R.; Sanchez, J.; Rivas, R. Ground measurements for the validation of land surface temperatures derived from AATSR and MODIS data. Remote Sens. Environ. 2005, 97, 288–300. [Google Scholar] [CrossRef]
- Ouyang, X.; Chen, D.; Duan, S.-B.; Lei, Y.; Dou, Y.; Hu, G. Validation and Analysis of Long-Term AATSR Land Surface Temperature Product in the Heihe River Basin, China. Remote Sens. 2017, 9, 152. [Google Scholar] [CrossRef]
- Guillevic, P.C.; Biard, J.C.; Hulley, G.C.; Privette, J.L.; Hook, S.J.; Olioso, A.; Göttsche, F.M.; Radocinski, R.; Román, M.O.; Yu, Y.; et al. Validation of Land Surface Temperature products derived from the Visible Infrared Imaging Radiometer Suite (VIIRS) using ground-based and heritage satellite measurements. Remote Sens. Environ. 2014, 154, 19–37. [Google Scholar] [CrossRef]
- Wang, K.; Liang, S. Evaluation of ASTER and MODIS land surface temperature and emissivity products using long-term surface longwave radiation observations at SURFRAD sites. Remote Sens. Environ. 2009, 113, 1556–1565. [Google Scholar] [CrossRef]
- Sabol, D.E., Jr.; Gillespie, A.R.; Abbott, E.; Yamada, G. Field validation of the ASTER Temperature–Emissivity Separation algorithm. Remote Sens. Environ. 2009, 113, 2328–2344. [Google Scholar] [CrossRef]
- Wan, Z.; Li, Z.-L.; Wan, Z.; Li, Z. A physics-based algorithm for retrieving land-surface emissivity and temperature from EOS/MODIS data. IEEE Trans. Geosci. Remote Sens. 1997, 35, 980–996. [Google Scholar]
- Wang, K.; Wan, Z.; Wang, P.; Sparrow, M.; Liu, J.; Zhou, X.; Haginoya, S. Estimation of surface long wave radiation and broadband emissivity using Moderate Resolution Imaging Spectroradiometer (MODIS) land surface temperature/emissivity products. J. Geophys. Res. 2005, 110, D11109. [Google Scholar] [CrossRef]
- Augustine, J.A.; DeLuisi, J.J.; Long, C.N. SURFRAD—A National Surface Radiation Budget Network for Atmospheric Research. Bull. Am. Meteorol. Soc. 2000, 81, 2341–2357. [Google Scholar] [CrossRef]
- Baldocchi, D.; Falge, E.; Gu, L.; Olson, R.; Hollinger, D.; Running, S.; Anthoni, P.; Bernhofer, C.; Davis, K.; Evans, R.; et al. FLUXNET: A New Tool to Study the Temporal and Spatial Variability of Ecosystem–Scale Carbon Dioxide, Water Vapor, and Energy Flux Densities. Bull. Am. Meteorol. Soc. 2001, 82, 2415–2434. [Google Scholar] [CrossRef]
- Stokes, G.M.; Schwartz, S.E. The Atmospheric Radiation Measurement (ARM) Program: Programmatic Background and Design of the Cloud and Radiation Test Bed. Bull. Am. Meteorol. Soc. 1994, 75, 1201–1221. [Google Scholar] [CrossRef]
- Ohmura, A.; Gilgen, H.; Hegner, H.; Müller, G.; Wild, M.; Dutton, E.G.; Forgan, B.; Fröhlich, C.; Philipona, R.; Heimo, A.; et al. Baseline Surface Radiation Network (BSRN/WCRP): New Precision Radiometry for Climate Research. Bull. Am. Meteorol. Soc. 1998, 79, 2115–2136. [Google Scholar] [CrossRef]
- Li, S.; Yu, Y.; Sun, D.; Tarpley, D.; Zhan, X.; Chiu, L. Evaluation of 10 year AQUA/MODIS land surface temperature with SURFRAD observations. Int. J. Remote Sens. 2014, 35, 830–856. [Google Scholar] [CrossRef]
- Heidinger, A.K.; Laszlo, I.; Molling, C.C.; Tarpley, D. Using SURFRAD to verify the NOAA single-channel land surface temperature algorithm. J. Atmos. Ocean. Technol. 2013, 30, 2868–2884. [Google Scholar] [CrossRef]
- Guillevic, P.C.; Privette, J.L.; Coudert, B.; Palecki, M.A.; Demarty, J.; Ottlé, C.; Augustine, J.A. Land Surface Temperature product validation using NOAA’s surface climate observation networks—Scaling methodology for the Visible Infrared Imager Radiometer Suite (VIIRS). Remote Sens. Environ. 2012, 124, 282–298. [Google Scholar] [CrossRef]
- Martin, M.; Göttsche, F.M. Satellite LST Validation Report; European Space Agency (ESA): Karlsruhe, Germany, 2016. [Google Scholar]
- Faysash, D.A.; Smith, E.A. Simultaneous Retrieval of Diurnal to Seasonal Surface Temperatures and Emissivities over SGP ARM–CART Site Using GOES Split Window. J. Appl. Meteorol. 2000, 39, 971–982. [Google Scholar] [CrossRef]
- Pinker, R.T.; Sun, D.; Hung, M.P.; Li, C.; Basara, J.B. Evaluation of satellite estimates of land surface temperature from GOES over the United States. J. Appl. Meteorol. Climatol. 2009, 48, 167–180. [Google Scholar] [CrossRef]
- Ou, S.C.; Chen, Y.; Liou, K.N.; Cosh, M.; Brutsaert, W. Satellite remote sensing of land surface temperatures: Application of the atmospheric correction method and split-window technique to data of ARM-SGP site. Int. J. Remote Sens. 2002, 23, 5177–5192. [Google Scholar] [CrossRef]
- Philipona, R.; Dutton, E.G.; Stoffel, T.; Michalsky, J.; Reda, I.; Stifter, A.; Wendung, P.; Wood, N.; Clough, S.A.; Mlawer, E.J.; et al. Atmospheric longwave irradiance uncertainty: Pyrgeometers compared to an absolute sky-scanning radiometer, atmospheric emitted radiance interferometer, and radiative transfer model calculations. J. Geophys. Res. Atmos. 2001, 106, 28129–28141. [Google Scholar] [CrossRef]
- Duan, S.-B.; Li, Z.-L.; Li, H.; Göttsche, F.-M.; Wu, H.; Zhao, W.; Leng, P.; Zhang, X.; Coll, C. Validation of Collection 6 MODIS land surface temperature product using in situ measurements. Remote Sens. Environ. 2019, 225, 16–29. [Google Scholar] [CrossRef]
- Xu, H.; Yu, Y.; Tarpley, D.; Gottsche, F.; Olesen, F.-S. Evaluation of GOES-R Land Surface Temperature Algorithm Using SEVIRI Satellite Retrievals With In Situ Measurements. IEEE Trans. Geosci. Remote Sens. 2014, 52, 3812–3822. [Google Scholar] [CrossRef]
- Wulder, M.A.; Loveland, T.R.; Roy, D.P.; Crawford, C.J.; Masek, J.G.; Woodcock, C.E.; Allen, R.G.; Anderson, M.C.; Belward, A.S.; Cohen, W.B.; et al. Current status of Landsat program, science, and applications. Remote Sens. Environ. 2019, 225, 127–147. [Google Scholar] [CrossRef]
- Barsi, J.A.; Barker, J.L.; Schott, J.R. An Atmospheric Correction Parameter Calculator for a single thermal band earth-sensing instrument. In Proceedings of the IGARSS 2003. 2003 IEEE International Geoscience and Remote Sensing Symposium. Proceedings (IEEE Cat. No.03CH37477), Toulouse, France, 21–25 July 2003; IEEE: Piscataway, NJ, USA, 2003; Volume 5, pp. 3014–3016. [Google Scholar]
- Barsi, J.A.; Schott, J.R.; Palluconi, F.D.; Hook, S.J. Validation of a web-based atmospheric correction tool for single thermal band instruments. In Proceedings of the Earth Observing Systems X, Bellingham, WA, USA, 25 August 2005; SPIE: Bellingham, WA, USA, 2005; Volume 5882, p. 58820. [Google Scholar]
- Dozier, J.; Warren, S.G. Effect of viewing angle on the infrared brightness temperature of snow. Water Resour. Res. 1982, 18, 1424–1434. [Google Scholar] [CrossRef]
- Zanter, K. USGS Landsat 8 (L8) Data Users Handbook. Available online: https://prd-wret.s3-us-west-2.amazonaws.com/assets/palladium/production/atoms/files/LSDS-1574_L8_Data_Users_Handbook-v5.0.pdf (accessed on 5 December 2019).
- Sobrino, J.A.; Raissouni, N.; Li, Z. A Comparative Study of Land Surface Emissivity Retrieval from NOAA Data. Remote Sens. Environ. 2001, 75, 256–266. [Google Scholar] [CrossRef]
- Sobrino, J.A.; Raissouni, N. Toward remote sensing methods for land cover dynamic monitoring: Application to Morocco. Int. J. Remote Sens. 2000, 21, 353–366. [Google Scholar] [CrossRef]
- Valor, E.; Caselles, V. Mapping land surface emissivity from NDVI: Application to European, African, and South American areas. Remote Sens. Environ. 1996, 57, 167–184. [Google Scholar] [CrossRef]
- Peres, L.F.; DaCamara, C.C. Emissivity maps to retrieve land-surface temperature from MSG/SEVIRI. IEEE Trans. Geosci. Remote Sens. 2005, 43, 1834–1844. [Google Scholar] [CrossRef]
- Sun, D.; Pinker, R.T. Estimation of land surface temperature from a Geostationary Operational Environmental Satellite (GOES-8). J. Geophys. Res. 2003, 108, 4326. [Google Scholar] [CrossRef]
- Sobrino, J.a.; Jiménez-Muñoz, J.C.; Paolini, L. Land surface temperature retrieval from LANDSAT TM 5. Remote Sens. Environ. 2004, 90, 434–440. [Google Scholar] [CrossRef]
- Van de Griend, A.A.; Owe, M. On the relationship between thermal emissivity and the normalized difference vegetation index for natural surfaces. Int. J. Remote Sens. 1993, 14, 1119–1131. [Google Scholar] [CrossRef]
- Sobrino, J.A.; Jimenez-Muoz, J.C.; Soria, G.; Romaguera, M.; Guanter, L.; Moreno, J.; Plaza, A.; Martinez, P. Land Surface Emissivity Retrieval From Different VNIR and TIR Sensors. IEEE Trans. Geosci. Remote Sens. 2008, 46, 316–327. [Google Scholar] [CrossRef]
- Carlson, T.N.; Ripley, D.A. On the relation between NDVI, fractional vegetation cover, and leaf area index. Remote Sens. Environ. 1997, 62, 241–252. [Google Scholar] [CrossRef]
- Skokovic, D.; Sobrino, J.a.; Jiménez Muñoz, J.C.; Soria, G.; Julien, Y.; Mattar, C.; Cristóbal, J. Calibration and Validation of land surface temperature for Landsat8- TIRS sensor TIRS LANDSAT-8 CHARACTERISTICS. Land Prod. Valid. Evol. ESA/ESRIN 2014, 1–27. [Google Scholar]
- Li, S.; Jiang, G.-M. Land Surface Temperature Retrieval From Landsat-8 Data With the Generalized Split-Window Algorithm. IEEE Access 2018, 6, 18149–18162. [Google Scholar] [CrossRef]
- Wang, S.; He, L.; Hu, W. A Temperature and Emissivity Separation Algorithm for Landsat-8 Thermal Infrared Sensor Data. Remote Sens. 2015, 7, 9904–9927. [Google Scholar] [CrossRef]
- Ndossi, M.; Avdan, U. Inversion of Land Surface Temperature (LST) Using Terra ASTER Data: A Comparison of Three Algorithms. Remote Sens. 2016, 8, 993. [Google Scholar] [CrossRef]
- Saltelli, A. Sensitivity Analysis for Importance Assessment. Risk Anal. 2002, 22, 579–590. [Google Scholar] [CrossRef] [PubMed]
- Wang, F.; Qin, Z.; Song, C.; Tu, L.; Karnieli, A.; Zhao, S. An Improved Mono-Window Algorithm for Land Surface Temperature Retrieval from Landsat 8 Thermal Infrared Sensor Data. Remote Sens. 2015, 7, 4268–4289. [Google Scholar] [CrossRef]
- Wang, H.; Mao, K.; Mu, F.; Shi, J.; Yang, J.; Li, Z.; Qin, Z. A Split Window Algorithm for Retrieving Land Surface Temperature from FY-3D MERSI-2 Data. Remote Sens. 2019, 11, 2083. [Google Scholar] [CrossRef]
- Meng, X.; Cheng, J.; Zhao, S.; Liu, S.; Yao, Y. Estimating Land Surface Temperature from Landsat-8 Data using the NOAA JPSS Enterprise Algorithm. Remote Sens. 2019, 11, 155. [Google Scholar] [CrossRef]
- Wang, M.; Zhang, Z.; Hu, T.; Liu, X. A Practical Single-Channel Algorithm for Land Surface Temperature Retrieval: Application to Landsat series data. J. Geophys. Res. Atmos. 2019, 124, 2018JD029330. [Google Scholar] [CrossRef]


| Site Location | Site ID | Latitude | Longitude | Elevation | Land Cover Type |
|---|---|---|---|---|---|
| Fort Peck, Montana | FPK | 48.308°N | 105.102°W | 634 m | Grassland |
| Table Mountain, Boulder, Colorado | TBL | 40.125°N | 105.237°W | 1689 m | Sparse Grassland |
| Sioux Falls, South Dakota | SXF | 43.734°N | 96.623°W | 473 m | Grassland |
| Goodwin Creek, Mississippi | GWN | 34.255°N | 89.873°W | 98 m | Cropland/Natural Vegetation Mosaic |
| Omega, Oklahoma | SGP E38 | 35.880°N | 98.173°W | 371 m | Pasture |
| Waukomis, Oklahoma | SGP E37 | 36.311°N | 97.928°W | 379 m | Grassland |
| Medford, Oklahoma | SGP E32 | 36.819°N | 97.820°W | 328 m | Pasture |
| Ringwood, Oklahoma | SGP E15 | 36.431°N | 98.284°W | 418 m | Pasture |
| Byron, Oklahoma | SGP E11 | 36.881°N | 98.285°W | 360 m | Pasture |
| Region | Linear Equations |
|---|---|
| USA 1976 Region | Ta = 25.940 + 0.8805 × To |
| Tropical Region | Ta = 17.977 + 0.9172 × To |
| Mid-latitude Summer Region | Ta = 16.011 + 0.9262 × To |
| Mid-latitude Winter Region | Ta = 19.270 + 0.9112 × To |
| Sensor | LSE Equations | Model ID | Reference |
|---|---|---|---|
| Landsat 8 (Band 10) | LSE1 | Van de Griend and Owe [94] | |
| LSE2 | Valor and Caselles [90] | ||
| LSE3 | Sobrino et al. [95] | ||
| LSE4 | Skoković et al. [97] | ||
| LSE5 | Yu et al. [51] | ||
| LSE6 | Li and Jiang [98] |
| Data Type | LSE ID | LST Retrieval Method | RMSE (K) | STD Error (K) | Bias (K) |
|---|---|---|---|---|---|
| Daytime LST | LSE4 | MWA | 2.17 | 1.86 | −1.13 |
| LSE6 | MWA | 2.17 | 1.79 | −1.24 | |
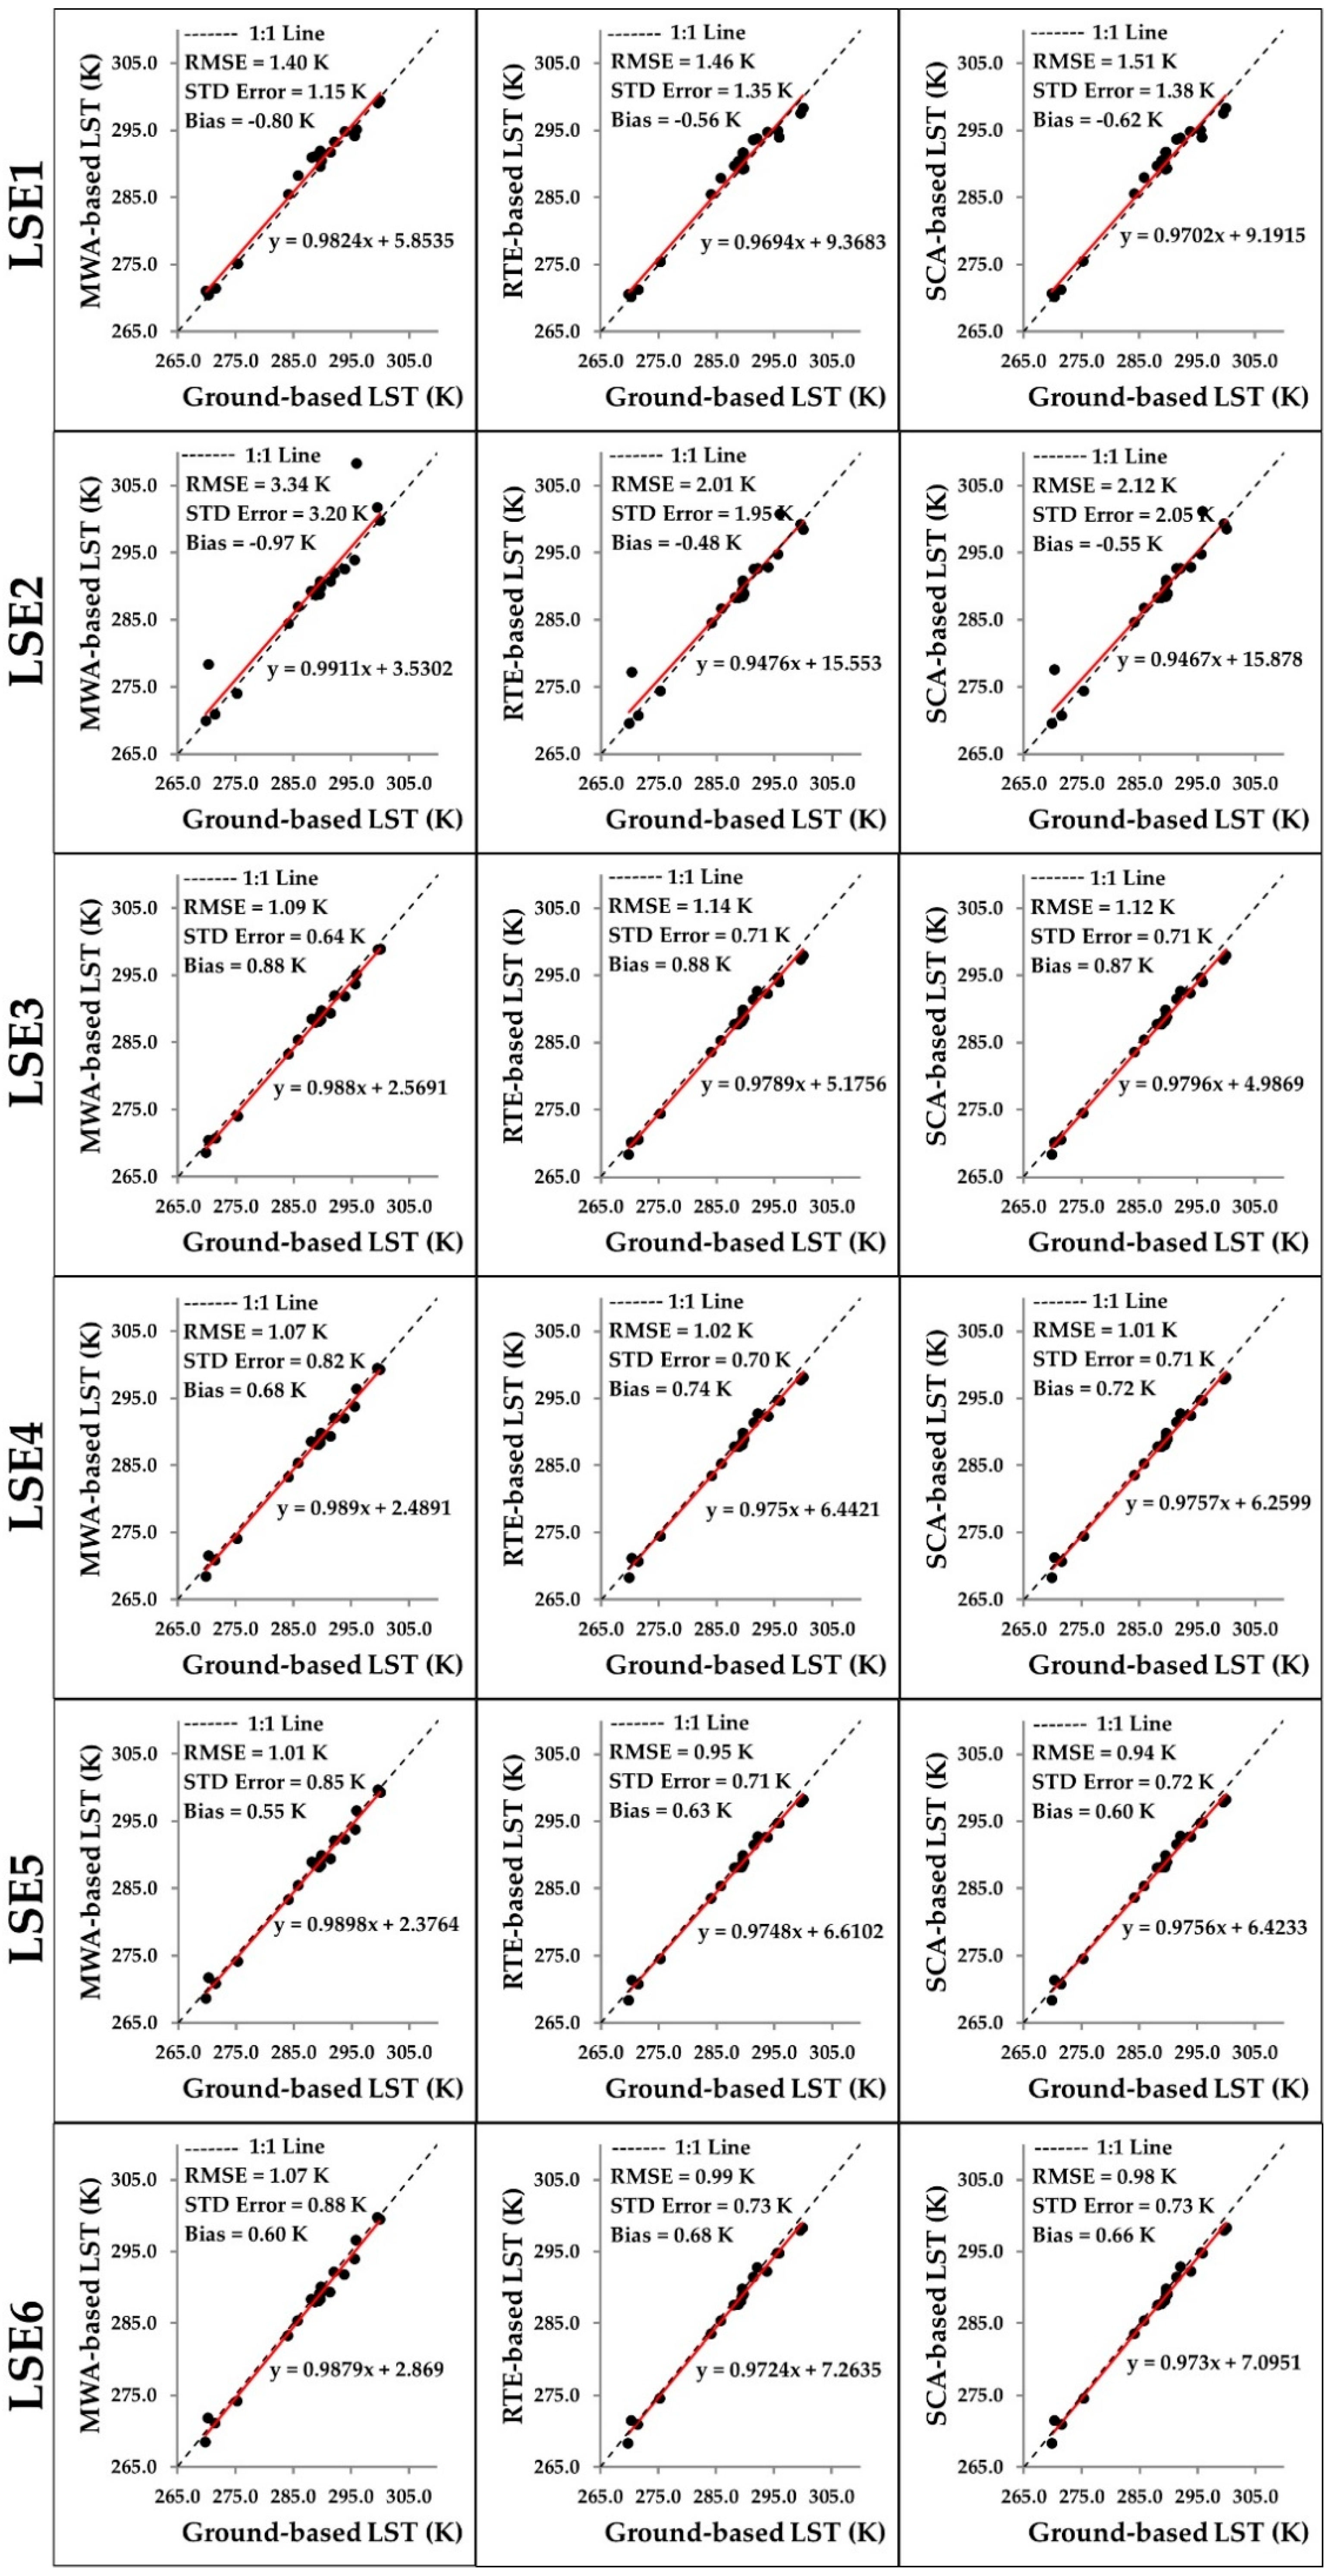
| Nighttime LST | LSE5 | SCA | 0.94 | 0.72 | 0.60 |
© 2020 by the authors. Licensee MDPI, Basel, Switzerland. This article is an open access article distributed under the terms and conditions of the Creative Commons Attribution (CC BY) license (http://creativecommons.org/licenses/by/4.0/).
Share and Cite
Sekertekin, A.; Bonafoni, S. Sensitivity Analysis and Validation of Daytime and Nighttime Land Surface Temperature Retrievals from Landsat 8 Using Different Algorithms and Emissivity Models. Remote Sens. 2020, 12, 2776. https://doi.org/10.3390/rs12172776
Sekertekin A, Bonafoni S. Sensitivity Analysis and Validation of Daytime and Nighttime Land Surface Temperature Retrievals from Landsat 8 Using Different Algorithms and Emissivity Models. Remote Sensing. 2020; 12(17):2776. https://doi.org/10.3390/rs12172776
Chicago/Turabian StyleSekertekin, Aliihsan, and Stefania Bonafoni. 2020. "Sensitivity Analysis and Validation of Daytime and Nighttime Land Surface Temperature Retrievals from Landsat 8 Using Different Algorithms and Emissivity Models" Remote Sensing 12, no. 17: 2776. https://doi.org/10.3390/rs12172776
APA StyleSekertekin, A., & Bonafoni, S. (2020). Sensitivity Analysis and Validation of Daytime and Nighttime Land Surface Temperature Retrievals from Landsat 8 Using Different Algorithms and Emissivity Models. Remote Sensing, 12(17), 2776. https://doi.org/10.3390/rs12172776