Article

Performances of Vegetation Indices on Paddy Rice at Elevated Air Temperature, Heat Stress, and Herbicide Damage

Department of Applied Plant Science, Chonnam National University, 77 Yongbong-ro, Gwangju 61186, Korea
*
Author to whom correspondence should be addressed.
Remote Sens. 2020, 12(16), 2654; https://doi.org/10.3390/rs12162654
Submission received: 2 July 2020 / Revised: 11 August 2020 / Accepted: 13 August 2020 / Published: 18 August 2020
(This article belongs to the Special Issue Remote Sensing for Agrometeorology)

Abstract

:
Spectral reflectance-based vegetation indices have sensitive characteristics to crop growth and health conditions. The performance of each vegetation index to a certain condition is different and needs to be interpreted, correspondingly. This study aimed to assess the most suitable vegetation index to identify the crop response against elevated air temperatures, heat stress, and herbicide damage. The spectral reflectance, yield components, and growth parameters such as plant height, leaf area index (LAI), and above-ground dry matter of paddy rice, which was cultivated in a temperature gradient field chamber to simulate global warming conditions, were observed from 2016 to 2018. The relationships between the vegetation indices and the crop parameters were assessed considering stress conditions. The normalized difference vegetation index (NDVI) represented the changes in plant height (R-square = 0.93) and the LAI (R-square = 0.901) before the heading stage. Furthermore, the NDVI and the cumulative growing degree days had a Sigmoid curve and an R-square value of 0.937 under the normal growth case, but it decreased significantly in the herbicide damage case. This characteristic was useful for detecting the damaged crop growth condition. Additionally, to estimate the grain yield of paddy rice, the medium resolution imaging spectrometer (MERIS) terrestrial chlorophyll index was better: R-square = 0.912; root mean square error = 95.69 g/m2. Photochemical reflectance index was sensitive to physiological stress caused by the heatwave, and it decreased in response to extremely high air temperatures. These results will contribute towards determining vegetation indices under stress conditions and how to effectively utilize them.

Graphical Abstract

1. Introduction

Remote sensing is a useful technique to directly monitor crop conditions non-destructively [1,2]. Crop spectral reflectance response varies depending on the distribution of crop biomass, crop conditions (e.g., disease, nutrition), and soil background [3,4,5,6,7]. This response constitutes the vegetation indices developed to represent the structural, biochemical, and physiological characteristics of vegetation [8]. Moreover, certain vegetation indices have been used to estimate the crop yield using an empirical relationship [9,10,11]. However, this method, with only one input of a vegetation index, has some limitations in various spatial and temporal applications [12,13]. Current crop yield models not only use meteorological variables but also the vegetation indices instead of the input parameters related to crop condition [14]. Thus, these crop models, unlike other crop models that only use meteorological variables and the fixed crop parameter values, can accurately represent the influence of the cultivation environment, such as agrometeorological disaster, disease stress, and nutriture conditions [15,16]; this is because most meteorological-based crop models are developed under normal meteorological conditions [12,17].
Generally, the vegetation indices that have been widely used in the crop models are calculated using spectral reflectance such as red and near-infrared (NIR) wavelengths. These vegetation indices, which were estimated from the data provided by satellite, unmanned aerial vehicle (UAV), and handheld-based optical devices, represent structural characteristics of vegetation [14,18]. According to Mosleh et al. [19], numerous remote sensing-based studies on forecasting grain yield have used vegetation indices from red and NIR wavelength data [9,20]. Thus, the use of other vegetation indices that include biochemical and physiological characteristics is needed to comprehend crop conditions and to forecast the grain yield.
Various spectral reflectance-based vegetation indices have been developed using hyper-spectrometers; these indices can be classified depending on the water content in the canopy, structural, biochemical, and physiological characteristics [8]. The ratio vegetation index (RVI), usually called simple ratio (SR), was first estimated using a ratio of the red and NIR (NIR/red) bands in 1969 [21], and it represents a structure of vegetation. After that, other structural vegetation indices, such as the normalized difference vegetation index (NDVI), the soil-adjusted vegetation index (SAVI), and the enhanced vegetation index (EVI) were created to represent biomass, a fraction of vegetation per area, and leaf area index (LAI), respectively [22,23,24,25]. After the SR and NDVI, other types of vegetation indices such as water content, biochemical, and physiology were developed. Normalized difference water index (NDWI), normalized difference infrared index (NDII), and water band index (WBI) were the representative indices to indicate water content of vegetation [26,27,28]. These indices were usually obtained from NIR and shortwave infrared (SWIR) wavelength. Vegetation indices such as the chlorophyll absorption ratio index (CARI), the carotenoid reflectance index (CRI), and the medium resolution imaging spectrometer (MERIS) terrestrial chlorophyll index (MTCI) were developed to estimate the biochemical characterization as pigments [29,30,31]. Chlorophyll and carotenoid are related to blue, green, and red-edge wavelengths; vegetation indices, which have a biochemical characteristic, were made using a relatively narrow band, unlike structural vegetation indices. Lastly, the physiological feature of vegetation has been detected by the photochemical reflectance index (PRI) since 1992 [32]. PRI was known to respond to sunlight; thus, it has diurnal change [33,34]. In addition, pigment pool size changes induce the vegetation growth and senescence affects the seasonal change of PRI [35,36,37]. In other words, PRI has seasonal features as well as diurnal characteristics, so it includes not only physiological features but also biochemical characteristics. Like this, although numerous vegetation indices can be classified based on structure, biochemical, physiology, and water content characteristics, vegetation index can be included both characteristics.
Given that the vegetation index behaves differently under normal (meteorological) and stress situations (e.g., extremely high air temperature, drought, and disease), the temporal change of vegetation index should be analyzed in an extended observation period [38]. The relative change of vegetation index based on the mean value of observation data measured for multiple years or decades can reveal vegetation conditions [39]. The vegetation condition index (VCI), which is calculated using minimum and maximum NDVI values observed for many years, is one of the representative indices for the structural status of vegetation. Low VCI values indicate relatively low vegetation biomass [40]. Unlike structural vegetation indices, obtaining the biochemical and physiological vegetation indices for many years is difficult. The bands onboard the satellite or UAV are limited, and the time series data on a cultivation period should be obtained once per year. Optical observation should be conducted in order to get hyper-spectrometer data of crop responses to different meteorological environment conditions in various regions. In addition, spectrum information under extreme weather events and stress conditions is needed to understand the performance of vegetation indices.
The purpose of this study is to assess the most suitable vegetation index for paddy rice that sensitively responds to various meteorological environments and stress conditions: (1) Elevated air temperature, (2) heat stress, (3) herbicide damage. In addition, this study aims to identify whether a plant is under stress conditions or not by using vegetation indices and meteorological variables in the vegetative and reproductive phases. The data for this study were obtained from the cultivation of paddy in a temperature gradient field chamber (TGFC) for three years; the purpose of this experiment was to study the crop response to various air temperatures in order to prepare for global warming. The growth parameters such as plant height, LAI, biomass, and grain yield were investigated, and spectral reflectance of paddy rice was measured using the spectrometer.

2. Data and Methodology

2.1. Study Area and Cultivation

The TGFCs for this study were located in Chonnam National University, Gwangju, Republic of Korea (35°10’26” N, 126°53’56” E) to simulate warming conditions (Figure 1a). The six TGFCs were originally established (Figure 1b), and the four TGFCs were operated from 2016 to 2018. The height and width of TGFC were about 2.0 and 1.8 m, and the length was approximately 24 m. Four instrument shelters to measure air temperature were installed in each TGFC (Figure 1c). The air temperature measured by the first instrument shelter from the entrance was defined as ambient air temperature (AT, °C) and was 0.65 °C higher on average than the air temperature outside during the crop growing period owing to the TGFC film. A heater and three exhaust fans in each TGFC were continually controlled to maintain a temperature of AT + 3 °C at the fourth instrument shelter from the entrance. The heater supplies hot air in the TGFC, and the exhaust fans take out the air from the TGFC to lower air temperature and to circulate the air. In addition, the transmittance of the film, which is made of ethylene tetra fluoro ethylene (ETFE), is above 92% at visible and NIR wavelengths [41]. Thus, the advantage of these facilities is that they utilize natural sunlight, so it is possible to evaluate the impact of higher air temperature on the crop instead of artificial light.
The paddy rice was cultivated from 2016 to 2018; it was transplanted on June 3 2016; June 15 2017; and June 1 2018 in the TGFCs. Cultivars, which had characteristics of medium-late maturity, were used for three years. Ilmi variety was cultivated in 2016 and 2018, and the Saenuri cultivar was cultivated in 2017. Ilmi and Saenuri are included in japonica rice cultivars. The planting was done by hand, with a density of three plants per hill and planting distance of 15 × 30 cm. In 2017, lysimeters were installed in two TGFCs located in the AT and AT + 3 °C positions. Additional lysimeters were installed in one TGFC in 2018. The transplanting of paddy rice in the lysimeter chamber was carried out following the same procedure as for the non-lysimeter chamber. The paddy rice was harvested on October 13 2016; October 10 2017; and September 27 2018.
The amount of fertilizers was given as follows: N = 9; P = 4.5; K = 5.7 kg/10 a. By transplanting day, about 50%, 100%, and 70% of the total fertilizer (nitrogen (N), phosphorus (P), and potassium (K)) for the cultivation period had been applied. About 20% of N was added 14 days after transplanting day. Finally, about 30% and 30% of N and K were treated in the panicle initiation stage. In 2017, the herbicide was used to eliminate weeds in paddy fields in the non-lysimeter chambers. Unfortunately, the herbicide component remained in the TGFC, which is a closure field, and affected the growth and development of the paddy rice. The plant height, LAI, NDVI values, and tillering number in the early stage of crop growth were lower in the damaged paddy rice as compared to the non-damaged paddy rice. In addition, the poor growth and development of the paddy rice in the damaged area were confirmed throughout the field survey. In this study, herbicide-induced damages were defined as abnormal growth.
In this study, the cultivated paddy rice in the TGFC was classified as the normal growth and development (hereafter normal growth) and herbicide-induced abnormal growth and development (hereafter abnormal growth) in Category 1 (Figure 2) based on growth parameters and field survey in the vegetative phase. The normal growth was sub-divided as common condition and heat stress states in Category 2 because the grain yield was different depending on the exposure degree of heat stress although the growth and development of paddy rice were normal under the extremely high temperature. The heat stress samples were defined by a ripening ratio below 75%.

2.2. Measurement Data

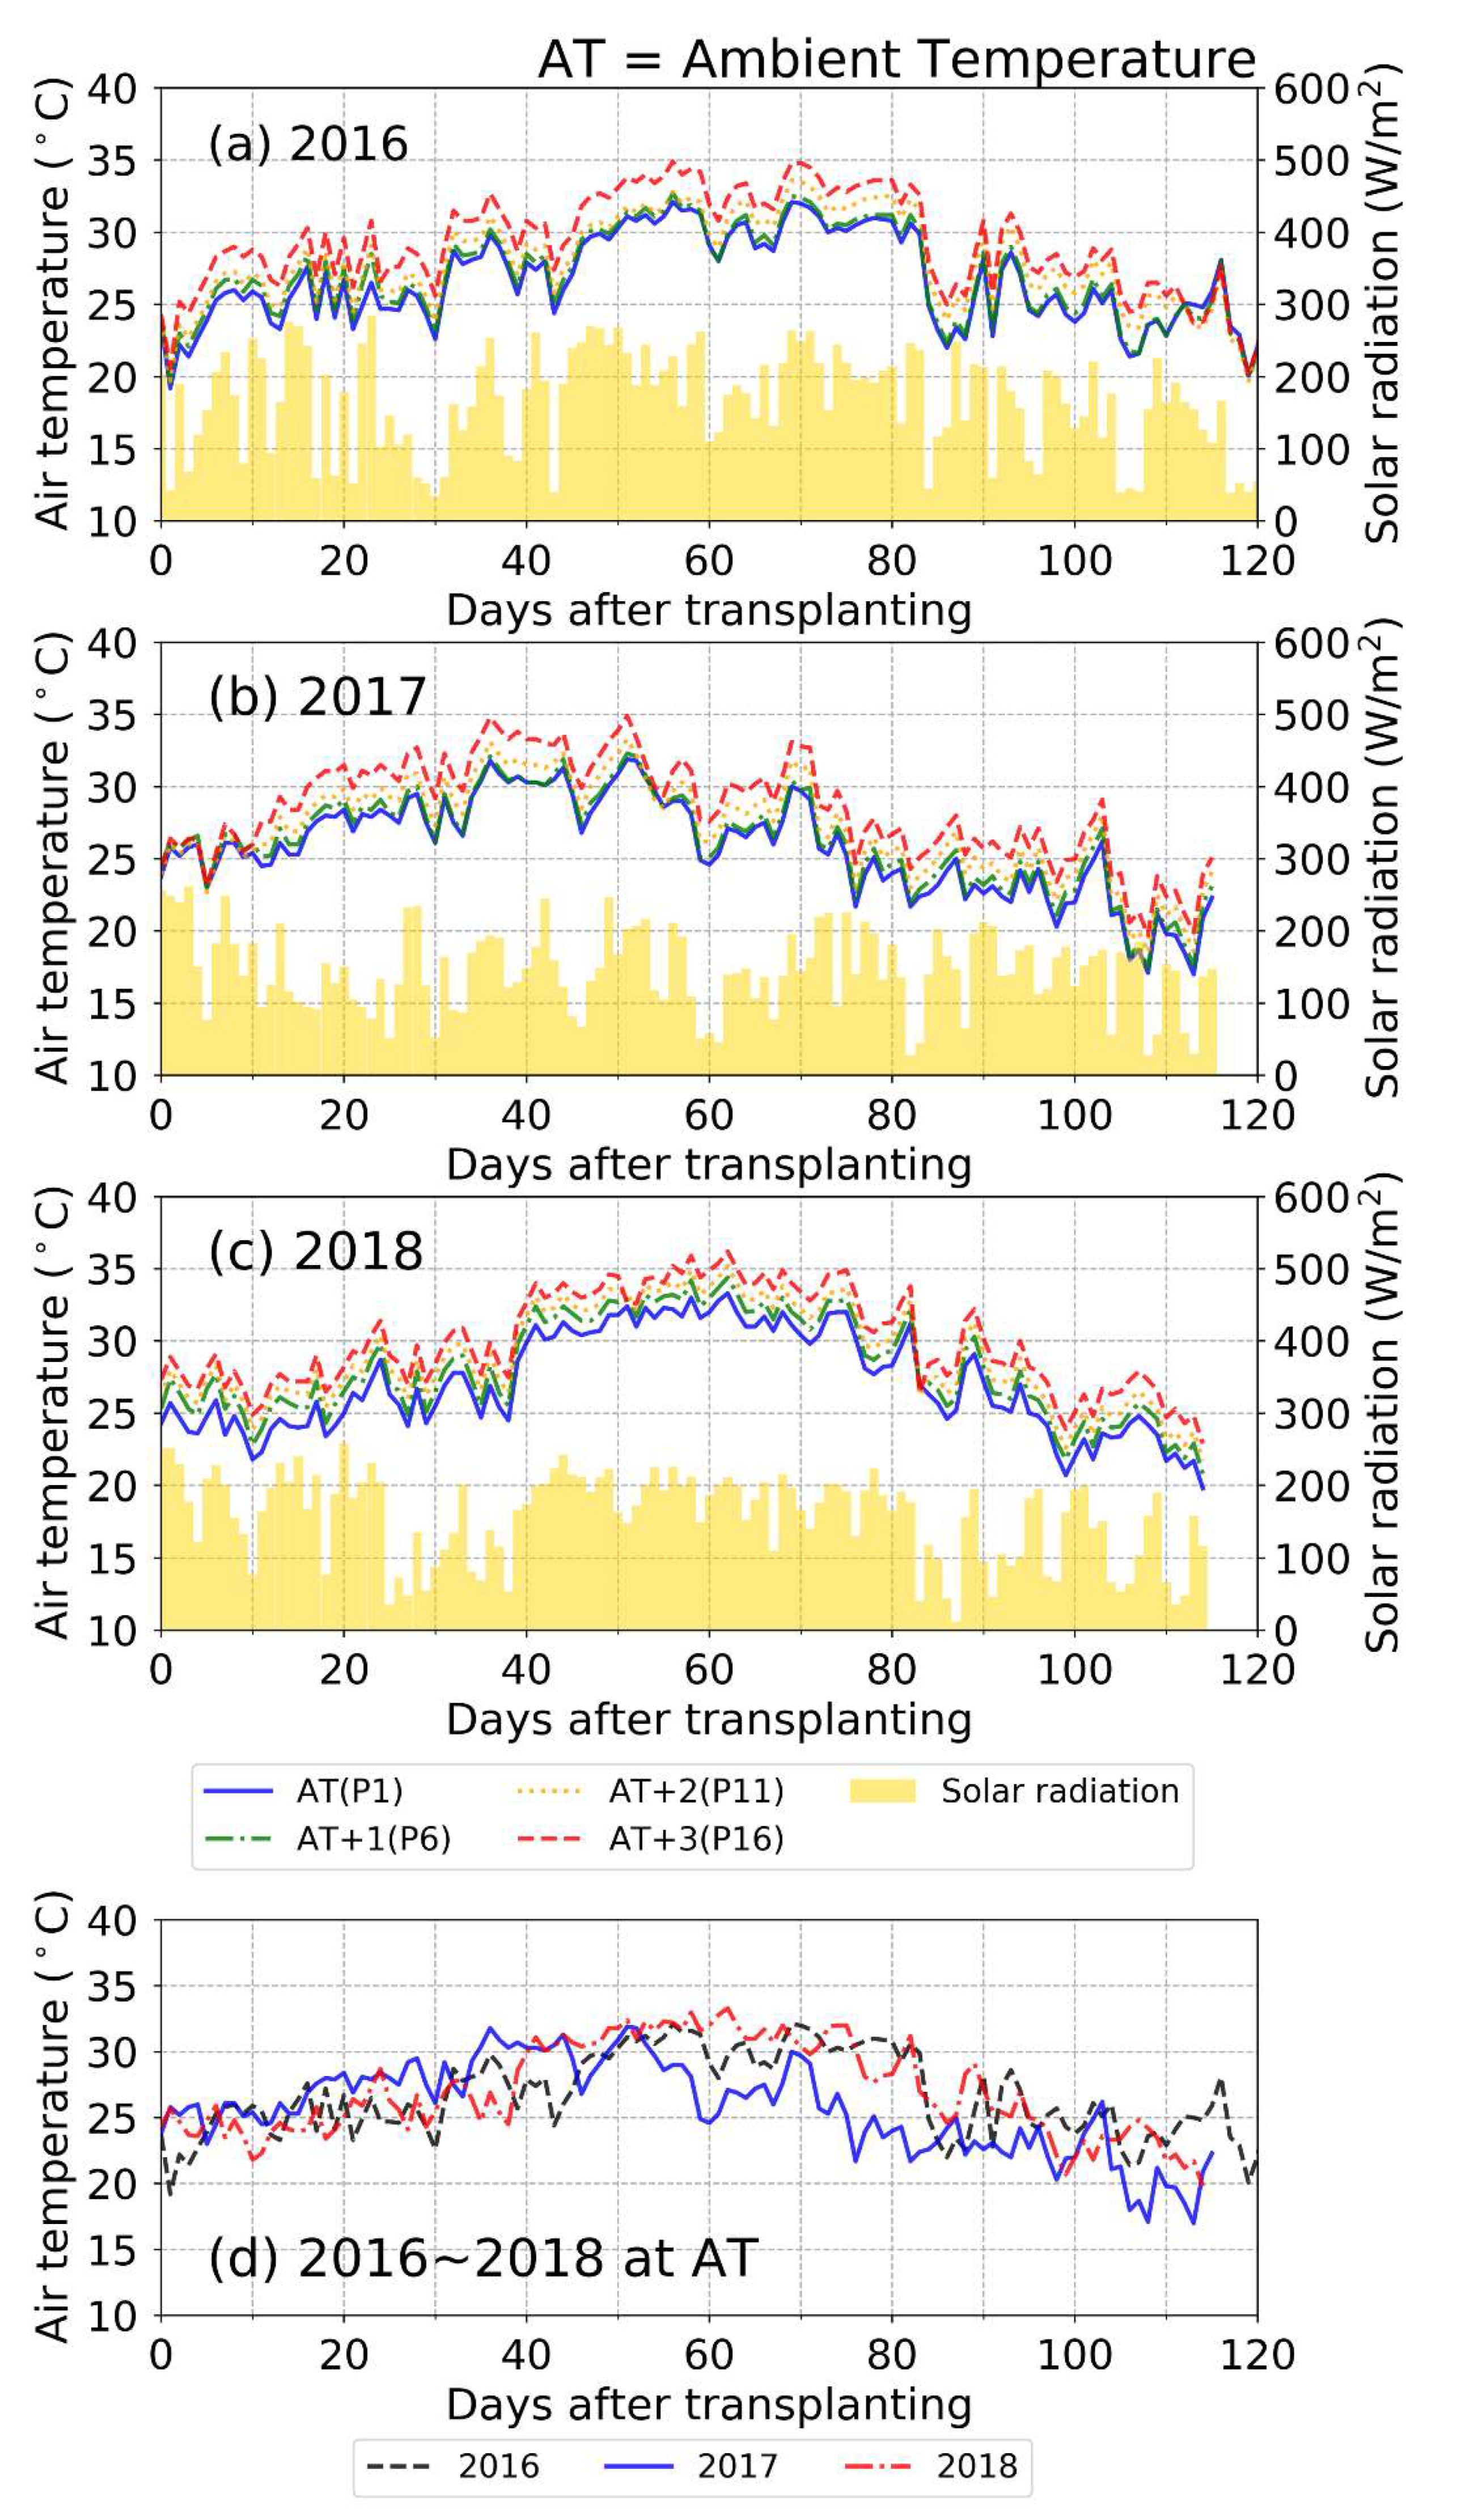
2.2.1. Meteorological Data

Four instrument shelters hanging in the middle of the TGFC measured the air temperature (°C) in each TGFC. A temperature probe (107, Campbell Scientific Inc., Logan, UT, USA), which is a type of thermistor with a tolerance of approximately ±0.2 °C, was used to measure the air temperature in the TGFC. The four temperature probes and instrument shelters were installed, and the position of the four shelters denoted as AT, AT+1, AT+2, and AT + 3 °C. TGFC systems are automatically an effort to maintain these conditions using the heater and three exhaust fans. In this study, the positions were divided into 16 equal intervals in each TGFC, and they were labeled from position 1 (P1) up to position 16 (P16). The four positions located in instrument shelters were position 1 (P1), position 6 (P6), position 11 (P11), and position 16 (P16). All meteorological data were recorded by the CR10X data logger (Campbell Scientific Inc., Logan, UT, USA) every 5 min and averaged based on 4 s interval scan data. Solar radiation information such as solar insolation and photosynthetically active radiation (PAR) was measured by a pyranometer (LI-200R, LI-COR Inc., Lincoln, Nebraska, USA) and a quantum sensor (LI-190R, LI-COR Inc., Lincoln, Nebraska, USA). These radiation sensors were installed inside and outside of TGFC to consider TGFC transmittance.
Figure 3 is an example of a time series for a daily mean air temperature and solar radiation for the three-year period in one TGFC. A solid blue line indicates the AT. Green dash-dot line, orange dot line, and red dash line show AT + 1, AT + 2, and AT + 3 °C, respectively. The difference in air temperature between two adjacent stations was not always 1 °C because these facilities were automatically controlled based on the AT and AT + 3 °C positions. Thus, analyses were conducted using cumulative air temperature in each position. The growing degree days (GDD) were calculated as follows: GDD = daily mean air temperature – base air temperature. Here, the daily mean air temperature was calculated based on data recorded in the data logger every 5 min. The base air temperature of the paddy rice is 10 °C [42]. GDD was accumulated for GDDs > 0 to evaluate the effect of air temperature under the same solar radiation condition in each position.
A heatwave occurred in this study area during the booting and heading stages in 2016, but this meteorological situation did not occur in 2017. According to the Korea Meteorological Administration (KMA), the worst heatwave in meteorological history happened in 2018. The heatwave lasted for one month from mid-July to mid-August in 2018. The highest solar radiation and air temperature were recorded during this period (Figure 3c). Therefore, the response of crop due to high air temperature was analyzed during this heatwave period. Although the optimum daily mean air temperature of paddy rice for the growth and development changes depending on the cultivars and the growth stage [43], it is generally 25~32 °C [44].

2.2.2. Ground Measurements of Growth Parameters

Growth parameters such as plant height, LAI, above-ground dry matter (AGDM), and grain yield were measured to evaluate their responses to elevated air temperature, heat stress, and herbicide damage. Plant height was measured at all chambers every week. For three years, the number of chambers used for plant height was 8, and measurement positions were 22. Finally, the 227 observations of plant height were used in this study. LAI was measured by LAI-2000 (LI-190R, LI-COR Inc., Lincoln, Nebraska, USA) at all chambers every week. The number of chambers used for observing LAI observation was nine for the three year period. The number of positions and data on LAI was 26 and 279, respectively. The AGDM was measured to accurately comprehend the growth of paddy rice. In the first year (2016), AGDM was only measured at mature stage to analyze yield components of rice. In 2017 and 2018, it was measured at seven growing stages and fifteen times: Tillering stage (Jun. 18 2018), stem elongation (Jul. 14 2017; Jul. 4 2018), panicle initiation stage (Jul. 26 2017; Jul. 18 2018), booting stage (Aug. 9 2017; Aug. 6 2018), heading stage (Aug. 28 2017; Aug. 14 2018), milk-and-dough stage (Sep. 14 2017; Aug. 22 2018; Sep. 5 2018; Sep. 21 2018), and mature stage (Oct. 17 2017; Sep. 27 2018). The number of AGDM positions and data, during the three years, was 38 and 113, respectively. To measure AGDM, the root of paddy rice was removed, and the AGDM was dried at 70 °C in the dryer for four days to maintain a constant humidity. The yield components such as grain yield (g/m2), AGDM (g), harvest index, number of panicles per area, number of spikelets per panicle, ripening ratio (%), and 1000 grain weight (g) were measured in 9 chambers and 38 positions during the harvesting period. Grain yield and ripening ratio among the yield components were analyzed with vegetation indices. The number of ground measurements for growth parameters in 2017 and 2018 was adjusted based on the 2016 results. Information on ground measurements is summarized in Table 1.

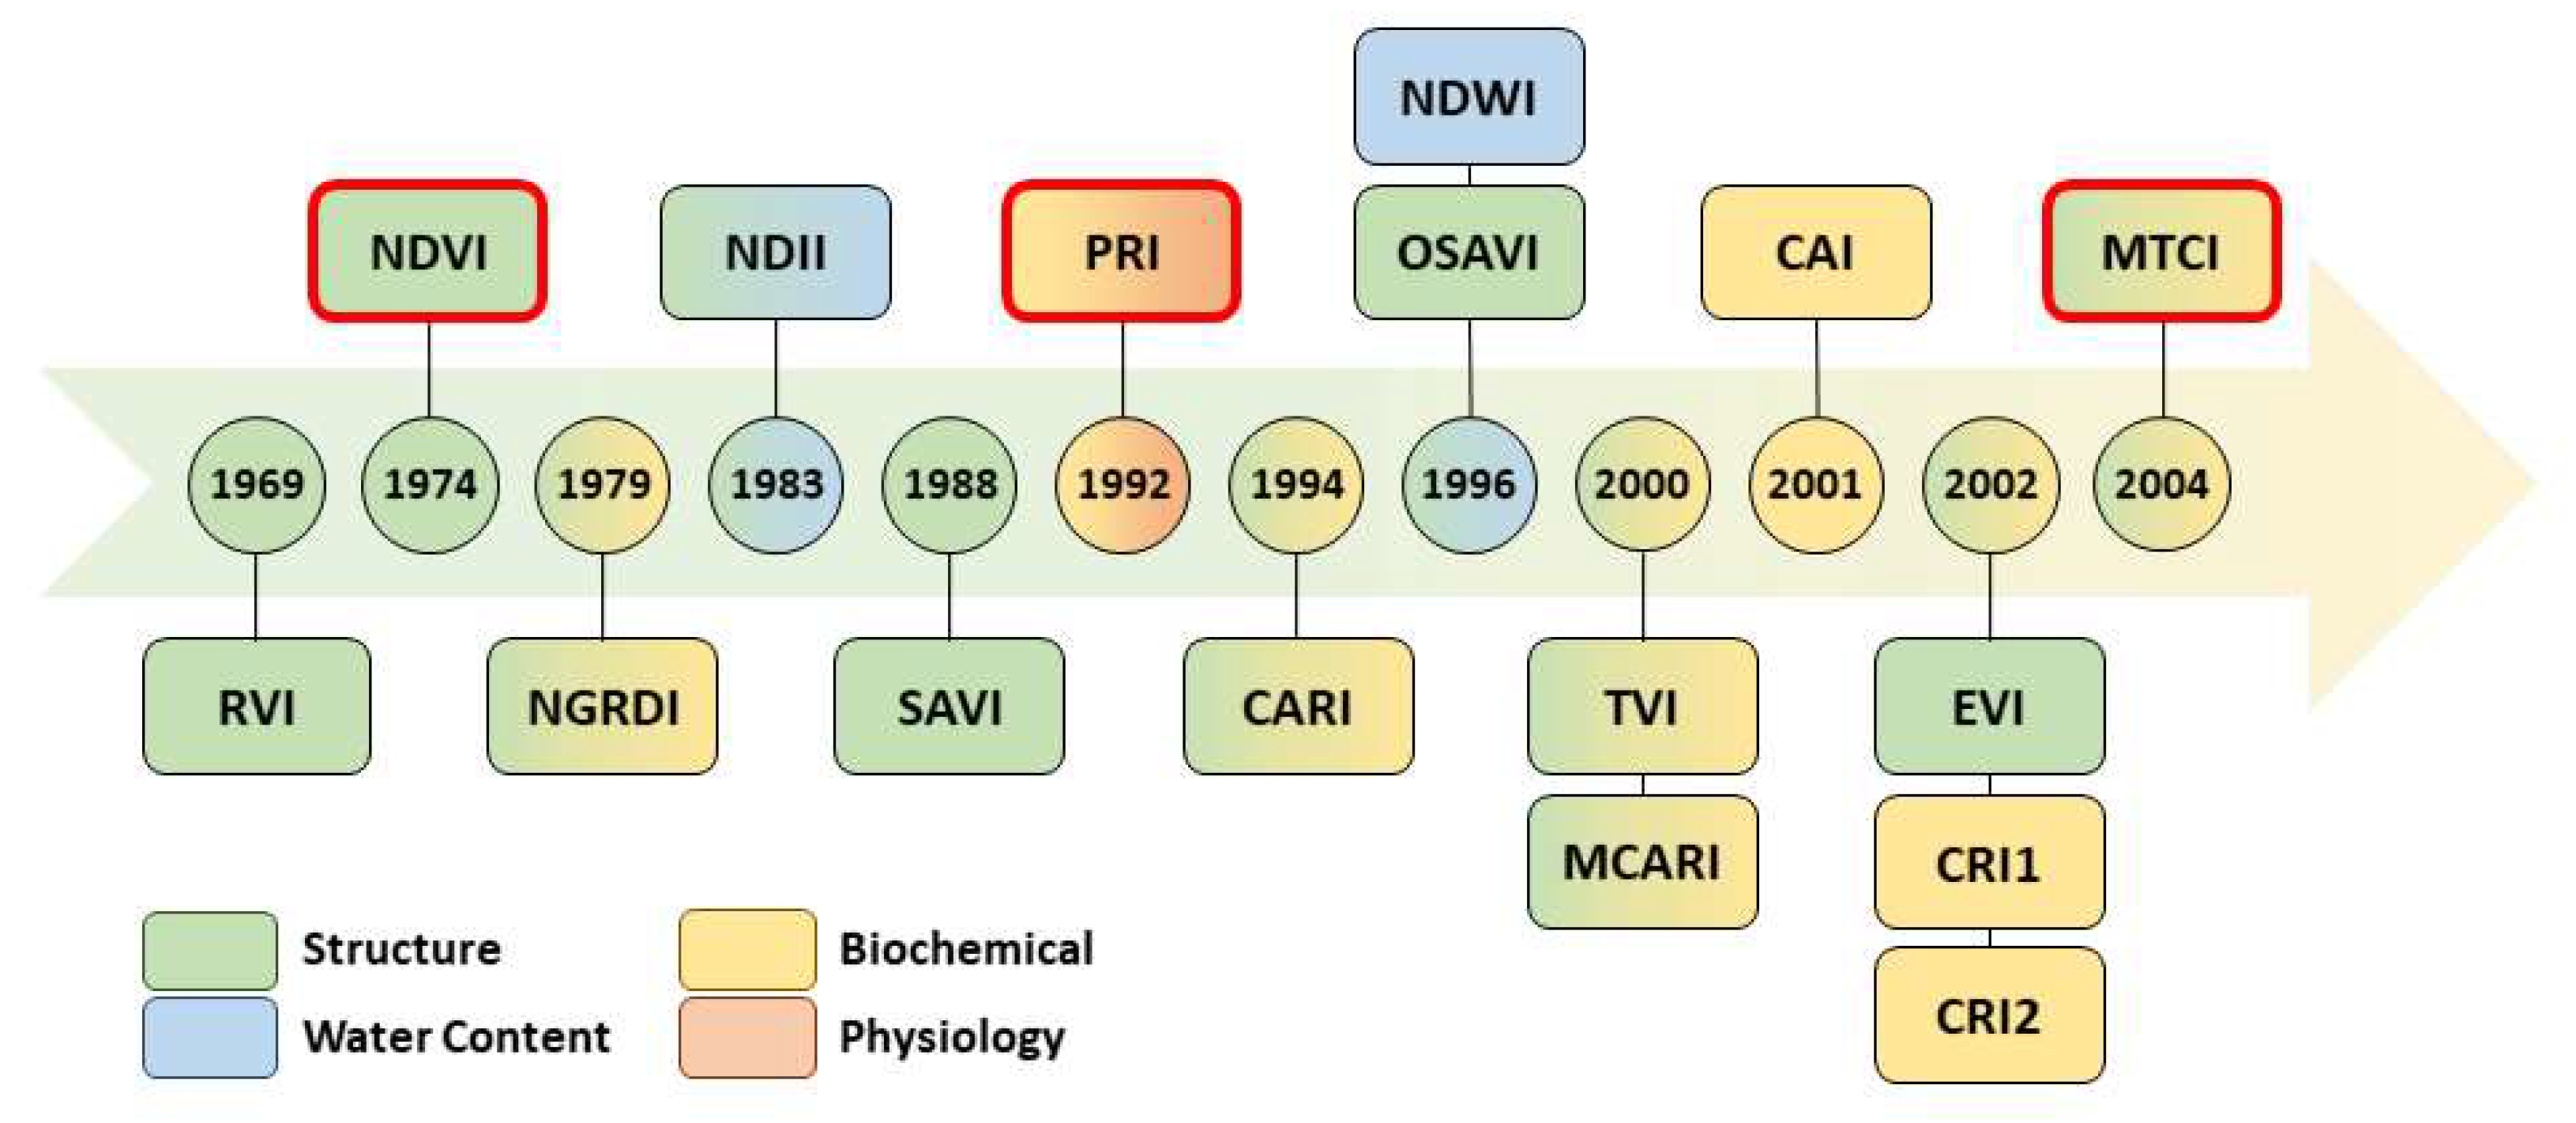
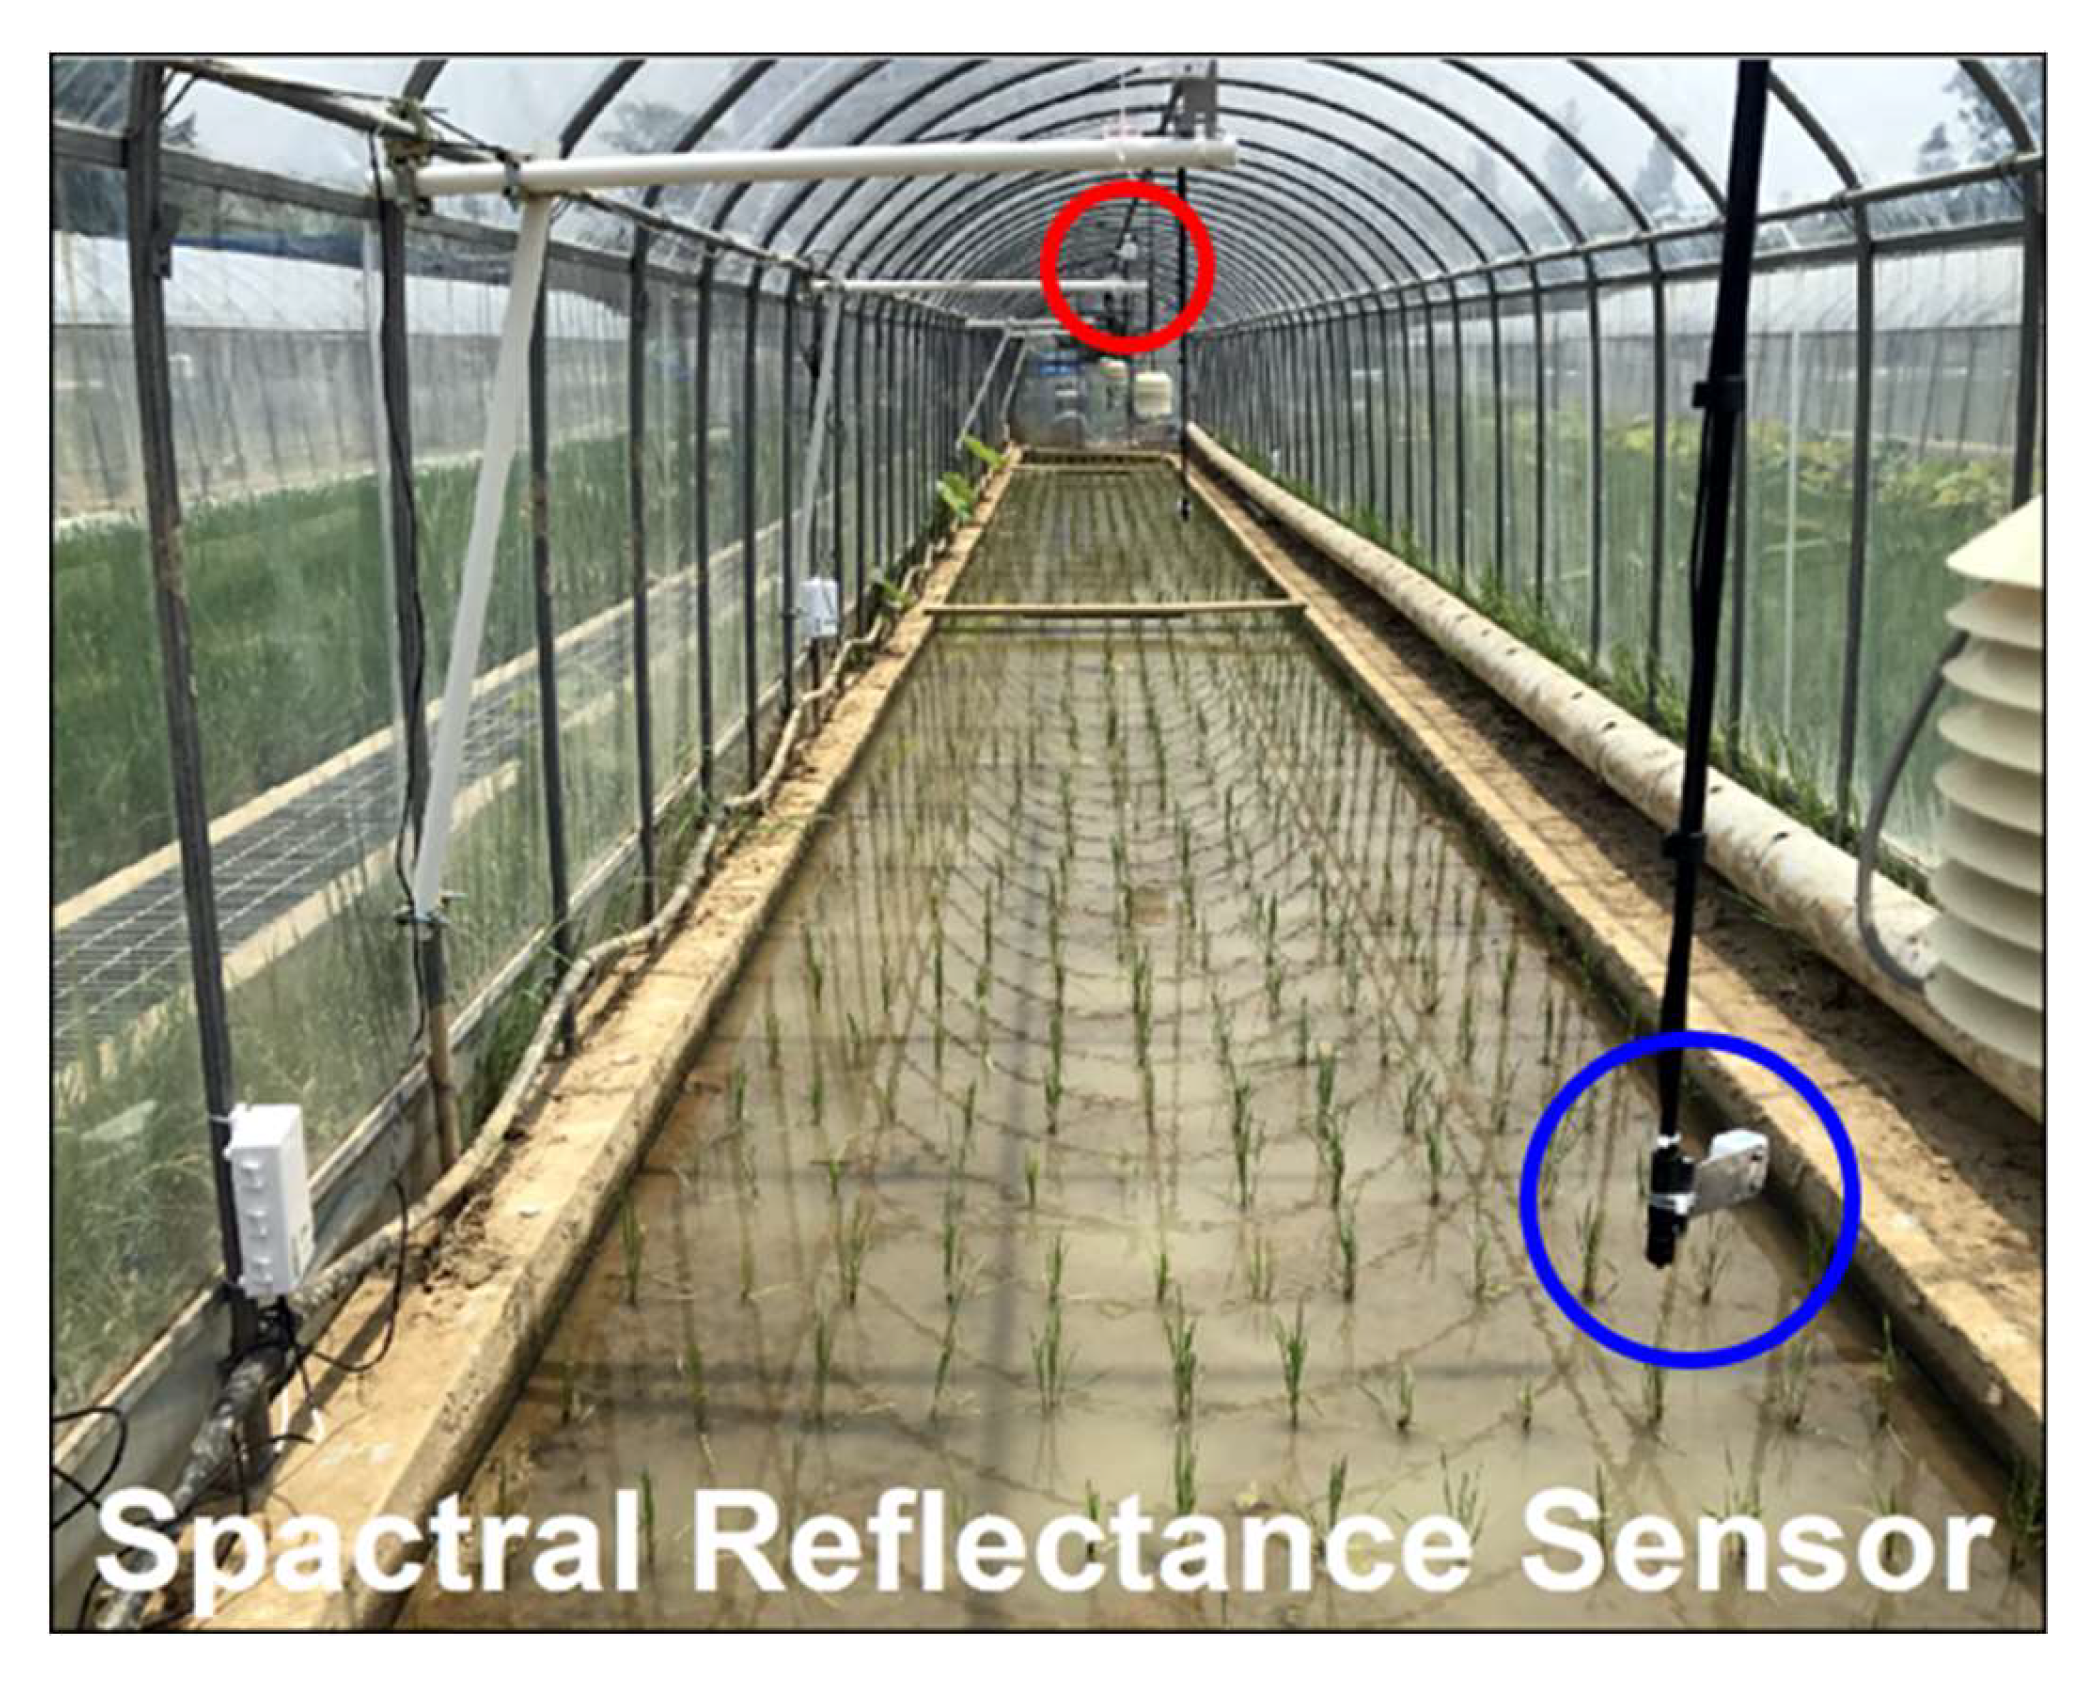
2.2.3. Optical Measurements for Vegetation Indices

Optical measurements were carried out to monitor the conditions of paddy rice. In this study, two types of devices were used to calculate vegetation indices. First, a field-spectrometer was used to measure spectral reflectance-based vegetation indices. Analytical spectral devices (ASD) Fieldspec 3 spectrometers (hereafter Fieldspec; Malvern Panalytical Ltd., Malvern, UK) were used in 2016. The wavelength range on Fieldspec spectrometer is 350~2500 nm. Spectral resolution and sampling interval in wavelength for calculating vegetation indices are 3 at 700 nm and 1.4 at 350~1050 nm. In 2017 and 2018, Avantes AvaSpec-UL2048L spectrometers (hereafter Avantes; Avantes BV, Apeldoorn, Netherlands) were used. The wavelength range of the Avantes spectrometer is 300 to 1100 nm, and this device observes visible and NIR wavelengths. The sampling interval is about 0.576 at 700 nm. Field of view (FOV) of the spectrometers is 23°. In this study, two spectrometers were used to measure solar irradiance and radiance at solar noon time that has the minimum solar zenith angle during the day. The radiance was the value reflected from paddy rice, and the observation radius and areas of the radiance were about 0.41 m and 0.52 m2 at a 1-m height from the target. Solar irradiance was the value reflected from a white reference panel (RS50 White Reflectance Standard, StellarNet Inc., Florida, USA; >97% reflectance between 300 and 1700 nm). Measurements were carried out inside the TGFC to determine the influence of the film as the micro-climate conditions inside the TGFC were different from the conditions outside [45]. After conducting an inter-calibration between two spectrometers, the reflectance at each wavelength was calculated from a ratio between radiance and solar irradiance. Vegetation indices were then computed.
Three vegetation indices were selected among various others based on three biophysical types, i.e., structural, biochemical, and physiological types (Figure 4, Table 2). The NDVI represents the structure of vegetation; it usually uses red and NIR wavelengths. It has been thoroughly studied compared to other structural vegetation indices such as SAVI and OSAVI and measured using a satellite and drone. The EVI was excluded to avoid the influence of the weak transmittance of blue wavelength on the ETFE film of the TGFC. The MTCI was chosen as a structural–biochemical index. It is produced using the Sentinel-2 satellite and the data obtained can be utilized in precision agriculture [46,47]. Last, the PRI was selected as a biochemical–physiological vegetation index. We hypothesized that the PRI can detect the crop stress caused by heatwave because it is highly related to the photosynthetic performance [48,49].
Second, a photodiode-based spectral reflectance sensor (hereafter SRS; METER group Inc., Pullman, WA, USA) was used to continually monitor paddy rice at AT and AT + 3 °C positions in 2017 and 2018. The NDVI and PRI were measured using SRS, and they were processed as daily mean values. In this process, data measured from 11 to 14 o’clock were used to utilize the seasonal signal of PRI that reflects the diurnal and seasonal changes [50]. The processed PRI was used to evaluate the response of paddy rice under the heatwave. SRS was installed in the TGFC (Figure 5), and the distance between the sensor and plants was maintained consistently. SRS data used in this study was saved in the EM50 data logger (METER group Inc., Pullman, WA, USA) every one minute.

3. Results and Discussion

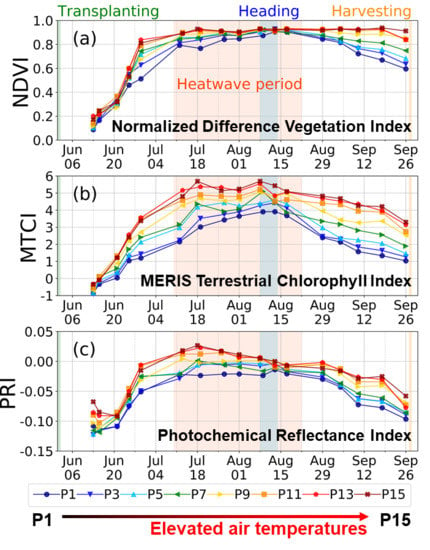
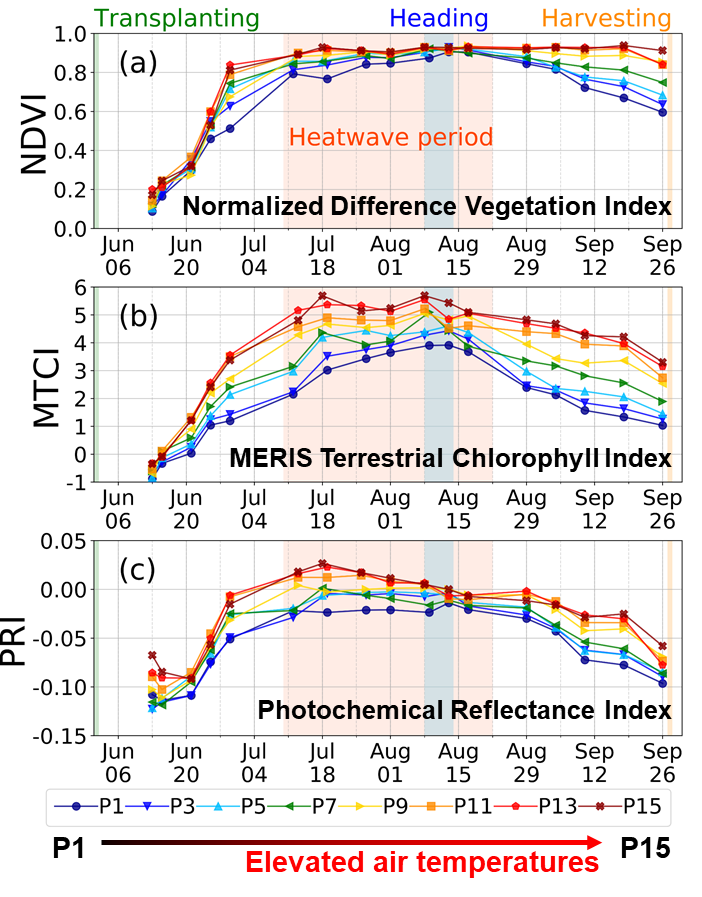
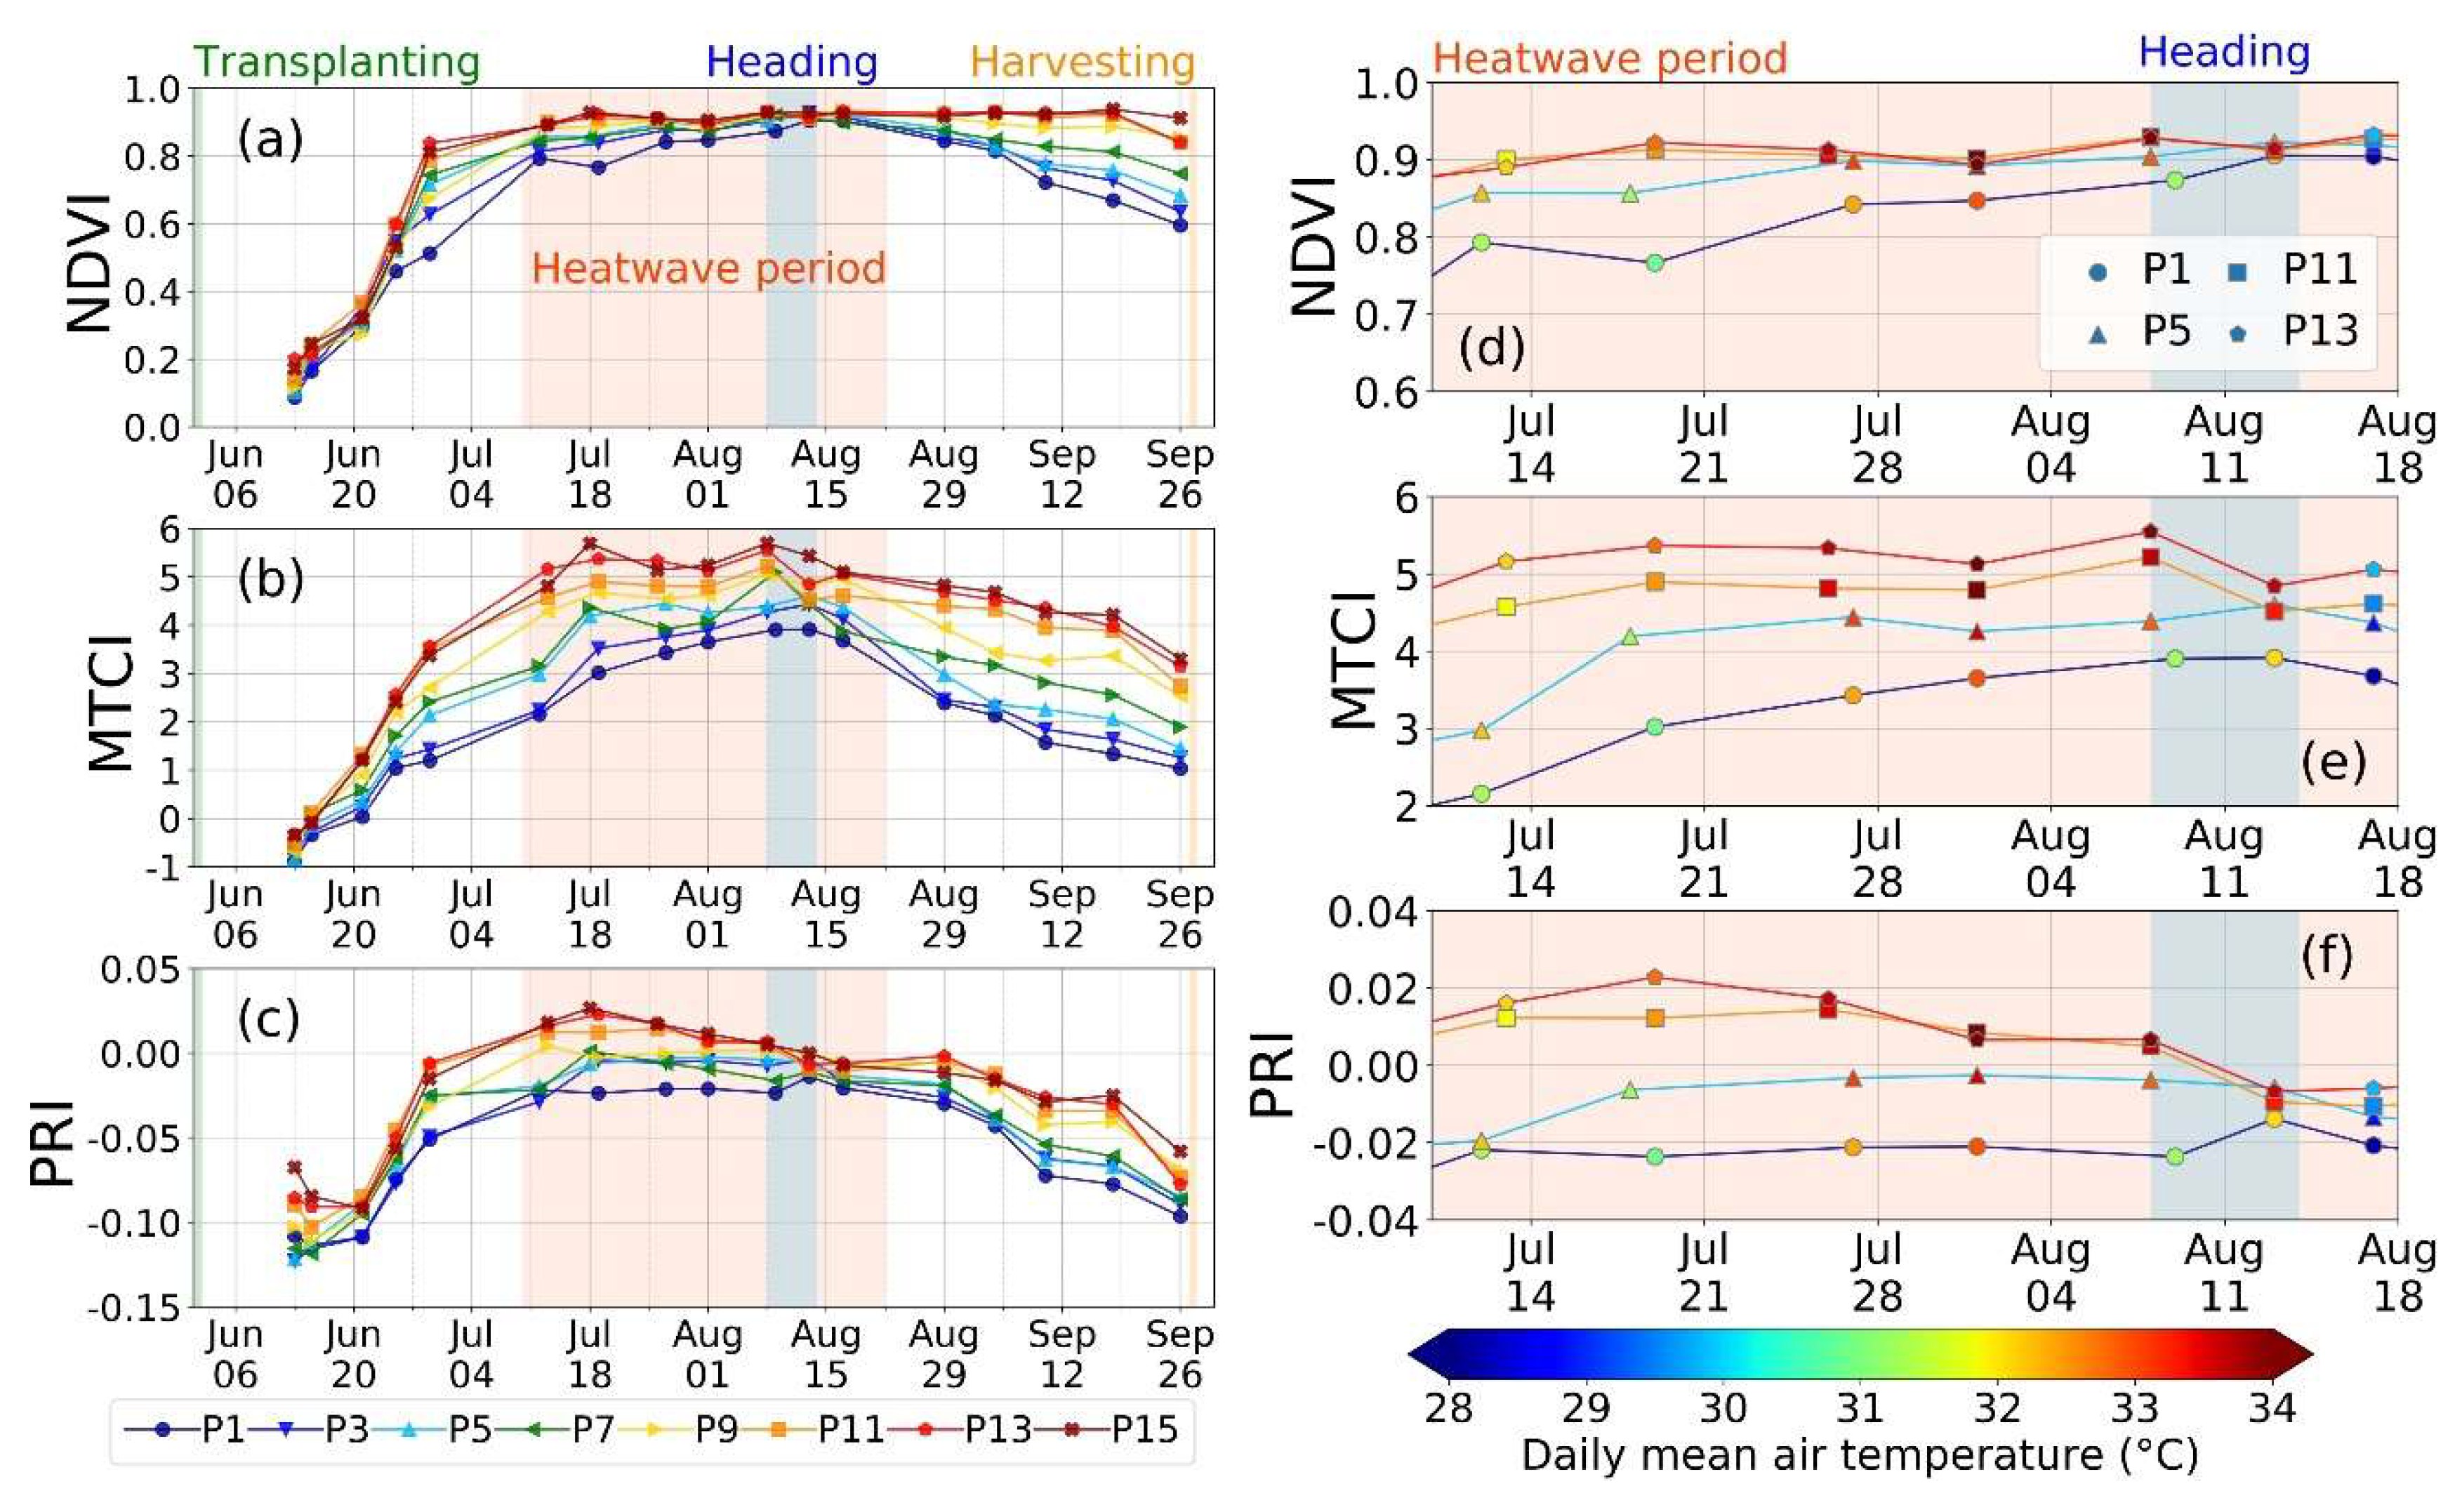
3.1. Time Series of NDVI, MTCI, and PRI Under Elevated Air Temperature

Time series of the vegetation indices, which reflect the elevated air temperature and measured using spectrometers, were evaluated during the whole cultivation period. The NDVI, MTCI, and PRI were selected as representative structural, structural–biochemical, and biochemical–physiological vegetation indices, respectively. These vegetation indices included the fraction of vegetation and each characteristic of vegetation indices. In 2018, NDVI increased after the transplanting stage until the heading stage (Figure 6a), and the gradient of NDVI was sharp at a high air temperature before the heading stage. The NDVIs at the eight positions were saturated in the heading stage, although they were exposed to different air temperatures. This saturation effect was known to occur in the vegetation index using a red wavelength such as NDVI [51,52]. After the heading stage, the NDVI decreased at the P1 (AT) position, but it had consistent value at P15 (AT + 2.37 °C). The time series of MTCI sensitively expressed the growth of paddy rice (Figure 6b). The value of MTCI at P15 (AT + 2.37 °C) was higher than that at P1 (AT). Unlike NDVI, the MTCIs exposed to various air temperatures were largely different among each temperature gradient condition in the heading stage because the red-edge band, which was used to calculate MTCI, tended to reduce saturation [53]. After the heading stage, the MTCI decreased at all positions. The PRI showed variability in the first optical measurement due to background effects, such as soil and water (Figure 6c), and it rapidly increased after that. The PRI decreased after the heading stage at the AT position due to senescence of the leaf [37]. However, decreasing trends in PRI occurred under high air temperatures before the heading stage, unlike NDVI and MTCI. According to Cao et al. [53], PRI was the most sensitive to heat stress among 17 published vegetation indices; this sensitivity is due to the relation between PRI and photosynthesis activity. In addition, given that seasonal change of PRI is associated with the ratio of chlorophyll and carotenoid [49,54], PRI can accurately detect the stress. Chou et al. [55] showed that the PRI had a relatively low value under the water stress and it was related to the change in the chlorophyll-to-carotenoid ratio. However, the chlorophyll content at the leaf scale did not significantly change. Given that the MTCI, which is related to chlorophyll, did not decrease under the extremely high air temperature in this study (Figure 6b), the PRI decrease is assumed to be due to the carotenoid change rather than chlorophyll. Carotenoid levels can increase to protect plants from heat stress [56]. The PRI had a positive correlation with the chlorophyll/carotenoid ratio, which decreased under heat shock [55,57].
In this study, vegetation indices in the four positions, P1 (AT), P5 (AT + 0.91), P11 (AT + 1.71), and P13 (AT + 2.00 °C), were analyzed during the heatwave period using detailed air temperature data (Figure 6d,e,f). The four positions were selected to consider the change of spectral reflectance. The spectral reflectance in visible wavelength decreased during the period from July 17 2018 to August 12 2018 in all positions. However, the spectral reflectance in the NIR wavelength was different. The NIR increased in P1 and P5 from July 17 2018 to August 12 2018 due to the growth of paddy rice. However, NIR wavelength had a consistent value for about one month in P11; this value decreased in P13 when exposed to the extremely high air temperatures. As a result, NDVI in P1 and P5 increased, and the value in P11 remained constant during the heatwave period. Although the NIR decreased in P13, NDVI was similar to NDVIs in the other positions during the heatwave period due to a low reflectance of the red band. In addition, MTCI showed a similar trend to the NDVI. Conversely, PRI exposed to high air temperatures decreased faster than that in AT position (Figure 6f). The first PRI decrease during the heatwave period (from July 10 2018 to August 17 2018) occurred in P13, with a daily mean and maximum air temperature of 33.35 and 35.69 °C, respectively. In P1 and P5, the PRI decreased after the heading stage, and the daily mean air temperature was below 32.0 °C.

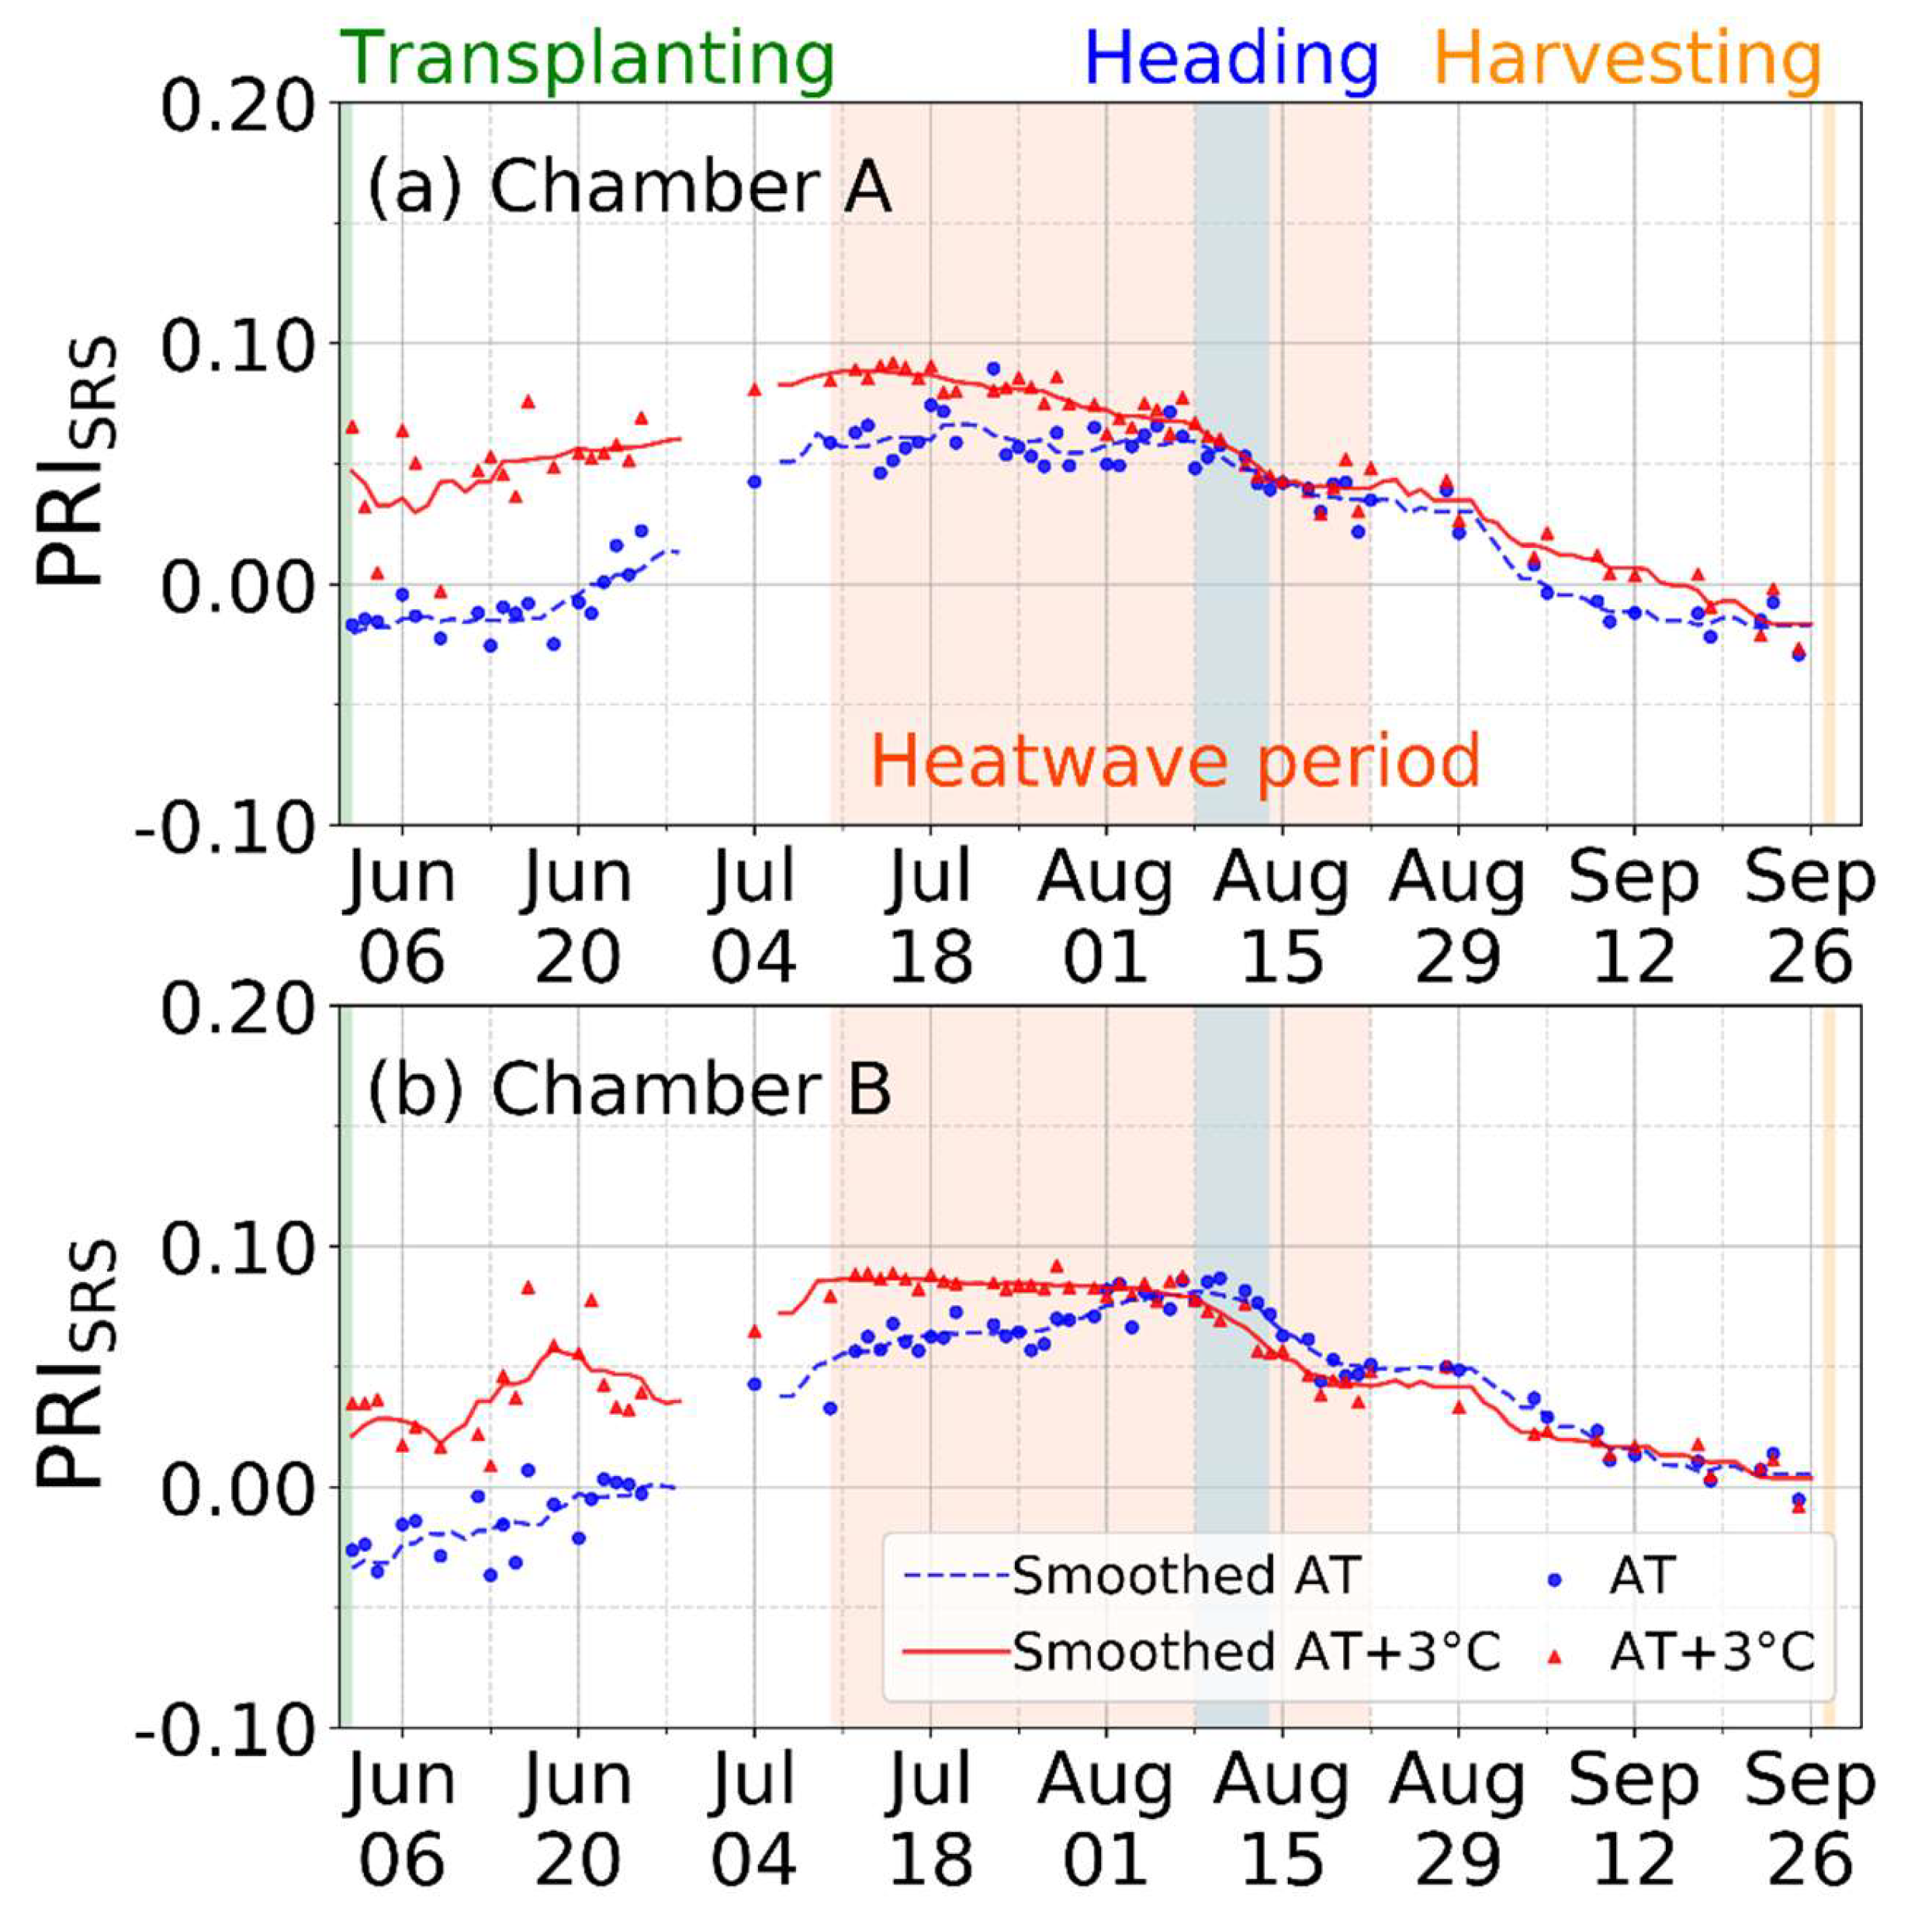
3.2. Performance of PRI Under the Heat Stress

PRI and NDVI were continually observed using SRS at AT and AT + 3 °C in 2017 and 2018. These two vegetation indices were processed based on 1 day. SRS-based PRI (hereafter PRISRS) in 2018 was analyzed because no heatwave occurred in 2017. SRS-based NDVI did not analyze because it did not respond to the heatwave like the results of spectrometers. Figure 7 shows the time series of PRISRS at two positions in 2018. PRISRS increased after the transplanting stage as PRI was measured by the spectrometer. PRISRS at AT + 3 °C was higher than that at AT before the heading stage. The decreasing time of PRISRS at AT appeared in the heading stage, but at AT + 3 °C, the decrease occurred early on the heatwave before the heading stage. This pattern of PRISRS was most noticeable in the AT + 3 °C position of chamber A; PRISRS did not increase in the AT + 3 °C position of chamber B. In other words, the decreasing characteristics of PRI in plot spatial scales showed the same behavior under heat stress as the previous study PRI characteristics at leaf spatial scale [53].
PRI normally decreases after the heading stage due to the leaf senescence [37,58]. Thus, this study assumes that the difference (hereafter, delta date; unit: Days) between the decline date in PRI and the heading stage date was related to heat stress. The delta date includes the error because the optical measurement using the spectrometer was averagely conducted once per week. Figure 8 shows the relationship between cumulative hours when the air temperature is above 35 °C and delta date. Here, 35 °C is the threshold air temperature of paddy rice for heat stress [59]. The data collected from spectrometer-based PRI and PRISRS from 2016 to 2018 were used in this relationship with cumulative hours. The correlation value in this relationship was −0.75 (p-value < 0.0001). The decline in PRI started early when the heat stress was maintained for a long time. This means that PRI responded to heat stress.

3.3. Performance of Vegetation Indices Under the Abnormal Growth

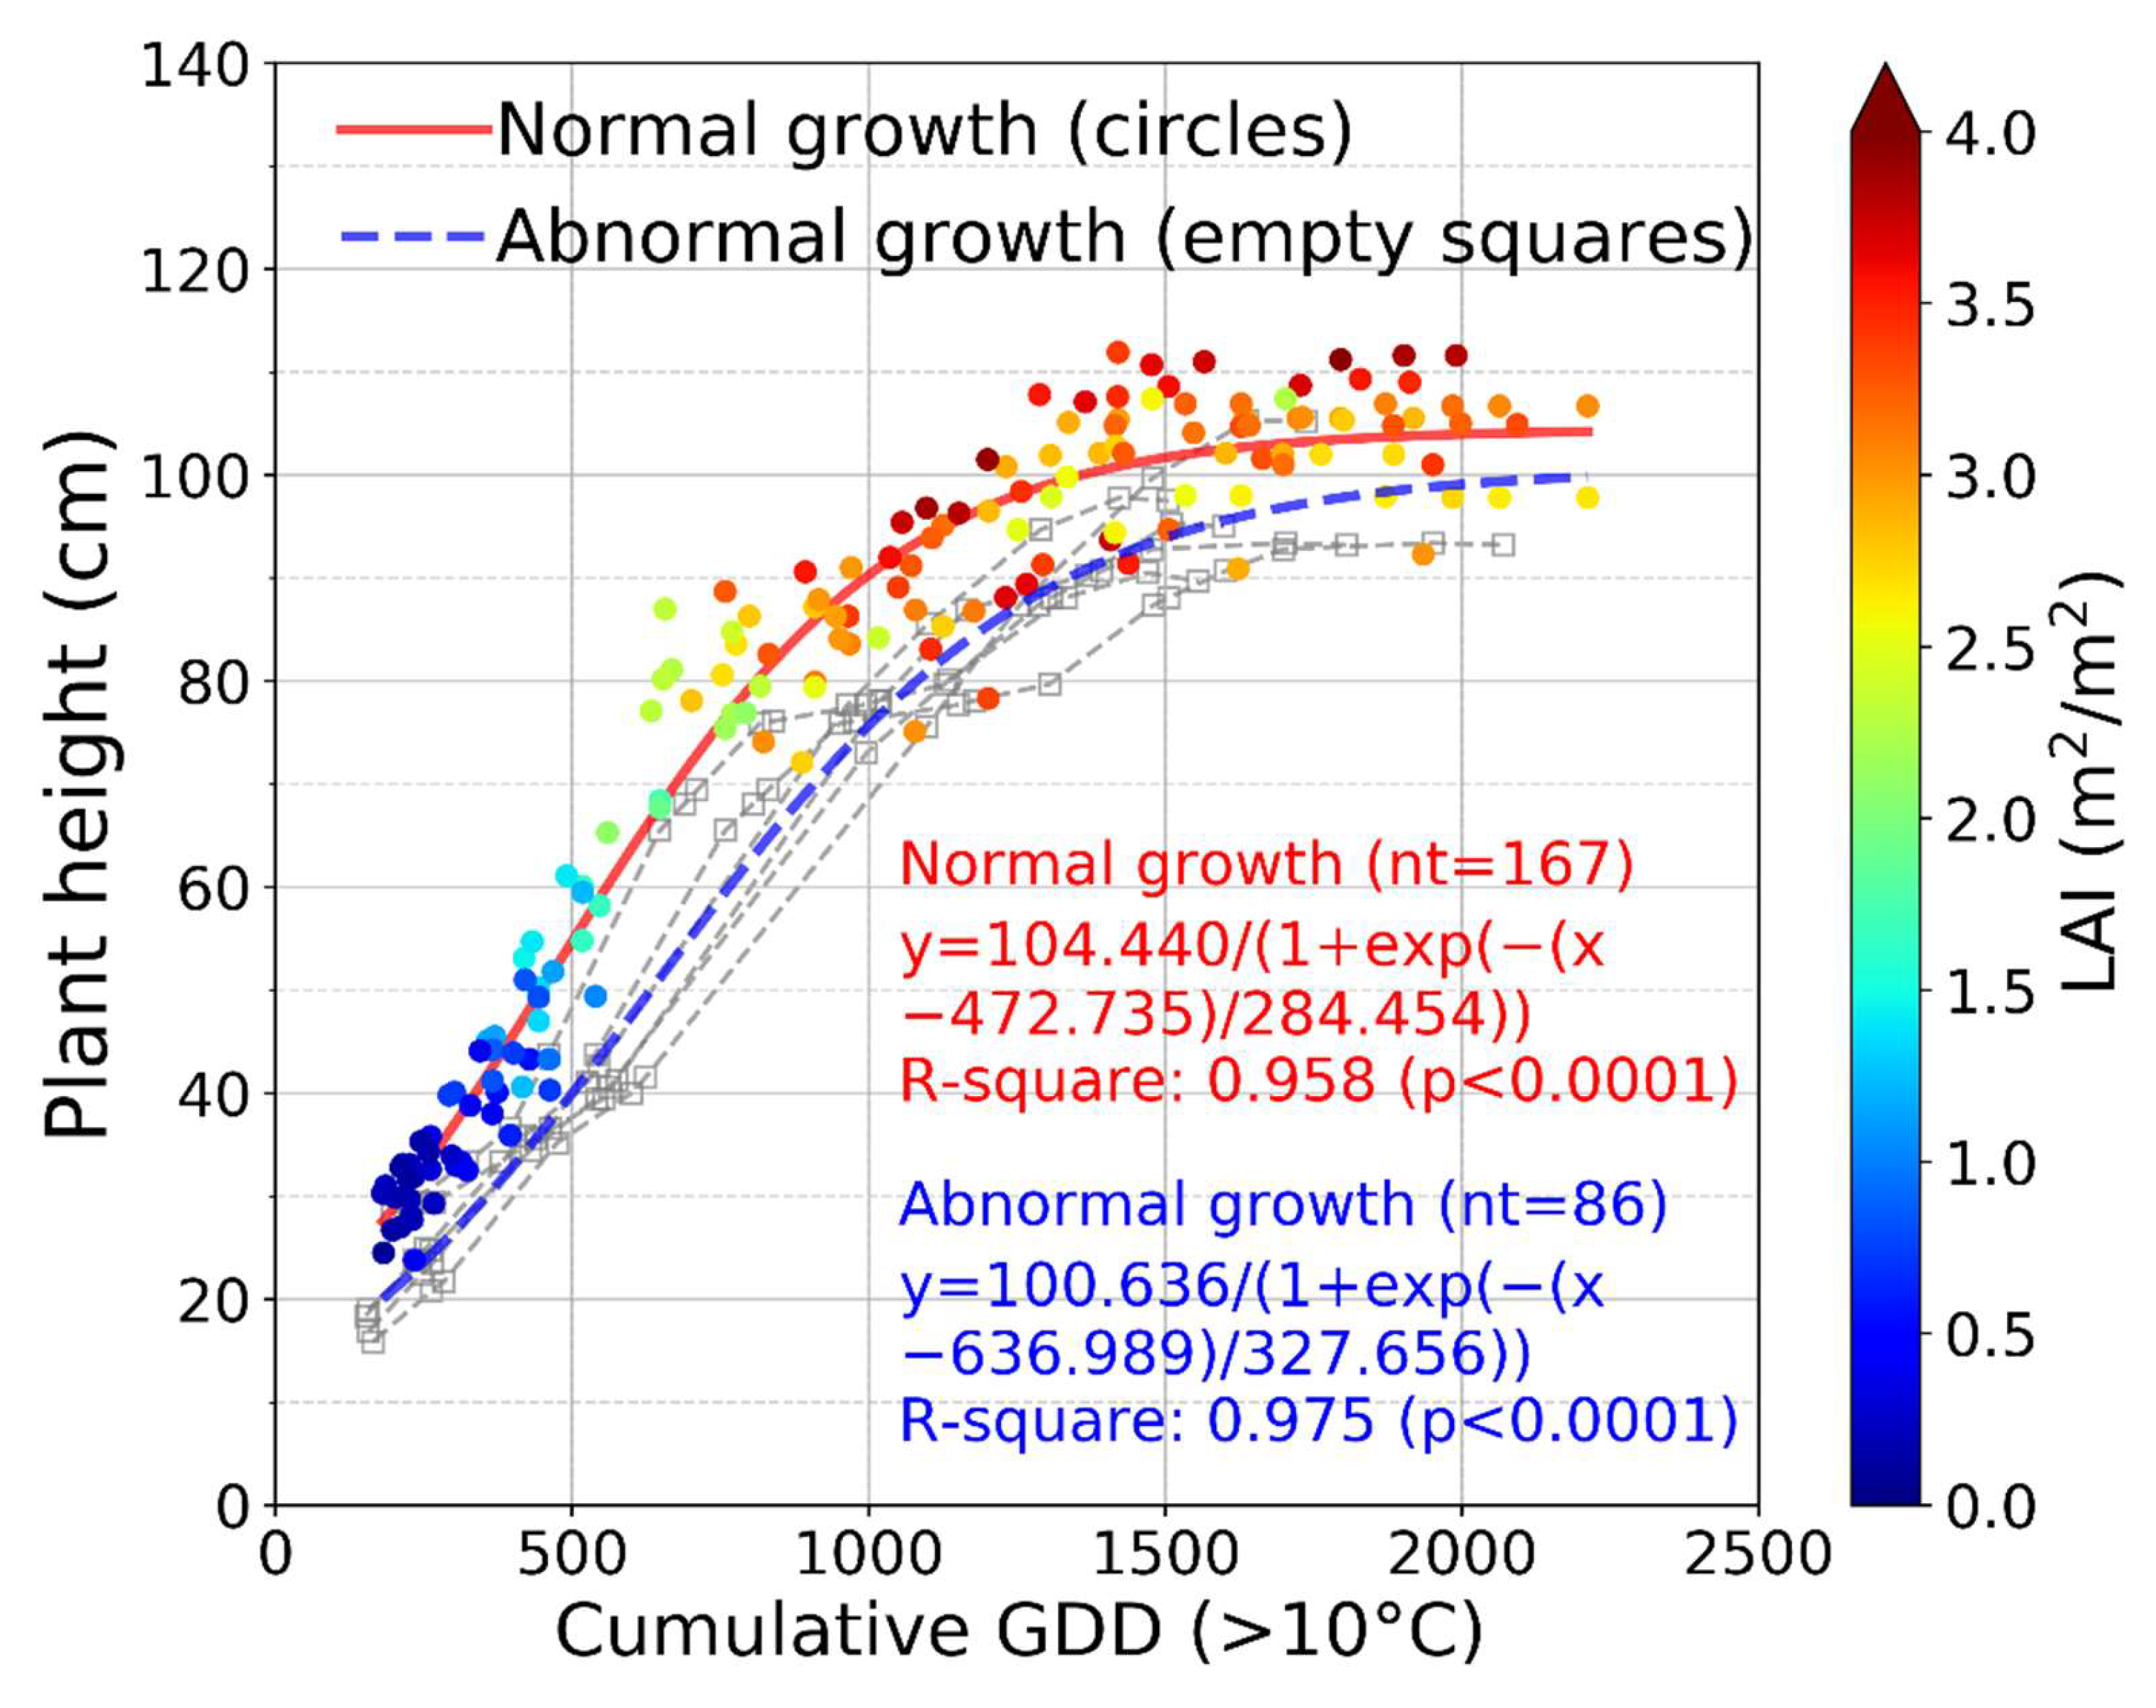
3.3.1. Relationship between Cumulative Growing Degree Days and Plant Height

The paddy rice in 2017 suffered due to the herbicide treatment; the abnormal growth and development on paddy rice were evaluated using cumulative GDD. Cumulative GDD is known to relate to LAI, dry matter, and grain yield, and it has been used to simulate crop growth in crop models [13,14,60]. Plant height (number of samples = 167) remains constant after the heading stage, so the relationship between cumulative GDD and plant height has a sigmoid trend (Figure 9). The coefficient of determination (hereafter R-square) was 0.958 (p-value < 0.0001), and the root mean square error (RMSE) was 5.82 cm under the normal growth states. These results were similar to the ones from previous studies, where the R-square between cumulative GDD and plant height was 0.88–0.91 for Sesamum indicum [61] and 0.99 for sweet corn [62]; these relationships follow a Sigmoid growth curve like the one obtained in this study. In general, the growth and development of paddy rice were fast under high air temperatures [63], and the relationship between cumulative GDD and plant height was stable.
The LAI has been estimated using GDD that is one of the variables in the rice growth and productivity model. The R-square (RMSE) was 0.97 (0.47) [64]. Williams and Lindquist [62] reported an R-square (RMSE) of 0.92–0.98 (0.0224-0.2138) for two years. In this study, R-square between cumulative GDD and LAI before the heading stage was 0.861 (p-value < 0.0001). These results mean that cumulative GDD has a high correlation with growth parameters of plant height and LAI under normal growth conditions. However, the relationship between cumulative GDD and LAI under the abnormal growth conditions had different trends with that under the normal growth condition. The growth and development of paddy rice were late due to herbicide influence. Thus, the relationship between cumulative GDD and growth parameters can effectively express the low and late growth and development of paddy rice due to herbicide damage.
This concept can be applied to other abnormal growth conditions as well as the effect of herbicide. For example, the damages of growth and development caused by disease and harmful insects can be detected using cumulative GDD and growth parameters. Conversely, rapid growth and development of crops due to the bountiful fertilizer can be detected because of the relatively high values of growth parameters compared to the normal relationship between cumulative GDD and growth parameter. Although the relationship between cumulative GDD and growth parameters was useful to detect plant stress on the crop growth and development, this method for detecting crop stress conditions needs micro-meteorological data, as well as crop growth information, and its application is limited to small areas. Thus, the relationships between growth parameters and vegetation indices under normal and abnormal growth states were evaluated in order to replace growth parameters with vegetation indices before the heading stage.

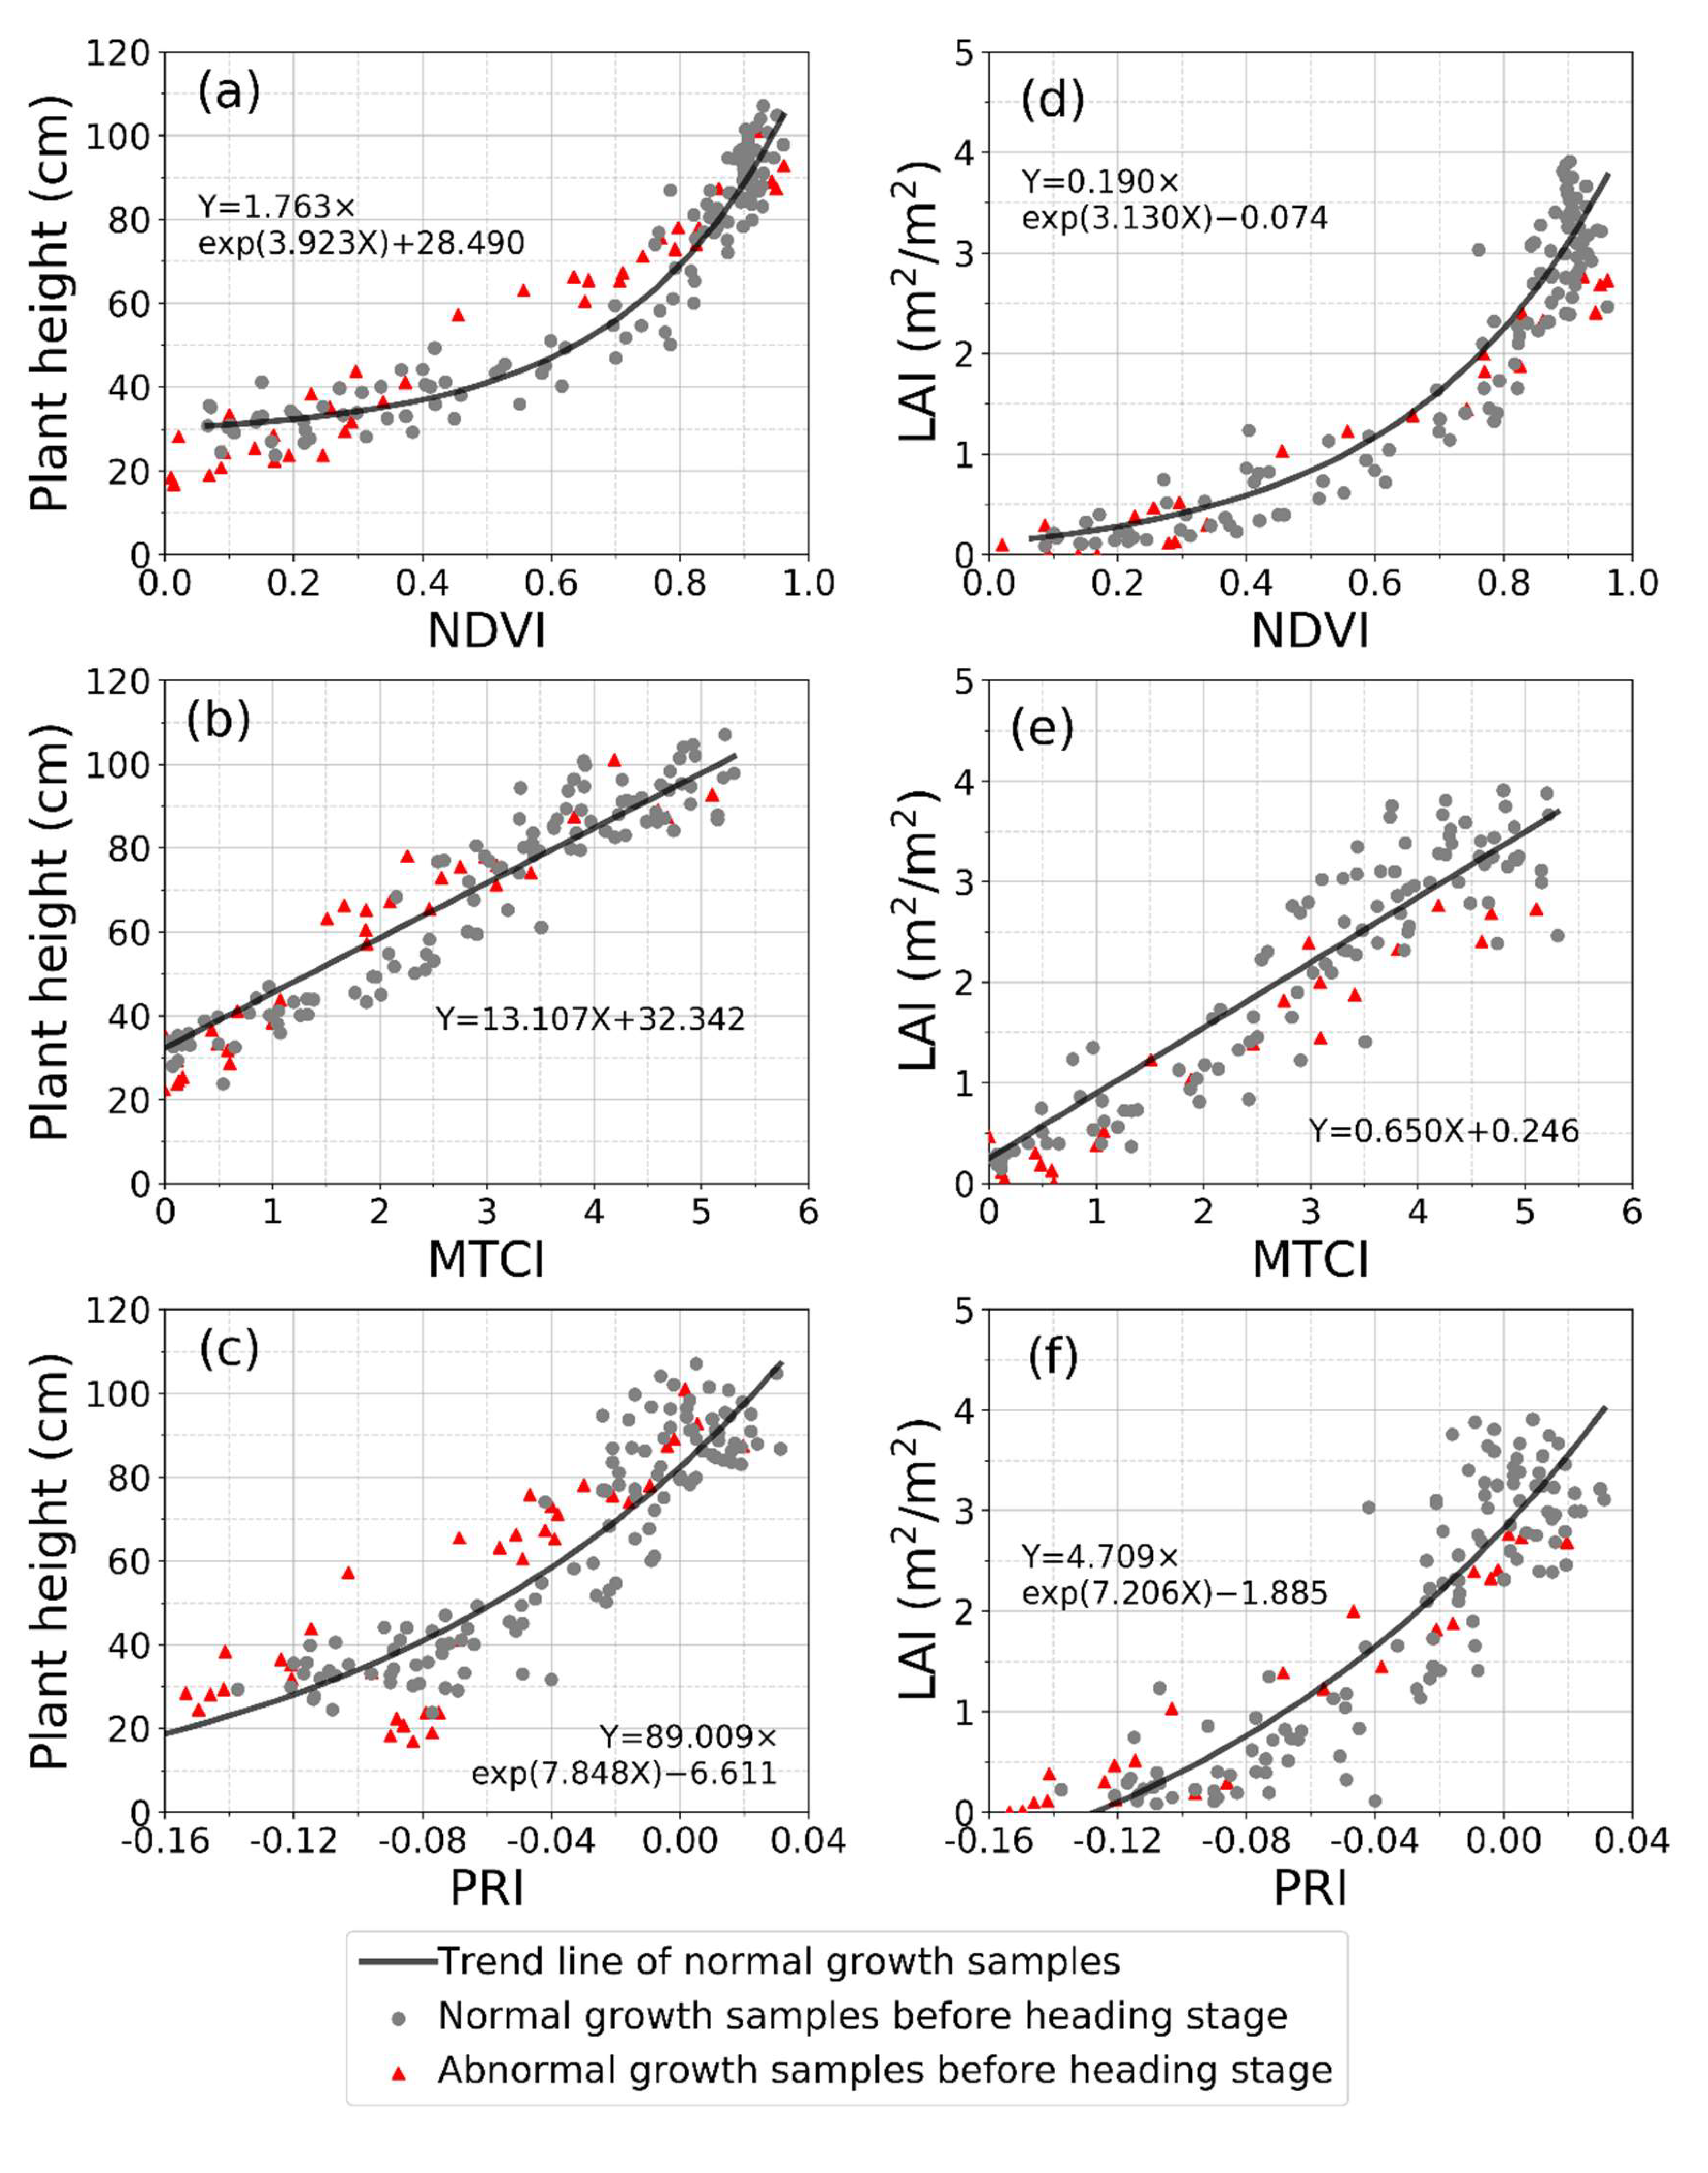
3.3.2. Relationship Between Plant Height and Vegetation Indices

Plant height increases after the transplanting stage, and then reaches its maximum at the heading stage. Conversely, vegetation indices increase until the heading stage, and then they start to decrease. For this reason, the relationship between plant height and vegetation indices was analyzed using data before the heading stage (number of samples = 121). The highest value of the R-square among the three vegetation indices was 0.938 in NDVI (Figure 10a), and the lowest value as 0.832 in PRI (Figure 10c). The relationship between plant height and MTCI was linear (Figure 10b). All vegetation indices accurately explained the plant height until the heading stage. Structural vegetation index such as NDVI was saturated in high values of plant height, but MTCI could sensitively express high plant height values. In the literature, the plant height of durum wheat had R-square values of 0.518~0.828 and root mean squared error values of 0.083~0.105 in the NDVI. In the OSAVI the same values were 0.519~0.817 and 0.102~0.127, respectively [65]. This result was lower than ours because it included the data measured after heading. In the ripening phase, the plant height has a constant value, but the value of vegetation index decreases. Thus, the estimation of the plant height of paddy rice using vegetation indices before the heading stage was recommended.
The influence of data related to the abnormal growth was evaluated in the relationship between plant height and vegetation indices. When data on abnormal growth (number of samples = 38) were included with the normal growth data, the R-square decreased approximately 0.003~0.015 in three vegetation indices (Table 3). Unlike PRI, the R-square values in NDVI and MTCI decreased by just 0.008 and 0.003, and they were similar regardless of stress, which means that vegetation indices, especially related to the structure of the crop, include the abnormal growth response of paddy rice.

3.3.3. Relationship between Leaf Area Index and Vegetation Indices

LAI that indicates 3-dimension crop growth information had a high correlation with plant height that indicates 2-dimensional crop growth information. The correlation coefficient for this relationship between plant height and LAI was 0.946 (p-value < 0.0001), and the equation on linear trend was “plant height (cm) = 19.802 × LAI (m2/m2) + 28.566” (number of samples = 158). This paddy rice result was similar to the garlic result with an R-square of 0.96 [66]. Unlike the plant height, LAI increased after transplanting and then decreased after the heading stage [67].
The relationship between LAI and vegetation indices was evaluated (number of samples = 155), excluding the abnormal growth. In this study, NDVI and PRI maintained an exponential relationship with LAI (Figure 10d,f). MTCI, which include biochemical characteristics, had a linear relationship with LAI (Figure 10e). The NDVI relationship showed the highest R-square (0.903; p-value < 0.0001), similar to its relationship with plant height. The relationship between LAI and MTCI was a linear relationship like with plant height, and it was effective for estimation of high LAI values [68]. Structural vegetation indices had a non-linear relationship with LAI, but they had a higher R-square than the ones in previous studies. The obtained R-square for the LAI were (1) 0.87, 0.91, and 0.87 for the SR, NDVI, and PRI correlations [69]; (2) 0.98, 0.99, and 0.99 for the SR, NDVI, and OSAVI correlations [67]; (3) 0.94 and 0.92 for the NDVI and OSAVI correlations [70]. Most previous studies have used NDVI to estimate LAI; NDVI was also found to be the best variable to predict the LAI in this study. Given that NDVI was saturated when the canopy was closed (LAI > about 2 m2/m2), vegetation index using the red-edge band (e.g., MTCI) can be used to diagnose the crop growth, because it does not saturate under high LAI values [68,71].
Data on abnormal growth (number of samples = 23) did not affect the relationship between LAI and vegetation indices that include structural characteristics such as the NDVI and the MTCI. The R-square in the NDVI and the MTCI decreased from 0.002 to 0.004. However, the values of LAI and vegetation indices under the abnormal growth were lower than those under normal growth because of the slow growth and development of paddy rice. Conversely, the R-square increased by 0.017 for PRI. These results mean that the relationship between LAI and vegetation indices remained similar independent of the stress conditions; this was the same as the plant height correlations behavior. Vegetation indices indicated which of the growth conditions were affected by stress and environmental factors. Accordingly, structural variables such as plant height and LAI can be replaced with vegetation indices.

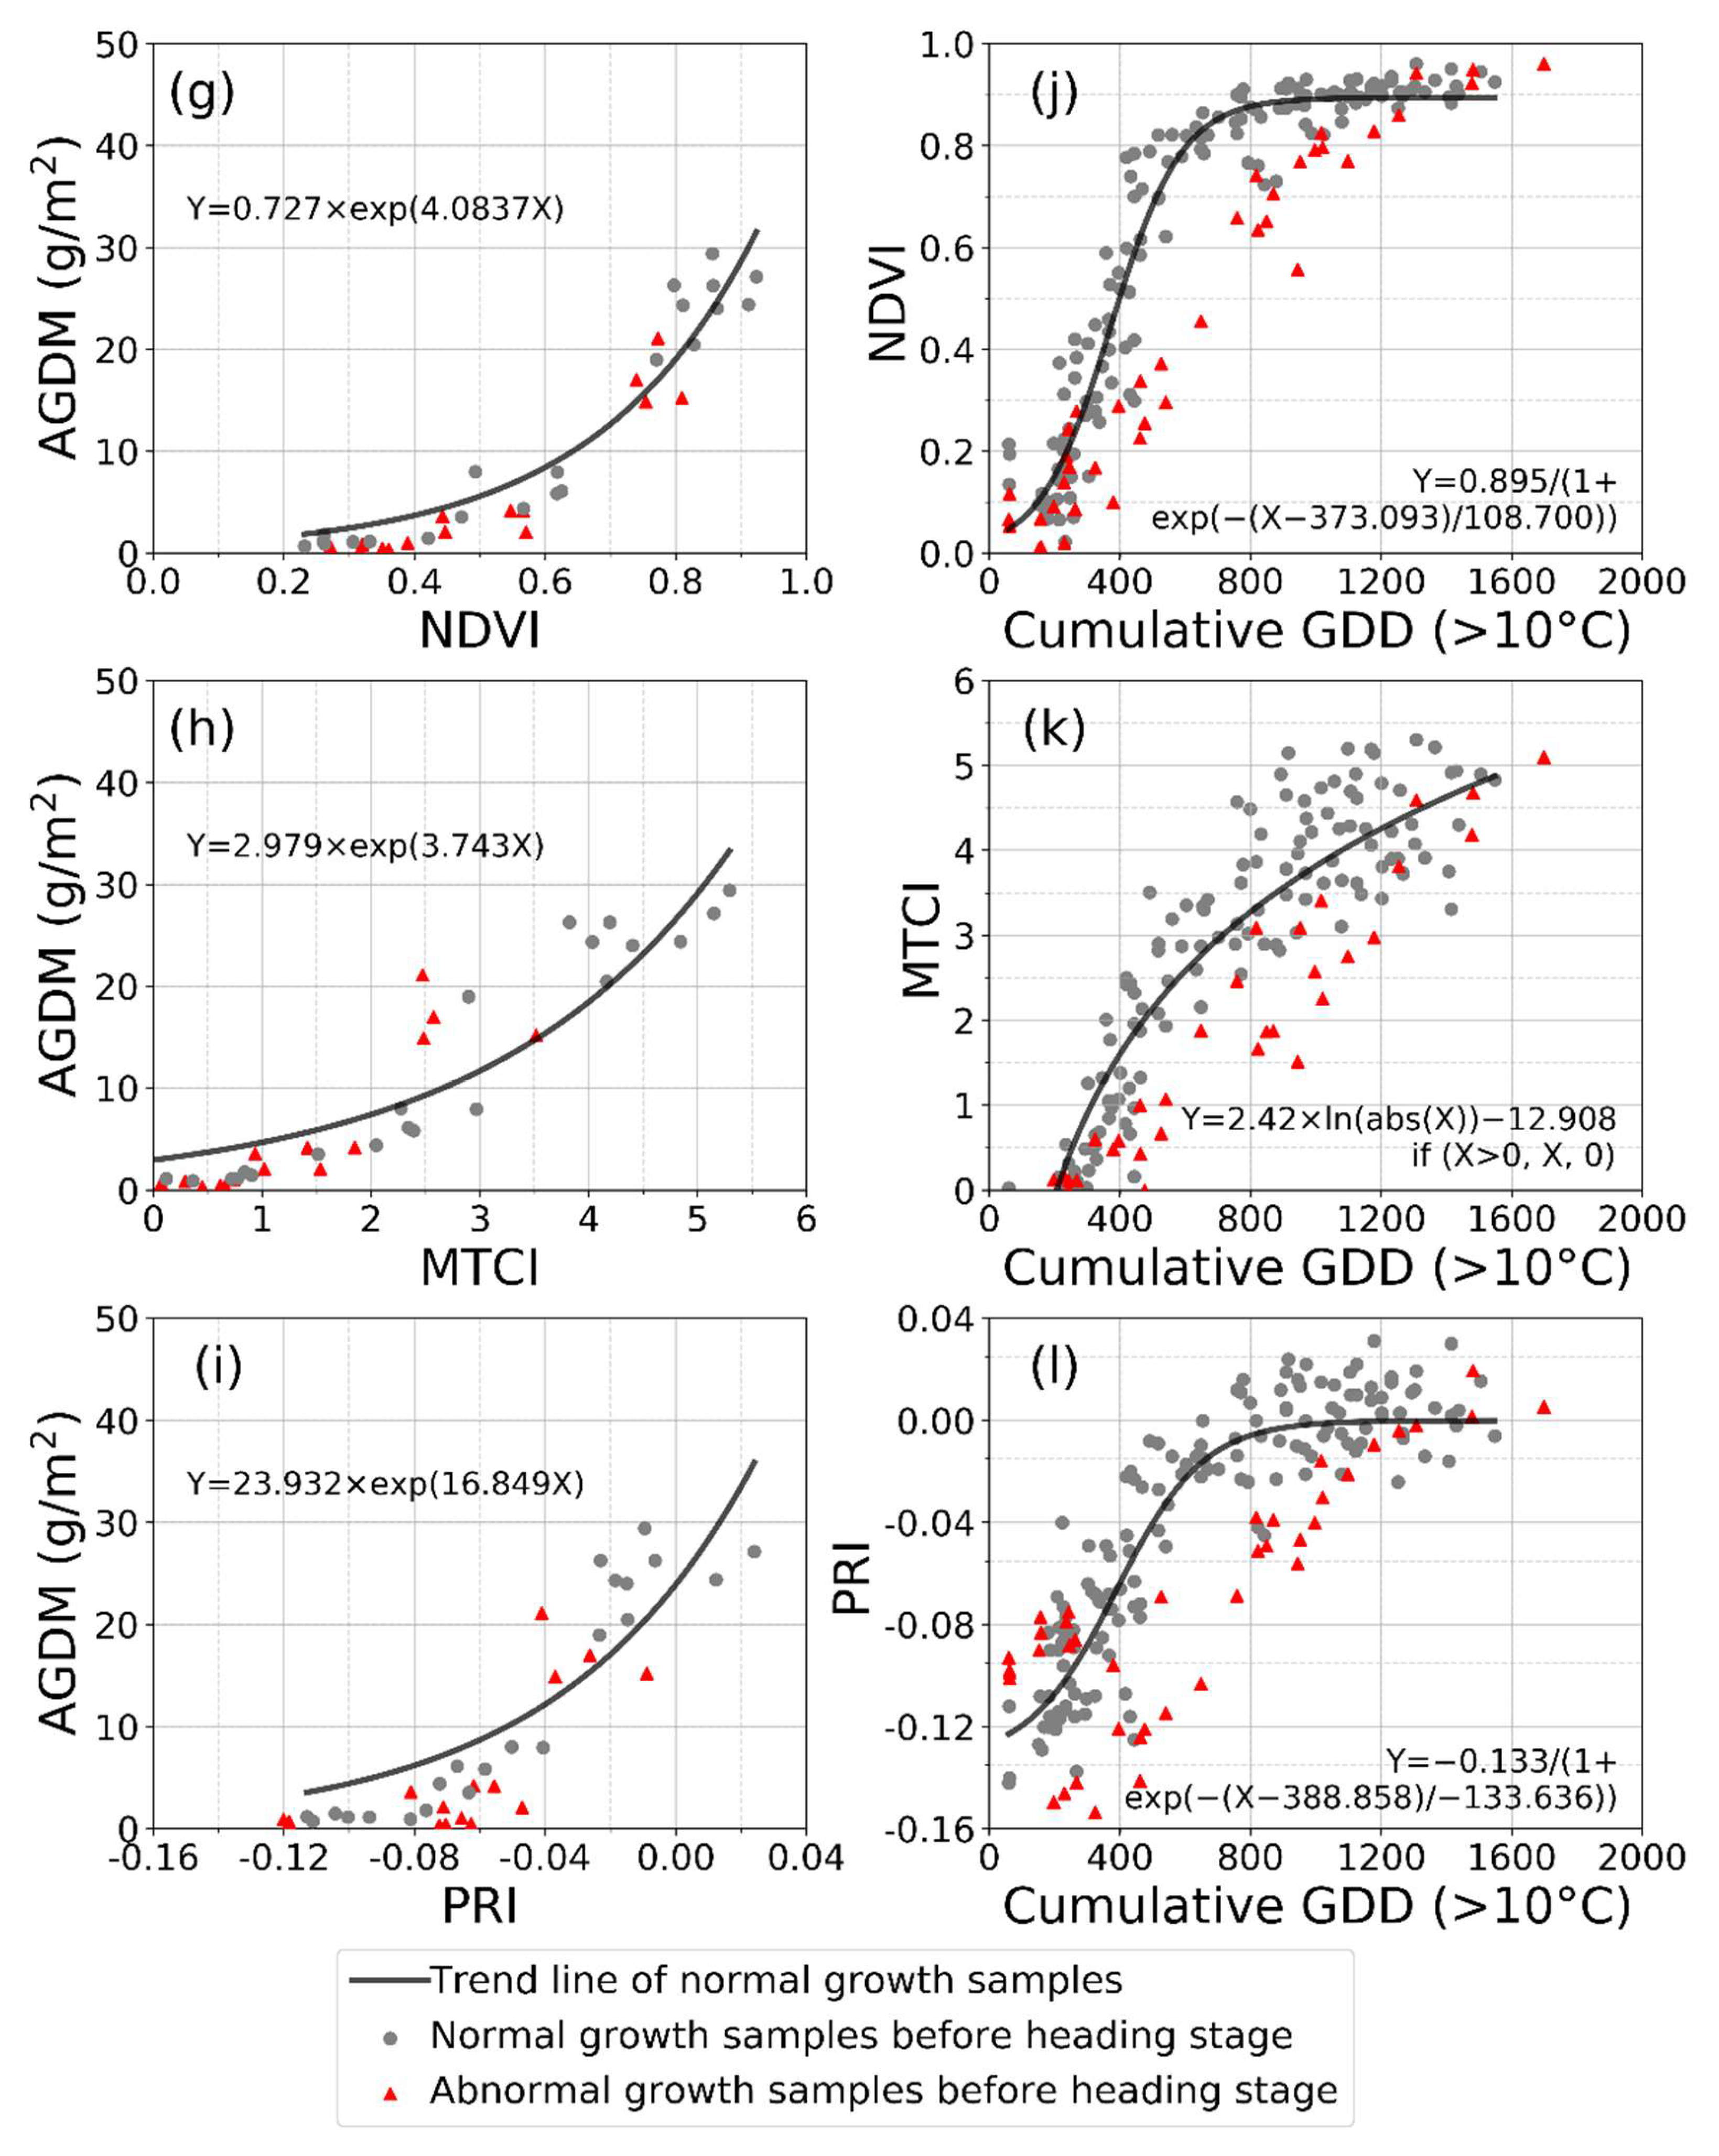
3.3.4. Relationship between Above-Ground Dry Matter and Vegetation Indices

AGDM indicates biomass information of paddy rice, and it increased continually until the harvesting stage. The characteristics of stem, leaf, and panicle in the AGDM were separated into before and after the heading stage. AGDM on stem and leaf increased before the heading stage. After the heading stage, AGDM of leaf decreased, and the panicle AGDM increased. In addition, the stem’s weight decreased due to assimilating translocation from stem to panicle. The ratio of panicle weight and all AGDM was called the harvest index. Given that the AGDM and harvest index are directly related to yield, the estimation of AGDM is critical. According to previous studies, SR and NDVI have an exponential relationship with the paddy rice AGDM, with an R-square of 0.68 and 0.64 (p-value < 0.0001) for SR and NDVI [72]. The relationship (p-value < 0.0001) between dry biomass and NDVI or OSAVI in barley shows an exponential regression with an R-square of 0.61 (NDVI) and 0.68 (OSAVI) [73]. Zheng et al. [74] reported the statistical results on the relationship between AGDM and structural vegetation indices such as the NDVI, green NDVI, and OSAVI before the heading stage. R-square values were 0.62 (NDVI), 0.66 (green NDVI), and 0.62 (OSAVI).
In this study, the number of samples on AGDM (number of samples = 22) was lower than that of other growth parameters because AGDM values can only be obtained using a destructive method. In addition, the number of samples matched with vegetation indices on the same day is lower than the number of AGDM measurements. In this study, NDVI was the best vegetation index to estimate AGDM before the heading stage (Figure 10g). The R-squares (p-value < 0.0001) for data on normal growth and data including abnormal growth samples were 0.914 and 0.910 in NDVI. MTCI had the second-best result with AGDM (Figure 10h); the R-square was 0.863 (p-value < 0.0001), and it decreased to 0.816 (p-value < 0.0001) when the abnormal growth data (number of samples = 15) were included. PRI showed an exponential and linear relationship with AGDM (Figure 10i). The statistic results of these vegetation indices were lower than the others. In addition, when abnormal growth data were added, degrees of change were relatively large, like MTCI. The relationship between AGDM and vegetation indices before the heading stage reflected the fraction effect of the crop before canopy closure [72].

3.3.5. Relationship Between Cumulative Growing Degree Days and Vegetation Indices

The relationships between the growth parameters of plant height, LAI, and AGDM and the vegetation indices were evaluated. The relationship between the two factors was divided into normal growth and abnormal growth conditions in vegetative and reproductive period. According to previous results, the growth parameters can be estimated using the structural vegetation index and MTCI, regardless of stress before the heading stage. Thus, the growth parameters were replaced with the vegetation index to detect abnormal growth of the paddy rice.
NDVI, MTCI, and PRI had a Sigmoid, logarithm, and Sigmoid trend with cumulative GDD (Figure 10j,k,l). The R-square (p-value < 0.0001) is 0.937 in the relationship between cumulative GDD and NDVI under the normal growth conditions (number of samples = 151), and it is the highest among the three indices. However, statistical results decreased when the abnormal growth data (number of samples = 41) was included. The trend in the abnormal growth data was different from that in the normal growth data. NDVI and PRI were effective in detecting the abnormal growth of paddy rice. The PRI statistics results were lower than those in NDVI because PRI includes physiological and biochemical characteristics.
Kimball et al. [75] reported the curve between cumulative GDD and NDVI during the cultivation period on wheat that was cultivated under the different air temperature conditions. The curves of cumulative GDD-NDVI were stable regardless of the different air temperature, but they were different when the crop was damaged by frost. The curve of cumulative GDD-NDVI in the frost-damaged samples was different with that in the heated samples. As a result, the grain yield of wheat damaged from frost was close to zero. It meant that the curve of cumulative GDD and vegetation indices could detect the abnormal status.

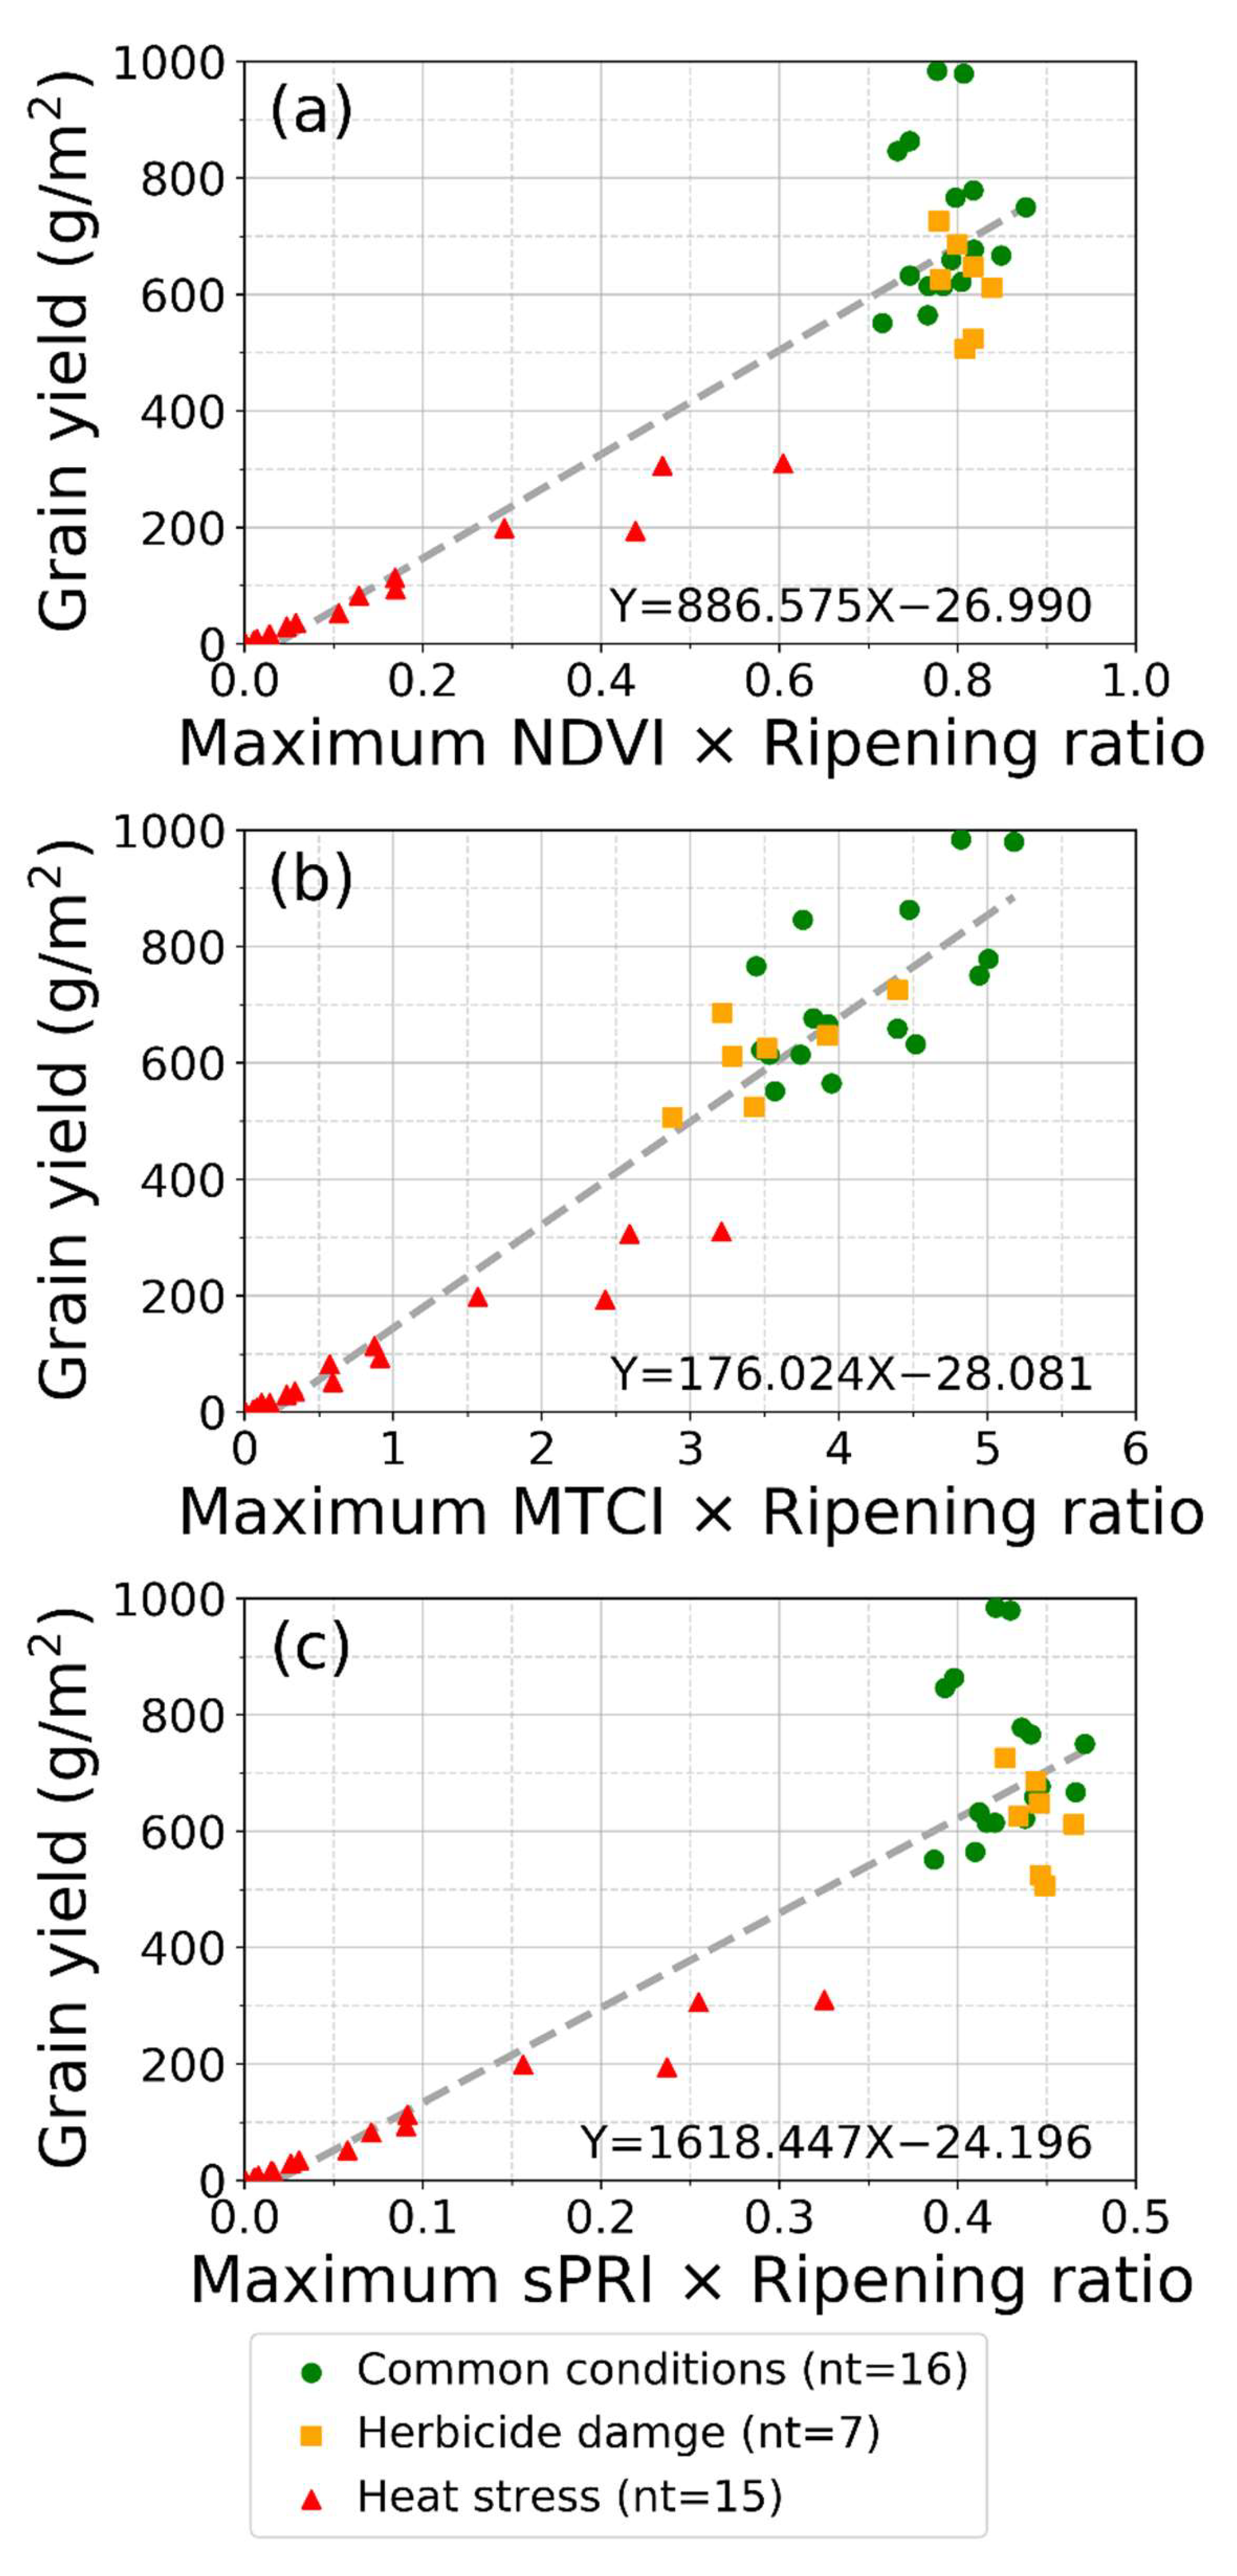
3.4. Estimation of Grain Yield Using Vegetation Indices

The grain yield of paddy rice has been estimated using vegetation indices. Vegetation indices are directly utilized as input data for the crop model, or they are used to estimate specific variables to use as input data for crop models, such as LAI [13]. In this study, vegetation indices were evaluated using the maximum vegetation index value during the cultivation period to estimate grain yield [9,10,11], because this study focuses on finding a suitable vegetation index instead of in the accurate estimation of grain yield. In addition, the ripening ratio of paddy rice was considered. Finally, the relationship between the maximum vegetation index value during the cultivation period multiplied by the ripening ratio (hereafter maximum vegetation index × ripening ratio) and grain yield of paddy rice was evaluated using three years of data (Figure 11). The samples on yield components were divided into common condition, herbicide damage, and heat stress samples to confirm the effect of stress. Additionally, the sPRI was used instead of PRI in order to remove the negative value, and it was calculated as (PRI+1)/2.
The R-square between the vegetation index × ripening ratio and the grain yield of paddy rice on all data ranged from 0.861 to 0.912 (p-value < 0.0001) (Table 4). MTCI had the best statistical results. Additionally, grain yield could be estimated after excluding the heat stress samples. The R-square values decreased in the three vegetation indices because the influence of ripening ratio on the estimation of grain yield was larger than that of the vegetation indices. In particular, the maximum NDVI and sPRI could not be used to estimate the grain yield. The maximum MTCI × ripening ratio had R-square values of 0.481 (p-value = 0.0002). The RMSE in MTCI was 96.04 g/m2 when heat stress samples were excluded.
Actually, grain yield dependence on the degree of stress was significant for p-value < 0.1 (Figure 12a). The grain yield in samples with herbicide damage was lower than that in samples in common conditions, and the yield in heat stress samples was notably low. The significant difference was assessed in NDVI, MTCI, and sPRI considering the ripening ratio. The maximum NDVI and sPRI × ripening ratio showed no significant difference between the normal growth and abnormal growth data (Figure 12b,d). Heat stress-induced damage of grain yield was reflected by the NDVI and sPRI. Conversely, the maximum MTCI × ripening ratio had a significant difference depending on the degree of stress for p-value < 0.1.
These results corresponded with previous studies. Kanke et al. [51] showed that red-edge-based vegetation indices were better than red-based vegetation indices to predict grain yield. Zhang and Liu [76] discussed that MTCI measured at the heading stage was the best indicator to predict grain yield (R-square = 0.652). In addition, MTCI is the best vegetation index to predict leaf nitrogen concentration in rice [77]. Although red-edge-based vegetation indices were useful, the NDVI was the selected representative vegetation index to estimate the crop grain yield of the crop in numerous studies [78,79,80]. NDVI at the specific growth stage of crops was utilized to predict the grain yield instead of maximum NDVI. Grain yield of rice was estimated using NDVI at the booting and heading stages (R-square = 0.76) [78], and it had a significant correlation with NDVI measured at 91 days after seeding (R-square = 0.605) [79]. In a corn crop, the relationship between grain yield and NDVI at the V8 stage was high (R-square = 0.77) [80]. However, to use only vegetation index values is not suitable for estimating the grain yield. Although biomass increases, grain yield can decrease due to external factors such as disease infection, heat stress, and lodging [51]. In this study, the difference of grain yield due to herbicide damage was detected by the vegetation indices; the decreased grain yield caused by physiological stress was not detected by the vegetation indices. If the decreasing of the ripening ratio, which happened due to heat stress, was not considered, none of the vegetation indices could have estimated the grain yield of paddy rice. MTCI in AT + 3 °C was higher than that in AT, but actual grain yield was lower due to the low ripening ratio. Therefore, an additional study to estimate the ripening ratio of paddy rice using vegetation index is demanded, or meteorological variables should be utilized to the ripening ratio or fertility percentage. The ripening ratio (fertility percentage) can be estimated using mean air temperature (maximum air temperature) for 40 days after the heading stage (during the flowering period) [81,82].

4. Conclusions

The phenology of paddy rice was monitored using structural, biochemical, and physiological vegetation indices under the elevated air temperature conditions for three years. The extremely high temperature-induced heat stress occurred in 2016 and 2018, and the herbicide damage occurred in 2017. The most suitable vegetation indices were selected based on their performance under the future meteorological environment, physiological stress, and herbicide damage. The conclusions in the study were summarized as follows:
(1)
The cumulative GDD had a stable relationship with the plant height and LAI under normal growth conditions;
(2)
The relationship between vegetation indices and growth parameters such as plant height, LAI, and AGDM was constant regardless of abnormal growth data until the heading stage. This means that vegetation indices can replace growth parameters;
(3)
The structural vegetation index, i.e., NDVI, can detect the slow growth and development of the crop caused by stress using the relationship with cumulative GDD. This concept can explain the abnormal condition of the crop, even if measurement data for several decades is not available;
(4)
PRI is the most useful vegetation index under physiological stress caused by heat stress. Unlike other vegetation indices, PRI decreased under the extremely high air temperatures even before the heading stage. When PRI decreases before the heading stage, this phenomenon might be the effect of the physiological stress and can then take the following actions: (1) Put silicate and potassium fertilizer; (2) let heatwave-induced the heated water flow to outside, and supply new water in order to lower the water temperature;
(5)
MTCI, which uses a red-edge band, is one of the most useful indices to predict the grain yield. MTCI showed higher sensitivity to the growth and development of paddy rice than structural vegetation indices because it did not saturate at the heading stage. In addition, the MTCI did not decrease under the extremely high air temperatures, indirectly indicating that the chlorophyll levels of paddy rice did not decrease before the heading stage.
In other words, structural vegetation indices are useful to distinguish the normal and abnormal growth and development states (Category 1). Although structural damage does not exist, the crop stress under the extremely high air temperature is detected through biochemical–physiological vegetation index (Category 2). Lastly, the structural–biochemical vegetation index is more effective to grasp the crop growth and development than the vegetation index which has the only structural characteristic. These results suggest that it is important to select a reasonable vegetation index in accordance with the development intention of the index and the purpose of its application.
In this study, the relationship between growth parameters and vegetation indices was assessed using many observation data under various environments of air temperature. These results can be helpful to remote sensing researchers in the agricultural domain for efficient monitoring of crop growth as well as indicating crop stress. However, although this study investigates not only the vegetative phase but also the grain yield, it focused on the performance of vegetation indices before the heading stage under the various environmental conditions. In further research, the temporal response of paddy rice after the heading stage will be analyzed considering different states of rice panicle, particularly, the ripening ratio.

Author Contributions

All authors contributed this paper. J.-H.R., the main author, designed the research, measured and analyzed the remote sensing data, and wrote the manuscript; H.J., the co-author, reviewed the paper and contributed to the discussion; J.C., the corresponding author, designed the research and wrote the manuscript. All authors have read and agreed to the published version of the manuscript.

Funding

This research was funded by the Ministry of Education, grant number NRF-2016R1D1A1B03933218.

Acknowledgments

The authors would like to thank the editors and the anonymous reviewers for their helpful comments.

Conflicts of Interest

The authors declare no conflict of interest.

References

  1. Cheng, Y.B.; Zhang, Q.; Lyapustin, A.I.; Wang, Y.; Middleton, E.M. Impacts of light use efficiency and fPAR parameterization on gross primary production modeling. Agric. For. Meteorol. 2014, 189, 187–197. [Google Scholar] [CrossRef]
  2. Yang, Z.; Shao, Y.; Li, K.; Liu, Q.; Liu, L.; Brisco, B. An improved scheme for rice phenology estimation based on time-series multispectral HJ-1A/B and polarimetric RADARSAT-2 data. Remote Sens. Environ. 2017, 195, 184–201. [Google Scholar] [CrossRef]
  3. Feng, W.; Qi, S.; Heng, Y.; Zhou, Y.; Wu, Y.; Liu, W.; He, L.; Li, X. Canopy vegetation indices from in situ hyperspectral data to assess plant water status of winter wheat under powdery mildew stress. Front. Plant Sci. 2017, 8, 1219. [Google Scholar] [CrossRef] [PubMed]
  4. Gitelson, A.A.; Kaufman, Y.J.; Stark, R.; Rundquist, D. Novel algorithms for remote estimation of vegetation fraction. Remote Sens. Environ. 2002, 80, 76–87. [Google Scholar] [CrossRef] [Green Version]
  5. Huete, A.R.; Jackson, R.D.; Post, D.F. Spectral response of a plant canopy with different soil backgrounds. Remote Sens. Environ. 1985, 17, 37–53. [Google Scholar] [CrossRef]
  6. Lu, J.; Ehsani, R.; Shi, Y.; Castro, A.I.; Wang, S. Detection of multi-tomato leaf diseases (late blight, target and bacterial spots) in different stages by using a spectral-based sensor. Sci. Rep. 2018, 8, 2793. [Google Scholar] [CrossRef] [Green Version]
  7. Stroppiana, D.; Boschetti, M.; Brivio, P.A.; Bocchi, S. Plant nitrogen concentration in paddy rice from field canopy hyperspectral radiometry. Field Crops Res. 2009, 111, 119–129. [Google Scholar] [CrossRef]
  8. Roberts, D.A.; Roth, K.L.; Perroy, R.L. Hyperspectral vegetation indices. In Hyperspectral Remote Sensing of Vegetation; Thenkabail, P.S., Lyon, J.G., Huete, A., Eds.; CRC Press Taylor & Francis Group: Boca Raton, FL, USA, 2012; pp. 309–327. [Google Scholar]
  9. Nuarsa, I.I.W.; Si, M.; Nuarsa, I.W. Relationship between rice spectral and rice yield using MODIS data. J. Agric. Sci. 2011, 3, 80–88. [Google Scholar] [CrossRef] [Green Version]
  10. Nuarsa, I.W.; Nishio, F.; Hongo, C. Rice yield estimation using Landsat ETM + data and field observation. J. Agric. Sci. 2012, 4, 45. [Google Scholar] [CrossRef] [Green Version]
  11. Siyal, A.A.; Dempewolf, J.; Becker-Reshef, I. Rice yield estimation using Landsat ETM + Data. J. Appl. Remote Sens. 2015, 9, 095986. [Google Scholar] [CrossRef]
  12. Boote, K.J.; Jones, J.W.; Pickering, N.B. Potential uses and limitations of crop models. Agronom. J. 1996, 88, 704–716. [Google Scholar] [CrossRef]
  13. Jeong, S.; Ko, J.; Yeom, J.M. Nationwide projection of rice yield using a crop model integrated with geostationary satellite imagery: A case study in South Korea. Remote Sens. 2018, 10, 1665. [Google Scholar] [CrossRef] [Green Version]
  14. Ko, J.; Jeong, S.; Yeom, J.; Kim, H.; Ban, J.-O.; Kim, H.-Y. Simulation and mapping of rice growth and yield based on remote sensing. J. Appl. Remote Sens. 2015, 9, 096067. [Google Scholar] [CrossRef]
  15. Jin, X.; Kumar, L.; Li, Z.; Feng, H.; Xu, X.; Yang, G.; Wang, J. A review of data assimilation of remote sensing and crop models. Eur. J. Agron. 2018, 92, 141–152. [Google Scholar] [CrossRef]
  16. Kim, H.Y.; Ko, J.; Kang, S.; Tenhunen, J. Impacts of climate change on paddy rice yield in a temperate climate. Glob. Chang. Biol. 2013, 19, 548–562. [Google Scholar] [CrossRef] [PubMed]
  17. Angulo, C.; Rötter, R.; Lock, R.; Enders, A.; Fronzek, S.; Ewert, F. Implication of crop model calibration strategies for assessing regional impacts of climate change in Europe. Agric. For. Meteorol. 2013, 170, 32–46. [Google Scholar] [CrossRef]
  18. Yeom, J.M.; Jeong, S.; Jeong, G.; Ng, C.T.; Deo, R.C.; Ko, J. Monitoring paddy productivity in North Korea employing geostationary satellite images integrated with GRAMI-rice model. Sci. Rep. 2018, 8, 16121. [Google Scholar] [CrossRef] [Green Version]
  19. Mosleh, M.; Hassan, Q.; Chowdhury, E. Application of remote sensors in mapping rice area and forecasting its production: A review. Sensors 2015, 15, 769–791. [Google Scholar] [CrossRef] [Green Version]
  20. Son, N.T.; Chen, C.F.; Chen, C.R.; Chang, L.Y.; Duc, H.N.; Nguyen, L.D. Prediction of rice crop yield using MODIS EVI−LAI data in the Mekong Delta, Vietnam. Int. J. Remote Sens. 2013, 34, 7275–7292. [Google Scholar] [CrossRef]
  21. Jordan, C.F. Derivation of leaf-area index from quality of light on the forest floor. Ecology 1969, 50, 663–666. [Google Scholar] [CrossRef]
  22. Haboudane, D.; Miller, J.R.; Pattey, E.; Zarco-Tejada, P.J.; Strachan, I.B. Hyperspectral vegetation indices and novel algorithms for predicting green LAI of crop canopies: Modeling and validation in the context of precision agriculture. Remote Sens. Environ. 2004, 90, 337–352. [Google Scholar] [CrossRef]
  23. Huete, A.; Didan, K.; Miura, T.; Rodriguez, E.P.; Gao, X.; Ferreira, L.G. Overview of the radiometric and biophysical performance of the MODIS vegetation indices. Remote Sens. Environ. 2002, 83, 195–213. [Google Scholar] [CrossRef]
  24. Huete, A.R. A soil-adjusted vegetation index (SAVI). Remote Sens. Environ. 1988, 25, 295–309. [Google Scholar] [CrossRef]
  25. Rouse, J.; Haas, R.; Schell, J.; Deering, D. Monitoring vegetation systems in the Great Plains with ERTS-1. In Proceedings of the Third Earth Resources Technology Satellite Symposium, Washington, DC, USA, 10–14 December 1974; pp. 309–317. [Google Scholar]
  26. Gao, B.C. NDWI—A normalized difference water index for remote sensing of vegetation liquid water from space. Remote Sens. Environ. 1996, 58, 257–266. [Google Scholar] [CrossRef]
  27. Hardisky, M.; Klemas, V.; Smart, R.M. The influence of soil salinity, growth form, and leaf moisture on the spectral radiance of Spartina alterniflora canopies. Photogramm. Eng. Remote. Sens. 1983, 49, 77–83. [Google Scholar]
  28. Peñuelas, J.; Filella, I.; Biel, C.; Serrano, L.; Save, R. The reflectance at the 950–970 nm region as an indicator of plant water status. Int. J. Remote Sens. 1993, 14, 1887–1905. [Google Scholar] [CrossRef]
  29. Dash, J.; Curran, P.J. The MERIS terrestrial chlorophyll index. Int. J. Remote Sens. 2004, 25, 5403–5413. [Google Scholar] [CrossRef]
  30. Gitelson, A.A.; Zur, Y.; Chivkunova, O.B.; Merzlyak, M.N. Assessing carotenoid content in plant leaves with reflectance spectroscopy. Photochem. Photobiol. 2002, 75, 272–281. [Google Scholar] [CrossRef]
  31. Kim, M.S.; Daughtry, C.S.T.; Chappelle, E.W.; McMurtrey, J.E.; Walthall, C.L. The Use of High Spectral Resolution Bands for Estimating Absorbed Photosynthetically Active Radiation (Apar). In Proceedings of the 6th Symp. on Physical Measurements and Signatures in Remote Sensing, Val D’Isere, France, 17–21 January 1994; pp. 299–306. [Google Scholar]
  32. Gamon, J.A.; Peñuelas, J.; Field, C.B. A narrow-waveband spectral index that tracks diurnal changes in photosynthetic efficiency. Remote Sens. Environ. 1992, 41, 35–44. [Google Scholar] [CrossRef]
  33. Gamon, J.A.; Berry, J.A. Facultative and constitutive pigment effects on the Photochemical Reflectance Index (PRI) in sun and shade conifer needles. Isr. J. Plant Sci. 2012, 60, 85–95. [Google Scholar] [CrossRef]
  34. Sims, D.A.; Gamon, J.A. Relationships between leaf pigment content and spectral reflectance across a wide range of species, leaf structures and developmental stages. Remote Sens. Environ. 2002, 81, 337–354. [Google Scholar] [CrossRef]
  35. Filella, I.; Porcar-Castell, A.; Munné-Bosch, S.; Bäck, J.; Garbulsky, M.F.; Peñuelas, J. PRI assessment of long-term changes in carotenoids/chlorophyll ratio and short-term changes in de-epoxidation state of the xanthophyll cycle. Int. J. Remote Sens. 2009, 30, 4443–4455. [Google Scholar] [CrossRef]
  36. Garrity, S.R.; Eitel, J.U.; Vierling, L.A. Disentangling the relationships between plant pigments and the photochemical reflectance index reveals a new approach for remote estimation of carotenoid content. Remote Sens. Environ. 2011, 11, 628–635. [Google Scholar] [CrossRef]
  37. Gitelson, A.A.; Gamon, J.A.; Solovchenko, A. Multiple drivers of seasonal change in PRI: Implications for photosynthesis 2. stand level. Remote Sens. Environ. 2017, 190, 198–206. [Google Scholar] [CrossRef] [Green Version]
  38. Du, L.; Tian, Q.; Yu, T.; Meng, Q.; Jancso, T.; Udvardy, P.; Huang, Y. A comprehensive drought monitoring method integrating MODIS and TRMM data. Int. J. Appl. Earth Obs. 2013, 23, 245–253. [Google Scholar] [CrossRef]
  39. Ryu, J.H.; Han, K.S.; Lee, Y.W.; Park, N.W.; Hong, S.; Chung, C.Y.; Cho, J. Different agricultural responses to extreme drought events in neighboring counties of South and North Korea. Remote Sens. 2019, 11, 1773. [Google Scholar] [CrossRef] [Green Version]
  40. Kogan, F.; Stark, R.; Gitelson, A.; Jargalsaikhan, L.; Dugrajav, C.; Tsooj, S. Derivation of pasture biomass in Mongolia from AVHRR-based vegetation health indices. Int. J. Remote Sens. 2004, 25, 2889–2896. [Google Scholar] [CrossRef]
  41. Cremers, J.; Marx, H. Comparative study of a new IR-absorbing film to improve solar shading and thermal comfort for ETFE structures. Proc. Eng. 2016, 155, 113–120. [Google Scholar] [CrossRef] [Green Version]
  42. Jayapriya, S.; Ravichandran, V.; Boominathan, P. Heat unit requirements of different rice genotypes at Coimbatore. J. Agrometeorol. 2016, 18, 326. [Google Scholar]
  43. Choi, J.; Ko, J.; Ng, C.T.; Jeong, S.; Tenhunen, J.; Xue, W.; Cho, J. Quantification of CO2 fluxes in paddy rice based on the characterization and simulation of CO2 assimilation approaches. Agric. For. Meteorol. 2018, 249, 348–366. [Google Scholar] [CrossRef]
  44. Yoon, P.R.; Choi, J.Y. Effects of shift in growing season due to climate change on rice yield and crop water requirements. Paddy Water Environ. 2019, 18, 1–17. [Google Scholar] [CrossRef]
  45. Sanna, F.; Deboli, R.; Calvo, A. Variability of tomato in protected environment in response to meteorological parameters. Plant Soil Environ. 2018, 64, 247–254. [Google Scholar] [CrossRef]
  46. Clevers, J.; Kooistra, L.; van den Brande, M. Using sentinel-2 data for retrieving LAI and leaf and canopy Chlorophyll content of a potato crop. Remote Sens. 2017, 9, 405. [Google Scholar] [CrossRef] [Green Version]
  47. Segarra, J.; Buchaillot, M.L.; Araus, J.L.; Kefauver, S.C. Remote sensing for precision agriculture: Sentinel-2 improved features and applications. Agronomy 2020, 10, 641. [Google Scholar] [CrossRef]
  48. Alonso, L.; Van Wittenberghe, S.; Amorós-López, J.; Vila-Francés, J.; Gómez-Chova, L.; Moreno, J. Diurnal cycle relationships between passive fluorescence, PRI and NPQ of vegetation in a controlled stress experiment. Remote Sens. 2017, 9, 770. [Google Scholar] [CrossRef] [Green Version]
  49. Zhang, C.; Filella, I.; Garbulsky, M.; Peñuelas, J. Affecting factors and recent improvements of the photochemical reflectance index (PRI) for remotely sensing foliar, canopy and ecosystemic radiation-use efficiencies. Remote Sens. 2016, 8, 677. [Google Scholar] [CrossRef] [Green Version]
  50. Zhu, X.; Song, L.; Weng, Q.; Huang, G. Linking in-situ photochemical reflectance index measurements with mangrove carbon dynamics in a subtropical coastal wetland. J. Geophys. Res. Biogeosci. 2019, 124, 1714–1730. [Google Scholar] [CrossRef]
  51. Kanke, Y.; Tubaña, B.; Dalen, M.; Harrell, D. Evaluation of red and red-edge reflectance-based vegetation indices for rice biomass and grain yield prediction models in paddy fields. Precis. Agric. 2016, 17, 507–530. [Google Scholar] [CrossRef]
  52. Yang, H.; Yang, X.; Heskel, M.; Sun, S.; Tang, J. Seasonal variations of leaf and canopy properties tracked by ground-based NDVI imagery in a temperate forest. Sci. Rep. 2017, 7, 1267. [Google Scholar] [CrossRef]
  53. Cao, Z.; Yao, X.; Liu, H.; Liu, B.; Cheng, T.; Tian, Y.; Cao, W.; Zhu, Y. Comparison of the abilities of vegetation indices and photosynthetic parameters to detect heat stress in wheat. Agric. For. Meteorol. 2019, 265, 121–136. [Google Scholar] [CrossRef]
  54. Gamon, J.A.; Kovalchuck, O.; Wong, C.Y.S.; Harris, A.; Garrity, S.R. Monitoring seasonal and diurnal changes in photosynthetic pigments with automated PRI and NDVI sensors. Biogeoscience 2015, 12, 4149–4159. [Google Scholar] [CrossRef] [Green Version]
  55. Chou, S.; Chen, J.; Yu, H.; Chen, B.; Zhang, X.; Croft, H.; Khalid, S.; Li, M.; Shi, Q. canopy-level photochemical reflectance index from hyperspectral remote sensing and leaf-level non-photochemical quenching as early indicators of water stress in maize. Remote Sens. 2017, 9, 794. [Google Scholar] [CrossRef] [Green Version]
  56. Zhou, R.; Yu, X.; Li, X.; Mendanha dos Santos, T.; Rosenqvist, E.; Ottosen, C.-O. Combined high light and heat stress induced complex response in tomato with better leaf cooling after heat priming. Plant Physiol. Biochem. 2020, 151, 1–9. [Google Scholar] [CrossRef] [PubMed]
  57. Zhang, X.; Wollenweber, B.; Jiang, D.; Liu, F.; Zhao, J. Water deficits and heat shock effects on photosynthesis of a transgenic Arabidopsis thaliana constitutively expressing ABP9, a bZIP transcription factor. J. Exp. Bot. 2008, 59, 839–848. [Google Scholar] [CrossRef] [PubMed] [Green Version]
  58. Zhou, K.; Deng, X.; Yao, X.; Tian, Y.; Cao, W.; Zhu, Y.; Ustin, S.L.; Cheng, T. Assessing the spectral properties of sunlit and shaded components in rice canopies with near-ground imaging spectroscopy data. Sensors 2017, 17, 578. [Google Scholar] [CrossRef] [PubMed] [Green Version]
  59. Zhang, S.; Tao, F.; Zhang, Z. Changes in extreme temperatures and their impacts on rice yields in southern China from 1981 to 2009. Field Crops Res. 2016, 189, 43–50. [Google Scholar] [CrossRef] [Green Version]
  60. Yan, D.; Zhu, Y.; Wang, S.; Cao, W. A quantitative knowledge-based model for designing suitable growth dynamics in rice. Plant Prod. Sci. 2006, 9, 93–105. [Google Scholar] [CrossRef]
  61. Meena, H.M.; Rao, A.S. Growing degree days requirement of sesame (Sesamum indicum) in relation to growth and phonological development in Western Rajasthan. Curr. Adv. Agric. Sci. 2013, 5, 107–110. [Google Scholar]
  62. Williams, M.M.; Lindquist, J.L. Influence of planting date and weed interference on sweet corn growth and development. Agron. J. 2007, 99, 1066–1072. [Google Scholar] [CrossRef] [Green Version]
  63. Morison, J.I.L.; Lawlor, D.W. Interactions between increasing CO2 concentration and temperature on plant growth. Plant Cell Environ. 1999, 22, 659–682. [Google Scholar] [CrossRef] [Green Version]
  64. Tang, L.; Zhu, Y.; Hannaway, D.; Meng, Y.; Liu, L.; Chen, L.; Cao, W. RiceGrow: A rice growth and productivity model. NJAS-Wagen. J. Life Sci. 2009, 57, 83–92. [Google Scholar] [CrossRef] [Green Version]
  65. Marino, S.; Alvino, A. Detection of spatial and temporal variability of wheat cultivars by high-resolution vegetation indices. Agronomy 2019, 9, 226. [Google Scholar] [CrossRef] [Green Version]
  66. Ryu, J.H.; Oh, D.; Jang, S.W.; Jeong, H.; Moon, K.H.; Cho, J. Assessment of photochemical reflectance index measured at different spatial scales utilizing leaf reflectometer, field hyper-spectrometer, and multi-spectral camera with UAV. Korean J. Remote Sens. 2018, 34, 1055–1066, (In Korean with English Abstract). [Google Scholar] [CrossRef]
  67. Kimura, R.; Okada, S.; Miura, H.; Kamichika, M. Relationships among the leaf area index, moisture availability, and spectral reflectance in an upland rice field. Agric. Water Manag. 2004, 69, 83–100. [Google Scholar] [CrossRef]
  68. Viña, A.; Gitelson, A.A.; Nguy-Robertson, A.L.; Peng, Y. Comparison of different vegetation indices for the remote assessment of green leaf area index of crops. Remote Sens. Environ. 2011, 115, 3468–3478. [Google Scholar] [CrossRef]
  69. Aparicio, N.; Villegas, D.; Casadesus, J.; Araus, J.L.; Royo, C. Spectral vegetation indices as nondestructive tools for determining durum wheat yield. Agron. J. 2000, 92, 83–91. [Google Scholar] [CrossRef]
  70. Jo, S.H.; Ko, J.H. Determining canopy growth conditions of paddy rice via ground-based remote sensing. Korean J. Remote Sens. 2015, 31, 11–20. [Google Scholar] [CrossRef] [Green Version]
  71. Zheng, H.; Cheng, T.; Yao, X.; Deng, X.; Tian, Y.; Cao, W.; Zhu, Y. Detection of rice phenology through time series analysis of ground-based spectral index data. Field Crops Res. 2016, 198, 131–139. [Google Scholar] [CrossRef]
  72. Gnyp, M.L.; Miao, Y.; Yuan, F.; Ustin, S.L.; Yu, K.; Yao, Y.; Huang, S.; Bareth, G. Hyperspectral canopy sensing of paddy rice aboveground biomass at different growth stages. Field Crops Res. 2014, 155, 42–55. [Google Scholar] [CrossRef]
  73. Bendig, J.; Yu, K.; Aasen, H.; Bolten, A.; Bennertz, S.; Broscheit, J.; Gnyp, M.L.; Bareth, G. Combining UAV-based plant height from crop surface models, visible, and near infrared vegetation indices for biomass monitoring in barley. Int. J. Appl. Earth Obs. Geoinf. 2015, 39, 79–87. [Google Scholar] [CrossRef]
  74. Zheng, H.; Cheng, T.; Zhou, M.; Li, D.; Yao, X.; Tian, Y.; Cao, W.; Zhu, Y. Improved estimation of rice aboveground biomass combining textural and spectral analysis of UAV imagery. Precis. Agric. 2018, 20, 611–629. [Google Scholar] [CrossRef]
  75. Kimball, B.A.; White, J.W.; Wall, G.W.; Ottman, M.J. Infrared-warmed and unwarmed wheat vegetation indices coalesce using canopy-temperature-based growing degree days. Agron. J. 2012, 104, 114–118. [Google Scholar] [CrossRef]
  76. Zhang, S.; Liu, L. The potential of the MERIS Terrestrial Chlorophyll Index for crop yield prediction. Remote Sens. Lett. 2014, 5, 733–742. [Google Scholar] [CrossRef]
  77. Tian, Y.C.; Yao, X.; Yang, J.; Cao, W.X.; Hannaway, D.B.; Zhu, Y. Assessing newly developed and published vegetation indices for estimating rice leaf nitrogen concentration with ground-and space-based hyperspectral reflectance. Field Crops Res. 2011, 120, 299–310. [Google Scholar] [CrossRef]
  78. Zhou, X.; Zheng, H.B.; Xu, X.Q.; He, J.Y.; Ge, X.K.; Yao, X.; Cheng, T.; Zhu, Y.; Cao, W.X.; Tian, Y.C. Predicting grain yield in rice using multi-temporal vegetation indices from UAV-based multispectral and digital imagery. ISPRS J. Photogramm. Remote Sens. 2017, 130, 246–255. [Google Scholar] [CrossRef]
  79. Guan, S.; Fukami, K.; Matsunaka, H.; Okami, M.; Tanaka, R.; Nakano, H.; Ohdan, H.; Takahashi, K. Assessing correlation of high-resolution NDVI with fertilizer application level and yield of rice and wheat crops using small UAVs. Remote Sens. 2019, 11, 112. [Google Scholar] [CrossRef] [Green Version]
  80. Teal, R.K.; Tubana, B.; Girma, K.; Freeman, K.W.; Arnall, D.B.; Walsh, O.; Raun, W.R. In-season prediction of corn grain yield potential using normalized difference vegetation index. Agron. J. 2006, 98, 1488–1494. [Google Scholar] [CrossRef] [Green Version]
  81. Horie, T. Predicting the effects of climatic variation and elevated CO2 on rice yield in Japan. J. Agric. Meteorol. 1993, 48, 567–574. [Google Scholar] [CrossRef] [Green Version]
  82. Kim, J.; Shon, J.; Lee, C.-K.; Yang, W.; Yoon, Y.; Yang, W.-H.; Kim, Y.-G.; Lee, B.-W. Relationship between grain filling duration and leaf senescence of temperate rice under high temperature. Field Crops Res. 2011, 122, 207–213. [Google Scholar] [CrossRef]
Figure 1. Study area. (a) Chonnam National University is located in Gwangju, Republic of Korea. (b) The temperature gradient field chamber (TGFC) is located in Chonnam National University. (c) TGFC diagram.
Remotesensing 12 02654 g001
Figure 2. Stress category in this study. Category 1 was classified as normal and abnormal growth and development stats. Normal growth was sub-divided as common condition and heat stress stats in Category 2.
Remotesensing 12 02654 g002
Figure 3. Time series of air temperature and insolation in the temperature gradient field chamber (TGFC) for three years (a) 2016 year, (b) 2017 year, (c) 2018 year, and (d) 2016~2018 years. The daily mean air temperature was controlled to maintain values of ambient air temperature (AT), AT + 1, AT + 2, AT + 3 °C in the four positions, which were named as position 1 (P1), position 6 (P6), position 11 (P11), position 16 (P16) in this study.
Remotesensing 12 02654 g003
Figure 4. Development of spectral reflectance-based vegetation indices. RVI: Ratio vegetation index; NDVI: Normalized difference vegetation index; NGRDI: Normalized red-green difference index; NDII: Normalized difference infrared index; SAVI: Soil-adjusted vegetation index; PRI: Photochemical reflectance index; CARI: Chlorophyll absorption ratio index; NDWI: Normalized difference water index; OSAVI: Optimized soil-adjusted vegetation index; TVI: Triangular vegetation index; MCARI: Modified chlorophyll absorption ratio index; CAI: Cellulose absorption index; EVI: Enhanced vegetation index; CRI: Carotenoid reflectance index; MTCI: MERIS terrestrial chlorophyll index.
Remotesensing 12 02654 g004
Figure 5. The inside of a temperature gradient field chamber (TGFC). Spectral reflectance sensors (SRS) were mounted on a mono-pod at each position in 2017 and 2018. The blue circle indicates the downward-looking SRS and the red circle indicates the upward-looking SRS.
Remotesensing 12 02654 g005
Figure 6. Time series of NDVI, MTCI, and PRI according to different air temperature. (a)–(c) Time series of vegetation indices during the whole cultivation period in 2018. (d)–(f) Time series of vegetation indices during the heatwave period in 2018. Positions were divided into 16 at equal intervals in each temperature gradient field chamber (TGFC) and they were named as position 1 (P1) ~ position 16 (P16). P1 indicates the time series of vegetation indices exposed to ambient temperature (AT), and P15 indicates the time series of vegetation indices exposed to high air temperature (about AT+2.37 °C). P5 and P11 were averagely higher temperatures as +0.91 and +1.71 °C than AT.
Remotesensing 12 02654 g006
Figure 7. Time series of PRI measured continually by a spectral reflectance sensor (SRS) in different positions for ambient temperature (AT) and AT + 3 °C.
Remotesensing 12 02654 g007
Figure 8. Relationship between cumulative hours when the air temperature is above 35 °C and delta date (decline date in PRI – heading stage date). Red line indicates the trend line of scatter plots measured for three years.
Remotesensing 12 02654 g008
Figure 9. Relationship between cumulative growing degree days (GDD) and plant height. The color indicates leaf area index (LAI). Circle scatters indicate normal growth samples (number of samples = 167), and gray empty square plots indicate abnormal growth samples (number of samples = 86).
Remotesensing 12 02654 g009
Figure 10. Relationship between vegetation indices and (1) plant height (a)–(c); (2) leaf area index (LAI) (d)–(f); (3) above-ground dry matter (AGDM) (g)–(i); (4) cumulative growing degree days (GDD) (j)–(l).
Remotesensing 12 02654 g010aRemotesensing 12 02654 g010b
Figure 11. Relationship between maximum vegetation index value during cultivation period × ripening ratio and grain yield.
Remotesensing 12 02654 g011
Figure 12. Boxplot of (a) grain yield, (b) maximum NDVI value × ripening ratio, (c) maximum MTCI value × ripening ratio, and (d) maximum sPRI value × ripening ratio according to stress values. The maximum vegetation value meant the maximum value of vegetation index during growth period of paddy rice.
Remotesensing 12 02654 g012
Table 1. Information of ground measurements on growth parameters for three years.
Variables
(units)
Number of Chambers
(2016, 2017, 2018 years)
Number of Positions
(2016, 2017, 2018 years)
Number of Measurement Data
(2016, 2017, 2018 years)
Plant height (cm)8 (2, 2, 4)22 (4, 6, 12)227 (27, 40, 160)
LAI (m2/m2)9 (2, 3, 4)26 (6, 8, 12)279 (39, 64, 176)
AGDM (g/m2)8 (1, 3, 4)38 (3, 15, 20)120 (3, 64, 53)
Yield components8 (1, 3, 4)38 (3, 15, 20)38 (3, 15, 20)
LAI: Leaf area index; AGDM: Above-ground dry matter.
Table 2. Spectral reflectance-based vegetation indices.
Index Name
(Abbreviation)
Biophysical
Types
FormulationsOptical
Instruments
References
Normalized difference vegetation index (NDVI)Structure(RNIR-RRed)
/(RNIR+RRed)
Field spectrometer
& SRS
[25]
MERIS terrestrial chlorophyll index (MTCI)Structure
& Biochemical
(R750-R710)
/(R710-R680)
Field spectrometer [29]
Photochemical reflectance index (PRI)Biochemical
& Physiology
(R531-R570)
/(R531+R570)
Field spectrometer
& SRS
[32]
SRS: Spectral reflectance sensor.
Table 3. The relationship between vegetation indices and cumulative growing degree days (GDD), plant height, leaf area index (LAI) or above-ground dry matter (AGDM) before the heading stage. Difference indicates the difference of R-square between “normal growth samples” and “normal growth + abnormal growth samples”. Li, Lo, S, and E are abbreviations for linear, logarithm, Sigmoid, and exponential function (p-value < 0.0001).
Vegetation indexDataPlant Height
(cm)
LAI
(m2/m2)
AGDM
(g/m2)
Cumulative GDD (>10 °C)
R-Square (Function)R-Square (Function)R-Square (Function)R-Square (Function)
Normalized difference vegetation index
(NDVI)
Normal growth samples0.938 (E)0.903 (E)0.914 (E)0.937 (S)
Normal growth
+ Abnormal growth samples
0.930 (E)0.901 (E)0.910 (E)0.892 (S)
Difference−0.008−0.002−0.004−0.045
MERIS terrestrial chlorophyll index
(MTCI)
Normal growth samples0.912 (Li)0.886 (Li)0.863 (E)0.851 (Lo)
Normal growth
+ Abnormal growth samples
0.915 (Li)0.882 (Li)0.816 (E)0.807 (Lo)
Difference0.003−0.004−0.047−0.044
Photochemical reflectance index
(PRI)
Normal growth samples0.832 (E)0.795 (E)0.784 (E)0.827 (S)
Normal growth
+ Abnormal growth samples
0.817 (E)0.812 (E)0.732 (E)0.738 (S)
Difference−0.0150.017−0.052−0.089
Table 4. Statistical results on grain yield estimated from two values of vegetation index and the ripening ratio. The maximum vegetation index refers to the maximum value of vegetation index during the paddy rice growth period.
VariablesGrain Yield (g/m2)
SamplesR-squarep-valueRMSEEquation
Maximum NDVI
× ripening ratio
All data0.869<0.0001116.77Y = 893.198X − 31.928
Ripening ratio
> 75%
0.0020.8351133.15Y = −158.816X + 817.234
Maximum MTCI
× ripening ratio
All data0.912<0.000195.69Y = 177.296X − 32.928
Ripening ratio
> 75%
0.4810.000296.04Y = 142.371X + 126.796
Maximum sPRI
× ripening ratio
All data0.861<0.0001120.08Y = 1629.197X − 29.565
Ripening ratio
> 75%
0.0290.4375131.35Y = −978.367X + 1114.129
NDVI: Normalized difference vegetation index; MTCI: MERIS terrestrial chlorophyll index; PRI: Photochemical reflectance index.

