Article

Quality Assessment of PROBA-V Surface Albedo V1 for the Continuity of the Copernicus Climate Change Service

by
Jorge Sánchez-Zapero
1,*,
Fernando Camacho
1,
Enrique Martínez-Sánchez
1,
Roselyne Lacaze
2,
Dominique Carrer
3,
Florian Pinault
3,
Iskander Benhadj
4 and
Joaquín Muñoz-Sabater
5
1
Earth Observation Laboratory (EOLAB), Parc Científic Universitat de València, C/Catedrático Augustín Escardino 9, 46980 Paterna (Valencia), Spain
2
HYGEOS, Euratechnologies, 165 Avenue de Bretagne, 59000 Lille, France
3
Centre National de Recherches Météorologiques (CNRM), Université de Toulouse, Météo France, CNRS 42, Avenue Gaspard Coriolis, 31057 Toulouse, France
4
Flemish Institute for Technological Research (VITO), Remote Sensing Unit, Boeretang 200, B-2400 Mol, Belgium
5
European Centre for Medium-Range Weather Forecasts (ECMWF), Shinfield Road, Reading RG2 8JD, UK
*
Author to whom correspondence should be addressed.
Remote Sens. 2020, 12(16), 2596; https://doi.org/10.3390/rs12162596
Submission received: 15 July 2020 / Revised: 7 August 2020 / Accepted: 10 August 2020 / Published: 12 August 2020
(This article belongs to the Special Issue Recent Advances in Satellite Derived Global Land Product Validation)

Abstract

:
The Copernicus Climate Change Service (C3S) includes estimates of Essential Climate Variables (ECVs) as a series of Climate Data Records (CDRs) derived from satellite data. The C3S Surface Albedo (SA) v1.0 CDR is composed of observations from National Oceanic and Atmospheric Administration (NOAA) Very High Resolution Radiometers (AVHRR) (1981–2005), and VEGETATION sensors onboard Satellites for the Observation of the Earth (SPOT/VGT) (1998–2014) and Project for Onboard Autonomy satellite (PROBA-V) (2014–2020), and will continue with Sentinel-3 (from 2020 onwards). The goal of this study is to assess the uncertainties associated with the C3S PROBA-V SA v1.0 product, with a focus on the transition from SPOT/VGT to PROBA-V. The methodology followed the good practices recommended by the Land Product Validation sub-group (LPV) of the Working Group on Calibration and Validation (WGCV) of the Committee on Earth Observing Satellites (CEOS) for the validation of satellite-derived global albedo products. Several performance criteria were evaluated, including an intercomparison with National Aeronautics and Space Agency (NASA) MCD43A3 C6 products. C3S PROBA-V SA v1.0 and MCD43A3 C6 showed similar completeness but had higher fractions of missing data than C3S SPOT/VGT SA v1.0. C3S PROBA-V SA v1.0 showed similar precision (~1%) to MCD43A3 C6, improving the results of SPOT/VGT SA v1.0 (2–3%), but C3S PROBA-V SA v1.0 provided residual noise in the near-infrared (NIR). Good spatio-temporal continuity between C3S PROBA-V and SPOT/VGT SA v1.0 products was found with a mean bias between ±2%. The comparison with MCD43A3 C6 showed positive mean biases (5%, 8%, and 12% for visible, NIR and total shortwave, respectively). The accuracy assessment with ground measurements showed a median error of 18.4% with systematic overestimation (positive bias of 11.5%). The percentage of PROBA-V retrievals complying with the C3S target requirements was 28.6%.

1. Introduction

The land surface albedo, which is defined as the ratio of the radiant flux reflected from the Earth’s land surface to the incident flux, is a key forcing parameter controlling the planetary radiative energy budget and the partitioning of the radiative energy between the atmosphere and surface. The surface albedo varies in space and time as a result of both natural processes (e.g., solar illumination, snowfall, and vegetation growth) and human activities (e.g., the clearing and replanting of forests, the sowing and harvesting of crops, and the burning and grazing of rangelands) and is a sensitive indicator of environmental vulnerability [1]. Consequently, a long-term record of the surface albedo for the global landmass is required by climate, biogeochemical, hydrological, and weather forecast, models at a range of spatial (from a few meters to 30 km) and temporal (from daily to monthly) scales, and it is therefore, mandatory to quantitatively, and efficiency assess the uncertainties in SA measurement using these products.
The European’s Union funded C3S [2] provides key indicators on climate change drivers by means of combining the observations of the climate system with the latest science to develop authoritative, quality-assured information about the past, current and future states of the climate. The C3S portfolio includes consistent estimates of multiple Essential Climate Variables (ECVs), including the surface albedo, which is primarily based on satellite data and provided as a series of gridded CDRs. In the frame of C3S, SA products have been derived from the data collected by NOAA/AVHRR (1981–2005) and SPOT/VGT (1998–2014). The Project for Onboard Autonomy satellite (PROBA-V) satellite [3], which was launched on May 2013 for seven years, was designed to bridge the gap in space-borne vegetation observation between SPOT/VGT (March 1998–May 2014) and the Sentinel-3 satellites. PROBA-V is comparable to the VGT sensors on SPOT platforms. In C3S, the PROBA-V SA v1.0 products are generated with the aim to extend the CDRs based on AVHRR and VGT observations over time. The algorithms for these C3S SA products were designed by Meteo-France based on previous research conducted within the Satellite Application Facility for Land Surface Analysis (LSA SAF) program of EUMETSAT [4,5]. Meteo-France developed the SA algorithms, Refs. [6,7,8,9] based on MSG/SEVIRI and MetOp/AVHRR within the EUMETSAT LSA SAF program, and were later adapted to these other sensors in C3S and Copernicus Global Land Service (CGLS) [10]. These products are generated by the processing line infrastructure implemented by VITO and openly distributed through the C3S Climate Data Store (CDS) [11].
Within the C3S CDS, a framework for the Evaluation and Quality Control (EQC) of climate data products derived from satellite and in situ observations to be catalogued was developed [12]. Validation, or quality assessment, is one of the main components defined in this EQC framework, and it is defined as the process of independently assessing the quality of the data products derived from the system outputs [13]. In terms of satellite-derived land products, validation is the procedure to assess their accuracy and quantify their uncertainties via analytical comparisons with reference data. Validation also constitutes the means of guaranteeing the compliance of products with user requirements, and helps end-users understand to what extent the product is suitable for their specific applications [14]. Based on previous validation works, mainly based on NASA products [15,16,17,18,19], but also on EUMETSAT [7], the CEOS WGCV LPV sub-group [20] has defined the global albedo product validation good practices [21]. Two main validation approaches have been defined: (i) The quantitative and qualitative product-to-product validation approach, which is referred to as satellite product intercomparison (i.e., indirect validation); and (ii) the direct point-to-pixel validation, which involves comparisons of satellite products with the albedo measured from in situ tower-based instruments (i.e., direct validation).
Indirect validation is helpful because most validation metrics cannot be computed using ground data, due to the limitations of ground measurements in terms of global conditions. Indirect validation approach mainly consists of comparing satellite-derived albedo products, particularly new products, with heritage albedo products [7,22,23,24,25,26,27,28]. In general, product intercomparison offers a means of assessing the discrepancies (systematic or random) between products. This method is particularly valuable for finding spatial disagreements between products over large areas and for a wide range of cover types. However, this approach does not yield absolute validation results, and satellite product intercomparisons alone are insufficient to validate a new product. Then, direct validation enables the assessment of uncertainties, and it may be argued that only such methods can be seen as actual validation in the field of remote sensing [29]. Direct validation consists of comparing satellite retrievals with in-situ albedo measurements [30]. It is, therefore, mandatory to evaluate the spatial representativeness of ground albedo measurements, which depends on the land surface heterogeneity [31,32,33,34].
As the PROBA-V mission is arriving at the end of its lifetime, the aim of this paper is to perform the full quality assessment of PROBA-V based C3S SA v1.0 products. To achieve that, the main objectives are the following:
  • To evaluate the product completeness and spatio-temporal consistency of C3S PROBA-V SA v1.0 products over global conditions compared to SPOT/VGT SA v1.0 (and MCD43A3 C6 for benchmarking) to verify the continuity of the C3S time series;
  • To assess the precision of C3S PROBA-V SA v1.0 and to intercompare it with reference satellite products (C3S SPOT/VGT SA v1.0 and MCD43A3 C6);
  • To assess the accuracy and the associated uncertainties of the products via direct validation with ground measurements; and
  • To assess the compliance of the product with regards to climate user requirements.
The remainder of this paper is structured as follows: Section 2 and Section 3 describe the datasets used in the study, which are for satellite-based products and ground data, respectively; Section 4 presents the validation methodology; Section 5 and Section 6 gather and discuss the intercomparison and validation results, respectively; and the conclusions are summarized in Section 7.

2. Remote Sensing Surface Albedo Products

The main features of the three SA products investigated in this work (C3S PROBA-V SA v1.0, C3S SPOT/VGT SA v1.0 and MCD43A3 C6) are summarized in Table 1. The information of the spectral characteristics of the four optical bands of the VEGETATION sensors onboard the PROBA and SPOT satellites, and its equivalent Moderate resolution Imaging Spectroradiometer (MODIS) bands, is provided in Table 2.
The quality flag information of each product was used to filter low-quality pixels (Table 3). For the C3S PROBA-V SA v1.0 products, the land pixels showing an input status “out of range” or “invalid” or “saturated” in the B2 and B0 channels were discarded. The SPOT/VGT SA v1.0 pixels where the algorithm failed were not considered in the validation exercise. Additionally, two ancillary variables were also taken into account: The uncertainty (ERR) and the mean age (AGE, in number of days) of the observations that are used to produce the SA. The SPOT/VGT SA v1.0 pixels with associated uncertainty greater than 0.2 and an AGE greater than 20 were discarded. For MODIS C6, the quality flags are given in the MCD43A2 product, and those pixels with fewer than seven valid observations were discarded.

2.1. Evaluated Dataset: C3S SA v1.0 Based on PROBA-V Data

PROBA-V has operated since May 2013 at an altitude of 820 km in a sun-synchronous orbit with a local overpass time at launch of 10:45 a.m. However, because the satellite has no onboard propellant, this local overpass time gradually differs from the at-launch value [3]. The payload consists of three identical cameras, which are equipped with a very compact Three Mirror Anastigmat telescope. Each camera has two focal planes, one for the short-wave infrared (SWIR) and one for the visible and near-infrared (VNIR) bands, with a slightly different off-nadir along track viewing direction. PROBA-V observes four spectral bands: Blue (called B0: centered at 0.463 µm), Red (B1: 0.655 µm), NIR (B2: 0.845 µm), and SWIR (MIR: 1.600 µm). The target on the ground is imaged at different times and with different viewing angles. This specific technical concept makes the angular configurations of the observations in the VNIR and SWIR bands different, and hence, different angular information is provided. Observations are taken at resolutions from 100 to 180 m at nadir and up to 350 m and 660 m at the swath extremes for the VNIR and SWIR channels, respectively [38]. The final PROBA-V data [39], disseminated by the PROBA-V Ground Segment at 100 m, 300 m and 1 km resolutions, have been available on [40] since the end of 2013.
The C3S PROBA-V SA v1.0 products (example in Figure 1) are freely available in the C3S CDS [11]. They also provide Directional-Hemispherical albedos (AL-DH)—also called Black-Sky Albedo (BSA)—and the Bi-Hemispherical albedos (AL-BH)—also called White-Sky Albedo (WSA)—in three broadband spectral domains (visible [VI: 0.4–0.7 µm], NIR [NI: 0.7–4 µm] and total shortwave [BB: 0.3–4 µm]). These broadband albedos are taken from the CGLS [10]. In addition, the spectral AL-DH and AL-BH albedos in the four spectral channels (see Table 2) are made available in the C3S. These products have been produced every 10 days from the end of 2013 onwards, with the production dates on the 3rd, 13th, and 23rd of each month and delivered with a 12 day lag in near real-time. The spatial resolution of the grid is 1/112°, resulting in a pixel size of approximately 1 km at the equator. Apart from the layers corresponding to albedo retrievals, the ancillary layers corresponding to their respective errors (ERRs), the associated quality flag (QFLAG) and the number of valid observations during the synthesis period (NMOD) are provided. The information of each layer is described in the Product User Guide and Specification (PUGS) document [41].
The methodology, which is described in the Algorithm Theoretical Basis Document (ATBD) [35], follows the approach of separating the atmospheric correction, directional reflectance normalization, and albedo determination. First, the top-of-atmosphere (TOA) data are processed to obtain the cloud-free top-of-canopy (TOC) reflectances. Then, the spectral TOC reflectances acquired under different solar-viewing configurations during the synthesis period are normalized by inverting a linear kernel-driven model [42]. The synthesis period is 30 day and a semi-Gaussian weighting function with the maximum weight on the last observation of the period was selected for near real-time production. Then, the spectral albedos are computed using the angular integration of the kernel functions with the retrieved parameters for each pixel. Finally, the broadband albedo is defined as a linear combination of the spectral albedo values in the available spectral channels. The narrow to broadband conversion coefficients are applied both for the black-sky and for the white-sky albedos.

2.2. C3S SA v1.0 Based on SPOT/VGT Data

C3S SPOT/VGT SA v1.0, which is available from C3S CDS [11], provides a CDR of the global black-sky and white-sky albedo estimates for the period from 1999 to 2014 at a ground sampling distance of 1/112° and a temporal frequency of 10 days using a compositing window of 20 days. The dates of production are the 10th, 20th and 30th of each month. As for PROBA-V, the albedo quantities are provided for the three broadband domains (visible [0.4–0.7 µm], NIR [0.7–4 µm] and total shortwave [0.3–4 µm]) and in the four spectral channels (see Table 2) of the VEGETATION sensors. The albedo products are based on the data acquired by the VEGETATION-1 and VEGETATION-2 sensors aboard the SPOT-4 and SPOT-5 satellites, respectively.
The retrieval algorithm [6,7,9] was developed based on the previous developments of the SA products [6,7,8,9] based on MSG/SEVIRI and Metop/AVHRR in the framework of the EUMETSAT LSA SAF project [4], and it was later adapted here to these other sensors in CGLS and C3S [43]. The input data were Collection 3 of SPOT/VGT, which corrects the bug previously detected regarding the incorrect calculation of the Sun-Earth distance of Collection 2, includes improved cloud and snow/ice detection, and revises the absolute radiometric calibration for the entire archive [44]. The main differences with the C3S PROBA-V SA v1.0 algorithm are related to the use of a different Bidirectional Reflectance Distribution Function (BRDF) model and temporal composite scheme. PROBA-V SA v1.0 implemented the Ross_Thick kernel for volumetric scattering and the Roujean kernel for geometric scattering [42], whereas SPOT/VGT SA v1.0 implemented the Ross_Thick kernel [42] for volumetric scattering and the Li_Sparse_Reciprocal kernel for geometrical scattering [45]. The synthesis period of PROBA-V SA v1.0 is 30 days using a semi-Gaussian weighting function. The SPOT/VGT SA v1.0 retrieval methodology uses a 20-day temporal composite, meaning that each surface albedo product is built from the valid SPOT/VGT observations corresponding to the 20-day period preceding the calculation date. At the BRDF inversion step, the previous inversion result is used as a priori information. Hence, a recursive temporal composition of the information over a longer time period (approximately three times longer than the production period) can be achieved to guarantee the coherence and spatial completeness of the product. The “age” (AGE parameter in the output product) of the clear-sky observations exploited in the recursive inversion scheme is an important piece of information for potential applications, and is therefore, also made available to users. This age corresponds to the mean age with respect to the date of the calculation of the clear observations considered for the albedo calculation. More details are given in the ATBD [36].
Sánchez-Zapero et al. [46] showed that the C3S SPOT/VGT SA v1.0 products were good quality based on most of the criteria evaluated, reaching validated stage 1 in the CEOS LPV hierarchy. However, two main limitations were found: (i) Some temporal noise existed at the short-time scale; and (ii) the product was not able to capture some snow events, showing large uncertainties (>0.2) in those cases. Comparisons with ground measurements (461 samples, 2000–2005 period) from 15 FLUXNET stations showed similar overall uncertainty (RMSD = 0.05) as other satellite products (MCD43A3 C6, GlobAlbedo, and GLASS), but a positive bias (14%) was found.

2.3. NASA MCD43 C6 Based on MODIS Data

The MODIS BRDF/Albedo (MCD43A3) Collection 6 (C6) dataset, which is available from [47], provides both directional albedo at local solar noon and bi-hemispherical albedo for MODIS bands 1–7 and for three broadbands (visible [0.3–0.7 μm], NIR [0.7–5.0 μm], and total shortwave [0.3–5.0 μm]). The MCD43A3 albedo quantities are delivered at a resolution of 500 m in a sinusoidal projection. They have been produced every day since 2000 with a synthesis period of 16 days. Data from both Terra and Aqua satellites are used in the generation of this product.
The MODIS albedo algorithm uses atmospherically corrected reflectance data (MOD09 product) to establish the best fit to a linear kernel-driven BRDF model, with the exception of the observations flagged as “cloud”, “cirrus high” or “aerosol high”. Like for C3S SPOT/VGT SA v1.0, the parametric BRDF model uses the Ross_Thick kernel for volumetric scattering and the Li_Sparse_Reciprocal kernel for geometrical scattering [45,48]. A full retrieval of the model is attempted if there are seven or more high-quality observations well distributed over the viewing hemisphere during the 16 day synthesis period. When the number of observations is strictly less than seven and strictly greater than two, or if observations are not well sampled or do not well fit the BRDF model, a back-up algorithm with prior information is used. Then, a fill value is stored if the number of observations is strictly less than three, and the separated snow-free gap-filled products are also accessible [49]. Then, the BRDF model parameters are used for estimating spectral albedos from angular integration. The broadband albedos are computed using the spectral to broadband conversion approach [50]. The MCD43 C6 products use an improved back-up database, which is pixel-based updated from the latest full inversion as opposed to the land cover-based database used in the previous Collection 5.
MCD43A3 SA products have reached CEOS LPV validation stage 3 [51]. Sánchez-Zapero et al. [46] reported an overall uncertainty (RMSD) of 0.053 and a low negative bias (−11.9%) of MCD43A3 C6 compared with the ground data from 15 FLUXNET homogeneous sites for the 2000–2005 period (653 samples), and a slight overall uncertainty (RMSD = 0.032) was reported compared with European FLUXNET measurements over snow-free conditions [52]. Existing studies of the previous collection 5 indicate that the accuracy of the MODIS shortwave broadband albedo meets the requirements (<5%) for both snow-free and snow-covered surfaces [31,32,33,34].

3. Ground Dataset

3.1. Ground-Based Observations for Validation (GBOV) Database

The CGLS GBOV [53] initiative aims at facilitating the use of observations from operational ground-based monitoring networks and their comparison to Earth Observation (EO) products. In the case of the SA, GBOV provides the Reference Measurements (RMs) and upscaled Land Products (LPs) based on the RM data [54,55] from over 24 sites coming from different networks, such as BSRN, FLUXNET, or SURFRAD. Currently, the GBOV database is made available for the 2012–2018 period [53]. The RM GBOV data corresponds to blue-sky albedo, which is defined as the fraction between the downward and the upward shortwave radiative flux. The diffuse fraction is also included in the RM dataset.
The innovative approach for the generation of GBOV LPs could be very useful for the validation of satellite SA products since it can be applied to both homogeneous and heterogeneous land surfaces. However, we can expect large discrepancies over heterogeneous sites compared to homogeneous sites [54,56]. The CEOS LPV albedo validation protocol [21] recommends the use of ground values measured at the flux tower (i.e., the RM) for the direct validation of EO products. For those reasons, GBOV RMs are used in this study for the accuracy assessment. Note that RMs are provided daily in the GBOV database with a typical temporal step of 30 or 1 min depending on the station. The estimation of the uncertainty associated with a solar radiation measurement by a commercial pyranometer is around 5% (at a 95% confidence level) for daily values under ideal conditions [57]. Since satellite products are defined to provide SA retrievals at solar local noon, the RMs used in this study have been taken at the same time. For this study, the concomitant period to PROBA-V was used (i.e., 2014–2018). The main characteristics of the 20 GBOV sites providing the RMs at solar local noon for the period under study are summarized in Table 4.

3.2. Analysis of the Spatial Representativeness of Tower Measurements

The reference albedo measured from towers covers a circular footprint that varies with the tower height. It is unlikely that the footprint of the ground measurements exactly matches the satellite pixel sizes. Then, the spatial representativeness of the tower-based measurements should be evaluated to minimize the issues associated with spatial representativeness in the point-to-pixel comparison [31,32].
The semivariogram [58,59] is one of the most efficient tools for describing spatial representativeness. Semivariograms were computed for the stations under evaluation using Sentinel-2 surface reflectances at a spatial resolution of 10 m near-nadir. Two different periods (leaf-off and leaf-on) periods during the year were considered to evaluate the spatial representativeness of the region around the ground tower. The spatial attributes (e.g., the range, sill and nugget) were computed by fitting the variogram estimator to an isotropic spherical model [60], and they can reveal the spatial variability of land surfaces and the scaling effects associated with remotely sensed data [31,32,33,34,61,62,63]. The methodology adopted in this study for the estimation of the geostatistical indexes is based on the comparison of the variogram model parameters retrieved at different spatial resolutions (i.e., from 1.0 km2 to 1.5 km2 squared subsets). Four different geostatistical attributes were used [16,32]: The relative coefficient of variation (RCV), the scale requirement index (RSE), the relative strength of the spatial correlation (RST) and the relative proportion of the structural variation (RSV).
The four geostatistical attributes can be combined in a compact metric (STscore [31,32], see Equation (1)), which represents a spatial representativeness score using RSE as the primary marker and the others like secondary weights. When the spherical variogram model does not provide a good fit to the variogram estimator, another indicator (RAWscore [31,32], see Equation (2) could be used to provide a spatial representativeness score, which is only based on the RCV.
S T s c o r e = ( | R C V | + | R S T | + | R S V | 3 + R S E ) 1
R A W s c o r e = | 2   R C V | 1
Both scores are directly proportional to the site representativeness. We consider that sites are heterogeneous or not spatially representative when both scores are lower than 2.0 (see Table 5) because large differences, due to spatial heterogeneity, are expected for scores below this threshold [16]. Based on it, the ground measurements coming from Boulder (USA_BAO), Renon (ITA_REN), Rock Springs (USA_PSU) and Table Mountain (USA_TBL) sites are not used for the accuracy assessment during the leaf-off seasonal period. In addition, the Cabauw (NET_CAB), Goodwin Creek (USA_GCM) and Gobabeb (NAM_GOB) sites were discarded during leaf-on seasonal period. Figure 2 shows two examples of sites of stations spatially representative (top side), and two examples of not spatially representative (bottom side).

4. Quality Assessment Methodology

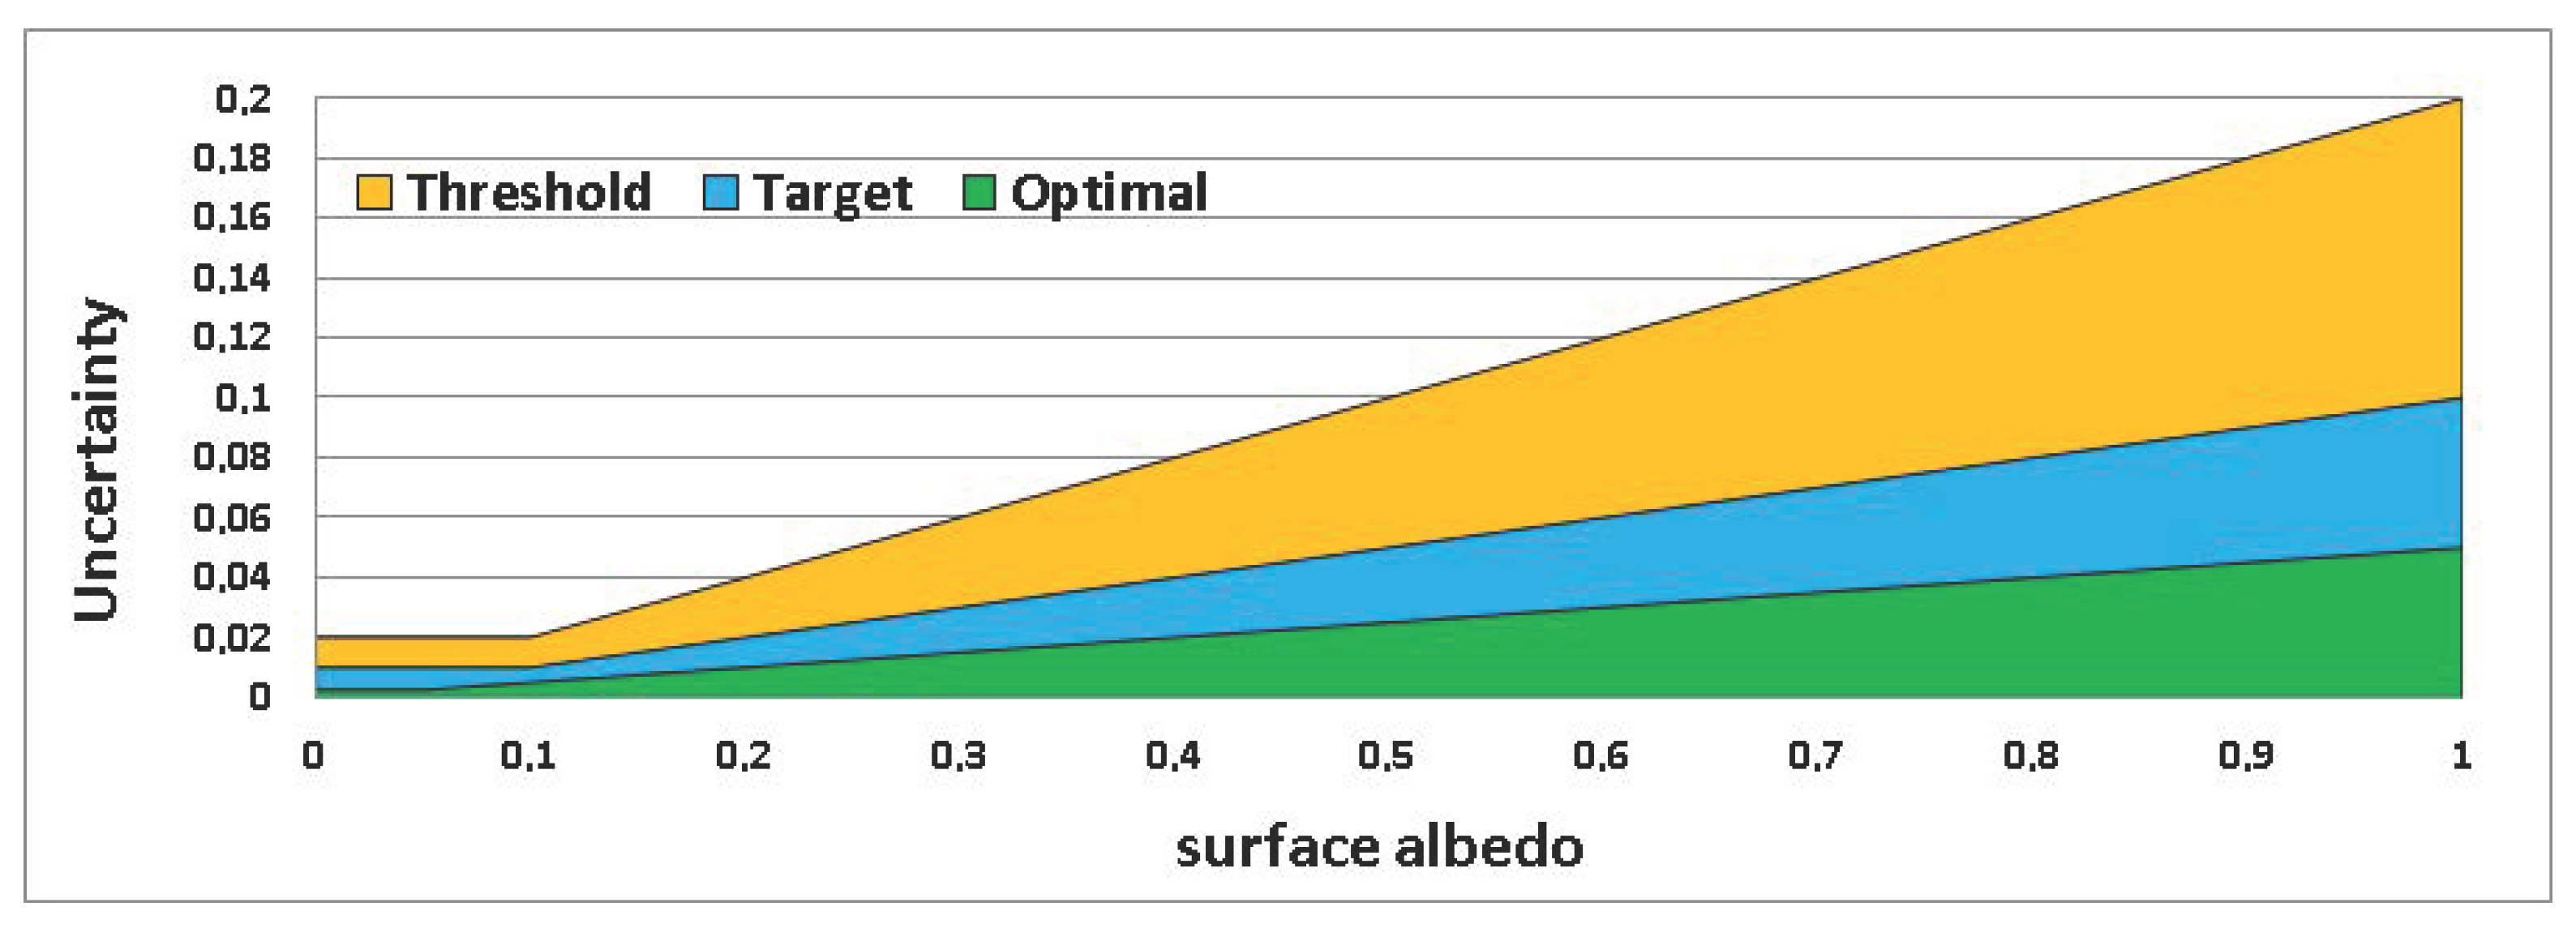
4.1. Uncertainty Requirements

The accuracy assessment results were analyzed against predefined uncertainty levels based on a review of the existing user requirements from the Global Climate Observing System (GCOS), the World Meteorological Organization (WMO) and the key performance indicators of C3S.
In the last update of the GCOS requirements [64], there is a distinction between the products targeted for “adaptation” and “modelling” applications that results in different needs for the horizontal resolution. Modelling requirements (i.e., uncertainty Max [5%; 0.0025], see Table 6) are the focus of this study since modelling is the main application targeted. Other requirements come from the WMO [65], which aids in the setting of the priorities to be agreed upon by WMO members and their space agencies for enhancing the space-based GCOS system. The WMO specifies the requirements for the SA for climatologic applications at three quality levels (Table 6): Threshold (minimum requirement), breakthrough (significant improvement) and goal (optimum, no further improvement required). The stated “goal” WMO uncertainty requirement of 5% is, thus, equivalent to the GCOS requirement in relative terms. Apart from the GCOS and WMO, the Key Performance Indicator (KPI) of the maximum accuracy being between 10% and 0.01 was defined in the C3S program [66].
Based on the existing requirements, three different levels (i.e., optimal, target and threshold) are predefined in this study (Table 7) with the aim to verify whether the results fit the purpose (Table 6). The optimal level (Max [5%, 0.0025]) was selected according to the GCOS uncertainty requirement and is equivalent to the WMO goal. The target level (Max [10%, 0.01]) is equivalent to the C3S KPI and partly equivalent to the WMO breakthrough level. Finally, the threshold level (Max [20%, 0.02]) was adopted from the WMO. Poor performances of the product correspond to values above the threshold level (minimum requirement). Figure 3 displays the selected uncertainty levels as a function of the product values.

4.2. Validation Methods

The validation methodology follows the CEOS LPV good practice protocol for the validation of satellite-derived albedo products [21], and the validation metrics are presented in Section 4.2.1. The different strategies for product intercomparison and direct validation are described in Section 4.2.2 and Section 4.2.3, respectively.
Figure 4 shows the global distribution of the sampling used in this study. The product intercomparison is evaluated over a 725-site land validation network (LANDVAL) of sites [67], which is designed to globally represent the variability of land surface types, and was used as the spatial sampling to evaluate these criteria. This network also includes 20 well-known desert calibration sites [26] for the precision evaluation, due to their high temporal stability. For the direct validation, the 20 selected GBOV homogeneous stations with available ground data (see Table 5) were used.

4.2.1. Validation Metrics

The definitions of the completeness, precision, uncertainty and accuracy (Table 8), which are applicable to SA validation, are drawn from the experimental recommendations of the Joint Committee for Guides in Metrology (JCGM) regarding the expression of uncertainty in measurement [68] and from the GCOS [64].
Completeness is the proportion of valid retrievals over an observation domain at any given time. It is, therefore, mandatory to document the completeness of the product (i.e., the distribution in space and time of missing data).
Two aspects of the precision, which is also called the repeatability, are evaluated: The intra-annual and inter-annual precision. The intra-annual precision (smoothness or δ function) corresponds to the temporal noise assumed to have no serial correlation within a season. The δ function is computed for each triplet of consecutive observations [69,70] as the absolute value of the difference between the center and the corresponding linear interpolation between the two extremes, and the median of the δ values is provided as an indicator of the intra-annual precision of satellite albedo products [21]. The inter-annual precision (i.e., the dispersion of the albedo values from year to year) was assessed over the 20 desert calibration sites between two consecutive years, and the median absolute deviation is provided as an indicator of the inter-annual precision [21].
Accuracy is the degree of “closeness of the agreement between the result of a measurement and a true value of the measurand” [68]. Commonly, accuracy is used to describe systematic errors and measure statistical bias, but the best practice is to provide the median error as an indicator of accuracy [21].
Uncertainty is a “parameter, associated with the result of a measurement, that characterizes the dispersion of the values that could reasonably be attributed to the measurand” [68]. Uncertainty includes the bias and precision errors and can be estimated by the Root Mean Square Deviation (RMSD). Additionally, the linear model fits are used to quantify the goodness of fit. For this purpose, Major Axis Regressions (MARs) were computed instead of Ordinary Least Squares (OLS) because it is specifically formulated to handle errors in both the x and y variables [71]. Other metrics are used, such as the number of samples (N), which is indicative of the power of the validation; or the correlation coefficient (R, estimated as the Pearson coefficient), which indicates the descriptive power of the linear accuracy test. The percentage of pixels within the predefined uncertainty levels (Table 7, Figure 3) is also quantified.

4.2.2. Satellite Product Intercomparison

The intercomparison of satellite products must account for the differences in the spatial and temporal characteristics of the different datasets. Consequently, a spatial support area and temporal support period were defined consistent with the C3S SA characteristics (Table 1). Thus, the MCD43A4 C6 products were re-sampled to Plate Carrée using a 1 km spatial sampling grid. Satellite products were compared using the closest date of their different temporal composites, using the 10 day temporal frequency of C3S SA products.
The completeness and precision of the different products were evaluated and compared, as well as the temporal consistency among the several products, which was qualitatively assessed per biome type. The uncertainty estimates from the intercomparisons provided an overall figure of the spatio-temporal consistency between products. Scatter-plots and the associated metrics between pairs of products were analyzed and complemented with box-plots of the bias per bin albedo value. Our analysis focuses on the consistency during the 6-month overlap period between PROBA-V SA v1.0 and SPOT/VGT SA v1.0, whereas the intercomparison with MCD43A3 C6 was conducted using one year (2014) of data.

4.2.3. Ground-Based Validation

The main steps in the accuracy assessment of albedo products include the generation of blue-sky albedo [30] for a direct comparison with in-situ measurements and the test of the spatial representativeness of the in situ albedometer footprints for the satellite pixel resolution of interest according to in situ measurements standards [31,32]. Consequently, a careful selection of ground points and the characterization of their spatial representativeness are crucial for a meaningful point-to-pixel comparison, as presented in Section 3.2. For the first step, the blue-sky albedo from a satellite is estimated from the retrieved AL-DH-BB and AL-BH-BB satellite EO product under study, and weighted by the fraction of diffuse down-welling shortwave radiation from the ground station [30]. The next step is the careful selection of the homogeneous sites, which are similar to the footprints of the satellite pixel resolution of interest. The accuracy assessment of the SA satellite products was performed against the measurements coming from the 20 selected GBOV homogeneous stations presented in Section 3.
The study here was extended to the period from 2014 to 2018 to have the maximum concomitant samples from the GBOV dataset to PROBA-V observations. The accuracy assessment of MCD43A3 C6 for the same period and sampling was performed for benchmarking. This exercise was carried out at a resolution of 1 km, which is equivalent to one pixel in the case of PROBA-V SA v1.0, and averages of 2 × 2 pixels in the case of MCD43A3 C6. The 10 day frequency of C3S products was used as temporal sampling, and the average values of the daily ground data were computed to compare with satellite estimations during the corresponding temporal composite window of each product (see Table 1). This analysis was performed over the best quality pixels of C3S PROBA-V SA v1.0 and MCD43A3 C6, according to QFLAGs (Table 3).

5. Results

5.1. Satellite Product Intercomparison

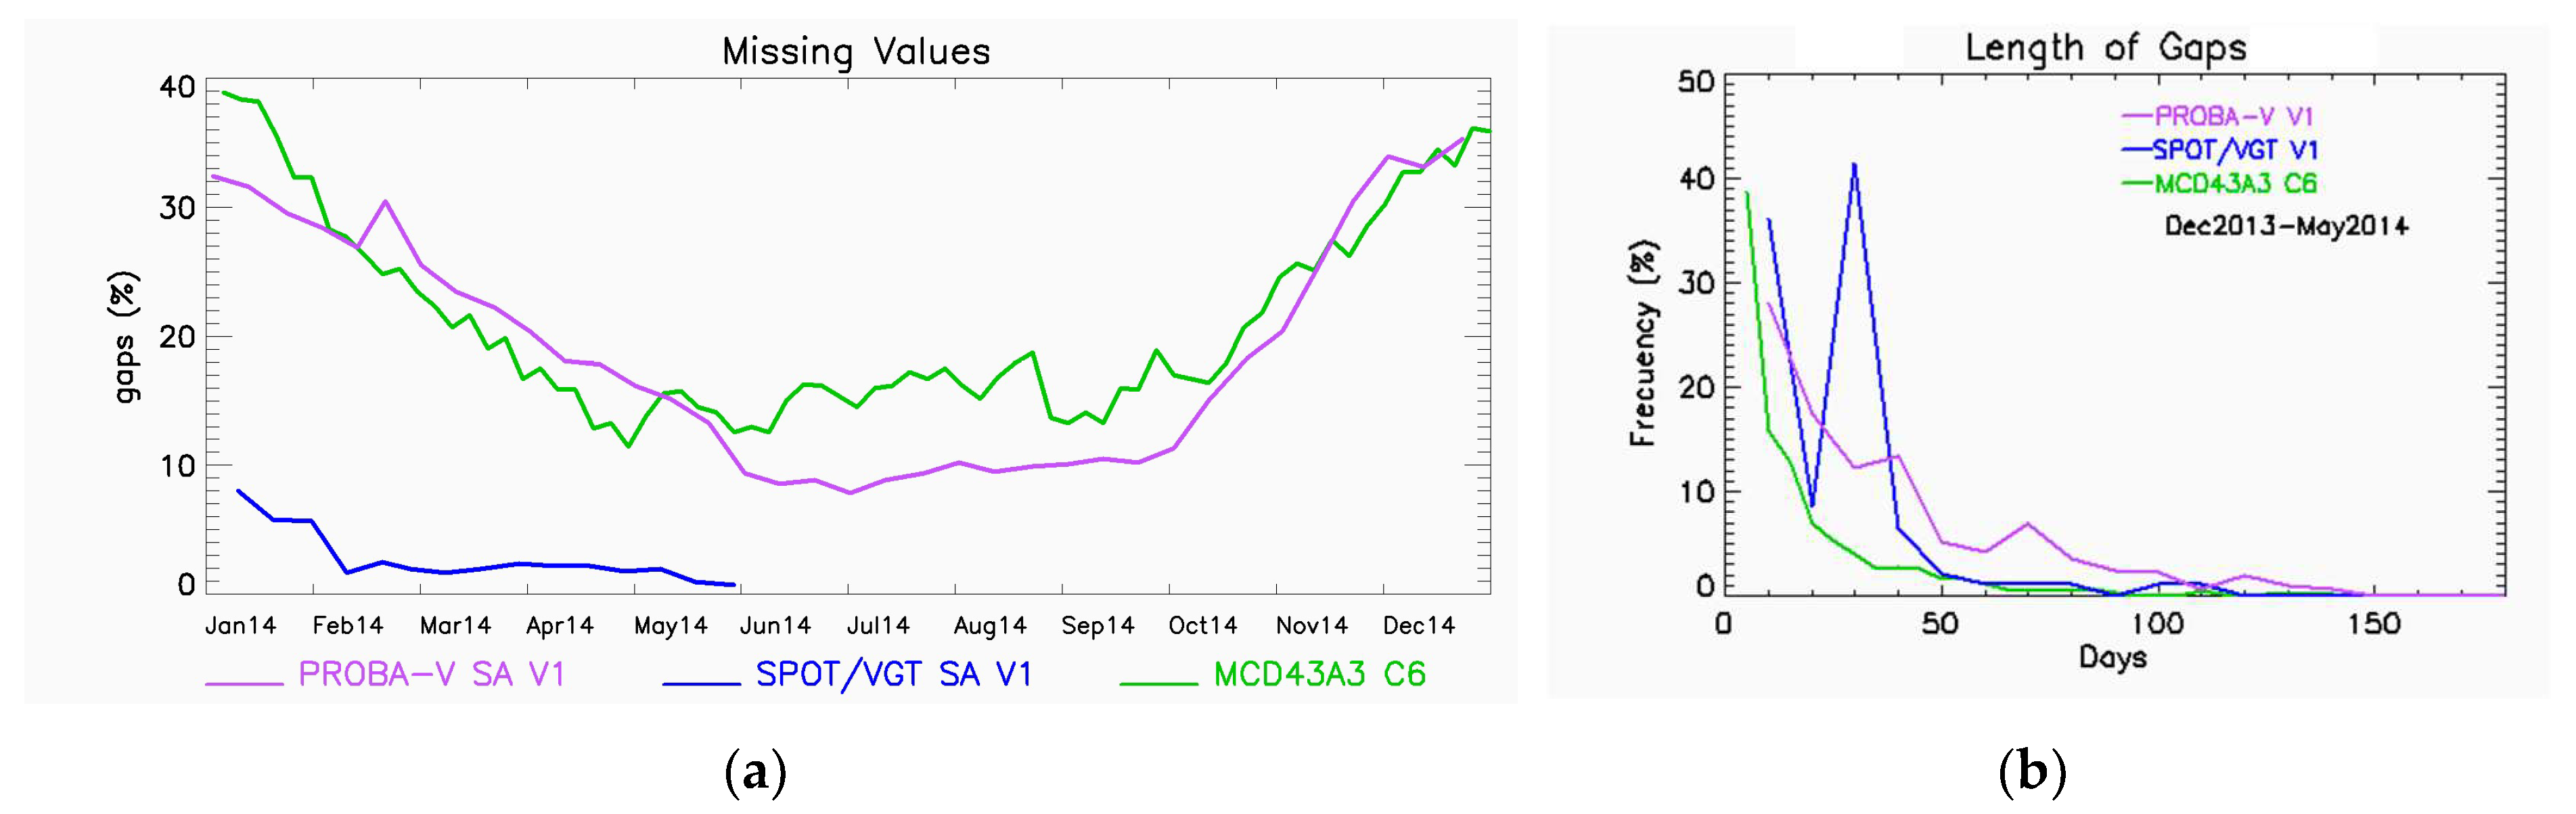
5.1.1. Product Completeness

The global map of the percentage of gaps (i.e., values with missing data) during one whole year of data (2014) for the PROBA-V SA v1.0 products (Figure 5) shows poor spatio-temporal continuity over latitudes higher than 45° north and over the equatorial belt, with a percentage of missing values up to 100% in some pixels over these areas. Note that the information from the quality flags was not considered here in the computation of the gaps (i.e., a gap or missing value corresponds to a fill value in the product). C3S products are not provided over areas out of the region from latitudes of 60°S to 75°N.
The temporal evolution of missing values (Figure 6a) shows the highest percentage of missing PROBA-V SA v1.0 values during wintertime in the northern hemisphere. The percentage of missing values ranges, on average, from approximately 12% (July and August 2014) to 32% (January and December 2014). PROBA-V SA v1.0 shows a similar temporal trend of missing data to MCD43A3 C6. Better completeness was found for SPOT/VGT SA v1.0 with almost no missing data during the months from March to May and a percentage up to 10% in wintertime in the northern hemisphere.
The distribution of the temporal length of the missing values (Figure 6b) allows one to better understand the impact of the gaps for monitoring the temporal variations. PROBA-V SA v1.0 shows that approximately 65% of the gaps are shorter than 30 days and approximately 35% are shorter than 10 days (time resolution of the product). Similarly, typically, approximately 35–40% of the SPOT/VGT SA v1.0 gaps are shorter than 10 days, and approximately 75% of gaps are shorter than 30 days during the overlap period between SPOT/VGT and PROBA-V. MCD43A3 C6 has a shorter length of gaps, with approximately 40% of the gaps corresponding to 5 days.

5.1.2. Temporal Consistency

The temporal profiles of the different SA products (PROBA-V SA v1.0, SPOT/VGT SA v1.0 and MCD43A3 C6) in the three broadband domains (visible, NIR, and total shortwave) were analyzed over the 725 LANDVAL sites for each main biome type (Figure 7). The analytical focus of the transition between SPOT/VGT and PROBA-V and the 2013–2014 period was represented. All the satellite products are displayed at the center of their temporal composite windows (30 days in the case of PROVA-V SA v1.0, 20 days in the case of SPOT/VGT SA v1.0 and 16 days in the case of MCD43A3 C6). Note that the information of the PROBA-V SA v1.0 QFLAG was also displayed in these graphs: Filled dots correspond to pixels flagged as good quality, and unfilled dots correspond to pixels flagged as low-quality (land pixels with bit 6, 10 or 11 to 1) according to Table 3.
For evergreen broadleaved forests, some temporal noise was observed in all satellite products. However, PROBA-V SA v1.0 and MCD43A3 C6 seem to provide less noise (i.e., flatter temporal trajectories) than SPOT/VGT SA v1.0, which seems to be more realistic for this biome type. For the rest of the biomes, the PROBA-V SA v1.0 profiles follow the temporal trends of SPOT/VGT SA v1.0 and MCD43A3 C6. The presence of rapid changes due to snow events, the occurrence of stable profiles and the phenological changes were consistent among the three datasets. However, PROBA-V SA v1.0 displays slightly large variability compared to other satellite products in the NIR domain (also affecting the total spectrum). Note that the use of the C3S PROBA-V SA v1.0 Quality Flag in northern latitudes removes valid snow observations in most cases.
A seasonality effect was observed with the sign of the bias between C3S PROBA-V SA v1.0 and SPOT/VGT SA v1.0 during the short overlap period over desert areas for the NIR and total spectrum. PROBA-V SA v1.0 tends to provide slightly higher values than SPOT/VGT SA v1.0 from December 2013 to February 2014, and the opposite trend was found from March 2014 to May 2014. Additionally, the SPOT/VGT SA v1.0 temporal trajectories show some temporal noise over desert sites, which is not observed for the other satellite products (PROBA-V SA v1.0 and MCD43A3 C6).

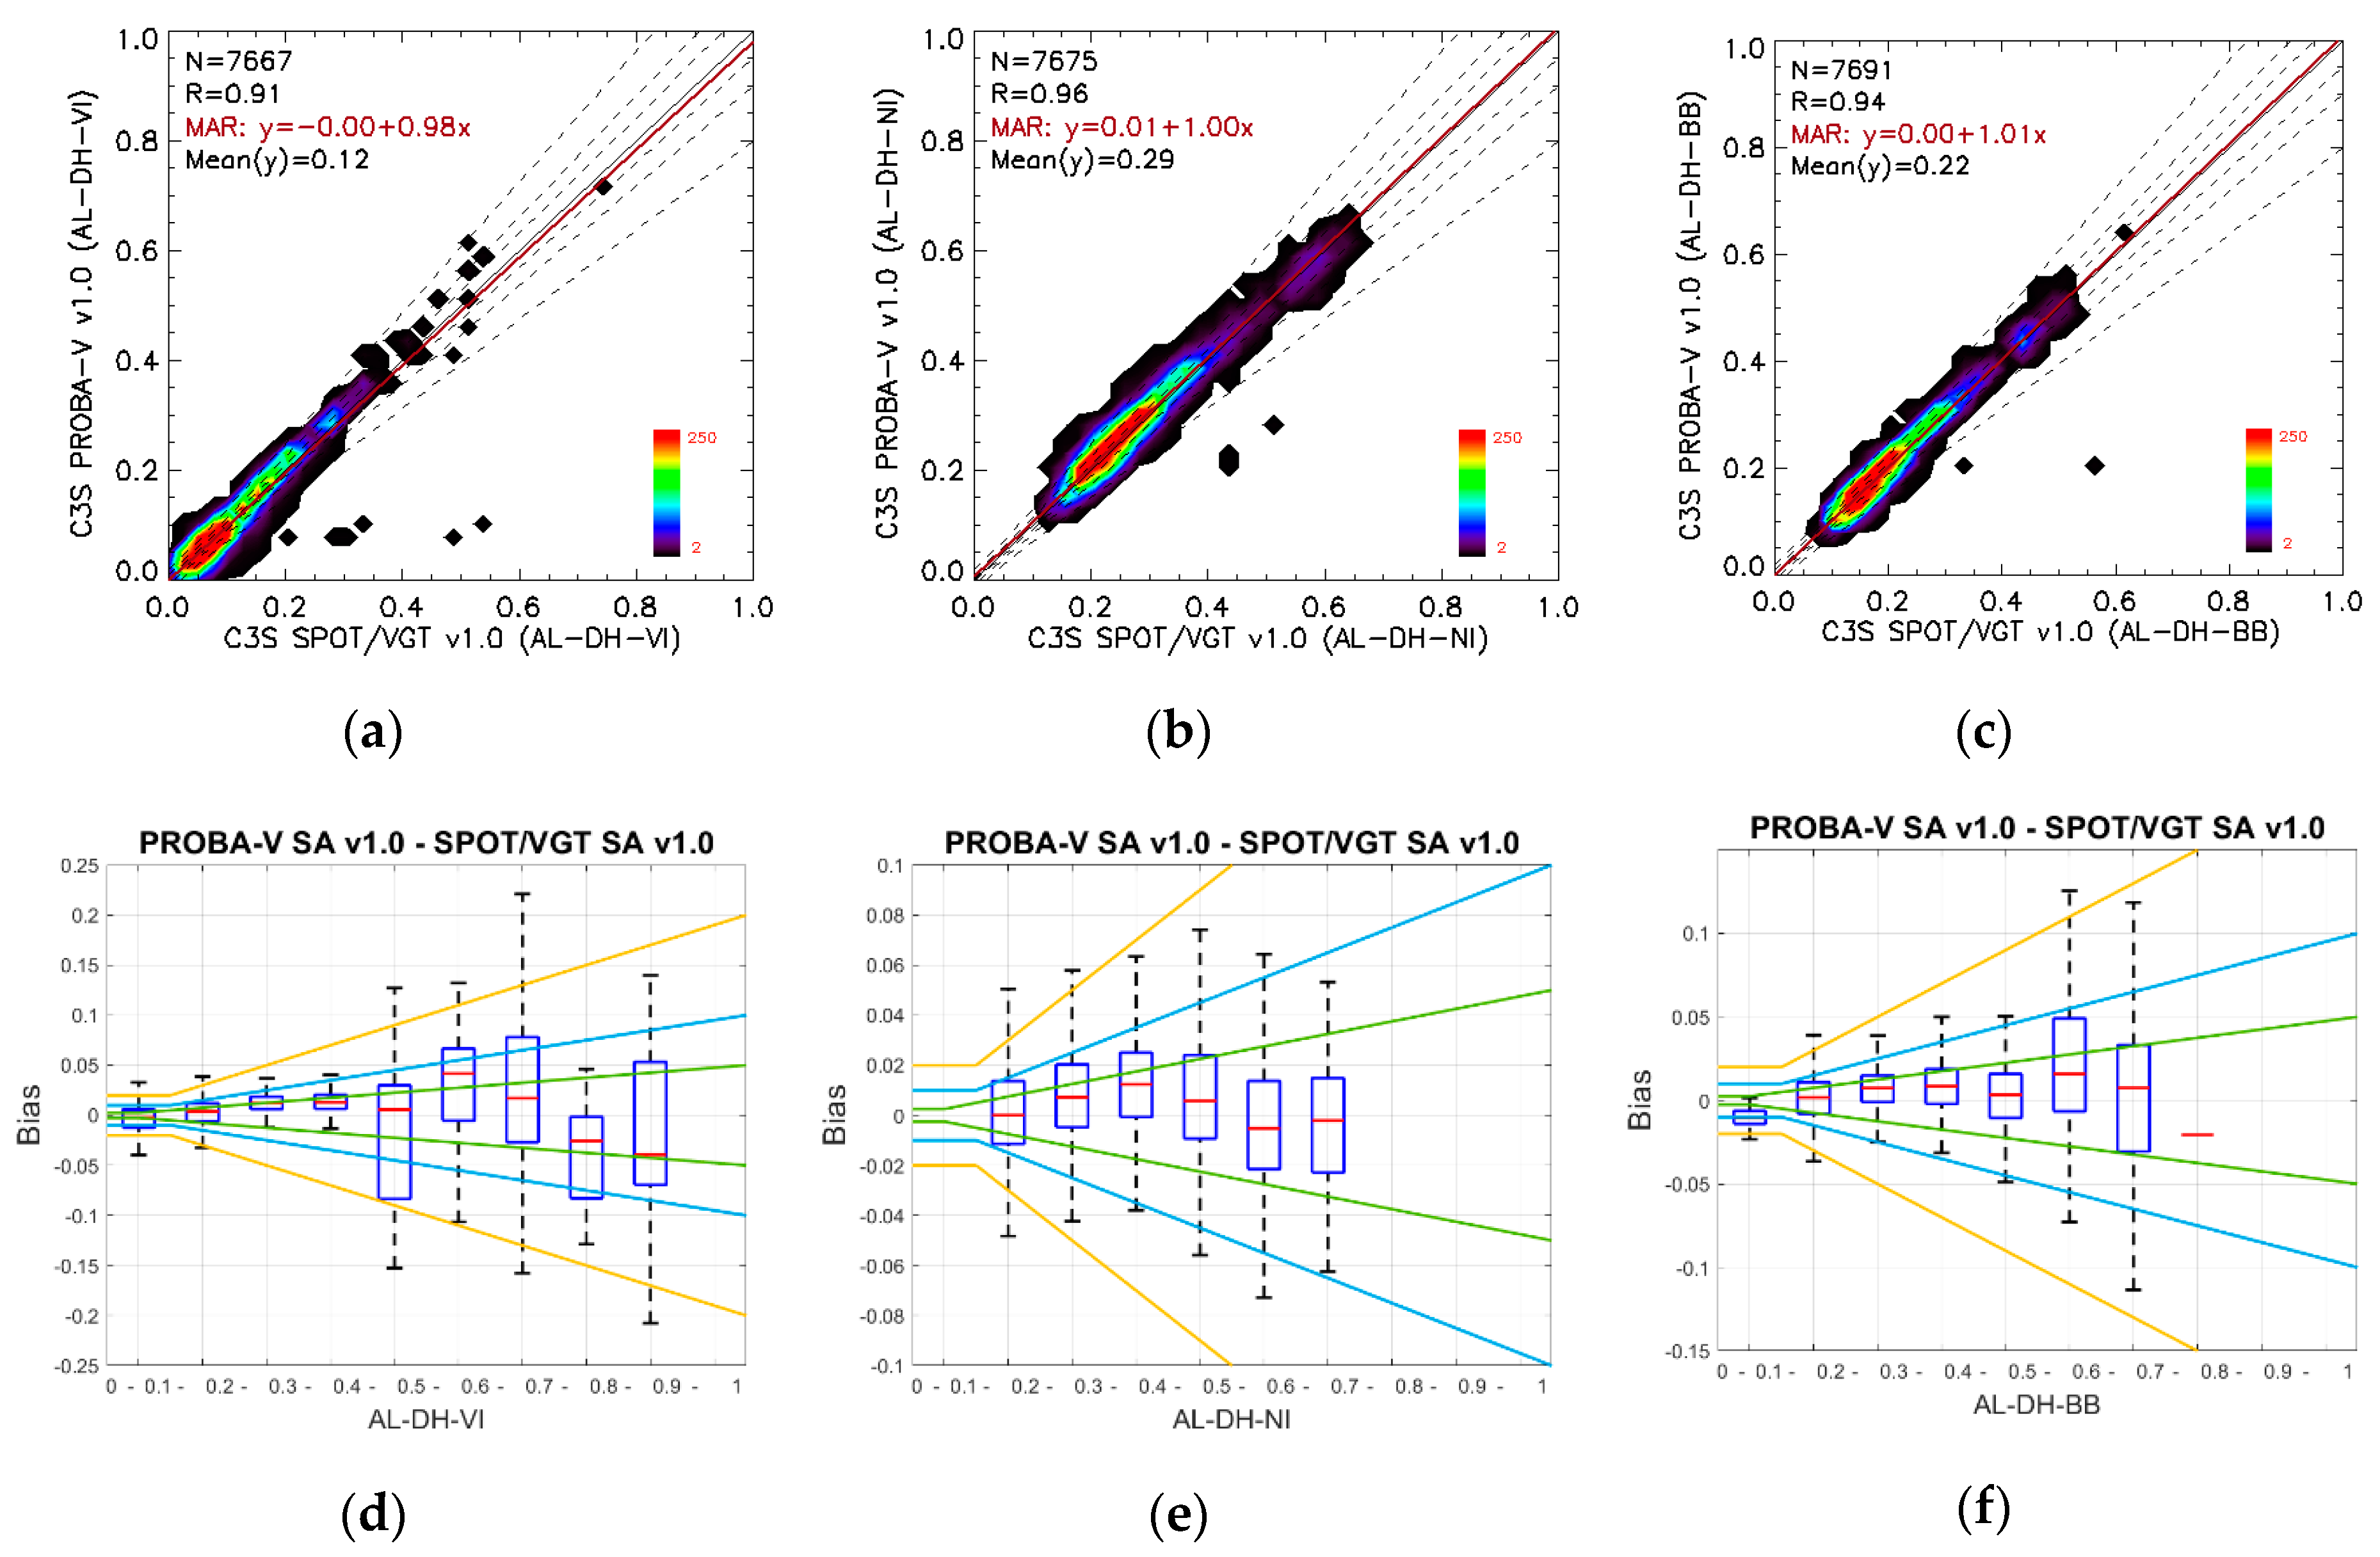
5.1.3. Spatio-Temporal Consistency

The overall spatio-temporal consistency between PROBA-V SA v1.0 and the reference products is assessed over the LANDVAL network sites considering all good quality observations according to the quality flags (see Table 3).
  • PROBA-V SA v1.0 versus SPOT/VGT SA v1.0 (overlap period)
For the visible domain (Figure 8a–d and Table 9), PROBA-V SA v1.0 tends to provide slightly lower values than SPOT/VGT SA v1.0, with small negative mean biases of −2.2% and −2.8% for black-sky and white sky albedos, respectively. Optimal lineal regression relationships from the MAR were found (offset ~0 and slope close to 1). Worse results were found in terms of the RMSD (uncertainty), with values of approximately 0.05 (~35%).
For the near-infrared (Figure 8b–e and Table 9), positive biases (PROBA-V SA v1.0 > SPOT/VGT SA v1.0) of 2.3–2.4% were found, with an RMSD of approximately 10% and high correlations (>0.94). PROBA-V SA v1.0 tends to provide higher values than SPOT/VGT SA v1.0 for albedo values lower than 0.5 and the opposite trend for albedo values higher than 0.5 (typically snow cases). In all cases, a median bias close to zero was found, which was within the optimal level of consistency.
Remarkably low mean biases (<1%) were found for the total shortwave (Figure 8c–f and Table 9), as well as high correlations (>0.93). Total uncertainties (RMSD) of 0.03 (~15%) were found. A systematic positive bias was found for almost all ranges, except for values lower than 0.1 and higher than 0.7, with the median bias typically within the optimal (GCOS) level of consistency (Table 6).
  • PROBA-V SA v1.0 versus MCD43A3 C6 (2014 year)
Positive bias (PROBA-V SA v1.0 > MCD43A3 C6) of ~ 5% was found for the visible domain (Figure 9a–d and Table 10) with uncertainties (RMSD) lower than 0.05. Box-plots show slight median positive bias for albedo ranges up to 0.4, which is the range where most of the samples are located in this spectral domain. Large discrepancies were found for the highest ranges, mainly affected by snow cases, with a tendency towards the negative sign of the bias.
PROBA-V SA v1.0 tends to provide higher values than MCD43A3 C6 ( ~ 8–9%) for the near-infrared (Figure 9b–e and Table 10), with overall RMSD of approximately 14–15%. PROBA-V SA v1.0 tends to provide higher values than MCD43A3 C6 for albedo values lower than 0.5, and the opposite trend for albedo values higher than 0.5.
The worse performance in the comparison PROBA-V SA v1.0 versus MCD43A3 C6 was found for the total spectrum (Figure 9c–f and Table 10), with a large positive bias of ~ 12–13%. As observed for the NIR, PROBA-V tends to provide higher values than MODIS C6 for albedo values lower than 0.5 and the opposite trend for albedo values higher than 0.5 (i.e., snow cases).
  • Compliance with user requirements
The compliance matrix of C3S PROBA-V SA v1.0 versus the reference products (SPOT/VGT SA v1.0 and MCD43A3) with predefined uncertainty levels based on different user requirements is presented in Table 11.

5.1.4. Intra-Annual Precision

The Probability Density Functions (PDFs) of the intra-annual precision (the so-called smoothness) are analyzed (Figure 10). The computation was performed over LANDVAL sites during the overlap period between SPOT/VGT, PROBA-V and MODIS products (i.e., December 2013–May 2014 period).
The three products present similar distributions of the smoothness (δ). Most of the delta values are below 0.01, which demonstrates the high stability over a short time scale for the albedo products. In all satellite products, worse intra-annual precision (i.e., higher δ values) was found for white-sky albedos compared with equivalent black-sky albedos. The median δ values (Table 12), which are indicative of the intra-annual precision, show improved results (i.e., lower δ values) of PROBA-V SA v1.0 compared to SPOT/VGT SA v1.0 for visible and total shortwave and worse performance for NIR. Both C3S products provide much worse intra-annual precision than MODIS C6.

5.1.5. Inter-Annual Precision

PROBA-V SA v1.0 black-sky albedo shows an inter-annual precision of approximately 1%, showing improved results compared to SPOT/VGT SA v1.0 (2–3%). MCD43A3 C6 provides better inter-annual precision, with median absolute deviations lower than 1%. As observed for the intra-annual precision, all products provided worse results for white-sky albedos compared to black-sky albedos (Table 13).

5.2. Ground-Based Direct Validation

To investigate the accuracy of C3S PROBA-V SA v1.0 and MCD43A3 C6 satellite albedo products, scatter plots versus field measurements (GBOV RM) were produced for the 2014–2018 period over 20 homogeneous sites (see Section 3) with different vegetation types. Figure 11 and Table 14 show the scatter-plots, and relevant statistics from the direct validation exercise, whilst Table 15 summarizes the compliance of both satellite products with user requirements (predefined in Section 4.1). The relevant statistics per biome type are presented in Table 16 and Table 17 for PROBA-V SA v1.0 and MCD43A3 C6, and the scatter-plots per biome type can be found in Appendix A. The temporal trajectories of both PROBA-V SA v1.0 and MCD43A3 C6 compared to the daily GBOV RMs are presented in Appendix B.
C3S PROBA-V SA v1.0 shows an overall accuracy (median error) of 18.2%, with a tendency to overestimate ground values (positive bias of 11.5%). This positive bias was mainly observed for low albedo values (up to 0.2, forest sites) showing an offset of 0.07 and a slope of 0.7 in the MAR relationship. MCD43A3 C6 provides a lower median error of 11.2% with a negative mean bias of −5.9%. C3S PROBA-V SA v1.0 products provide similar results in terms of uncertainty (RMSD of 22.4%) than MCD43A3 C6 (RMSD of 24.8%).
Note that 15.5% of the 1715 PROBA-V SA v1.0 samples achieved the optimal predefined level (i.e., GCOS requirements) and 28.6% of the target level (i.e., C3S KPI), as shown in Table 15. Slightly improved results were found for MCD43A3 C6 (23.7% and 45.5% of the optimal and target levels, respectively).
Per biome type, PROBA-V SA v1.0 provides a large positive bias for forest (22.4%) and desert (10.4%) sites compared to crop (7.4%) and grassland/shrubland (4.2%) sites. MCD43A3 C6 systematically provides a large negative bias for most biome cases (croplands, grassland/shrublands and desert) except for forests, where a low positive bias was found (2.8%).

6. Discussion

C3S SA v1.0 based on PROBA-V provides continuity to the CDRs of global albedo products in the C3S from December 2013 onwards. Previously, SA products were derived from SPOT/VGT (1998–2014) and NOAA/AVHRR (1981–2005) data. Good spatio-temporal consistency in the transition from SPOT/VGT to PROBA-V for both black-sky and white-sky albedos, with mean biases below ±3% for the overlap period, was found. However, the comparison of C3S PROBA-V SA v1.0 with MCD43A3 C6 SA showed lower spatio-temporal consistency between satellite products with mean biases up to 13%. C3S PROBA-V SA v1.0 (and MCD43A3 C6) displayed more gaps (typically between 10% and 20%) than C3S SPOT/VGT v1.0.
Different aspects of the retrieval methodology play important roles in the existing discrepancies between the satellite products under study (C3S PROBA-V SA v1.0, C3 SPOT/VGT SA v1.0 and MCD43A3 C6) starting from the different input data and different atmospheric correction methods; including the BRDF parameterization, temporal compositing and angular integration; and finalizing with the narrow to broadband conversion.
Regarding the input data, each sensor works in different spectral channels (see Table 2). The SPOT/VGT and PROBA-V channels provide very similar spectral characteristics in the Blue, Red and NIR bands, whereas significant differences are found for the SWIR channel. The central wavelengths of the MODIS spectral bands are comparable to the corresponding bands for PROBA-V and VGT, albeit the MODIS spectral bands are narrower. These differences could translate into reflectance discrepancies in regions with high absorption features like in the visible domain, where large uncertainty values were found between pairs of products.
Each satellite processing chain uses its own method for cloud/shadow screening and atmospheric correction according to the spatial, spectral and directional capabilities of each instrument. Cloud or snow contamination is the main reason for missing data in the EO products derived from optical onboard satellite sensors. The conservative PROBA-V cloud detection algorithm [72] is one of the reasons for the higher fraction of missing data of PROBA-V SA v1.0 products compared to SPOT/VGT SA v1.0.
Discrepancies between different albedo estimates can also be attributed to the different BRDF models used [7]. Moreover, the performance of the BRDF model for good clear-sky observations also depends on the number of available looks during the synthesis period and the angular distribution of the sampling. Large BRDF uncertainties are associated with snow targets (as observed for the highest albedo ranges) for which none of these parametric BRDF models were well suited [73]. PROBA-V, SPOT/VGT and MODIS are wide-FOV sensors on polar-orbiting platforms, and a low impact of discrepancies is expected, due to different sun-view configurations. However, the different compositing periods (see Table 1) could play an important role in the differences between satellite products, mainly in rapid SA variations, such as snow events. Different techniques for temporal composite approaches also affect the completeness of EO satellite products. SPOT/VGT SA v1.0 uses a recursive temporal composition approach [9], which is the main reason for the improved completeness compared to the other satellite products (C3S PROBA-V SA v1.0 and MCD43A3 C6) that are computed using classical composite schemes based on predefined temporal windows.
In the last step, the broadband albedos are defined using slightly different spectral regions. The same broadband spectral regions are defined in both C3S PROBA-V SA v1.0 and SPOT/VGT SA v1.0 products, which contribute to a better agreement, whereas the MCD43A3 C6 broadband albedos are slightly differently defined.
In addition, the temporal noise (i.e., large temporal variability) observed for C3S PROBA-V SA v1.0 in the NIR domain through the qualitative inspection of the temporal variations (see Section 5.1.2) has a strong relationship with the precision, since low intra-annual precision was found compared to both reference EO products in this spectral range. In terms of the inter-annual precision, improved results were found for C3S PROBA-V SA v1.0 ( ~ 1%) compared to C3S SA v1.0 based on SPOT/VGT SA data (2%).
Regarding the accuracy with the ground measurements, PROBA-V SA v1.0 provided a similar accuracy (bias of 11.5%) to that found for C3S SPOT/VGT SA v1.0 during the validation exercise [44], where a positive bias (14%) was also reported for a different sampling (i.e., different stations and dates). PROBA-V SA v1.0 also provided a slightly worse accuracy (median error of 18.2%) than MCD43A3 C6 (median error of 11.2%). PROBA-V SA v1.0 tends to overestimate the ground values, whereas MCD43A3 C6 showed the opposite sign of the mean bias. The positive bias of PROBA-V SA v1.0 was mainly observed for forest sites (SA < 0.2) explained in the fact that the Roujean kernel [42] for geometrical scattering may not fit some cover types well, especially dense forest canopies, where it showed a weak hotspot effect [74,75,76]. The negative bias of MCD43A3 C6 is mainly influenced by some outliers detected in Gobabeb (bare soil) and Cabaw (grassland). For the Cabaw case, the lower MCD43A3 C6 values are explained by the persistent cloudiness at the MODIS overpass times [56]. It is important to note that only the satellite retrievals classified as the best quality, according to QFLAGs (Table 3), were used in the direct validation. As observed in the temporal consistency, the use of QFLAGs removes most of the valid snow retrievals in the case of PROBA-V. Then, this exercise is almost equivalent to snow-free conditions, which is more convenient for assessing the uncertainty of satellite EO products, since it is expected that the spatial representativeness of the pixels dropped during the fall and winter months as a consequence of the increased sub-pixel heterogeneity, due to processes, such as non-uniform patterns of snowmelt [77]. The positive bias of C3S PROBA-V SA v1.0 is consistent with previous studies performed on the CGLS, where a positive bias of approximately 22% was found compared to ground measurements over 17 stations [27], and a positive bias of approximately 14% was found compared to National Ecological Observatory Network (NEON) ground data [78]. The accuracy assessment of MCD43A3 C6 was also consistent with that previously reported when comparing the combined TERRA+AQUA albedo product with eight field stations during the spring and summer months of 2003 and 2004 (i.e., equivalent to snow-free conditions), where an accuracy of 0.013 was reported in terms of the absolute bias [79]. It should be noted that the estimation of the uncertainty of ground reference data is around 5% under ideal conditions [58]. Thus, fiducial reference measurements must be characterized with highly calibrated instrumentation at dedicated cal/val sites to better estimate the satellite product uncertainty budget.
The compliance of satellite EO products versus ground data with user requirements showed a low percentage of pixels within GCOS (only < 25%) and C3S (<50%) requirements, which indicates the difficulties of achieving these requirements using current products. To further improve the compliance with requirements, it is recommended that EO programs provide the uncertainties associated with the processing chain, mainly related to the sensor calibration and atmospheric correction. In that way, the steps providing higher error can be improved. However, the comparison between satellite C3S SA v1.0 products showed an overall good spatio-temporal consistency in the comparison of SPOT/VGT versus PROBA-V during the 6-month overlapping period (December 2013–May 2014), with typically more than 60% of the samples within the C3S target requirements for the visible domain, and more than 75% of the samples within the requirements for the NIR and total shortwave.

7. Conclusions

This paper presents the quality assessment results of C3S PROBA-V SA v1.0 products (broadband albedos) through intercomparison with reference satellite products (C3S SPOT/VGT SA v1.0 and MCD43 C6) at the global scale and the direct validation with a representative amount of ground data (1715 samples) across different biomes types (eight stations over forests, six over crops, three over grassland/shrubs, and three over desert). This validation exercise is a novelty in the literature, since very few global and temporally representative SA validation exercises have been published [21], and they are mainly based on MODIS observations [15,16,17]. The validation methodology adopted the guidelines, protocols and metrics defined by the CEOS LPV best practices for the validation of global albedo satellite products [21]. Additional results, such as the comparison of the spectral albedos or the presentation of the satellite products intercomparison per biome type, are not shown in this manuscript for the sake of brevity; however, they can be found in the product quality assessment report [66].
The main conclusions are the following.
  • The good spatio-temporal consistency of C3S PROBA-V and SPOT/VGT SA v1.0 products assures the continuity of the CDRs in terms of the uncertainty between products. However, C3S PROBA-V SA v1.0 (and MCD32A3 C6) provides low numbers of valid retrievals compared to C3S SPOT/VGT SA v1.0.
  • C3S PROBA-V SA v1.0 shows similar inter-annual precision (~1%) to MCD43A3 C6, improving the results of SPOT/VGT SA v1.0 (2–3%), since they provide some temporal instability over desert calibration targets. Both C3S products provide lower intra-annual precision than MCD43A3 C6, mainly in the NIR domain where some temporal noise was found.
  • The accuracy of the C3S PROBA-V SA v1.0 best quality retrievals with respect to the ground data over a five-year period (2014–2018) showed systematic positive overestimation, which was mainly observed for the lowest albedo ranges (SA < 0.2) over forest sites. Similar uncertainty (RMSD ~ 0.4 ) was found for MCD43A3 C6 products using the same sampling, showing the opposite sign for the mean bias.
  • Few current satellite EO albedo products comply with the GCOS, C3S and WMO uncertainty requirements.
Additionally, it is important to remark that the use of PROBA-V QFLAGs (bit 6, input status; and bits 10–11, B2–B0 saturation status) removes most of the valid snow retrievals. Therefore, masking out data by means of the QFLAGs is not recommended for snow applications (users should ignore the information of QFLAGs over snow targets for specific applications).
Based on these results, C3S PROBA-V SA v1.0 has reached validation stage 3 in the validation hierarchy of the CEOS LPV [20]. The continuity of the C3S SA CDR time series will be ensured using Sentinel-3 OLCI and SLSTR data, and the algorithm and design of the processing chain are currently being developed. C3S is also developing multi-sensor albedo products combining NOAA/AVHRR, SPOT/VGT and PROBA-V input data. The long-term CDRs, provided by the Copernicus Climate Change Service from 1981 to the present (with the aim of extending to the future), are an added extra compared with the existing EO programs, providing the longest and state-of-the-art albedo products.

Author Contributions

J.S.-Z. and F.C. conceived and conceptualized the work. J.S.-Z., F.C. and R.L. defined the methodology. J.S.-Z. and E.M.-S. developed the validation software for generating the results. J.S.-Z. wrote the first version of the manuscript. All authors contributed to the analysis, writing, review and editing of the manuscript. The C3S_Lot5 consortium is structured as follows: validation team (J.S.-Z., F.C. and E.M.-S.), algorithm development (D.C. and F.P.), project management (I.B.), and technical officer (J.M.-S.). All authors have read and agreed to published the manuscript.

Funding

This work was funded by the European Centre for Medium-Range Weather Forecasts in the framework of the Copernicus Climate Change Service (Official reference number service contract: 2018/C3S_312b_Lot5_VITO/SC1), led by VITO as the prime contractor. Previously, the development of the algorithm and the methodology were defined in the framework of the Copernicus Global Land Service (European Commission/Joint Research Center under Framework Service Contract N°199494).

Acknowledgments

This study has been undertaken using data from GBOV “Ground Based Observation for Validation” (https://land.copernicus.eu/global/gbov) founded by the European Commission Joint Research Centre FWC932059 as part of the Global Component of the European Union’s Copernicus Land Monitoring Service.

Conflicts of Interest

The authors declare no conflict of interest.

Abbreviations

The following abbreviations are used in this manuscript:
AL-DHDirectional-Hemispherical ALbedos
AL-BHBi-Hemispherical Albedos
ATBDAlgorithm Theoretical Basis Document
AVHRRAdvanced Very High Resolution Radiometer
BBtotal shortwave
BRDFBidirectional Reflectance Distribution Function
BSABlack-Sky Albedo
BSRNBaseline Surface Radiation Network
CDRClimate Data Records
CDSClimate Data Store of C3S
CEOSCommittee on Earth Observing Satellites
CGLSCopernicus Global Land Service
C3SCopernicus Climate Change Service
C6Collection 6 of MODIS products
ECVEssential Climate Variables
EOEarth Observation
EQCEvaluation and Quality Control
EUMETSATEuropean Organization for the Exploitation of Meteorological Satellites
FLUXNETFLUXes NETwork (network of regional networks)
GBOVGround-Based Observations for Validation
CGOSGlobal Climate Observing System
GLASSGlobal Land Surface Satellite
GSDGround Sampling Distance
JCGMJoint Committee for Guides in Metrology
KPIKey Performance Indicator
LANDVALLAND VALidation network
LSA SAFSatellite Application Facility for Land Surface Analysis
LPVLand Product Validation sub-group
MARMajor Axis Regression
MCD43TERRA+AQUA MODIS BRDF/Albedo/NBAR Product
MetOpPolar-orbiting Meteorological satellites
MIRMid InfraRed
MODISMODerate resolution Imaging Spectroradiometer
MSGMeteosat Second Generation
NNumber of samples
NASANational Aeronautics and Space Agency
NEONNational Ecological Observatory Network
NIR (or NI)Near-Infrared
NOAANational Oceanic and Atmospheric Administration
OLCIOcean and Land Colour Instrument
OLSOrdinary Least Squares
LPLand Products
PROBA-VProject for Onboard Autonomy satellite, the V standing for vegetation
PUGSProduct User Guide and Specification document
QFLAGQuality FLAG
RCorrelation coefficient
RMReference Measurements
RMSDRoot Mean Square Deviation
RTLSRRoss Thick kernel and Li Sparse-Reciprocal kernels
SASurface Albedo
SEVIRISpinning Enhanced Visible and Infrared Imager
SLSTRSea and Land Surface Temperature Radiometer
SPOTSatellites for the Observation of the Earth
SURFRADSurface Radiation budget
SWIRShort-Wave InfraRed
TOATop-Of-Atmosphere
TOCTop-Of-Canopy
VGTVeGeTation sensor
VIVisible domain
VNIRVisible and Near-InfRared
WGCVWorking Group on Calibration and Validation
WMOWorld Meteorological Organization
WSAWhite-Sky Albedo

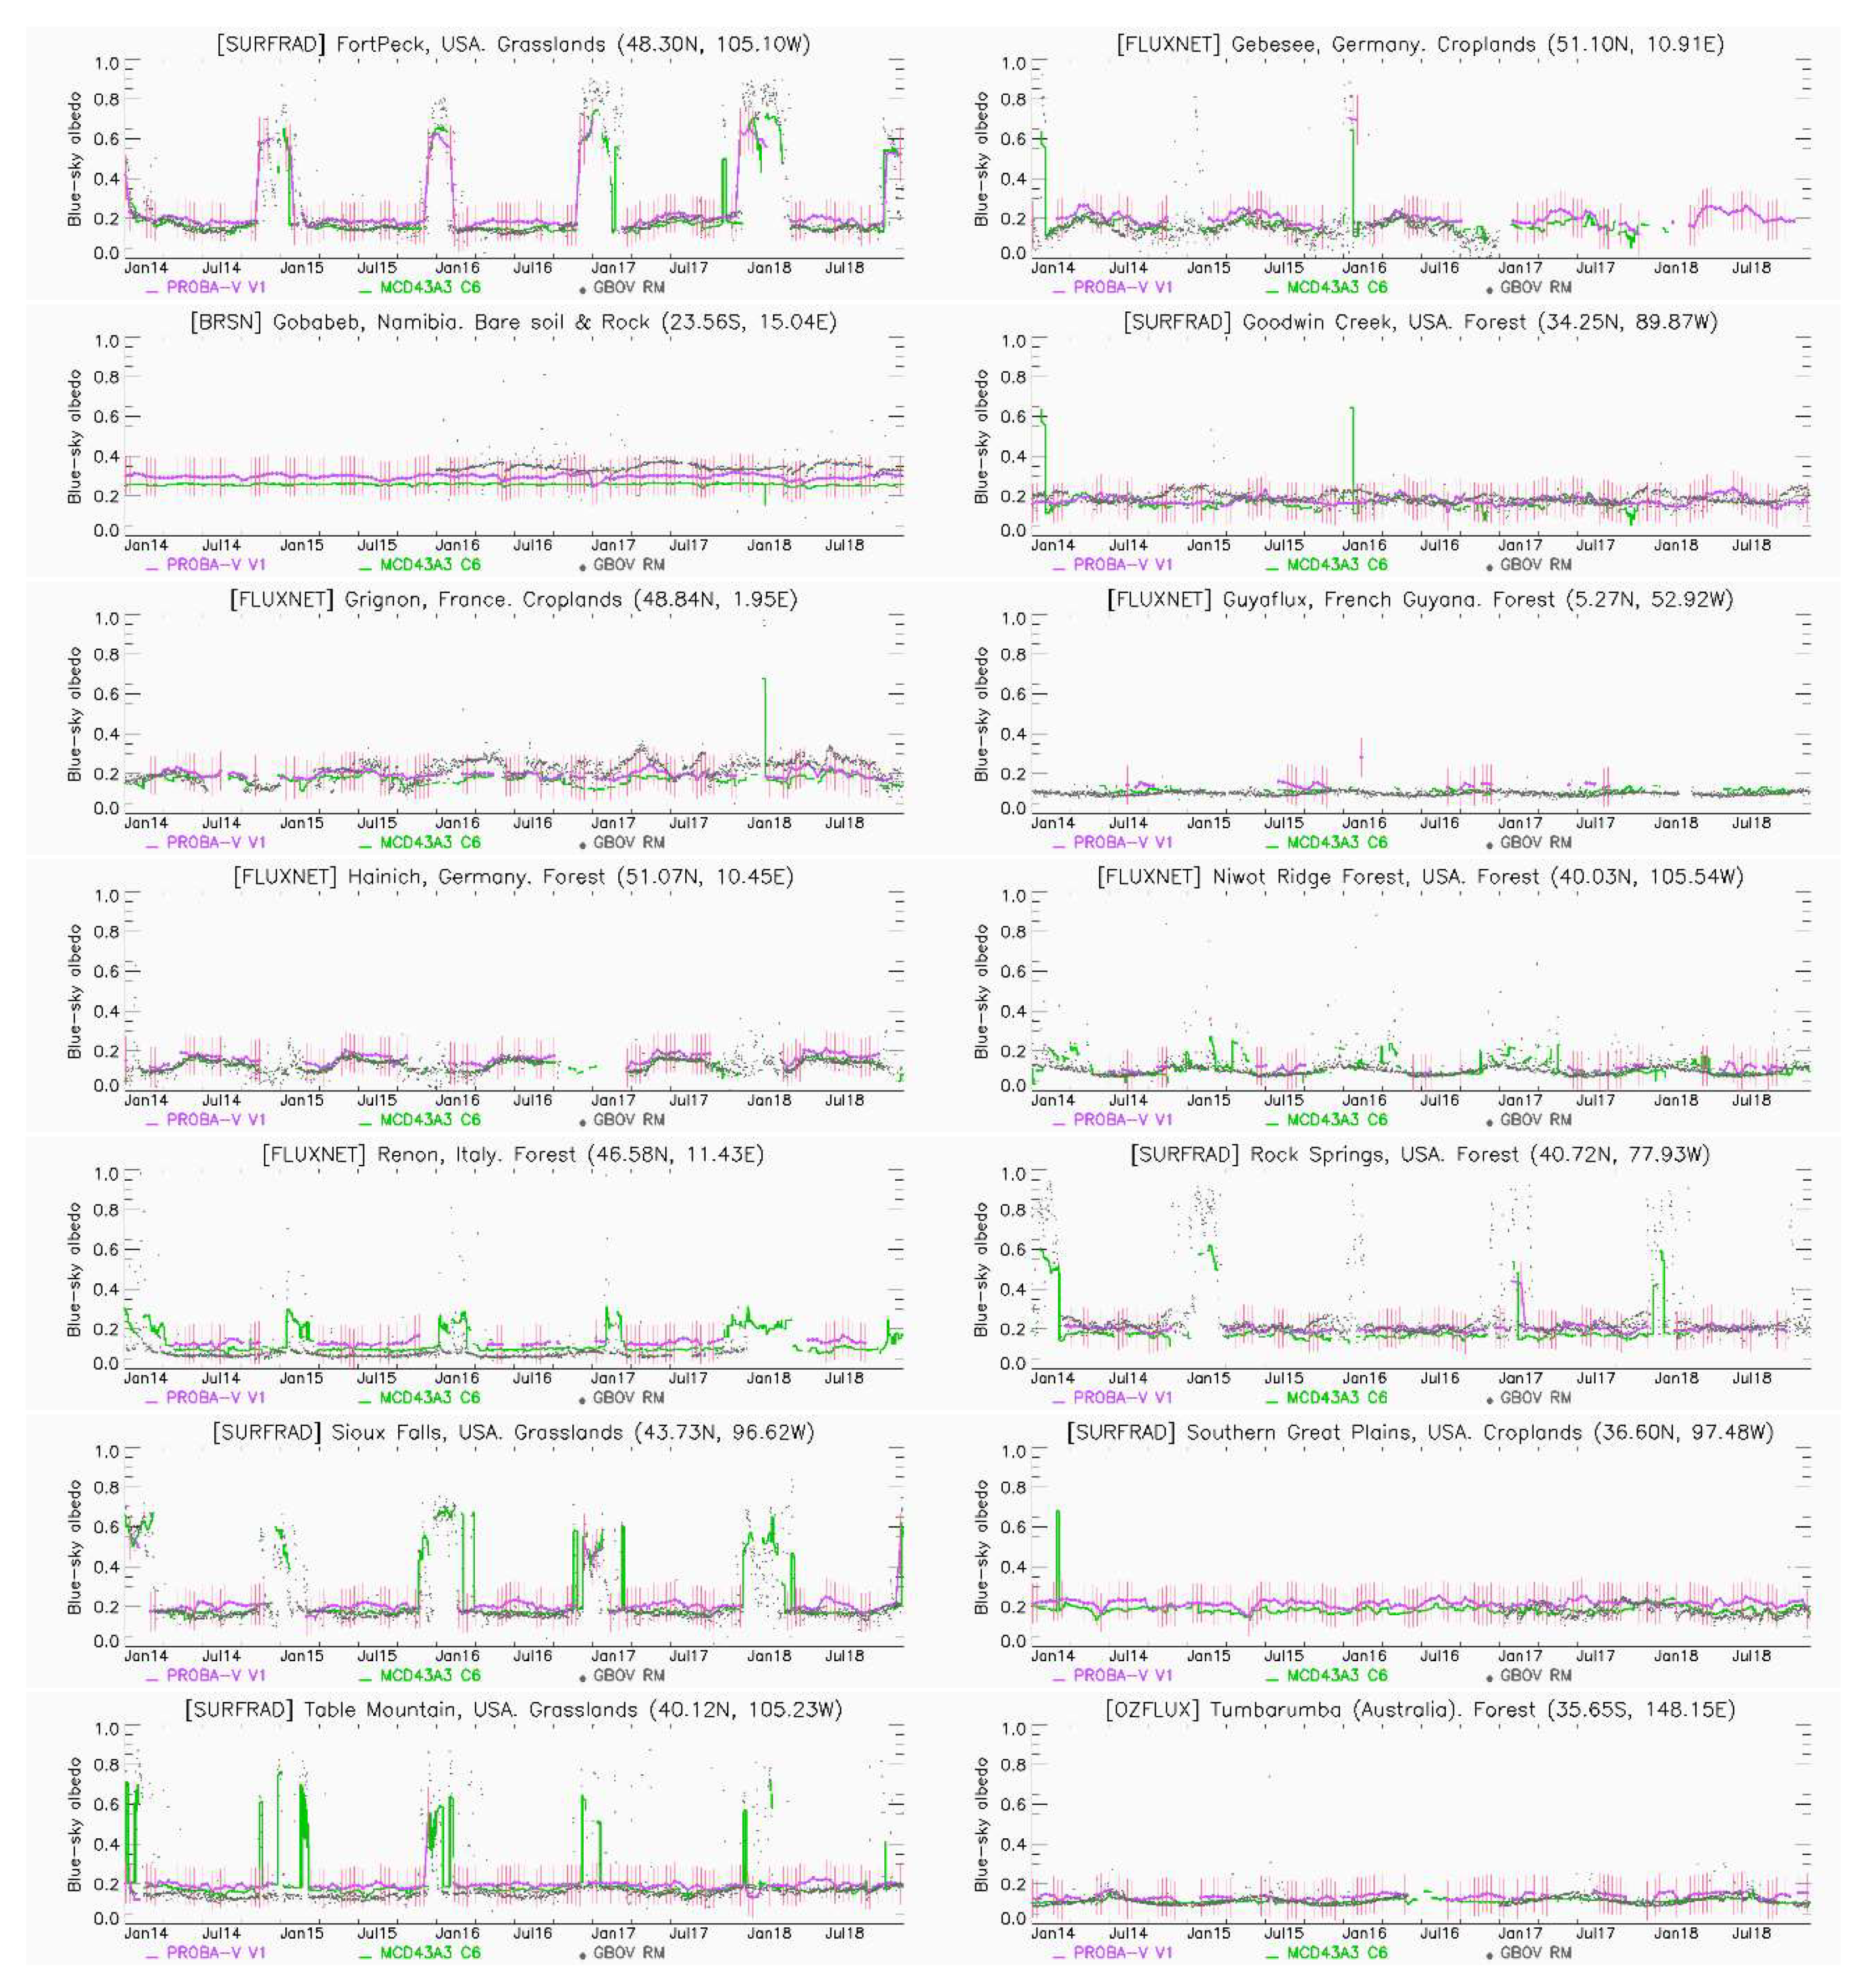
Appendix A. Ground-Based Direct Validation per Biome Type

  • C3S PROBA-V SA v1.0
Figure A1. Direct validation per biome type (a) Forest, (b) Crops, (c) grass/shrublands, and (d) desert) of the C3S PROBA-V SA v1.0 blue-sky albedo best quality pixels versus the ground measurements (RMs) at 20 GBOV stations during the 2014–2018 period. The continuous black lines correspond to the 1:1 lines and the dashed lines correspond to the optimal (GCOS uncertainty requirement), target (C3S KPI) and predefined threshold levels. The red lines correspond to the Major Axis Regression (MAR).
Remotesensing 12 02596 g0a1
  • MCD43A3 C6
Figure A2. Direct validation per biome type (a) Forest, (b) Crops, (c) grass/shrublands, and (d) desert) of the MCD43A3 C6 blue-sky albedo best quality pixels versus the ground measurements (RMs) at 20 GBOV stations during the 2014–2018 period. The continuous black lines correspond to the 1:1 lines and the dashed lines correspond to the optimal (GCOS uncertainty requirement), target (C3S KPI) and predefined threshold levels. The red lines correspond to the Major Axis Regression (MAR).
Remotesensing 12 02596 g0a2

Appendix B. Temporal Realism of Blue-Sky Albedos over Gbov Sites

Figure A3. Time series of the blue-sky C3S PROBA-V SA v1.0 and MCD43A3 C6 satellite albedos and GBOV RMs for the selected sites during the 2014–2018 period. In the case of PROBA-V, the filled dots correspond to ‘good quality’ pixels, and the unfilled dots correspond to pixels flagged as ‘low-quality’ according to the QFLAGs (Table 3).
Remotesensing 12 02596 g0a3aRemotesensing 12 02596 g0a3b

References

  1. Implementation Plan for the Global Observing System for Climate in Support of the United Nations Framework Convention on Climate Change (UNFCCC). GCOS-No 92. 2004. Available online: https://library.wmo.int/index.php?lvl=notice_display&id=6678#.Xowv2-oza5t (accessed on 7 April 2020).
  2. Copernicus Climate Change Service (C3S). Available online: https://climate.copernicus.eu/ (accessed on 7 April 2020).
  3. Wolters, E.; Dierckx, W.; Iordache, M.-D.; Swinnen, E. PROBA-V Products User Manual Document v3.01. Available online: http://proba-v.vgt.vito.be/sites/proba-v.vgt.vito.be/files/products_user_manual.pdf (accessed on 7 April 2020).
  4. Trigo, I.F.; Dacamara, C.C.; Viterbo, P.; Roujean, J.-L.; Olesen, F.; Barroso, C.; Camacho-de-Coca, F.; Carrer, D.; Freitas, S.C.; García-Haro, J.; et al. The Satellite Application Facility for Land Surface Analysis. Int. J. Remote Sens. 2011, 32, 2725–2744. [Google Scholar] [CrossRef]
  5. Land Surface Analysis (LSA-SAF) of EUMETSAT. Available online: https://landsaf.ipma.pt/en/ (accessed on 8 April 2020).
  6. Geiger, B.; Carrer, D.; Franchistéguy, L.; Roujean, J.L.; Meurey, C. Land surface albedo derived on a daily basis from meteosat second generation observations. IEEE Trans. Geosci. Remote Sens. 2008, 46, 3841–3856. [Google Scholar] [CrossRef]
  7. Carrer, D.; Roujean, J.L.; Meurey, C. Comparing operational MSG/SEVIRI Land Surface albedo products from Land SAF with ground measurements and MODIS. IEEE Trans. Geosci. Remote Sens. 2010, 48, 1714–1728. [Google Scholar] [CrossRef]
  8. Carrer, D.; Roujean, J.-L.; Hautecoeur, O.; Elias, T. Daily estimates of aerosol optical thickness over land surface based on a directional and temporal analysis of SEVIRI MSG visible observations. J. Geophys. Res. 2010, 115, D10208. [Google Scholar] [CrossRef] [Green Version]
  9. Carrer, D.; Moparthy, S.; Lellouch, G.; Ceamanos, X.; Pinault, F.; Freitas, S.C.; Trigo, I.F. Land surface albedo derived on a ten daily basis from Meteosat Second Generation Observations: The NRT and climate data record collections from the EUMETSAT LSA SAF. Remote Sens. 2018, 10, 1262. [Google Scholar] [CrossRef] [Green Version]
  10. Copernicus Global Land Service (CGLS) Portal. Available online: https://land.copernicus.eu/global/index.html (accessed on 8 April 2020).
  11. Climate Data Store of Copernicus Climate Change Service. Available online: https://cds.climate.copernicus.eu/#!/home (accessed on 10 May 2020).
  12. Nightingale, J.; Mittaz, J.P.D.; Douglas, S.; Dee, D.; Ryder, J.; Taylor, M.; Old, C.; Dieval, C.; Fouron, C.; Duveau, G.; et al. Ten Priority Science Gaps in Assessing Climate Data Record Quality. Remote Sens. 2019, 11, 986. [Google Scholar] [CrossRef] [Green Version]
  13. Justice, C.; Belward, A.; Morisette, J.; Lewis, P.; Privette, J.; Baret, F. Developments in the’validation’of satellite sensor products for the study of the land surface. Int. J. Remote Sens. 2000, 21, 3383–3390. [Google Scholar] [CrossRef]
  14. Zeng, Y.; Su, Z.; Calvet, J.C.; Manninen, T.; Swinnen, E.; Schulz, J.; Roebeling, R.; Poli, P.; Tan, D.; Riihelä, A.; et al. Analysis of current validation practices in Europe for space-based climate data records of essential climate variables. Int. J. Appl. Earth Obs. Geoinf. 2015, 42, 150–161. [Google Scholar] [CrossRef]
  15. Liang, S.; Fang, H.; Chen, M.; Shuey, C.J.; Walthall, C.; Daughtry, C.; Morisette, J.; Schaaf, C.; Strahler, A. Validating MODIS land surface reflectance and albedo products: Methods and preliminary results. Remote Sens. Environ. 2002, 83, 149–162. [Google Scholar] [CrossRef]
  16. Cescatti, A.; Marcolla, B.; Santhana Vannan, S.K.; Pan, J.Y.; Román, M.O.; Yang, X.; Ciais, P.; Cook, R.B.; Law, B.E.; Matteucci, G.; et al. Intercomparison of MODIS albedo retrievals and in situ measurements across the global FLUXNET network. Remote Sens. Environ. 2012, 121, 323–334. [Google Scholar] [CrossRef] [Green Version]
  17. Liu, Q.; Wang, L.; Qu, Y.; Liu, N.; Liu, S.; Tang, H.; Liang, S. Preliminary evaluation of the long-term GLASS albedo product. Int. J. Digit. Earth 2013, 6, 69–95. [Google Scholar] [CrossRef]
  18. Liu, Y.; Wang, Z.; Sun, Q.; Erb, A.M.; Li, Z.; Schaaf, C.B.; Zhang, X.; Román, M.O.; Scott, R.L.; Zhang, Q.; et al. Evaluation of the VIIRS BRDF, Albedo and NBAR products suite and an assessment of continuity with the long term MODIS record. Remote Sens. Environ. 2017, 201, 256–274. [Google Scholar] [CrossRef]
  19. Shuai, Y.; Schaaf, C.B.; Strahler, A.H.; Liu, J.; Jiao, Z. Quality assessment of BRDF/albedo retrievals in MODIS operational system. Geophys. Res. Lett. 2008, 35, 1–5. [Google Scholar] [CrossRef]
  20. LPV (Land Product Validation). Subgroup CEOS Validation Hierarchy 2019. Available online: https://lpvs.gsfc.nasa.gov/ (accessed on 12 April 2020).
  21. Wang, Z.; Schaaf, C.; Lattanzio, A.; Carrer, D.; Grant, I.; Roman, M.; Camacho, F.; Yang, Y.; Sánchez-Zapero, J. Global Surface Albedo Product Validation Best Practices Protocol. Version 1.0. In Best Practice for Satellite Derived Land Product Validation (p. 45): Land Product Validation Subgroup (WGCV/CEOS); Wang, Z., Nickeson, J., Román, M., Eds.; Available online: https://lpvs.gsfc.nasa.gov/PDF/CEOS_ALBEDO_Protocol_20190307_v1.pdf (accessed on 1 April 2020). [CrossRef]
  22. Taberner, M.; Pinty, B.; Govaerts, Y.; Liang, S.; Verstraete, M.M.; Gobron, N.; Widlowski, J.L. Comparison of MISR and MODIS land surface albedos: Methodology. J. Geophys. Res. Atmos. 2010, 115, 1–13. [Google Scholar] [CrossRef] [Green Version]
  23. Qu, Y.; Liu, Q.; Liang, S.; Wang, L.; Liu, N.; Liu, S. Direct-estimation algorithm for mapping daily land-surface broadband albedo from modis data. IEEE Trans. Geosci. Remote Sens. 2014, 52, 907–919. [Google Scholar] [CrossRef]
  24. Sütterlin, M.; Schaaf, C.B.; Stöckli, R.; Sun, Q.; Hüsler, F.; Neuhaus, C.; Wunderle, S. Albedo and reflectance anisotropy retrieval from AVHRR operated onboard NOAA and MetOp satellites: Algorithm performance and accuracy assessment for Europe. Remote Sens. Environ. 2015, 168, 163–176. [Google Scholar] [CrossRef]
  25. Fell, F.; Bennartz, R.; Loew, A. Validation of the EUMETSAT Geostationary Surface Albedo Climate Data Record -2- (ALBEDOVAL-2). Available online: https://www.eumetsat.int/website/home/Data/TechnicalDocuments/index.html (accessed on 12 April 2020).
  26. Camacho, F.; Sánchez-Zapero, J. Quality Assessment Report SPOT/VGT Suface Albedo V1 (I1.10). Gio Global Land Component - Lot I ”Operation of the Global Land Component” Framework Service Contract N° 388533 (JRC). Available online: https://land.copernicus.eu/global/sites/cgls.vito.be/files/products/GIOGL1_VR_SAV1_I1.10.pdf (accessed on 25 March 2020).
  27. Sánchez-Zapero, J.; de la Madrid, L.; Camacho, F. Validation Report of Surface Albedo (SA) from PROBA-V Collection 1km Version 1.5 (I2.21). Copernicus Global Land Operations CGLOPS-1 (Framework Service Contract N° 199494 - JRC). Available online: https://land.copernicus.eu/global/sites/cgls.vito.be/files/products/CGLOPS1_VR_SA1km-PROBAV-V1.5_I2.21.pdf (accessed on 9 April 2020).
  28. Sánchez-Zapero, J.; de la Madrid, L.; Camacho, F. Quality Assessment Report Normalized TOC-r from PROBA-V Collection 1 km Version 1.5 (I2.21). Copernicus Global Land Operations “Vegetation and Energy” ”CGLOPS-1” Framework Service Contract N° 199494 (JRC). Available online: https://land.copernicus.eu/global/sites/cgls.vito.be/files/products/CGLOPS1_QAR_TOCR1km-PROBAV-V1.5_I2.21.pdf (accessed on 11 August 2020).
  29. Mayr, S.; Kuenzer, C.; Gessner, U.; Klein, I.; Rutzinger, M. Validation of Earth Observation Time-Series: A Review for Large-Area and Temporally Dense Land Surface Products. Remote Sens. 2019, 11, 2616. [Google Scholar] [CrossRef] [Green Version]
  30. Lewis, P.; Barnsley, M. Influence of the sky radiance distribution on various formulations of the earth surface albedo. In Proceedings of the 6th International Symposium on Physical Measurements and Signatures in Remote Sensing (ISPRS), Val d’Isere, France, 17–21 January 1994; pp. 707–715. [Google Scholar]
  31. Román, M.O.; Schaaf, C.B.; Woodcock, C.E.; Strahler, A.H.; Yang, X.; Braswell, R.H.; Curtis, P.S.; Davis, K.J.; Dragoni, D.; Goulden, M.L.; et al. The MODIS (Collection V005) BRDF/albedo product: Assessment of spatial representativeness over forested landscapes. Remote Sens. Environ. 2009, 113, 2476–2498. [Google Scholar] [CrossRef] [Green Version]
  32. Román, M.O.; Schaaf, C.B.; Lewis, P.; Gao, F.; Anderson, G.P.; Privette, J.L.; Strahler, A.H.; Woodcock, C.E.; Barnsley, M. Assessing the coupling between surface albedo derived from MODIS and the fraction of diffuse skylight over spatially-characterized landscapes. Remote Sens. Environ. 2010, 114, 738–760. [Google Scholar] [CrossRef]
  33. Wang, Z.; Schaaf, C.B.; Chopping, M.J.; Strahler, A.H.; Wang, J.; Román, M.O.; Rocha, A.V.; Woodcock, C.E.; Shuai, Y. Evaluation of Moderate-resolution Imaging Spectroradiometer (MODIS) snow albedo product (MCD43A) over tundra. Remote Sens. Environ. 2012, 117, 264–280. [Google Scholar] [CrossRef]
  34. Wang, Z.; Schaaf, C.B.; Strahler, A.H.; Chopping, M.J.; Román, M.O.; Shuai, Y.; Woodcock, C.E.; Hollinger, D.Y.; Fitzjarrald, D.R. Evaluation of MODIS albedo product (MCD43A) over grassland, agriculture and forest surface types during dormant and snow-covered periods. Remote Sens. Environ. 2014, 140, 60–77. [Google Scholar] [CrossRef] [Green Version]
  35. Carrer, D.; Ceamanos, X.; Pinault, F.; Benhadj, I.; Toté, C. Algorithm Theoretical Basis Document (ATBD) of PROBA-V CDR and ICDR Surface Albedo v1.0 (Official Reference Number Service Contract: 2018/C3S_312b_Lot5_VITO/SC1). Available online: https://cds.climate.copernicus.eu/cdsapp#!/dataset/satellite-albedo?tab=doc (accessed on 9 April 2020).
  36. Carrer, D.; Pinault, F.; Ramon, D.; Benhadj, I.; Swinnen, E. Algorithm Theoretical Basis Document (ATBD) of CDR SPOT/VGT Surface Albedo v1.0 (Official Reference Number Service Contract: 2018/C3S_312b_Lot5_VITO/SC1). Available online: https://cds.climate.copernicus.eu/cdsapp#!/dataset/satellite-albedo?tab=doc (accessed on 9 April 2020).
  37. Schaaf, C.B.; Gao, F.; Strahler, A.H.; Lucht, W.; Li, X.; Tsang, T.; Strugnell, N.C.; Zhang, X.; Jin, Y.; Muller, J.P.; et al. First operational BRDF, albedo nadir reflectance products from MODIS. Remote Sens. Environ. 2002, 83, 135–148. [Google Scholar] [CrossRef] [Green Version]
  38. Francois, M.; Santandrea, S.; Mellab, K.; Vrancken, D.; Versluys, J. The PROBA-V mission: The space segment. Int. J. Remote Sens. 2014, 35, 2548–2564. [Google Scholar] [CrossRef]
  39. Dierckx, W.; Sterckx, S.; Benhadj, I.; Livens, S.; Duhoux, G.; Van Achteren, T.; Francois, M.; Mellab, K.; Saint, G. PROBA-V mission for global vegetation monitoring: Standard products and image quality. Int. J. Remote Sens. 2014, 35, 2589–2614. [Google Scholar] [CrossRef]
  40. PROBA-V Products Data Access. Available online: http://proba-v.vgt.vito.be/en/product-types (accessed on 8 April 2020).
  41. Carrer, D.; Benhadj, I. Product User Guide and Specification (PUGS) of PROBA-V CDR and ICDR Surface Albedo v1.0 (Official Reference Number Service Contract: 2018/C3S_312b_Lot5_VITO/SC1). Available online: https://cds.climate.copernicus.eu/cdsapp#!/dataset/satellite-albedo?tab=doc (accessed on 9 April 2020).
  42. Roujean, J.-L.; Leroy, M.; Deschamps, P.-Y. A bidirectional reflectance model of the Earth’s surface for the correction of remote sensing data. J. Geophys. Res. 1992, 97, 20455–20468. [Google Scholar] [CrossRef]
  43. Carrer, D.; Smets, B.; Ceamanos, X.; Roujean, J.-L. SPOT/VEGETATION and PROBA-V Surface Albedo Products—1 Km Version 1; Algorithm Theoretical Basis Document (ATBD), Issue 2.11. Copernicus Global Land Operations CGLOPS-1 (Framework Service Contract N° 199494-JRC). Available online: https://land.copernicus.eu/global/sites/cgls.vito.be/files/products/CGLOPS1_ATBD_SA1km-V1_I2.11.pdf (accessed on 10 May 2020).
  44. Toté, C.; Swinnen, E.; Sterckx, S.; Clarijs, D.; Quang, C.; Maes, R. Evaluation of the SPOT/VEGETATION Collection 3 reprocessed dataset: Surface reflectances and NDVI. Remote Sens. Environ. 2017, 201, 219–233. [Google Scholar] [CrossRef]
  45. Lucht, W.; Schaaf, C.B.; Strahler, A.H. An algorithm for the retrieval of albedo from space using semiempirical BRDF models. IEEE Trans. Geosci. Remote Sens. 2000, 38, 977–998. [Google Scholar] [CrossRef] [Green Version]
  46. Sanchez-Zapero, J. Product Quality Assessment Report (PQAR) of CDR SPOT/VGT-Based Surface Albedo v1.0 (Official Reference Number Service Contract: 2018/C3S_312b_Lot5_VITO/SC1). Available online: https://cds.climate.copernicus.eu/cdsapp#!/dataset/satellite-albedo?tab=doc (accessed on 9 April 2020).
  47. Schaaf, C.; Wang, Z. MCD43A3 MODIS/Terra+Aqua BRDF/Albedo Daily L3 Global-500m V006 [Data set]. NASA EOSDIS Land Processes DAAC. 2015. Available online: https://doi.org/10.5067/MODIS/MCD43A3.006 (accessed on 10 April 2020).
  48. Lucht, W.; Lewis, P. Theoretical noise sensitivity of BRDF and albedo retrieval from the EOS-MODIS and MISR sensors with respect to angular sampling. Int. J. Remote Sens. 2000, 21, 81–98. [Google Scholar] [CrossRef]
  49. Sun, Q.; Wang, Z.; Li, Z.; Erb, A.; Schaaf, C.B. Evaluation of the global MODIS 30 arc-second spatially and temporally complete snow-free land surface albedo and reflectance anisotropy dataset. Int. J. Appl. Earth Obs. Geoinf. 2017, 58, 36–49. [Google Scholar] [CrossRef]
  50. Liang, S.; Strahler, A.H.; Walthall, C. Retrieval of Land Surface Albedo from Satellite Observations: A Simulation Study. J. Appl. Meteorol. 1999, 38, 712–725. [Google Scholar] [CrossRef]
  51. Wang, Z.; Schaaf, C.B.; Sun, Q.; Shuai, Y.; Román, M.O. Capturing rapid land surface dynamics with Collection V006 MODIS BRDF/NBAR/Albedo (MCD43) products. Remote Sens. Environ. 2018, 207, 50–64. [Google Scholar] [CrossRef]
  52. Roujean, J.L.; Leon-Tavares, J.; Smets, B.; Claes, P.; Camacho De Coca, F.; Sanchez-Zapero, J. Surface albedo and toc-r 300 m products from PROBA-V instrument in the framework of Copernicus Global Land Service. Remote Sens. Environ. 2018, 215, 57–73. [Google Scholar] [CrossRef]
  53. Ground-Based Observations for Validation (GBOV) of Copernicus Global Land Products Site. Available online: https://land.copernicus.eu/global/gbov (accessed on 1 April 2020).
  54. Song, R.; Muller, J.-P.; Kharbouche, S.; Woodgate, W. Intercomparison of Surface Albedo Retrievals from MISR, MODIS, CGLS Using Tower and Upscaled Tower Measurements. Remote Sens. 2019, 11, 644. [Google Scholar] [CrossRef] [Green Version]
  55. Kharbouche, S.; Song, R.; Muller, J.-P. Algorithm Theoretical Basis Document of Energy products: RM1 (short wave radiation), LP1 (Top Of Canopy Reflectance), LP2 (Albedo). Ground-Based Observations for Validation (GBOV) of CGLS Products (Framework Contract reference: 932059-JRC). Available online: https://gbov.acri.fr/public/docs/products/2019-11/GBOV-ATBD-RM1-LP1-LP2_v1.3-Energy.pdf (accessed on 10 April 2020).
  56. Song, R.; Muller, J.P.; Kharbouche, S.; Yin, F.; Woodgate, W.; Kitchen, M.; Roland, M.; Arriga, N.; Meyer, W.; Koerber, G.; et al. Validation of space-based albedo products from upscaled tower-based measurements over heterogeneous and homogeneous landscapes. Remote Sens. 2020, 12, 833. [Google Scholar] [CrossRef] [Green Version]
  57. Reda, I. Method to calculate uncertainties in measuring shortwave solar irradiance using thermopile and semiconductor solar radiometers, Tech. Rep. NREL/TP-3B10-52194, 20 pp., Natl. Renewable Energy Lab., Golden, Colo. 2011. Available online: http://www.osti.gov/servlets/purl/1021250/ (accessed on 5 August 2020). [CrossRef] [Green Version]
  58. Hohn, M.E. An Introduction to Applied Geostatistics: By Edward H. Isaaks and R. Mohan Srivastava, 1989, Oxford University Press, New York, 561 p., ISBN 0-19-505012-6, ISBN 0-19-505013-4. Comput. Geosci. 1991, 17, 471–473. [Google Scholar] [CrossRef]
  59. Carroll, S.S.; Cressie, N. A COMPARISON OF GEOSTATISTICAL METHODOLOGIES USED TO ESTIMATE SNOW WATER EQUIVALENT. J. Am. Water Resour. Assoc. 1996, 32, 267–278. [Google Scholar] [CrossRef]
  60. Matheron, G. Principles of geostatistics. Econ. Geol. 1963, 58, 1246–1266. [Google Scholar] [CrossRef]
  61. Woodcock, C.E.; Strahler, A.H.; Jupp, D.L.B. The use of variograms in remote sensing: I. Scene models and simulated images. Remote Sens. Environ. 1988, 25, 323–348. [Google Scholar] [CrossRef]
  62. Woodcock, C.E.; Strahler, A.H.; Jupp, D.L.B. The use of variograms in remote sensing: II. Real digital images. Remote Sens. Environ. 1988, 25, 349–379. [Google Scholar] [CrossRef]
  63. Wang, Z.; Schaaf, C.B.; Sun, Q.; Kim, J.H.; Erb, A.M.; Gao, F.; Román, M.O.; Yang, Y.; Petroy, S.; Taylor, J.R.; et al. Monitoring land surface albedo and vegetation dynamics using high spatial and temporal resolution synthetic time series from Landsat and the MODIS BRDF/NBAR/albedo product. Int. J. Appl. Earth Obs. Geoinf. 2017, 59, 104–117. [Google Scholar] [CrossRef]
  64. Systematic Observation Requirements for Satellite-Based Data Products for Climate. Supplemental Details to the Satellite-Based Component of the “Implementation Plan for the GCOS in Support of the UNFCCC”. [GCOS-154, 2011 Update]. Available online: https://library.wmo.int/doc_num.php?explnum_id=3710 (accessed on 10 April 2020).
  65. World Meteorological Organization (WMO) Requirements for Earth Surface Albedo. Available online: https://www.wmo-sat.info/oscar/variables/view/54 (accessed on 10 April 2020).
  66. Sánchez-Zapero, J.; Camacho, F. Product Quality Assessment Report (PQAR) of CDR and ICDR Surface Albedo v1.0 Based on PROBA-V (Official Reference Number Service Contract: 2018/C3S_312b_Lot5_VITO/SC1). Available online: https://cds.climate.copernicus.eu/cdsapp#!/dataset/satellite-albedo?tab=doc (accessed on 9 April 2020).
  67. Fuster, B.; Sánchez-Zapero, J.; Camacho, F.; García-Santos, V.; Verger, A.; Lacaze, R.; Weiss, M.; Baret, F.; Smets, B. Quality Assessment of PROBA-V LAI, fAPAR and fCOVER Collection 300 m Products of Copernicus Global Land Service. Remote Sens. 2020, 12, 1017. [Google Scholar] [CrossRef] [Green Version]
  68. Joint Committee for Guides in Metrology (JCGM)-Guides to the Expression of Uncertainty in Measurement (GUM). [ISO/IEC Guide 98-Part 3, 2008]. Available online: https://www.iso.org/sites/JCGM/GUM-introduction.htm (accessed on 10 April 2020).
  69. Weiss, M.; Baret, F.; Garrigues, S.; Lacaze, R. LAI and fAPAR CYCLOPES global products derived from VEGETATION. Part 2: Validation and comparison with MODIS collection 4 products. Remote Sens. Environ. 2007, 110, 317–331. [Google Scholar] [CrossRef]
  70. Sánchez, J.; Camacho, F.; Lacaze, R.; Smets, B. Early validation of PROBA-V GEOV1 LAI, FAPAR and FCOVER products for the continuity of the copernicus global land service. Int. Arch. Photogramm. Remote Sens. Spat. Inf. Sci.-ISPRS Arch. 2015, 40, 93–100. [Google Scholar] [CrossRef] [Green Version]
  71. Harper, W.V. Reduced Major Axis regression: Teaching alternatives to Least Squares. In Proceedings of the 9th International Conference on Teaching Statistics (ICOTS-9), Flagstaff, AZ, USA, 13–18 July 2014; pp. 1–4. Available online: https://digitalcommons.otterbein.edu/math_fac/24 (accessed on 11 August 2020).
  72. Iannone, R.Q.; Niro, F.; Goryl, P.; Dransfeld, S.; Hoersch, B.; Stelzer, K.; Kirches, G.; Paperin, M.; Brockmann, C.; Gomez-Chova, L.; et al. Proba-V cloud detection Round Robin: Validation results and recommendations. In Proceedings of the 2017 9th International Workshop on the Analysis of Multitemporal Remote Sensing Images, MultiTemp 2017, Brugge, Belgium, 27–29 June 2017; pp. 1–8. Available online: https://ieeexplore.ieee.org/document/8035219 (accessed on 11 August 2020). [CrossRef]
  73. Maignan, F.; Bréon, F.M.; Lacaze, R. Bidirectional reflectance of Earth targets: Evaluation of analytical models using a large set of spaceborne measurements with emphasis on the Hot Spot. Remote Sens. Environ. 2004, 90, 210–220. [Google Scholar] [CrossRef]
  74. Liu, S.; Liu, Q.; Liu, Q.; Wen, J.; Li, X. The Angular and Spectral Kernel Model for BRDF and Albedo Retrieval. IEEE J. Sel. Top. Appl. Earth Obs. Remote Sens. 2010, 3, 241–256. [Google Scholar] [CrossRef]
  75. Chen, J.M.; Cihlar, J. A hotspot function in a simple bidirectional reflectance model for satellite applications. J. Geophys. Res. Atmos. 1997, 102, 25907–25913. [Google Scholar] [CrossRef]
  76. Wu, A.; Li, Z.; Cihlar, J. Effects of land cover type and greenness on advanced very high resolution radiometer bidirectional reflectances: Analysis and removal. J. Geophys. Res. 1995, 100, 9179–9192. [Google Scholar] [CrossRef] [Green Version]
  77. Jin, Y.; Schaaf, C.B.; Woodcock, C.E.; Gao, F.; Li, X.; Strahler, A.H.; Lucht, W.; Liang, S. Consistency of MODIS surface bidirectional reflectance distribution function and albedo retrievals: 1. Validation. J. Geophys. Res. D Atmos. 2003, 108, 1–15. [Google Scholar] [CrossRef] [Green Version]
  78. Sanchez-Zapero, J. Scientific Quality Evaluation (SQE) of PROBA-V Surface Albedo (SA) Collection 1 km Version 1.5 (I2.00). Copernicus Global Land Operations CGLOPS-1 (Framework Service Contract N° 199494-JRC). Available online: https://land.copernicus.eu/global/sites/cgls.vito.be/files/products/CGLOPS1_SQE2017_SA1km-V1_I1.00.pdf (accessed on 9 April 2020).
  79. Salomon, J.G.; Schaaf, C.B.; Strahler, A.H.; Gao, F.; Jin, Y. Validation of the MODIS Bidirectional Reflectance Distribution Function and albedo retrievals using combined observations from the Aqua and Terra platforms. IEEE Trans. Geosci. Remote Sens. 2006, 44, 1555–1564. [Google Scholar] [CrossRef]
Figure 1. Global distribution of PROBA-V SA v1.0 black-sky albedo values in the total shortwave (AL-DH-BB) on 23 September 2014.
Remotesensing 12 02596 g001
Figure 2. Sentinel-2 surface reflectance (Band 8A) images (3 km × 3 km) at a spatial resolution of 10 m centered over a selection of 4 GBOV sites (a) GER_HAI, (b) AUS_TMB, (c) ITA_REN, (d) USA_PSU). STscore and RAWscore, indicators of the spatial representativeness, are displayed in the plots.
Remotesensing 12 02596 g002
Figure 3. Uncertainty levels as a function of SA values.
Remotesensing 12 02596 g003
Figure 4. Global distribution of the 725 LANDVAL (including 20 desert calibration sites) and 20 GBOV sites.
Remotesensing 12 02596 g004
Figure 5. Percentage of gaps (%) during the year 2014 for the C3S PROBA-V SA v1.0 product considering all land pixels.
Remotesensing 12 02596 g005
Figure 6. Temporal variations of missing values for the year 2014 (a), and distribution of the temporal length of the missing values from December 2013 to May 2014 (b). Computation over LANDVAL sites for C3S PROBA-V SA v1.0 (purple), SPOT/VGT SA v1.0 (blue) and MCD43A3 C6 (green).
Remotesensing 12 02596 g006
Figure 7. SA time series of the C3S PROBA-V SA v1.0, C3S SPOT/VGT SA v1.0 and MCD43A3 C6 broadband black-sky albedos for selected LANDVAL sites (a) Evergreen Broadleaf Forest, (b) Broadleaved Deciduous Forest, (c) Needle-leaf Forest, (d) cultivate, (e) shrublands/herbaceous/sparse vegetation, and (f) bare areas during the 2013–2014 period. Information on the sites is shown at the top of the corresponding figures. In the case of PROBA-V, filled dots correspond to ‘good quality’ pixels, and unfilled dots correspond to pixels flagged as ‘low-quality’ according to QFLAG (Table 3).
Remotesensing 12 02596 g007aRemotesensing 12 02596 g007b
Figure 8. Top: C3S PROBA-V SA v1.0 versus C3S SPOT/VGT SA v1.0 products’ scatter-plots, where the dashed lines correspond to the optimal, target and predefined threshold uncertainty levels around the 1:1 relation (continuous line). Bottom: Box-plots of the bias per bin albedo range, where red bars indicate the median values, blue boxes stretch from the 25th percentile to the 75th percentile of the data and whiskers include 99.3% of the coverage data (±2.7 σ). Outliers are not displayed. The green, blue and orange lines correspond to optimal, target and threshold uncertainty levels, respectively. Computation over all LANDVAL sites for the December 2013–May 2014 period over good quality pixels according to the quality flags (Table 3) for AL-DH-VI (a,d), AL-DH-NII (b,e), and AL-DH-BB (c,f).
Remotesensing 12 02596 g008
Figure 9. Top: C3S PROBA-V SA v1.0 versus MCD43A3 C6 products scatter-plots, where the dashed lines correspond to the optimal, target and predefined threshold uncertainty levels around the 1:1 relation (continuous line). Bottom: Box-plots of the bias per bin albedo range, where red bars indicate the median values, blue boxes stretch from the 25th percentile to the 75th percentile of the data and whiskers include 99.3% of the coverage data (±2.7 σ). Outliers are not displayed. The green, blue and orange lines correspond to the optimal, target and threshold uncertainty levels, respectively. Computation over all LANDVAL sites during the year 2014 over good quality pixels according to the quality flags for AL-DH-VI (a,d), ALI-NI (b,e), and AL-DH-BB (c,f).
Remotesensing 12 02596 g009
Figure 10. Histograms of the δ function (smoothness) for black-sky C3S PROBA-V SA v1.0, C3S SPOT/VGT SA v1.0 and MCD43A3 C6 for visible (a), NIR (b) and total shortwave (c). Computation over LANDVAL sites during the overlap period (December 2013–May 2014 period). The median δ values are presented for each product.
Remotesensing 12 02596 g010
Figure 11. Direct validation of the best quality pixels of the C3S PROBA-V SA v1.0 (a) and MODIS MCD43A3 C6 (b) blue-sky albedo satellite products versus the ground measurements (RMs) at 20 GBOV stations during the 2014–2018 period. The continuous black lines correspond to the 1:1 lines and the dashed lines correspond to the optimal (GCOS uncertainty requirement), target (C3S KPI) and predefined threshold levels. The red lines correspond to the Major Axis Regression (MAR).
Remotesensing 12 02596 g011
Table 1. Characteristics of the global remote sensing SA products under study. GSD stands for Ground Sampling Distance.
ProductSatellite
/Sensor
BRDF Model:
Volumetric
/Geometrical Kernels
Frequency
/Composite Period
GSD
/Projection
Reference
C3S
PROBA-V
SA v1.0
PROBA
/VEGETATION
Ross_Thick
/Roujean
10 days
/30 days
1 km
/Plate Carrée
[35]
C3S SPOT/VGT
SA v1.0
SPOT
/VEGETATION
Ross_Thick
/Li_Sparse_Reciprocal
10 days
/20 days
1 km
/Plate Carrée
[36]
NASA
MCD43A3 C6
TERRA+AQUA
/MODIS
Ross_Thick
/Li_Sparse_Reciprocal
Daily
/16 days
500 m
/Sinusoidal
[37]
Table 2. Spectral characteristics of PROBA-V, and its equivalent channels in the VGT-2 and MODIS sensors.
PROBA-VVGT-2MODIS
AcronymCenter
(nm)
Width
(nm)
AcronymCenter
(nm)
Width
(nm)
AcronymCenter
(nm)
Width
(nm)
BlueB046346B045837Band348920
RedB265579B265374Band164550
NIRB3845144B3838109Band2858.535
SWIRMIR160073MIR1635101Band6163924
Table 3. Quality flag (QFLAG) information used to filter pixels flagged as ‘low-quality’.
ProductQuality Control Used to Discard Pixels
C3S PROBA-V SA v1.0Sea (bit 1)
Input status out of range or invalid (bit 6)
B2 saturated (bit 10)
B0 saturated (bit 11)
C3S SPOT/VGT SA v1.0Sea and continental water (bits 0-1 of QFLAG)
Algorithm Failed (bit 6 of QFLAG)
ERR > 0.2
AGE > 20
MCD43A2 C6BRDF_Albedo_Band_Quality_Band1-7:
Magnitude inversion (number of observations lower than 7)
Table 4. Characteristics of the 20 GBOV sites providing data during the 2014–2018 period.
#Site IDNameCountryNetworkLand CoverLat
(deg)
Lon
(deg)
1USA_BNDBondvilleUSASURFRADCroplands40.052−88.373
2USA_BAOBoulderUSABSRNCroplands40.050−105.004
3BEL_BRABrasschaat BelgiumFLUXNETMixed Forest51.3094.521
4NET_CABCabauw NetherlandsBSRNGrasslands51.9714.927
5AUS_CLPCalperumAustraliaFLUXNETShrublands−34.003140.588
6USA_DRADesert RockUSASURFRADBare Soil36.624−116.019
7USA_FPKFort PeckUSASURFRADGrasslands48.308−105.102
8GER_GEBGebesee GermanyFLUXNETCroplands51.10010.914
9NAM_GOBGobabebNamibiaBRSNBare Soil−23.56115.042
10USA_GCMGoodwin CreekUSASURFRADDecidous Broadleaf 34.255−89.873
11FRA_GRIGrignonFranceFLUXNETCroplands48.8441.952
12FRA_GUYGuyafluxFrench GuyanaFLUXNETEvergreen Broadleaf5.279−52.925
13GER_HAIHainich GermanyFLUXNETMixed Forest51.07010.450
14USA_NRFNiwot RidgeUSAFLUXNETEvergreen Needelleaf40.033−105.546
15ITA_RENRenonItalyFLUXNETEvergreen Needelleaf46.58711.434
16USA_PSURock SpringsUSASURFRADDecidous Broadleaf40.720−77.931
17USA_SFSSioux Falls USASURFRADCroplands43.730−96.620
18USA_SGPSouthern Great Plains USAFLUXNETCroplands36.606−97.489
19USA_TBLTable MountainUSASURFRADBare soil and Rocks40.125−105.237
20AUS_TMBTumbarumbaAustraliaFLUXNETEvergreen Broadleaf−35.657148.152
Table 5. Geospatial statistics of the 20 selected GBOV sites for the accuracy assessment.
#Site IDFootprint (m)Seasonal PeriodRCV (%)RSE (%)RST (%)RSV (%)STscoreRAWscore
1USA_BND126Leaf-off5.2442.63−5.1759.161.529.54
Leaf-on−4.5648.502.8437.101.5810.9
2USA_BAO3788Leaf-off175.370.00−3.30−15.641.540.29
Leaf-on19.430.002.77−44.654.492.57
3BEL_BRA505Leaf-off11.240.010.15−4.3719.024.45
Leaf-on12.740.06−0.39−14.6110.743.93
4NET_CAB213Leaf-off11.310.00−2.617.1314.254.42
Leaf-on32.620.000.7411.701.661.53
5AUS_CLP253Leaf-off−5.8331.924.15−4.622.728.58
Leaf-on−11.0729.702.53−3.132.834.52
6USA_DRA126Single season18.8823.56.083.91.672.65
7USA_FPK126Leaf-off7.0119.5−2.03−1.254.377.13
Leaf-on42.2723.53.3669.441.621.18
8GER_GEB76Leaf-off10.3581.49−1.7041.861.014.83
Leaf-on−24.4973.045.35−13.411.142.04
9NAM_GOB10Leaf-off11.6751.272.3740.411.444.29
Leaf-on26.4758.170.9247.891.201.89
10USA_GCM126Leaf-off−17.1775.32.9410.001.172.91
Leaf-on30.2175.2−5.0245.760.981.65
11FRA_GRI67Leaf-off5.3068.84−4.9929.891.229.44
Leaf-on10.6261.834.170.421.494.71
12FRA_GUY253Single season−0.727.852.47−1.9810.4569.33
13GER_HAI530Leaf-off7.660.005.9422.018.436.53
Leaf-on−6.370.001.947.4019.117.85
14USA_NRF322Leaf-off−19.957.43−12.98−10.774.552.51
Leaf-on6.716.61−7.073.288.137.45
15ITA_REN12Leaf-off59.7415.757.8084.411.510.84
Leaf-on21.4432.85−2.0010.262.272.33
16USA_PSU126Leaf-off66.2124.9412.7361.961.390.76
Leaf-on5.0622.863.16−14.453.299.89
17USA_SFS32Leaf-off7.3375.51.56−6.741.246.82
Leaf-on21.0849.57.29104.411.072.37
18USA_SGP152Leaf-off−14.7637.13−13.2123.661.843.39
Leaf-on10.0235.26−10.84104.301.304.99
19USA_TBL126Leaf-off26.6869.72−4.7879.700.941.87
Leaf-on−17.4664.916.59−2.341.362.86
20AUS_TMB884Single season18.410.000.067.2711.652.72
Table 6. GCOS, WMO and C3S SA uncertainty requirements.
GCOS WMOC3S KPI
Surface Albedo
requirements
Max (5%; 0.0025)Goal: 5%
Breakthrough: 10%
Threshold: 20%
Max (10%; 0.01)
Table 7. Predefined uncertainty requirement levels used for SA validation.
OptimalTargetThreshold
Surface Albedo
Uncertainty Requirements
Max [5%, 0.0025]Max [10%, 0.01]Max [20%, 0.02]
Table 8. Validation metrics for product validation.
QuantityValidation Metric
CompletenessGap size distribution (spatial and temporal)
Gap length
PrecisionMedian 3-point difference (intra-annual precision)
Median absolute deviation (inter-annual precision)
AccuracyMedian Error
Box-plots of the bias per albedo range
UncertaintyRoot mean square deviation (RMSD)
Scatter-plots of match-ups (MAR Linear models and correlation)
Table 9. Main performance statistics of C3S PROBA-V SA v1.0 versus SPOT/VGT SA v1.0 broadband albedo products over all LANDVAL sites during December 2103 to May 2014 period. The computation was performed over good quality pixels according to PROBA-V and SPOT/VGT QFLAGs.
PROBA-V SA v1.0 vs. SPOT/VGT SA v1.0 (Dec 2013–May 2014)
AL-DH-VIAL-DH-NIAL-DH-BBAL-BH-VIAL-DH-NIAL-BH-BB
Median_Err0.010.0140.010.0130.020.014
(Median_Err %)(8%)(5%)(4.7%)(10%)(6.3%)(5.9%)
Bias−0.0030.0070.002−0.0240.0070.002
(Bias %)(2.2%)(2.3%)(0.9%)(2.8%)(2.4%)(1.0%)
RMSD0.0440.0310.0320.0470.0370.036
(RMSD %)(35.3%)(10.5%)(14.5%)(36.1%)(11.7%)(15.2%)
Table 10. Main performance statistics of C3S PROBA-V SA v1.0 versus MCD43A3 C6 broadband albedo products over all LANDVAL sites during the year 2014. The computation was performed over good quality pixels according to PROBA-V and MCD43A2 QFLAGs.
PROBA-V SA v1.0 vs. MCD43A3 C6 (2014)
AL-DH-VIAL-DH-NIAL-DH-BBAL-BH-VIAL-BH-NIAL-BH-BB
Median_Err0.0110.0250.0270.0120.0290.031
(Median_Err %)(9.8%)(9%)(13.4%)(10.1%)(9.9%)(14.5%)
Bias0.0060.0240.0240.0060.0290.029
(Bias %)(5.3%)(8.4%)(11.9%)(5.1%)(9.6%)(13.3%)
RMSD0.0480.0390.0440.0480.0450.048
(RMSD %)(43.3%)(14%)(21.5%)(41.4%)(15.1%)(22.2%)
Table 11. Compliance matrix (percentage of pixels filing the predefined uncertainty levels) of C3S PROBA-V SA v1.0 versus SPOT/VGT SA v1.0 (December 2103 to May 2014 period) and MCD43A3 C6 (2014 year) broadband albedo products. Computation over LANDVAL sites for good quality pixels according to QFLAGs (Table 3).
PROBA-V SA v1.0 vs. SPOT/VGT SA v1.0 (Dec 2013–May 2014)
AL-DH-VIAL-DH-NIAL-DH-BBAL-BH-VIAL-BH-NIAL-BH-BB
% optimal (GCOS)28.948.650.223.939.941.8
% target (C3S KPI)62.976.878.551.368.569.9
% threshold83.192.688.172.890.282.6
PROBA-V SA v1.0 vs. MCD43A3 C6 (2014 year)
AL-DH-VIAL-DH-NIAL-DH-BBAL-BH-VIAL-BH-NIAL-BH-BB
% optimal (GCOS)20.424.56.520.922.96.7
% target (C3S KPI)55.550.424.852.746.423
% threshold83.578.750.780.577.449.8
Table 12. Intra-annual precision indicator (Median of the 3-point difference) of the C3S PROBA-V SA v1.0, C3S SPOT/VGT SA v1.0 and MCD43A3 C6 products. Computation over LANDVAL sites during the overlap period (December 2013–May 2014 period).
Median of 3-Point Difference (i.e., Median δ Values)
AL-DH-VIAL-DH-NIAL-DH-BBAL-BH-VIAL-BH-NIAL-BH-BB
PROBA-V SA v1.00.00260.00520.00350.00390.00740.0050
SPOT/VGT SA v1.00.00420.00470.00410.00570.00630.0055
MCD43A3 C60.00120.00220.00160.00180.00320.0023
Table 13. The median absolute deviation between two consecutive years of the PROBA-V SA v1.0, SPOT/VGT SA v1.0 and MCD43A3 C6 products. Computation over desert calibration sites.
Inter-Annual Precision (Median Absolute Deviation)
AL-DH-VIAL-DH-NIAL-DH-BBAL-BH-VIAL-BH-NIAL-BH-BB
PROBA-V
SA v1.0
0.004 (1.2%)0.006 (1.1%)0.004 (0.9%)0.004 (1.3%)0.008 (1.3%)0.006 (1.2%)
SPOT/VGT
SA v1.0
0.008 (2.6%)0.012 (2%)0.009 (2%)0.011 (3.7%)0.02 (3.3%)0.014 (3%)
MCD43A3 C60.003 (0.9%)0.005 (0.8%)0.004 (0.8%)0.003 (1.2%)0.006 (1.1%)0.005 (1.1%)
Table 14. Relevant statistics of the direct validation of the best quality pixels (Table 3) of the C3S PROBA-V SA v1.0 and MODIS MCD43A3 C6 blue-sky albedo satellite products versus the GBOV ground values coming from 20 GBOV stations during the 2014–2018 period.
PROBA-V SA v1.0MCD43A3 C6
Median Error (Median Error %)0.032 (18.2%)0.018 (11.2%)
Bias (Bias %)0.020 (11.5%)−0.010 (5.9%)
RMSD (RMSD %)0.04 (22.4%)0.04 (24.8%)
Table 15. Compliance matrix of the direct validation of the C3S PROBA-V SA v1.0 and MODIS MCD43A3 C6 blue-sky albedo satellite retrievals (best quality pixels, Table 3) versus ground values (N = 643) from 20 GBOV stations during the 2014–2018 period. N stands for the number of samples.
PROBA-V SA v1.0MCD43A3 C6
% optimal (GCOS)15.523.7
% target (C3S KPI)28.645.5
% threshold44.258.0
Table 16. Relevant statistics per main biome type and the compliance matrix of the direct validation of the C3S PROBA-V SA v1.0 blue-sky albedo satellite retrievals (best quality pixels, Table 3) versus the ground values (RMs) from 20 GBOV stations during the 2014–2018 period.
PROBA-V SA v1.0 vs. GBOV RM
ForestCropsGrass/ShrubsDesert
Number of Samples (stations)608 (8)488 (6)316 (3)303 (3)
Median Error (Median Error %)0.037 (27.0%)0.036 (18.3%)0.015 (7.8%)0.037 (16.7%)
Bias (Bias %)0.030 (22.4%)0.014 (7.4%)0.008 (4.2%)0.023 (10.4%)
RMSD (RMSD %)0.044 (32.6%)0.044 (22.4%)0.024 (12.2%)0.038 (17.2%)
% optimal (GCOS)6.112.438.915.5
% target (C3S KPI)13.825.859.530.4
% threshold22.938.775.363.4
Table 17. Relevant statistics per main biome type and the compliance matrix of the direct validation of the MCD43A3 C6 blue-sky albedo satellite retrievals (best quality pixels, Table 3) versus the ground values (RMs) from 20 GBOV stations during the 2014–2018 period. N stands for the number of samples.
MCD43A3 C6 vs. GBOV RM
ForestCropsGrass/ShrubsDesert
Number of Samples (stations)608 (8)488 (6)316 (3)303 (3)
Median Error (Median Error %)0.015 (12.1%)0.021 (11.3%)0.020 (11.5%)0.017 (8.4%)
Bias (Bias %)0.003 (2.8%)−0.012 (6.7%)−0.027 (15.3%)−0.013 (6.5%)
RMSD (RMSD %)0.031 (25.2%)0.051 (28.0%)0.042 (24.1%)0.036 (17.8%)
% optimal (GCOS)21.525.418.430.7
% target (C3S KPI)41.144.543.458.1
% threshold58.953.552.868.6

