Geophysical and Sedimentological Investigations Integrate Remote-Sensing Data to Depict Geometry of Fluvial Sedimentary Bodies: An Example from Holocene Point-Bar Deposits of the Venetian Plain (Italy)


 , ,
, ,  , and
, and
Abstract
1. Introduction
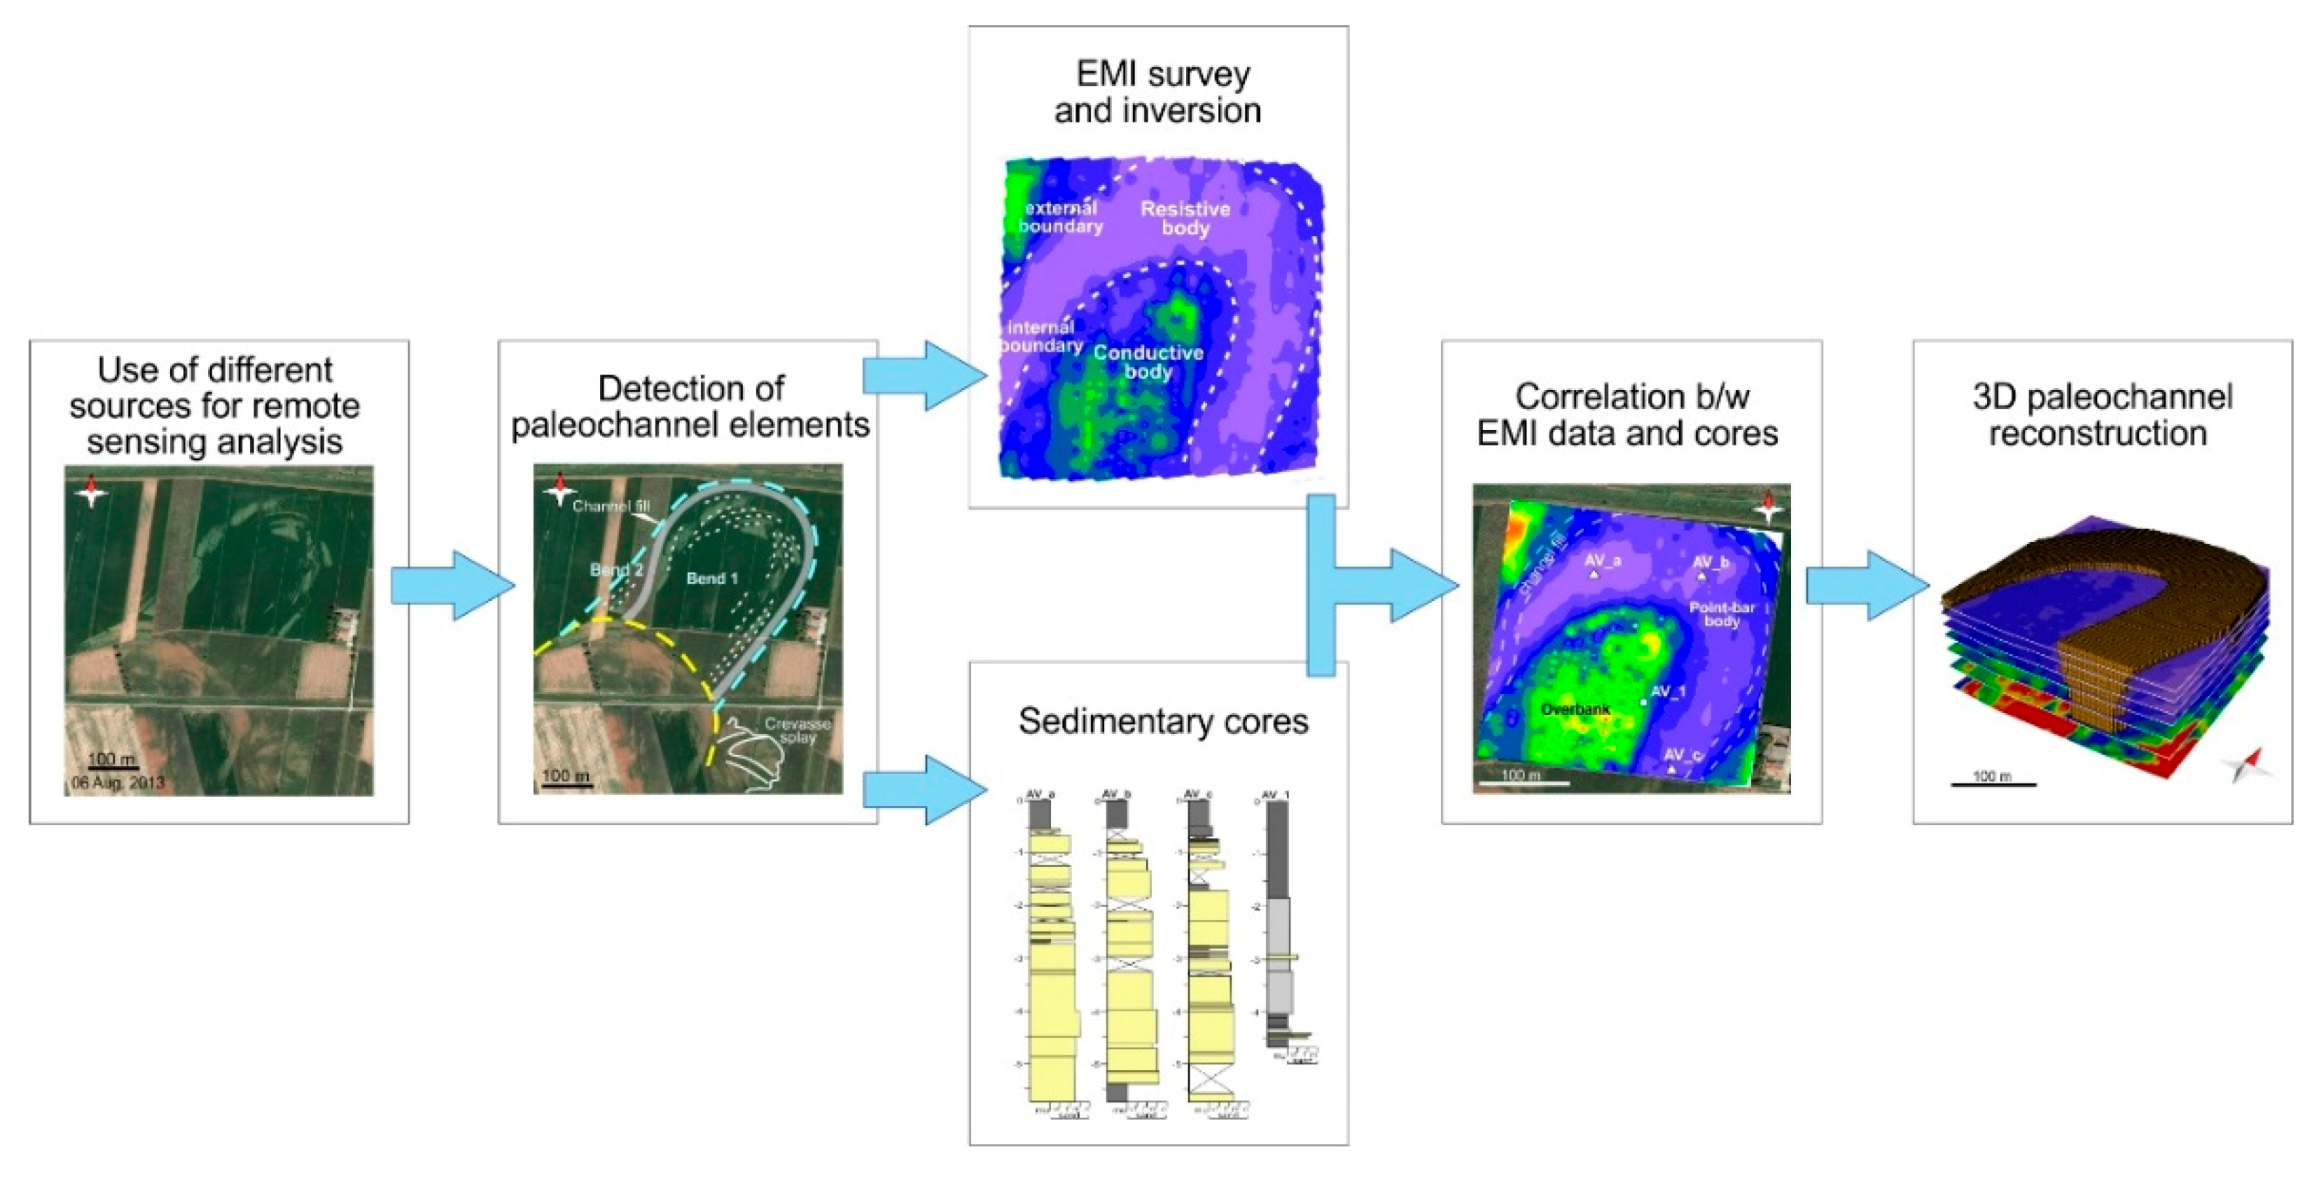
2. Materials and Methods
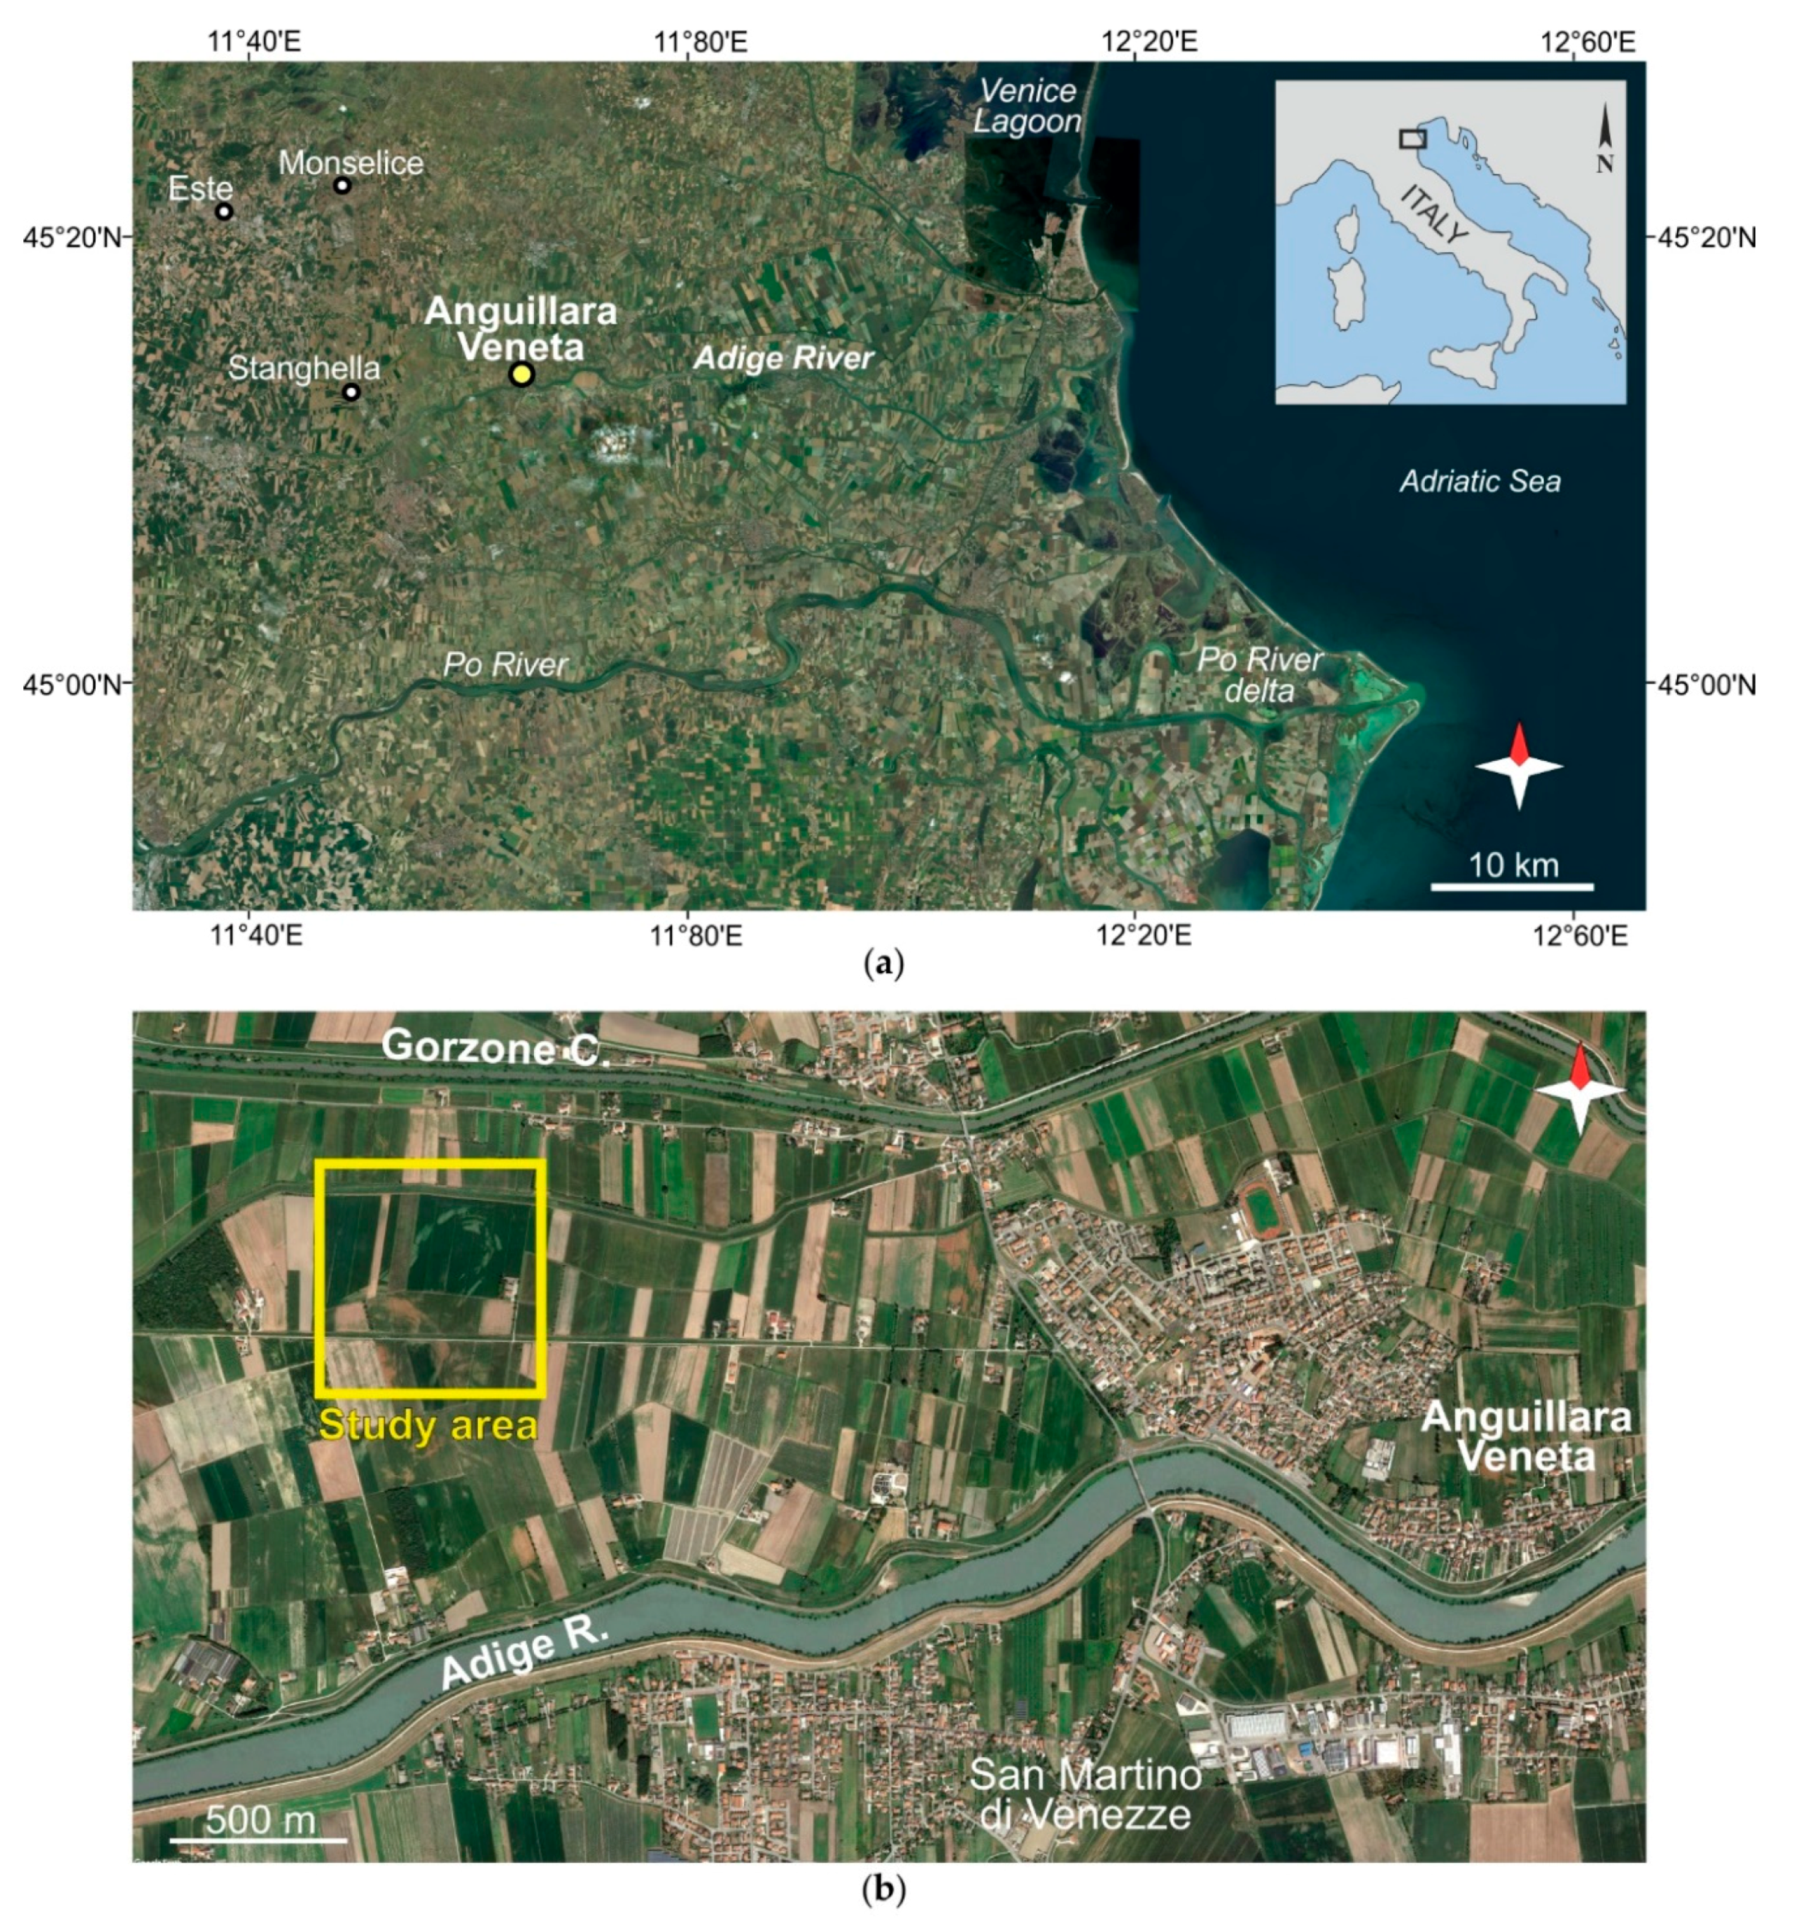
2.1. Geological Setting and Study Area
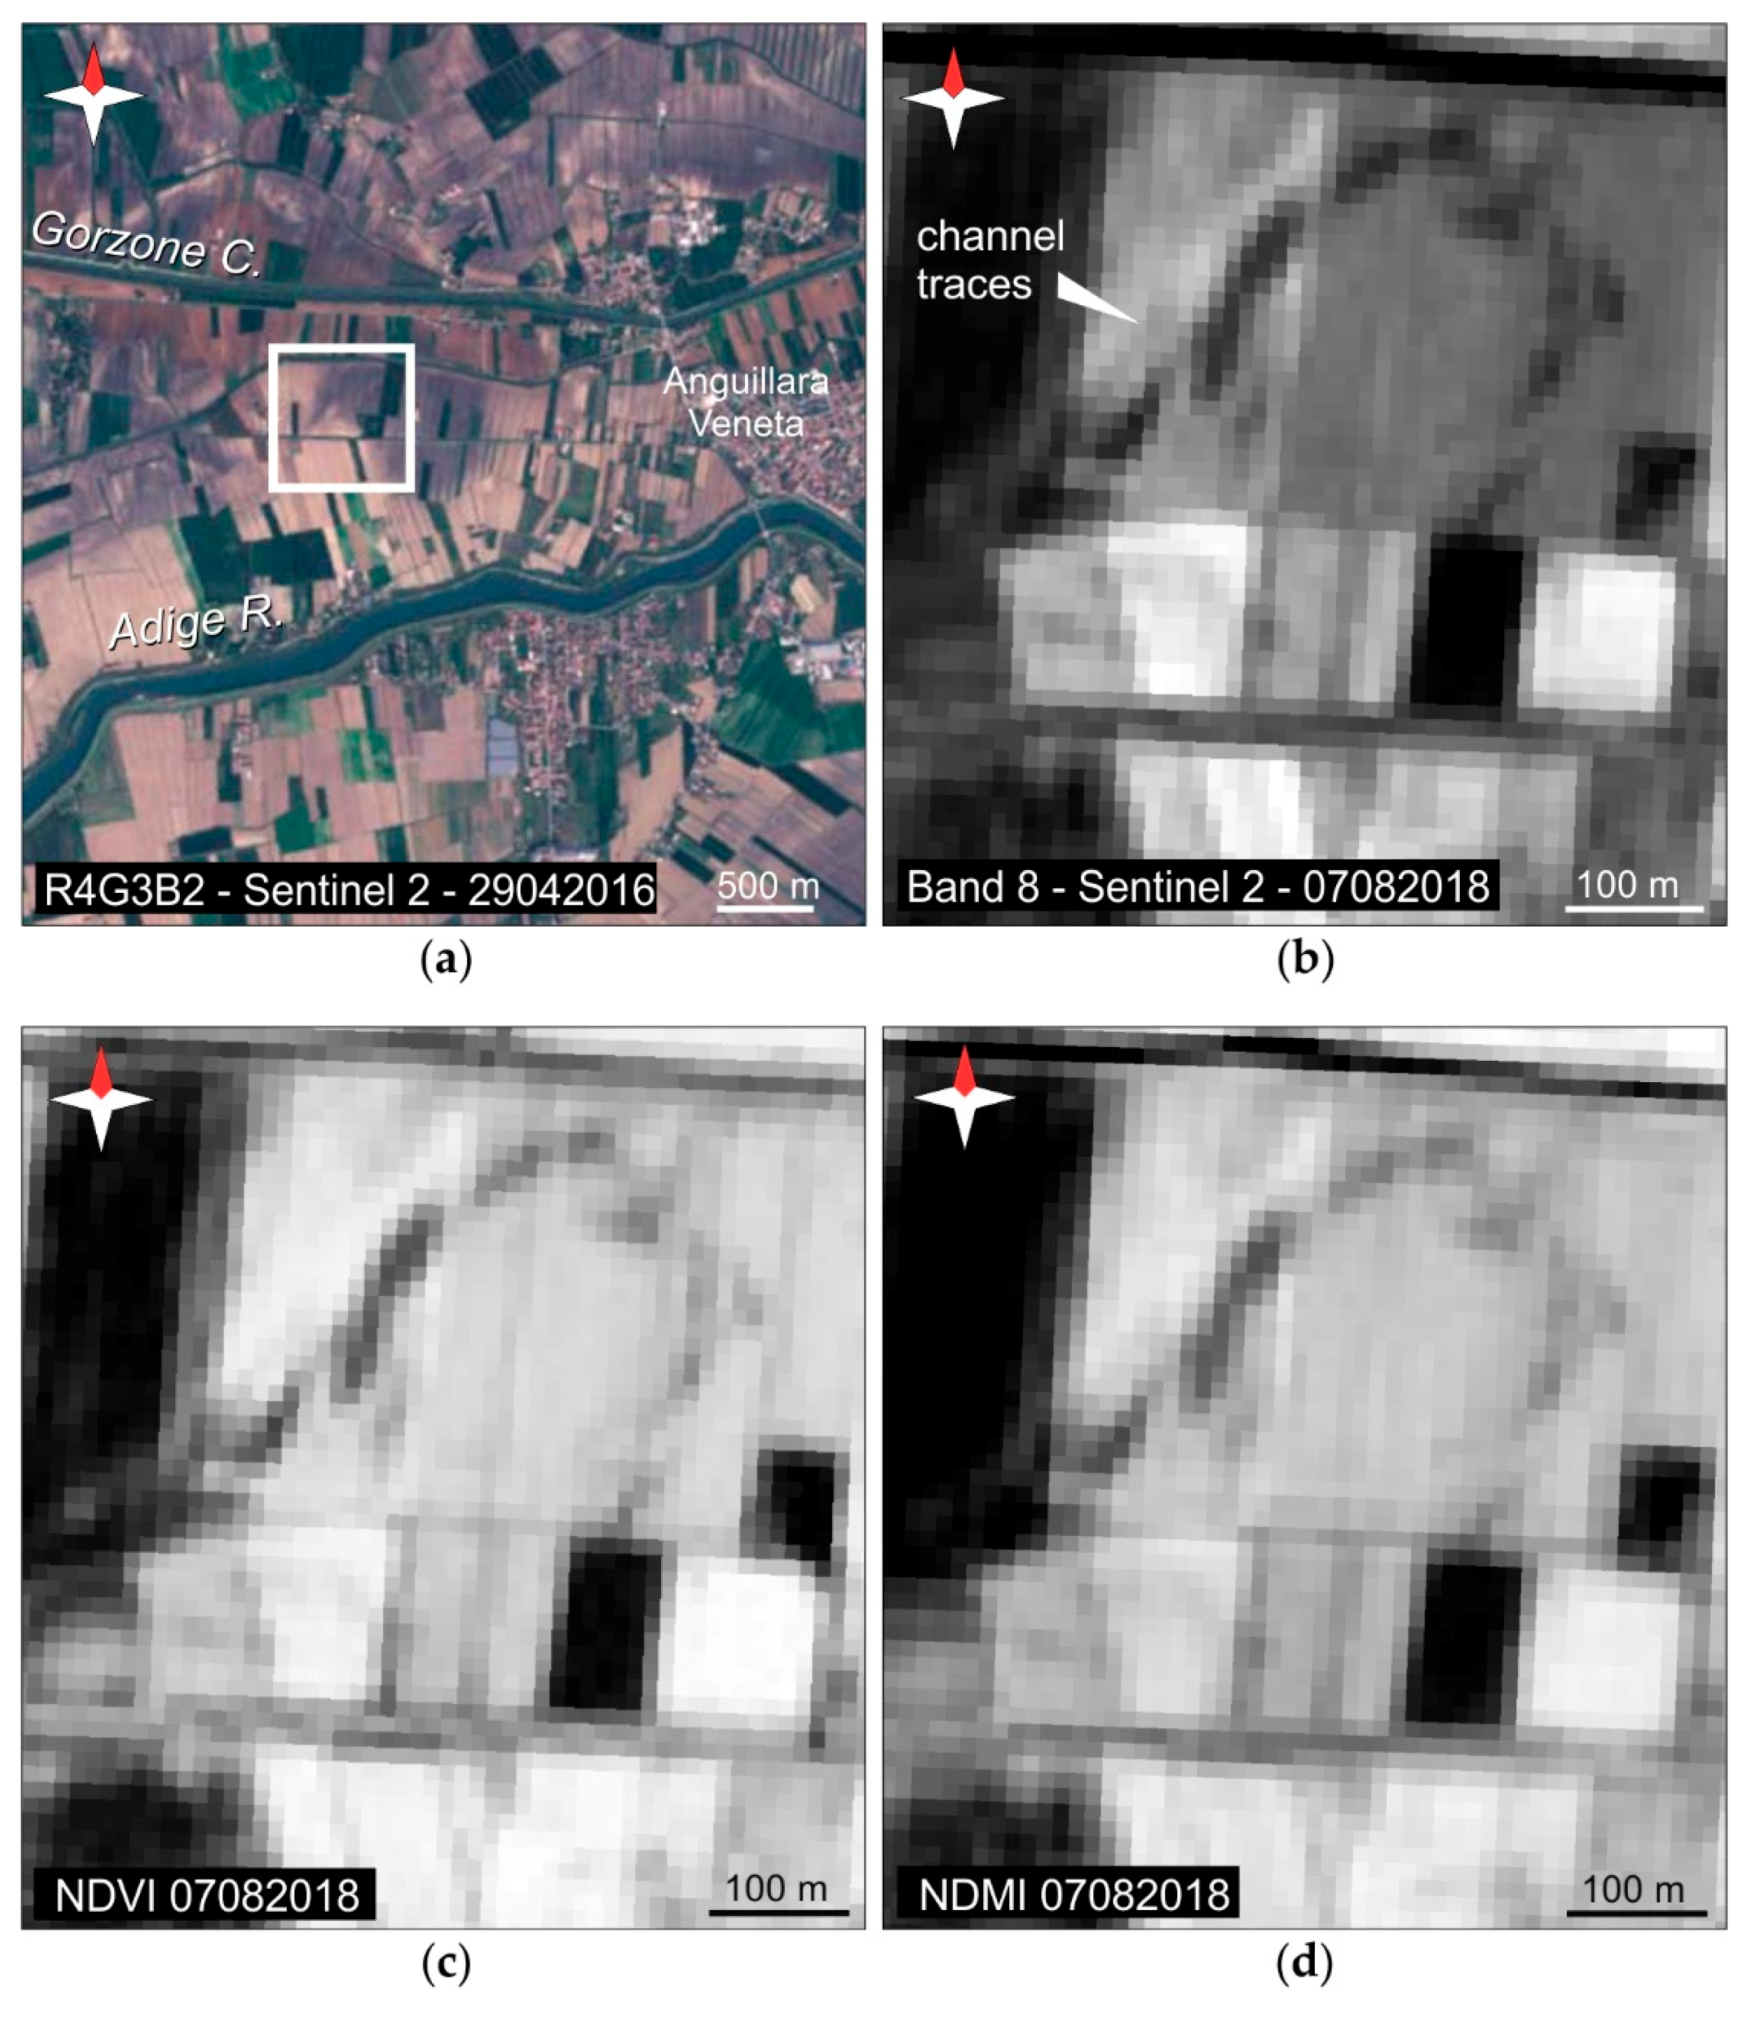
2.2. Remote Sensing
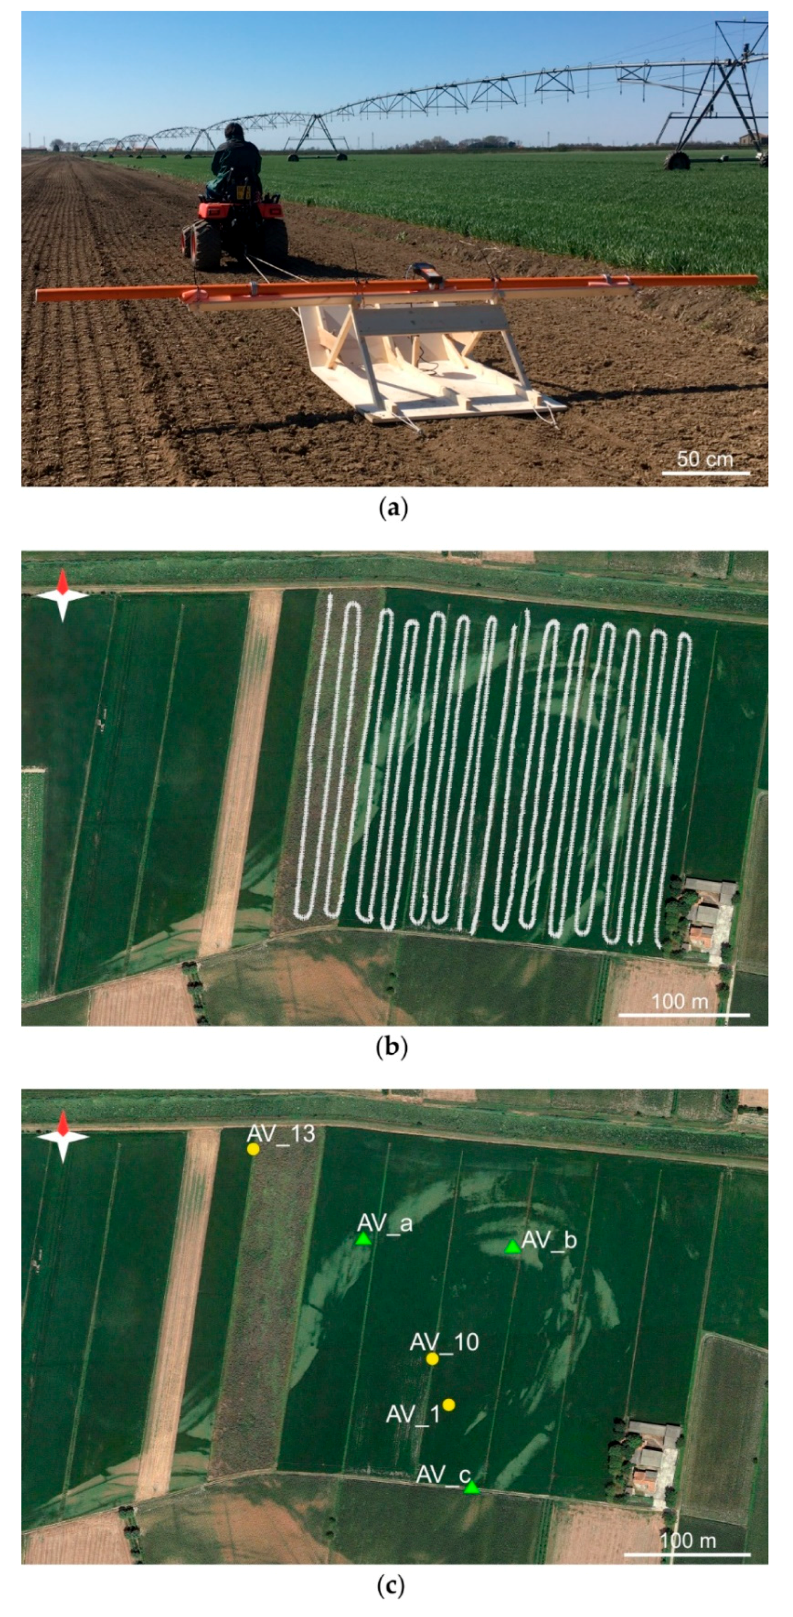
2.3. Geophysical Investigations
- (a)
- Reoccupation of the same location is warranted by the GPS within the required precision (note that the sonde is a few meters long);
- (b)
- The setting of the sonde is the same at all locations, with no changes of either the height above ground or the setting of the sonde that is maintained largely horizontal.
2.4. Sedimentary Cores
3. Results
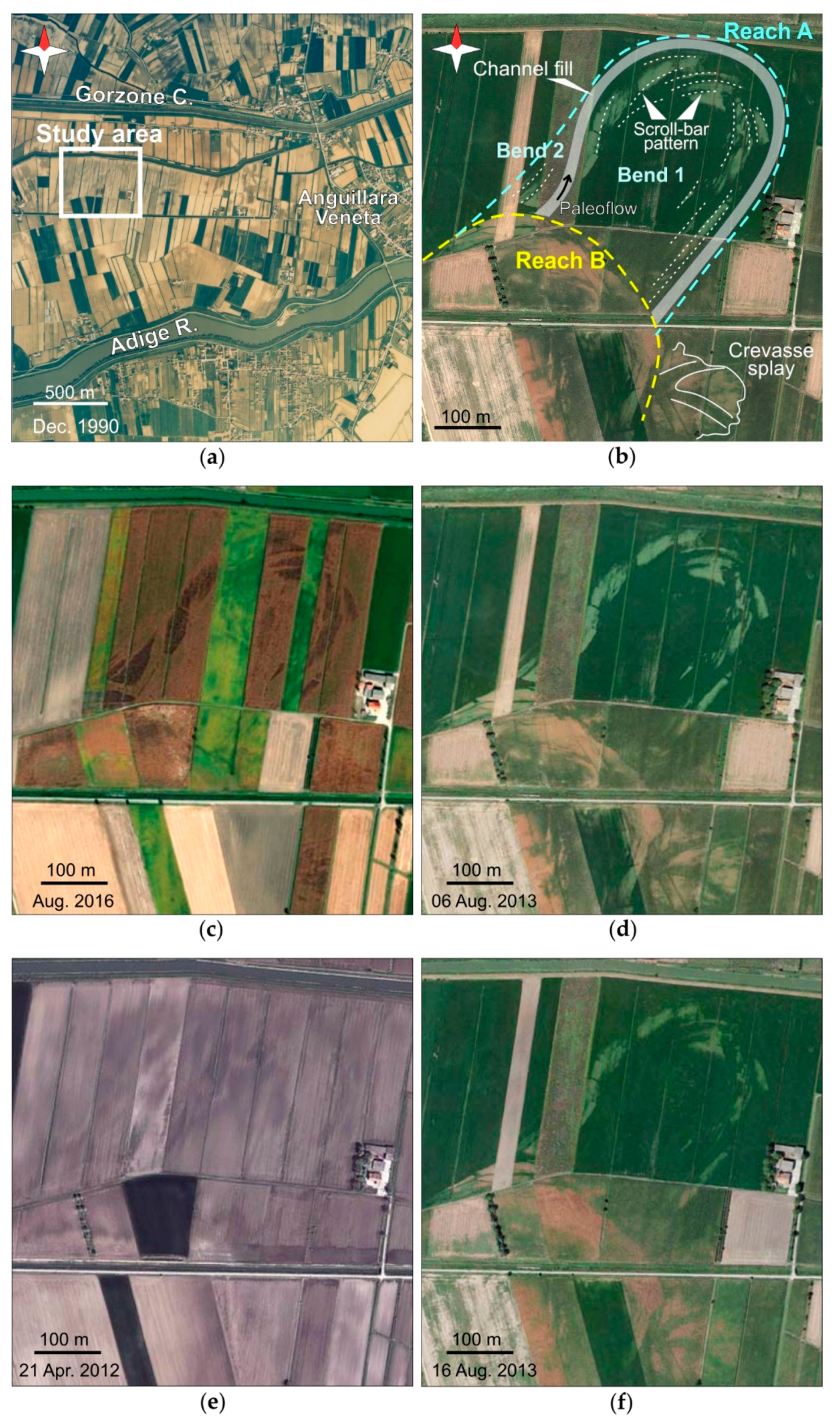
3.1. Remote Sensing
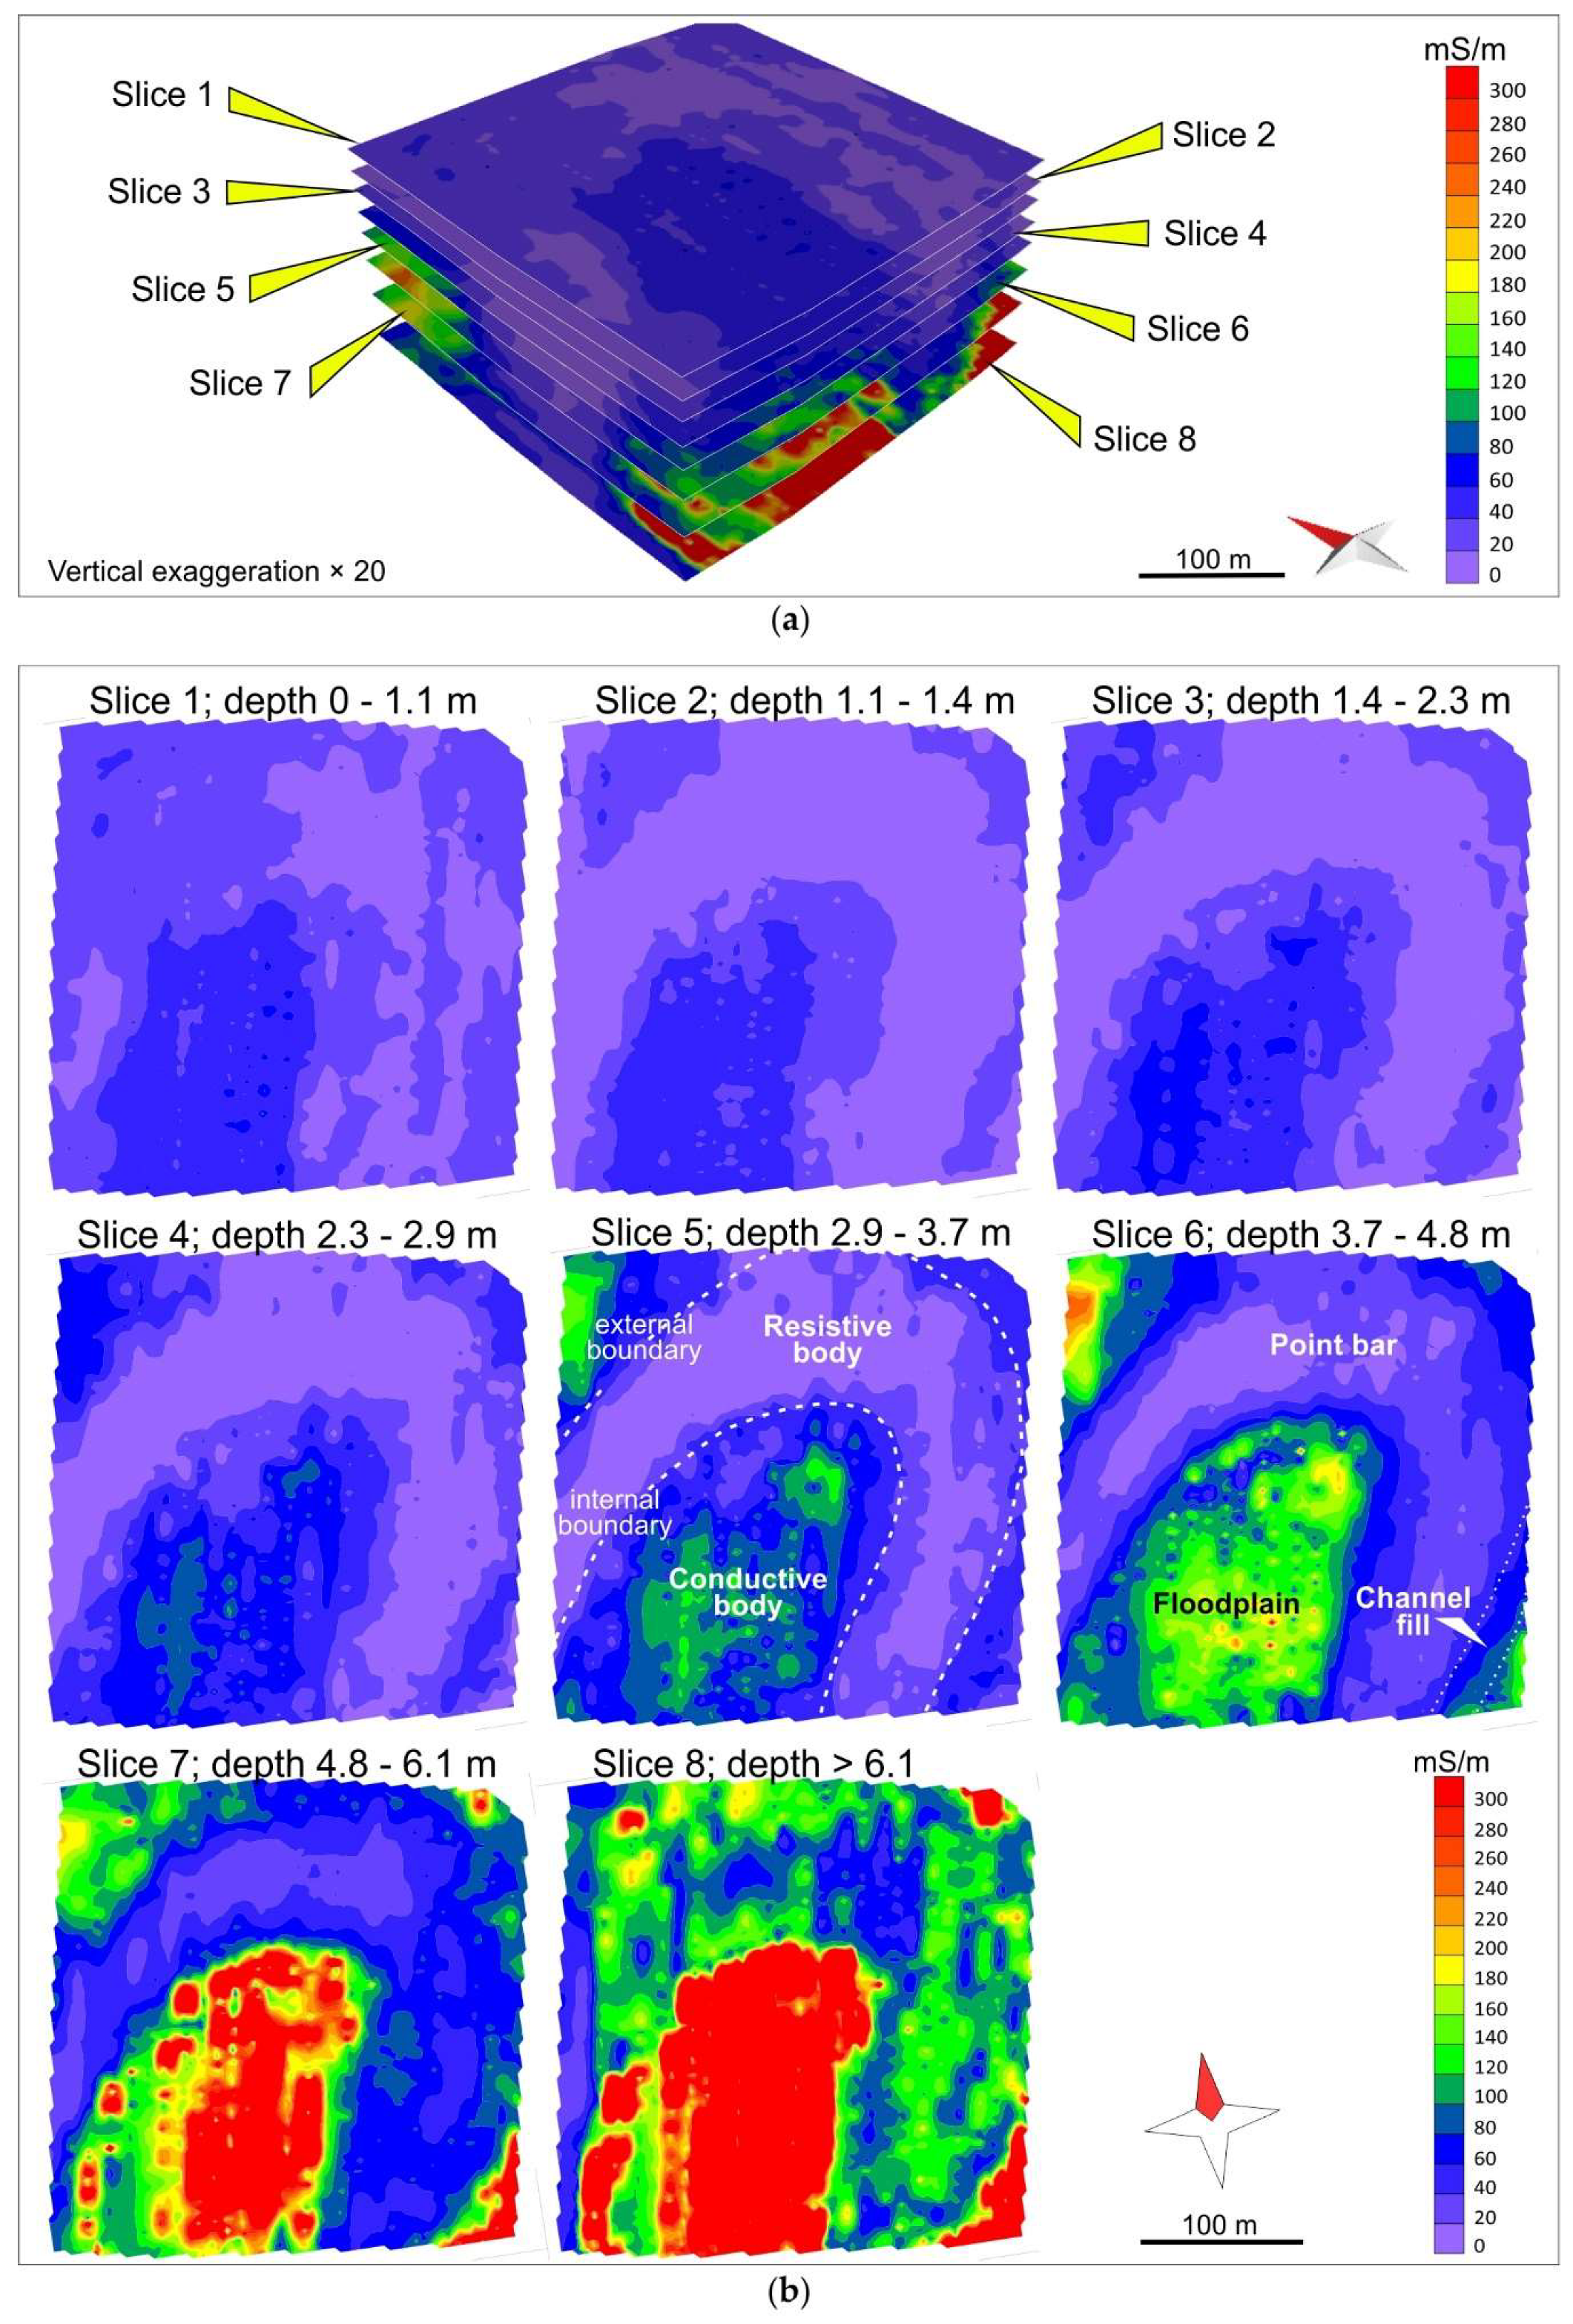
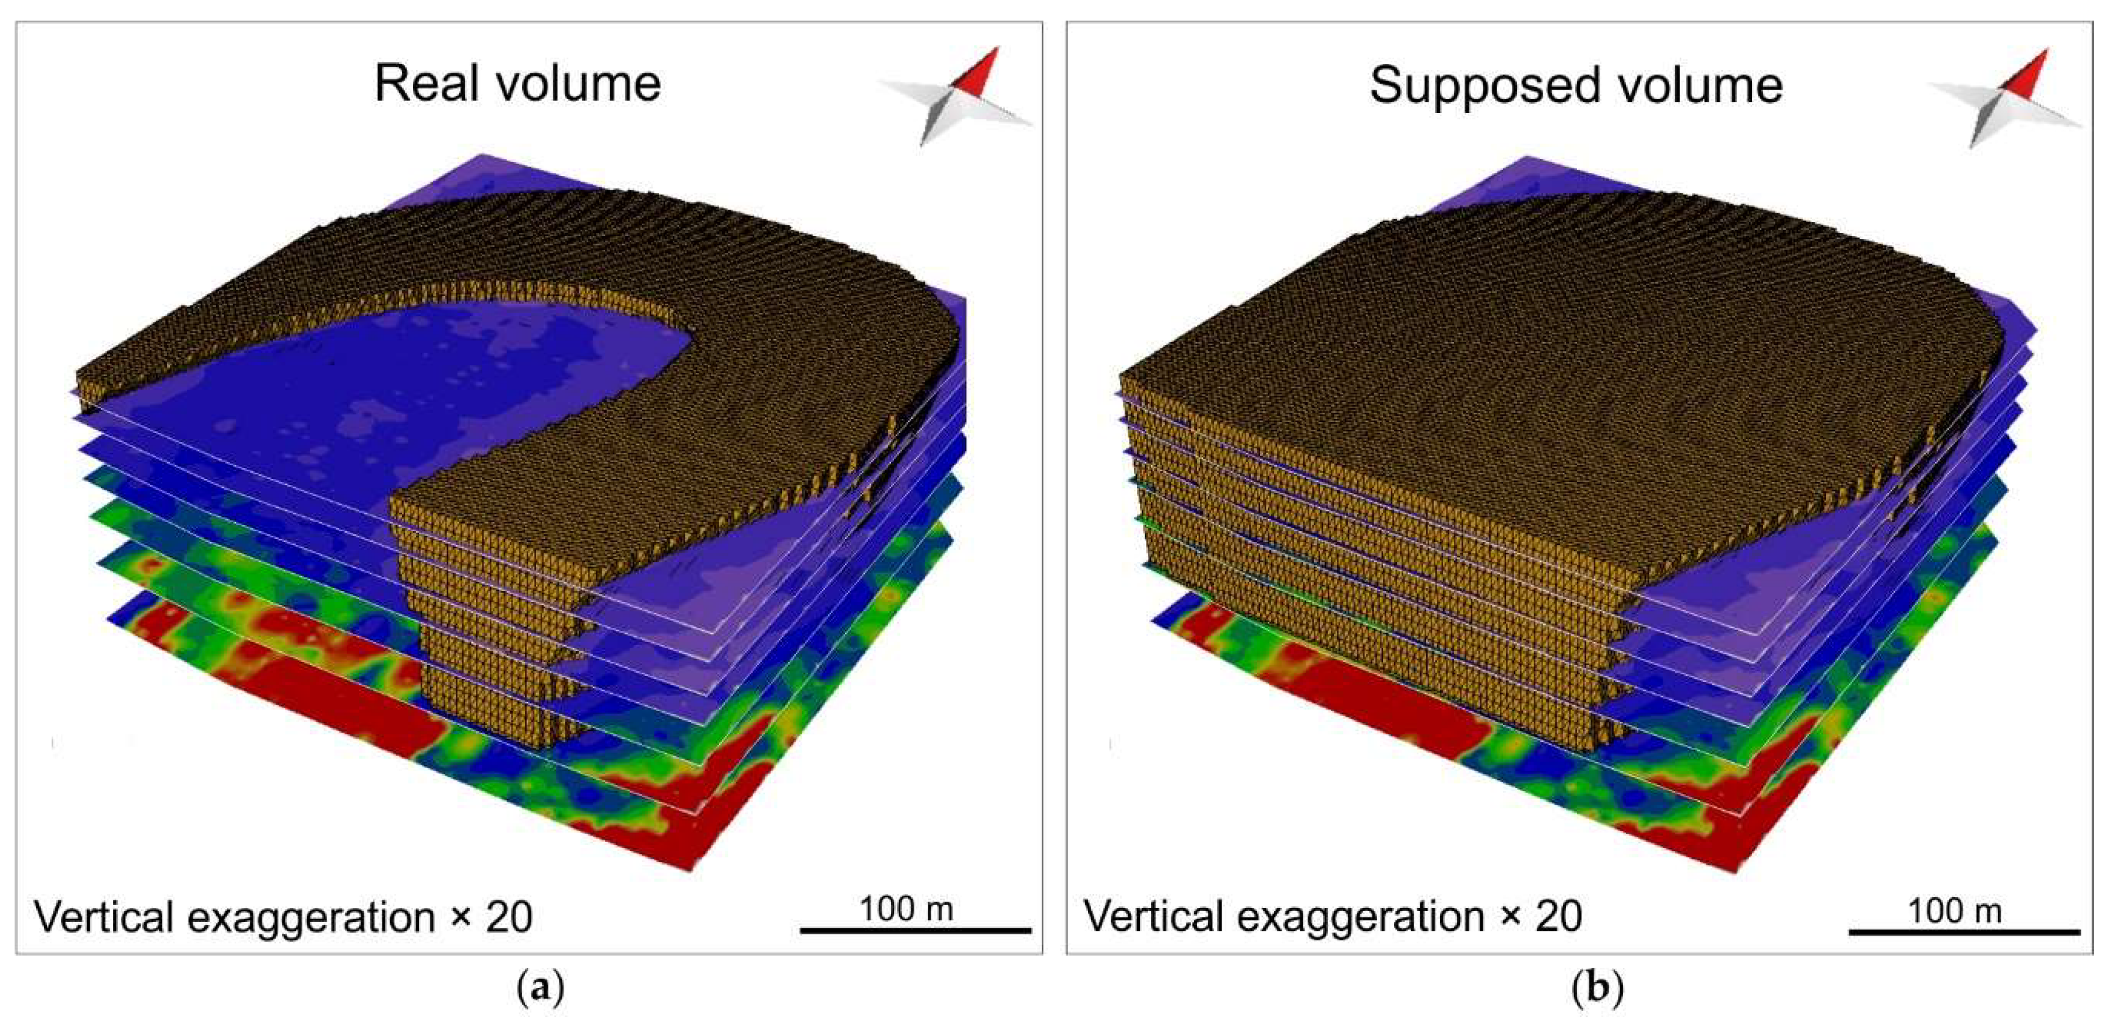
3.2. 3D Electrical Conductivity Model from EMI
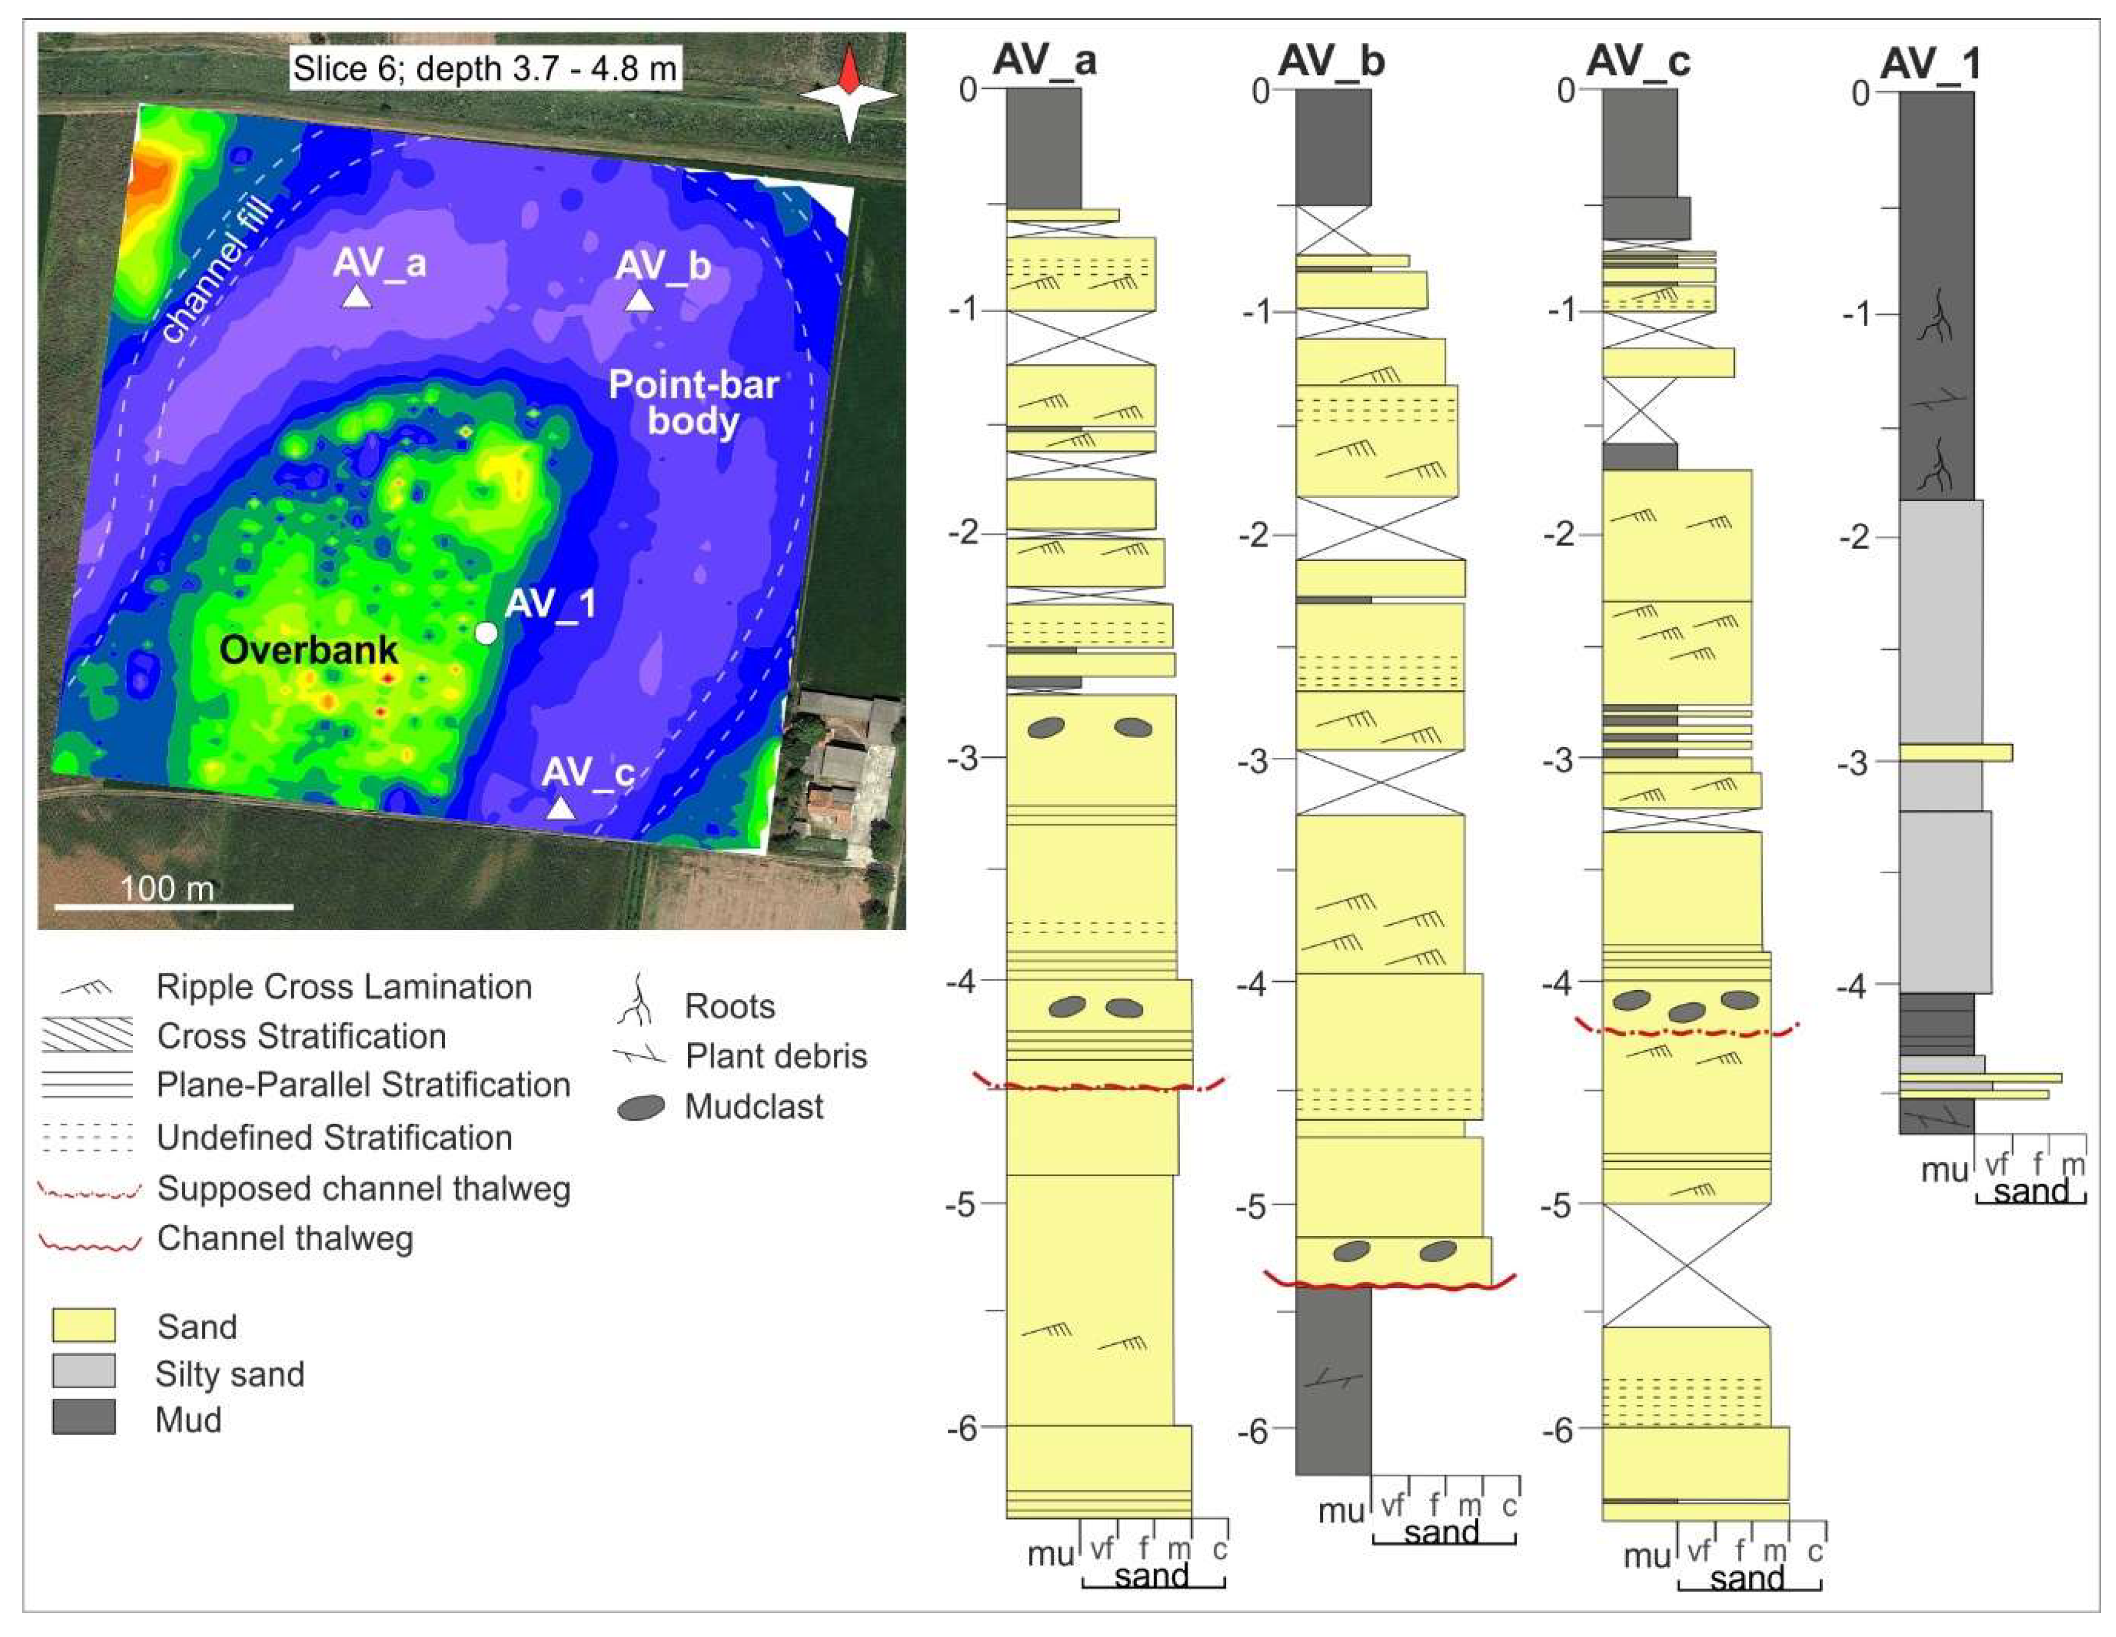
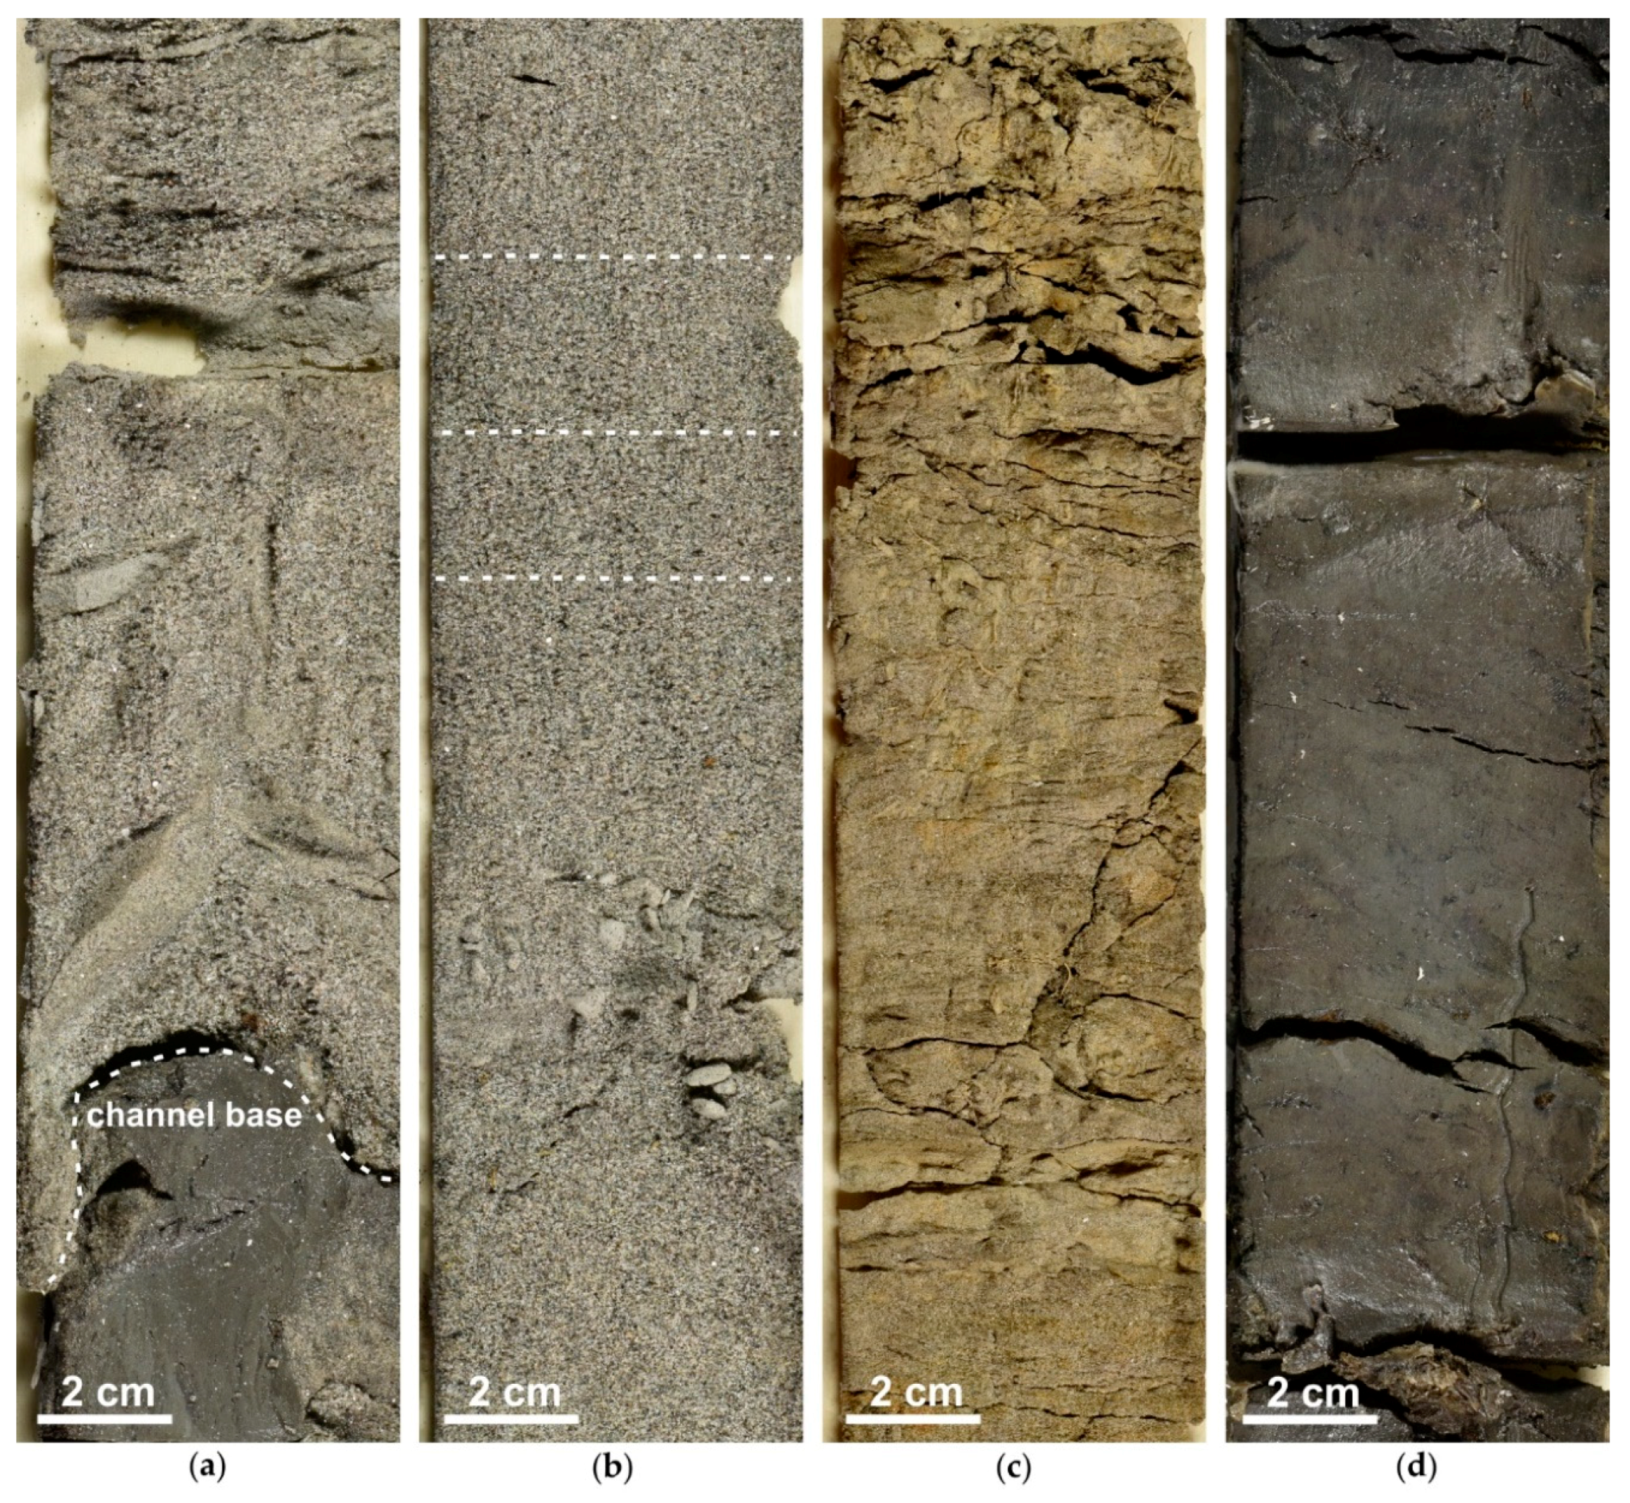
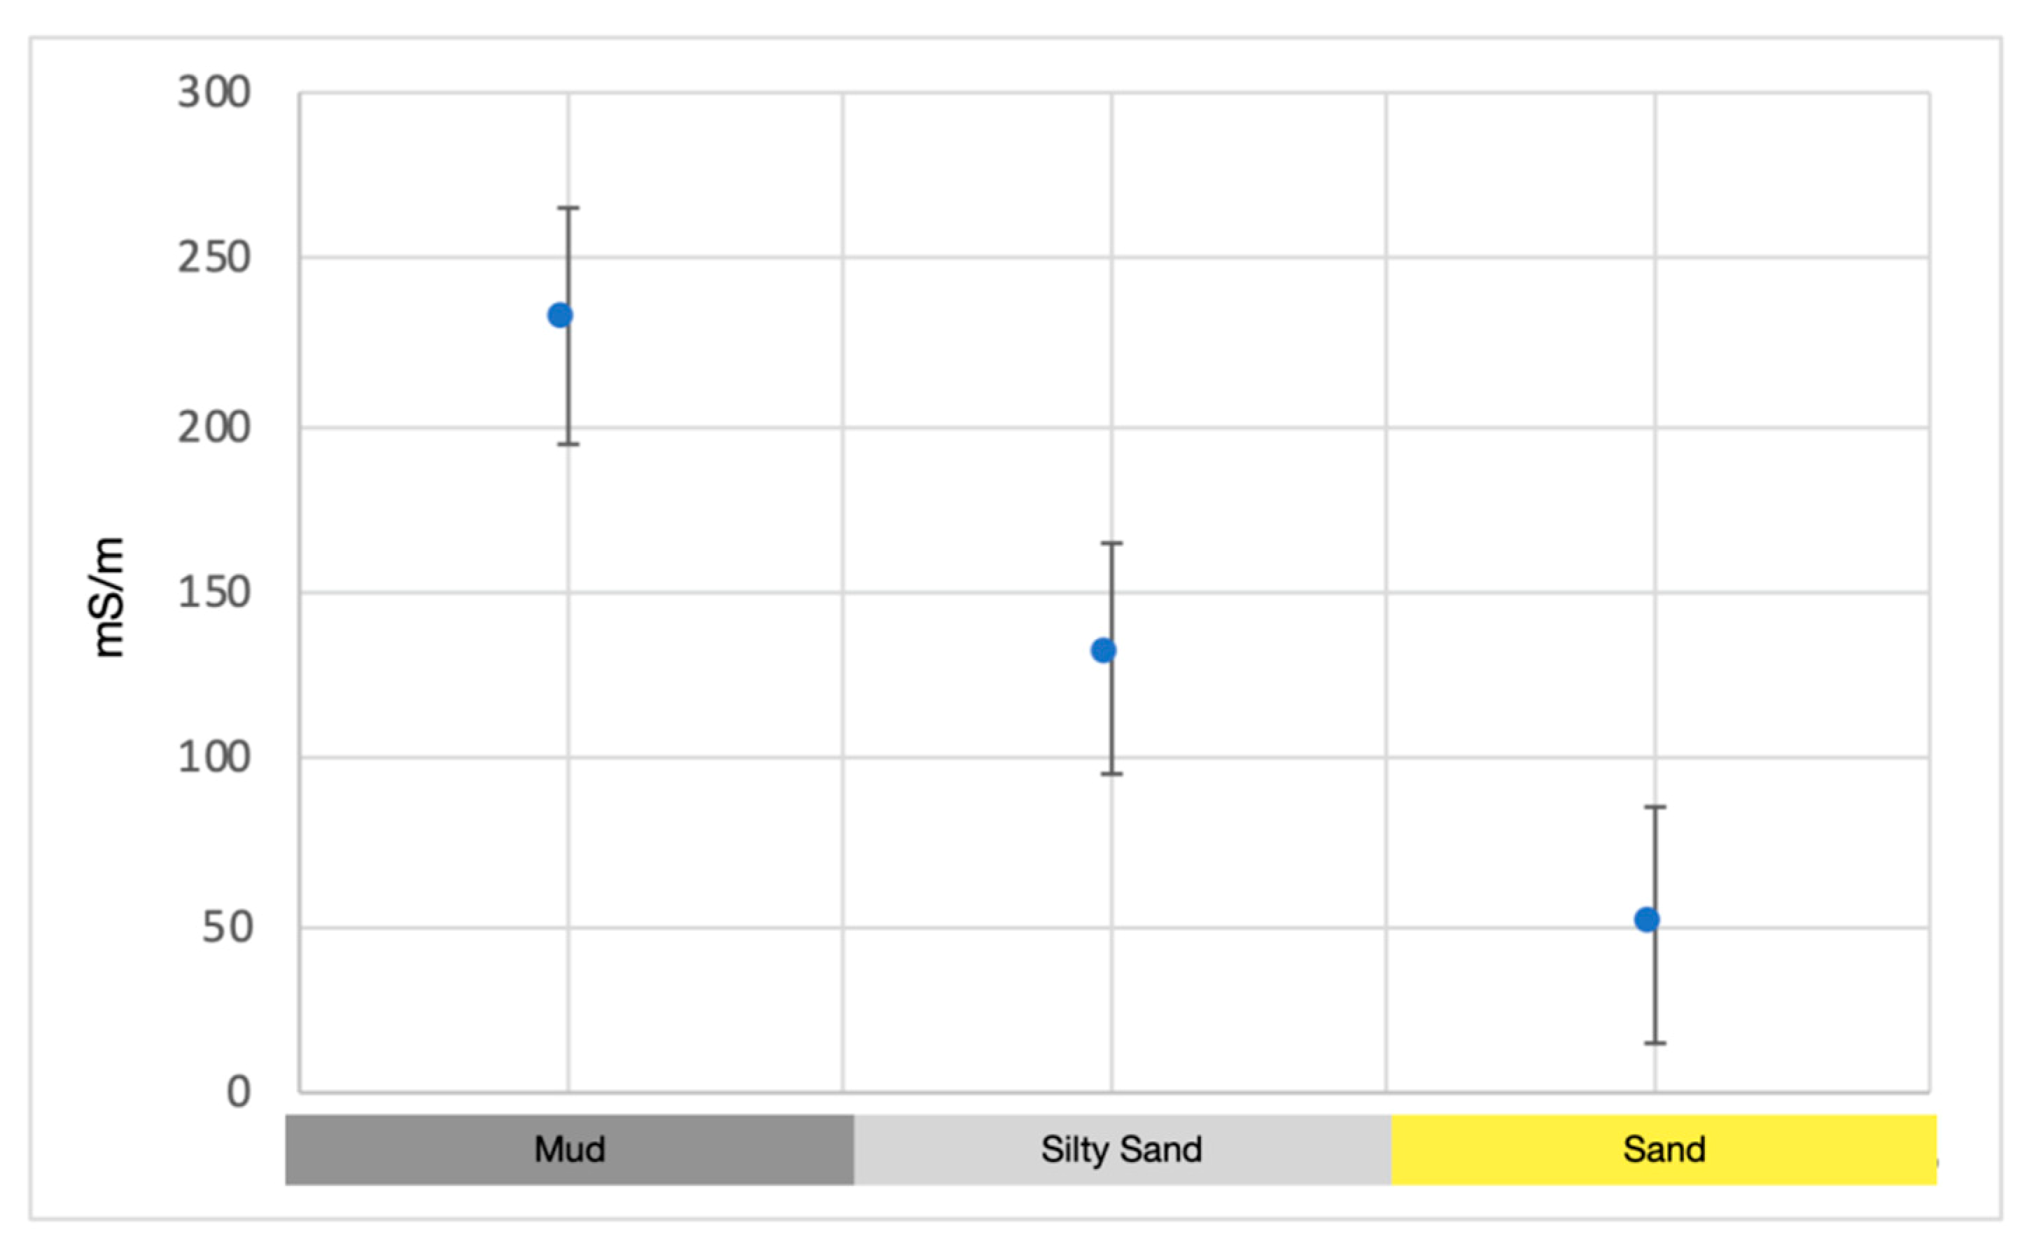
3.3. Sedimentology
4. Discussion
4.1. Implications for Noninvasive (Remote Sensing and Ground-Based Electromagnetic) Investigations
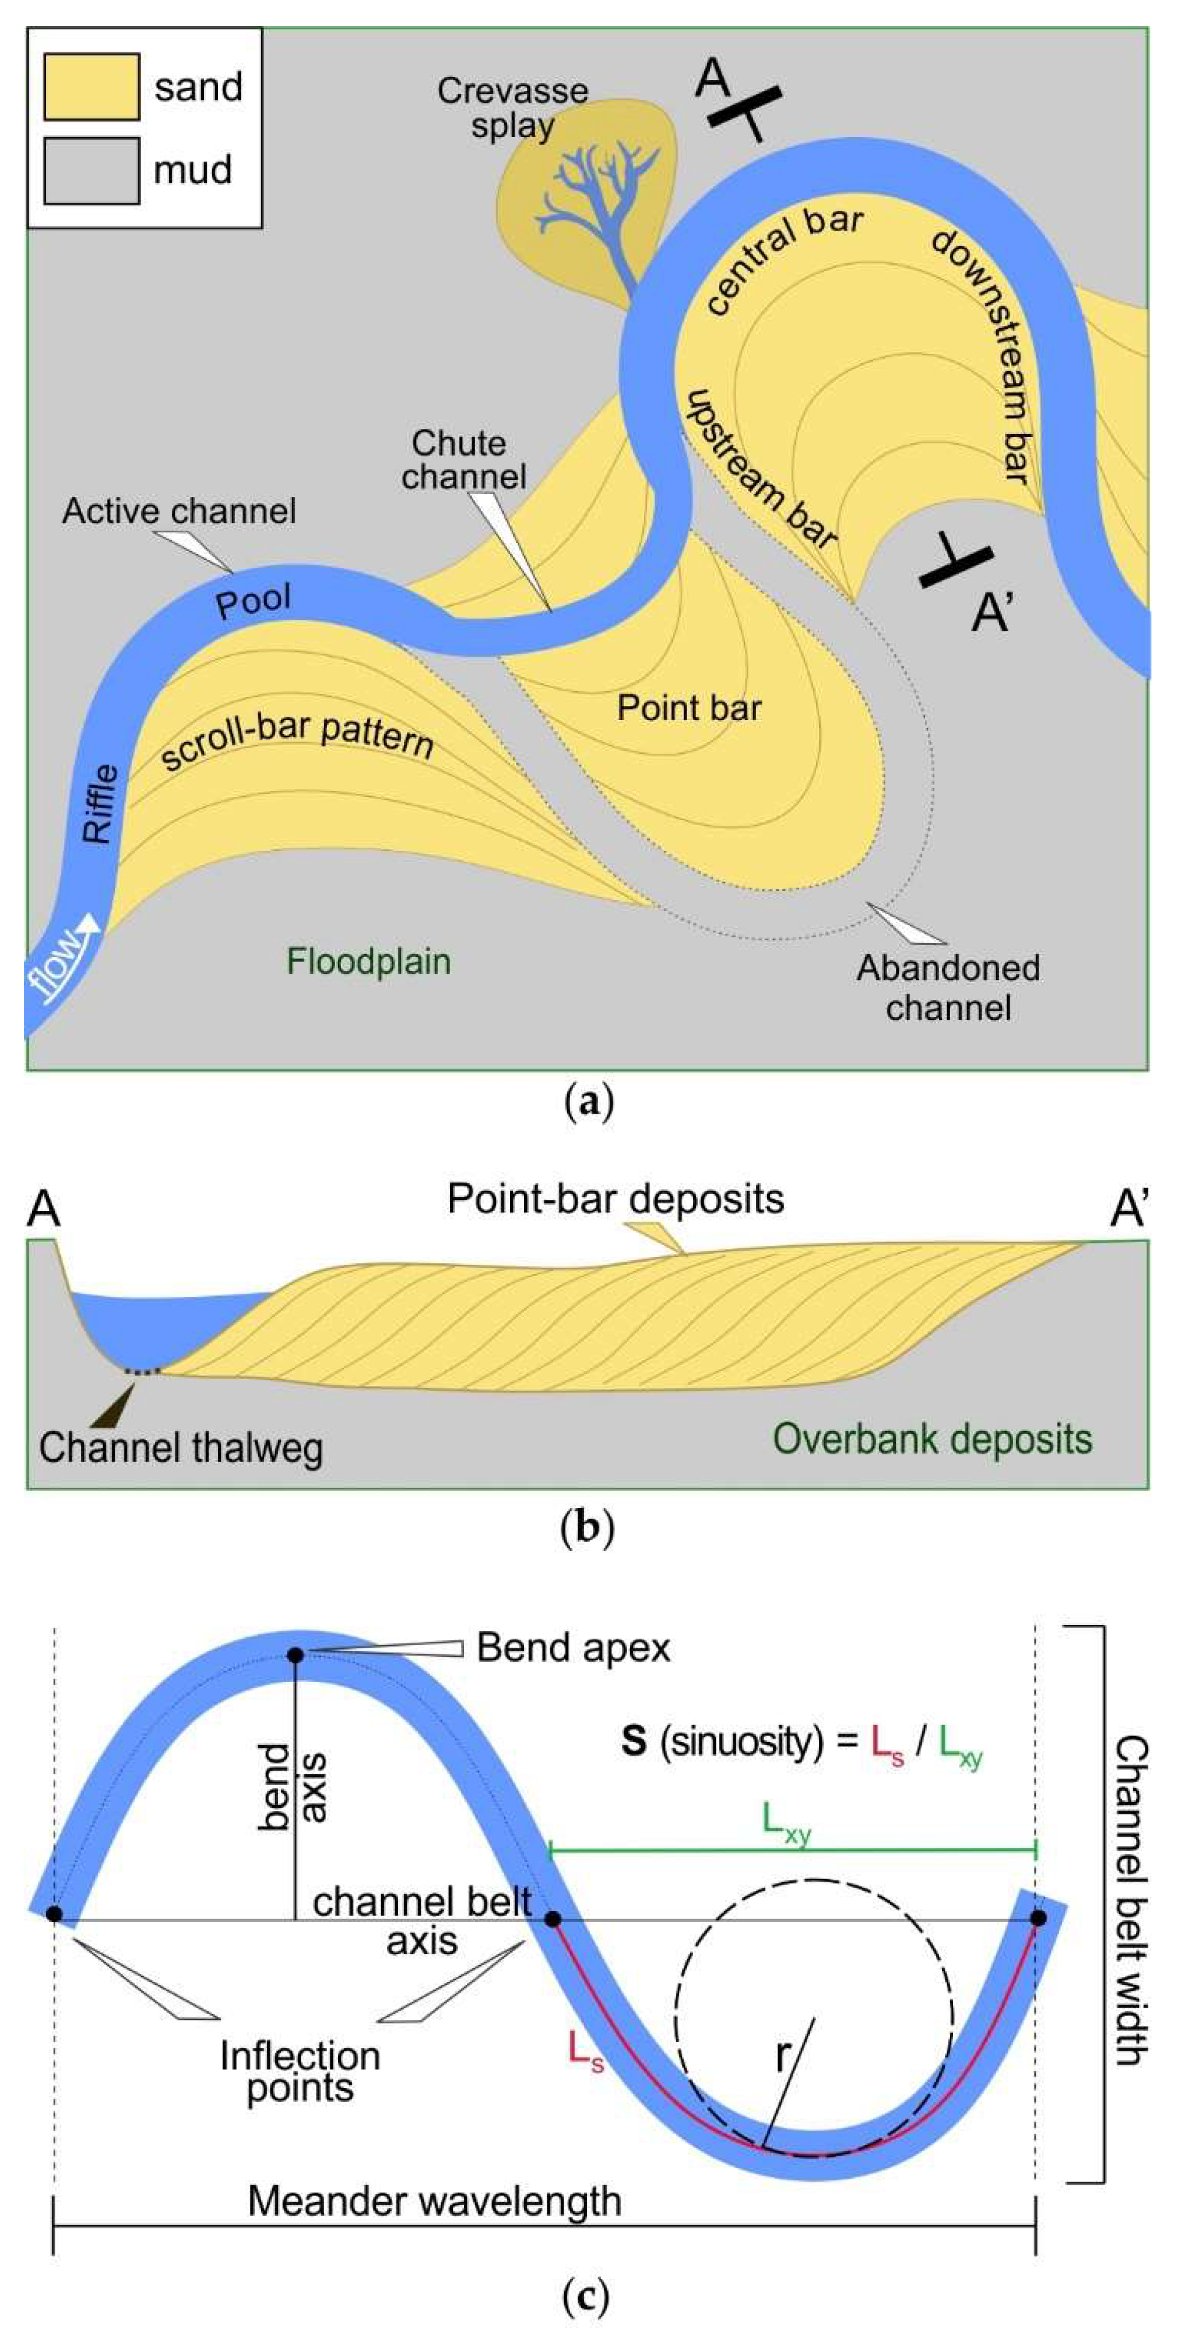
4.2. Implications for Investigation of Meandering River Deposits
5. Conclusions
Author Contributions
Funding
Acknowledgments
Conflicts of Interest
References
- Clement, W.P.; Barrash, W. Crosshole radar tomography in a fluvial aquifer near Boise, Idaho. J. Environ. Eng. Geophys. 2006, 11, 171–184. [Google Scholar] [CrossRef][Green Version]
- Galgaro, A.; Finzi, E.; Tosi, L. An experiment on a sand-dune environment in Southern Venetian coast based on GPR, VES and documentary evidence. Ann. Geophys. 2000, 43, 289–295. [Google Scholar] [CrossRef]
- Nofal, E.R.; Amer, M.A.; El-Didy, S.M.; Fekry, A.M. Delineation and modeling of seawater intrusion into the Nile Delta Aquifer: A new perspective. Water Sci. 2015, 29, 156–166. [Google Scholar] [CrossRef]
- Da Lio, C.; Carol, E.; Kruse, E.; Teatini, P.; Tosi, L. Saltwater contamination in the managed low-lying farmland of the Venice coast, Italy: An assessment of vulnerability. Sci. Total Environ. 2015, 533, 356–369. [Google Scholar] [CrossRef] [PubMed]
- Desbarats, A.J.; Koenig, C.E.M.; Pal, T.; Mukherjee, P.K.; Beckie, R.D. Groundwater flow dynamics and arsenic source characterization in an aquifer system of West Bengal, India. Water Resour. Res. 2014, 50, 4974–5002. [Google Scholar] [CrossRef]
- Carraro, A.; Fabbri, P.; Giaretta, A.; Peruzzo, L.; Tateo, F.; Tellini, F. Effects of redox conditions on the control of arsenic mobility in shallow alluvial aquifers on the Venetian Plain (Italy). Sci. Total Environ. 2015, 532, 581–594. [Google Scholar] [CrossRef]
- Romeo, R.W.; Amoroso, S.; Facciorusso, J.; Lenti, L.; Madiai, C.; Martino, S.; Monaco, P.; Rinaldis, D.; Totani, F. Soil liquefaction during the Emilia, 2012 seismic sequence: Investigation and analysis. Eng. Geol. Soc. Territ. 2015, 5, 1107–1110. [Google Scholar] [CrossRef]
- Amorosi, A.; Bruno, L.; Facciorusso, J.; Piccin, A.; Sammartino, I. Stratigraphic control on earthquake-induced liquefaction: A case study from the Central Po Plain (Italy). Sediment. Geol. 2016, 345, 42–53. [Google Scholar] [CrossRef]
- Fontana, D.; Lugli, S.; Dori, S.M.; Caputo, R.; Stefani, M. Sedimentology and composition of sands injected during the seismic crisis of May 2012 (Emilia, Italy): Clues for source layer identification and liquefaction regime. Sediment. Geol. 2015, 325, 158–167. [Google Scholar] [CrossRef][Green Version]
- Mozzi, P. Alluvial plain formation during the Late Quaternary between the southern Alpine margin and the Lagoon of Venice (Northern Italy). Geogr. Fis. Din. Quat. 2005, 7, 219–229. [Google Scholar]
- Ninfo, A.; Ferrarese, F.; Mozzi, P.; Fontana, A. High resolution dems for the analysis of fluvial and ancient anthropogenic landforms in the alluvial plain of Padua (Italy). Geogr. Fis. Din. Quat. 2011, 34, 95–104. [Google Scholar] [CrossRef]
- Castigoni, G.B. Geomorphology of the Po Plain. Earth Surf. Process. Landf. J. Br. Geomorphol. Res. Group 1999, 24, 1115–1120. [Google Scholar]
- Mehdi, S.M.; Pant, N.C.; Saini, H.S.; Mujtaba, S.A.I.; Pande, P. Identification of palaeochannel configuration in the Saraswati River basin in parts of Haryana and Rajasthan, India, through digital remote sensing and GIS. Episodes 2016, 39, 29–38. [Google Scholar] [CrossRef]
- De Rossetti, D.F. Multiple remote sensing techniques as a tool for reconstructing late Quaternary drainage in the Amazon lowland. Earth Surf. Process. Landf. 2010, 35, 1234–1239. [Google Scholar] [CrossRef]
- Wray, R.A.L. Palaeochannels of the Namoi River Floodplain, New South Wales, Australia: The use of multispectral Landsat imagery to highlight a Late Quaternary change in fluvial regime. Aust. Geogr. 2009, 40, 29–49. [Google Scholar] [CrossRef]
- Entwistle, N.; Heritage, G.; Milan, D. Recent remote sensing applications for hydro and morphodynamic monitoring and modelling. Earth Surf. Process. Landf. 2018, 43, 2283–2291. [Google Scholar] [CrossRef]
- Demarchi, L.; Bizzi, S.; Piégay, H. Regional hydromorphological characterization with continuous and automated remote sensing analysis based on VHR imagery and low-resolution LiDAR data. Earth Surf. Process. Landf. 2017, 42, 531–551. [Google Scholar] [CrossRef]
- Piégay, H.; Arnaud, F.; Belletti, B.; Bertrand, M.; Bizzi, S.; Carbonneau, P.; Dufour, S.; Liébault, F.; Ruiz-Villanueva, V.; Slater, L. Remotely sensed rivers in the Anthropocene: State of the art and prospects. Earth Surf. Process. Landf. 2020, 45, 157–188. [Google Scholar] [CrossRef]
- Langat, P.K.; Kumar, L.; Koech, R. Monitoring river channel dynamics using remote sensing and GIS techniques. Geomorphology 2019, 325, 92–102. [Google Scholar] [CrossRef]
- Righini, M.; Surian, N. Remote Sensing as a Tool for Analysing Channel Dynamics and Geomorphic Effects of Floods. In Flood Monitoring through Remote Sensing; Springer: Cham, Switzerland, 2018; pp. 27–59. [Google Scholar]
- Finotello, A.; Lanzoni, S.; Ghinassi, M.; Marani, M.; Rinaldo, A.; D’Alpaos, A. Field migration rates of tidal meanders recapitulate fluvial morphodynamics. Proc. Natl. Acad. Sci. USA 2018, 115, 1463–1468. [Google Scholar] [CrossRef]
- Fontana, A.; Mozzi, P.; Bondesan, A. Alluvial megafans in the Venetian-Friulian Plain (north-eastern Italy): Evidence of sedimentary and erosive phases during Late Pleistocene and Holocene. Quat. Int. 2008, 189, 71–90. [Google Scholar] [CrossRef]
- Fontana, A.; Mozzi, P.; Bondesan, A. Late Pleistocene evolution of the Venetian-Friulian Plain. Rend. Lincei 2010, 21, 181–196. [Google Scholar] [CrossRef]
- Piovan, S.; Mozzi, P.; Stefani, C. Bronze age paleohydrography of the southern Venetian Plain. Geoarchaeology 2010, 25, 6–35. [Google Scholar] [CrossRef]
- Brivio, L.; Ghinassi, M.; D’Alpaos, A.; Finotello, A.; Fontana, A.; Roner, M.; Howes, N. Aggradation and lateral migration shaping geometry of a tidal point bar: An example from salt marshes of the Northern Venice Lagoon (Italy). Sediment. Geol. 2016, 343, 141–155. [Google Scholar] [CrossRef]
- Parasnis, D.S. Principles of Applied Geophysics, 5th ed.; Chapman & Hall: London, UK, 1997. [Google Scholar]
- Telford, W.M.; Geldart, L.P.; Sheriff, R.E. Applied Geophysics; Cambridge University Press: Cambridge, UK, 1990. [Google Scholar]
- Everett, M.E.; Meju, M.A. Near-Surface Controlled-Source Electromagnetic Induction: Background and Recent Advances. In Hydrogeophysics; Rubin, Y., Hubbard, S.S., Eds.; Springer: Berlin/Heidelberg, Germany, 2005; Volume 50, pp. 157–184. ISBN 978-1-4020-3101-4. [Google Scholar]
- Boaga, J. The use of FDEM in hydrogeophysics: A review. J. Appl. Geophys. 2017, 139, 36–46. [Google Scholar] [CrossRef]
- Lesch, S.M.; Strauss, D.J.; Rhoades, J.D. Spatial Prediction of Soil Salinity Using Electromagnetic Induction Techniques: 1. Statistical prediction models: A comparison of multiple linear regression and cokriging Identification and Estimation. Water Resour. Res. 1995, 31, 373–386. [Google Scholar] [CrossRef]
- Paine, J.G. Determining salinization extent, identifying salinity sources, and estimating chloride mass using surface, borehole, and airborne electromagnetic induction methods. Water Resour. Res. 2003, 39. [Google Scholar] [CrossRef]
- Sambuelli, L.; Leggieri, S.; Calzoni, C.; Porporato, C. Study of riverine deposits using electromagnetic methods at a low induction number. Geophysics 2007, 72, B113–B120. [Google Scholar] [CrossRef][Green Version]
- Greenhouse, J.P.; Slaine, D.D. The use of reconnaissance electromagnetic methods to map contaminant migration: These nine case studies can help determine which geophysical techniques are applicable to a given problem. Groundw. Monit. Remediat. 1983, 3, 47–59. [Google Scholar] [CrossRef]
- Martinelli, P.; Duplaá, M.C. Laterally filtered 1D inversions of small-loop, frequency-domain EMI data from a chemical waste site. Geophysics 2008, 73, F143–F149. [Google Scholar] [CrossRef][Green Version]
- Cassiani, G.; Ursino, N.; Deiana, R.; Vignoli, G.; Boaga, J.; Rossi, M.; Perri, M.T.; Blaschek, M.; Duttmann, R.; Meyer, S.; et al. Noninvasive Monitoring of Soil Static Characteristics and Dynamic States: A Case Study Highlighting Vegetation Effects on Agricultural Land. Vadose J. 2012, 11. [Google Scholar] [CrossRef]
- Gebbers, R.; Lück, E.; Heil, K. Depth sounding with the EM38-detection of soil layering by inversion of apparent electrical conductivity measurements. In Precision Agricolture’07; Stafford, J.V., Ed.; Wageningen Academic Publisher: Skiathos, Greece, 2007; pp. 95–102. ISBN 978-90-8686-024-1. [Google Scholar]
- Yao, R.; Yang, J. Quantitative evaluation of soil salinity and its spatial distribution using electromagnetic induction method. Agric. Water Manag. 2010, 97, 1961–1970. [Google Scholar] [CrossRef]
- Osella, A.; De la Vega, M.; Lascano, E. 3D electrical imaging of an archaeological site using electrical and electromagnetic methods. Geophysics 2005, 70, G101–G107. [Google Scholar] [CrossRef]
- Thiesson, J.; Dabas, M.; Flageul, S. Detection of resistive features using towed Slingram electromagnetic induction instruments. Archaeol. Prospect. 2009, 16, 103–109. [Google Scholar] [CrossRef]
- Perri, M.T.; Boaga, J.; Bersan, S.; Cassiani, G.; Cola, S.; Deiana, R.; Simonini, P.; Patti, S. River embankment characterization: The joint use of geophysical and geotechnical techniques. J. Appl. Geophys. 2014, 110, 5–22. [Google Scholar] [CrossRef]
- Huang, H.; SanFilipo, B.; Oren, A.; Won, I.J. Coaxial coil towed EMI sensor array for UXO detection and characterization. J. Appl. Geophys. 2007, 61, 217–226. [Google Scholar] [CrossRef]
- Corwin, D.L.; Rhoades, J.D. An Improved Technique for Determining Soil Electrical Conductivity-Depth Relations from Above-ground Electromagnetic Measurements. Soil Sci. Soc. Am. J. 1982, 46, 517–520. [Google Scholar] [CrossRef]
- McNeill, J.D. Electromagnetic Terrain Conductivity Measurement at Low Induction Numbers. Tech. Note 1980, 6, 13. [Google Scholar]
- Wait, J.R. Geo-Electromagnetism; Academic Press: New York, NY, USA, 1982. [Google Scholar]
- Frischknecht, F.C.; Labson, V.F.; Spies, B.R.; Anderson, W.L. Profiling methods using small sources. In Electromagnetic Methods in Applied Geophysics; Nabighian, M.N., Ed.; Society of Exploration Geophysicists: Tulsa, OK, USA, 1991; Volume 2, pp. 105–270. [Google Scholar]
- Deidda, G.P.; Fenu, C.; Rodriguez, G. Regularized solution of a nonlinear problem in electromagnetic sounding. Inverse Probl. 2014, 30, 125014. [Google Scholar] [CrossRef]
- Von Hebel, C.; Rudolph, S.; Mester, A.; Huisman, J.A.; Kumbhar, P.; Vereecken, H.; van der Kruk, J. Three-dimensional imaging of subsurface structural patterns using quantitative large-scale multiconfiguration electromagnetic induction data. Water Resour. Res. Res. 2014, 50, 2732–2748. [Google Scholar] [CrossRef]
- Saey, T.; De Smedt, P.; Delefortrie, S.; Van De Vijver, E.; Van Meirvenne, M. Comparing one- and two-dimensional EMI conductivity inverse modeling procedures for characterizing a two-layered soil. Geoderma 2015, 241–242, 12–23. [Google Scholar] [CrossRef]
- Shanahan, P.W.; Binley, A.; Whalley, W.R.; Watts, C.W. The Use of Electromagnetic Induction to Monitor Changes in Soil Moisture Profiles beneath Different Wheat Genotypes. Soil Sci. Soc. Am. J. 2015, 79, 459–466. [Google Scholar] [CrossRef]
- Frederiksen, R.R.; Christiansen, A.V.; Christensen, S.; Rasmussen, K.R. A direct comparison of EMI data and borehole data on a 1000 ha data set. Geoderma 2017, 303, 188–195. [Google Scholar] [CrossRef]
- Boaga, J.; Ghinassi, M.; D’Alpaos, A.; Deidda, G.P.; Rodriguez, G.; Cassiani, G. Geophysical investigations unravel the vestiges of ancient meandering channels and their dynamics in tidal landscapes. Sci. Rep. 2018, 8, 3303905. [Google Scholar] [CrossRef]
- Viezzoli, A.; Christensen, A.V.; Auken, E.; Sørensen, K. Quasi-3D modeling of airborne TEM data by spatially constrained inversion. Geophysics 2008, 73, F105–F113. [Google Scholar] [CrossRef]
- Piovan, S.; Mozzi, P.; Zecchin, M. The interplay between adjacent Adige and Po alluvial systems and deltas in the late Holocene (Northern Italy). Géomorphol. Process. Environ. 2012, 18, 427–440. [Google Scholar] [CrossRef]
- De Franco, R.; Biella, G.; Tosi, L.; Teatini, P.; Lozej, A.; Chiozzotto, B.; Giada, M.; Rizzetto, F.; Claude, C.; Mayer, A.; et al. Monitoring the saltwater intrusion by time lapse electrical resistivity tomography: The Chioggia test site (Venice Lagoon, Italy). J. Appl. Geophys. 2009, 69, 117–130. [Google Scholar] [CrossRef]
- Mozzi, P.; Piovan, S.; Corrò, E. Long-term drivers and impacts of abrupt river changes in managed lowlands of the Adige river and northern PO delta (Northern Italy). Quat. Int. 2018, 538, 80–93. [Google Scholar] [CrossRef]
- Teatini, P.; Tosi, L.; Strozzi, T.; Carbognin, L.; Wegmüller, U.; Rizzetto, F. Mapping regional land displacement in the Venice coastland by an integrated monitoring system. Remote Sens. Environ. 2005, 98, 403–413. [Google Scholar] [CrossRef]
- Carminati, E.; Martinelli, G.; Severi, P. Influence of glacial cycles and tectonics on natural subsidence in the Po Plain (Northern Italy): Insights from 14C ages. Geochem. Geophys. Geosystems 2003, 4. [Google Scholar] [CrossRef]
- Teatini, P.; Tosi, L.; Strozzi, T. Quantitative evidence that compaction of Holocene sediments drives the present land subsidence of the Po Delta, Italy. J. Geophys. Res. Earth Surf. 2011, 116. [Google Scholar] [CrossRef]
- ArcGIS. Available online: https://www.esri.com/en-us/arcgis/about-arcgis/overview (accessed on 20 March 2020).
- QGIS. Available online: https://www.qgis.org/it/site/ (accessed on 25 March 2020).
- Il Geoportale Della Regione del Veneto. Available online: https://idt2.regione.veneto.it/ (accessed on 3 April 2020).
- Recanatesi, F.; Giuliani, C.; Ripa, M.N. Monitoring mediterranean oak decline in a peri-urban protected area using the NDVI and sentinel-2 images: The Case Study of Castelporziano state natural reserve. Sustainability 2018, 10, 3308. [Google Scholar] [CrossRef]
- Bannari, A.; Morin, D.; Bonn, F.; Huete, A.R. A review of vegetation indices. Remote Sens. Rev. 1995, 13, 95–120. [Google Scholar] [CrossRef]
- Piedelobo, L.; Taramelli, A.; Schiavon, E.; Valentini, E.; Molina, J.L.; Xuan, A.N.; González-Aguilera, D. Assessment of green infrastructure in Riparian zones using copernicus programme. Remote Sens. 2019, 11, 2967. [Google Scholar] [CrossRef]
- Goodwin, N.R.; Coops, N.C.; Wulder, M.A.; Gillanders, S.; Schroeder, T.A.; Nelson, T. Estimation of insect infestation dynamics using a temporal sequence of Landsat data. Remote Sens. Environ. 2008, 112, 3680–3689. [Google Scholar] [CrossRef]
- Mather, P.M.; Koch, M. Computer Processing of Remotely-Sensed Images: An Introduction, 4th ed.; John Wiley & Sons: Hoboken, NJ, USA, 2011; ISBN 9780470742396. [Google Scholar]
- Congedo, L. Semi-Automatic Classification Plugin Documentation. Release 2016, 4, 29. [Google Scholar] [CrossRef]
- MOVE Suite-Petroleum Experts. Available online: https://www.petex.com/products/move-suite/ (accessed on 11 May 2020).
- GF Instruments S.R.O. Available online: www.gfinstruments.cz (accessed on 10 February 2020).
- Um, E.S.; Alumbaugh, D.L. On the physics of the marine controlled-source electromagnetic method. Geophysics 2007, 72, WA13–WA26. [Google Scholar] [CrossRef]
- Trimble-Transforming the Way the World Works. Available online: www.trimble.com (accessed on 10 February 2020).
- Allred, B.; Daniels, J.J.; Ehsani, R.M. Handbook of Agricultural Geophysics; CRC Press: Boca Raton, FL, USA, 2008; ISBN 9780849337284. [Google Scholar]
- Delefortrie, S.; De Smedt, P.; Saey, T.; Van De Vijver, E.; Van Meirvenne, M. An efficient calibration procedure for correction of drift in EMI survey data. J. Appl. Geophys. 2014, 110, 115–125. [Google Scholar] [CrossRef]
- Interpex Limited-Specialists in PC Based Geophysical Software. Available online: www.interpex.com (accessed on 3 February 2020).
- Constable, S.C.; Parker, R.L.; Constable, C.G. Occam’s inversion: A practical algorithm for generating smooth models from electromagnetic sounding data. Geophysics 1987, 52, 289–300. [Google Scholar] [CrossRef]
- Ghinassi, M.; Ielpi, A.; Aldinucci, M.; Fustic, M. Downstream-migrating fluvial point bars in the rock record. Sediment. Geol. 2016, 334, 66–96. [Google Scholar] [CrossRef]
- Ghinassi, M. Chute channels in the Holocene high-sinuosity river deposits of the Firenze plain, Tuscany, Italy. Sedimentology 2011, 58, 618–642. [Google Scholar] [CrossRef]
- Ninfo, A.; Fontana, A.; Mozzi, P.; Ferrarese, F. The Map of Altinum, Ancestor of Venice. Science 2009, 325, 577. [Google Scholar] [CrossRef] [PubMed]
- Bhattacharyya, P.; Bhattacharya, J.P.; Khan, S.D. Paleo-channel reconstruction and grain size variability in fluvial deposits, Ferron Sandstone, Notom Delta, Hanksville, Utah. Sediment. Geol. 2015, 325, 17–25. [Google Scholar] [CrossRef]
- Ghinassi, M.; Nemec, W.; Aldinucci, M.; Nehyba, S.; Özaksoy, V.; Fidolini, F. Plan-form evolution of ancient meandering rivers reconstructed from longitudinal outcrop sections. Sedimentology 2014, 61, 952–977. [Google Scholar] [CrossRef]
- Durkin, P.R.; Hubbard, S.M.; Smith, D.G.; Leckie, D.A. Predicting heterogeneity in meandering fluvial and tidal-fluvial deposits: The point bar to counter point bar transition. In Fluvial Meanders and Their Sedimentary Products in the Rock Record; Ghinassi, M., Colombera, L., Mountney, N.P., Reesink, J.H., Eds.; John Wiley & Sons: Hoboken, NJ, USA, 2018; Volume 48, pp. 231–250. [Google Scholar]
- Brice, J.C. Evolution of meander loops. Geol. Soc. Am. Bull. 1974, 85, 581–586. [Google Scholar] [CrossRef]
- Lewin, J. Initiation of bed forms and meanders in coarse-grained sediment. Geol. Soc. Am. Bull. 1976, 87, 281–285. [Google Scholar] [CrossRef]
- Nanson, G.C.; Page, K. Lateral accretion of fine-grained concave benches on meandering rivers. In Modern and Ancient Fluvial Systems; Collinson, J.D., Lewin, J., Eds.; John Wiley & Sons, Inc.: Hoboken, NJ, USA, 1983; Volume 6, pp. 133–143. ISBN 0632009977. [Google Scholar]
- Wu, C.; Bhattacharya, J.P.; Ullah, M.S. Paleohydrology and 3D facies architecture of ancient point bars, Ferron Sandstone, Notom Delta, south-central Utah, USA. J. Sediment. Res. 2015, 85, 399–418. [Google Scholar] [CrossRef]
- Jones, H.L.; Hajek, E.A. Characterizing avulsion stratigraphy in ancient alluvial deposits. Sediment. Geol. 2007, 202, 124–137. [Google Scholar] [CrossRef]
- Taylor, C.F.H. The role of overbank flow in governing the form of an anabranching river: The Fitzroy River, northwestern Australia. Fluv. Sedimentol. VI Spec. Publ. Int. Assoc. Sedimentol. 1999, 28, 77–91. [Google Scholar] [CrossRef]
- Motta, D.; Abad, J.D.; Langendoen, E.J.; García, M.H. The effects of floodplain soil heterogeneity on meander planform shape. Water Resour. Res. 2012, 48, 1–17. [Google Scholar] [CrossRef]
- Bogoni, M.; Putti, M.; Lanzoni, S. Modeling meander morphodynamics over self-formed heterogeneous floodplains. Water Resour. Res. 2017, 53, 5137–5157. [Google Scholar] [CrossRef]
- Fidolini, F.; Ghinassi, M.; Aldinucci, M.; Billi, P.; Boaga, J.; Deiana, R.; Brivio, L. Fault-sourced alluvial fans and their interaction with axial fluvial drainage: An example from the Plio-Pleistocene Upper Valdarno Basin (Tuscany, Italy). Sediment. Geol. 2013, 289, 19–39. [Google Scholar] [CrossRef]
- Nanson, G.C. Point bar and floodplain formation of the meandering Beatton River, northeastern British Columbia, Canada. Sedimentology 1980, 27, 3–29. [Google Scholar] [CrossRef]
- Ielpi, A.; Ghinassi, M. Planform architecture, stratigraphic signature and morphodynamics of an exhumed Jurassic meander plain (Scalby Formation, Yorkshire, UK). Sedimentology 2014, 61, 1923–1960. [Google Scholar] [CrossRef]
- Swan, A.; Hartley, A.J.; Owen, A.; Howell, J. Reconstruction of a sandy point-bar deposit: Implications for fluvial facies analysis. In Fluvial Meanders and Their Sedimentary Products in the Rock Record; Ghinassi, M., Colombera, L., Mountney, N.P., Reesink, A.J., Betaman, M., Eds.; John Wiley & Sons Ltd.: Hoboken, NJ, USA, 2018; Volume 48, pp. 445–474. [Google Scholar]
- Frothingham, K.M.; Rhoads, B.L. Three-dimensional flow structure and channel change in an asymmetrical compound meander loop, Embarras River, Illinois. Earth Surf. Process. Landf. J. Br. Geomorphol. Res. Gr. 2003, 28, 625–644. [Google Scholar] [CrossRef]
- Kasvi, E.; Vaaja, M.; Alho, P.; Hyyppä, H.; Hyyppä, J.; Kaartinen, H.; Kukko, A. Morphological changes on meander point bars associated with flow structure at different discharges. Earth Surf. Process. Landf. 2013, 38, 577–590. [Google Scholar] [CrossRef]
- Finotello, A.; D’Alpaos, A.; Bogoni, M.; Ghinassi, M.; Lanzoni, S. Remotely-sensed planform morphologies reveal fluvial and tidal nature of meandering channels. Sci. Rep. 2020, 10, 54. [Google Scholar] [CrossRef]
- Ferguson, R.I.; Parsons, D.R.; Lane, S.N.; Hardy, R.J. Flow in meander bends with recirculation at the inner bank. Water Resour. Res. 2003, 39. [Google Scholar] [CrossRef]


| Instrument Probe | Coil Interdistance (m) | Frequency | Nominal Exploration Depth (Horizontal Mode HMD /Vertical Mode VMD) |
|---|---|---|---|
| 1 | 1.48 | 10 kHz | 2.2/1.1 m |
| 2 | 2.82 | 10 kHz | 4.2/2.1 m |
| 3 | 4.49 | 10 kHz | 6.7/3.3 m |
© 2020 by the authors. Licensee MDPI, Basel, Switzerland. This article is an open access article distributed under the terms and conditions of the Creative Commons Attribution (CC BY) license (http://creativecommons.org/licenses/by/4.0/).
Share and Cite
Cassiani, G.; Bellizia, E.; Fontana, A.; Boaga, J.; D’Alpaos, A.; Ghinassi, M. Geophysical and Sedimentological Investigations Integrate Remote-Sensing Data to Depict Geometry of Fluvial Sedimentary Bodies: An Example from Holocene Point-Bar Deposits of the Venetian Plain (Italy). Remote Sens. 2020, 12, 2568. https://doi.org/10.3390/rs12162568
Cassiani G, Bellizia E, Fontana A, Boaga J, D’Alpaos A, Ghinassi M. Geophysical and Sedimentological Investigations Integrate Remote-Sensing Data to Depict Geometry of Fluvial Sedimentary Bodies: An Example from Holocene Point-Bar Deposits of the Venetian Plain (Italy). Remote Sensing. 2020; 12(16):2568. https://doi.org/10.3390/rs12162568
Chicago/Turabian StyleCassiani, Giorgio, Elena Bellizia, Alessandro Fontana, Jacopo Boaga, Andrea D’Alpaos, and Massimiliano Ghinassi. 2020. "Geophysical and Sedimentological Investigations Integrate Remote-Sensing Data to Depict Geometry of Fluvial Sedimentary Bodies: An Example from Holocene Point-Bar Deposits of the Venetian Plain (Italy)" Remote Sensing 12, no. 16: 2568. https://doi.org/10.3390/rs12162568
APA StyleCassiani, G., Bellizia, E., Fontana, A., Boaga, J., D’Alpaos, A., & Ghinassi, M. (2020). Geophysical and Sedimentological Investigations Integrate Remote-Sensing Data to Depict Geometry of Fluvial Sedimentary Bodies: An Example from Holocene Point-Bar Deposits of the Venetian Plain (Italy). Remote Sensing, 12(16), 2568. https://doi.org/10.3390/rs12162568