3.1. Overall Architecture
In this part, we introduce the proposed oriented vehicle detection algorithm for aerial images based on feature amplification and oversampling based data augmentation. This paper takes the Faster RCNN as the research basis and makes improvements on it.
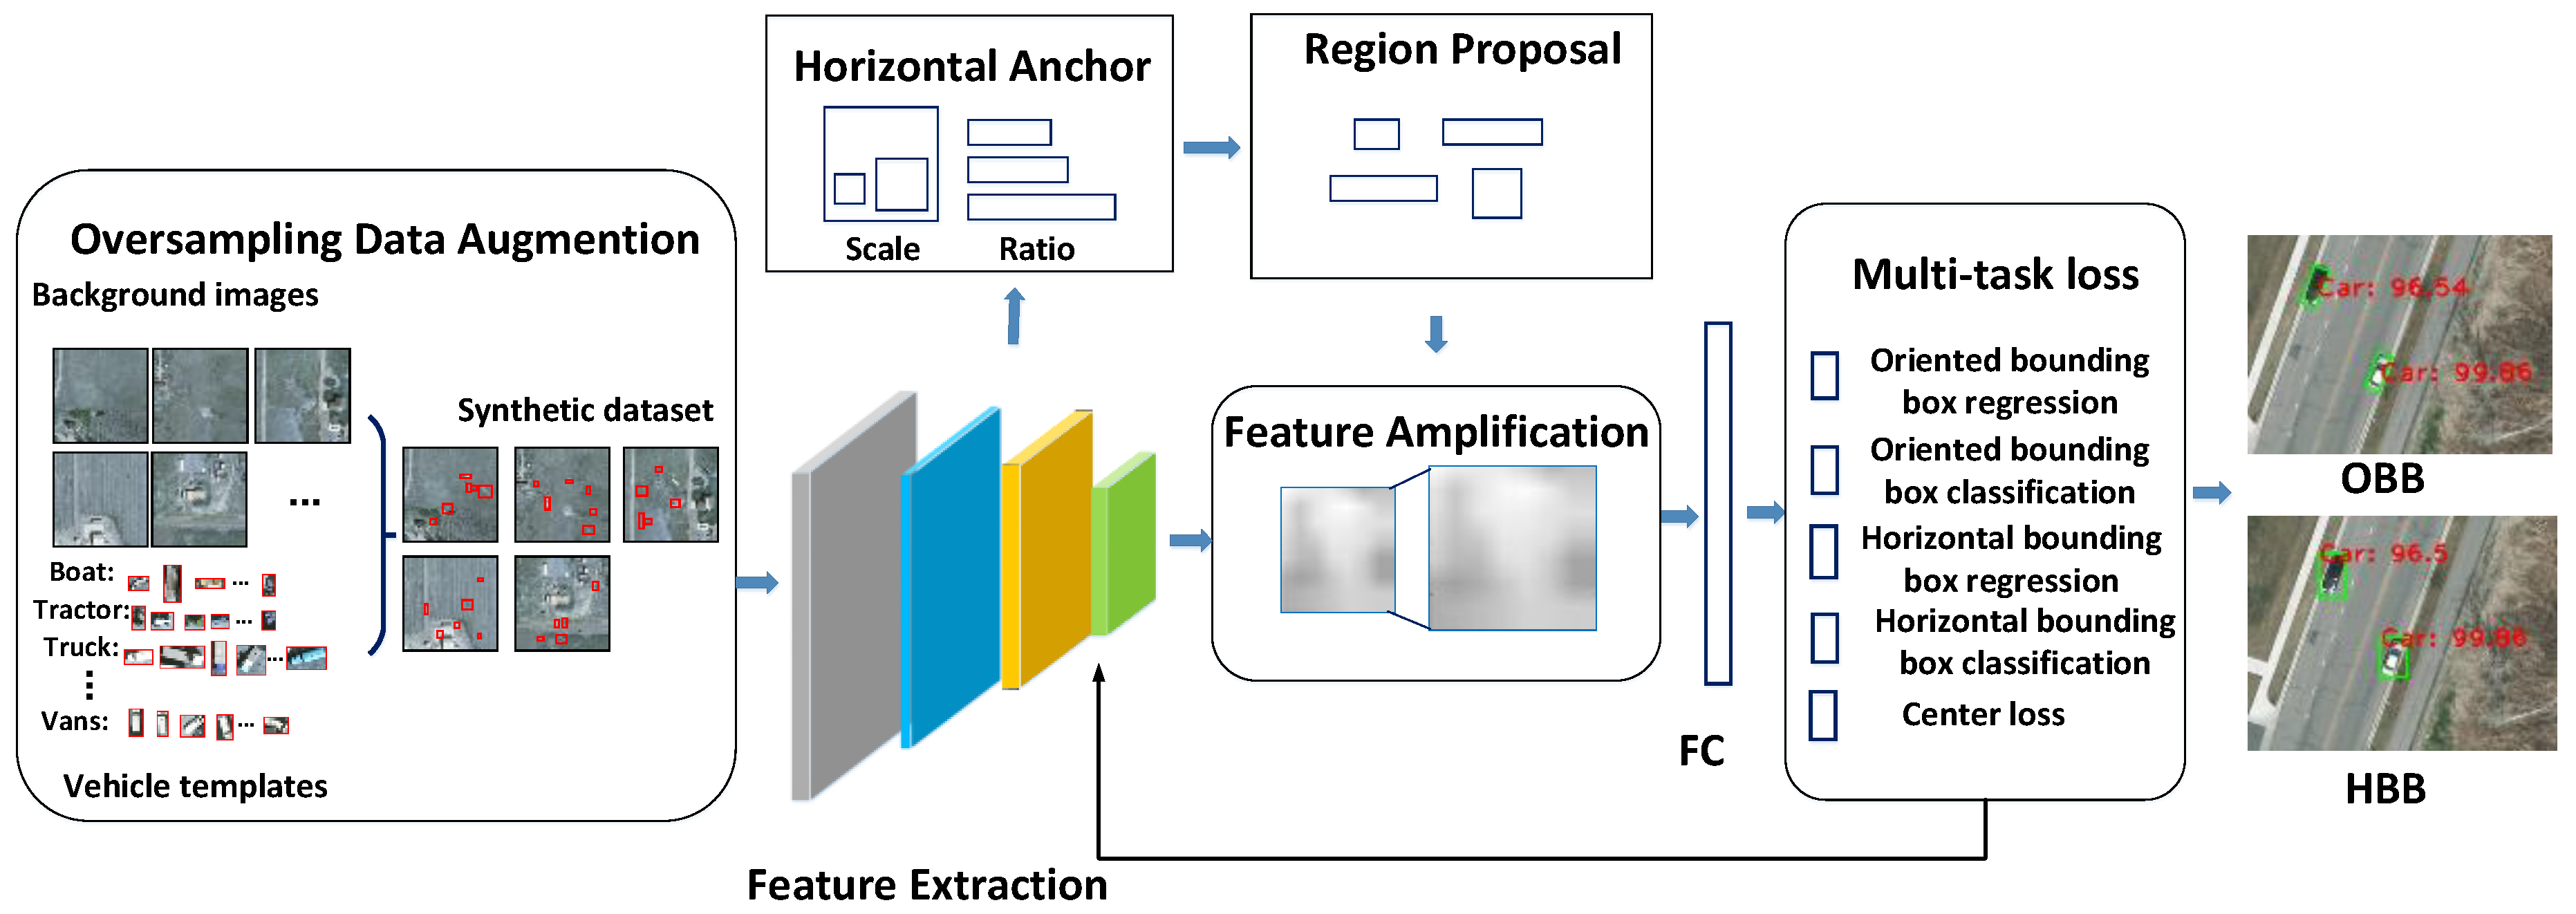
Figure 3 depicts the overall structure of the algorithm. The basic feature extractor in the proposed framework is the Resnet101 [
38]. The proposed framework mainly consists of three parts, (1) Oversampling and stitching data augmentation, (2) Enlarging feature maps and (3) A joint training loss function combined with center loss for horizontal and oriented bounding boxes. Each step can be illustrated as follows.
First of all, we perform oversampling and stitching data augmentation on the training dataset by increasing the frequency of vehicles with fewer number of training data to synthesize a new dataset.
In the stage of RPN, we set up multi-scale and multi-shape horizontal anchors and select positive and negative samples for training a RPN network, by calculating the overlap between anchors and ground truths.
In the stage of classification, we amplify the feature map for increased ability of feature maps to represent vehicles. Considering the orientation of vehicles, we propose a multi-task loss function, which jointly trains oriented and horizontal bounding boxes, and introduces the center loss to decrease within-class difference.
3.2. Data Augmentation for Foreground-Foreground Imbalance Problem by Oversampling and Stitching
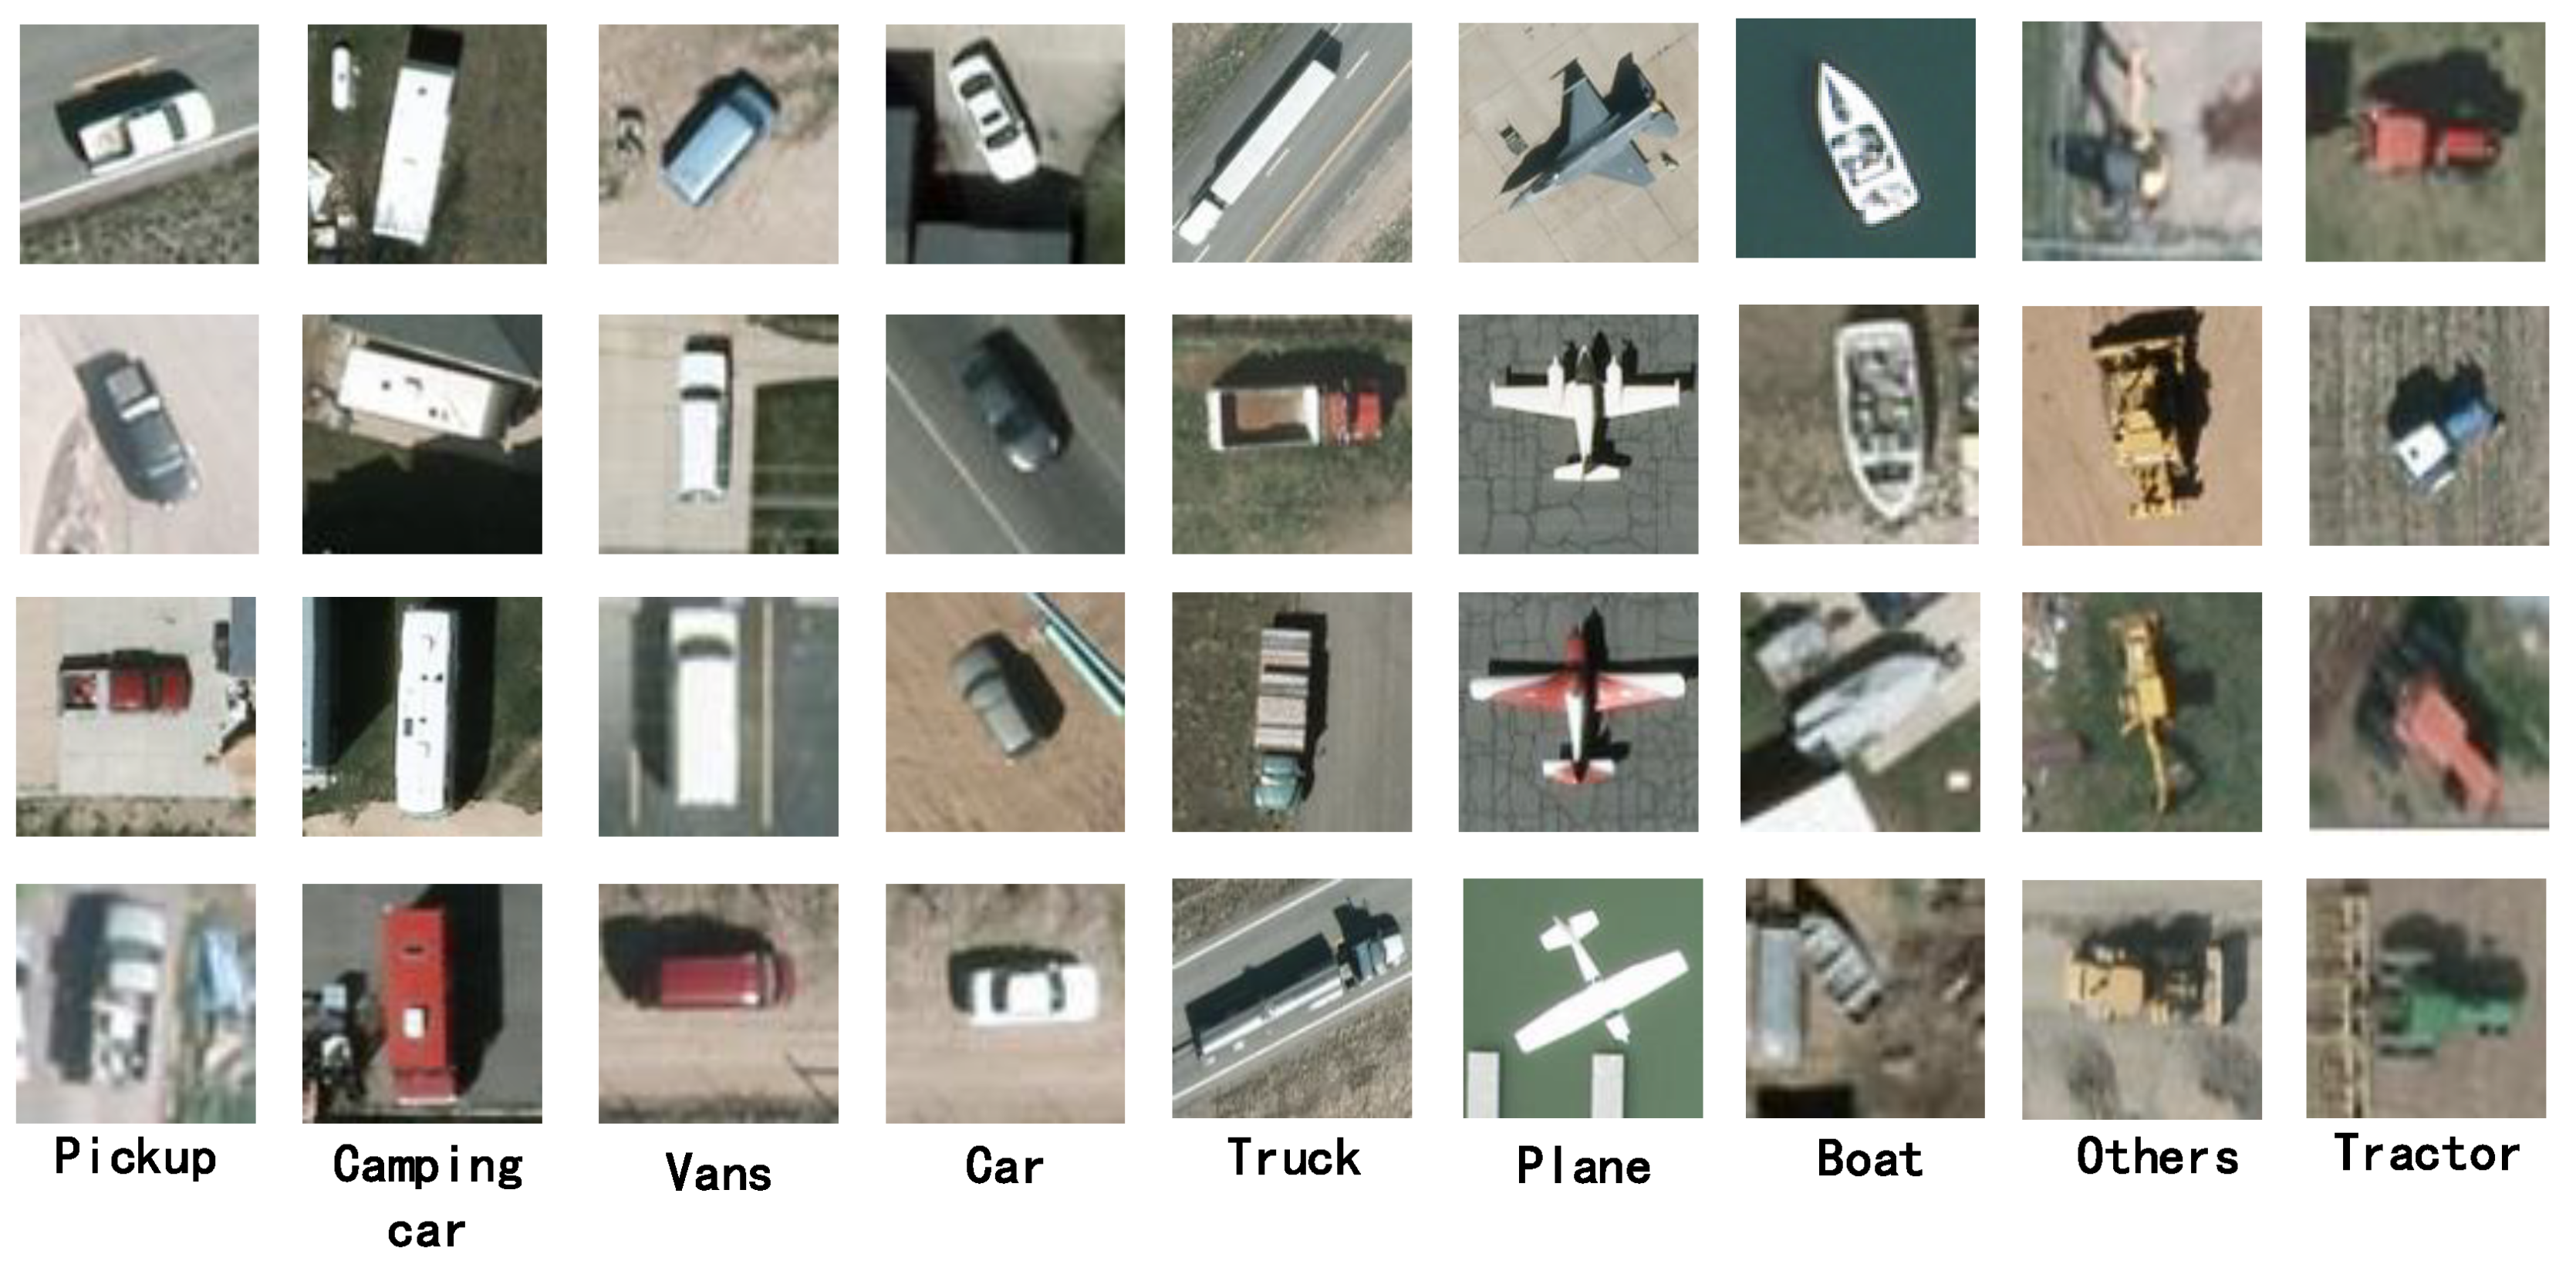
Motivation of data augmentation by oversampling and stitching. The proposed data augmentation method is aimed to address the foreground-foreground category imbalance problem. It is a common problem in vehicle detection since the frequency and location of different types of vehicles in aerial images are random. When there exists large quantity variance between diverse vehicles, objects may be over-presented or under-represented in the training process.
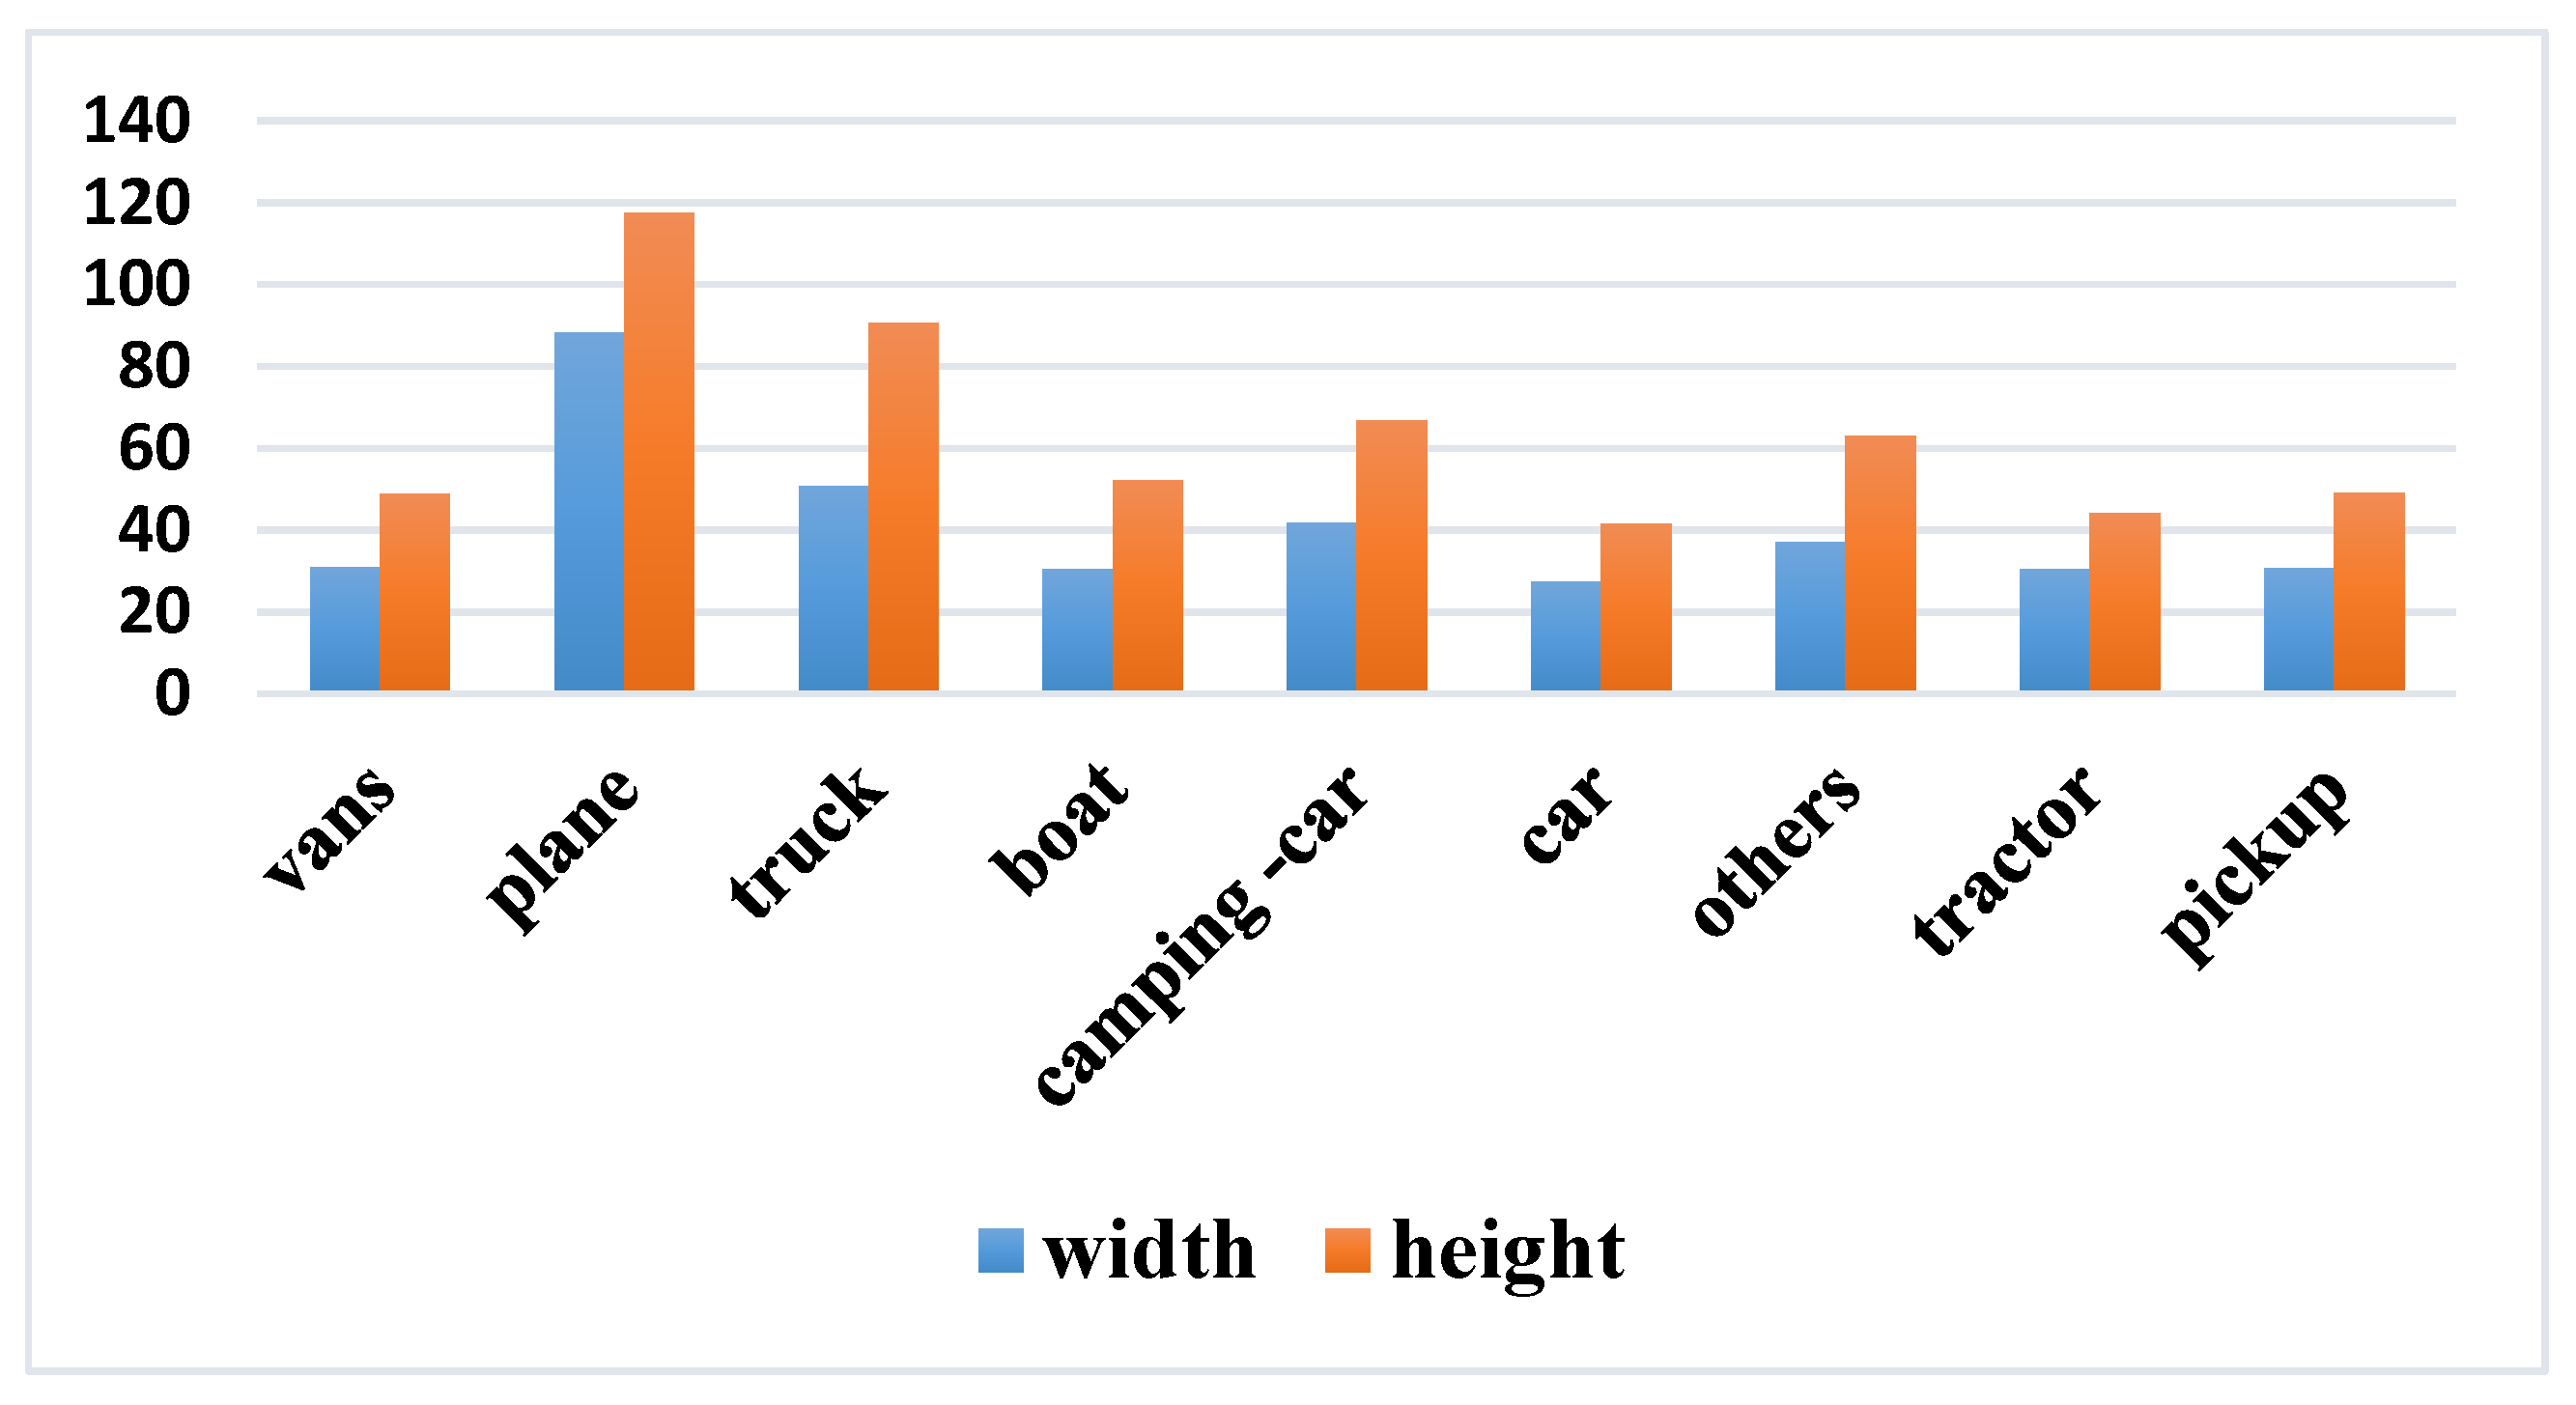
Two factors contribute to the foreground-foreground category imbalance, namely the imbalanced category distribution in a dataset and that within a batch of samples. We have counted the number of 9 types of vehicles in the VEDAI dataset.
Table 1 describes the statistical results according to a descending order of vehicle number.
The above statistical results show that there exists a serious foreground-foreground category imbalance in the VEDAI dataset, which will negatively affect the detection results of vehicles with a small number of samples. In addition, vehicles occupy less image areas, and the vehicles with lower frequency usually have fewer matched anchors, which may increase the difficulty to learn useful information from the network.
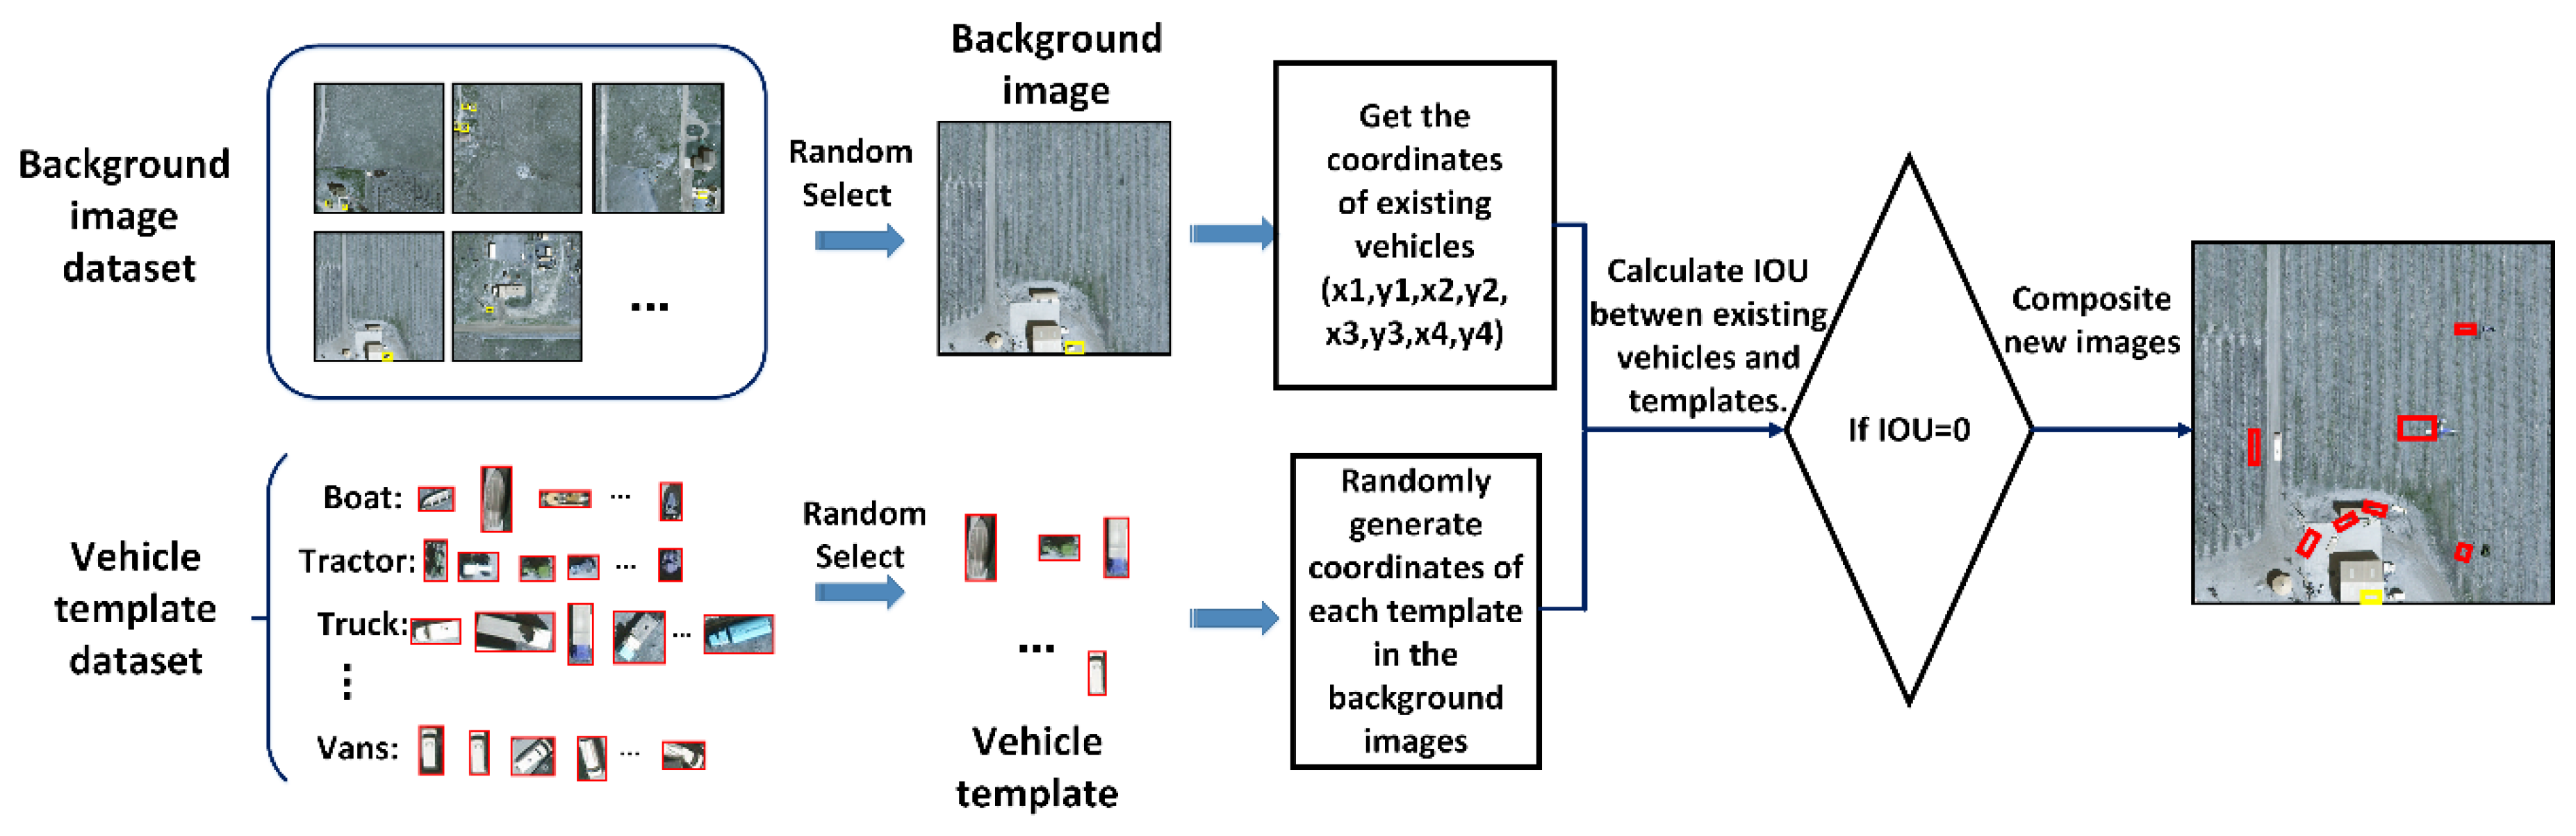
Considering that each image contains only a small number of vehicles and backgrounds are with a large image area, this paper designs a data augmentation method based on oversampling and stitching in order to decrease the impact of foreground-foreground imbalance on the training process. The central idea of the proposed method shown in
Figure 4 can be illustrated as follows.
Step 1: Augment the original training images by rotating them with angles of 90°, 180°, 270° to generate the rotation dataset ensuring the diversity of object direction.
Step 2: Segment each vehicle from the rotation dataset in Step 1 according to the type and location of vehicles in order to establish the vehicle template dataset. Meanwhile, considering that vehicles in each image occupy only a small area, the images in the rotation dataset with less 10 vehicles are selected as the background image dataset.
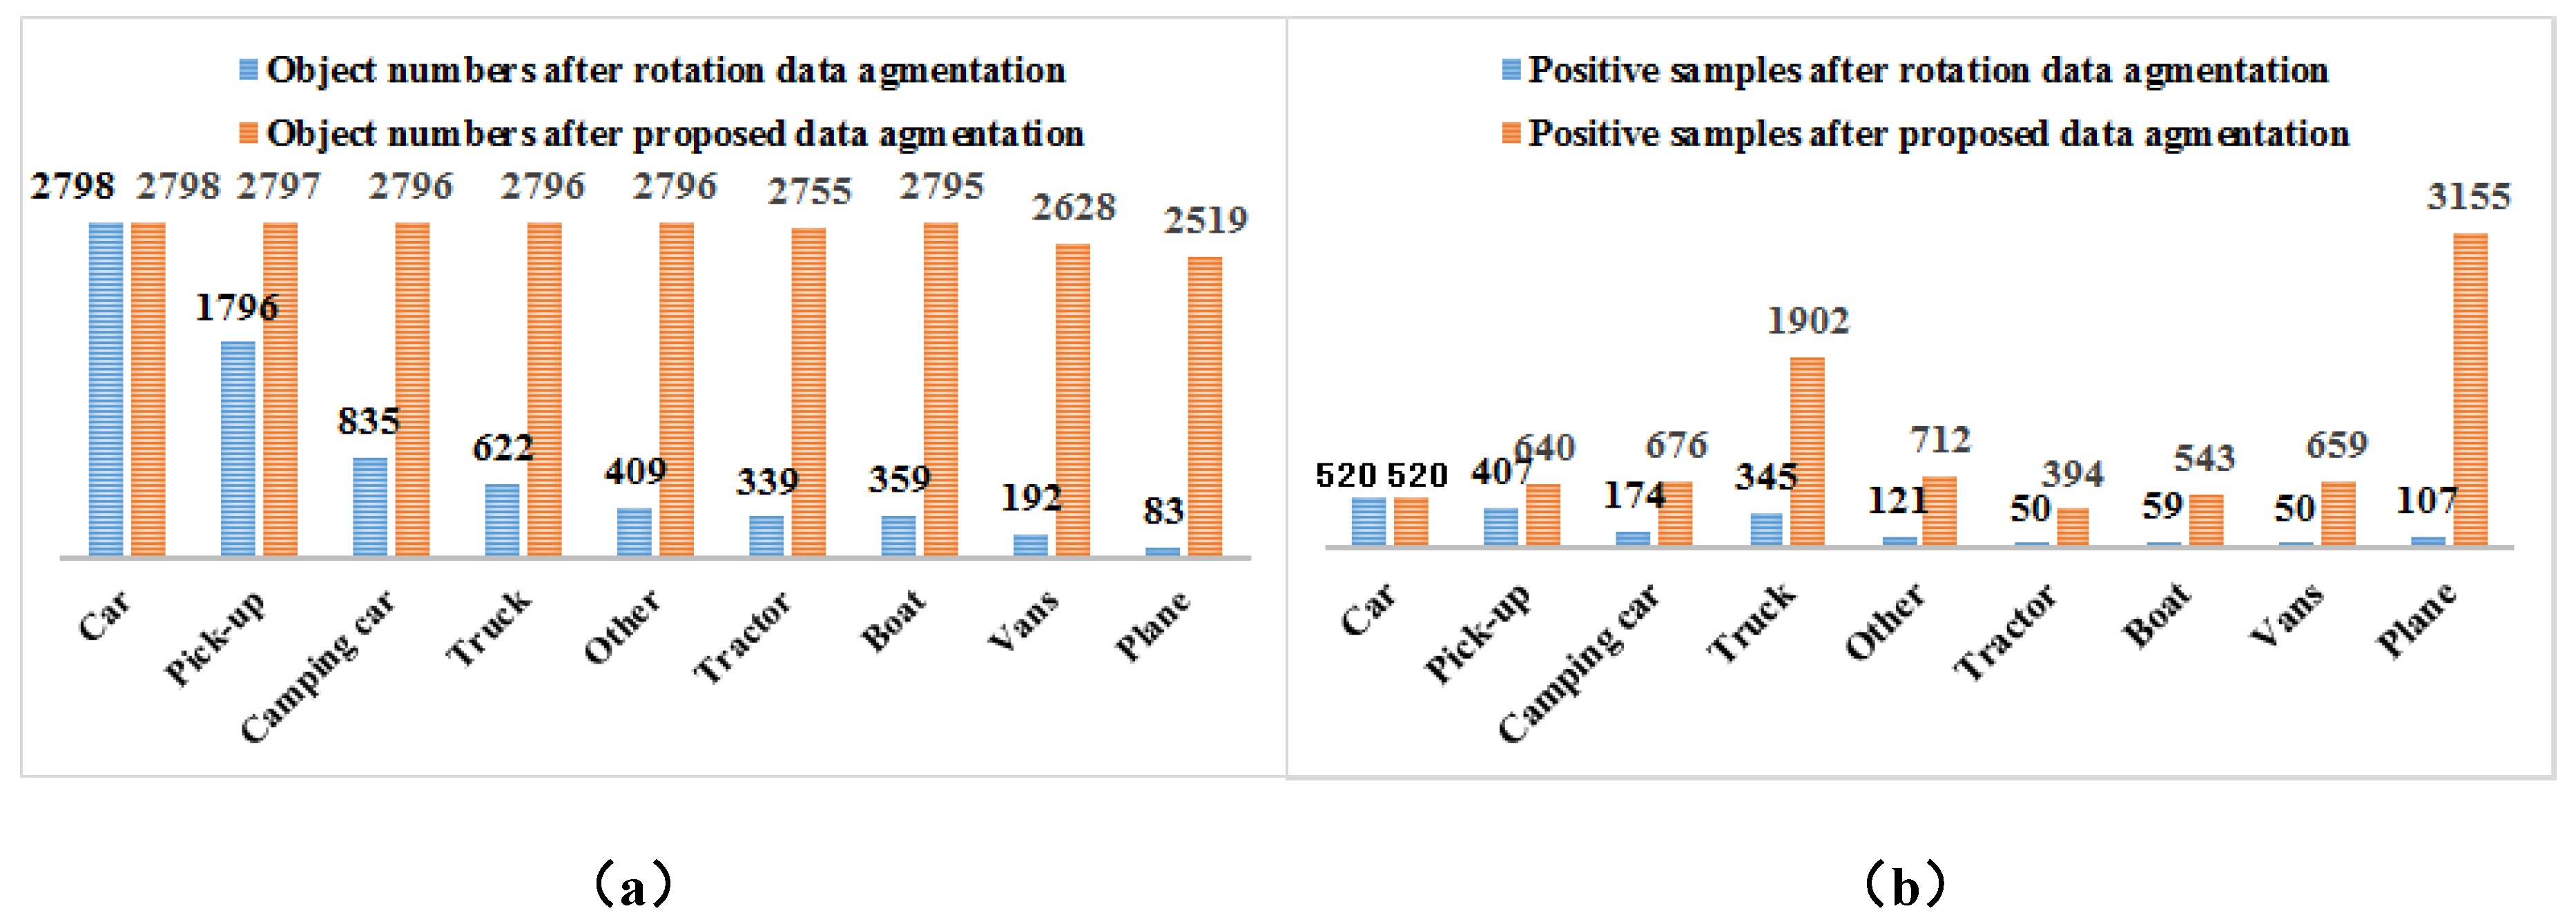
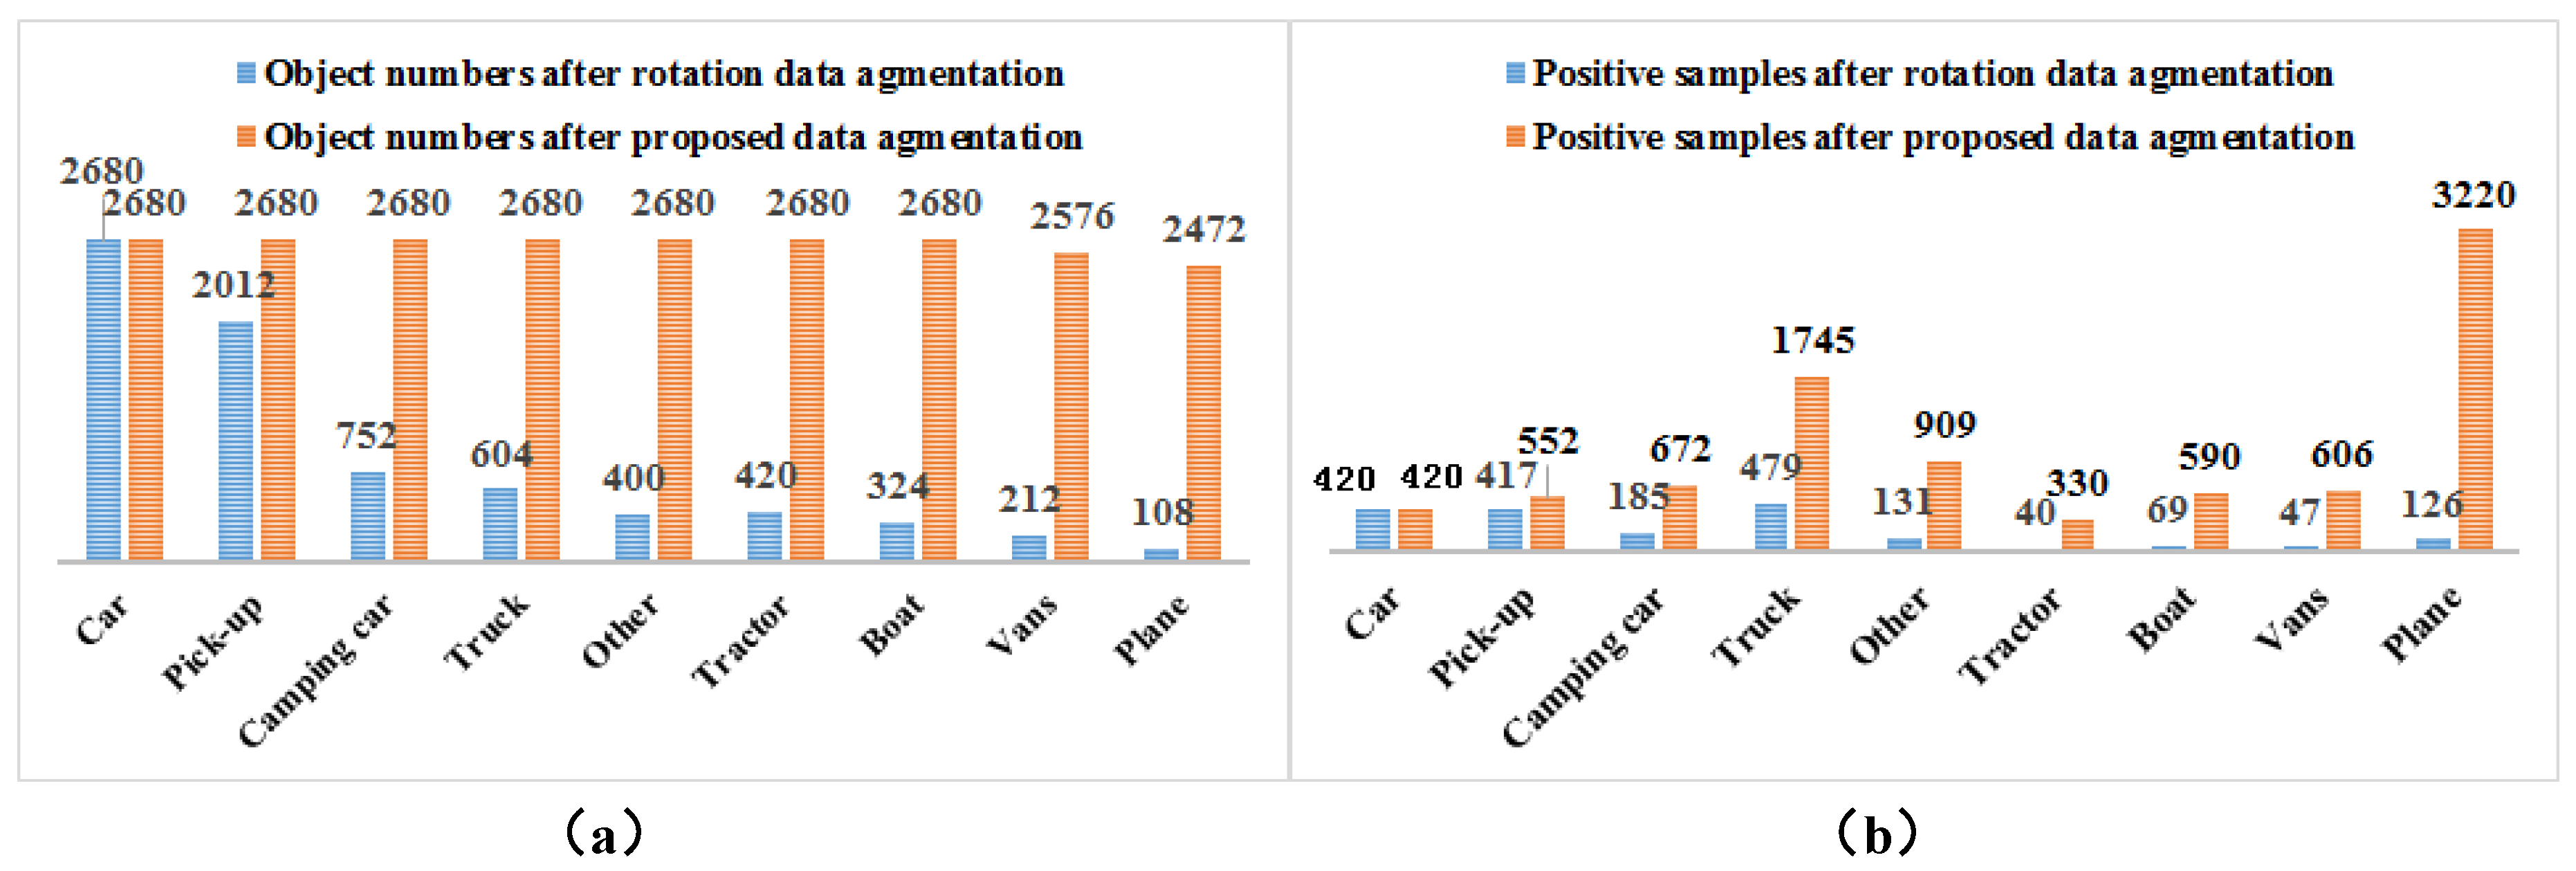
Step 3: Count the number of vehicles in each category in the rotation dataset. We take the most numerous type as an expansion benchmark. In order to keep a balance between the quantities of vehicles, the number of vehicles in each category to be augmented should be calculated.
Step 4: For each type of vehicles, certain number of images from the background dataset and a random vehicle from the template dataset are used to synthetize the new training images. We try to make each synthetized image include all types of vehicles to reduce the imbalanced distribution of the samples within a training batch.
Step 5: Considering the random location of vehicles in the geographic space, randomly generate the position of the vehicles in the background images. In order to avoid repetition, we calculate whether there is an overlap between positions of newly generated vehicles and those of original vehicles in the image. When the overlap is 0, image synthesis is performed. The gray values of generated vehicles replace those of original pixels in the background image.
Step 6: Repeat Steps 4 and 5 until the number of vehicles from different categories in the training dataset is balanced.
3.3. Amplification of Deep Features for Small Objects
Motivation of deep feature amplification. The pooling operations can decrease the number of deep neural network parameters but may lose the details of feature maps for small objects. Feature amplification can enlarge the deep feature map and restore the detailed information of the feature map. We use bilinear interpolation in the last feature map to increase the capability of features in representing small objects with more simple operations.
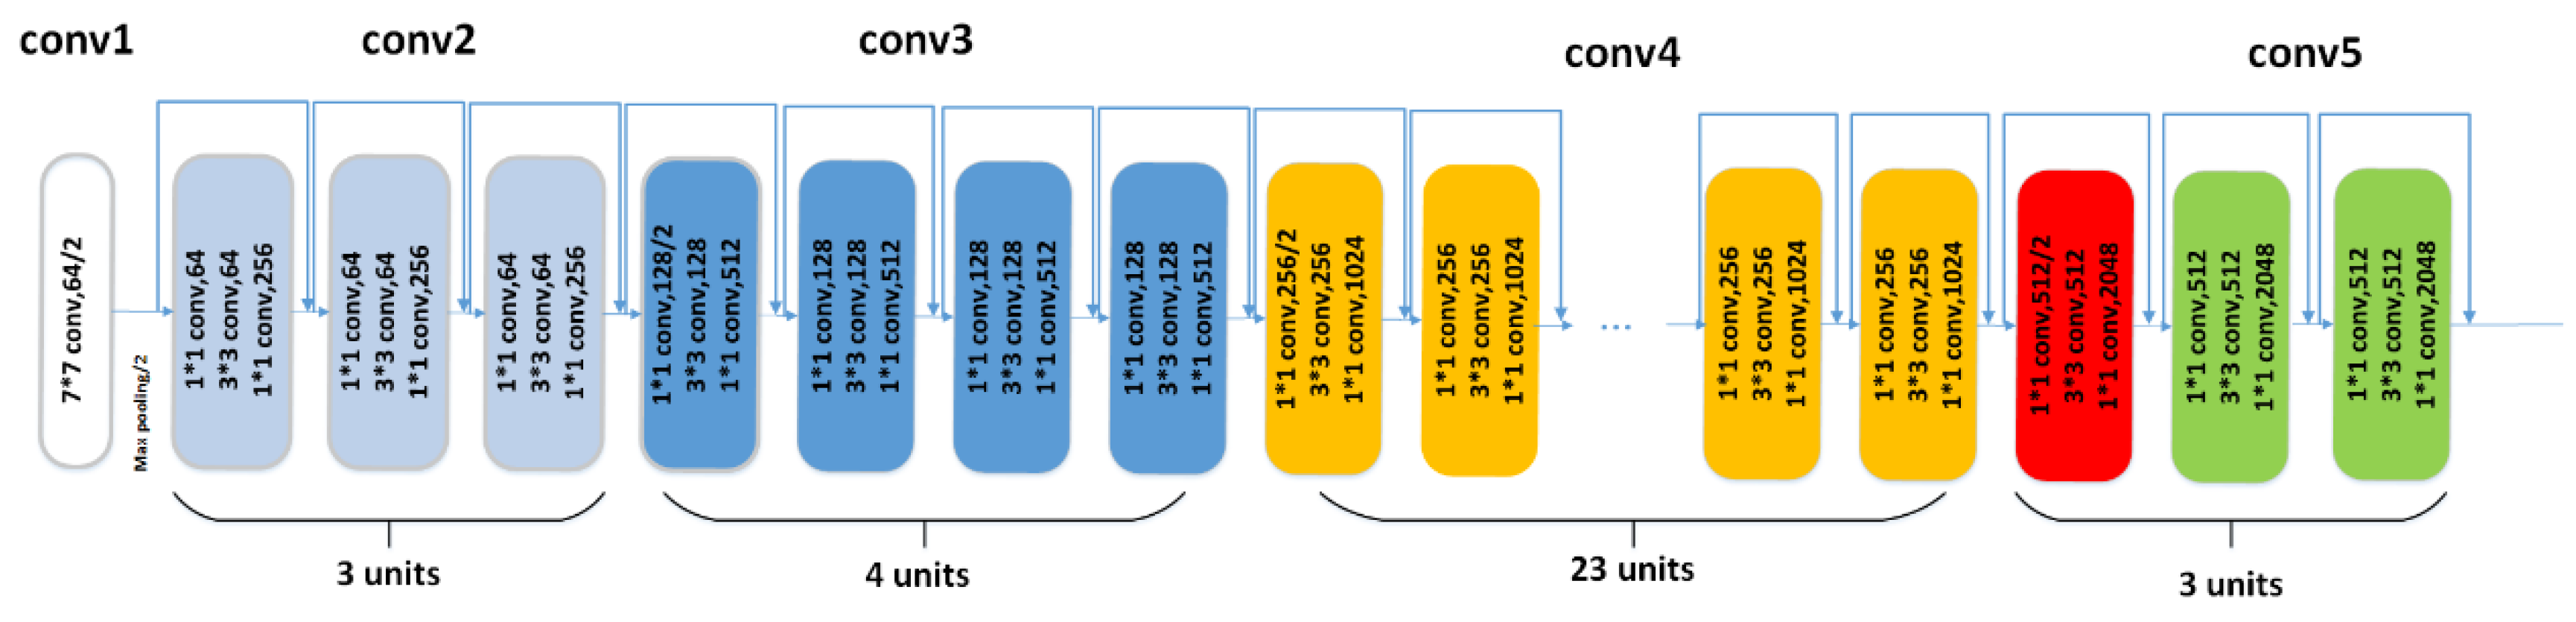
Resnet101 is the backbone for feature extraction in this paper.
Figure 5 shows the structure of Resnet101 including four pooling operations. If a vehicle with the size of 32 × 32 pixels undergoes 4 pooling operations, the corresponding feature map size is 2 × 2 pixels. However, feature map of 2 × 2 pixels cannot fully describe the information of a vehicle. The differences between appearances of vehicles from different types are relatively small. The detailed information of the feature map plays a very important role in distinguishing vehicles. Therefore, we propose to perform amplification operation to the feature maps and increase the discriminative ability of features for vehicles.
There are usually two main methods for upsampling feature map, interpolation and deconvolution. However, deconvolution usually produces checkboard artifacts, which is not conducive to the detailed description of features. Therefore, we adopt interpolation to enlarge the feature image. Here, we use bilinear interpolation to amplify the last feature map. The bilinear interpolation can be illustrated as follows.
Assume that the original feature map size is w ∗ h pixels and the enlarged feature map size is W ×H pixels. It is known that each pixel value in the original feature maps and enlarged feature maps is
and
respectively. If you want to get the pixel value of the point
, you need to get pixel values corresponding to the original feature map
according to the ratio of enlargement. As shown in Equation (1), if the calculated position is not an integer, you need to interpolate the pixels
in the original image and assign them to the enlarged pixels
.
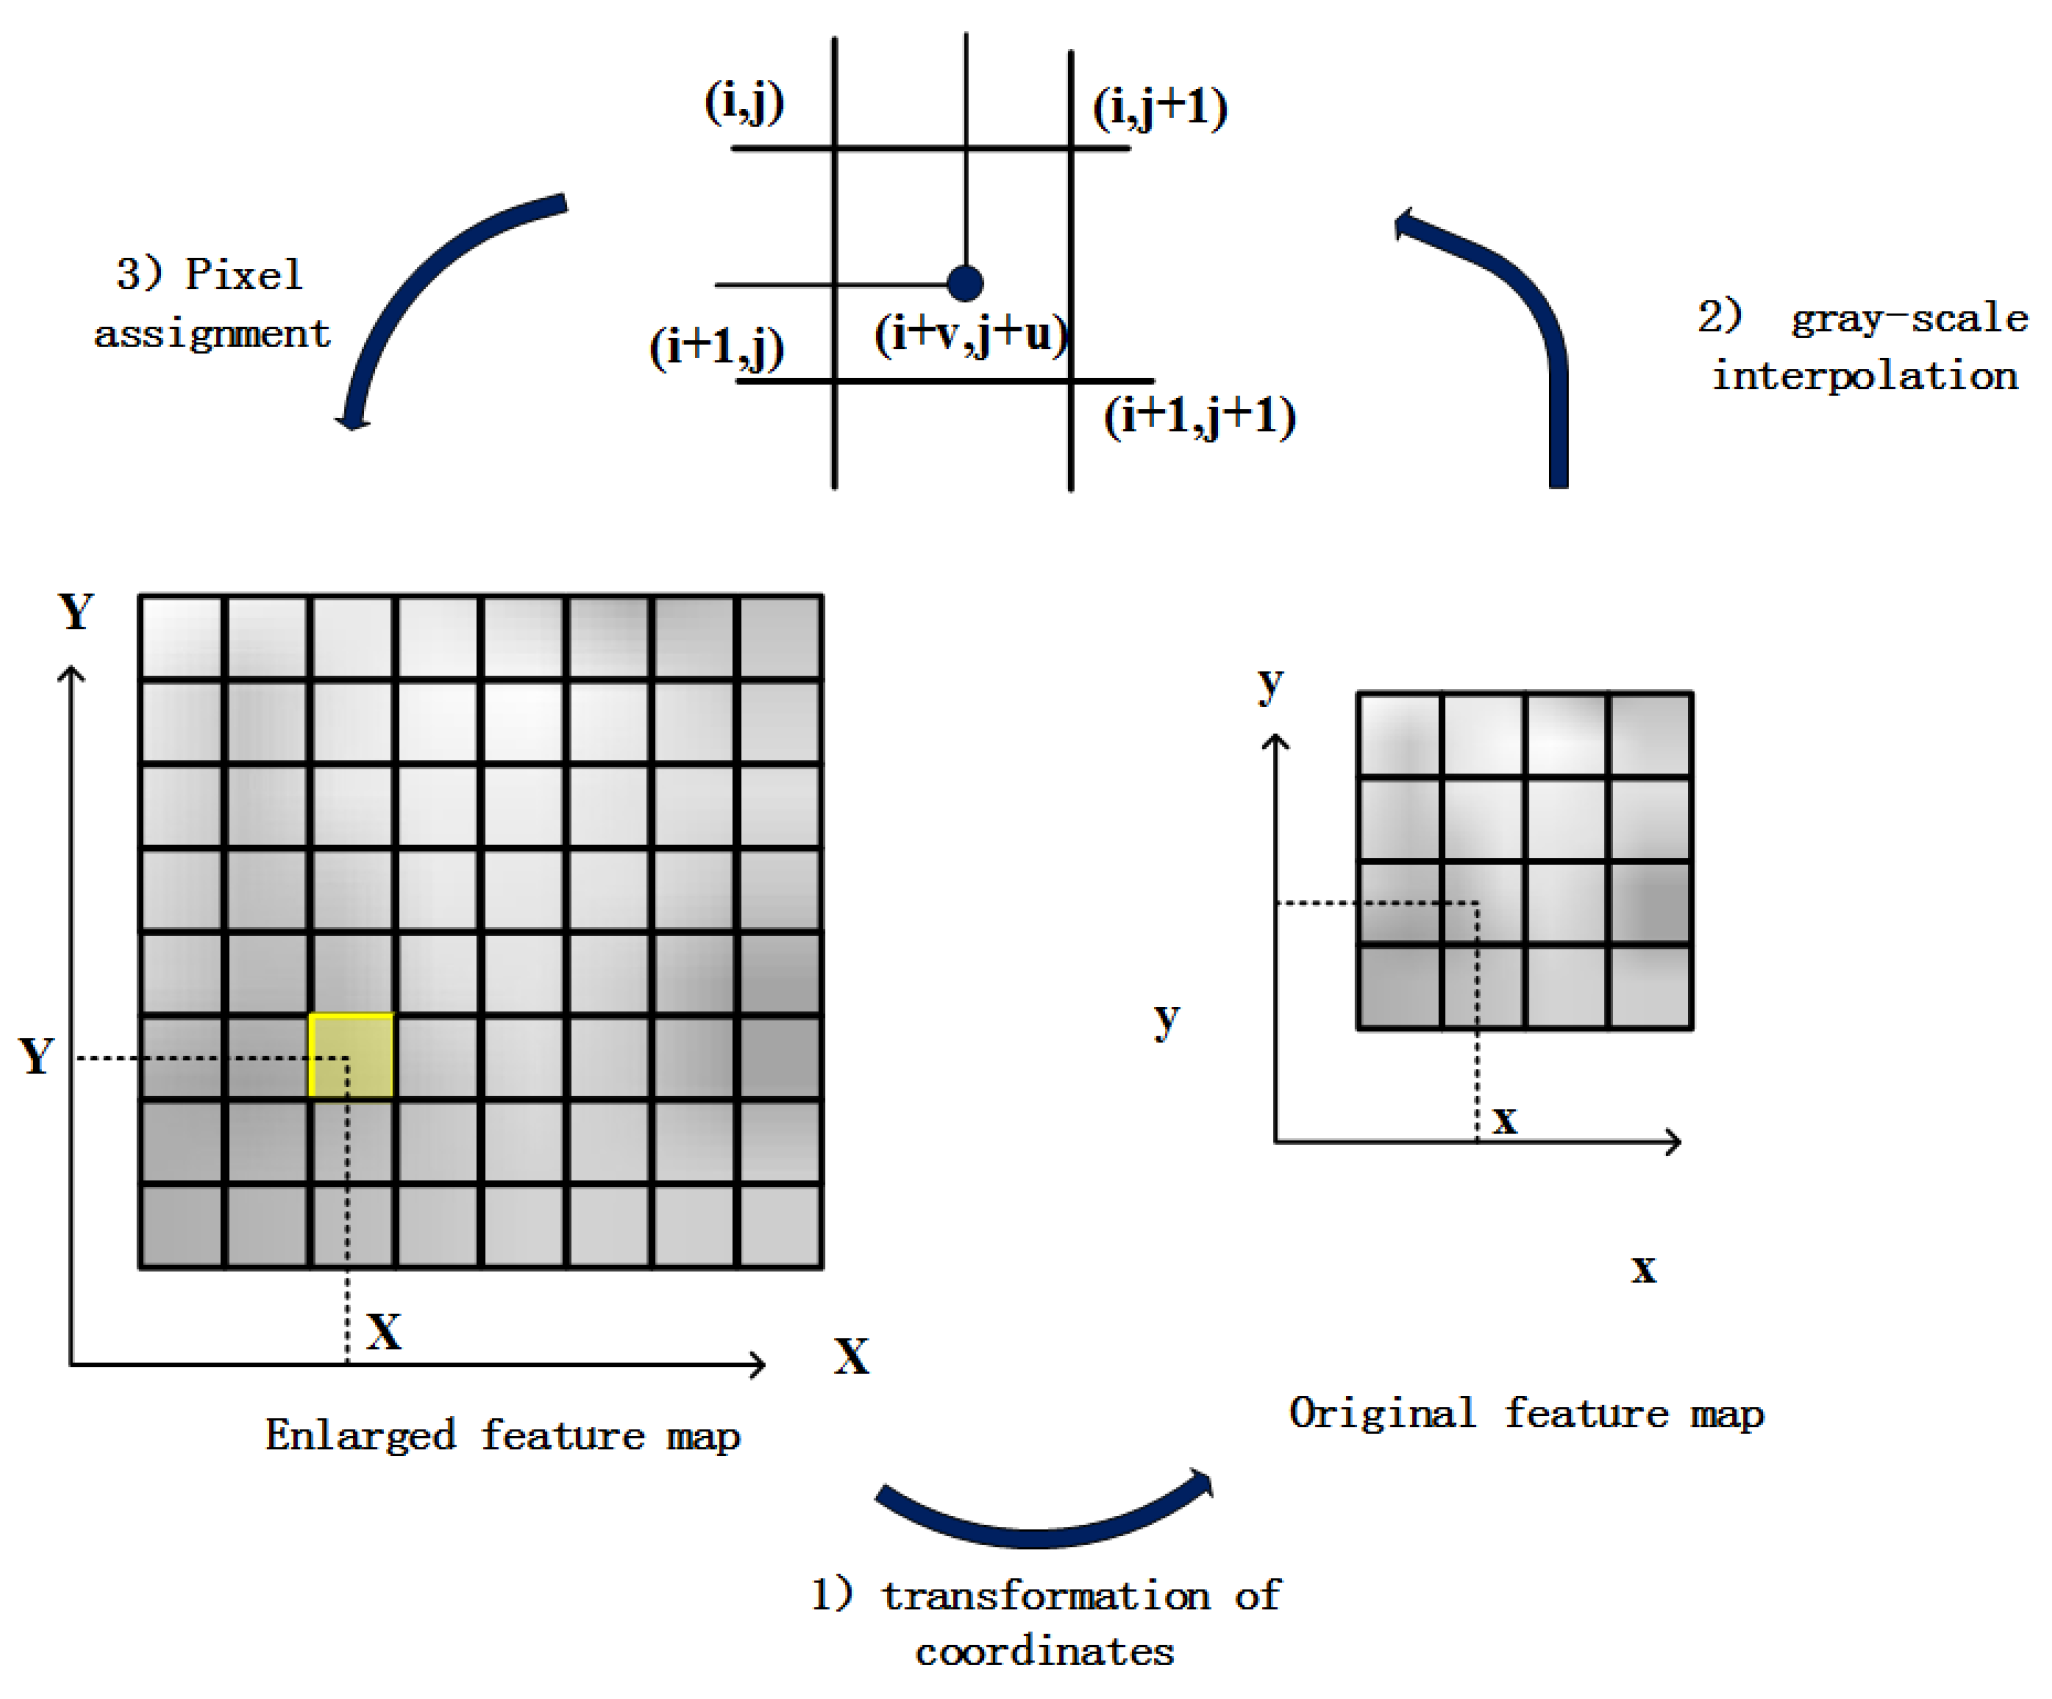
As shown in
Figure 6, the central idea of bilinear interpolation is to get the final pixel values to be interpolated by four adjacent points
next to the central pixel for linear interpolation in the vertical and horizontal directions. Suppose that the float coordinates of the pixel to be interpolated are
, where
i,
j are the integer part of the coordinate, and u, v are the decimal part of the coordinate whose range is [0, 1). Then the pixel value to be interpolated
can be determined by the corresponding values of the four surrounding pixels
,
,
,
. The pixel value of the point to be interpolated is shown in Equation (2). Where
represents the pixel values of the location
in the original image.
3.4. Multi-Task Loss Function for Joint Horizontal and Oriented Bounding Boxes
Motivation of multi-task loss function. Multi-task loss function is aimed to detect horizontal and oriented vehicles simultaneously by combining the loss of horizontal bounding boxes with that of oriented bounding boxes. In addition, vehicle detection is a difficult problem due to diversity in object representation and small difference between different vehicles. Therefore, we also introduce center loss to the multi-task loss function to improve the discriminative ability of the features.
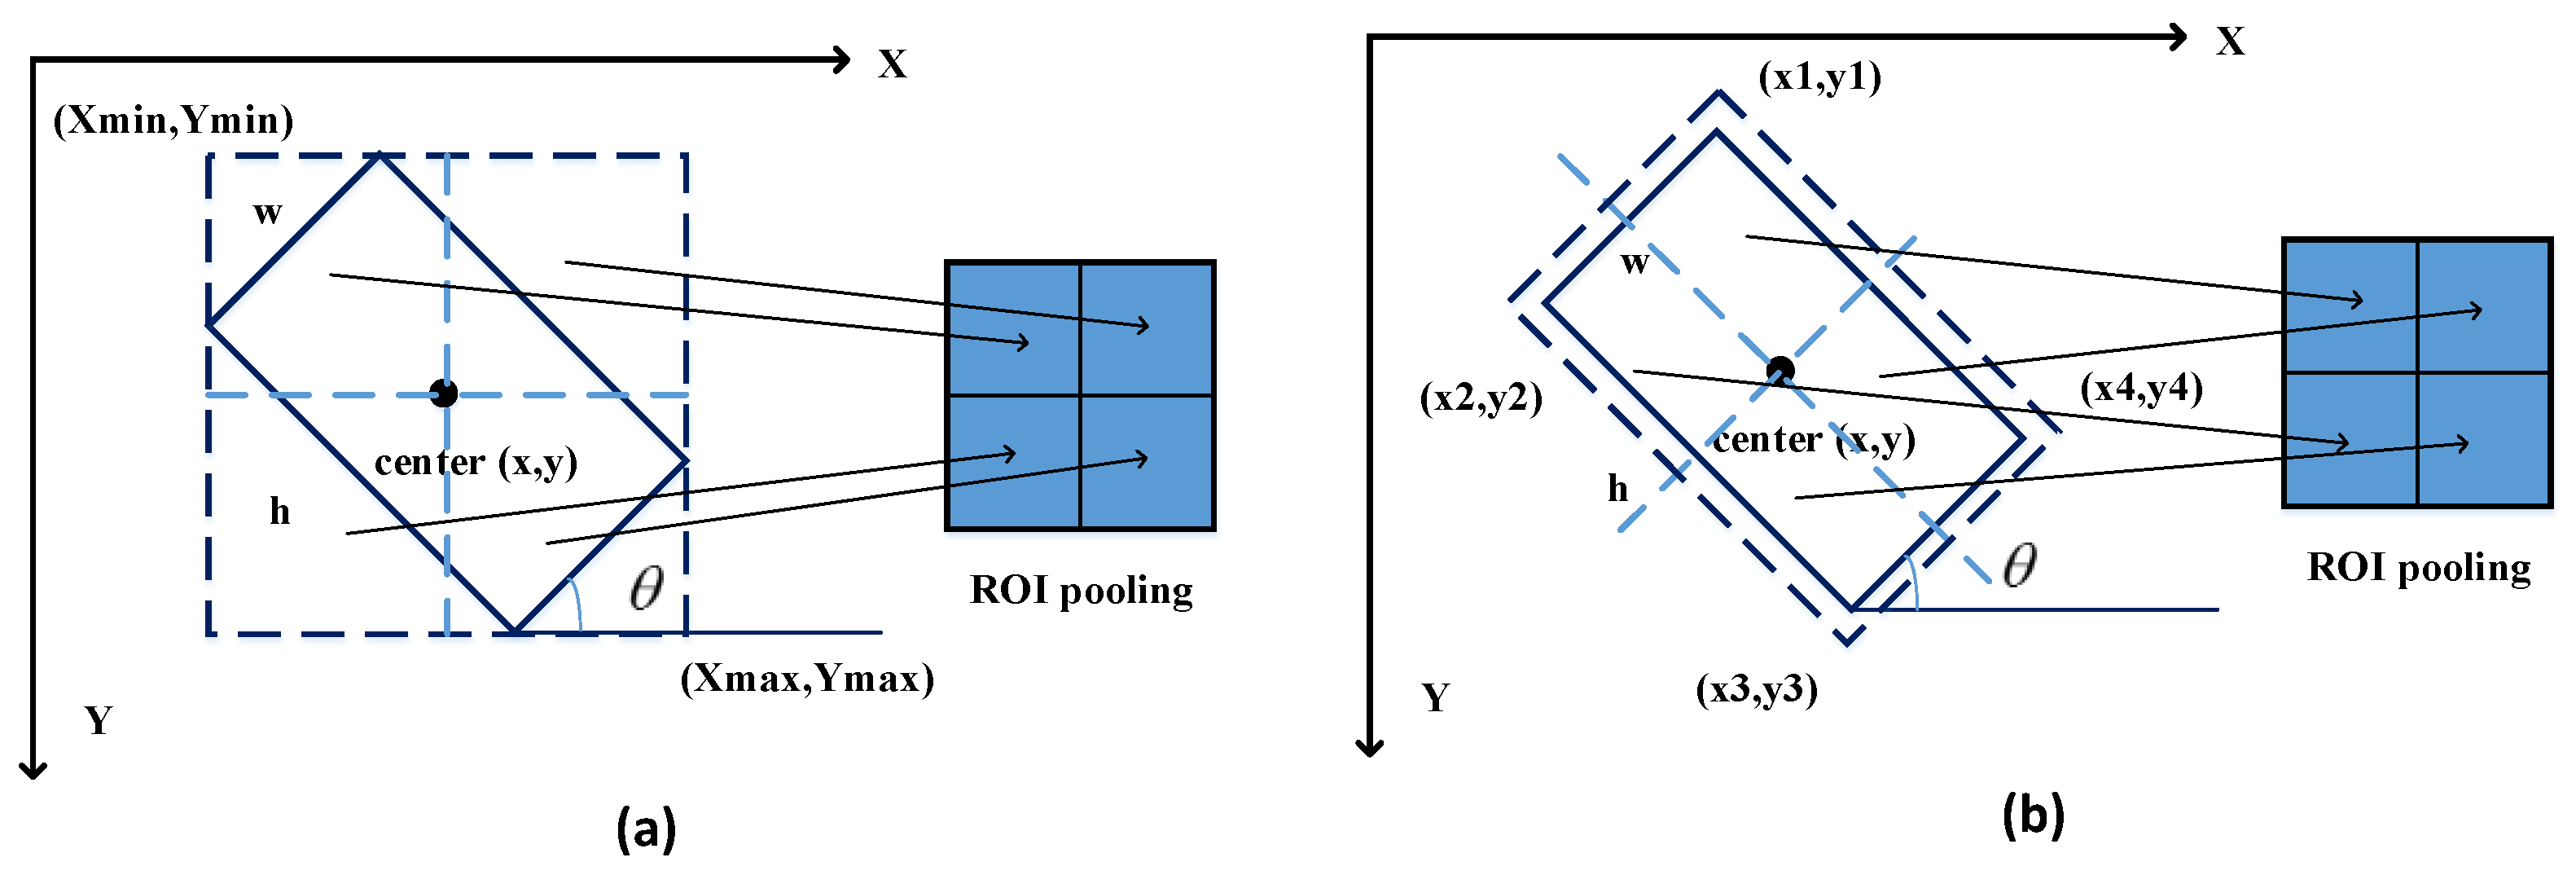
Traditional object detection methods usually use horizontal bounding boxes to describe the position of the objects. However, vehicles on aerial images are usually with arbitrary oriention. For a oriented vehicle, we can describe the position more accurately by describing the coordinates of its four corners .
As shown in
Figure 7, when detecting an object that contains direction information, two types of anchors are usually used [
39], namely horizontal anchors and oriented anchors. The horizontal anchor contains more contextual information around objects than oriented anchor in the ROI pooling, which can assist the object recognition. Therefore, the horizontal anchor rather than oriented anchor is adopted in the article.
As shown in Equation (3), the proposed loss function consists of 5 parts, namely the cross-entropy loss of oriented objects
in Equation (4), the cross-entropy loss of horizontal objects
in Equation (5), the location loss function of the oriented objects
and the horizontal objects
in Equation (6) and center loss function
in Equation (11).
are the balance parameters.
In terms of classification, and are the probabilities that predicted horizontal and oriented bounding boxes belong to each category respectively; and are true categories of the horizontal and oriented bounding boxes respectively.
In the process of location regression, we convert four corners to the
in order to describe the position of oriented vehicles, where
represents the coordinates of vehicle center,
represents the width and height of vehicles and
is the degrees from the horizontal perspective. For the horizontal bounding boxes,
represents the offset vector between true bounding boxes and positive anchors composed of
. For the oriented bounding boxes,
consists of
.
represents the corresponding predicted coordinate vector. In Equations (7) and (8),
represent the true bounding box, anchor, and predicted box respectively.
y,
w,
h,
θ can be represented in a way similar to
x.
We introduce center loss as shown in Equation (9) to decrease within-class differences existing in features, and increase the ability of features in distinguishing diverse vehicles.
where
m is the batch size in the object classification stage,
is the feature center of the
y-th category and
is the features before the fully connected layer.


