Article

NOx Emission Flux Measurements with Multiple Mobile-DOAS Instruments in Beijing

1
Key Laboratory of Environmental Optics and Technology, Anhui Institute of Optics and Fine Mechanics, Hefei Institutes of Physical Science, Chinese Academy of Sciences, Hefei 230031, China
2
University of Science and Technology of China, Hefei 230026, China
3
CAS Center for Excellence in Regional Atmospheric Environment, Institute of Urban Environment, Chinese Academy of Sciences, Xiamen 361000, China
4
Chinese Academy of Meteorological Science, Beijing 100081, China
5
Beijing Municipal Climate Center, Beijing 100089, China
*
Author to whom correspondence should be addressed.
Remote Sens. 2020, 12(16), 2527; https://doi.org/10.3390/rs12162527
Submission received: 2 June 2020 / Revised: 31 July 2020 / Accepted: 3 August 2020 / Published: 6 August 2020
(This article belongs to the Section Atmospheric Remote Sensing)

Abstract

:
NOX (NOX = NO + NO2) emissions measurements in Beijing are of great significance because they can aid in understanding how NOX pollution develops in mega-cities throughout China. However, NOX emissions in mega-cities are difficult to measure due to changes in wind patterns and moving sources on roads during measurement. To obtain good spatial coverage on different ring roads in Beijing over a short amount of time, two mobile differential optical absorption spectroscopy (DOAS) instruments were used to measure NOX emission flux from April 18th to 26th, 2018. In addition, a wind profile radar provided simultaneous wind field measurements for altitudes between 50 m and 1 km for each ring road measurement. We first determined NOX emission flux of different ring roads using wind field averages from measured wind data. The results showed that the NOX emission flux of Beijing’s fifth ring road, which represented the urban part, varied from (19.29 ± 5.26) × 1024 molec./s to (36.46 ± 12.86) × 1024 molec./s. On April 20th, NOX emission flux for the third ring was slightly higher than the fourth ring because the two ring roads were measured at different time periods. We then analyzed the NOX emission flux error budget and error sensitivity. The main error source was the wind field uncertainty. For some measurements, the main emission flux error source was either wind speed uncertainty or wind direction uncertainty, but not both. As Beijing’s NOX emissions came from road vehicle exhaust, we found that emission flux error had a more diverse sensitivity to wind direction uncertainty, which improved our knowledge on this topic. The NOX emission flux error sensitivity study indicated that more accurate measurements of the wind field are crucial for effective NOX emission flux measurements in Chinese mega-cities. Obtaining actual time and high resolved wind measurements is an advantage for mega-cities’ NOX emission flux measurements. The emission flux errors caused by wind direction and wind speed uncertainties were clearly distinguished. Other sensitivity studies indicated that NOX/NO2 ratio uncertainty dominated flux errors when the NOX/NO2 ratio uncertainty was >0.4. Using two mobile-DOAS and wind profile radars to measure NOx emission flux improved the quality of the emission flux measuring results. This approach could be applied to many other mega-cities in China and in others countries.

Graphical Abstract

1. Introduction

Nitrogen oxides (NOX, NOX = NO + NO2) is an important trace gas in the atmosphere [1]. It plays a key role in atmospheric chemical reactions and easily produces air pollution with excessive emissions [1,2]. China’s rapid economic development in the 21st century has been accompanied by serious environmental pollution, especially air pollution [2,3,4,5,6,7,8]. Haze pollution events occur frequently in Jingjinji (Beijing, Tianjin, and Hebei province) due to the excessive emissions of NOx, sulfur dioxide (SO2), and volatile organic compounds (VOCs) [9]. The project of the Jingjinji area air pollution control was launched in April 2017, led by the National Air Pollution Prevention and Control Association, China (NAPCA). Several research efforts have been dedicated to the study of pollution causes and control measures to prevent air pollution events [6,7,8,9,10]. According to the campus of Peking University, the nitrate formation of PM2.5 was evident in the haze pollution of Jingjinji in 2014. The ratio of nitrates in PM2.5 in Jingjinji obviously increased because of sulphate emission reduction [9]. NOX is now a major source of inorganic pollutants in the Jingjinji area.
Urbanization has significantly increased NOX emissions from vehicles in Chinese mega-cities. Beijing, a typical mega-city in China, has no factories in its downtown area, except for a power plant near the east side of the fifth ring. The power plant emits little NOX due to the region’s strict gas pollution control policies. Hence, most of the NOX emissions can be attributed to road vehicles. Figure 1 presents annual NOX emissions of vehicle emissions and the ratio of vehicle NOX emissions compared to the total NOX emissions in Beijing from 2011 to 2017. Due to the implementation of traffic control policies, the NOX emission flux emitted by vehicles decreased from 2011 to 2014 and from 2015 to 2016. However, the NOX emissions from vehicles are increasing year by year (nearly 85% in 2017). This happens in other mega-cities such as Shanghai and Guangzhou. Studying the mega-cities’ NOX emissions from vehicles has great significance for air pollution control.
Differential optical absorption spectroscopy (DOAS) is a remote sensing technique developed in the 1970s and used for measuring atmospheric gases [11,12]. The DOAS technique is widely applied to measure trace gases [13,14,15]. An important application of the DOAS method is to measure the gas emission flux, such as NOx and SO2, using the close integral method (for area emitters) and the flow rate method (for point sources) [16,17]. Mobile-DOAS uses sunlight as its light source and places a DOAS instrument on a mobile platform, which is a technological improvement for the technique. This platform can be a car or an airplane [18,19,20,21,22]; here, we focus on cars. Mobile-DOAS has been widely used for emission flux measurements and has achieved good results [23,24,25,26,27,28,29,30,31,32]. Previous studies have aimed at point sources [25,26] or area emitting [27,28,29,30,31,32] measurements taken from stationary emission sources. Some studies have also used mobile-DOAS to examine CHIMERE chemistry transport model (CTM) outputs or emission inventories [26,31]. Improvements in the mobile-DOAS measurements quality has been highly requested by the scientific community to enhance the capabilities needed to determine NOx emission fluxes particularly in Chinese mega-cities.
Road vehicles, which are moving sources, are now the main emission sources of NOX in Chinese mega-cities. The large spatial scales of these cities and the predominance of moving sources make NOX emission flux measurements rather complicated for mobile-DOAS. The large spatial scale of these cities leads to two issues: unknown details of NOX emission fluxes in inner cities and the large amount of time needed to take necessary measurements. This directly relates NOX emission flux measurements needed for the high-quality wind field. Moving sources have also introduced a problem: the spatial tropospheric NO2 vertical column density (VCD) distributed along the measurement route has a strong relationship not only to wind field dispersion but also to traffic flow and traffic jams. This indicates that high value VCDs can appear anywhere along roads and that the NOX flux error budget and sensitivity to the wind field might have unexpected differences.
This paper is organized as follows: Section 2 describes the experiments, instruments, and algorithms. In Section 3, the measurement results are presented. Section 4 concentrates on the discussion. In Section 5, the conclusions are presented.

2. Experiment and Methodology

2.1. Experiment Overview

For area emission flux measurements using mobile-DOAS, the close integral method is usually used [30]. Therefore, the ring structure of Beijing is ideal for the mobile-DOAS emission estimations. We chose 4 ring roads (the second ring, third ring, fourth ring, and fifth ring) for these measurements. The mean distance r from the measurement location to the city center was about 4.5 km, 7 km, 10 km, and 15 km for the second ring, third ring, fourth ring, and fifth ring, respectively. Two sets of the same mobile-DOAS model and wind profile radar were selected to perform cooperative measurements. We used DOAS1 and DOAS2 to mark the 2 mobile-DOAS sets. DOAS1 was used to measure the third and fourth ring, and the rest were measured by DOAS2. The wind profile radar provided simultaneous measurements of the wind field. Figure 2 shows the measurements routes and wind profile radar measurement location.

2.2. Mobile-DOAS

2.2.1. Mobile-DOAS Instrument

There are two types of mobile-DOAS instruments: one working in the zenith sky configuration [18] and the other in the multi axis (MAX) configuration [17]. The instruments for our experiment were carefully chosen, as there are many tall buildings in Beijing that can directly act on the sunlight scattering or reflection. The air mass factor (AMF) is also a problem, as it cannot be accurately estimated. Therefore, the application of mobile MAX-DOAS in our experiment is limited. We chose the mobile zenith-sky DOAS and, for simplicity, used the “mobile-DOAS” abbreviation.
The mobile-DOAS consists of several parts. A telescope, placed on the top of the mobile, is used to collect the scattering sunlight from the zenith sky. A spectrometer with a 0.5 nm resolution and a 290–438 nm of spectral range is located inside the temperature stabilization system placed within the car. An optical fiber is used to transmit the sunlight from the telescope to the spectrometer. The other parts include the GPS module used to record the car’s moving trail and a computer to collect the data. The mobile-DOAS system and its measurements principle are outlined in Figure 3.

2.2.2. Retrieval Algorithm

In this study, we used the QDOAS software (version 3.2, 2017) to retrieve the tropospheric NO2 differential slant column density (DSCD) from the measured spectra [33]. All the measured spectra were divided by a Fraunhofer reference spectrum, which was relatively “clean”, and the ring was calculate by DOASIS [34,35]. The absorption cross-sections used in the QDOAS for the 2 mobile-DOAS and fitting window are listed in Table 1. Figure 4 shows a DOAS fitting example for NO2 and the fitting residual.
The tropospheric NO2 VCD taking part in the NOX emission flux calculations is obtained from NO2 DSCD divided for the AMF according to the following formula [17]:
VCD = DSCD trop     DSCD offset ( t i ) AMF trop
where DSCDtrop denotes the tropospheric NO2 DSCD and AMFtrop is the tropospheric AMF.
DSCDoffset(ti) is the difference of the reference SCD and stratospheric SCD, and is a smooth function of time [17]. DSCDoffset(ti) depends on the solar zenith angle (SZA), where the dependence is weak when SZA <80° [17]. The SZA during the measurements was <55°. Therefore, the DSCDoffset(ti) was negligible in our measurements.
AMFtrop can be computed with a radiation transfer model simulation or with geometric approximations [36]. In this study, we performed the Monte Carlo radiative transfer model [37] simulations to determine AMFtrop. The AMFtrop was simulated under different SZA and different aerosol scenarios. The mean NO2 load from national environment observation stations (Dongsi station, Aoti Station, Gucheng station and Wanliu station) in Beijing was about 43 ppb. AMF simulation results indicated that the AMFtrop was typically between 1.05 and 1.4. The higher SZA and higher aerosol, the larger the AMFtrop. Since SZA was less than 45° for most of the measurement time (AMFtrop < 1.3), we applied a typical AMFtrop value of 1.15 with an error of ±0.1.

2.2.3. Retrieval Comparison

We used 2 mobile-DOAS systems to measure the NOX emission flux for the first time. To ensure measurement quality, two retrieval comparisons were performed.
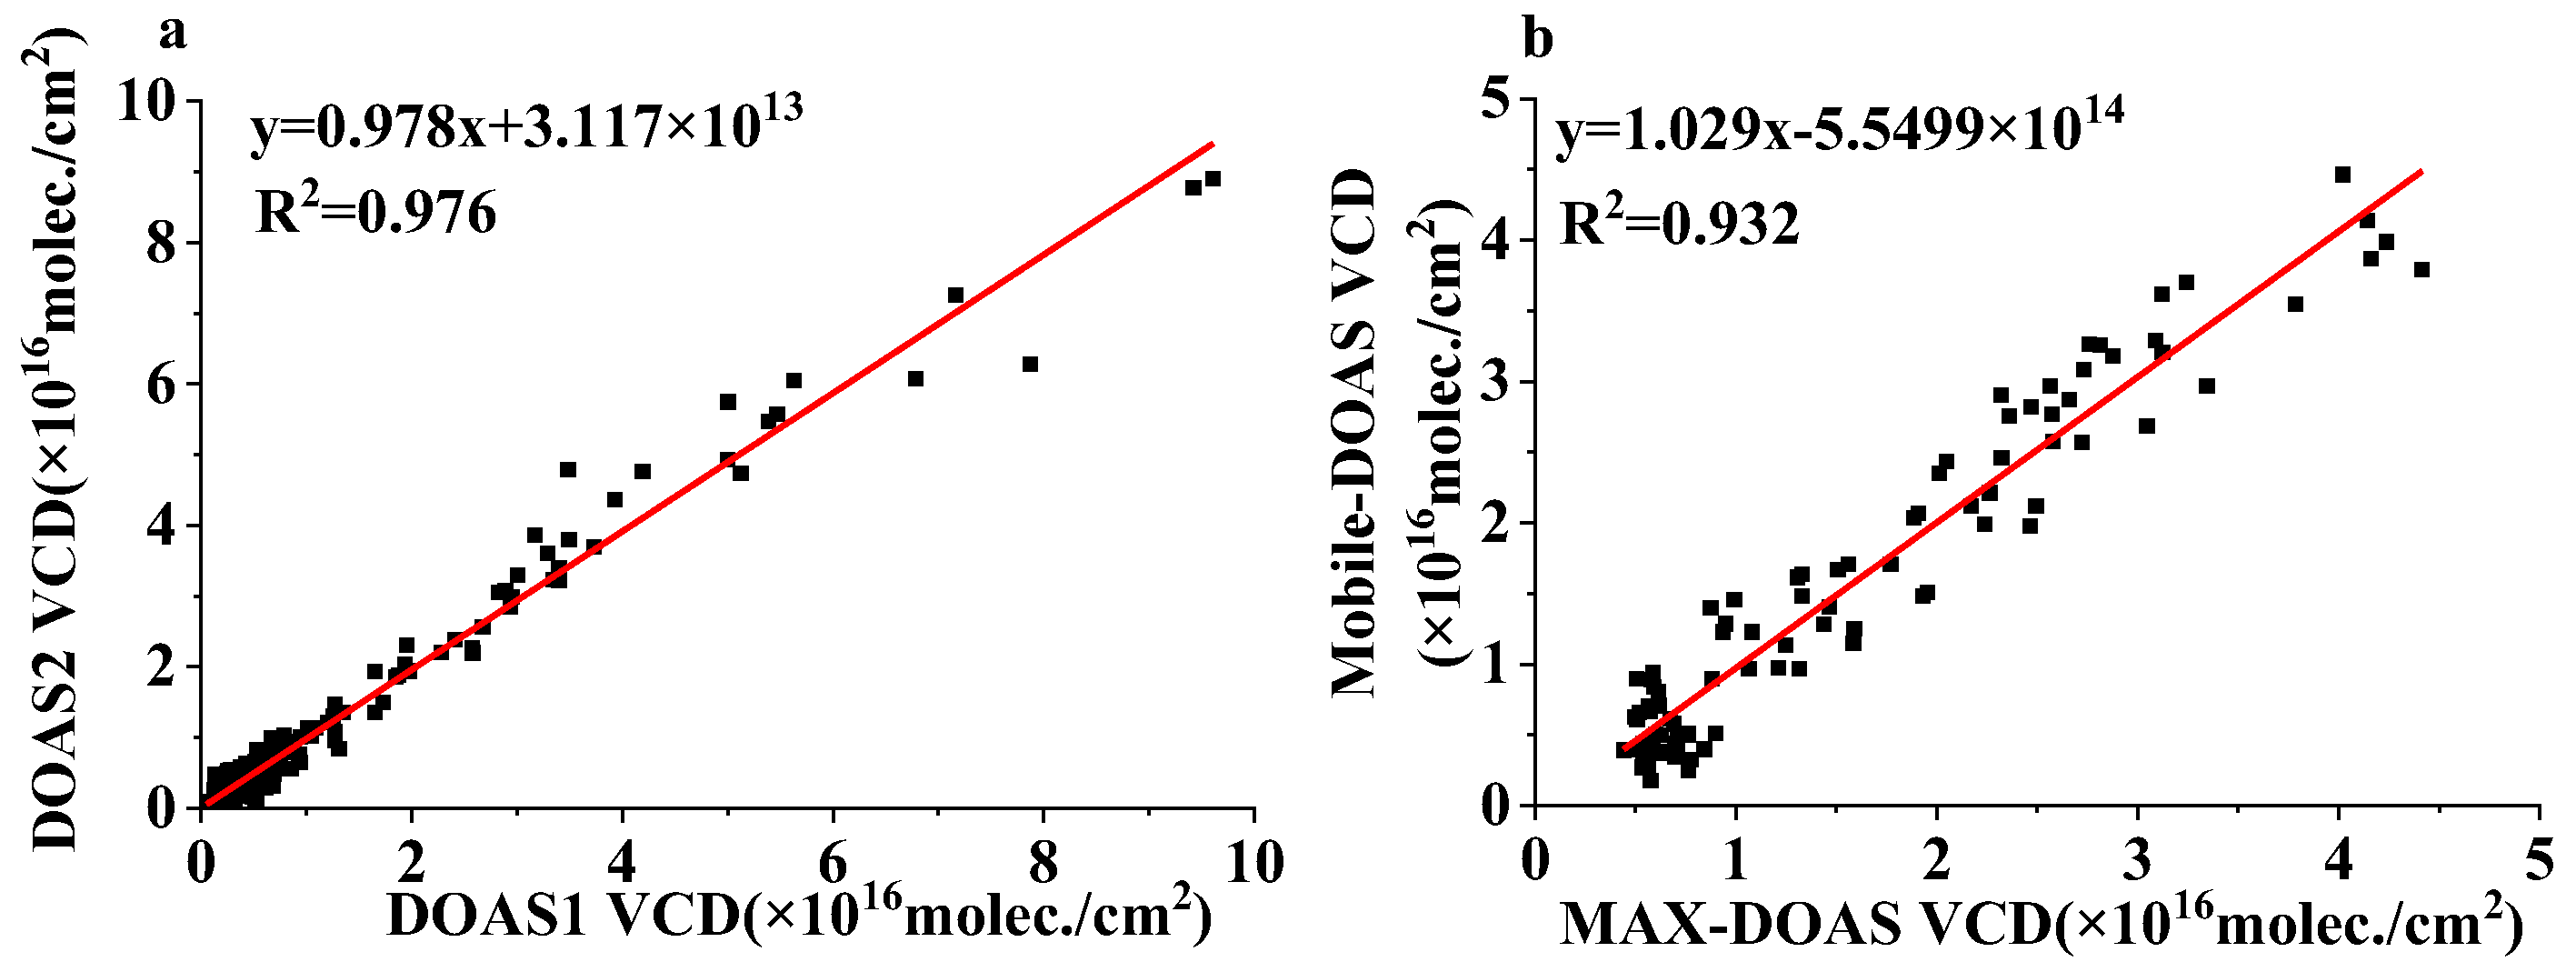
The first tested the retrieval homogeneity of the 2 mobile-DOAS systems. On 14 April 2018, we placed 2 DOAS instruments on 1 mobile to measure the NO2 of an industrial park located in Handan, Hebei province. The 2 DOAS apparatus’ time resolutions were set as 10 s and measured NO2 almost simultaneously. The comparison results of NO2 VCDs apparatuses are shown in Figure 5a and the correlation coefficient ( R 2 ) of the 2 sets was found to be 0.976. The high retrieval homogeneity shows the efficacy of cooperatively measuring the area emission flux using the 2 DOAS sets.
The second was to ensure mobile-DOAS instrument performance. The retrieval homogeneity was ensured, so we only needed to compare one of the mobile-DOAS (DOAS1) instruments with another instrument. A ground-based MAX-DOAS located on the roof of the Beijing south observation station building (116.468° N, 39.798° E) was selected as the reference instrument. The mobile-DOAS and MAX-DOAS systems were put together to measure NO2 on April 16th. The 2 apparatuses time resolutions were 10 s and measured NO2 almost simultaneously. Figure 5b presents the comparison result, which shows good agreement with a correlation coefficient ( R 2 ) of 0.932.
These two comparison results demonstrated that the 2 mobile-DOAS systems can perform a good quality measurement.

2.3. Wind Field Measurement and Average Wind Field

2.3.1. Wind Profile Radar

The wind field uncertainty is the main error source of mobile-DOAS emission flux measurements [27]. Several studies on mobile-DOAS indicate that having a wind profile is crucial for mobile-DOAS [18,22,24,26,31]. A near real-time measurement of the wind field is recommended for calculating the emission flux [18,26,31]. To enable an accurate emission flux measurement, we chose a wind profile radar to obtain wind profile data.
Wind field measurements involve two possible methods. The first uses a mobile wind profile radar with a mobile-DOAS to measure the wind field. The second uses stationary observation. Wind profile radar vehicles are usually large and inconvenient to enter/exit the second and third ring in Beijing because of the strict restriction policies on vehicles. Therefore, we measured the wind field data using stationary observations. An advantage of this approach is that the 2 DOAS sets only need 1 shared wind profile radar to obtain the wind profile data. Furthermore, the wind field and wind field uncertainty for each ring road measurement could be determined.
The tall buildings in downtown Beijing markedly affected the wind field, so wind field observation sites could not be selected randomly. The comprehensive meteorological experimental observation station (116.466° N, 39.796° E) was used for Beijing’s meteorological research so we chose this station to measure the wind field data. The location of the station is shown in Figure 2 marked with point A.
A radar for boundary wind profiling placed in a square cabin was also used in this experiment. The wind profile radar can measure the wind profile under a height of 5 km, with a height resolution of 50 m and a time resolution of 2 min. Since a wind profile under 1 km met our needs [31], we only measured the wind profile under a height of 1 km.

2.3.2. Wind Field Statistics

The wind parameters taking part in the NOX emission flux calculations are for average wind speed and wind direction, while the data furnished by the wind profile radar measured the time series of wind profiles. In order to calculate NOX emission flux, we developed 2 methods for averaging wind field profiles. The first used vector-based statistics and the second used scalar-based statistics. Both presented the same behavior and were equivalent [38]. Here, we chose scalar-based statistics.
Wind data were measured as a time series wind profile and averaging was be implemented in 2 steps. The first step averaged each height of the wind field for each time series to generate a time averaged wind profile, while the second step averaged the time averaged wind profile by using the exponential-weight method.
1. Wind field time averaging
First, we calculated the time averaged wind speed. The average wind speed and its uncertainty were determined by Equations (2) and (3), respectively.
w ( z j ) ¯ t = 1 N i = 1 N w ( z ji )
σ ( w zj ) t = 1 N 1 i = 1 N   [ w ( z ji ) w ( z j ) ¯ t ] 2  
where i is the data measured at time i, z j is the height, and j is the layer series. The subscript t represents the average.
We then averaged the wind direction. Wind direction distribution is subject to wrapped normal distribution, so we introduced wrapped normal distribution to determine the average wind direction and its uncertainty [38,39,40]. The wrapped normal distribution probability density is given with:
f ( μ | θ , σ ) = 1 2 π σ κ = 1 exp   [ ( θ μ + 2 π κ ) 2 2 σ 2 ] ,   0 θ 2 π
where θ is the wind direction, μ is the expectation, and σ is the standard deviation. Since the wind direction is between 0 and 2π, we let κ equal 0. The wind direction uncertainty of the measured wind data is
σ ( θ zj ) t =   ln ( ρ zj 2 )
where ρ zj 2 = ( cos θ ¯ zj ) 2 + ( sin θ ¯ zj ) 2 , cos θ ¯ zj = 1 N i = 1 N cos θ zji , cos θ ¯ zj = 1 N i = 1 N sin θ zji .
The average wind direction is
θ >( z j >) ¯ t = {   arctan ( sin θ ¯ zj cos θ ¯ zj ) ,   cos θ ¯ zj > 0 arctan ( sin θ ¯ zj cos θ ¯ zj ) + π ,   cos θ ¯ zj < 0
In this step, the wind speed uncertainty σ wt and the wind direction uncertainty σ θ t introduced by time averaging were determined by Equation (7) according to the error combination law, which are:
σ wt = j = 1 M   [ Q zj · σ ( w zj ) t ] 2 ,   σ θ t = j = 1 M   [ Q zj · σ ( θ zj ) t ] 2  
where Q z j is the weight function determined by Equation (8).
2. Wind profile averaging
After the time averaging, the next step was to average the wind field by the NOX concentration’s exponentially decreasing profiles. This was an exponential weight function [29,31] and the weight at the height of z j is:
Q zj = exp ( z j / z 0 ) j = 1 M exp ( z j / z 0 )
Then, the final average wind speed w ¯ z and the average wind direction θ ¯ z are given with:
w ¯ z = j = 1 M   [ Q zj · w ( z j ) ¯ t ] ,   θ ¯ z = j = 1 M   [ Q zj · θ ( z j ) ¯ t ]
where z 0 is the scale height, which is assumed to be 500 m in summer and 300 m in winter [31]. In spring and autumn, z 0 was chosen as the average of the winter and summer seasons, i.e., 400 m. The z 0 we chose is a rough estimate and has a rather small influence on the average wind field [31].
In this step, the uncertainty caused by the wind profile was introduced. According to statistical theory, the wind speed σ wz and the directional uncertainty σ θ z of the wind profile is:
σ wz = j = 1 M   [ Q j ( w ¯ z w ( z j ) ¯ t ) ] 2 ,   σ θ z = j = 1 M   [ Q j ( θ ¯ z θ ( z j ) ¯ t ) ] 2
Therefore, the total uncertainty of the wind speed σ w and the wind direction σ θ are:
σ w = σ wz 2 + σ wt 2 ,   σ θ = σ θ z 2 + σ θ t 2  

2.4. Determination of the NOX Emission Flux

There are two steps to determine the NOX emission flux.
The first step is to determine the NO2 emission flux using the closed integral method is given as
F NO 2 =   VCD   w   n   d s
where VCD is the NO2 VCD, w is the wind filed, and n is the unit vector orthogonal to the car’s moving direction. The discrete form of Equation (12) is given with [25]
F NO 2 = i   [ VCD i · w · ( cos θ · s iy sin θ · s ix ) ]
where w is the average wind speed and θ is the average direction. s i = ( s ix , s iy ) is the car’s movement vector. VCD i is the tropospheric NO2 VCD retrieved from the spectra measured by mobile-DOAS.
Then, we determined the NOX emission flux with NOX/NO2 ratio correction and NOX lifetime correction [29].
F NOx = R NOx · c τ · F NO 2
where R NOx is the mean NOX/NO2 ratio. R NOx is sensitive to meteorological conditions, other trace gases, and emission sources [32]. However, for Beijing, the R NOx was highly sensitive to emission sources because many vehicles on the road give off NO and consume a large amount of O3. This may result in significant O3 consumption, which will in turn lead to a higher NOX/NO2 ratio near the surface. Therefore, the R NOx observed on the ground should be carefully used. An understanding of the mean RNOx value at different heights is thus important. An available method is to derive the mean R NOx from the European Center for Medium-Range Weather Forecasts (ECMWF) CAMS model with the NO2 and NO products under different heights. The mean R NOx derived from different heights is used in this study at a height under 1 km at a UTC time of 6:00 (LT 14:00).
c τ = exp ( r w · τ ) is the NOX atmospheric lifetime decay correction factor, r is the mean distance from the measurement center to the measurement location, and we have provided these data in Section 2.1. τ is the NOX mean lifetime in atmosphere. In urban areas it varies from 3 h to 12 h in different seasons [31]. Usually, the NOx lifetime correction is sensitive to the lifetime when the wind speed is very low (<1 m/s) in mega-city measurements because NOX decay is a lifetime exponential function. However, accurate lifetime correction is not very sensitive when the wind speed is larger than 1 m/s. In this study, average wind speeds are all above 1.5m/s. Therefore, we roughly assumed the urban NOX mean lifetime to be about 5 h in spring [29]. It should also be noted that Equation (14) is for NOX lifetime correction of total NOX emissions. As Beijing has strong NOX emissions within fourth and fifth ring roads, NOX influx and outflux [24] lifetime correction for the flux of fourth and fifth ring roads are not so evident. There is a 5%~11% difference between the correction for total flux correction and correction for influx and outflux. The lifetime correction for NOX influx and outflux is important when there is little difference between influx and outflux [31]. Differences between NOX influx and outflux for second and third ring roads are relatively small so that lifetime correction for influx and outflux is important. However, the spatial scales of second and third ring roads are rather small. Lifetime correction for NOX influx and outflux have little influence from the correction for total NOX emissions. As a result, we applied lifetime correction for the NOX influx and outflux of fourth and fifth ring roads.

3. Results

3.1. Average Wind Field

Using the statistical method outlined in Section 2.2.2, we first calculated the time averaged wind field to generate corresponding wind profile. Then, we averaged the time averaged wind profile. The average wind field and its uncertainty for different ring roads are listed in Table 2. The average wind field in Table 2 was used to determine the NOX emission flux in Section 4.

3.2. Determination of NO2 VCD

We used Equation (1) to calculate tropospheric NO2 VCDs. After determining the NO2 VCDs, we plotted the overall NO2 VCDs with the GPS data shown in Figure 6. From the results, NO2 VCDs varied from 1.38 × 10¹⁵ molec./cm2 to 8.0 × 10¹⁶ molec./cm2. As we mentioned in Section 1, the NO2 VCD has a strong relationship with traffic flow and traffic jam, so high NO2 VCD distribution along measurement routes had no obvious pattern. This strongly impacted the emission flux error estimation, which we discuss in Section 4.3.

3.3. Comparison of TROPOMI and Mobile-DOAS VCDs

In this study, mobile-DOAS NO2 VCDs were compared with a Tropospheric Monitoring Instrument (TROPOMI) to measure tropospheric NO2 VCDs over Beijing. For places without significant emission sources, ground-based observations can compare with satellite products within 2 h around the satellite’s overpass time [9]. As there are many moving sources in Beijing, we used mobile-DOAS tropospheric NO2 VCDs within 1 h around the overpass time for comparison. Figure 7a–e presents the spatial distribution of mobile-DOAS and satellite tropospheric NO2 VCDs over Beijing. The two datasets generally agree with each other, yet for some observations the satellites underestimated NO2 VCDs compared with mobile-DOAS (subfigures (b) and (e)). The tropospheric NO2 VCD daily average for the mobile-DOAS and TROPOMI correlation coefficient (R2) was 0.7, showing a relatively good agreement, as shown in subfigure (f).

4. Discussion

4.1. NOX Emission Flux Error Sources

NOX emission flux errors mainly come from the VCD, wind speed, wind direction, car moving vector, NOX/NO2 ratio, and lifetime measurement errors or uncertainty [27,28,29,30,31,32]. The NOX emission flux is obtained with:
Δ F NOx = Δ F RNOx 2 + Δ F c τ 2 + Δ F VCD 2 + Δ F s 2 + Δ F θ 2 + Δ F w 2
where Δ F RNOx represents the NOX flux error introduced by the NOX/NO2 ratio uncertainty. The NOX/NO2 ratio uncertainty we assumed to be about ± 0.1.
Δ F c τ is the NOX flux error introduced by the NOX atmospheric lifetime uncertainty. The NOX atmospheric lifetime uncertainty we assumed here to be about ±1 h. It should be noted that the NOX lifetime uncertainty estimation in this study was rough and had a small influence on the error budget (see Section 4.3).
Δ F VCD is the NOX emission flux error introduced by NO2 VCD error. Because VCD = D S C D t r o p / A M F t r o p , the VCD error is determined by DSCD retrieval error and AMFtrop uncertainty. The NO2 DSCD is retrieved by the QDOAS software so that DSCD error can be mainly attributed to the DOAS retrieval error. The AMF error that we simulated was approximately ±0.1.
Δ F s is the NOX emission flux error caused by the car movement vector measurement error. The car movement vector was recorded by GPS and the GPS error was <1.5 m.
Δ F w and Δ F θ represent the emission flux error caused the wind speed uncertainty and wind direction uncertainty, respectively. The wind speed uncertainty and wind direction uncertainty are mainly attributed to the wind fluctuation in space and time during the measurements. The uncertainties are listed in Table 2.

4.2. NOX Emission Flux and Error

One of the motivations of this work was to obtain good spatial coverage of mega-cities’ NOX emission flux in a short amount of time. The NOX emission flux values of different ring roads obtained using our measurements can provide useful and detailed information on road vehicle exhaust in Beijing. The NOX emission flux and the errors results are shown in Figure 8.
During the measurement, the NOX emission flux of the second ring varied from (0.30 ± 0.51) × 1024 molec./s to (1.53 ± 0.75) × 1024 molec./s; the third ring varied from (2.60 ± 0.95) × 1024 molec./s to (5.21 ± 1.42) × 1024 molec./s; the fourth ring varied from (5.01 ± 3.43) × 1024 molec./s to (18.22 ± 6.82) × 1024 molec./s; and the fifth ring, representing downtown Beijing, varied from (19.29 ± 5.26) × 1024 molec./s to (36.46 ± 12.86) × 1024 molec./s. The fifth ring’s NOx emission flux mean value was about 26.89 × 1024 molec./s, which was ~13.08% higher compared to the estimations by Li et al. in November, 2014, under a low wind speed (<3 m/s) [41]. Significant improvement of NOX emissions within the fifth ring was not found in this study, although a strict traffic control policy has been implemented in Beijing for these years.
The NOx emission flux showed an overall increase from the second ring to the fifth ring. This indicates that little NOX was emitted from other sources within the fifth ring (mainly the road vehicles emissions). Because the traffic conditions vary day to day, the NOX emission flux of different ring roads also vary day to day, which can be easily found in our measurements. For example, the fifth ring’s NOX emission flux was 36.46 × 1024 molec./cm2 on April 18th and 34.740 × 1024 molec./cm2 on April 26th, while it was 20.63 × 1024 molec./cm2 on April 20th, 19.29 × 1024 molec./cm2 on April 24th, and 23.35 × 1024 molec./cm2 on April 25th. Other ring roads that were measured on different dates also show this characteristic. This analysis reveals that the large amount NOX emissions from road vehicles may create additional challenges for the accurate measurements of NOX emissions in the mega-cities of China.
Some interesting findings from our results were the NOX emission flux differences between the third and fourth ring. On April 18th, the NOX emission flux values of the third and fourth ring were 2.74 × 1024 molec./cm2 and 13.01 × 1024 molec./cm2, respectively. It seemed reasonable that for the fourth ring road’s NOX emissions would be higher than those of the third ring. However, on April 20th, the NOX emission flux values of the third and fourth ring were 5.22 × 1024 molec./cm2 and 5.10 × 1024 molec./cm2, respectively. The fourth ring’s NOX emissions were slightly lower than the third ring’s on April 20th. The differences in the NOX emission flux values can be attributed to the number of road vehicles. The direct reason for the different number of road vehicles was the different measurement time periods. A potential issue was that there may be an indirect cause behind the differences in the number of road vehicles. The number of road vehicles during different time periods was decided by factors such as the citizen’s workplace, the office area aggregation scale in the city, and the business style. Therefore, detailed NOX emission flux studies in mega-cities can provide important information for urbanization in China.

4.3. Error Budget and Sensitivity

4.3.1. Error Budget

Studying the emission flux error budget and sensitivity can improve our knowledge about the area emitters’ flux measurements, especially in mega-cities. Therefore, another motivation of this work was to study the error budget of NOX emission flux measurements in mega-cities and to determine the emission flux sensitivity factors in detail. We chose the 18th and 20th measurement results as typical examples to analyze.
The tropospheric NO2 VCD spatial distribution has a strong relationship to traffic flow and traffic jams. This suggests that NOX emission flux error may be very sensitive to wind field uncertainty.
Because the emission flux error is propagated and combined (and is not linear), using percentage indicator is not a good way to evaluate the error budget. We thus used R i 2 as the indicator:
R i 2 = Δ F i 2 Δ F NOx 2
where Δ F i is the emission flux error and i represents the error source. Because   R i 2 = 1 , a different error source budget can be accurately represented by R i 2 . Δ F i contributes over half of this value when R i 2   >   0.5 .
Figure 9 shows the R i 2 of the ring roads’ measurements on April 18th and 20th. Interestingly, the sums of the wind speed uncertainty’s R 2 and the direction uncertainty’s R 2 are all above 0.84, with the highest close to 1, while the other error sources’ R 2 values are very low. This could indicate that wind field uncertainty contributed most to the emission flux error in our measurements.
We also found an extreme case for the second ring on April 18th and extreme cases for the second, third, fourth, and fifth ring on April 20th. The main error source was either wind speed uncertainty or wind direction uncertainty, rather than the common work of wind field uncertainty. This suggests that the main error source of each case may be the sensitivity factors of the emission flux error.
We classified the R 2 values into Groups A, B, and C in Figure 9 to aid the sensitivity study. Groups A, B, and C represented three different cases:
A: the main error source is the wind direction uncertainty;
B: the main error source is the wind speed uncertainty;
C: the error contribution of the wind speed uncertainty and wind direction uncertainty is approximately equal.

4.3.2. Sensitivity to Wind Field Uncertainty

Sensitivity involves studying the relationship between the independent variable change rate (the wind speed uncertainty or the direction’s) and the dependent variable change rate (the emission flux error due to wind speed uncertainty or the direction). The independent variable change rates are given by:
Δ θ = θ θ ¯ σ θ × 100 % ,   Δ w = w w σ w × 100 %
The dependent variable change rates are given by:
r θ | w ¯ = Δ F θ θ ¯ Δ F NOx | w ¯ ,   r w | θ ¯ = Δ F w w ¯ Δ F NOx | θ ¯
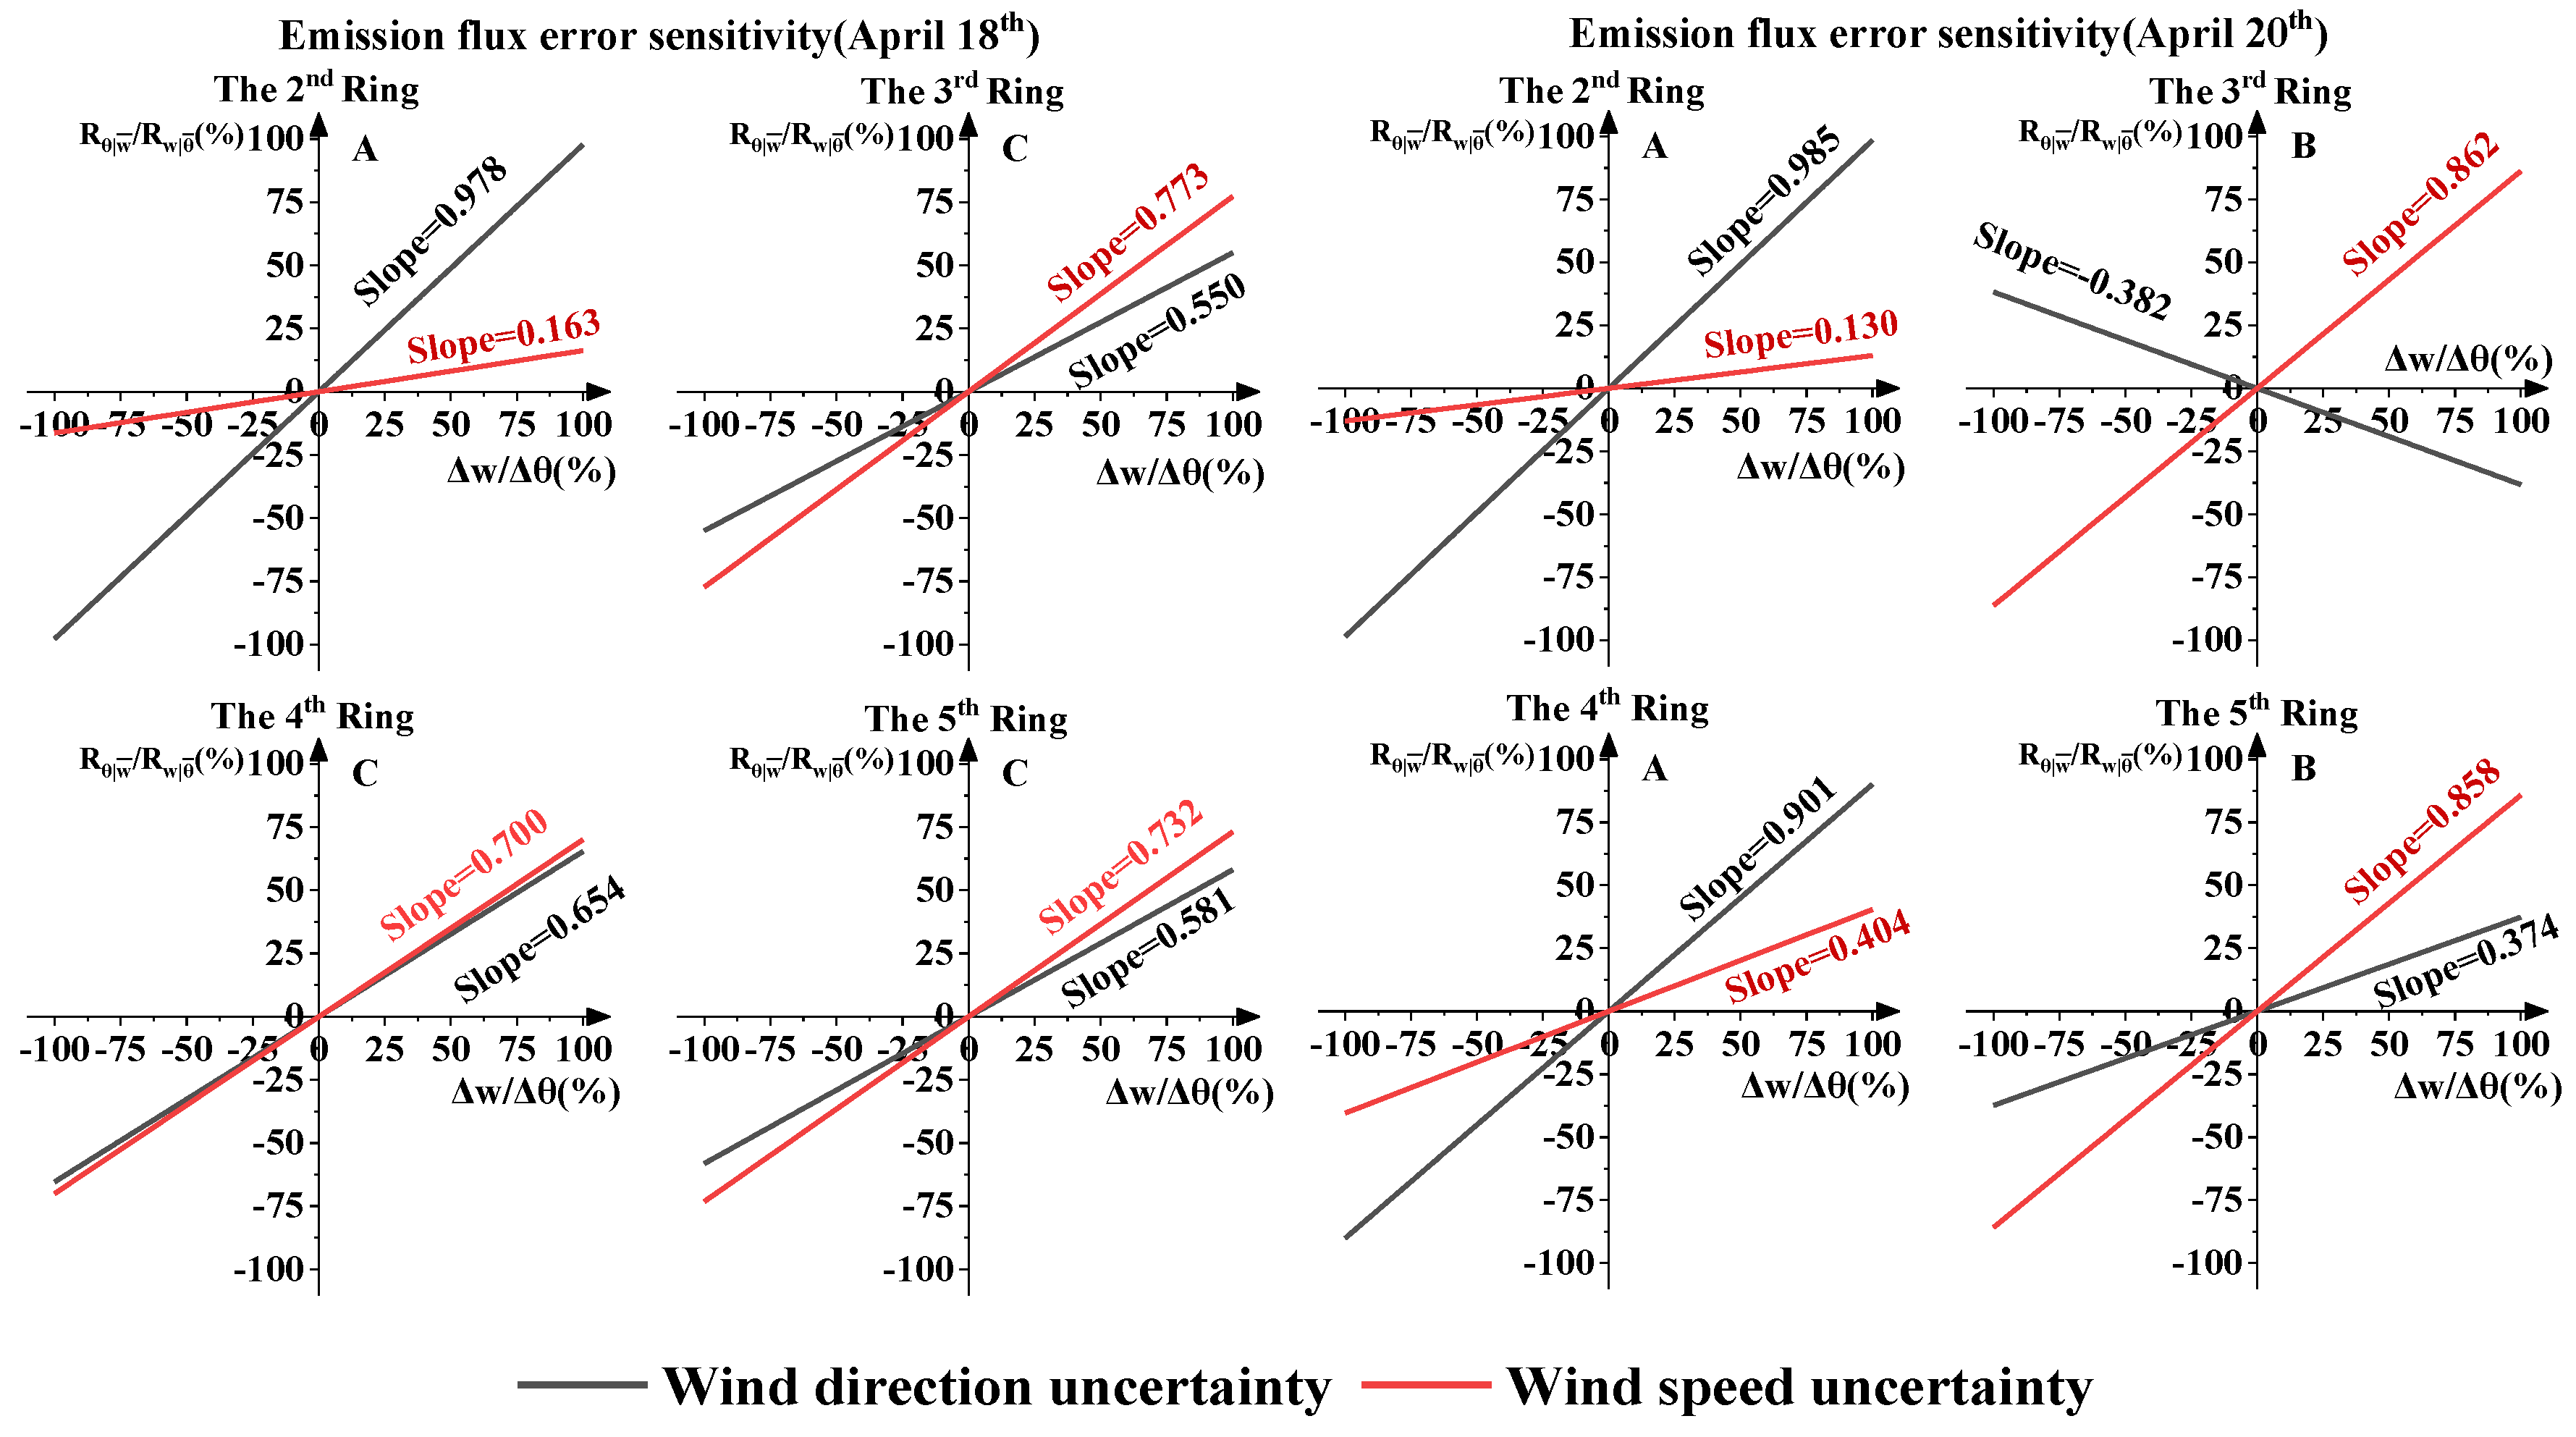
The variations of r θ | w ¯ / r w | θ ¯ with Δ θ / Δ w are shown in Figure 10. Groups A, B, and C in Figure 10 correspond to the same groups as shown in Figure 9. We also calculated the slope value because of the relationship between r θ | w ¯ / r w | θ ¯ and Δ θ / Δ w , which was linear. This can help assess the sensitivity. The higher the slope, the more sensitive it is to the error source.
First, we studied the characteristics of Groups A and B. The absolute slope of r θ | w ¯ in Group A (varying with Δ θ   ) was higher than that of r θ | w ¯ while the absolute slope of r w | θ ¯ in Group B (varying with Δ w   ) was higher than that of r θ | w ¯ A higher slope means a higher growth rate and, in other words, greater sensitivity. Therefore, the emission flux error of Group A was sensitive to wind direction uncertainty and Group B was more sensitive to wind speed uncertainty. Unlike the fifth ring in Group A, the r θ | w ¯ slopes of the second ring on April 18th and 20th were much higher than those of r w | θ ¯ suggesting that the emission flux error was highly sensitive to wind direction uncertainty.
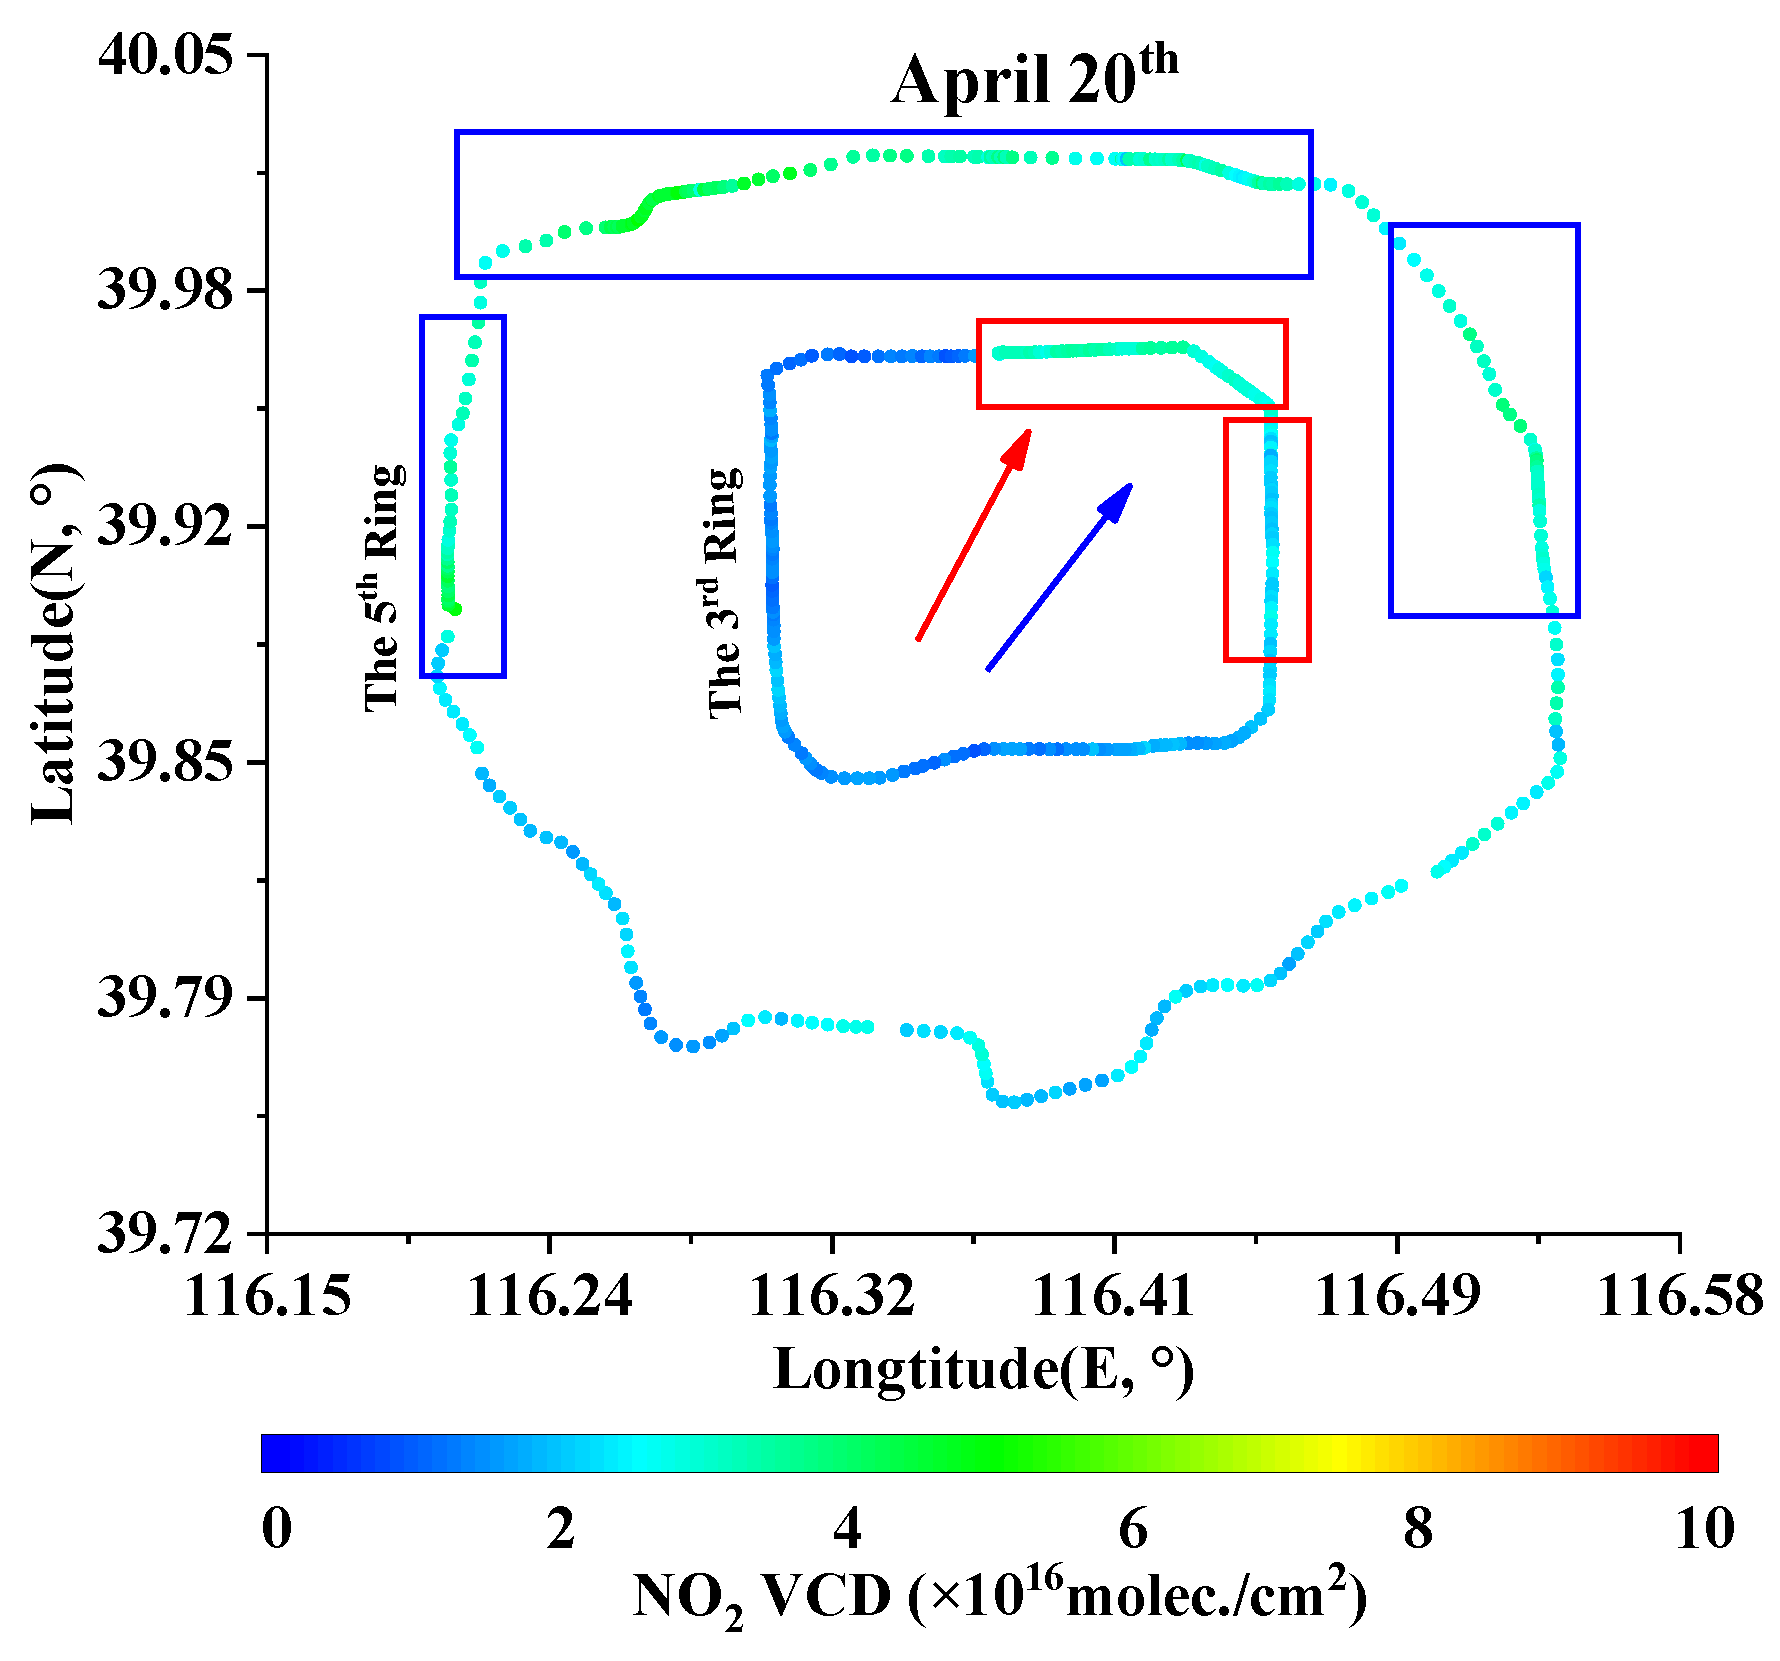
We made an interesting discovery in Group B (the third ring measurement on April 20th). The r w | θ ¯ varied with the Δ w , but has a negative trend for r θ | w ¯ To explain this, we compared the third ring’s VCD with the fifth ring’s VCD (see Figure 11). The rectangular as area represented the main high VCD value. The blue arrow was the fifth ring’s averaged wind field and the red arrow was the third ring’s averaged wind field.
The characteristics of the point/industry park source emission measurements by mobile-DOAS suggest that the high VCD value should appear downwind. The high value VCD distribution we measured was approximately vertical to the wind direction. However, the NO2 VCD for road vehicle exhaust was different. The high value VCD distribution had a relationship with traffic jams and traffic flow, not only with the wind field. The high VCDs in the fifth ring have three distributed sectors, while those in the third ring have two. Clearly, these high VCDs impact the emission flux as the emission flux errors are different. This phenomenon could produce diverse sensitivity to the wind direction and, furthermore, indicates that the NOX emissions of the road vehicle exhaust measurements are highly sensitive to the wind field. Therefore, more accurate wind field data are necessary.
Second, we studied the characteristics of Group C. Like other groups, the slope in each unit figure of Group C had subtle differences. This indicates that the sensitivity of the emission flux error to the wind speed uncertainty or the directional uncertainty was similar.
Since emission flux error was highly sensitive to wind field uncertainty, the emission flux error may have evident increase if using coarse wind measurements. For coarse wind measurements, wind speed uncertainty, and wind directional uncertainty were roughly estimated as ±1 m/s and ±20°, respectively. The emission flux errors with coarse wind measurements typically increased by about 7%~50%. The wind profile radar used in our experiment was an advantage.

4.3.3. Sensitivity to Other Error Sources

In Section 4.3.2 we determined that the emission flux error was highly sensitive to wind field uncertainty. The sensitivity to other error sources should also be discussed.
We assumed the NOX atmospheric lifetime uncertainty to be ±1 h. As NOX decay is a lifetime exponential function, the NOx emission flux is not very sensitive to NOX atmospheric lifetime uncertainty. The R τ 2 is < 0.15, even though the atmospheric lifetime uncertainty is ±2 h. VCD uncertainties are determined by SCD retrieval errors and AMF errors. With the amount of VCD data included in the emission flux calculations, the VCD uncertainties have only a small influence on the emission flux errors. Therefore, for area measurements, emission flux errors are not sensitive to VCD uncertainties.
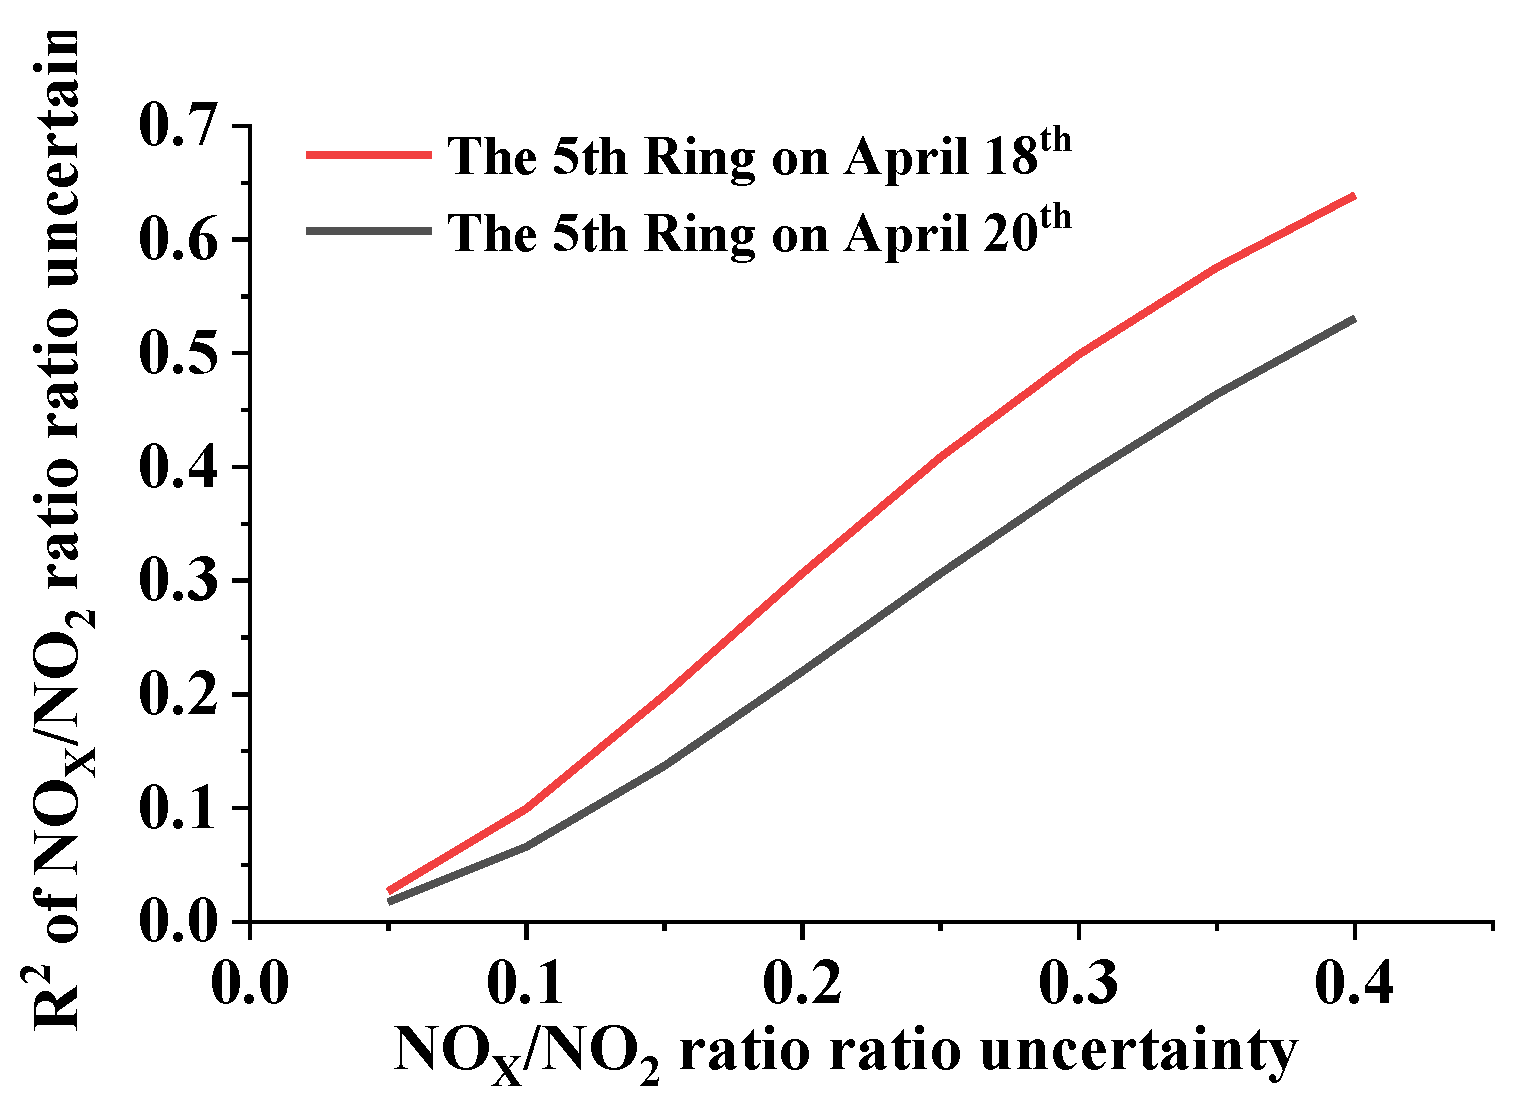
The NOX/NO2 ratio directly acts on NOX emission flux corrections; thus, NOX emission flux errors may be sensitive to the uncertainty of this ratio. In Section 4.3.2, we demonstrated what happens when the error source dominates the error budget. For simplicity, we used R2 to survey the sensitivity, wherein measurements from the fifth ring were tested. The R2 of the NOX/NO2 ratio uncertainty remains above 0.5 when the NOX/NO2 ratio uncertainty is >0.4., as shown in Figure 12. This demonstrates that the emission flux error is no longer sensitive to wind field uncertainty when the NOX/NO2 ratio uncertainty is > 0.4.
In the above analysis, we showed the emission flux error budget and the relationship between the emission flux error sensitivity and wind field uncertainty. We found that wind field uncertainty was the main error source for emission flux errors on Beijing’s ring roads. For some cases, the NOX emission flux errors were highly sensitive to wind speed uncertainty or wind direction uncertainty, rather than both. These diverse sensitivities were caused by traffic flow and traffic jam. This study adds to the existing literature on this topic expanding upon the work of previous studies [22,23,24,25,26,27,28,29,30,31,32,34,35,36]. Our work also indicates that wind information is crucial, as having the actual time and height resolved wind measurements yields great advantages for measuring mega-cities’ emission flux.

5. Conclusions

We reported here, for the first time, the use of two mobile-DOAS and a wind profile radar to perform cooperative measurements using data from April 2018.
Two mobile-DOAS systems were used to measure the NO2 VCD of Beijing’s ring road and a wind profile radar was used to measure the near real-time wind field in a short amount of time to determine the NOX emission flux values of different ring roads. The results show that the NOX emission flux of Beijing’s fifth ring road varied from (19.29 ± 5.26) × 1024 molec./s to (36.46 ± 12.86) × 1024 molec./s. Day to day variability in the different ring roads’ NOX emission flux values was also observed in our measurements. At the same time, studying the NOX emissions from different ring road found that on April 20th, the third ring’s NOX emissions flux was slightly higher than the fourth ring’s, because the two ring roads were measured at different time periods. We then performed the emission flux error budget and sensitivity analyses. The main emission flux error source was wind field uncertainty. For some measurements, the main emission flux error source was either wind speed uncertainty or wind direction uncertainty, rather than both. Actual time wind measurements in our experiments decreased the NOX emission flux error by about 7%~50% compared to coarse wind measurements. The emission flux error sensitivity study indicated that the emission flux error, in some cases, was highly sensitive to wind speed uncertainty or wind direction uncertainty, rather than both. The emission flux error had diverse sensitivity to wind direction uncertainty, which is a novel addition to the existing literature on this topic. This also indicates that wind information is crucial for measuring Beijing’s NOX emission flux values. The NOX/NO2 ratio uncertainty sensitivity analyses indicated that the wind field uncertainty no longer dominates the emission flux errors when the NOX/NO2 ratio uncertainty is >0.4.
Possessing actual time and height resolved wind measurements and provided a great advantage for NOX emission flux measurements in Chinese mega-cities. The emission flux errors of different ring roads caused by wind speed uncertainty and wind direction uncertainty were clearly distinguished. Good spatial coverage also provides crucial information for traffic control policies in these cities. Potential advantages of this method are that it can be used to validate the high spatial resolution NOx emission flux derived the TROPOMI [42] and that it can be applied to many other mega-cities in China since most of these cities have a ring road structure, a large scale, and many vehicles.

Author Contributions

Y.H. and A.L. developed the method. Z.H. designed the experiments. Y.H., X.L., and H.R. performed the mobile-DOAS experiment and processed the mobile-DOAS data. X.F. and B.D. helped with the wind measuring. Y.H. and H.R. processed the wind data. P.X., J.X., and X.F. supervised this study. Y.H. analyzed the data and wrote the paper. All authors have read and agreed to the published version of the manuscript.

Funding

This work was supported by National Natural Science Foundation of China (No.:41775029, 91644110, 41530644 and 41975037), National Key Research and Development Project of China (No.: 2018YFC0213201 and 2017YFC0209902), Science and Technology Commission of Shanghai Municipality (No.: 17DZ1203102).

Conflicts of Interest

The authors declare no conflict of interest.

References

  1. Seinfeld, J.H.; Pandis, S.N. Atmospheric Chemistry and Physics: From Air Pollution to Climate Change; Wiley: Hoboken, NJ, USA, 2016. [Google Scholar]
  2. Cheng, L.X.; Tao, J.H.; Valks, P.; Yu, C.; Liu, S.; Wang, Y.; Xiong, X.Z.; Wang, Z.F.; Chen, L.F. NO2 Retrieval from the Environmental Trace Gases Monitoring Instrument (EMI): Preliminary Results and Intercomparison with OMI and TROPOMI. Remote Sens. 2019, 11, 3017. [Google Scholar] [CrossRef] [Green Version]
  3. Mak, H.W.L.; Laughner, J.L.; Fung, J.C.H.; Zhu, Q.; Cohen, R.C. Improved Satellite Retrieval of Tropospheric NO2 Column Density via Updating of Air Mass Factor (AMF): Case Study of Southern China. Remote Sens. 2018, 10, 1789. [Google Scholar] [CrossRef] [Green Version]
  4. Squires, F.A.; Nemitz, E.; Langford, B.; Wild, O.; Drysdale, W.S.; Acton, W.J.F.; Fu, P.; Grimmond, C.S.B.; Hamilton, J.F.; Hewitt, C.N.; et al. Measurements of traffic dominated pollutant emissions in a Chinese megacity. Atmos. Chem. Phys. 2020, 20, 8737–8761. [Google Scholar] [CrossRef]
  5. Wang, Y.; Tao, J.; Cheng, L.; Yu, C.; Wang, Z.; Chen, L. A Retrieval of Glyoxal from OMI over China: Investigation of the Effects of Tropospheric NO2. Remote Sens. 2019, 11, 137. [Google Scholar] [CrossRef] [Green Version]
  6. Wen, L.; Xue, L.; Wang, X.; Xu, C.; Chen, T.; Yang, L.; Wang, T.; Zhang, Q.; Wang, W. Summertime fine particulate nitrate pollution in the North China Plain: Increasing trends, formation mechanisms and implications for control policy. Atmos. Chem. Phys. 2018, 18, 11261–11275. [Google Scholar] [CrossRef] [Green Version]
  7. Zhang, H.X.; Liu, C.; Chan, K.L.; Hu, Q.H.; Liu, H.R.; Li, B.; Xing, C.Z.; Tan, W.; Zhou, H.J.; Si, F.Q.; et al. First observation of tropospheric nitrogen dioxide from the Environ-mental Trace Gases Monitoring Instrument onboard the GaoFen-5 satellite. Light Sci. Appl. 2020, 9, 66. [Google Scholar] [CrossRef] [PubMed] [Green Version]
  8. Zhang, Q.J.; Beekmann, M.; Freney, E.; Sellegri, K.; Pichon, J.M.; Schwarzenboeck, A.; Colomb, A.; Bourrianne, T.; Michoud, V.; Borbon, A. Formation of secondary organic aerosol in the Paris pollution plume and its impact on surrounding regions. Atmos. Chem. Phys. 2015, 15, 13973–13992. [Google Scholar]
  9. Wang, Y.; Beirle, S.; Lampel, J.; Koukouli, M.; De Smedt, I.; Theys, N.; Li, A.; Wu, D.; Xie, P.; Liu, C.; et al. Validation of OMI, GOME-2A and GOME-2B tropospheric NO2, SO2 and HCHO products using MAX-DOAS observations from 2011 to 2014 in Wuxi, China: Investigation of the effects of priori profiles and aerosols on the satellite products. Atmos. Chem. Phys. 2017, 17, 5007–5033. [Google Scholar] [CrossRef] [Green Version]
  10. Zhang, Q.; Zheng, Y.X.; Tong, D.; Shao, M.; Wang, S.X.; Zhang, Y.H.; Xu, X.D.; Wang, J.N.; He, H.; Liu, W.Q.; et al. Drivers of improved PM2.5air quality in China from 2013 to 2017. Proc. Natl. Acad. Sci. USA 2019, 116, 24463–24469. [Google Scholar] [CrossRef] [Green Version]
  11. Platt, U. Dry Deposition of SO2. Atmos. Environ. 1978, 12, 363–367. [Google Scholar] [CrossRef]
  12. Platt, U.; Stutz, J. Differential Optical Absorption Spectroscopy, Principles and Applications; Springer: Berlin/Heidelberg, Germany, 2008. [Google Scholar]
  13. Wagner, T.; Dix, B.; Friedeburg, C.V.; Frieß, U.; Sanghavi, S.; Sinreich, R. MAX-DOAS O4 measurements: A new technique to derive information on atmospheric aerosols—Principles and information content. J. Geophys. Res. 2004, 109, D22205. [Google Scholar] [CrossRef] [Green Version]
  14. Bortoli, D.; Silva, A.M.; Costa, M.J.; Domingues, A.F.; Giovanelli, G. Monitoring of atmospheric minor compounds at the Evora Station–Portugal. Int. J. Remote Sens. 2009, 30, 4209–4226. [Google Scholar] [CrossRef]
  15. Premuda, M.; Petritoli, A.; Masieri, S.; Palazzi, E.; Kostadinov, I.; Bortoli, D.; Ravegnani, F.; Giovanelli, G. A study of O3 and NO2 vertical structure in a coastal wooded zone near a metropolitan area, by means of DOAS measurements. Atmos. Environ. 2013, 71, 104–114. [Google Scholar] [CrossRef]
  16. Premuda, M.; Masieri, S.; Bortoli, D.; Kostadinov, I.; Petritoli, A.; Giovanelli, G. Evaluation of vessel emissions in a lagoon area with ground based Multi axis DOAS measurements. Atmos. Environ. 2011, 45, 5212–5219. [Google Scholar] [CrossRef]
  17. Wagner, T.; Ibrahim, O.; Shaiganfar, R.; Platt, U. Mobile MAX DOAS observations of tropospheric trace gases. Atmos. Meas. Tech. 2010, 3, 129–140. [Google Scholar] [CrossRef] [Green Version]
  18. Johanssona, M.; Galle, M.; Yu, T.; Tang, L.; Chen, D.L.; Li, H.J.; Li, J.X.; Zhang, Y. Quantification of total emission of air pollutants from Beijing using mobile mini-DOAS. Atmos. Environ. 2008, 42, 6926–6933. [Google Scholar] [CrossRef]
  19. Oetjen, H.; Baidar, S.; Krotkov, N.A.; Lamsal, L.N.; Lechner, M.; Volkamer, R. Airborne MAX-DOAS measurements over California: Testing the NASA OMI tropospheric NO2 product. J. Geophys. Res. Atmos. 2013, 118, 7400–7413. [Google Scholar] [CrossRef] [Green Version]
  20. Wang, P.; Richter, A.; Bruns, M.; Burrows, J.P.; Scheele, R.; Junkermann, W.; Heue, K.-P.; Wagner, T.; Platt, U.; Pundt, I. Airborne multi-axis DOAS measurements of tropospheric SO2 plumes in the Po-valley, Italy. Atmos. Chem. Phys. 2006, 6, 329–338. [Google Scholar] [CrossRef] [Green Version]
  21. Wang, R.W.; Xie, P.H.; Xu, J.; Li, A.; Sun, Y.W. Observation of CO2 Regional Distribution Using an Airborne Infrared Remote Sensing Spectrometer (Air-IRSS) in the North China Plain. Remote Sens. 2019, 11, 123. [Google Scholar] [CrossRef] [Green Version]
  22. Rivera, C.; Mellqvist, J.; Samuelsson, J.; Lefer, B.; Alvarez, S.; Patel, M.R. Quantification of NO2 and SO2 emissions from Houston Ship Channel and Texas City industrial areas during the 2006 Texas Air Quality Study. J. Geophys. Res. 2010, 115, D08301. [Google Scholar] [CrossRef] [Green Version]
  23. Constantin, D.-E.; Merlaud, A.; van Roozendael, M.; Voiculescu, M.; Fayt, C.; Hendrick, F.; Pinardi, G.; Georgescu, L. Measurements of Tropospheric NO2 in Romania Using a Zenith-Sky Mobile DOAS System and Comparisons with Satellite Observations. Sensors 2013, 13, 3922–3940. [Google Scholar] [CrossRef] [PubMed] [Green Version]
  24. Ibrahim, O.; Shaiganfar, R.; Sinreich, R.; Stein, T.; Platt, U.; Wagner, T. Car MAX-DOAS measurements around entire cities: Quantification of NOX emissions from the cities of Mannheim and Ludwigshafen (Germany). Atmos. Meas. Tech. 2010, 3, 709–721. [Google Scholar] [CrossRef] [Green Version]
  25. Frins, E.; Bobrowski, N.; Osorio, M.; Casaballe, N.; Belsterli, G.; Wagner, T.; Platt, U. Scanning and mobile multi-axis DOAS measurements of SO2 and NO2 emissions from an electric power plant in Montevideo, Uruguay. Atmos. Environ. 2014, 98, 347–356. [Google Scholar] [CrossRef]
  26. Davis, Z.Y.W.; Baray, S.; McLinden, C.A.; Khanbabakhani, A.; Fujs, W.; Csukat, C.; Debosz, J.; McLaren, R. Estimation of NOX and SO2 emissions from Sarnia, Ontario, using a mobile MAX-DOAS (Multi-AXis Differential Optical Absorption Spectroscopy) and a NOX analyzer. Atmos. Chem. Phys. 2019, 19, 13871–13889. [Google Scholar] [CrossRef] [Green Version]
  27. Rivera, C.; Sosa, G.; Wöhrnschimmel, H.; de Foy, B.; Johansson, M.; Galle, B. Tula industrial complex (Mexico) emissions of SO2 and NO2 during the MCMA 2006 field campaign using a mobile mini-DOAS system. Atmos. Chem. Phys. 2009, 9, 6351–6361. [Google Scholar] [CrossRef] [Green Version]
  28. Rivera, C.; Barrera, H.; Grutter, M.; Zavala, M.; Galle, B.; Bei, N.F.; Li, G.H.; Molina, L.T. NO2 fluxes from Tijuana using a mobile mini-DOAS during Cal-Mex 2010. Atmos. Environ. 2012, 70, 532–539. [Google Scholar] [CrossRef]
  29. Shaiganfar, R.; Beirle, S.; Sharma, M.; Chauhan, A.; Singh, R.P.; Wagner, T. Estimation of NOX emissions from Delhi using Car MAX-DOAS observations and comparison with OMI satellite data. Atmos. Chem. Phys. 2011, 11, 10871–10887. [Google Scholar] [CrossRef] [Green Version]
  30. Wang, S.S.; Zhou, B.; Wang, Z.R.; Yang, S.N.; Hao, N.; Valks, P.; Trautmann, T.; Chen, L.M. Remote sensing of NO2 emission from the central urban area of Shanghai (China) using the mobile DOAS technique. J. Geophys. Res. 2012, 117, D13305. [Google Scholar] [CrossRef]
  31. Shaiganfar, R.; Beirle, S.; Denier van der Gon, H.; Jonkers, S.; Kuenen, J.; Petetin, H.; Zhang, Q.; Beekmann, M.; Wagner, T. Estimation of the Paris NOX emissions from mobile MAX-DOAS observations and CHIMERE model simulations during the MEGAPOLI campaign using the closed integral method. Atmos. Chem. Phys. 2017, 17, 7853–7890. [Google Scholar] [CrossRef] [Green Version]
  32. Tan, W.; Zhao, S.H.; Liu, C.; Chan, K.L.; Xie, Z.Q.; Zhu, Y.; Sub, W.J.; Zhang, C.X.; Liu, H.R.; Xing, C.Z.; et al. Estimation of winter time NOX emissions in Hefei, a typical inland city of China, using mobile MAX-DOAS observations. Atmos. Environ. 2019, 200, 228–242. [Google Scholar] [CrossRef]
  33. Danckaert, T.; Fayt, C.; van Roozendael, M.; de Smedt, I.; Letocart, V.; Merlaud, A.; Pinardi, G. QDOAS Software User Manual. 2017. Available online: http://uv-vis.aeronomie.be/software/QDOAS/QDOAS_manual.pdf (accessed on 9 September 2017).
  34. Wu, F.C.; Li, A.; Xie, P.H.; Chen, H.; Hu, Z.K.; Zhang, Q.; Liu, J.G.; Liu, W.Q. Emission Flux Measurement Error with a Mobile DOAS System and Application to NOX Flux Observations. Sensors 2017, 17, 231. [Google Scholar] [CrossRef] [PubMed] [Green Version]
  35. Wu, F.; Xie, P.; Li, A.; Mou, F.; Chen, H.; Zhu, Y.; Zhu, T.; Liu, J.; Liu, W. Investigations of temporal and spatial distribution of precursors SO2 and NO2 vertical columns in the North China Plain using mobile DOAS. Atmos. Chem. Phys. 2018, 18, 1535–1554. [Google Scholar] [CrossRef] [Green Version]
  36. Wu, F.C.; Xie, P.H.; Li, A.; Chan, K.L.; Hartl, A.; Wang, Y.; Si, F.Q.; Zeng, Y.; Qin, M.; Xu, J.; et al. Observations of SO2 and NO2 by mobile DOAS in the Guangzhou eastern area during the Asian Games 2010. Atmos. Meas. Tech. 2010, 6, 2277–2292. [Google Scholar] [CrossRef] [Green Version]
  37. Deutschmann, T.; Beirle, S.; Frieß, U.; Grzegorski, M.; Kern, C.; Kritten, L.; Platt, U.; Prados-Roman, C.; Pukite, J.; Wagner, T.; et al. The Monte Carlo atmospheric radiative transfer model McArtim: Introduction and validation of Jacobians and 3-D features. J. Quant. Spectrosc. Radiat. Transf. 2011, 112, 1119–1137. [Google Scholar] [CrossRef]
  38. Farrugia, P.S.; Micallef, A. Vectorial statistics for the standard deviation of wind direction. Meteorol. Atmos. Phys. 2017, 129, 495–506. [Google Scholar] [CrossRef]
  39. Bowers, J.A.; Morton, I.D.; Mould, G.I. Mould. Directional statistics of the wind and waves. Appl. Ocean. Res. 1999, 22, 13–30. [Google Scholar] [CrossRef]
  40. Mardia, K.V.; Peter, E.J. Directional Statistics; John Wiley & Sons: Chichester, UK, 1999. [Google Scholar]
  41. Li, A.; Zhang, J.; Xie, P.H.; Hu, Z.K.; Xu, J.; Mou, F.S.; Wu, F.C.; Liu, J.G.; Liu, W.Q. Variation of temporal and spatial patterns of NO2 in Beijing using OMI and mobile DOAS. Sci. China Chem. 2015, 58, 1367–1376. [Google Scholar] [CrossRef]
  42. Steffen Beirle, S.; Borger, C.; Dörner, S.; Li, A.; Hu, Z.K.; Liu, F.; Wang, Y.; Wagner, T. Pinpointing nitrogen oxide emissions from space. Sci. Adv. 2019, 5, eaax9800. [Google Scholar] [CrossRef] [Green Version]
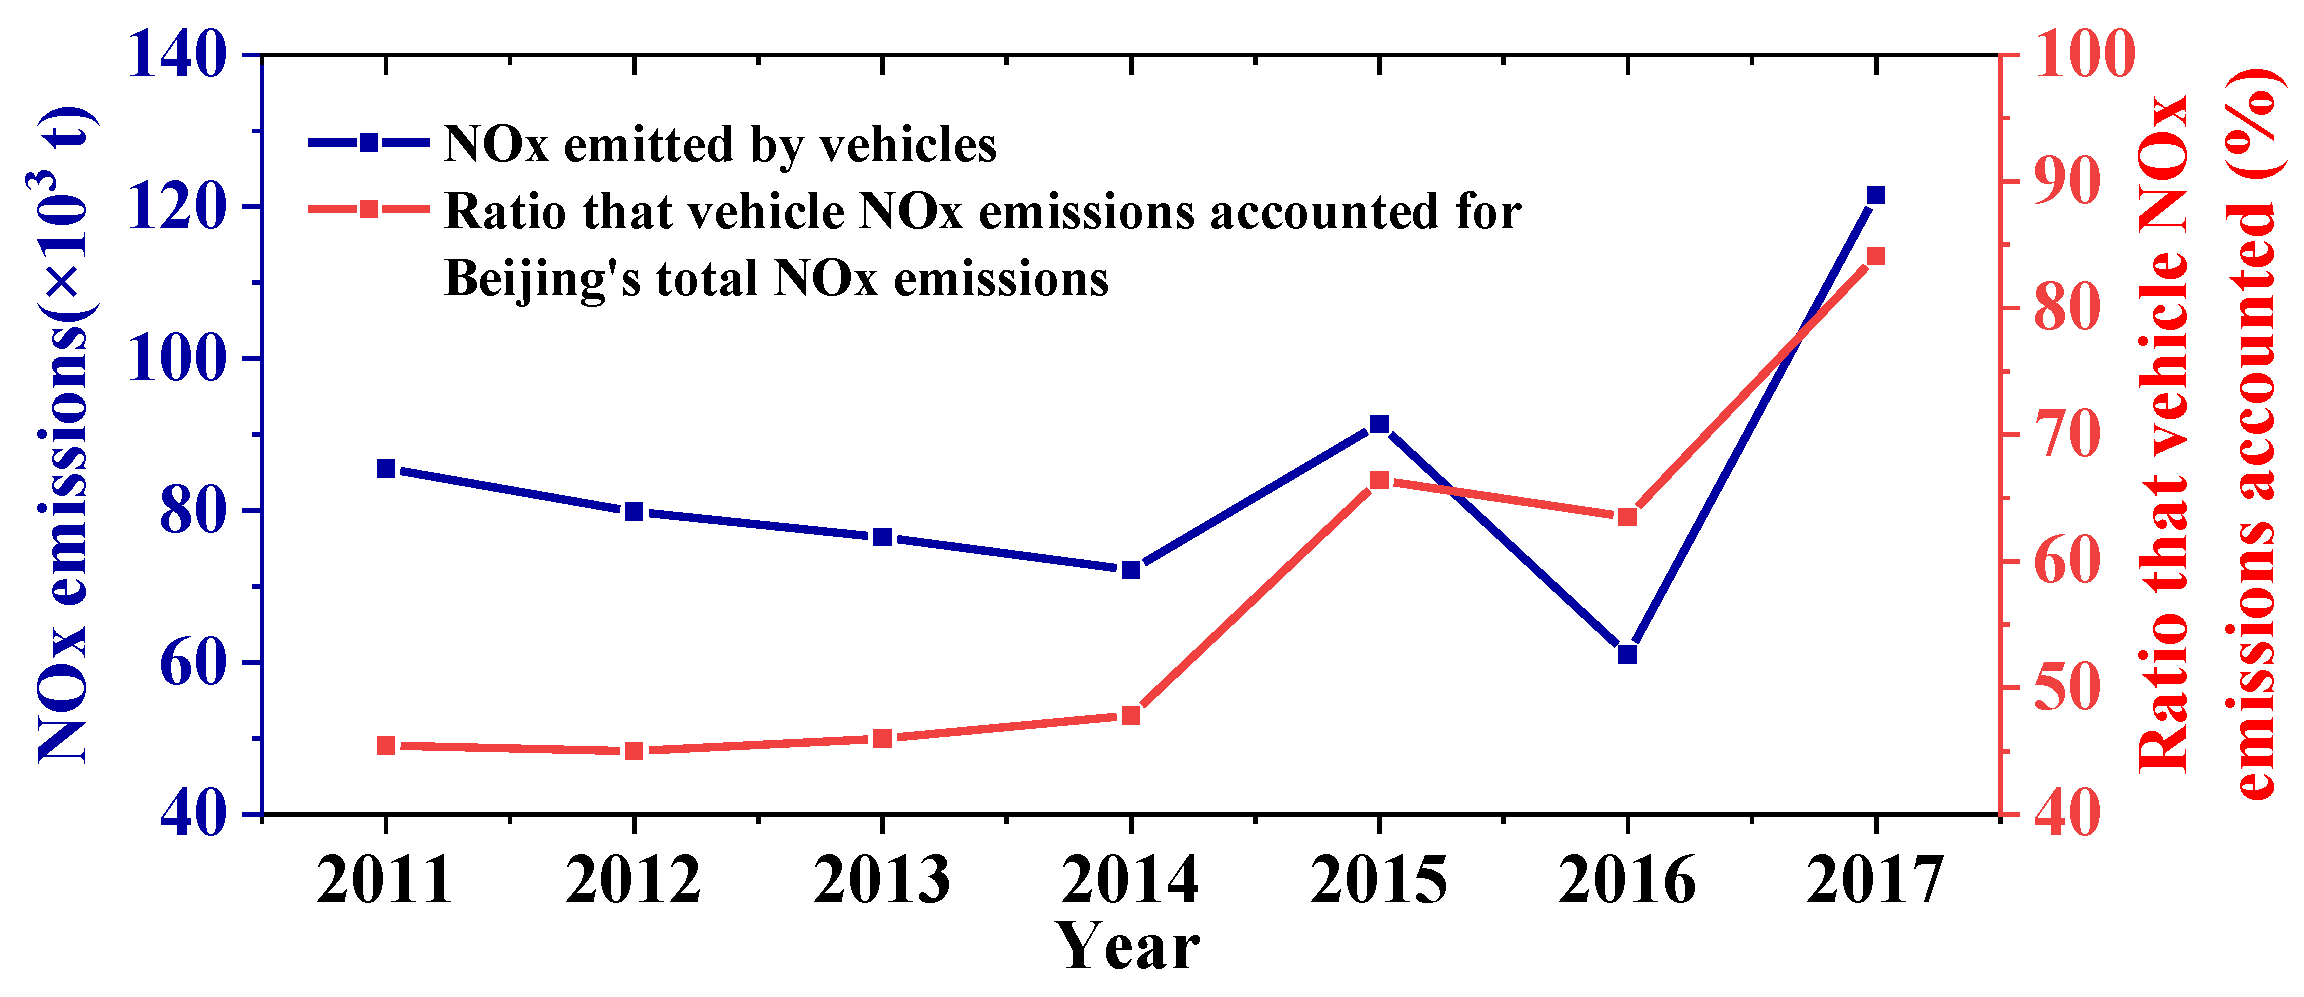
Figure 1. The annual NOX emissions of vehicles in Beijing from 2011 to 2017 and the percentage of vehicles emitting NOx over total NOx emissions in Beijing. (NOX emission data source: Beijing Municipal Ecological Environment Bureau).
Remotesensing 12 02527 g001
Figure 2. The ring roads of Beijing, China. Map data © Google Earth (point A is the location of the wind profile radar).
Remotesensing 12 02527 g002
Figure 3. (a) The mobile zenith-sky differential optical absorption spectroscopy (DOAS) system; (b) the measurement principle of the mobile-DOAS system.
Remotesensing 12 02527 g003
Figure 4. (Upper plot) DOAS fitting example for NO2; (bottom plot) fitting residual.
Remotesensing 12 02527 g004
Figure 5. Retrieval comparison results. (a) The retrieval homogeneity of the 2 mobile-DOAS instruments with a correlation coefficient (R2) of 0.976; (b) the comparison result for mobile-DOAS (DOAS1) and MAX-DOAS with a correlation coefficient (R2) of 0.932.
Remotesensing 12 02527 g005
Figure 6. NO2 VCD distribution of Beijing’s ring roads on April 18th, 20th, 24th, 25th, and 26th. From outside to inside, the ring roads are the fifth ring, fourth ring, third ring, and second ring.
Remotesensing 12 02527 g006
Figure 7. (ae) are the mobile-DOAS and satellite tropospheric NO2 VCD spatial distribution; (f) is the correlation coefficient (R2).
Remotesensing 12 02527 g007
Figure 8. The NOX emission flux and its error for the ring roads in Beijing; measurements taken on April 18th, 20th, 24th, 25th, and 26th, 2018.
Remotesensing 12 02527 g008
Figure 9. The R i 2 of the ring roads measured on April 18th and 20th. Group A’s main error source is the wind direction uncertainty. Group B’s main error source is the wind speed uncertainty. Group C’s main error is both the wind direction uncertainty and the wind speed uncertainty.
Remotesensing 12 02527 g009
Figure 10. The emission flux error change rate ( r θ | ¯ w / r w | ¯ θ ) varied with the wind direction/speed change rate ( Δ θ / Δ w   ) on April 18th and 20th. The higher the slope, the more sensitive it is to the NOX emission flux error.
Remotesensing 12 02527 g010
Figure 11. The NO2 VCD spatial distribution of the fifth ring and third ring on April 20th (The blue arrow is the averaged wind field of the fifth ring. The red arrow is the averaged wind field of the third ring).
Remotesensing 12 02527 g011
Figure 12. The variation in the R2 of NOX/NO2 ratio uncertainty with NOX/NO2 ratio uncertainty.
Remotesensing 12 02527 g012
Table 1. NO2 slant column density (SCD) retrieval fit setting.
Fitting ParameterNO2
Fitting windows(338~370) nm
Polynomial order5
NO2Vandaele, 1996 (220K, 298k)
O3Bogumil, 2003 (223K, 243K)
O4Thalman, 2013 (293K)
HCHOMeller, 2000 (297K)
Ringby DOASIS
Table 2. The ring roads’ measuring data, measuring time, averaged wind field, and its uncertainty on April 18th, 20th, 24th, 25th, and 26th, 2018.
Date (2018)Ring Roads and Measuring Time (Beijing Time)Averaged Wind Speed and Its Uncertainty (m/s)Averaged Wind Direction and Its Uncertainty (°)
April 18thThe second ring (12:40~13:27)2.325 ± 0.64355.644 ± 17.039
The third ring (12:03~13:11)2.285 ± 0.63865.176 ± 13.735
The fourth ring (9:39~11:24)1.738 ± 0.50170.651 ± 17.302
The fifth ring (9:27~11:56)1.736 ± 0.49467.317 ± 15.497
April 20thThe second ring (13:18~14:32)2.905 ± 0.77968.607 ± 15.859
The third ring (12:01~13:21)3.553 ± 0.95964.944 ± 13.220
The fourth ring (9:33~11:21)3.423 ± 0.91961.889 ± 20.926
The fifth ring (9:24~12:22)3.501 ± 0.94260.662 ± 15.265
April 24thThe second ring (11:24~12:15)2.183 ± 0.551255.665 ± 13.897
The third ring (9:56~11:03)2.721 ± 0.704260.323 ± 20.409
The fourth ring (11:09~12:47)1.973 ± 0.512255.457 ± 13.760
The fifth ring (9:41~11:03)2.83 ± 0.737260.666 ± 21.051
April 25thThe second ring (13:19~14:07)2.826 ± 0.73044.126 ± 8.448
The third ring (12:28~13:36)2.621 ± 0.67643.218 ± 9.216
The fourth ring (11:03~12:26)1.956 ± 0.54541.982 ± 21.501
The fifth ring (9:58~12:28)2.14 ± 0.58245.945 ± 19.045
April 26thThe second ring (12:08~13:30)1.912 ± 0.506273.92 ± 17.226
The third ring (11:36~13:10)1.537 ± 0.413276.556 ± 15.009
The fourth ring (9:42~11:32)1.686 ± 0.459255.23 ± 14.349
The fifth ring (9:33~11:53)1.571 ± 0.431254.648 ± 14.211