Article

Triple Collocation-Based Assessment of Satellite Soil Moisture Products with In Situ Measurements in China: Understanding the Error Sources

1
College of Hydrology and Water Resources, No. 1 Xikang Road, Hohai University, Nanjing 210098, China
2
Department of Geodesy and Geo-Information, Wiedner Hauptstraße 8/E120, Vienna University of Technology, A-1040 Vienna, Austria
*
Author to whom correspondence should be addressed.
Remote Sens. 2020, 12(14), 2275; https://doi.org/10.3390/rs12142275
Submission received: 11 June 2020 / Revised: 10 July 2020 / Accepted: 12 July 2020 / Published: 15 July 2020
(This article belongs to the Special Issue Satellite Soil Moisture Validation and Applications)

Abstract

:
With the increasing utilization of satellite-based soil moisture products, a primary challenge is knowing their accuracy and robustness. This study presents a comprehensive assessment over China of three widely used global satellite soil moisture products, i.e., Soil Moisture Active Passive (SMAP), European Space Agency (ESA) Climate Change Initiative (CCI) Soil Moisture, Soil Moisture and Ocean Salinity (SMOS). In situ soil moisture from 1682 stations and Variable Infiltration Capacity (VIC) model are used to evaluate the performance of SMAP_L3, ESA_CCI_SM_COMBINED, SMOS_CATDS_L3 from 31 March 2015 to 3 June 2018. The Triple Collocation (TC) approach is used to minimize the uncertainty (e.g., scale issue) during the validation process. The TC analysis is conducted using three triplets, i.e., [SMAP-Insitu-VIC], [CCI-Insitu-VIC], [SMOS-Insitu-VIC]. In general, SMAP is the most reliable product, reflecting the main spatiotemporal characteristics of soil moisture, while SMOS has the lowest accuracy. The results demonstrate that the overall root mean square error of SMAP, CCI, SMOS is 0.040, 0.028, 0.107 m3m−3, respectively. The overall temporal correlation coefficient of SMAP, CCI, SMOS is 0.68, 0.65, 0.38, respectively. The overall fractional root mean square error of SMAP, CCI, SMOS is 0.707, 0.750, 0.897, respectively. In irrigated areas, the accuracy of CCI is reduced due to the land surface model (which does not consider irrigation) used for the rescaling of the CCI_COMBINED soil moisture product during the merging process, while SMAP and SMOS preserve the irrigation signal. The quality of SMOS is most strongly impacted by land surface temperature, vegetation, and soil texture, while the quality of CCI is the least affected by these factors. With the increase of Radio Frequency Interference, the accuracy of SMOS decreases dramatically, followed by SMAP and CCI. Higher representativeness error of in situ stations is noted in regions with higher topographic complexity. This study helps to provide a guideline for the application of satellite soil moisture products in scientific research and gives some references (e.g., modify data algorithm according to the main error sources) for improving the data quality.

1. Introduction

Soil moisture is a key surface state variable in land-atmosphere interactions [1], controlling water fluxes (e.g., runoff, evapotranspiration, infiltration) [2,3], energy fluxes (e.g., latent and sensible heat flux) [4,5] and carbon exchange [6,7]. Therefore, the knowledge of soil moisture dynamics is of vital importance in both climate change, hydrology, and agricultural research [8,9,10].
Soil moisture can be obtained through in situ measurement, land surface model simulation and remote sensing retrieval [11,12,13]. Over the past decade, remote sensing has been recognized as the most promising way for large-scale soil moisture monitoring (especially in ungauged regions) due to the evolution of microwave remote sensing techniques [14,15]. Compared to traditional optical remote sensing, microwave remote sensing (with wavelengths between 1 mm and 1 m) has a greater penetrating ability, which means it is less affected by cloud and vegetation canopy [16]. According to the sensor type, microwave remote sensing can be divided into active remote sensing (onboard radar) and passive remote sensing (onboard radiometer) [11,17]. Examples of active remote sensing satellites are the Advanced Scatterometer (ASCAT) series on METOP-A, METOP-B, METOP-C launched by European Space Agency (ESA) in 2006, 2012, 2018, respectively [15,18]. Examples of passive remote sensing satellites are Soil Moisture and Ocean Salinity (SMOS) launched by ESA in 2009 [4], Advanced Microwave Scanning Radiometer 2 (AMSR2) launched by Japan Aerospace Exploration Agency (JAXA) in 2012 [19,20], and Soil Moisture Active Passive (SMAP) launched by National Aeronautics and Space Administration (NASA) in 2015 [14,21]. Considering the long-term dataset length required for climate research, the ESA project consortium merged a selection of these individual satellite soil moisture products together into one product namely Climate Change Initiative (CCI) soil moisture product [1,22], reference Section 2.3 for more details.
These satellite-based soil moisture products provide a great opportunity to improve the existing climatological, hydrological, and agricultural research, which require accurate data sources for soil moisture [2,23]. However, data quality should be evaluated first to estimate the uncertainty when utilizing these products [24,25]. In addition, the error characteristics of these satellite soil moisture products are of great value for improving the product quality (e.g., the improvement of the retrieval algorithm for certain areas) [26]. Many validation studies have been conducted at a global scale [14,27] and at a regional scale, e.g., Europe [18], USA [2], Australia [19], Africa [28], China [29]. Generally, the broad validation approach of satellite soil moisture products is the direct comparison to in situ soil moisture, land surface models, or other satellite soil moisture products. However, the validation metrics obtained from such comparisons may not truly reflect the error between the target soil moisture product and unknown soil moisture truth [27,30]. For example, uncertainty such as representativeness error due to scale mismatch may influence the validation process [31].
In response to this challenge, the Triple Collocation (TC)-based validation strategy is used in this study. TC was first proposed by Stoffelen [9] to calibrate scatterometer-derived ocean winds and estimate errors. Three datasets with the same target variable and independent errors are required in TC. Error variances of these datasets can then be obtained after the data is collocated [9,32]. For the soil moisture case, the most ideal TC data triplets are in situ measurements, land surface models, and satellite-based products due to independence [27]. Based on TC, the Extended Triple Collocation (ETC) approach was proposed by McColl et al. [33], which allows both root mean square error (RMSE) and Pearson correlation coefficient (R) to be obtained as validation metrics [34]. Crow et al. [30] found that TC-based validation is able to minimize the scale issue (common in sparse network validation, which contain only 1–3 sites in a satellite grid) between grid-scale satellite soil moisture and point-scale in situ soil moisture. All metrics from TC-based validation are theoretically between the soil moisture product under evaluation and the unknown truth [34], which allows the evaluation of the accuracy and error characteristics of different soil moisture products more fairly [31,35]. Only validation between single satellite soil moisture and few in situ sites (less than 500) has been conducted before in China [29]. For satellite soil moisture products, one of the advantages is that they are able to preserve the irrigation signal [5,36]. Kumar et al. [37] highlight the importance of choosing the representative reference data in irrigated areas, which may be crucial for CCI due to its model-dependent rescaling [22]. In addition to irrigation, this is also the first study to comprehensively analyze the impact of surface temperature, vegetation, soil texture, and Radio Frequency Interference (RFI) on satellite soil moisture products accuracy in China.
The objective of this study is to evaluate the most recent version of satellite soil moisture products (i.e., SMAP L3 passive version 5, SMOS L3 CATDS version 300, and CCI COMBINED version 4.5) and to have a comprehensive understanding of the impact of environmental factors on product accuracy, with the validation period from 31 March 2015 to 3 June 2018. The other two components in TC triplets are in situ measurement from 1682 stations and the Variable Infiltration Capacity (VIC) Model daily soil moisture outputs [38,39]. This paper is organized as follows. The datasets are described in Section 2, Section 3 reviews the TC approach and validation metrics. Section 4 presents the overall TC-based validation results, and the results in the context of irrigation, land surface characteristics, and spatial representativeness. Conclusions are given in Section 5 and the reliability of TC-based validation is verified in Appendix A.

2. Data

2.1. SMAP Soil Moisture

The SMAP satellite was launched on 31 January 2015 by NASA to obtain global-scale soil moisture and freeze/thaw state [11]. It carries a radiometer at L-band, with a revisit time of 2–3 days, a sun-synchronous orbit with an altitude of 685 km, which consists of ascending (6:00 PM at local time) and descending (6:00 AM at local time) half-orbits [11,21,24]. SMAP provides four different level products with different application goals, i.e., level 1 instrument data, level 2 half-orbit data, level 3 daily composite data, and level 4 model-derived value-added data [11]. In this study, SMAP L3 passive product (version 5) was used, with 36 km spatial resolution. It should be noted that both ascending and descending products are available, however, we chose to use only the AM (descending) data. The reasons are (1) the plant and soil temperatures are more consistent at 6:00 am, (2) the vertical profiles of soil temperature and soil dielectric properties are likely to be more uniform in the morning, which means the descending soil moisture data are theoretically more trustworthy [21].

2.2. SMOS Soil Moisture

The SMOS mission was launched on 2 November 2009 by ESA with the aim of mapping global surface soil moisture with a target accuracy of 0.04 m3 m−3 [40,41,42]. The satellite carries the L-band radiometer with multiple incidence angles from 0° to 55°, which retrieves soil moisture twice a day at 6:00 am (ascending) and 6:00 pm (descending) Local Solar Time (LST) [43,44]. The spatial resolution is around 35–55 km and the revisit period is 3 days [45,46]. The daily SMOS L3 products (V300) were used in this study. The products were generated on a 25-km EASE_v2 grid and released by Centre Aval de Traitement des Données (CATDS), which are available online via http://www.catds.fr/. In addition to SMOS-CATDS, we also tried SMOS-IC [14]. However, due to the low space coverage in China, we decided to still use SMOS-CATDS. As is the case for SMAP, only AM (ascending) data of SMOS were used in this study.

2.3. CCI Soil Moisture

The ESA CCI soil moisture products are generated through the Climate Change Initiative (CCI) programme of European Space Agency (ESA) to meet the demand of global soil moisture monitoring [1]. The ESA CCI products merge multiple soil moisture products derived from various passive and active microwave instruments to fulfil the need of climate research in the long term [1], with a spatial resolution of 0.25° and temporal resolution of 1 day [8,22]. Three soil moisture products are provided within the ESA CCI product, i.e., CCI_ACTIVE, CCI_PASSIVE, and CCI_COMBINED [25]. The active product is merged using observations from AMI-WS and ASCAT-A/B, while the passive product is merged using observations from SMMR, SSMI/I, TMI, AMSR-E, WindSat, SMOS, AMSR2 [22]. The COMBINED product is generated using both the active and passive sensors. Furthermore, to generate a climatology consistent product, the GLDAS-Noah land surface model [1] soil moisture is used as the scaling reference to rescale the combined product using cumulative density function (CDF) matching during the merging process [22,28,47]. The CCI_ACTIVE and CCI_PASSIVE products are rescaled using ASCAT and AMSR-E, respectively, instead of land surface model [22]. The latest CCI version 4.5 (https://www.esa-soilmoisture-cci.org/) was used in this study which covers the 40-years from November 1978 to December 2018. Note that in this paper, the ESA CCI SM COMBINED v04.5 product is referred to simply as CCI. Where the ACTIVE or PASSIVE products are specifically considered, they are stated as CCI_ACTIVE and CCI_PASSIVE.

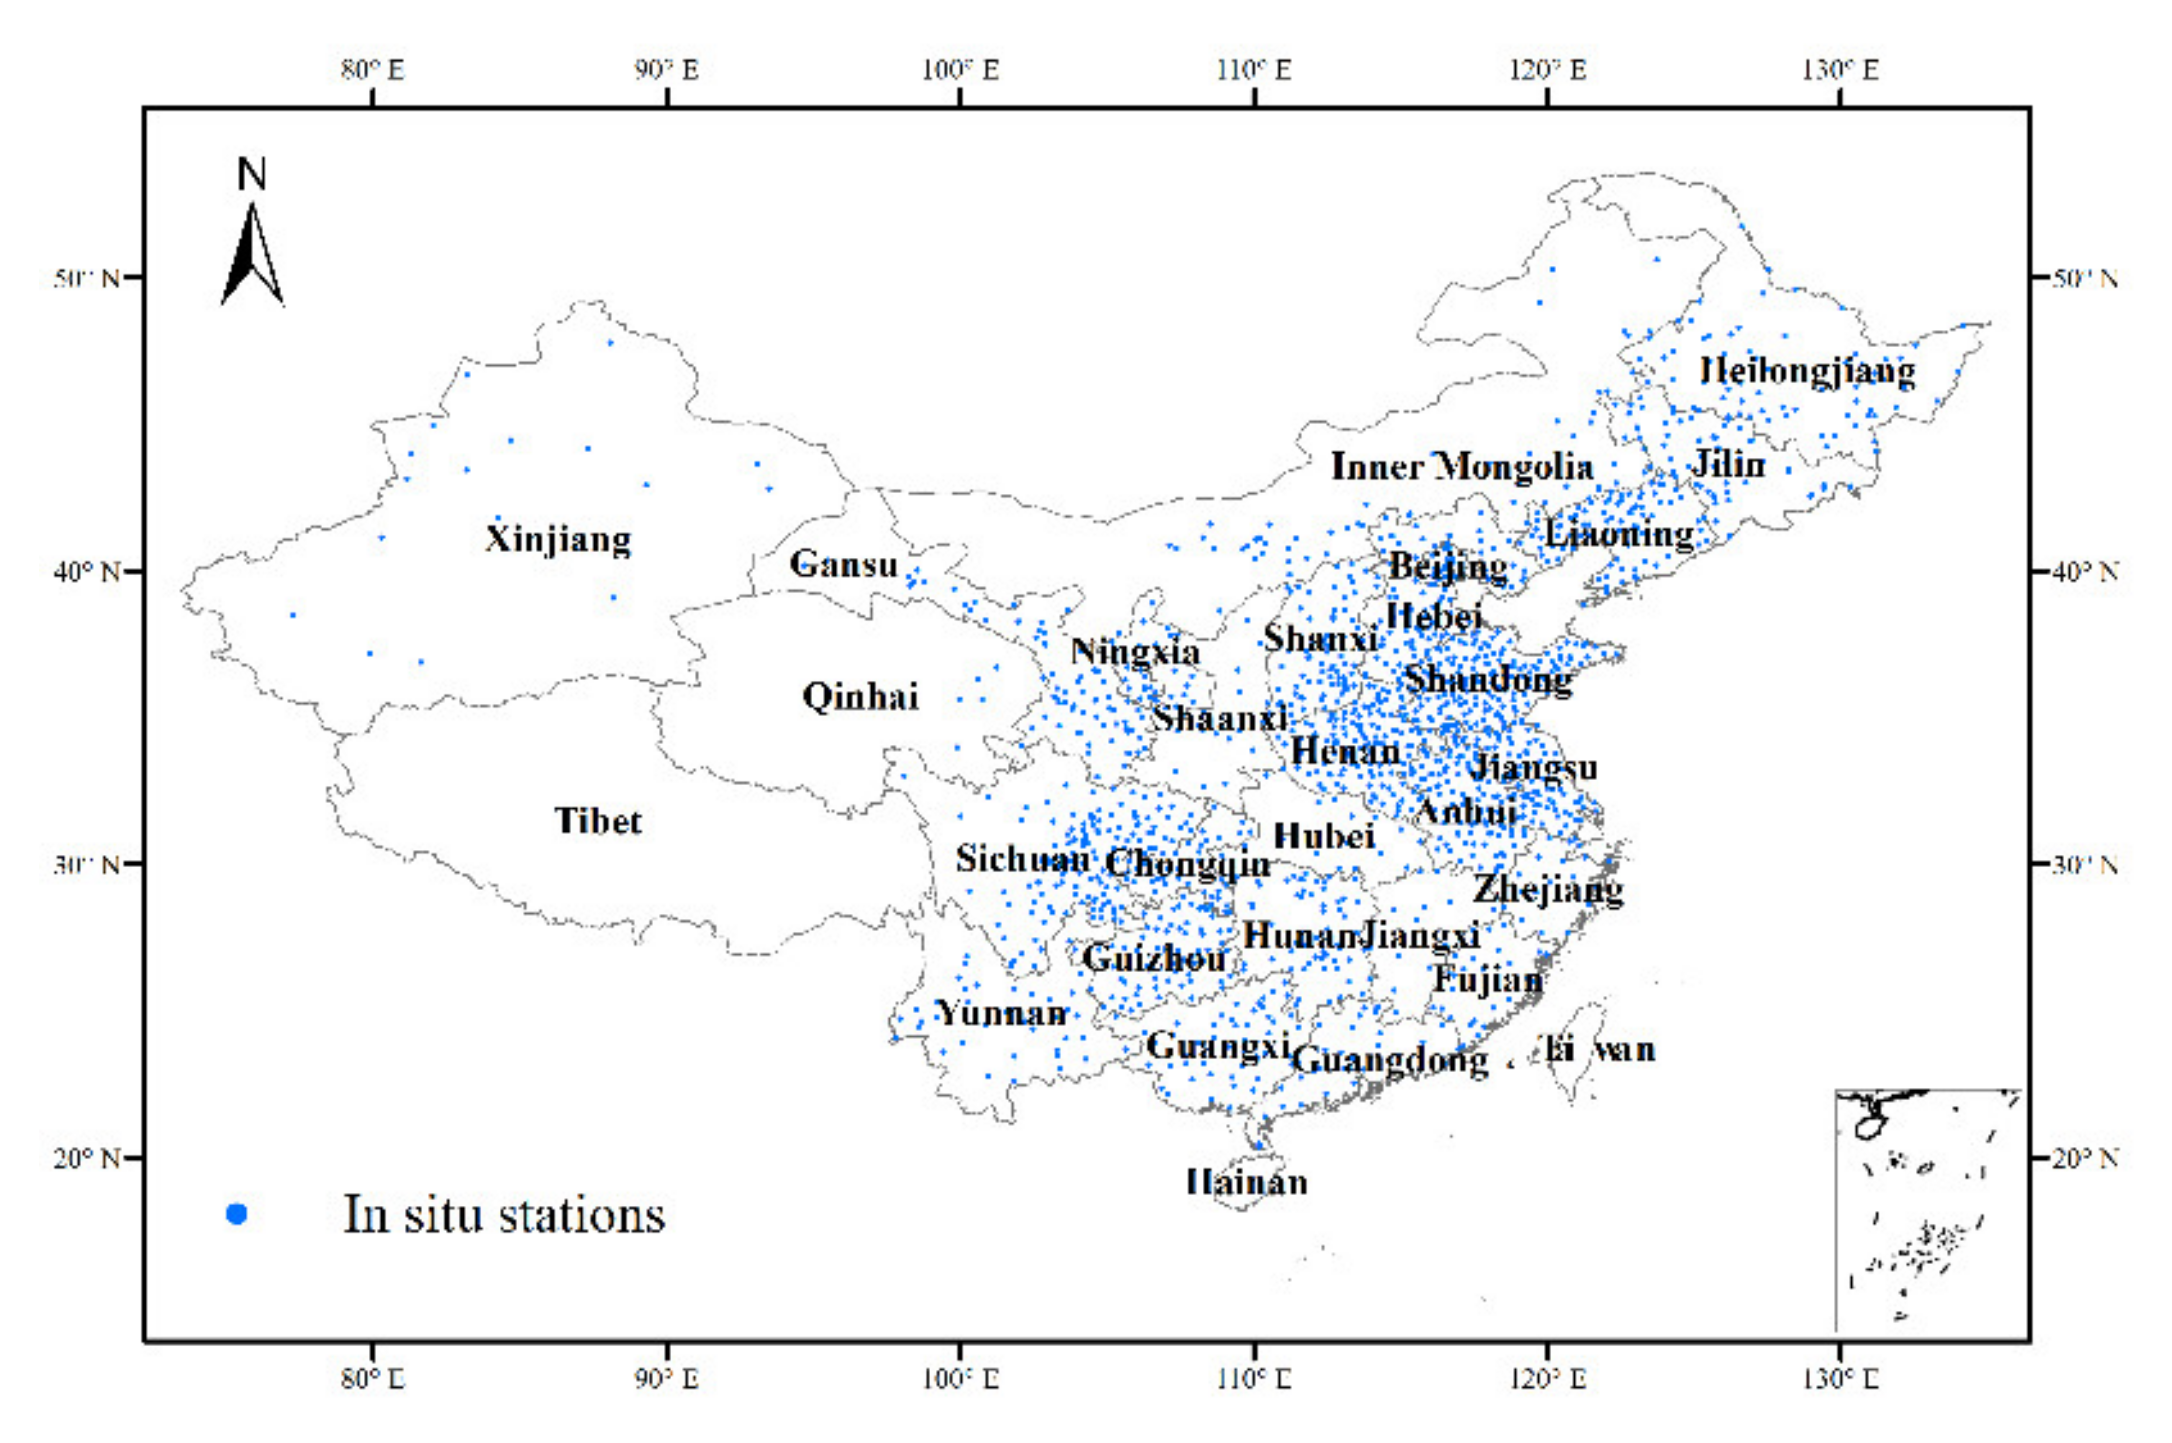
2.4. In Situ Measurements

In situ soil moisture measurements from the Ministry of Water Resources of China were used in this study. For each station, soil moisture is measured at 8:00 AM on the 1st, 6th, 11th, 16th, 21st, 26th of each month, at depths of 0–10, 10–20, and 20–40 cm. In situ data in the period of 31 March 2015 to 3 June 2018 were collected from 1682 stations nationwide. The average number of observations at each station is 220 during this period. Considering the penetration depth of SMAP, CCI, and SMOS is typically around 5 cm [40], only the top layer (0–10 cm) in situ soil moisture were used in this study. The data quality was checked by the Ministry of Water Resources, the sites with unreliable quality were deleted. Note that this is the first study to validate satellite soil moisture with such a large number of in situ sites in China (3 times more than previous studies, e.g., An et al., [29]). The geographical locations of these stations are presented in Figure 1. For those areas where crops are grown (e.g., North China Plain), the stations are located on irrigated land to accurately obtain the soil moisture of the field. Thus, these observations can maintain the irrigation signal.

2.5. VIC Model Outputs

The Variable Infiltration Capacity (VIC) model is a macroscale land surface model which was first proposed by Liang et al. [48]. Soil moisture simulations from the VIC model, which is the most widely used one in China [39], have been proven to be highly accurate among several land surface models [49]. When driven by the four categories of parameters (i.e., geography, vegetation, soil, and hydrological parameters) and meteorological forcing data (i.e., precipitation, land surface temperature, and wind speed), a variety of surface variables such as soil moisture and evapotranspiration can be simulated by VIC model [38]. Meteorological forcing data from China Meteorological Administration (http://data.cma.cn/) was used. The forcing data is based on the daily precipitation and temperature data of 756 meteorological stations [39]. The VIC soil moisture used here was the top layer (0–10 cm), expressed in volumetric water content m3m−3, with 10-km grid cells. Soil moisture from VIC model is available at a daily interval from 1951 to 2018.

2.6. Auxiliary Data

To better understand the performance of satellite-based soil moisture products over different land covers, the MODIS (MCD12Q1) landcover product was used in this study [50]. The land cover classification in this product was based on the International Geosphere Biosphere Programme (IGBP) taxonomy, which divide land covers into 17 categories [21].
To investigate the potential impact of irrigation on model and satellite soil moisture products, a global map of irrigation areas (GMIA_V5) (http://www.fao.org/nr/water/aquastat/irrigationmap/) from Food and Agriculture Organization of the united nations (FAO) was used. As shown in Figure 2, the irrigation map provides estimates of area equipped for irrigation, expressed as percentage of total area, with a spatial resolution at 5 minutes.
Satellite soil moisture retrievals are generally affected by surface temperature, vegetation, and soil texture [21,51]. To understand the impacts of these land surface characteristics on product accuracy, land surface temperature from Modern-Era Retrospective Analysis for Research and Applications (MERRA) reanalysis simulated by Goddard Earth Observing System Model version 5 (https://gmao.gsfc.nasa.gov/reanalysis/MERRA/), vegetation water content driven from MODIS NDVI climatology (https://modis.gsfc.nasa.gov/), and clay content from Harmonized World Soil Database version 1.21 (http://www.fao.org/soils-portal/soil-survey/soil-maps-and-databases/) were used in this study. Radio Frequency Interference (RFI) is considered as a key factor which affects the accuracy of satellite retrieval. Previous studies have shown that the accuracy of SMOS in Asia is reduced due to the influence of RFI [4]. Therefore, SMAP adds the RFI detection and mitigation algorithm to reduce the impact of RFI [21]. In this study, RFI data from SMOS ancillary were used to investigate the variation of product accuracy under different RFI conditions.
To investigate the relationship between representativeness error of in situ sites and topography, the topographic complexity data from CCI ancillary data (https://www.esa-soilmoisture-cci.org/) were used in this study. The topographic complexity was derived from the United States Geological Survey (USGS) 30-s Global Elevation Data (GTOPO30).

2.7. Data Processing

Table 1 summarizes the information of the satellite, in situ, and model soil moisture products mentioned above. As the satellites and model products have different grid resolutions and grid positions, the SMAP grid (EASE_v2) is defined as the reference grid. SMOS, CCI, and VIC data were resampled to this grid using the area-weighted average method, and the in situ stations were matched to the EASE_v2 grid using the nearest-neighbor pixel method [34]. For SMAP, soil moisture with the quality flag not recommended were filtered [27]. For SMOS, soil moisture with quality flag index DQX > 0.06 were filtered out [44].

3. Methods

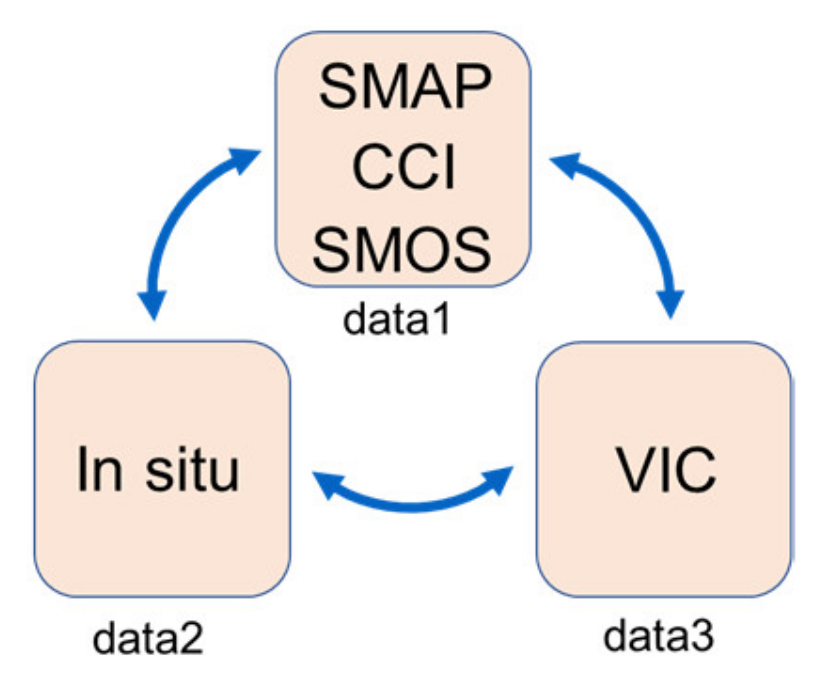
3.1. Triple Collocation and Extended Triple Collocation

TC was proposed by Stoffelen [9] to calibrate scatterometer-derived ocean winds and estimate errors. It is the most commonly used method for estimating error variances of large scale satellite-based products, such as soil moisture [9,34]. Crow et al. [30] found that TC-based validation is able to minimize the scale issue between grid-scale satellite soil moisture and point-scale in situ soil moisture [27]. Three collocated datasets with independent errors are required in this method, ideally composed of in situ measurements, satellite products, and model outputs [2,52]. Assuming that soil moisture from three datasets satisfy the following linear relationship:
θ 1 = β 1 + α 1 θ + ε 1 θ 2 = β 2 + α 2 θ + ε 2 θ 3 = β 3 + α 3 θ + ε 3
where θ is the unknown truth value of the target variable (i.e., true soil moisture in this paper), and θ 1 , θ 2 , θ 3 are values from three independent datasets (i.e., in situ soil moisture, satellite soil moisture, model soil moisture, respectively). β i (i = 1, 2, 3) and α i are the bias term and scale factor, and ε i is the zero-mean random error for each dataset. The unknown truth can be eliminated from each equation in Equation (1) by rearranging it and substituting it into the other equations [53]. The error variance can be obtained as Equation (2).
σ ε 1 * 2 = θ 1 * θ 2 * θ 1 * θ 3 * σ ε 2 * 2 = θ 2 * θ 1 * θ 2 * θ 3 * σ ε 3 * 2 = θ 3 * θ 1 * θ 3 * θ 2 *
where σ ε i 2 is the error variance of dataset i, θ i * equals to ( θ i β i ) / α i . Additionally, 〈〉 represents the calculation of the mean value. Note that error covariances between datasets are zero under the independence assumption [35].
Based on classical TC method, McColl et al. [33] proposed a new approach called Extended Triple Collocation (ETC), which solves the Pearson correlation coefficient (R) between one dataset and the unknown truth [53]. Like the TC, three independent datasets are needed here, and we assume that the relationship between datasets values and the unknown truth is linear [27]. In this way, R can be estimated by the following equation:
R i = σ i , j σ i , k σ i 2 σ j , k
where i, j, k are three independent products, i.e., in this study: soil moisture from satellite retrieval, in situ measurement, model output, respectively. σ i 2 and σ i , j are dataset variance of dataset i and covariance between dataset i and dataset j, respectively.
Note that in ETC, error variance from Equation (2) could also be calculated by the following Equation (4), which does not need a reference dataset [34].
σ ε i 2 = σ i 2 σ i , j σ i , k σ j , k
where the meaning of i, j, k, σ i 2 and σ i , j are the same with Equation (4).

3.2. Fractional RMSE and Conventional Validation Metrics

RMSE obtained from TC is considered as the absolute error variance, which is unsuitable for the inter-comparison of different products, as some products have rescaling strategies such as CCI [53]. To overcome this shortage, the relative error variance metric called fractional root mean square error (fRMSE) was proposed by Draper et al. [54]. The fRMSE is defined as follows:
fRMSE = R M S E j σ j
where RMSEj is the error for site j and σ j is the standard deviation, respectively. The main advantage for fRMSE is that mean additive biases between two products are removed by dividing by standard deviation, which makes the results more comparable. Furthermore, it should be noticed that the connection between fRMSE and correlation coefficient (R) is fRMSE = 1 R 2 [33].
Generally, in satellite product evaluation, conventional validation metrics such as R, RMSE, bias are widely used [14]. Among these metrics, unbiased RMSE (ubRMSE) is the most commonly used accuracy indicator because it removes long-term mean bias between two products [21]. The ubRMSE is defined as follows:
RMSE = i = 1 N X i Y i 2 N
Bias = i = 1 N X i Y i N
ubRMSE = R M S E 2 B i a s 2
where X represents satellite data, Y represents reference data which is usually in situ data, i represents temporally matched index between simulation and observation. N is the total number of matched observations. Compared with the conventional ubRMSE, TC-based RMSE also takes into account the spatial representativeness error on the basis of removal of long-term mean bias. There are other metrics to assess the temporal variation (not only R but also the anomaly correlation coefficient). It is the same calculation with R, but the anomalies are defined as the difference of the data from the moving window average [55,56]. Considering the validation period is not so long, we still use the normal R rather than the anomaly correlation coefficient.

3.3. Assessment Strategy

In this study, three triples of in situ, satellite, model soil moisture were used where the satellite dataset is one of SMAP, CCI, or SMOS (as shown in Figure 3). Only the Pearson correlation coefficient (R) was used as the metric when the accuracy of different products was inter-compared (in Section 4.2 and Section 4.3). RMSE was used as the metric for other analyses (in Section 4.4 and Appendix A). RMSE, R, and fRMSE were used as metrics in Section 4.1.

4. Results and Discussion

4.1. Overall Performance of Satellite Products

Figure 4a shows the correlation coefficient (R) of three satellite soil moisture products. The performance of SMAP and CCI is relatively similar, while SMOS has some significant differences. The highest values are observed in the SMAP product with a median R value of 0.69 and an averaged R value of 0.68. This is followed by the CCI product with a median R value of 0.65 and an averaged R value of 0.65. SMOS shows the lowest R among three products, with a median R value of 0.375 and an averaged R value of 0.38. The performance of SMAP is consistent with the study by Chen et al. [27], which has an averaged R of 0.76 globally while the performance of R in China is worse than other countries. The range of R is similar for SMAP and CCI, which both vary from 0.24 to 0.99. For SMOS, the highest R is 0.86 while the lowest R is almost near 0. The significantly worse performance of the SMOS product may be due to the high RFI in China [57] and the existence of algorithmic bugs [40].
The boxplot in Figure 4b presents the overall performance of the three satellite products in terms of RMSE. The best performance is observed for the CCI product, which has a median RMSE and an averaged RMSE both of 0.028 m3m−3. The median RMSE and averaged RMSE of SMAP is 0.039 and 0.040 m3m−3, respectively. As the retrieval accuracy goal of SMAP is 0.04 m3m−3 (after removal of long-term mean bias), SMAP just narrowly meets the requirement in China [21,58]. The highest RMSE is observed for SMOS with a median and an averaged value of 0.107 m3m−3, which is significantly larger than SMAP and CCI. Second, the range of RMSE is very limited for CCI, which confirms that CCI has a stable performance over different regions [25]. Compared with the CCI, the error range of SMAP is slightly larger with the highest RMSE at 0.081 m3m−3, which is twice as large as the retrieval goal [44,59]. SMOS has the largest error range among three products, which varies from 0.018 to 0.189 m3m−3. This large error range indicates that the performance of SMOS varies significantly for different regions.
Obviously, there is some disagreement between the R and RMSE metrics, i.e., SMAP is better than CCI in terms of R while CCI is better than SMAP in terms of RMSE. The reason for this result is that the CCI product has been rescaled through CDF-matching with GLDAS-Noah land surface model. Such a rescaling process usually reduces the dynamic range of soil moisture compared to individual satellite soil moisture products, which contain more noise [1]. To verify this hypothesis, the fRMSE of the three products was calculated, which removes the bias due to the difference in dynamic range (standard deviation) of the product itself [54]. As shown in Figure 4c, the median fRMSE and averaged fRMSE of SMAP is 0.720 and 0.707, respectively. The median fRMSE and averaged fRMSE of CCI is 0.758 and 0.75, respectively. SMAP shows the lowest fRMSE, which is consistent with results for R. It should be noticed that the fRMSE range of SMOS is very small, which indicates that the high standard deviation of the SMOS product is one of the reasons for large RMSE difference over different sites.
Generally, the retrieval accuracy of soil moisture is affected by the type of landcover [60]. Here, all in situ sites are classified into specific categories based on the MODIS landcover data. As shown in Figure 5, SMAP has the best performance in woody savanna, with an averaged R of 0.78. CCI has the best performance in evergreen and deciduous broadleaf, with an averaged R of 0.72. SMOS has the best performance in grassland, with an averaged R of 0.48. The worst performing landcover for SMAP, CCI, SMOS is bare surface, crop, woody savanna, respectively. Overall, CCI has the most stable performance among the three products. For CCI, SMAP, and SMOS, the difference between the highest R and the lowest R over different landcovers are 0.1, 0.28, 0.23, respectively. In general, CCI has the smallest variation in the accuracy over different landcovers, while SMAP and SMOS are more sensitive to the landcover change. The possible explanation for this result is that integration of multi-sources satellite data in CCI products brings more robustness over different landcover types, while a single product may contain large errors in certain landcovers.
To investigate the latitudinal error characteristics among different satellite products, the latitude average is calculated for each product (as shown in Figure 6). In low latitudes (20° N to 30° N), SMAP and CCI show a relatively similar behavior, while SMOS shows an opposite trend. The lowest peak values in the distribution lines of SMAP, CCI, SMOS are found in 48° N, 33° N, 25° N, respectively. For SMAP, the overall trend is that the performance decreases with the increases of latitude (except for 50° N), while SMOS has almost the opposite trend. CCI is still the most stable product which has the least R change with latitude changes. However, the accuracy of CCI decreases significantly when the latitude is between 32° N and 36° N. The possible reason is that this latitude range is located in the irrigated areas of China, and the accuracy of CCI is affected by irrigation. For more analysis of the effects of irrigation see Section 4.2.

4.2. Spatial Error Characteristics and Irrigation Impact Analysis

The spatial performance of R for three satellite-based soil moisture products is compared in Figure 7. Overall, SMAP and CCI have their own advantages in different regions, while the SMOS performs the worst among three products. For SMAP, performance of R in South China (typically Southern Sichuan, Guizhou, Yunnan province) are the best, which are generally above 0.8 (the location of these provinces is shown in Figure 1). The second most accurate region for SMAP is in Shanxi province, which has R values of 0.7–0.8 for most sites. The worst performing areas for SMAP are Heilongjiang, Jilin, Inner Mongolia, and Anhui provinces, with R values below 0.5 for most sites. For CCI, it is demonstrated that performance of R in South China (except Guizhou province) are also good, with R values between 0.7 and 0.8, while the worst R performing area is in Henan province. Compared with SMAP, CCI has better performance in North China (including Heilongjiang, Jilin, Inner Mongolia, and Ningxia provinces). However, in the North China Plain (including Hebei, Henan, Shandong, Anhui, Jiangsu, Tianjin, and Beijing provinces), performance of CCI is much worse than that of SMAP, in this region, the R values of CCI are usually only between 0.5 and 0.6. For SMOS, most areas have an R value of less than 0.4.
In the irrigated area (as shown in Figure 2), the accuracy of soil moisture from the land surface model is strongly affected by the model structure, i.e., if the model itself does not contain an irrigation module, there will be a significant decrease of simulation accuracy in the irrigation area [61]. However, satellite-based soil moisture retrieval can effectively improve this situation due to the preservation of irrigation signal during soil moisture retrieval [5]. Figure 7d shows the performance of R for VIC soil moisture product. It demonstrates that the R values of VIC model in Henan, Shandong, Hebei provinces decreases by 0.2–0.4, indicating that the lack of irrigation module in the land surface model does affect the accuracy of soil moisture in the irrigation areas [62]. For SMAP and SMOS, the retrieval accuracy in these irrigation areas has not been reduced, which indicates that the accuracy of the retrieval is less affected by the irrigation. In irrigated areas, if we use a triplet of in situ, SMAP, and CCI active product in TC, the correlation coefficient of SMAP will increase (which is caused by the low accuracy of VIC model in these areas). This indicates that the actual correlation coefficient of SMAP in irrigated areas may be higher than the results in this study. It should be noted that although the CCI soil moisture is a satellite-based product, the accuracy of CCI has also been greatly reduced in irrigated areas. The reason for this result may be caused by the land surface model used in the CCI combined product [25]. In the merging process, the GLDAS-Noah land surface model soil moisture is used as the scaling reference when merging soil moisture into a consistent climatology [1]. Therefore, the missing of irrigation module in land surface model may also affect the accuracy of CCI combined product in irrigation area. The results indicate that rescaling to a biased model may lead to the loss of valuable signals, which is consistent with the conclusions of Kumar et al. [37].
To further quantify the impact of irrigation on different soil moisture products, the boxplot of performance in terms of R over the whole validation period with different irrigation percentages is exhibited in Figure 8 (the red parts of the boxplot). To support the above-mentioned hypothesis that the rescaling strategy of CCI_COMBINED product is the main reason for accuracy decrease in irrigated areas, the other two soil moisture products in the ESA CCI programme, i.e., the CCI_ACTIVE and CCI_PASSIVE are also analyzed here. Note that the CCI_ACTIVE and CCI_PASSIVE products were not rescaled to GLDAS-Noah simulations, instead to ASCAT and AMSR-E soil moisture observations, respectively [22]. For VIC, the significant trend is that the performance decreases with the increase of irrigation percentage. The performance of median R in the most irrigated area is 0.1 lower than in the least irrigated area due to irrigated impact. It is demonstrated that VIC has the best performance among six soil moisture products when the irrigation percentage is below 60%, with the median R value around 0.76. However, SMAP and CCI_PASSIVE become the best performing products among the six products when the irrigation percentage is greater than 60%. For SMAP and SMOS, there is no significant irrigation impact unlike VIC. The best R performance of SMAP is found when the irrigation percentage is between 80% and 100%, with the median R value of 0.72. For the CCI_COMBINED product, irrigation impacts similar to the VIC product are found. The worst CCI_COMBINED median performance of 0.57 is found when the irrigation percentage is above 80%. Besides, the performance of R for CCI_COMBINED product decreases by 0.09 due to irrigation impact. For CCI_ACTIVE product, the performance of R decreases slightly yet not as much as CCI_COMBINED. For CCI_PASSIVE product, the performance of R has not decreased in the irrigated areas, a similar trend is found between the SMAP and the CCI_PASSIVE product. In addition, it should be noticed that in low irrigated areas (irrigation percentage less than 40%), CCI_COMBINED product has a better performance than CCI_ACTIVE and CCI_PASSIVE product. However, in highly irrigated areas (irrigation percentage greater than 60%), the performance of CCI_COMBINED product is worse than CCI_ACTIVE and CCI_PASSIVE product. The result indicates that rescaling strategy of CCI_COMBINED improves product precision in the low irrigated areas, while it reduces the product accuracy in the highly irrigated areas.
As shown in Figure 2, the most irrigated area is in the North China Plain. In this area, the main crop is winter wheat with the crop season from October to May of the following year (www.moa.gov.cn). According to the irrigation policy in this area, the best timing for irrigation is before winter (October to December) and spring (March to May), indicating that more irrigation would be detected during this period. The boxplots of R for six soil moisture products over the crop season are also shown in Figure 8 (the blue parts of the boxplot). Compared with the whole validation period, VIC is more affected by irrigation during the crop season. For highly irrigated areas, the performance of the VIC product decreases more during the crop season than during the whole validation period. The median performance of R for these areas is 0.58 and the decrease of R caused by irrigation impact is 0.18. Similar to VIC product, more irrigation impact is also found for the CCI_COMBINED product during the crop season. However, for the other four soil moisture products, very little irrigation impact is discovered. After checking the proportion of active and passive products in the irrigated area, and the degree of accuracy decline of active product and combined product, respectively, we believe that the main reason is caused by the rescaling with GLADS-Noah. These results demonstrate that the satellite soil moisture products have more advantages compared with model product in the irrigated areas. Besides, care must be taken when model products are used in, or incorporated into, the generation of satellite derived products (i.e., assimilation, rescaling, merging) in irrigated areas. It also demonstrates that the model independent rescaling approach (e.g., using SMAP soil moisture product or models with irrigation module as reference data rather than GLDAS-Noah) should be considered for the CCI_COMBINED product, especially in highly irrigated areas.

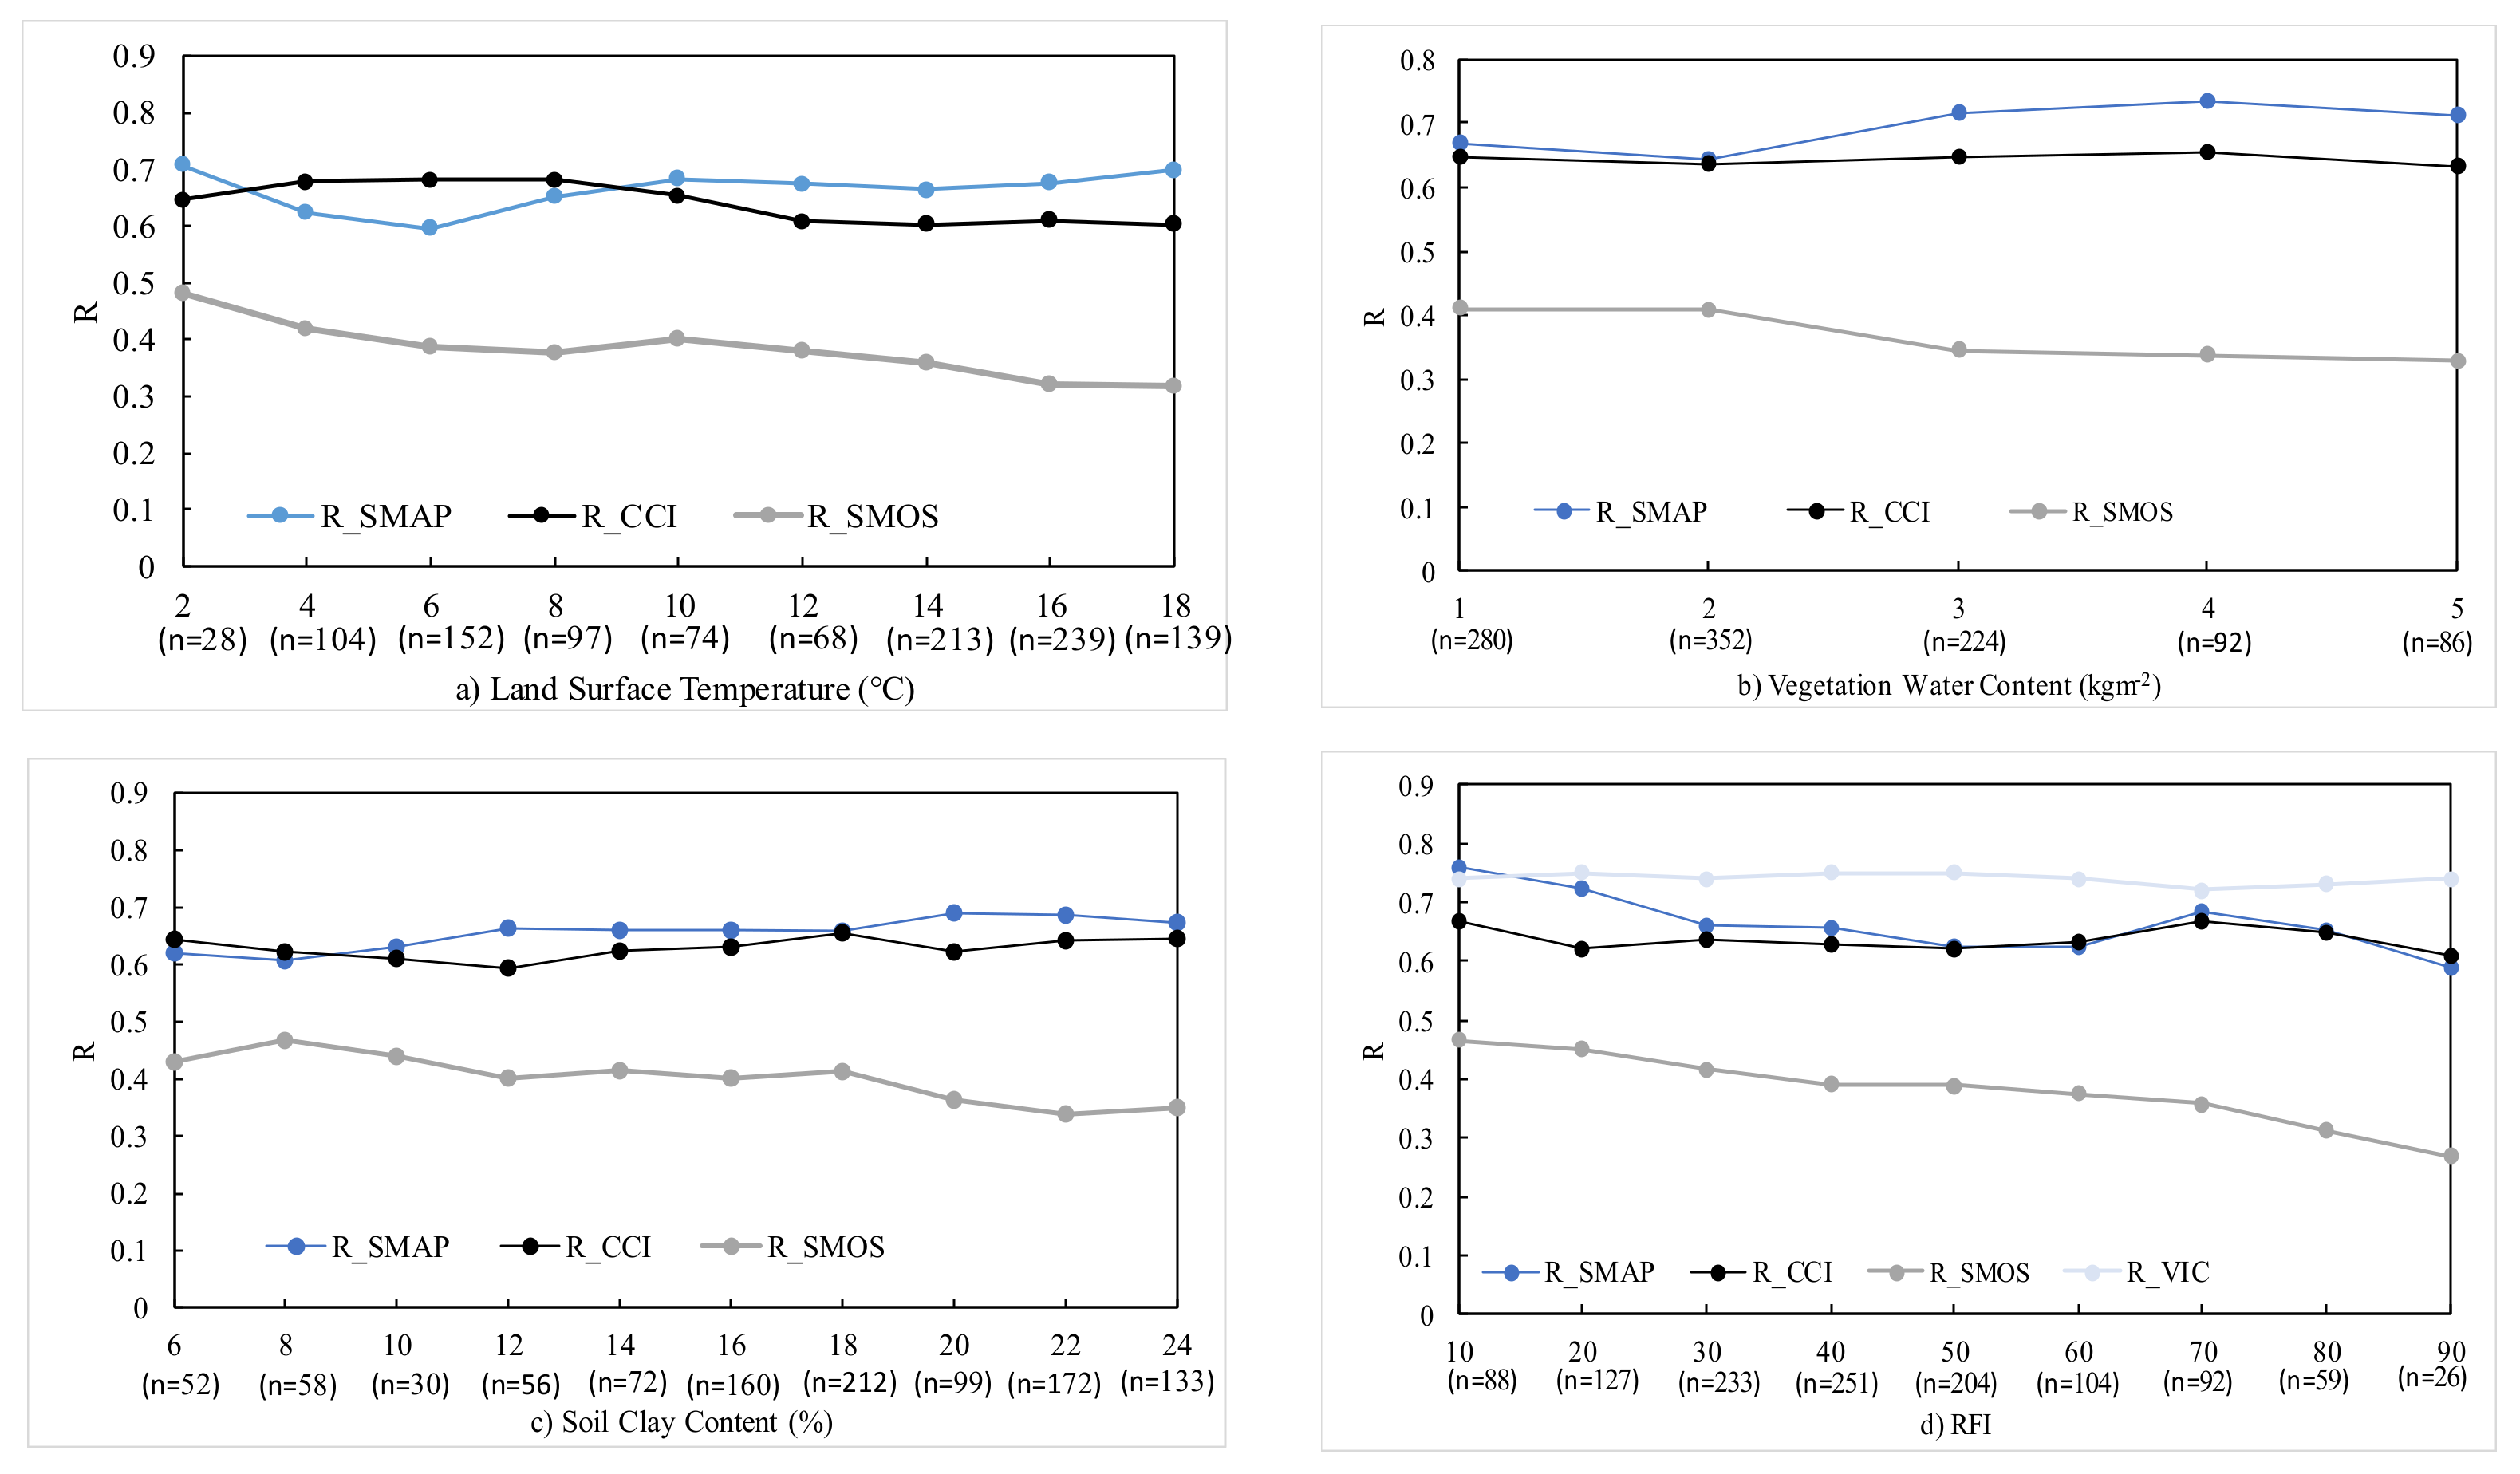
4.3. Impacts of Land Surface Characteristics on Product Accuracy

In this section, the impacts of four land surface characteristics and RFI on product accuracy are assessed. For satellite soil moisture retrievals, several environmental impact factors are considered, e.g., surface temperature, vegetation, and soil texture [21]. To assess the impact of these factors on product accuracy, performance of R against mean annual land surface temperature, mean vegetation water content, and soil clay content of each individual station are plotted in Figure 9. Note that the points in Figure 9 represent the average R under the corresponding impact factor. Lines between points are used to better visualize and understand the trend. In addition to the four impact factors mentioned above, RFI is also considered one of the most critical factors which affect the quality of L-band satellite soil moisture products [4,57]. Therefore, SMAP adds the RFI detection and mitigation algorithms to reduce the impact of RFI [21]. The similar analysis considering RFI is exhibited in Figure 9d.
For surface temperature, dates without successful retrievals are excluded from the calculation of average surface temperatures. Specifically, with the increase of land surface temperature, the performance of SMOS has a significant downward trend, while SMAP and CCI have less variation. The possible reason for this is the assumption that the plant and soil temperatures are consistent is no longer valid when the land surface temperature is too high [11]. However, the overall performance for SMAP increases when surface temperature exceeds 6 °C, which agrees well with the results from Zhang et al. [58]. A possible reason is that the temperature correction in the SMAP retrieval algorithm helps to improve the data accuracy of SMAP. In terms of vegetation water content, SMAP and SMOS have the opposite trends. With the increase of vegetation water content, the performance of SMAP increases while the performance of SMOS decreases. A similar vegetation impact for SMAP and SMOS is also found in the research from Ma et al. [63] and Zhang et al. [58]. In addition, when the grid VWC is less than 5 kg/m2, the average ubRMSE of SMAP is 0.04 m3m−3, which meets the accuracy requirement of the SMAP algorithm from Jackson et al. [64]. The performance of the CCI product is the most stable among the three products (with very little variation in performance), which indicates the advantages of the integration of multi-sources satellite soil moisture products [1]. For the soil clay content, the CCI product is also the most stable product with very little change of performance over different land surface characteristics, followed by SMAP and SMOS.
As shown in Figure 9d, SMOS has a clear pattern that the performance of R decreases as RFI increases. For SMAP, the performance of R also decreases slightly as RFI increases yet not as much as SMOS. Specifically, the differences in R caused by RFI are 0.15 and 0.20 for SMAP and SMOS, respectively (take R across RFI for VIC as a reference dataset as it is insensitive to RFI). The result indicates that the special hardware for detection and filtering of RFI installed in the SMAP radiometer can effectively reduce the impact of RFI [21]. The influence of RFI on the CCI is still the lowest among the three products. When RFI is close to 0, SMAP has the largest R advantage compared with CCI (around 0.1). When RFI is over 50, the difference is much smaller (within 0.01).
In summary, SMOS is the most sensitive to land surface characteristics among all products, followed by SMAP and CCI. Integration based on multiple sources of products will bring more stability over these factors compared to single products. Besides, the results also indicate that more effort should focus on RFI mitigation, surface temperature correction, and vegetation correction in the SMAP and SMOS retrieval algorithm.

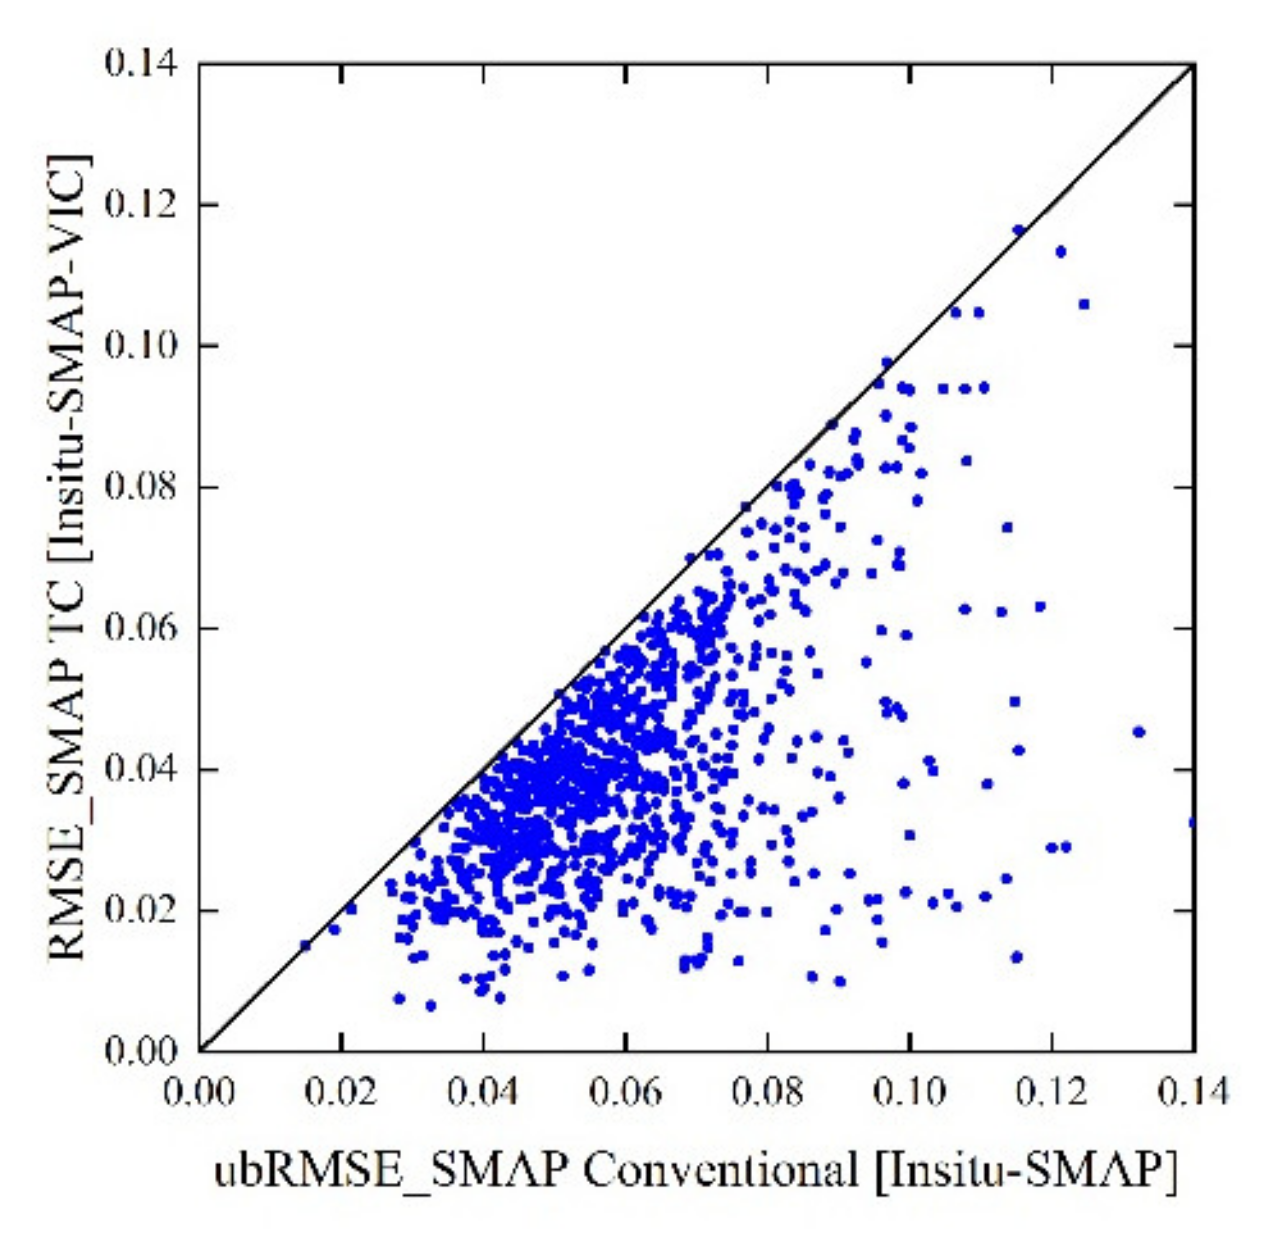
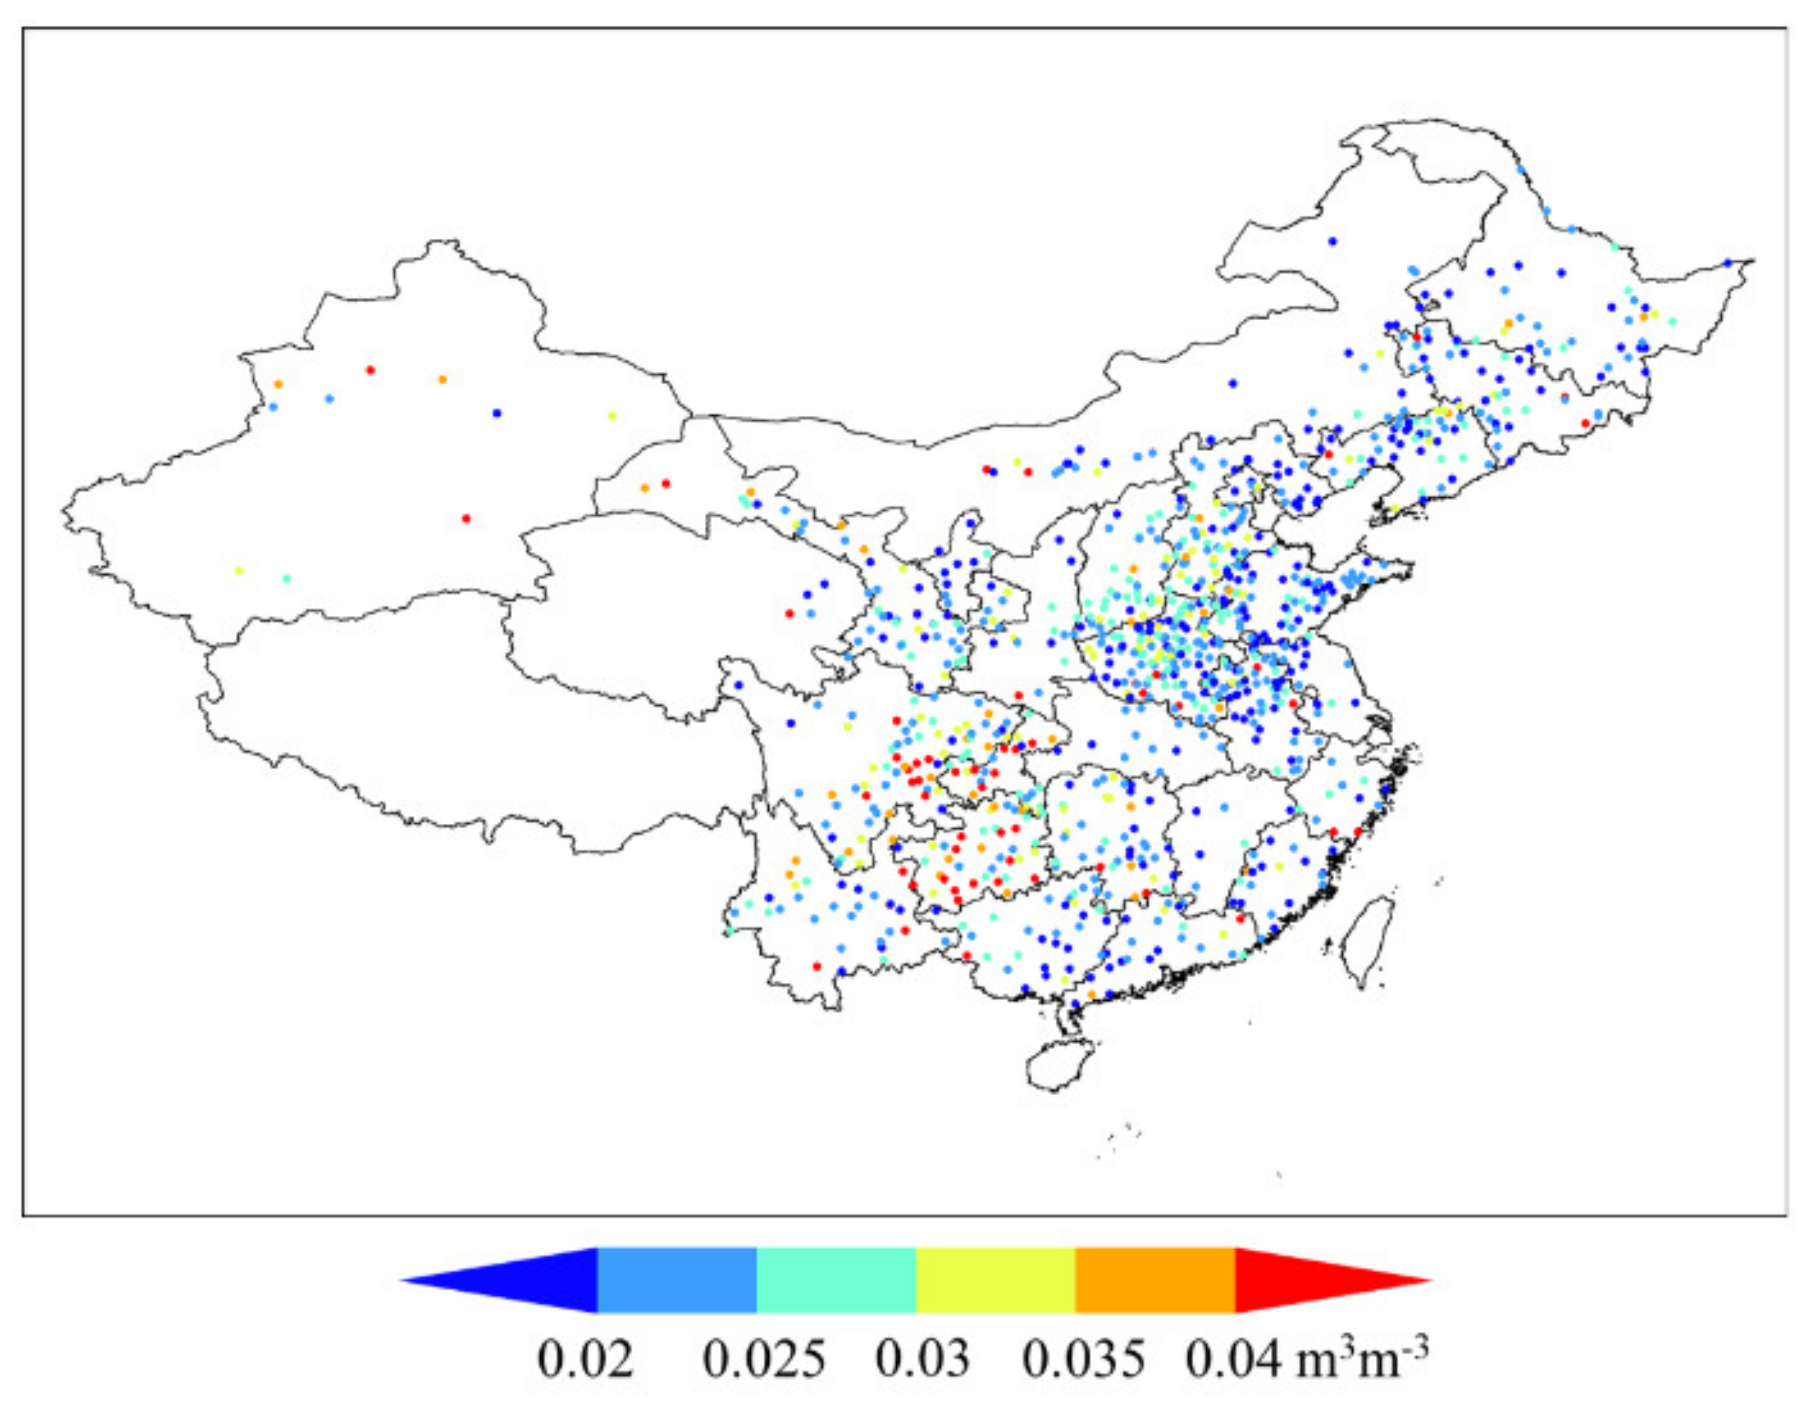
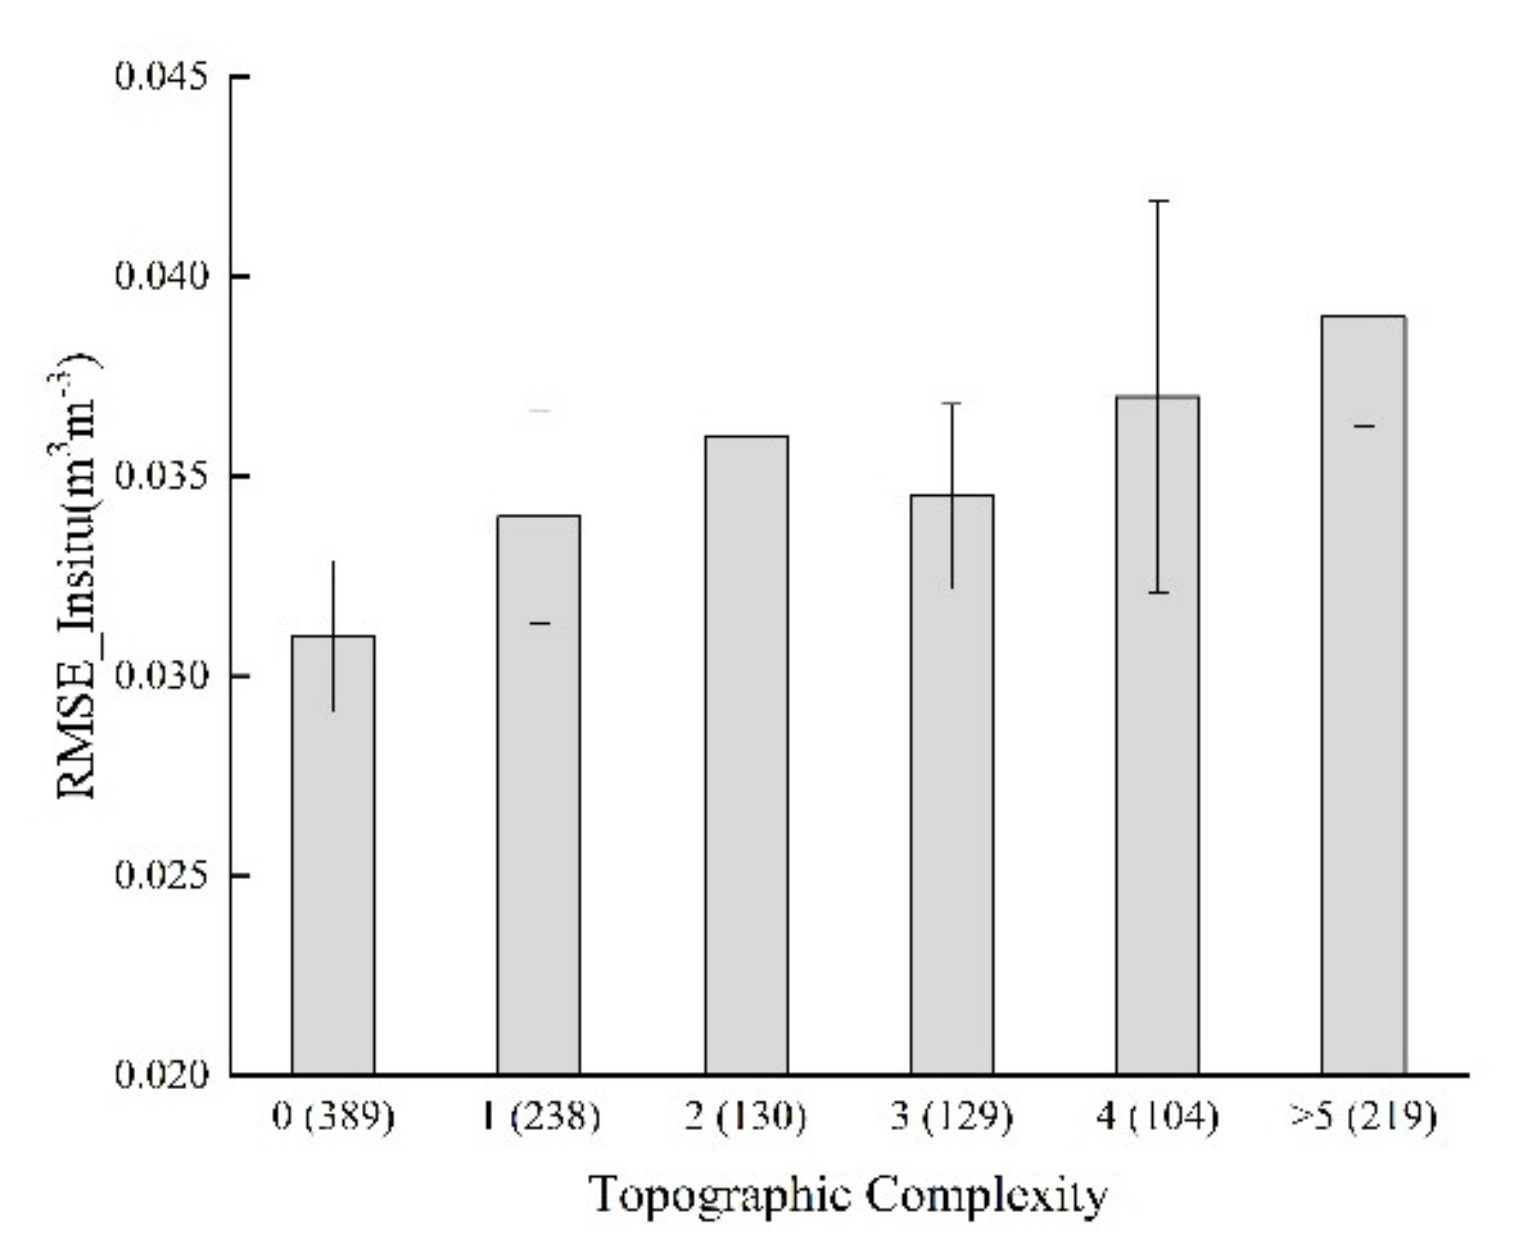
4.4. Spatial Representativeness Error of In Situ Sites

Compared with conventional validation, the consideration of representativeness error is one of the advantages for TC-based validation [34]. The long-term mean bias is removed when conventional ubRMSE is used, while TC-based RMSE takes into account both the long-term mean bias and spatial representativeness error [30]. Comparison between the conventional validation metric ubRMSE (i.e., validated SMAP product using in situ measurement only) and TC-based RMSE (i.e., in situ, SMAP, and VIC soil moisture are used here) of SMAP are shown in Figure 10. As shown in Figure 10, ubRMSE from conventional validation are generally higher than TC-based RMSE. The average difference between ubRMSE and RMSE is around 0.02 m3m−3, with the averaged RMSE of 0.04 and averaged ubRMSE of 0.06 m3m−3. The same comparison between TC-based RMSE and conventional ubRMSE has been undertaken by Dorigo et al. [25], with the average difference around 0.01 m3m−3. The possible reasons for this result are (1) satellite soil moisture products with a higher spatial resolution are used in his study or, (2) a higher density of in situ sites are used in the study. The conventional ubRMSE can correct the systematic error (e.g., long-term mean bias is removed) between in situ measurement and satellite product, however, some uncertainty still exists during the validation process [34]. The uncertainty may come from the representativeness error of in situ data considering the spatial scale mismatch between point scale and grid scale [30]. However, TC-based RMSE attempts to minimize such uncertainty, as TC-based RMSE reflects the error against unknown grid scale truth [27]. As a result, the difference between TC-based RMSE and conventional ubRMSE also indicates the representativeness error of individual sites [25]. Thus, if the points in Figure 10 are at the lower right, it indicates that the corresponding in situ sites have a large spatial representativeness error. It also means that if the corresponding in situ data are used directly for the evaluation of satellite soil moisture products, a lot of uncertainty (e.g., large representativeness error of in situ measurements) may be involved. As a result, in situ sites at the lower right corner are considered unreliable sites. In contrast, sites close to the 1:1 line are considered to be reliable sites, which means that these sites represent high accuracy soil moisture at grid scale [34]. In addition, the results using conventional validation in these sites can be less-biased even without TC-based validation. It is important to distinguish such reliable sites, because in some cases, the data length of some sites is insufficient to perform TC. In this way, conventional validation in reliable sites will be more convincing.
Figure 11 shows the RMSE spatial pattern of in situ sites. It is noticed that the errors of in situ measurements in Guizhou, Chongqing, Zhejiang, and Shanxi province (most mountainous area in China) are relatively larger than other areas, which may be caused by the highly complex topography in these regions. The regions which have the best performance of RMSE for in situ measurements are Shandong and Henan province, which belong to the North China Plain. In these regions, relatively flat terrain conditions increase the spatial representation of point scale in situ measurements. Another valuable conclusion from Figure 11 is that, in the region with large representativeness error, a higher density of in situ sites is needed [30].
It is assumed that the RMSE of in situ sites is mainly due to the representativeness error [30]. To further verify the relationship between RMSE of in situ sites and terrain complexity, Figure 12 shows the average RMSE of in situ sites over different topographic complexity. In general, it demonstrates that with the increase of topographic complexity, the RMSE of in situ sites also increases correspondingly. The minimum error of 0.031 is found when topographic complexity is 0, while the maximum error of 0.039 is found when topographic complexity is over 5. This finding can be used to decide the location and density of in situ sites using topographic complexity data, which can help to reduce the representativeness error impact of in situ sites.

5. Conclusions

In this study, the assessment of three satellite soil moisture products (i.e., SMAP, SMOS, CCI) against in situ soil moisture from 1682 sites was conducted over China. Triple collocation-based validation was used to minimize the uncertainty caused by spatial representativeness error of in situ sites [27]. Several conclusions are summarized as follows:
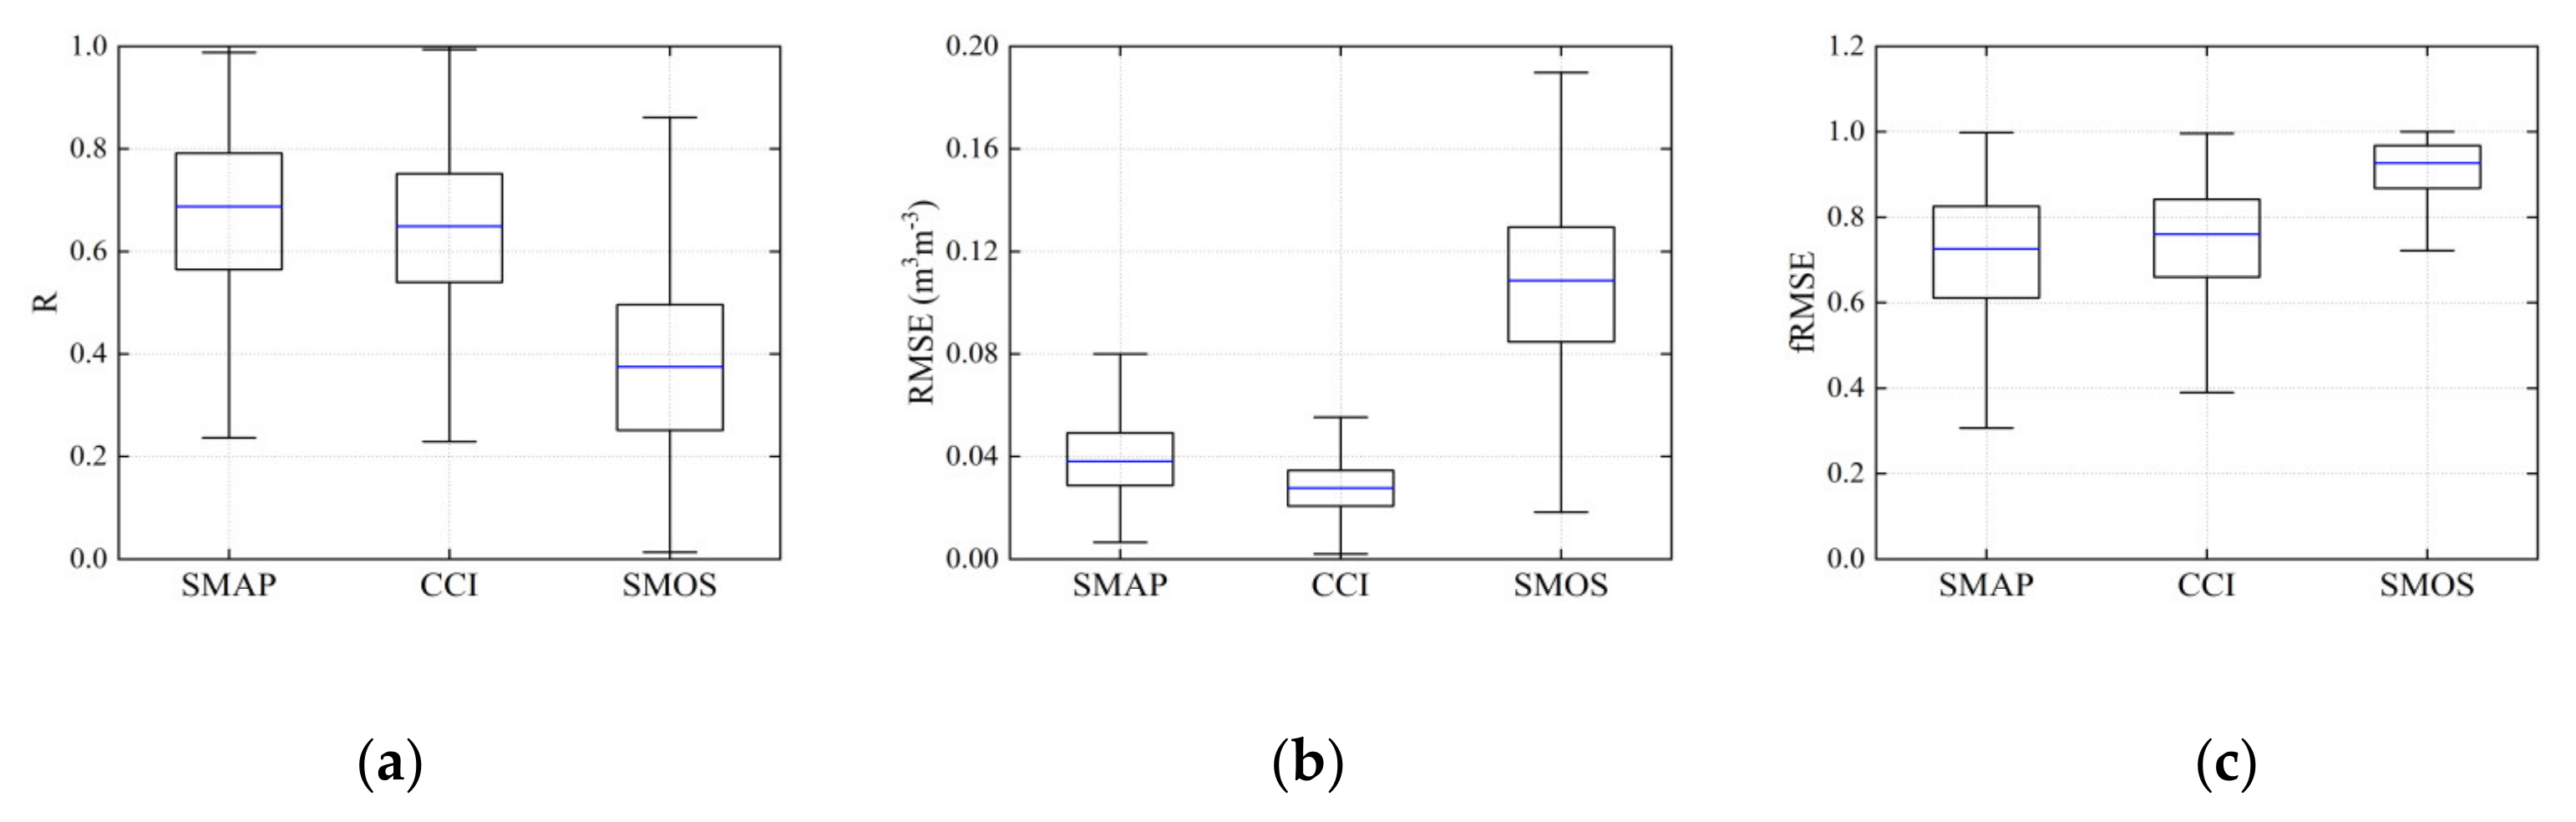
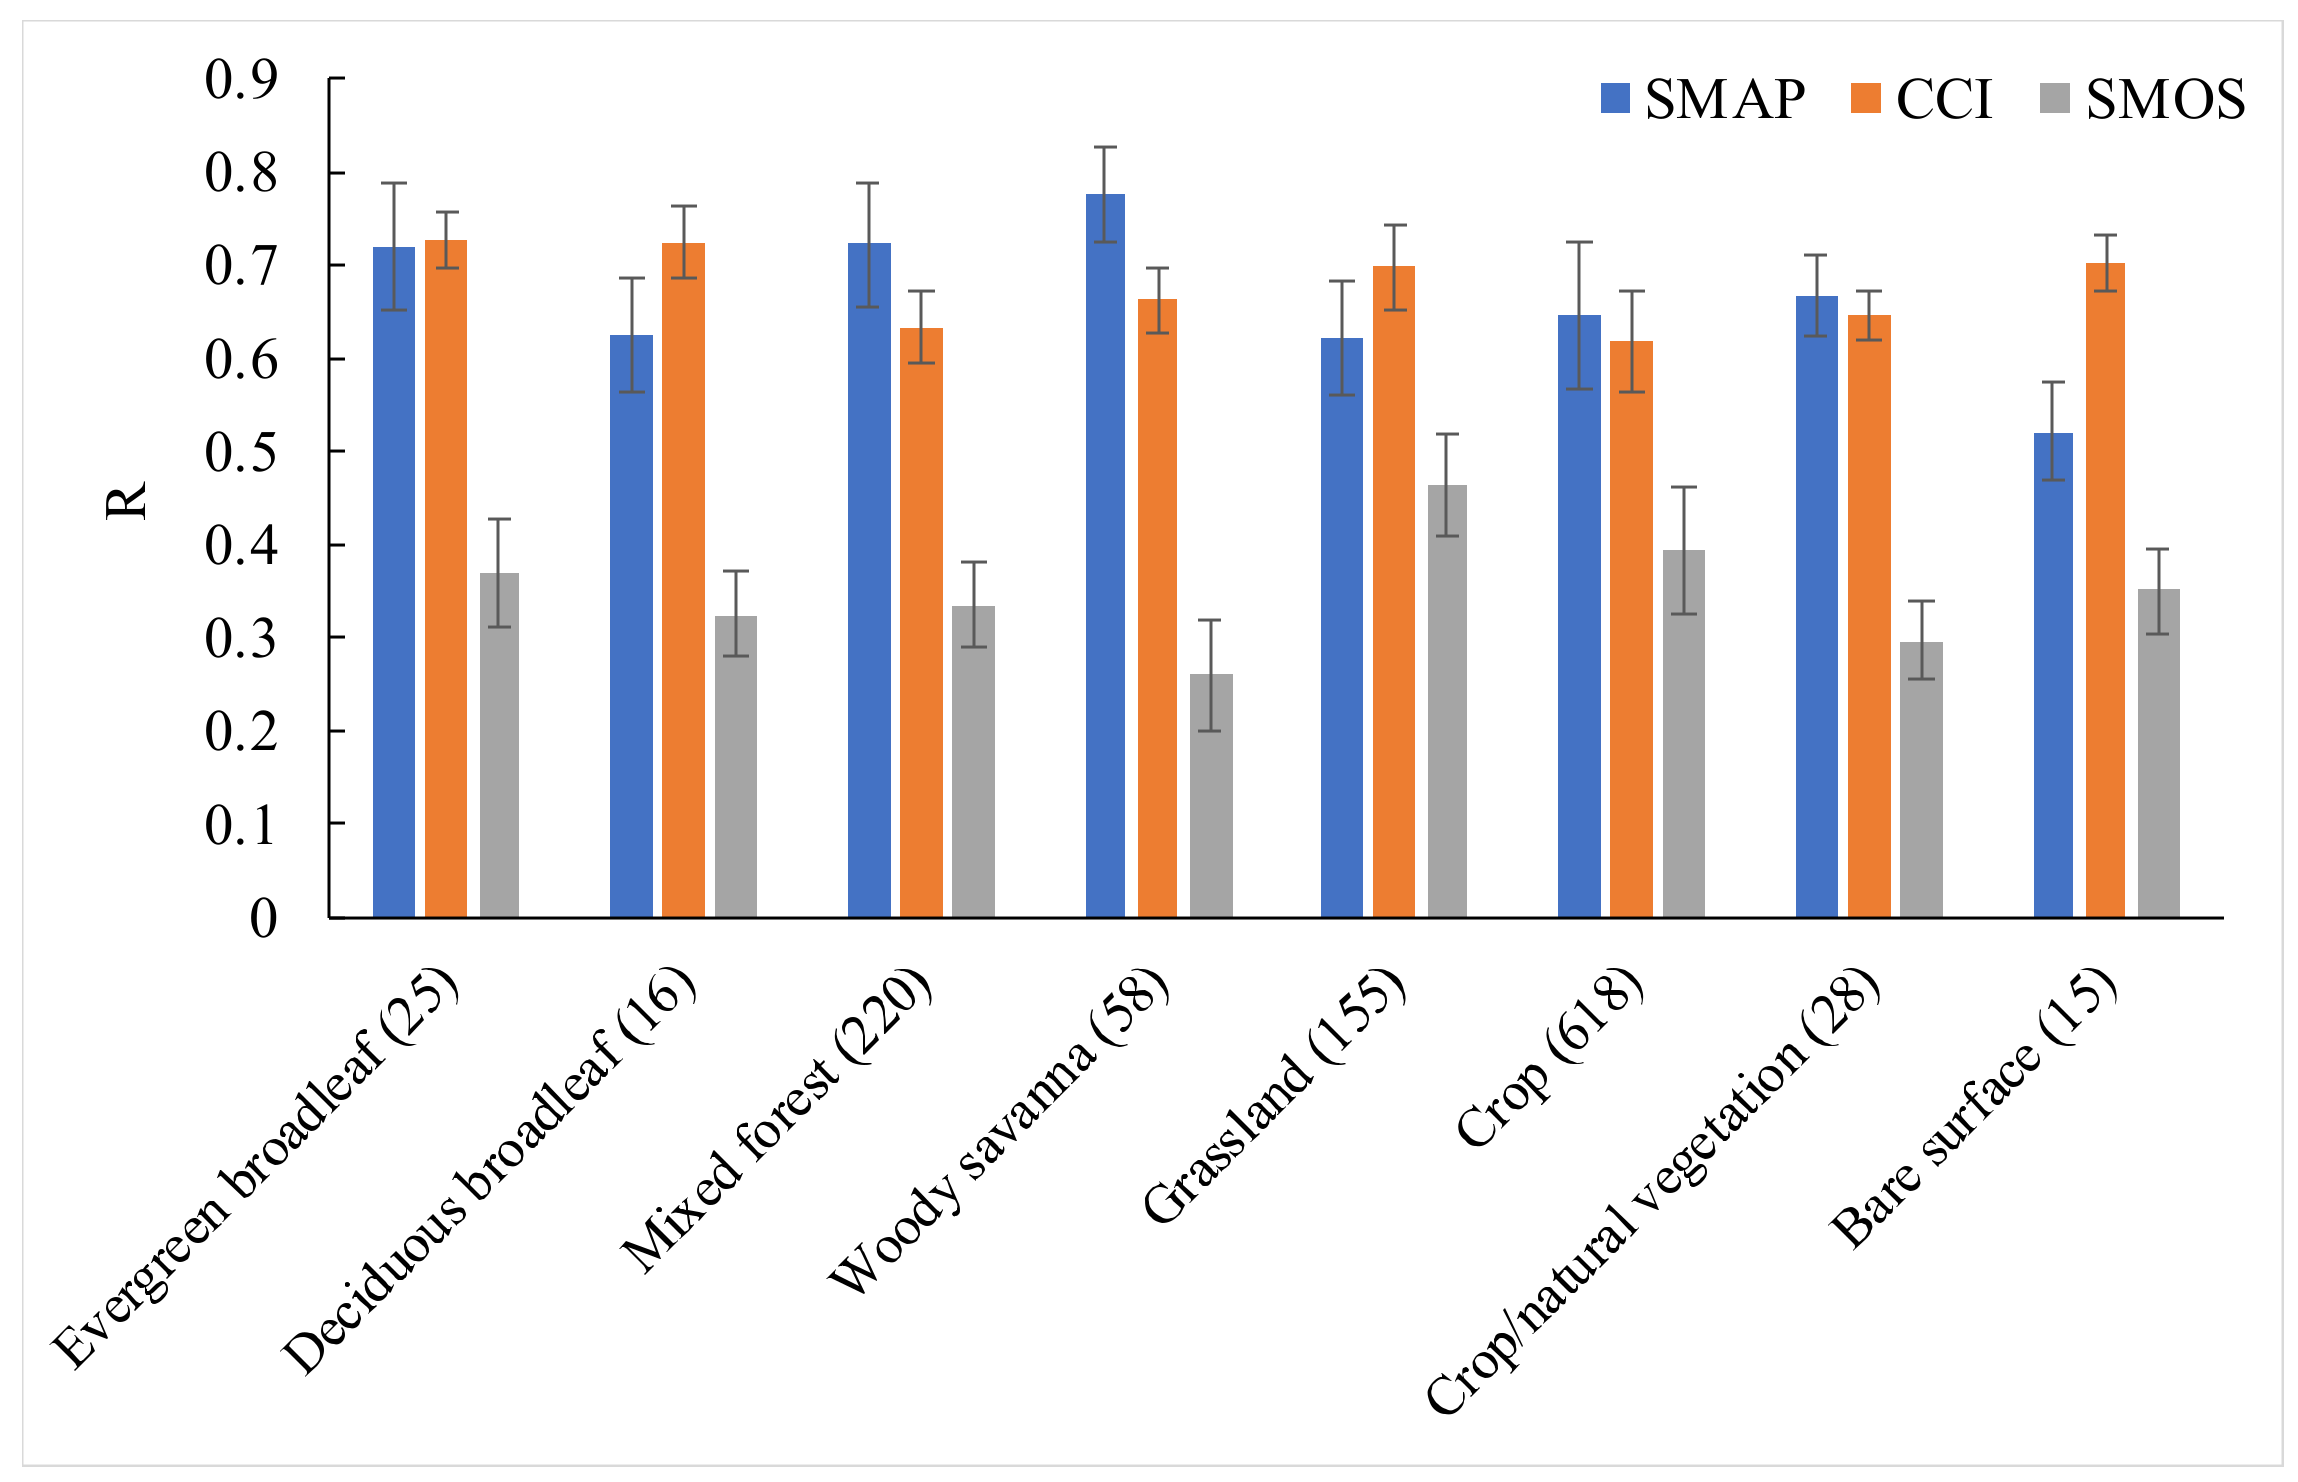
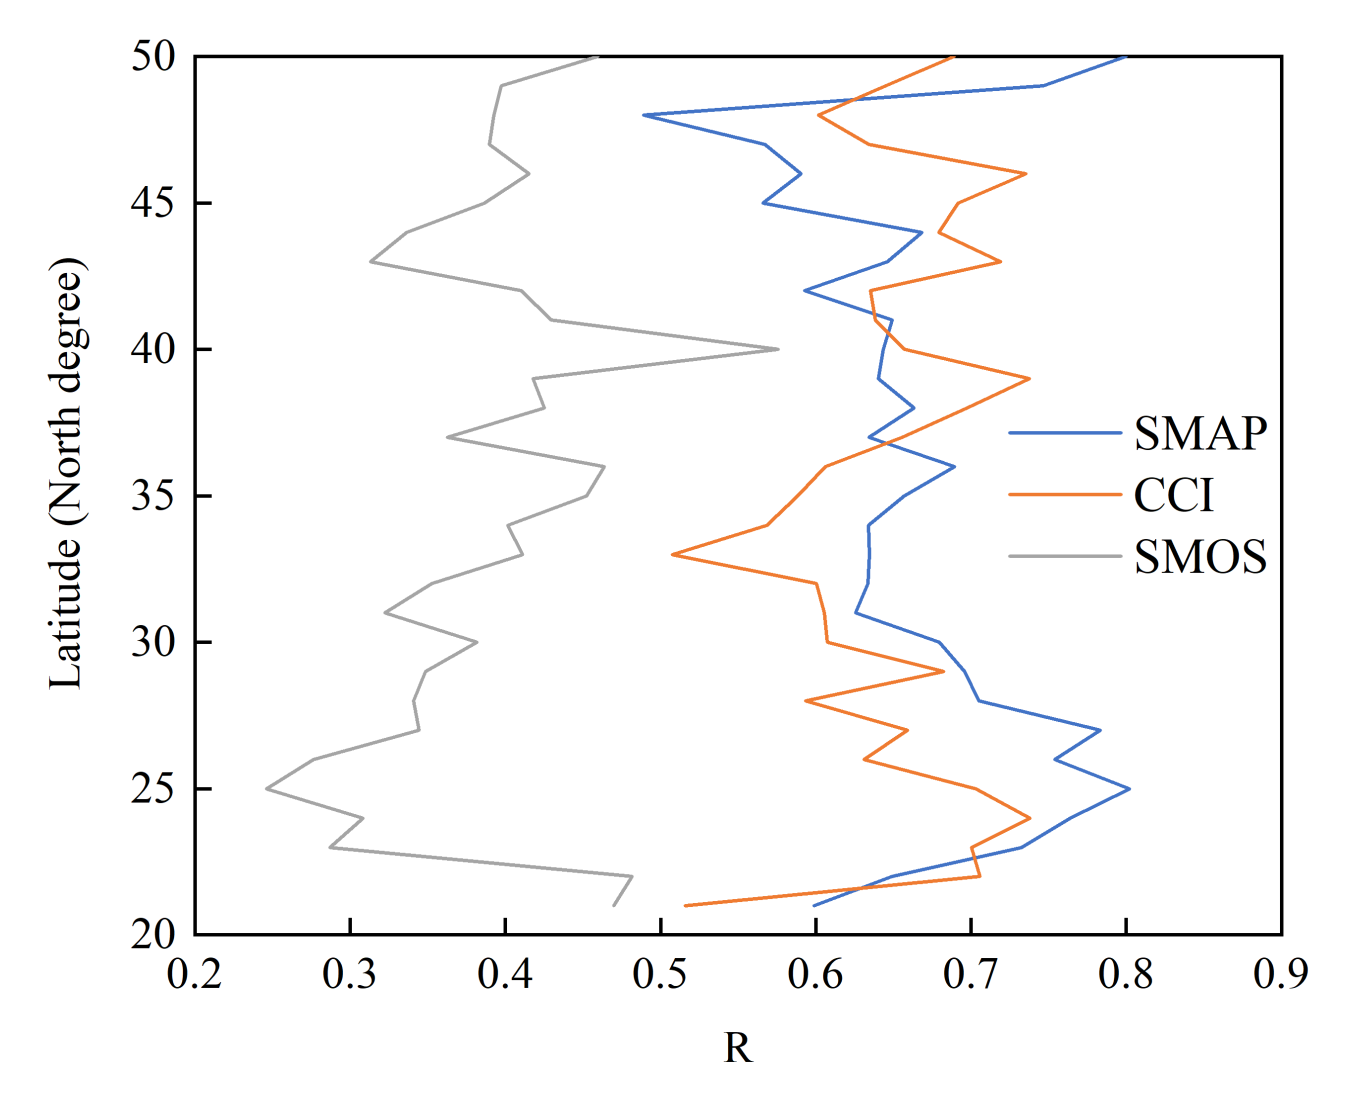
  • SMAP and CCI are found to be more reliable than SMOS in China, for all metrics that are considered. The overall RMSE of SMAP, CCI, SMOS is 0.040, 0.028, 0.107 m3m−3, respectively. The overall R of SMAP, CCI, SMOS is 0.68, 0.65, 0.38, respectively. The overall fRMSE of SMAP, CCI, SMOS is 0.707, 0.750, 0.897, respectively. SMAP just meets the data accuracy requirement of 0.04 m3m−3, while SMOS is far away from data accuracy requirement possibly due to severe RFI influence in China [4,57]. The CCI product is the most stable product over different landcover types. The best performing landcovers for SMAP, CCI, and SMOS are woody savanna, broadleaf, and grassland, respectively.
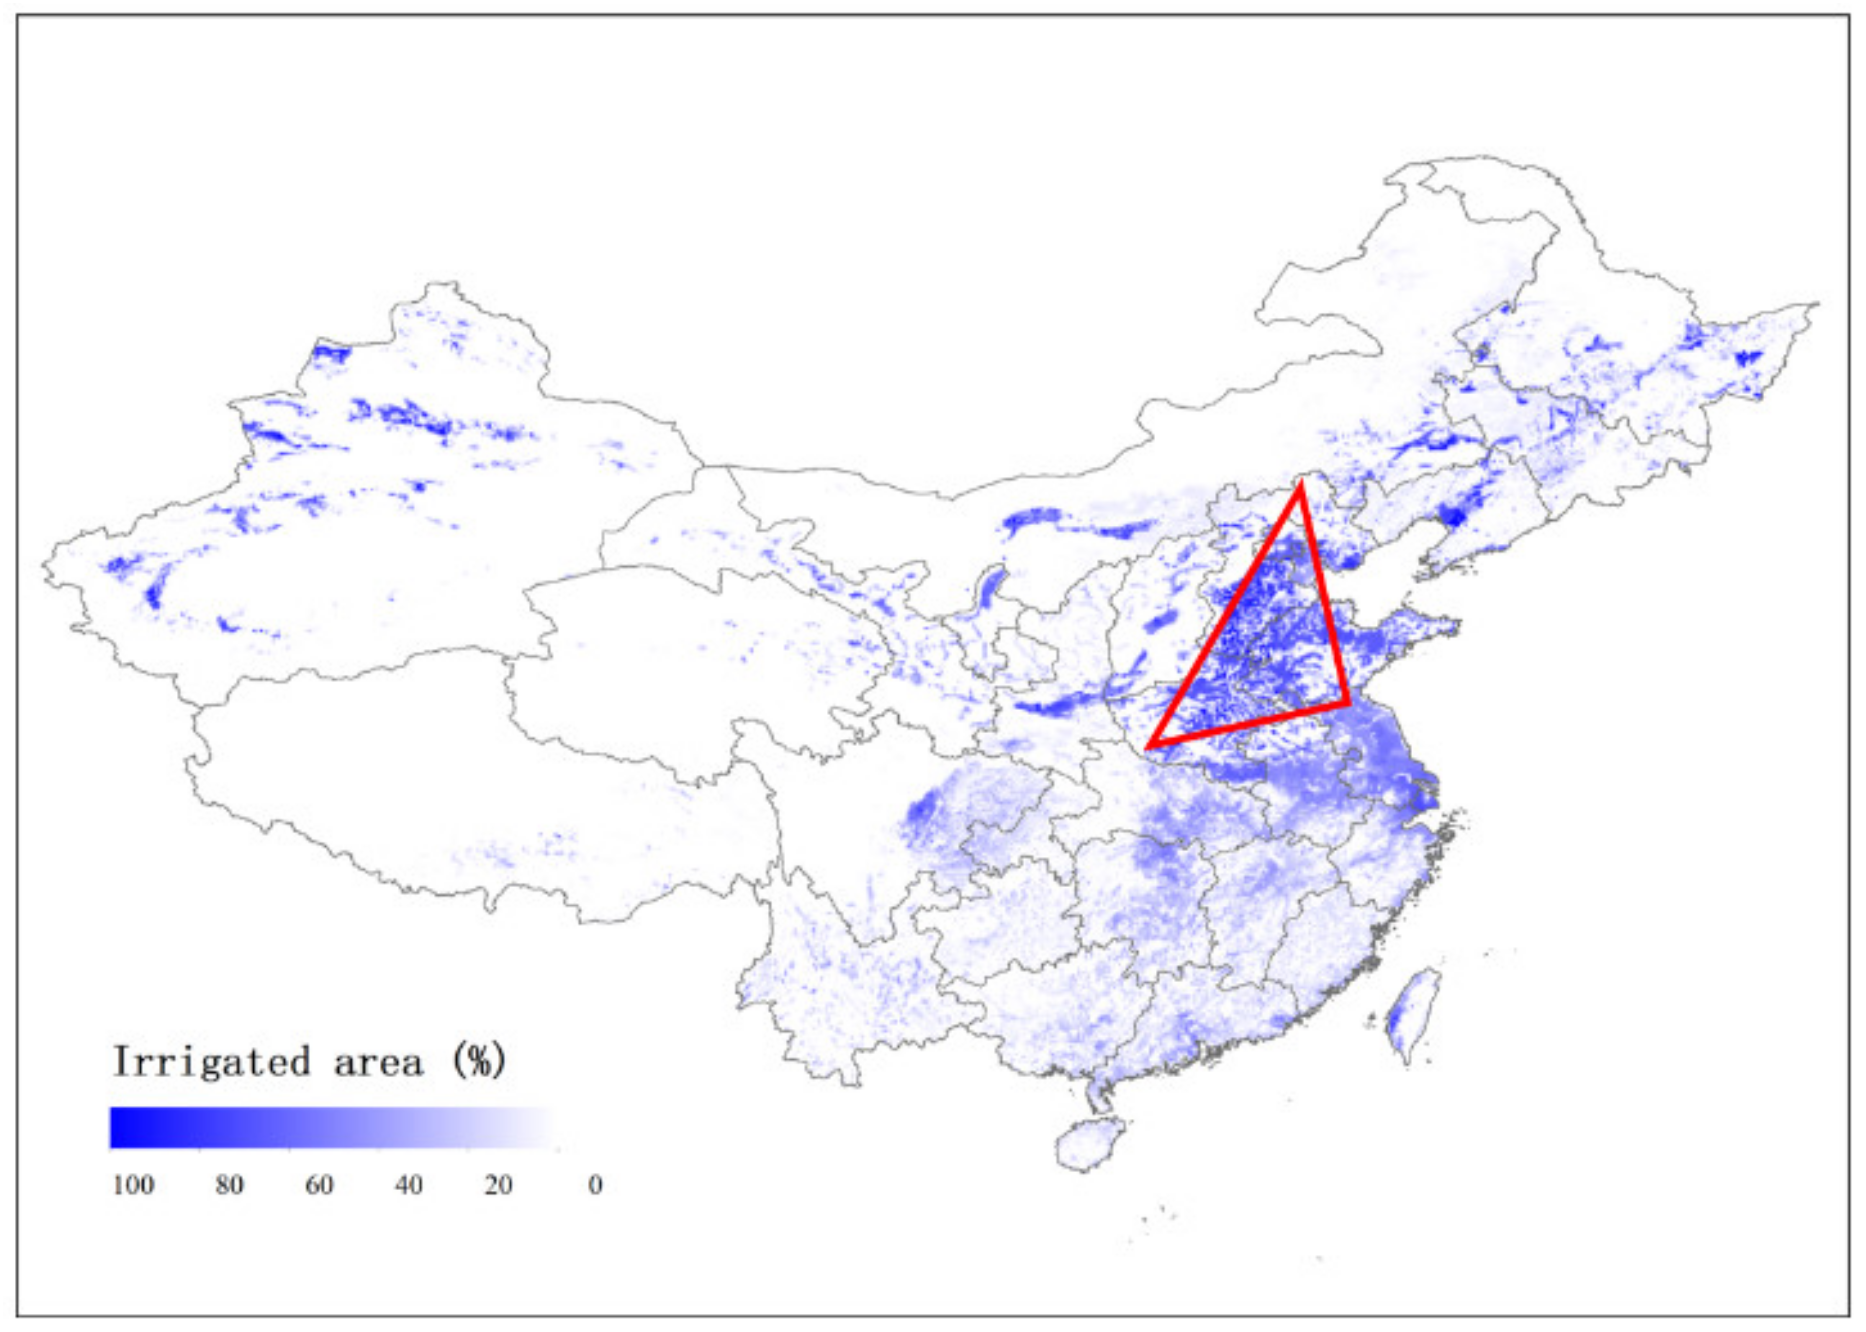
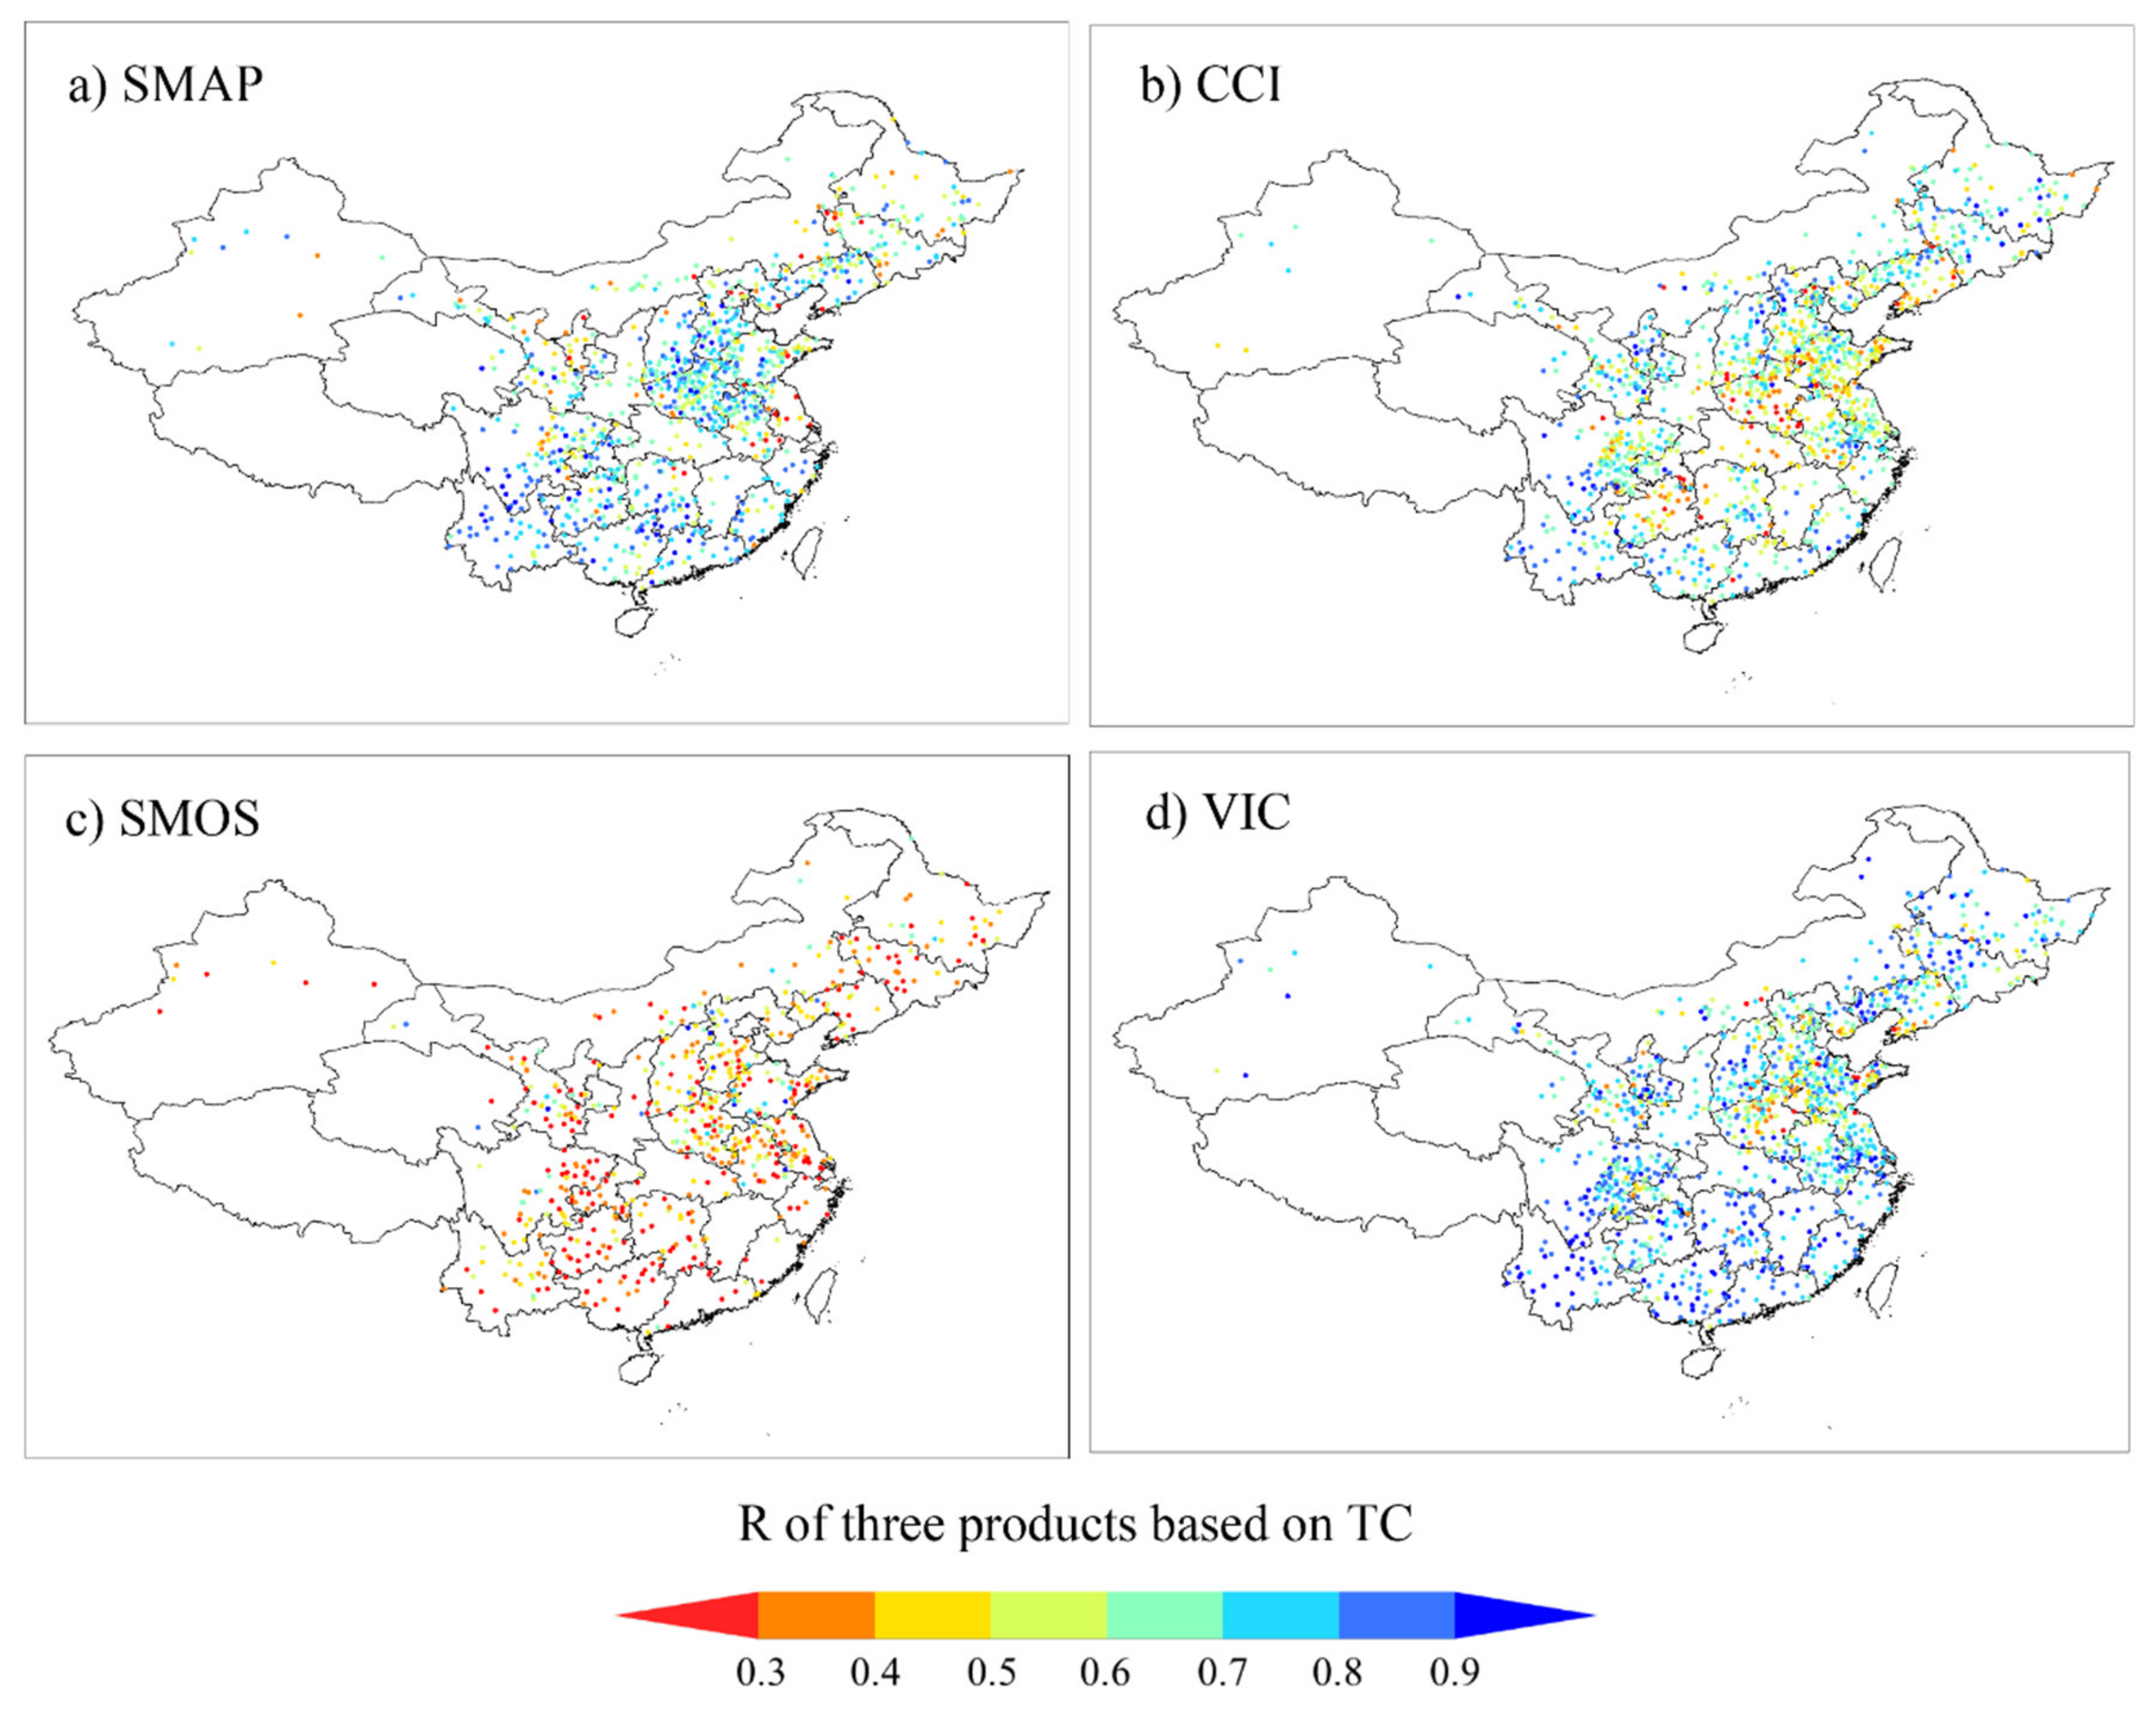
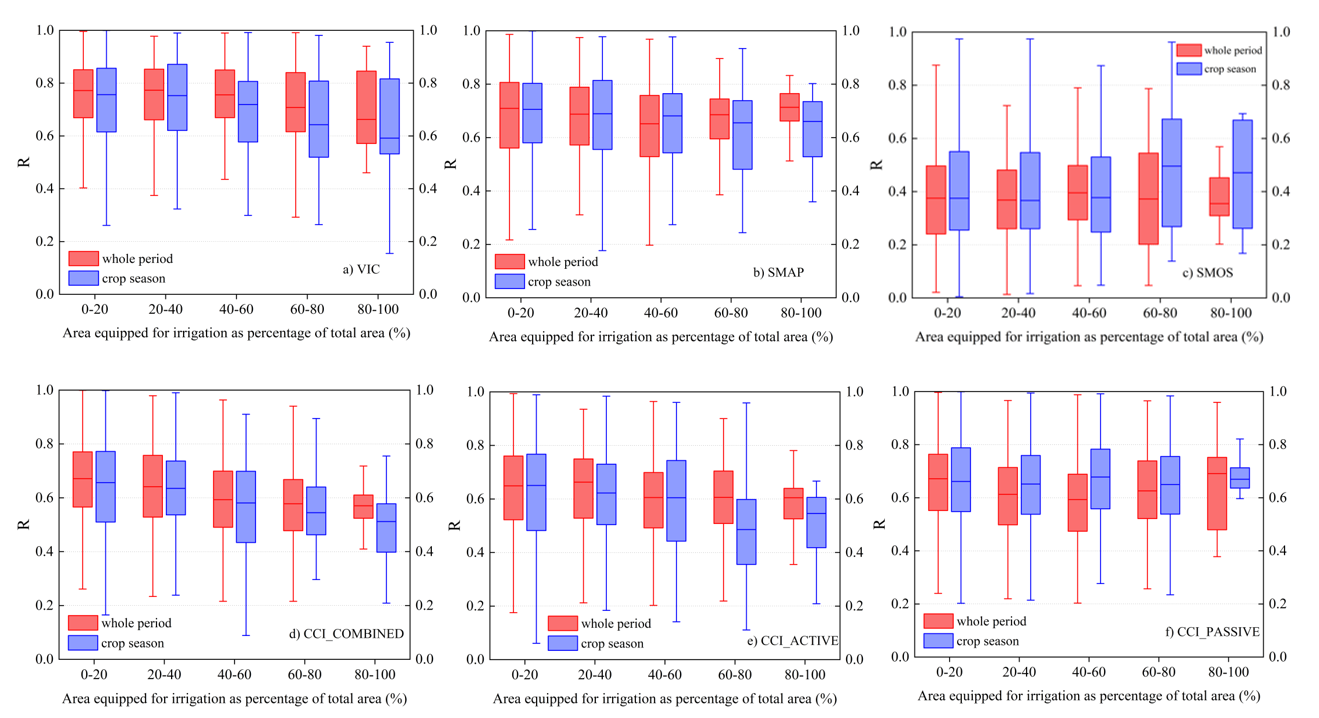
  • Generally, SMAP has the worst performance in Northeast China and Anhui province. CCI has the worst performance in North China Plain, which are most irrigated areas in China. Irrigation affects the accuracy of both VIC and CCI_COMBINED soil moisture product. The reasons for this result are (1) lack of irrigation module in VIC model, (2) GLDAS-Noah land surface model (which does not consider irrigation) soil moisture is used to rescale CCI combined data by CDF-matching [1]. However, SMAP and SMOS are able to preserve the irrigation signal in irrigated areas. In the crop season, the impact of irrigation on VIC and CCI is greater than that of the whole year. Based on these findings, a model independent rescaling approach should be adopted for the CCI product, especially in irrigated areas.
  • Overall, the CCI is the least affected by the land surface temperature, vegetation water content, soil clay content, and RFI, followed by SMAP and SMOS. The land surface characteristics corrections in the SMAP retrieval algorithm effectively improve the product accuracy compared with SMOS. For CCI, compared with single product, the integration of multi-sources active and passive soil moisture products helps to improve the stability over different land surface characteristics. Both SMAP and SMOS are significantly affected by RFI. However, the RFI detection and mitigation algorithm in SMAP retrieval algorithm effectively reduce the RFI impact compared with SMOS.
  • TC-based validation and conventional validation are compared in this study to investigate representativeness error of in situ sites. In complex topography areas of China (e.g., Guizhou province), the representativeness errors of in situ sites are usually larger than other sites, which indicates that higher density of in situ networks are need in these areas. Compared with conventional validation, TC-based validation is more reasonable and can better investigate true error characteristics of satellite products.
The results of this study evaluate the accuracy and error characteristics of most commonly used satellite soil moisture products. In addition, comprehensive analysis between product accuracy and impact factors improves the understanding of error mechanisms. The corresponding results in this study can be used to improve the data quality of these soil moisture products in the future. For satellite soil moisture products, the primary effort should be focused on RFI mitigation, surface temperature correction, and vegetation correction. For model-dependent soil moisture products, the impact of irrigation must not be ignored. As a result, another work for CCI is that it should be independent from the land surface model.

Author Contributions

Conceptualization, G.L.; Data curation, X.W.; Formal analysis, X.W.; Funding acquisition, H.H.; Resources, Z.W.; Supervision, Z.W. and W.D.; Writing—original draft, X.W.; Writing—review & editing, T.S. and W.D. Authorship must be limited to those who have contributed substantially to the work reported. All authors have read and agree to the published version of the manuscript.

Funding

This work is supported by the National Key Research and Development Project (2017YFC1502403), the National Science Foundation of China (Grant No. 51779071, 51579065), the Fundamental Research Funds for the Central Universities (Grant No. 2017B10514), Central Public Welfare Operations for Basic Scientific Research of Research Institute (Grant No. HKY-JBYW-2017-12) and Water Science and Technology Project of Jiangsu Province (2017007), Fundamental Research Funds for the Central Universities (2019B10214). Tracy Scanlon and Wouter Dorigo acknowledge support from ESA’s Climate Change Initiative (CCI) for soil moisture (Grant No. 4000104814/11/I-NB and 4000126684/19/I-NB) and the QA4SM project (https://qa4sm.eodc.eu/) funded through the Austrian Space Application Programme.

Acknowledgments

The authors wish to express their thanks to all data providers, editors and reviewers for their outstanding work and contribution to the manuscript.

Conflicts of Interest

The authors declare no conflict of interest.

Appendix A. Reliability Evaluation of TC-Based Validation

The main purpose of this section is to verify the robustness of inter-comparison between different triplets. In this study, the validation metrics of three satellite soil moisture products were obtained based on three different triplets using TC. It is assumed that the single product error from different TC triplets is stable and reliable [34]. As a result, if we change the satellite component in the TC triplet (in situ, satellite, model data), the error of in situ or model data will still be consistent [27] To verify this assumption, the RMSE of in situ data from three TC triples was calculated, i.e., TC (Insitu-SMAP-VIC), TC (Insitu-CCI-VIC), and TC (Insitu-SMOS-VIC), respectively. As shown in Figure A1, RMSE of each in situ site from SMAP-based and CCI-based TC were drawn. Overall, the RMSE of in situ from SMAP-based TC is very close to CCI-based TC for most sites. The correlation coefficient (R) between these two RMSE values is 0.86 (p < 0.005), which indicates a significant consistency between them. The results prove that error independence assumption of TC is reliable, which also demonstrates that the error of different satellite products from different TC triplets are comparable [9].
Figure A1. Comparison of individual in situ sites RMSE obtained from TC [Insitu-CCI-VIC] and TC [Insitu-SMAP-VIC] triplets.
Remotesensing 12 02275 g0a1
The boxplot in Figure A2 presents overall in situ RMSE from SMAP-based, CCI-based, and SMOS-based TC. The median RMSE values are 0.035, 0.032, and 0.033 m3m−3, respectively, which are similar to each other. Besides, the maximum values, 75th percentiles values, 25th percentiles values, and minimum values of RMSE indicate a great consistence with other different satellite-based triples. As mentioned above, the robustness demonstrates the reliability of TC-based comparison between different satellite products in the following paper.
Figure A2. Boxplot of overall in situ station RMSE obtained via three triplets.
Remotesensing 12 02275 g0a2

References

  1. Dorigo, W.; Wagner, W.; Albergel, C.; Albrecht, F.; Balsamo, G.; Brocca, L.; Chung, D.; Ertl, M.; Forkel, M.; Gruber, A.; et al. ESA CCI Soil Moisture for improved Earth system understanding: State-of-the art and future directions. Remote Sens. Environ. 2017, 203, 185–215. [Google Scholar] [CrossRef]
  2. Zhang, X.; Zhang, T.; Zhou, P.; Shao, Y.; Gao, S. Validation Analysis of SMAP and AMSR2 Soil Moisture Products over the United States Using Ground-Based Measurements. Remote Sens. 2017, 9, 104. [Google Scholar] [CrossRef] [Green Version]
  3. Zhao, L.; Yang, K.; Qin, J.; Chen, Y.; Tang, W.; Lu, H.; Yang, Z.-L. The scale-dependence of SMOS soil moisture accuracy and its improvement through land data assimilation in the central Tibetan Plateau. Remote Sens. Environ. 2014, 152, 345–355. [Google Scholar] [CrossRef]
  4. Kerr, Y.; Al-Yaari, A.; Rodríguez-Fernández, N.J.; Parrens, M.; Molero, B.; Leroux, D.; Bircher, S.; Mahmoodi, A.; Mialon, A.; Richaume, P.; et al. Overview of SMOS performance in terms of global soil moisture monitoring after six years in operation. Remote Sens. Environ. 2016, 180, 40–63. [Google Scholar] [CrossRef]
  5. Zaussinger, F.; Dorigo, W.A.; Gruber, A.; Tarpanelli, A.; Filippucci, P.; Brocca, L. Estimating irrigation water use over the contiguous United States by combining satellite and reanalysis soil moisture data. Hydrol. Earth Syst. Sci. 2019, 23, 897–923. [Google Scholar] [CrossRef] [Green Version]
  6. Su, C.-H.; Zhang, J.; Gruber, A.; Parinussa, R.; Ryu, D.; Crow, W.T.; Wagner, W. Error decomposition of nine passive and active microwave satellite soil moisture data sets over Australia. Remote Sens. Environ. 2016, 182, 128–140. [Google Scholar] [CrossRef]
  7. Scholze, M.; Kaminski, T.; Knorr, W.; Blessing, S.; Vossbeck, M.; Grant, J.; Scipal, K. Simultaneous assimilation of SMOS soil moisture and atmospheric CO2 in-situ observations to constrain the global terrestrial carbon cycle. Remote Sens. Environ. 2016, 180, 334–345. [Google Scholar] [CrossRef]
  8. González-Zamora, Á.; Sanchez, N.; Pablos, M.; Martinez-Fernandez, J. CCI soil moisture assessment with SMOS soil moisture and in situ data under different environmental conditions and spatial scales in Spain. Remote Sens. Environ. 2019, 225, 469–482. [Google Scholar] [CrossRef]
  9. Gruber, A.; Dorigo, W.A.; Crow, W.T.; Wagner, W. Triple Collocation-Based Merging of Satellite Soil Moisture Retrievals. IEEE Trans. Geosci. Remote Sens. 2017, 55, 6780–6792. [Google Scholar] [CrossRef]
  10. Rajib, A.; Merwade, V.; Yu, Z. Multi-objective calibration of a hydrologic model using spatially distributed remotely sensed/in-situ soil moisture. J. Hydrol. 2016, 536, 192–207. [Google Scholar] [CrossRef] [Green Version]
  11. Colliander, A.; Jackson, T.; Bindlish, R.; Chan, S.; Das, N.; Kim, S.; Cosh, M.; Dunbar, R.; Dang, L.; Pashaian, L.; et al. Validation of SMAP surface soil moisture products with core validation sites. Remote Sens. Environ. 2017, 191, 215–231. [Google Scholar] [CrossRef]
  12. Crow, W.T.; Su, C.-H.; Ryu, D.; Yilmaz, M.T. Optimal averaging of soil moisture predictions from ensemble land surface model simulations. Water Resour. Res. 2015, 51, 9273–9289. [Google Scholar] [CrossRef] [Green Version]
  13. Burgin, M.S.; Colliander, A.; Njoku, E.G.; Chan, S.K.; Cabot, F.; Kerr, Y.H.; Bindlish, R.; Jackson, T.J.; Entekhabi, D.; Yueh, S.H. A Comparative Study of the SMAP Passive Soil Moisture Product with Existing Satellite-Based Soil Moisture Products. IEEE Trans. Geosci. Remote Sens. 2017, 55, 2959–2971. [Google Scholar] [CrossRef]
  14. Al-Yaari, A.; Wigneron, J.-P.; Dorigo, W.; Colliander, A.; Pellarin, T.; Hahn, S.; Mialon, A.; Richaume, P.; Moran, R.F.; Fan, L.; et al. Assessment and inter-comparison of recently developed/reprocessed microwave satellite soil moisture products using ISMN ground-based measurements. Remote Sens. Environ. 2019, 224, 289–303. [Google Scholar] [CrossRef]
  15. Kolassa, J.; Gentine, P.; Prigent, C.; Aires, F. Soil moisture retrieval from AMSR-E and ASCAT microwave observation synergy. Part 1: Satellite data analysis. Remote Sens. Environ. 2016, 173, 1–14. [Google Scholar] [CrossRef]
  16. Petropoulos, G.P.; Ireland, G.; Barrett, B. Surface soil moisture retrievals from remote sensing: Current status, products & future trends. Phys. Chem. Earth Parts A/B/C 2015, 83, 36–56. [Google Scholar] [CrossRef]
  17. Wigneron, J.-P.; Jackson, T.J.; O’Neill, P.; De Lannoy, G.; De Rosnay, P.; Walker, J.P.; Ferrazzoli, P.; Mironov, V.; Bircher, S.; Grant, J.; et al. Modelling the passive microwave signature from land surfaces: A review of recent results and application to the L-band SMOS & SMAP soil moisture retrieval algorithms. Remote Sens. Environ. 2017, 192, 238–262. [Google Scholar] [CrossRef]
  18. Brocca, L.; Hasenauer, S.; Lacava, T.; Melone, F.; Moramarco, T.; Wagner, W.; Dorigo, W.A.; Matgen, P.; Martinez-Fernandez, J.; Llorens, P.; et al. Soil moisture estimation through ASCAT and AMSR-E sensors: An intercomparison and validation study across Europe. Remote Sens. Environ. 2011, 115, 3390–3408. [Google Scholar] [CrossRef]
  19. Cho, E.; Su, C.-H.; Ryu, D.; Kim, H.; Choi, M. Does AMSR2 produce better soil moisture retrievals than AMSR-E over Australia? Remote Sens. Environ. 2017, 188, 95–105. [Google Scholar] [CrossRef]
  20. Kim, S.; Liu, Y.Y.; Johnson, F.; Parinussa, R.M.; Sharma, A. A global comparison of alternate AMSR2 soil moisture products: Why do they differ? Remote Sens. Environ. 2015, 161, 43–62. [Google Scholar] [CrossRef]
  21. Entekhabi, D.; Yueh, S.; O’Neill, P.E.; Kellogg, K.H.; Allen, A.; Bindlish, R.; Brown, M.; Chan, S.; Colliander, A.; Crow, W.T.; et al. SMAP Handbook—Soil Moisture Active Passive: Mapping Soil Moisture and Freeze/Thaw from Space; JPL Publication: Pasadena, CA, USA, 2014. [Google Scholar]
  22. Gruber, A.; Scanlon, T.; Van Der Schalie, R.; Wagner, W.; Dorigo, W. Evolution of the ESA CCI Soil Moisture climate data records and their underlying merging methodology. Earth Syst. Sci. Data 2019, 11, 717–739. [Google Scholar] [CrossRef] [Green Version]
  23. Yee, M.S.; Walker, J.P.; Monerris, A.; Rüdiger, C.; Jackson, T.J. On the identification of representative in situ soil moisture monitoring stations for the validation of SMAP soil moisture products in Australia. J. Hydrol. 2016, 537, 367–381. [Google Scholar] [CrossRef]
  24. Chan, S.K.; Bindlish, R.; O’Neill, P.E.; Njoku, E.; Jackson, T.; Colliander, A.; Chen, F.; Burgin, M.; Dunbar, S.; Piepmeier, J.; et al. Assessment of the SMAP Passive Soil Moisture Product. IEEE Trans. Geosci. Remote Sens. 2016, 54, 4994–5007. [Google Scholar] [CrossRef]
  25. Dorigo, W.; Gruber, A.; De Jeu, R.; Wagner, W.; Stacke, T.; Loew, A.; Calvet, J.-C.; Brocca, L.; Chung, D.; Parinussa, R.; et al. Evaluation of the ESA CCI soil moisture product using ground-based observations. Remote Sens. Environ. 2015, 162, 380–395. [Google Scholar] [CrossRef]
  26. Krishnan, P.; Kochendorfer, J.; Dumas, E.J.; Guillevic, P.C.; Baker, C.B.; Meyers, T.P.; Martos, B. Comparison of in-situ, aircraft, and satellite land surface temperature measurements over a NOAA Climate Reference Network site. Remote Sens. Environ. 2015, 165, 249–264. [Google Scholar] [CrossRef]
  27. Chen, F.; Crow, W.T.; Bindlish, R.; Colliander, A.; Burgin, M.S.; Asanuma, J.; Aida, K. Global-scale evaluation of SMAP, SMOS and ASCAT soil moisture products using triple collocation. Remote Sens. Environ. 2018, 214, 1–13. [Google Scholar] [CrossRef]
  28. McNally, A.; Shukla, S.; Arsenault, K.R.; Wang, S.; Peters-Lidard, C.; Verdin, J.P. Evaluating ESA CCI soil moisture in East Africa. Int. J. Appl. Earth Obs. Geoinf. 2016, 48, 96–109. [Google Scholar] [CrossRef] [Green Version]
  29. An, R.; Zhang, L.; Wang, Z.; Quaye-Ballard, J.A.; You, J.; Shen, X.; Gao, W.; Huang, L.; Zhao, Y.; Ke, Z. Validation of the ESA CCI soil moisture product in China. Int. J. Appl. Earth Obs. Geoinf. 2016, 48, 28–36. [Google Scholar] [CrossRef]
  30. Crow, W.T.; Berg, A.A.; Cosh, M.H.; Loew, A.; Mohanty, B.P.; Panciera, R.; De Rosnay, P.; Ryu, D.; Walker, J.P. Upscaling sparse ground-based soil moisture observations for the validation of coarse-resolution satellite soil moisture products. Rev. Geophys. 2012, 50. [Google Scholar] [CrossRef] [Green Version]
  31. MirallesiD, D.G.; Crow, W.T.; Cosh, M.H. Estimating Spatial Sampling Errors in Coarse-Scale Soil Moisture Estimates Derived from Point-Scale Observations. J. Hydrometeorol. 2010, 11, 1423–1429. [Google Scholar] [CrossRef]
  32. Pan, M.; Fisher, C.K.; Chaney, N.W.; Zhan, W.; Crow, W.T.; Aires, F.; Entekhabi, D.; Wood, E.F. Triple collocation: Beyond three estimates and separation of structural/non-structural errors. Remote Sens. Environ. 2015, 171, 299–310. [Google Scholar] [CrossRef]
  33. McColl, K.A.; Vogelzang, J.; Konings, A.G.; Entekhabi, D.; Piles, M.; Stoffelen, A. Extended triple collocation: Estimating errors and correlation coefficients with respect to an unknown target. Geophys. Res. Lett. 2014, 41, 6229–6236. [Google Scholar] [CrossRef] [Green Version]
  34. Chen, F.; Crow, W.T.; Colliander, A.; Cosh, M.H.; Jackson, T.J.; Bindlish, R.; Reichle, R.H.; Chan, S.K.; Bosch, D.D.; Starks, P.J.; et al. Application of Triple Collocation in Ground-Based Validation of Soil Moisture Active/Passive (SMAP) Level 2 Data Products. IEEE J. Sel. Top. Appl. Earth Obs. Remote Sens. 2016, 10, 489–502. [Google Scholar] [CrossRef]
  35. Dorigo, W.A.; Scipal, K.; Parinussa, R.M.; Liu, Y.Y.; Wagner, W.; De Jeu, R.A.M.; Naeimi, V. Error characterisation of global active and passive microwave soil moisture datasets. Hydrol. Earth Syst. Sci. 2010, 14, 2605–2616. [Google Scholar] [CrossRef] [Green Version]
  36. Lawston, P.M.; Santanello, J.; Kumar, S.V. Irrigation Signals Detected From SMAP Soil Moisture Retrievals. Geophys. Res. Lett. 2017, 44, 11–860. [Google Scholar] [CrossRef] [Green Version]
  37. Kumar, S.V.; Peters-Lidard, C.D.; Santanello, J.A.; Reichle, R.H.; Draper, C.S.; Koster, R.D.; Nearing, G.; Jasinski, M.F. Evaluating the utility of satellite soil moisture retrievals over irrigated areas and the ability of land data assimilation methods to correct for unmodeled processes. Hydrol. Earth Syst. Sci. 2015, 19, 4463–4478. [Google Scholar] [CrossRef] [Green Version]
  38. Mao, Y.; Wu, Z.; He, H.; Lu, G.; Xu, H.; Lin, Q. Spatio-temporal analysis of drought in a typical plain region based on the soil moisture anomaly percentage index. Sci. Total Environ. 2017, 576, 752–765. [Google Scholar] [CrossRef]
  39. Wu, Z.; Zhou, J.; He, H.; Lin, Q.; Wu, X.; Xu, Z. An advanced error correction methodology for merging in-situ observed and model-based soil moisture. J. Hydrol. 2018, 566, 150–163. [Google Scholar] [CrossRef]
  40. Al Bitar, A.; Mialon, A.; Kerr, Y.H.; Cabot, F.; Richaume, P.; Jacquette, E.; Quesney, A.; Mahmoodi, A.; Tarot, S.; Parrens, M.; et al. The global SMOS Level 3 daily soil moisture and brightness temperature maps. Earth Syst. Sci. Data 2017, 9, 293–315. [Google Scholar] [CrossRef] [Green Version]
  41. Al-Yaari, A.; Wigneron, J.-P.; Kerr, Y.; Rodríguez-Fernández, N.J.; O’Neill, P.E.; Jackson, T.J.; De Lannoy, G.; Al Bitar, A.; Mialon, A.; Richaume, P.; et al. Evaluating soil moisture retrievals from ESA’s SMOS and NASA’s SMAP brightness temperature datasets. Remote Sens. Environ. 2017, 193, 257–273. [Google Scholar] [CrossRef] [Green Version]
  42. Kerr, Y.H.; Richaume, P.; Wigneron, J.-P.; Gruhier, C.; Juglea, S.E.; Leroux, D.; Delwart, S.; Waldteufel, P.; Ferrazzoli, P.; Mahmoodi, A.; et al. The SMOS Soil Moisture Retrieval Algorithm. IEEE Trans. Geosci. Remote Sens. 2012, 50, 1384–1403. [Google Scholar] [CrossRef]
  43. Parrens, M.; Wigneron, J.-P.; Richaume, P.; Mialon, A.; Al Bitar, A.; Moran, R.F.; Al-Yaari, A.; Kerr, Y.H. Global-scale surface roughness effects at L-band as estimated from SMOS observations. Remote Sens. Environ. 2016, 181, 122–136. [Google Scholar] [CrossRef]
  44. Al-Yaari, A.; Wigneron, J.-P.; Ducharne, A.; Kerr, Y.; Wagner, W.; De Lannoy, G.; Reichle, R.H.; Al Bitar, A.; Dorigo, W.; Richaume, P.; et al. Global-scale comparison of passive (SMOS) and active (ASCAT) satellite based microwave soil moisture retrievals with soil moisture simulations (MERRA-Land). Remote Sens. Environ. 2014, 152, 614–626. [Google Scholar] [CrossRef] [Green Version]
  45. Molero, B.; Merlin, O.; Malbeteau, Y.; Al Bitar, A.; Cabot, F.; Stefan, V.; Kerr, Y.; Bacon, S.; Cosh, M.; Bindlish, R.; et al. SMOS disaggregated soil moisture product at 1 km resolution: Processor overview and first validation results. Remote Sens. Environ. 2016, 180, 361–376. [Google Scholar] [CrossRef]
  46. Lievens, H.; De Lannoy, G.; Al Bitar, A.; Drusch, M.; Dumedah, G.; Franssen, H.-J.H.; Kerr, Y.; Tomer, S.; Martens, B.; Merlin, O.; et al. Assimilation of SMOS soil moisture and brightness temperature products into a land surface model. Remote Sens. Environ. 2016, 180, 292–304. [Google Scholar] [CrossRef] [Green Version]
  47. Pratola, C.; Barrett, B.; Gruber, A.; Dwyer, E. Quality Assessment of the CCI ECV Soil Moisture Product Using ENVISAT ASAR Wide Swath Data over Spain, Ireland and Finland. Remote Sens. 2015, 7, 15388–15423. [Google Scholar] [CrossRef] [Green Version]
  48. Liang, X.; Lettenmaier, D.P.; Wood, E.F.; Burges, S.J. A simple hydrologically based model of land surface water and energy fluxes for general circulation models. J. Geophys. Res. Space Phys. 1994, 99, 14415. [Google Scholar] [CrossRef]
  49. Xia, Y.; Sheffield, J.; Ek, M.B.; Dong, J.; Chaney, N.; Wei, H.; Meng, J.; Wood, E.F. Evaluation of multi-model simulated soil moisture in NLDAS-2. J. Hydrol. 2014, 512, 107–125. [Google Scholar] [CrossRef]
  50. Zhang, A.; Jia, G. Monitoring meteorological drought in semiarid regions using multi-sensor microwave remote sensing data. Remote Sens. Environ. 2013, 134, 12–23. [Google Scholar] [CrossRef]
  51. Das, N.N.; Entekhabi, D.; Dunbar, R.S.; Chaubell, M.J.; Colliander, A.; Yueh, S.H.; Jagdhuber, T.; Chen, F.; Crow, W.T.; O’Neill, P.E.; et al. The SMAP and Copernicus Sentinel 1A/B microwave active-passive high resolution surface soil moisture product. Remote Sens. Environ. 2019, 233, 111380. [Google Scholar] [CrossRef]
  52. McColl, K.A.; Roy, A.; Derksen, C.; Konings, A.G.; Alemohammad, S.H.; Entekhabi, D. Triple collocation for binary and categorical variables: Application to validating landscape freeze/thaw retrievals. Remote Sens. Environ. 2016, 176, 31–42. [Google Scholar] [CrossRef] [Green Version]
  53. Gruber, A.; Su, C.-H.; Zwieback, S.; Crow, W.; Dorigo, W.; Wagner, W. Recent advances in (soil moisture) triple collocation analysis. Int. J. Appl. Earth Obs. Geoinf. 2016, 45, 200–211. [Google Scholar] [CrossRef]
  54. Draper, C.; Reichle, R.H.; De Jeu, R.; Naeimi, V.; Parinussa, R.; Wagner, W. Estimating root mean square errors in remotely sensed soil moisture over continental scale domains. Remote Sens. Environ. 2013, 137, 288–298. [Google Scholar] [CrossRef] [Green Version]
  55. Draper, C.; Reichle, R.H.; De Lannoy, G.J.M.; Liu, Q. Assimilation of passive and active microwave soil moisture retrievals. Geophys. Res. Lett. 2012, 39. [Google Scholar] [CrossRef] [Green Version]
  56. Liu, Q.; Reichle, R.H.; Bindlish, R.; Cosh, M.H.; Crow, W.T.; de Jeu, R.; De Lannoy, G.J.; Huffman, G.J.; Jackson, T.J. The contributions of precipitation and soil moisture observations to the skill of soil moisture estimates in a land data assimilation system. J. Hydrometeorol. 2011, 12, 750–765. [Google Scholar] [CrossRef]
  57. Oliva, R.; Daganzo, E.; Richaume, P.; Kerr, Y.; Cabot, F.; Soldo, Y.; Anterrieu, E.; Reul, N.; Gutierrez, A.; Barbosa, J.; et al. Status of Radio Frequency Interference (RFI) in the 1400–1427 MHz passive band based on six years of SMOS mission. Remote Sens. Environ. 2016, 180, 64–75. [Google Scholar] [CrossRef]
  58. Zhang, R.; Kim, S.; Sharma, A. A comprehensive validation of the SMAP Enhanced Level-3 Soil Moisture product using ground measurements over varied climates and landscapes. Remote Sens. Environ. 2019, 223, 82–94. [Google Scholar] [CrossRef]
  59. Al Bitar, A.; Leroux, D.; Kerr, Y.H.; Merlin, O.; Richaume, P.; Sahoo, A.; Wood, E.F. Evaluation of SMOS Soil Moisture Products Over Continental U.S. Using the SCAN/SNOTEL Network. IEEE Trans. Geosci. Remote Sens. 2012, 50, 1572–1586. [Google Scholar] [CrossRef] [Green Version]
  60. Pacheco, A.; McNairn, H.; Mahmoodi, A.; Champagne, C.; Kerr, Y.H. The Impact of National Land Cover and Soils Data on SMOS Soil Moisture Retrieval Over Canadian Agricultural Landscapes. IEEE J. Sel. Top. Appl. Earth Obs. Remote Sens. 2015, 8, 1–13. [Google Scholar] [CrossRef]
  61. Qiu, J.; Gao, Q.; Wang, S.; Su, Z. Comparison of temporal trends from multiple soil moisture data sets and precipitation: The implication of irrigation on regional soil moisture trend. Int. J. Appl. Earth Obs. Geoinf. 2016, 48, 17–27. [Google Scholar] [CrossRef]
  62. Zhu, X.; Zhu, W.; Zhang, J.; Pan, Y. Mapping Irrigated Areas in China From Remote Sensing and Statistical Data. IEEE J. Sel. Top. Appl. Earth Obs. Remote Sens. 2014, 7, 4490–4504. [Google Scholar] [CrossRef]
  63. Ma, H.; Zeng, J.; Chen, N.; Zhang, X.; Cosh, M.H.; Wang, W. Satellite surface soil moisture from SMAP, SMOS, AMSR2 and ESA CCI: A comprehensive assessment using global ground-based observations. Remote Sens. Environ. 2019, 231, 111215. [Google Scholar] [CrossRef]
  64. Jackson, T.; O’Neill, P.; Chan, S.; Bindlish, R.; Colliander, A.; Chen, F.; Dunbar, S.; Piepmeier, J.; Misra, S.; Cosh, M. Calibration and Validation for the L2/3_SM_P Version 6 and L2/3_SM_P_E Version 3 Data Products; SMAP Project, JPL D-56297; Jet Propulsion Laboratory: Pasadena, CA, USA, 2019. [Google Scholar]
Figure 1. Distribution map of in situ stations (total number of 1682) in China. Labels indicate the respective province names.
Remotesensing 12 02275 g001
Figure 2. Irrigated area expressed as percentage of total area (http://www.fao.org/nr/water/aquastat/irrigationmap/). The most irrigated area is the North China Plain, highlighted by the red frame.
Remotesensing 12 02275 g002
Figure 3. Three triplets of datasets triple collocation used in this study.
Remotesensing 12 02275 g003
Figure 4. (a) Correlation coefficient (R), (b) root mean square error (RMSE), and (c) fractional RMSE (fRMSE) of Soil Moisture Active Passive (SMAP), Climate Change Initiative (CCI), Soil Moisture and Ocean Salinity (SMOS) soil moisture products based on Triple Collocation (TC). Horizontal lines of the box indicate the 25th percentiles, median, and 75th percentiles, respectively. Whiskers indicate the minimum and maximum values.
Remotesensing 12 02275 g004
Figure 5. Average performance of R for SMAP, CCI, SMOS soil moisture products over different landcover types from MODIS. The numbers in parentheses represent the number of sites in the corresponding landcover types. Error bars show 95% confidence intervals obtained from standard error.
Remotesensing 12 02275 g005
Figure 6. Latitudinal average distribution of performance in terms of R for SMAP, CCI, SMOS soil moisture products.
Remotesensing 12 02275 g006
Figure 7. Distribution map of R for (a) SMAP, (b) CCI, (c) SMOS, (d) Variable Infiltration Capacity (VIC) soil moisture products. For VIC, R is obtained via TC [Insitu-SMAP-VIC]. Blue represents good performance and red represents poor performance.
Remotesensing 12 02275 g007
Figure 8. Boxplots of R for (a) VIC, (b) SMAP, (c) SMOS, (d) CCI_COMBINED (e) CCI_ACTIVE, and (f) CCI_PASSIVE soil moisture products over the whole validation period (31 March 2015 to 3 June 2018) and over the crop season (October to May of the following year) with different percentages of irrigated area. Note that R values of VIC, CCI_ACTIVE, CCI_PASSIVE are obtained via TC [Insitu-SMAP-VIC], TC [Insitu-CCI_ACTIVE-VIC], TC [Insitu -CCI_PASSIVE-VIC], respectively.
Remotesensing 12 02275 g008
Figure 9. Performance of R for SMAP, CCI, and SMOS soil moisture product considering (a) land surface temperature; (b) vegetation water content; (c) soil clay content; (d) Radio Frequency Interference (RFI). The n in parentheses represents the number of sites in the corresponding impact factors.
Remotesensing 12 02275 g009
Figure 10. Scatter diagram comparison of SMAP RMSE obtained from TC [Insitu-SMAP-VIC] and SMAP unbiased RMSE (ubRMSE) obtained from conventional validation [Insitu-SMAP]. Blue points represent individual in situ sites. The dashed line in square brackets represents the TC combination rather than the subtraction.
Remotesensing 12 02275 g010
Figure 11. Distribution map for RMSE of in situ sites obtained via TC-based validation. Red dots represent large errors.
Remotesensing 12 02275 g011
Figure 12. Average RMSE of in situ sites over different topographic complexity. Zero represents flat terrain, while the large number of topographic complexity represents more complex terrain. Topographic complexity data comes from CCI ancillary data [1]. The numbers in parentheses represent the number of sites in the corresponding topographic complexity. Error bars show 95% confidence intervals obtained from standard error.
Remotesensing 12 02275 g012
Table 1. Summary of satellite, in situ, model soil moisture products used in this study.
DataVersionBand FrequencyPeriodTemporal/Spatial ResolutionDepth
SMAPL3_P_V51.4 GHz2015–20192–3 days/36 km0–5 cm
CCIV4.5-1978–20181 day/0.25°0–5 cm
SMOSL3_CATDS1.4 GHz2009–20192–3 days/25 km0–5 cm
In situ1682 sites-2008–20185 days/point0–10 cm
VICV4.0-1956–20181 day/10 km0–10 cm

