Cardiopulmonary Activity Monitoring Using Millimeter Wave Radars

 , and
, and
Abstract
1. Introduction
2. Materials and Methods
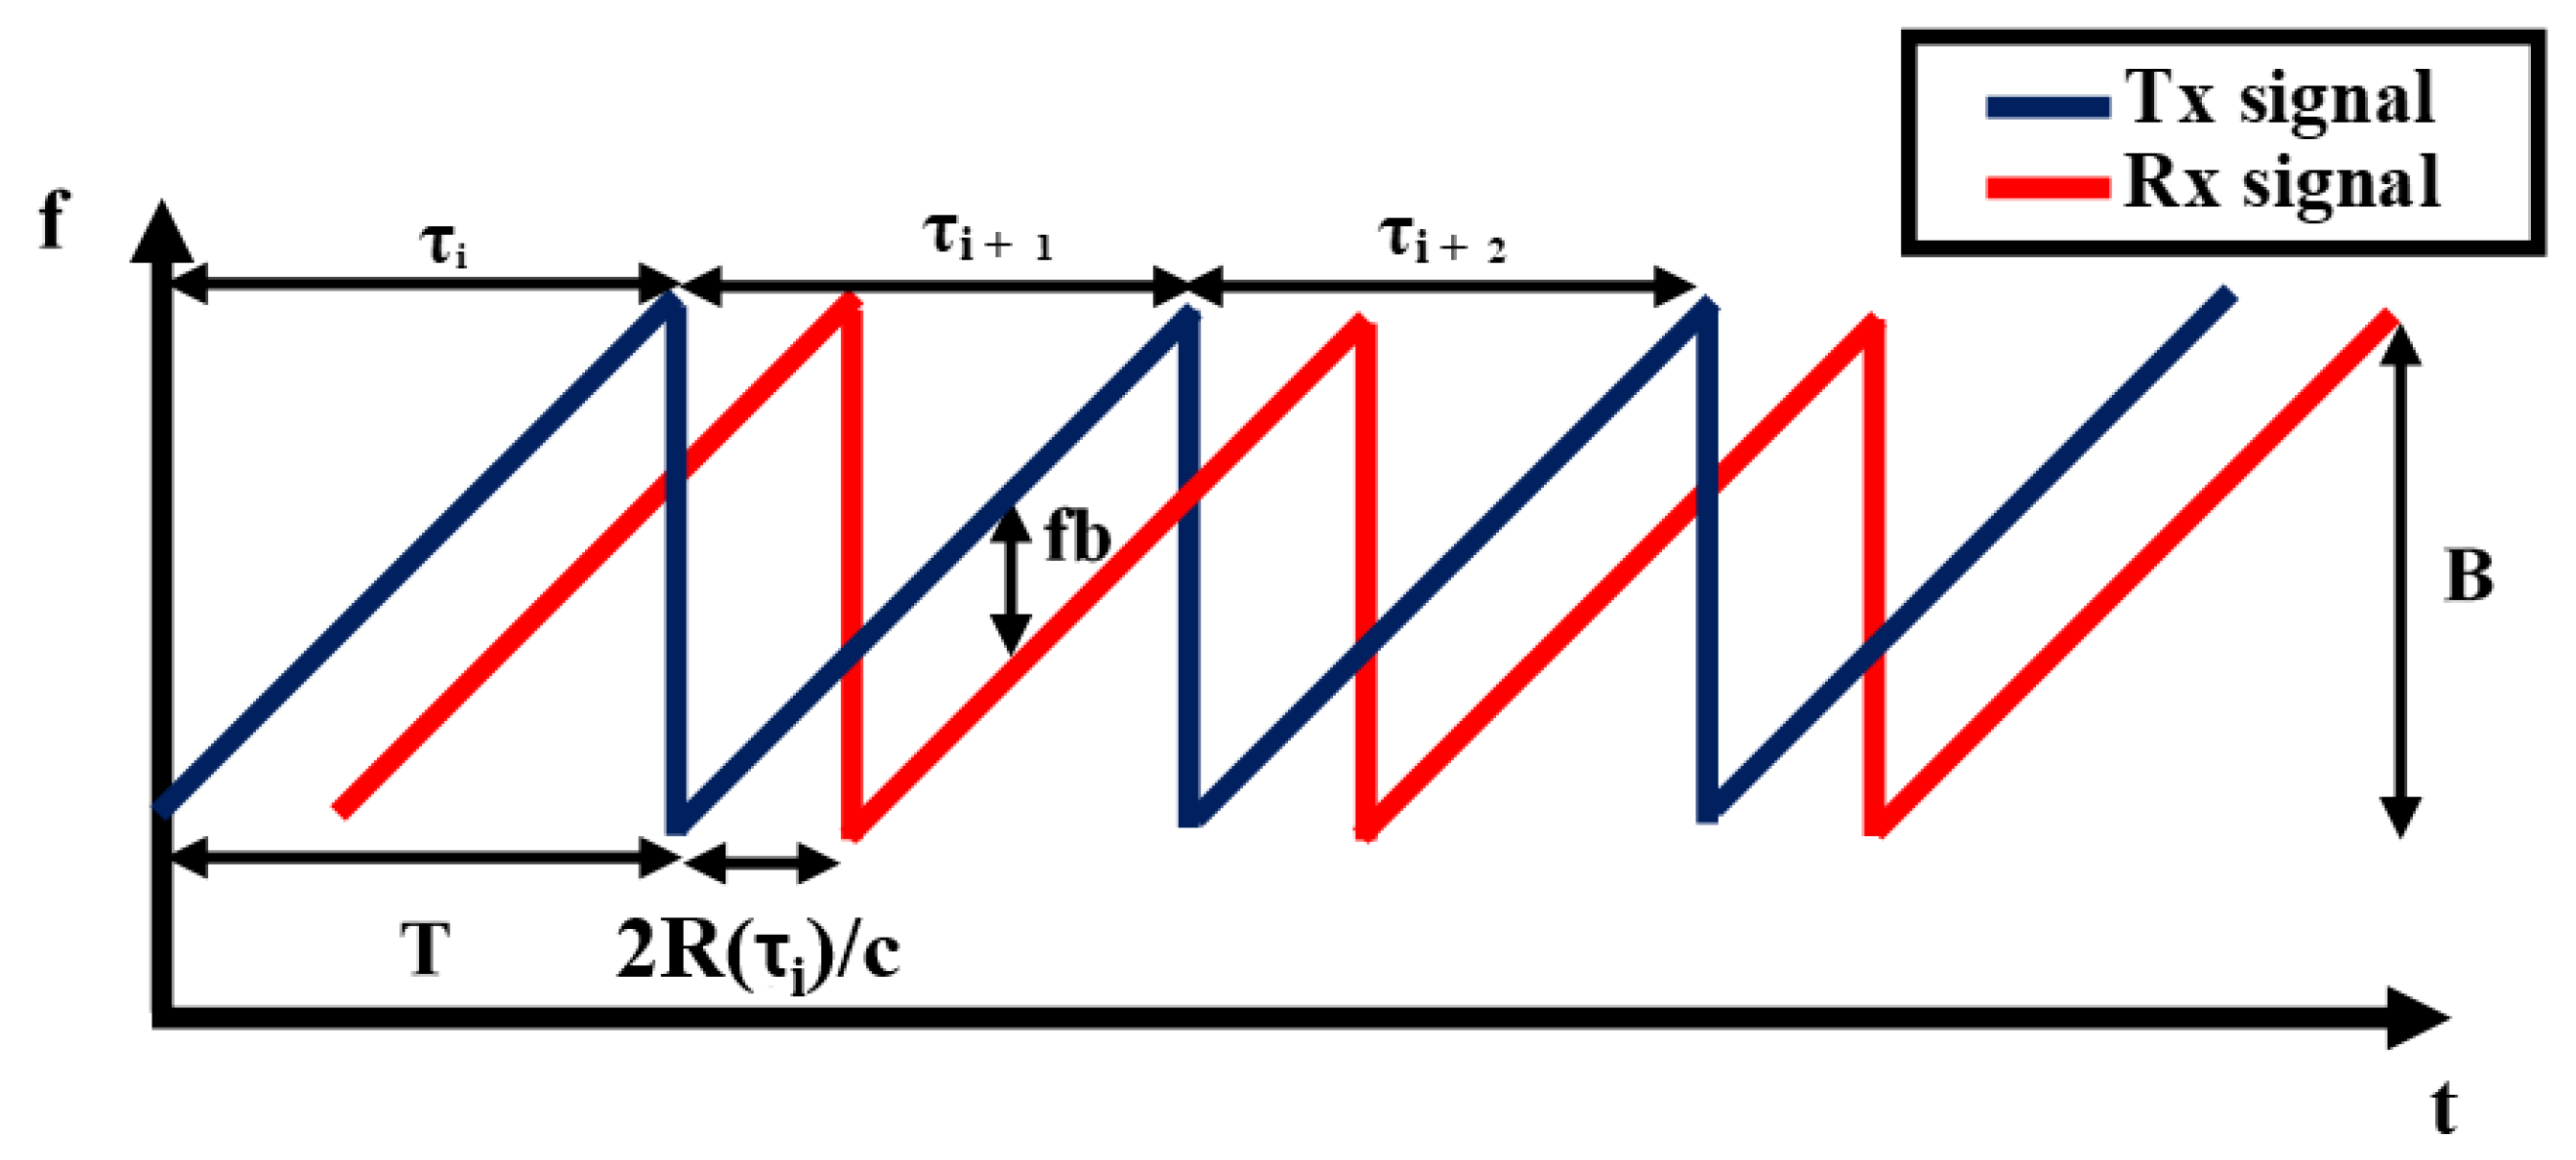
2.1. FMCW Radar Working Principle
2.2. Radar Module
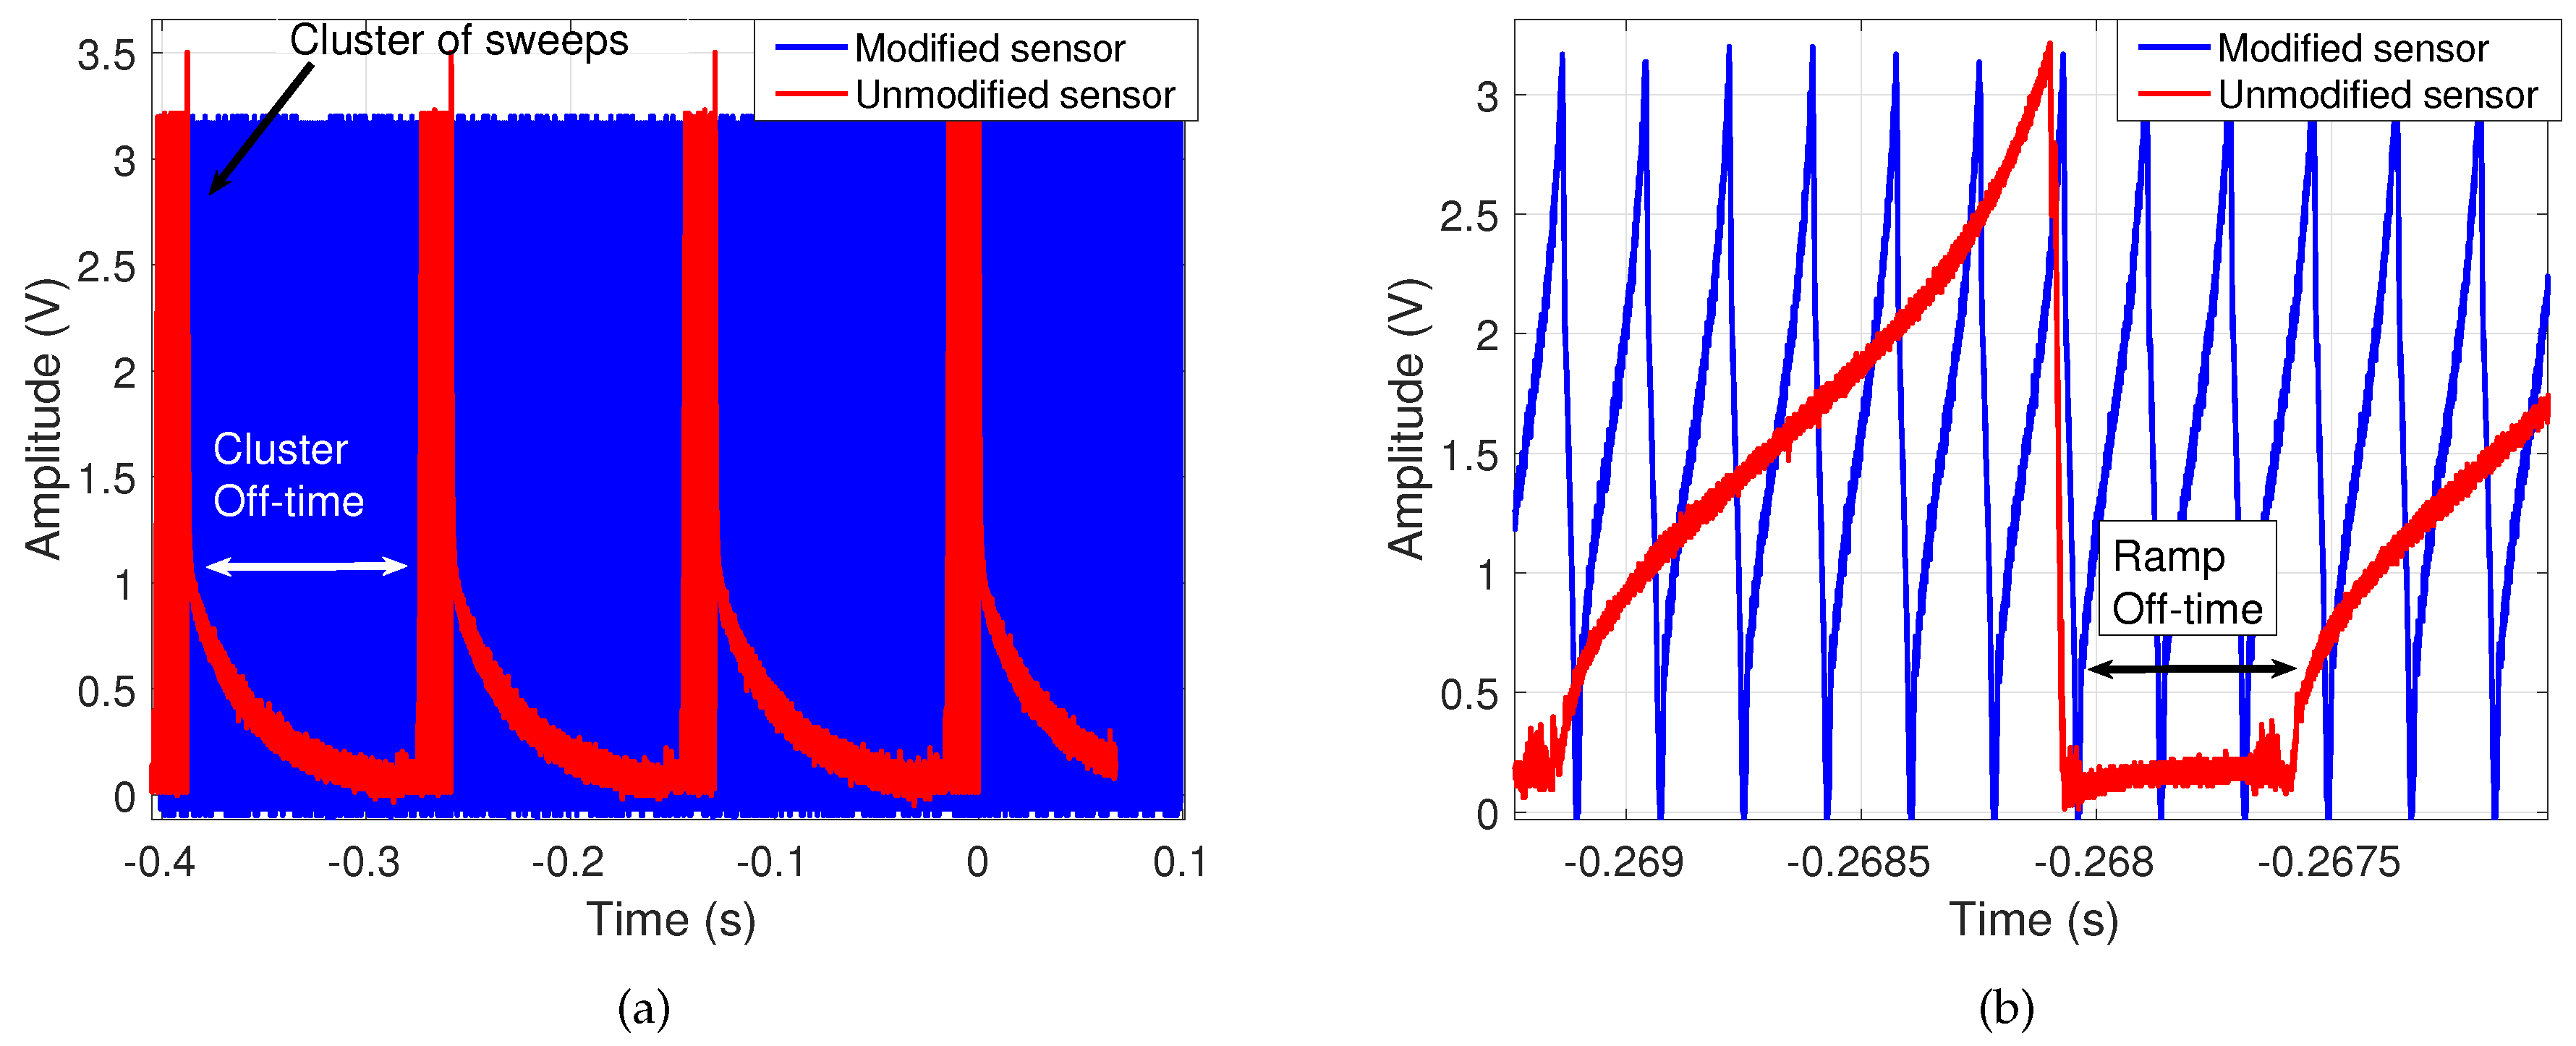
- Continuous FMCW operation: The commercial FMCW radar’s transmission was limited to intervals managed by its microcontroller. These intervals included off-time between clusters of FMCW sweeps to allow for on-board signal processing and USB-to-PC data transmission as shown in Figure 5, which would hinder continuous cardiopulmonary measurements. Figure 5a shows both types of off-time originally preventing continuous transmission, while Figure 5b confirms that data is composed of voltage ramps of the same amplitude as before the modifications and with faster sweeps. In the modified architecture the microcontroller has been removed so that all processing is offloaded to a PC, with a connected external ADC that continuously samples the I/Q signals.
- Cleaner signal reference: The reference oscillator used to feed the PFD has been replaced for another commercial component from the same manufacturer. Although slightly more expensive, the new reference provides less phase noise. This is an important feature in an upconversion architecture such as the one in Figure 4, because the phase noise will be increased in each multiplication stage, ultimately masking close low-power targets in the spectrum, as shown in Figure 6. Notice, in Figure 6b, the increase in dynamic range due to the reduction in phase noise of the new reference oscillator, which allows detection of the previously-masked target at around 1 m distance. This is specially useful in our desired application, since some of the returns from cardiopulmonary activity can present very low SNR.
- Flexible waveform configurations: The replacement of the microcontroller allows for improved waveform configurations, including finer bandwidth and sweep time selections. This has enabled proper alignment of sweep flyback times, and triggering of the ADC’s sampling using an end-of-ramp signal. Both improvements create better-synchronized waveform generation and sampling, producing less error in the cardiopulmonary measurements.
- Redesign of signal conditioning: Enabled by the removal of the commercial baseband board, the baseband signal conditioning has been modified for better adaptation to the desired application. This includes a redesign of the I/Q filters, which are now electronically-modified by the microcontroller, to adapt their cutoff frequency and gain to the specific needs of each measurement scenario.
- Cleaner power supply: In contrast to the commercial architecture, the power source of the noisy microcontroller (i.e., a USB port) can be made independent from the PLL’s (which can be through voltage-regulated jack connector or dedicated pins). This provides a cleaner source for waveform generation, ultimately producing less spurs and/or harmonics in RF bands, which could be erroneously interpreted as useful cardiopulmonary information.
- Cost reduction: The removal of the commercial kit’s baseband and microcontroller boards allows acquiring only the commercial MMIC. Including the fabrication of the custom-made PCBs, the overall cost of the modified sensor is approximately one third of the commercial radar’s price, dropping down to ∼300€
2.3. Signal Processing Scheme
2.3.1. Pre-Processing Module
2.3.2. Processing Module for Signals Separation
3. Results
3.1. Breathing and Heartbeat Information Extraction
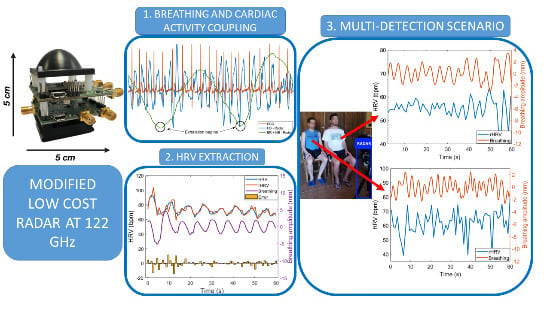
3.2. Analysis of Breathing and Cardiac Activity Coupling
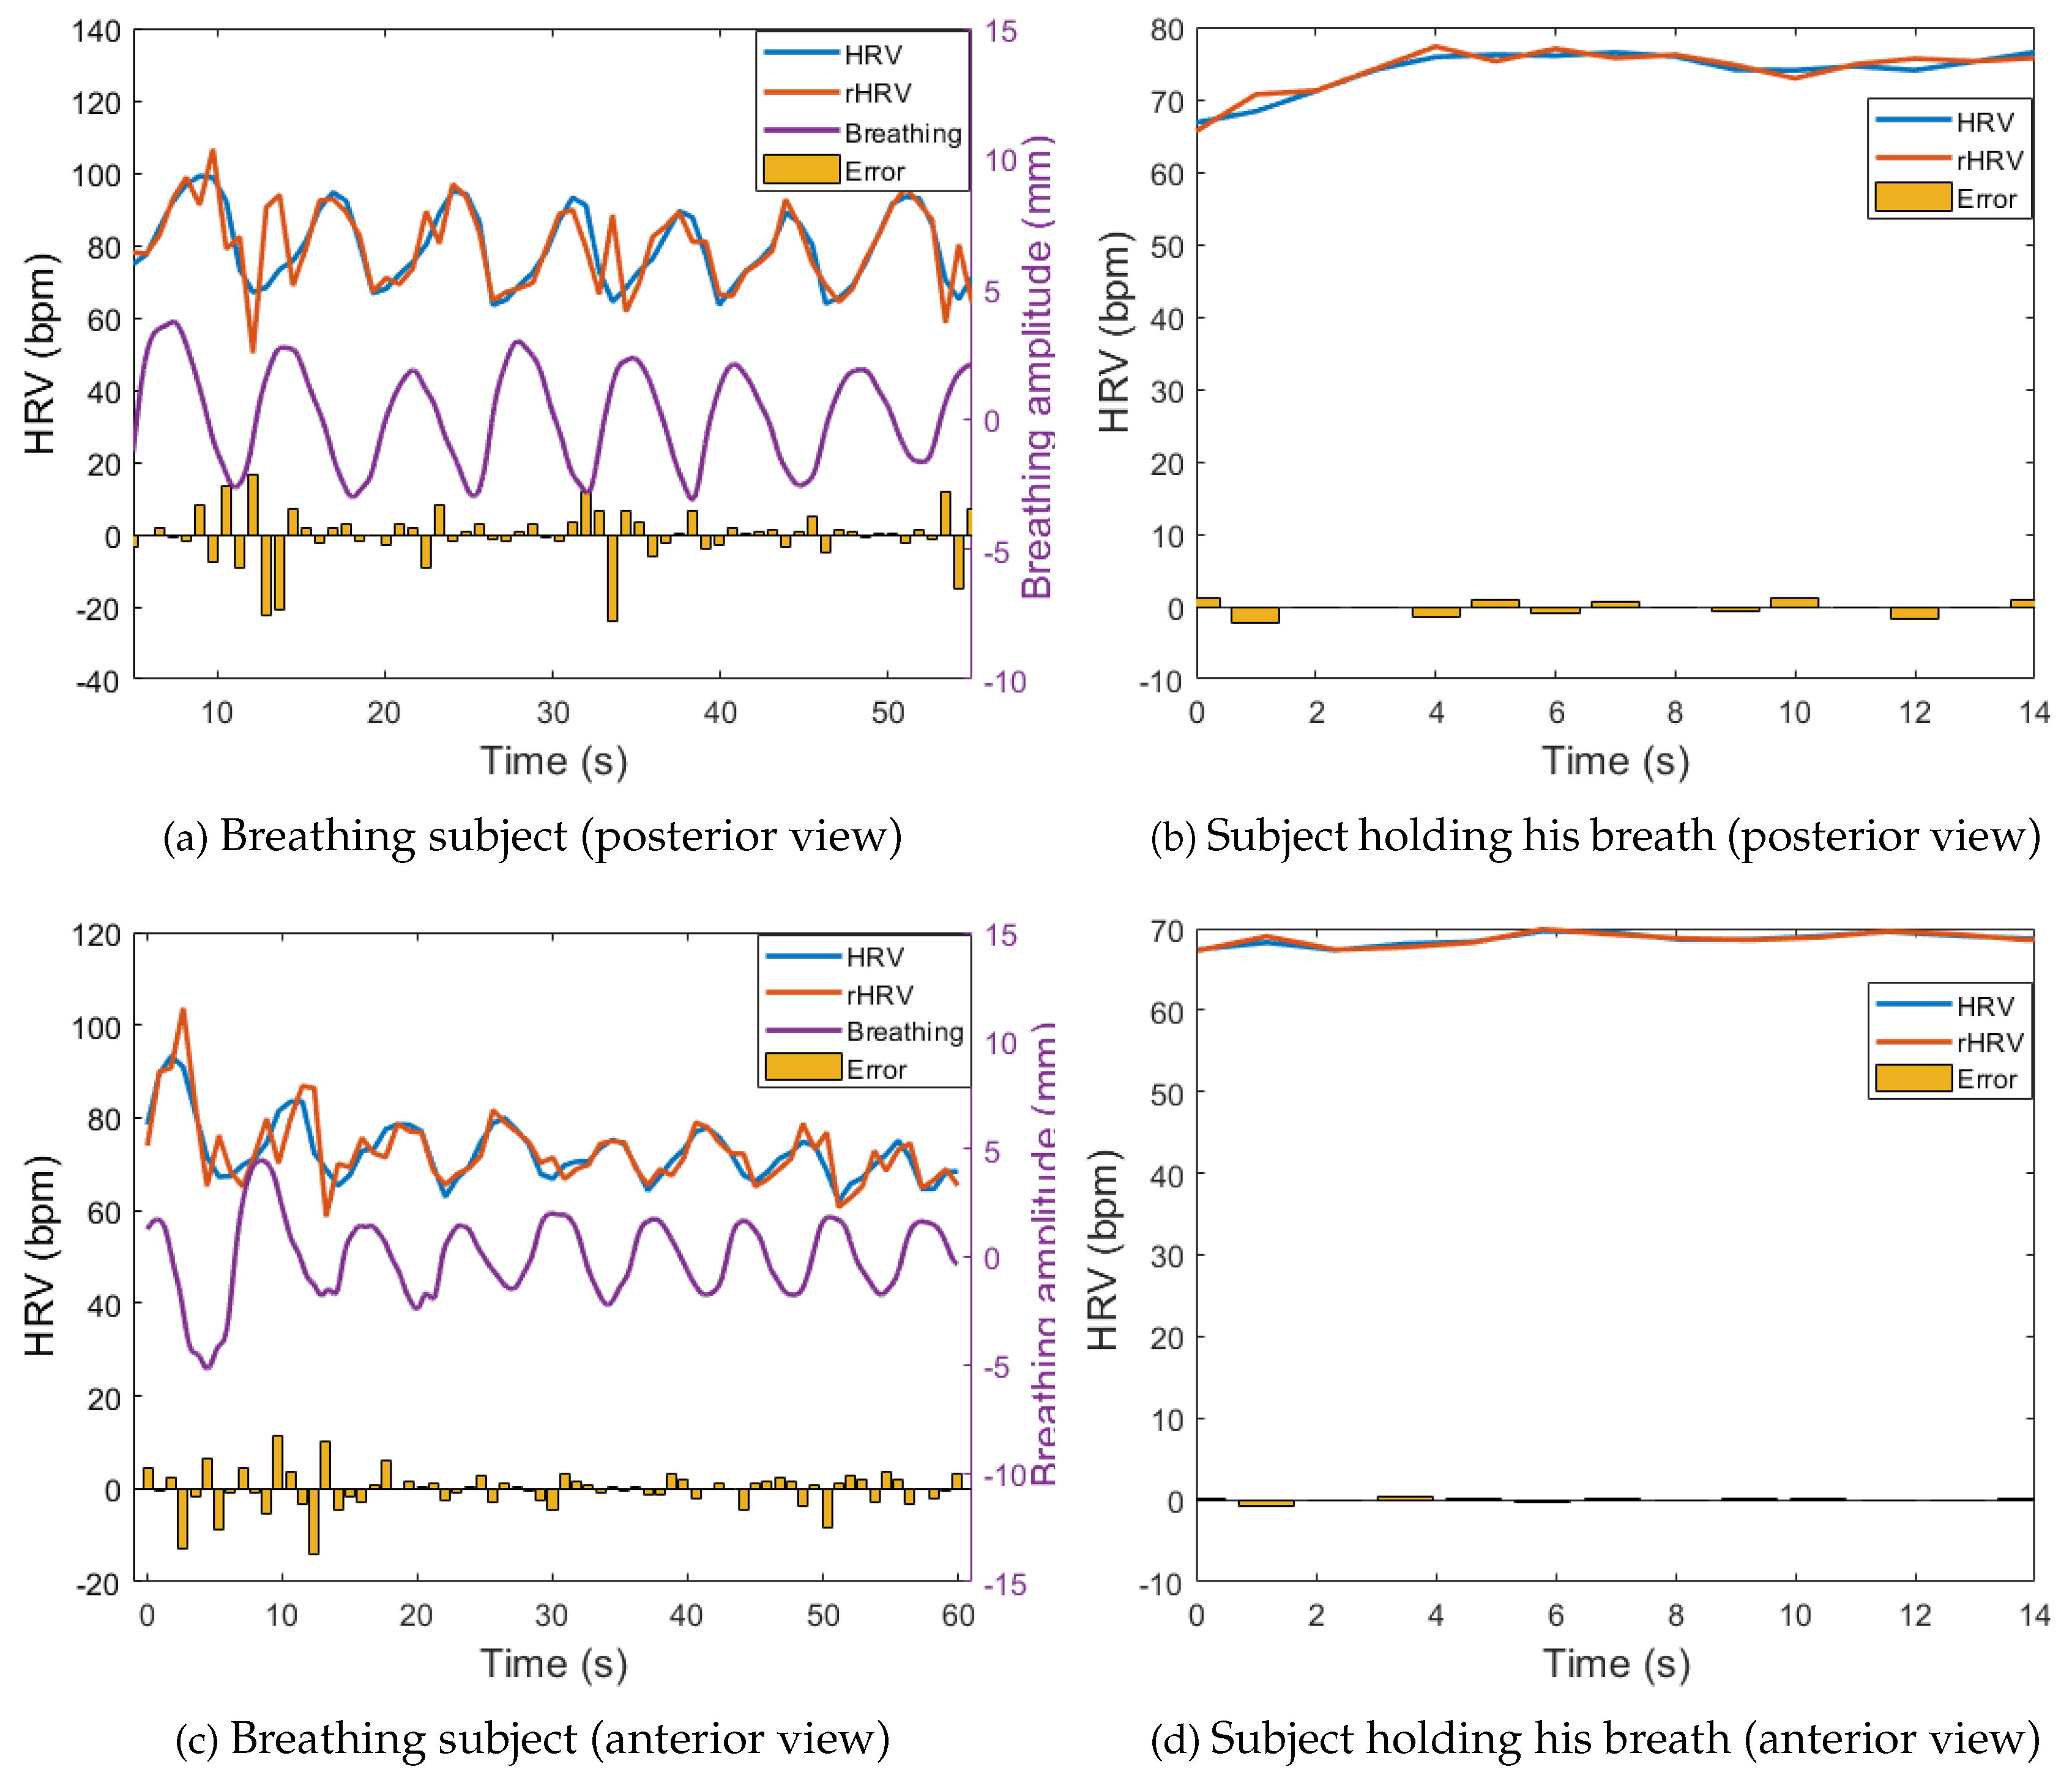
Heart Rate Variability
3.3. Multi-Detection
4. Discussion
5. Conclusions
Author Contributions
Funding
Conflicts of Interest
Abbreviations
| ADC | Analogical-digital converter |
| ANS | Autonomic nervous system |
| APFT | Almost-Periodic Fourier Transform |
| BCG | Ballistocardiograph |
| CW | Continuous-wave |
| DACM | Differentiate and cross-multiply |
| ECG | Electrocardiogram |
| EMD | Empirical mode decomposition |
| FFT | Fast Fourier Transform |
| FMCW | Frequency modulated continuous-wave |
| FoV | Field of view |
| HRV | Heart rate variability |
| ISM | Industrial, scientific and medical |
| IMF | Intrinsic Mode Functions |
| MIMO | Multiple-input multiple-output |
| MMIC | Monolithic microwave integrated circuit |
| MSE | Mean Squared Error |
| PFD | Phase-frequency detector |
| PLL | Phase-locked loop |
| PPG | Photopletysmogram |
| rHRV | HRV from the radar measurement |
| RSA | Respiratory sinus arrhythmia |
| RVP | Residual video phase |
| SCG | Seismocardiograph |
| SNR | Signal-to-noise ratio |
| VCO | Voltage-controlled oscillator |
| VMD | Variational Mode Decomposition |
References
- Boric-Lubecke, O.; Lubecke, V.M.; Droitcour, A.D.; Park, B.K.; Singh, A. (Eds.) Doppler Radar Physiological Sensing; Wiley Series in Biomedical Engineering and Multi-Disciplinary Integrated Systems; IEEE: New York, NY, USA; Wiley: Hoboken, NJ, USA, 2016. [Google Scholar]
- Antognoli, L.; Marchionni, P.; Nobile, S.; Carnielli, V.; Scalise, L. Assessment of cardio-respiratory rates by non-invasive measurement methods in hospitalized preterm neonates. In Proceedings of the 2018 IEEE International Symposium on Medical Measurements and Applications (MeMeA), Rome, Italy, 11–13 June 2018; pp. 1–5. [Google Scholar] [CrossRef]
- Tataraidze, A.B.; Anishchenko, L.N.; Korostovtseva, L.S.; Bochkarev, M.V.; Sviryaev, Y.V. Non-contact Respiratory Monitoring of Subjects with Sleep-Disordered Breathing. In Proceedings of the 2018 IEEE International Conference “Quality Management, Transport and Information Security, Information Technologies” (IT&QM&IS), St. Petersburg, Russia, 24–28 September 2018; pp. 736–738. [Google Scholar] [CrossRef]
- Konstam, M.A. Home Monitoring Should Be the Central Element in an Effective Program of Heart Failure Disease Management. Circulation 2012, 125, 820–827. [Google Scholar] [CrossRef]
- Darkins, A.; Ryan, P.; Kobb, R.; Foster, L.; Edmonson, E.; Wakefield, B.; Lancaster, A.E. Care Coordination/Home Telehealth: The Systematic Implementation of Health Informatics, Home Telehealth, and Disease Management to Support the Care of Veteran Patients with Chronic Conditions. Telemed. E-Health 2008, 14, 1118–1126. [Google Scholar] [CrossRef] [PubMed]
- Gurbuz, S.Z.; Amin, M.G. Radar-Based Human-Motion Recognition With Deep Learning: Promising Applications for Indoor Monitoring. IEEE Signal Process. Mag. 2019, 36, 16–28. [Google Scholar] [CrossRef]
- Le Kernec, J.; Fioranelli, F.; Ding, C.; Zhao, H.; Sun, L.; Hong, H.; Lorandel, J.; Romain, O. Radar Signal Processing for Sensing in Assisted Living: The Challenges Associated With Real-Time Implementation of Emerging Algorithms. IEEE Signal Process. Mag. 2019, 36, 29–41. [Google Scholar] [CrossRef]
- Vieau, S.; Iaizzo, P.A. Basic ECG Theory, 12-Lead Recordings, and Their Interpretation. In Handbook of Cardiac Anatomy, Physiology, and Devices; Iaizzo, P.A., Ed.; Springer International Publishing: Cham, Switzerland, 2015; pp. 321–334. [Google Scholar] [CrossRef]
- Fusco, A.; Locatelli, D.; Onorati, F.; Durelli, G.C.; Santambrogio, M.D. On how to extract breathing rate from PPG signal using wearable devices. In Proceedings of the 2015 IEEE Biomedical Circuits and Systems Conference (BioCAS), Atlanta, GA, USA, 22–24 October 2015; pp. 1–4. [Google Scholar] [CrossRef]
- Starr, I.; Rawson, A.J.; Schroeder, H.A.; Joseph, N.R. Studies on the estimation of cardiac output in man, and of abnormalities in cardiac function, from the heart’s recoil and the blood’s impact; the ballistocardiogram. Am. J. Physiol. Leg. Content 1939, 127, 1–28. [Google Scholar] [CrossRef]
- Zanetti, J.; Salerno, D. Seismocardiography: A technique for recording precordial acceleration. In Computer-Based Medical Systems-Proceedings of the Fourth Annual IEEE Symposium; IEEE Computer Society Press: Baltimore, MD, USA, 1991; pp. 4–9. [Google Scholar] [CrossRef]
- Wu, H.Y.; Rubinstein, M.; Shih, E.; Guttag, J.; Durand, F.; Freeman, W. Eulerian video magnification for revealing subtle changes in the world. ACM Trans. Graph. 2012, 31, 1–8. [Google Scholar] [CrossRef]
- Hong, H. Noninvasive detection of cardiovascular pulsations by optical Doppler techniques. J. Biomed. Opt. 1997, 2, 382. [Google Scholar] [CrossRef] [PubMed]
- Abbas, A.K.; Heimann, K.; Jergus, K.; Orlikowsky, T.; Leonhardt, S. Neonatal non-contact respiratory monitoring based on real-time infrared thermography. BioMedical Eng. OnLine 2011, 10, 93. [Google Scholar] [CrossRef]
- Bruser, C.; Antink, C.H.; Wartzek, T.; Walter, M.; Leonhardt, S. Ambient and Unobtrusive Cardiorespiratory Monitoring Techniques. IEEE Rev. Biomed. Eng. 2015, 8, 30–43. [Google Scholar] [CrossRef]
- Lin, J. Noninvasive microwave measurement of respiration. Proc. IEEE 1975, 63, 1530. [Google Scholar] [CrossRef]
- Li, C.; Peng, Z.; Huang, T.Y.; Fan, T.; Wang, F.K.; Horng, T.S.; Munoz-Ferreras, J.M.; Gomez-Garcia, R.; Ran, L.; Lin, J. A Review on Recent Progress of Portable Short-Range Noncontact Microwave Radar Systems. IEEE Trans. Microw. Theory Tech. 2017, 65, 1692–1706. [Google Scholar] [CrossRef]
- Chen, K.-M.; Huang, Y.; Zhang, J.; Norman, A. Microwave life-detection systems for searching human subjects under earthquake rubble or behind barrier. IEEE Trans. Biomed. Eng. 2000, 47, 105–114. [Google Scholar] [CrossRef] [PubMed]
- Wang, S.; Pohl, A.; Jaeschke, T.; Czaplik, M.; Kony, M.; Leonhardt, S.; Pohl, N. A novel ultra-wideband 80 GHz FMCW radar system for contactless monitoring of vital signs. In Proceedings of the 2015 37th Annual International Conference of the IEEE Engineering in Medicine and Biology Society (EMBC), Milan, Italy, 25–29 August 2015; pp. 4978–4981. [Google Scholar] [CrossRef]
- Lee, Y.S.; Pathirana, P.N.; Steinfort, C.L.; Caelli, T. Monitoring and Analysis of Respiratory Patterns Using Microwave Doppler Radar. IEEE J. Transl. Eng. Health Med. 2014, 2, 1–12. [Google Scholar] [CrossRef] [PubMed]
- Droitcour, A.; Lubecke, V.; Lin, J.; Boric-Lubecke, O. A microwave radio for Doppler radar sensing of vital signs. In Proceedings of the 2001 IEEE MTT-S International Microwave Sympsoium Digest (Cat. No.01CH37157), Phoenix, AZ, USA, 20–24 May 2001; Volume 1, pp. 175–178. [Google Scholar] [CrossRef]
- Massagram, W.; Lubecke, V.; Host-Madsen, A.; Boric-Lubecke, O. Assessment of Heart Rate Variability and Respiratory Sinus Arrhythmia via Doppler Radar. IEEE Trans. Microw. Theory Tech. 2009, 57, 2542–2549. [Google Scholar] [CrossRef]
- Wang, J.; Wang, X.; Zhu, Z.; Huangfu, J.; Li, C.; Ran, L. 1-D Microwave Imaging of Human Cardiac Motion: An Ab-Initio Investigation. IEEE Trans. Microw. Theory Tech. 2013, 61, 2101–2107. [Google Scholar] [CrossRef]
- Petrovic, V.L.; Jankovic, M.M.; Lupsic, A.V.; Mihajlovic, V.R.; Popovic-Bozovic, J.S. High-Accuracy Real-Time Monitoring of Heart Rate Variability Using 24 GHz Continuous-Wave Doppler Radar. IEEE Access 2019, 7, 74721–74733. [Google Scholar] [CrossRef]
- Will, C.; Shi, K.; Schellenberger, S.; Steigleder, T.; Michler, F.; Weigel, R.; Ostgathe, C.; Koelpin, A. Local Pulse Wave Detection Using Continuous Wave Radar Systems. IEEE J. Electromagn. RF Microwaves Med. Biol. 2017, 1, 81–89. [Google Scholar] [CrossRef]
- Vinci, G.; Lindner, S.; Barbon, F.; Mann, S.; Hofmann, M.; Duda, A.; Weigel, R.; Koelpin, A. Six-Port Radar Sensor for Remote Respiration Rate and Heartbeat Vital-Sign Monitoring. IEEE Trans. Microw. Theory Tech. 2013, 61, 2093–2100. [Google Scholar] [CrossRef]
- Dong, S.; Zhang, Y.; Ma, C.; Zhu, C.; Gu, Z.; Lv, Q.; Zhang, B.; Li, C.; Ran, L. Doppler Cardiogram: A Remote Detection of Human Heart Activities. IEEE Trans. Microw. Theory Tech. 2020, 68, 1132–1141. [Google Scholar] [CrossRef]
- Petkie, D.T.; Benton, C.; Bryan, E. Millimeter wave radar for remote measurement of vital signs. In Proceedings of the 2009 IEEE Radar Conference, Pasadena, CA, USA, 4–8 May 2009; pp. 1–3. [Google Scholar]
- Lee, H.; Kim, B.H.; Yook, J.G. Path Loss Compensation Method for Multiple Target Vital Sign Detection with 24-GHz FMCW Radar. In Proceedings of the 2018 IEEE Asia-Pacific Conference on Antennas and Propagation (APCAP), Auckland, New Zealand, 5–8 August 2018; pp. 100–101. [Google Scholar] [CrossRef]
- Ahmad, A.; Roh, J.C.; Wang, D.; Dubey, A. Vital signs monitoring of multiple people using a FMCW millimeter-wave sensor. In Proceedings of the 2018 IEEE Radar Conference (RadarConf18), Oklahoma City, OK, USA, 23–27 April 2018; pp. 1450–1455. [Google Scholar] [CrossRef]
- Prat, A.; Blanch, S.; Aguasca, A.; Romeu, J.; Broquetas, A. Collimated Beam FMCW Radar for Vital Sign Patient Monitoring. IEEE Trans. Antennas Propag. 2019, 67, 5073–5080. [Google Scholar] [CrossRef]
- Betancur, J. Multimodal Image Registration for the Characterization of the Hypertrophic Cardiomyopathy and the Cardiac Asynchronism. Ph.D. Thesis, Université Rennes, Rennes, France, 2014. [Google Scholar]
- Sermesant, M. Modèle électromécanique du coeur pour l’analyse d’image et la simulation (Electromechanical Model of the Heart for Image Analysis and Simulation). Ph.D. Thesis, Université Nice Sophia Antipolis, Nice, France, 2003. [Google Scholar]
- OpenStax. Anatomy and Physiology; OpenStax CNX: Houston, TX, USA, 2016; Chapter 19. [Google Scholar]
- Esper, S.A.; Pinsky, M.R. Arterial waveform analysis. Best Pract. Res. Clin. Anaesthesiol. 2014, 28, 363–380. [Google Scholar] [CrossRef] [PubMed]
- Vasan, R.; Larson, M.; Leip, E. Impact of high-normal blood pressure on the risk of cardiovascular disease. ACC Curr. J. Rev. 2002, 11, 31. [Google Scholar] [CrossRef]
- Romagnoli, S.; Ricci, Z.; Quattrone, D.; Tofani, L.; Tujjar, O.; Villa, G.; Romano, S.M.; De Gaudio, A.R. Accuracy of invasive arterial pressure monitoring in cardiovascular patients: An observational study. Crit. Care 2014, 18, 644. [Google Scholar] [CrossRef] [PubMed]
- Kang, J.H.; Kim, J.K.; Hong, S.H.; Lee, C.H.; Choi, B.Y. Heart Rate Variability for Quantification of Autonomic Dysfunction in Fibromyalgia. Ann. Rehabil. Med. 2016, 40, 301. [Google Scholar] [CrossRef] [PubMed]
- Tsao, J.; Evans, S.; Seidman, L.; Lung, K.; Zeltzer, L.; Naliboff, B. Heart rate variability as a biomarker for autonomic nervous system response differences between children with chronic pain and healthy control children. J. Pain Res. 2013, 6, 449. [Google Scholar] [CrossRef]
- Tereshchenko, L.G.; Cygankiewicz, I.; McNitt, S.; Vazquez, R.; Bayes-Genis, A.; Han, L.; Sur, S.; Couderc, J.P.; Berger, R.D.; De Luna, A.B.; et al. Predictive Value of Beat-to-Beat QT Variability Index Across the Continuum of Left Ventricular Dysfunction: Competing Risks of Noncardiac or Cardiovascular Death and Sudden or Nonsudden Cardiac Death. Circ. Arrhythmia Electrophysiol. 2012, 5, 719–727. [Google Scholar] [CrossRef]
- Khandoker, A.H.; Jelinek, H.F.; Palaniswami, M. Identifying diabetic patients with cardiac autonomic neuropathy by heart rate complexity analysis. BioMedical Eng. OnLine 2009, 8, 3. [Google Scholar] [CrossRef]
- Schwerdtfeger, A.R.; Schwarz, G.; Pfurtscheller, K.; Thayer, J.F.; Jarczok, M.N.; Pfurtscheller, G. Heart rate variability (HRV): From brain death to resonance breathing at 6 breaths per minute. Clin. Neurophysiol. 2020, 131, 676–693. [Google Scholar] [CrossRef]
- Hales, S.; Innys, W.; Manby, R.; Woodward, T. Statical Essays, Containing Haemastaticks, or, An Account of Some Hydraulick and Hydrostatical Experiments Made on the Blood and Blood Vessels of Animals: Also an Account of Some Experiments on Stones in the Kidneys and Bladder: With an Enquiry into the Nature of Those Anomalous Concretions: To Which is Added, an Appendix, Containing Observations and Experiments Relating to Several Subjects in the First Volume, the Greater Part of Which were Read at Several Meetings before the Royal Society: With an Index to Both Volumes; Innys, W., Manby, R., Woodward, T., Eds.; Printed for W. Innys and R. Manby, at the west-end of St. Paul’s, and T. Woodward, at the Half-Moon between Temple-Gate, Fleetstreet: London, UK, 1733. [Google Scholar] [CrossRef]
- Ludwig, C. Beiträge zur Kenntniss des Einflusses der Respirationsbewegungen auf den Blutlauf im Aortensysteme. Arch. Für Anat. Physiol. Und Wiss. Med. 1847, 4, 242–302. [Google Scholar]
- Mukhopadhyay, S.C.; Pimentel, M.A.; Charlton, P.H.; Clifton, D.A. Probabilistic Estimation of Respiratory Rate from Wearable Sensors. In Wearable Electronics Sensors: For Safe and Healthy Living; Number Volume 15 in Smart Sensors, Measurement and Instrumentation; Springer: Cham, Switzerland; Heidelberg, Germany; New York, NY, USA, 2015; Chapter 10; p. 243. [Google Scholar]
- Lehrer, P.; Carr, R.E.; Smetankine, A.; Vaschillo, E.; Peper, E.; Porges, S.; Edelberg, R.; Hamer, R.; Hochron, S. EMG and Incentive Inspirometry Biofeedback for Asthma: A Pilot Study. Appl. Psychophysiol. Biofeedback 1997, 22, 95–109. [Google Scholar] [CrossRef]
- Citi, L.; Bianchi, M.T.; Klerman, E.B.; Barbieri, R. Instantaneous monitoring of sleep fragmentation by point process heart rate variability and respiratory dynamics. In Proceedings of the 2011 Annual International Conference of the IEEE Engineering in Medicine and Biology Society, Boston, MA, USA, 30 August–3 September 2011; pp. 7735–7738. [Google Scholar]
- Giardino, N.D.; Chan, L.; Borson, S. Combined Heart Rate Variability and Pulse Oximetry Biofeedback for Chronic Obstructive Pulmonary Disease: Preliminary Findings. Appl. Psychophysiol. Biofeedback 2004, 29, 121–133. [Google Scholar] [CrossRef] [PubMed]
- CEPT/ECC. ERC Report 25: The Eropean Table of Frequency Allocations and Applications in the Frequency Range 8.3 kHz to 3000 GHz (ECA Table). Available online: https://www.ecodocdb.dk/download/2ca5fcbd-4090/ERCREP025.pdf (accessed on 20 May 2020).
- Wang, G.; Munoz-Ferreras, J.M.; Gu, C.; Li, C.; Gomez-Garcia, R. Application of Linear-Frequency-Modulated Continuous-Wave (LFMCW) Radars for Tracking of Vital Signs. IEEE Trans. Microw. Theory Tech. 2014, 62, 1387–1399. [Google Scholar] [CrossRef]
- GmbH, S.R. Radar Evaluation Kits for various Front Ends. Available online: https://siliconradar.com/evalkits/ (accessed on 17 April 2020).
- Pauli, M.; Gottel, B.; Scherr, S.; Bhutani, A.; Ayhan, S.; Winkler, W.; Zwick, T. Miniaturized Millimeter-Wave Radar Sensor for High-Accuracy Applications. IEEE Trans. Microw. Theory Tech. 2017, 65, 1707–1715. [Google Scholar] [CrossRef]
- Zwick, T.; Boes, F.; Gottel, B.; Bhutani, A.; Pauli, M. Pea-Sized mmW Transceivers: QFN-? Based Packaging Concepts for Millimeter-Wave Transceivers. IEEE Microw. Mag. 2017, 18, 79–89. [Google Scholar] [CrossRef]
- Frischen, A.; Hasch, J.; Waldschmidt, C. A Cooperative MIMO Radar Network Using Highly Integrated FMCW Radar Sensors. IEEE Trans. Microw. Theory Tech. 2017, 65, 1355–1366. [Google Scholar] [CrossRef]
- Wang, J.; Wang, X.; Chen, L.; Huangfu, J.; Li, C.; Ran, L. Noncontact Distance and Amplitude-Independent Vibration Measurement Based on an Extended DACM Algorithm. IEEE Trans. Instrum. Meas. 2014, 63, 145–153. [Google Scholar] [CrossRef]
- Huang, N.E.; Shen, Z.; Long, S.R.; Wu, M.C.; Shih, H.H.; Zheng, Q.; Yen, N.C.; Tung, C.C.; Liu, H.H. The empirical mode decomposition and the Hilbert spectrum for nonlinear and non-stationary time series analysis. Proc. R. Soc. Lond. Ser. A Math. Phys. Eng. Sci. 1998, 454, 903–995. [Google Scholar] [CrossRef]
- Geddes, L.A. Handbook of Blood Pressure Measurement; Humana Press: Clifton, NJ, USA, 1991. [Google Scholar]
- Van Varik, B.J.; Rennenberg, R.J.M.W.; Reutelingsperger, C.P.; Kroon, A.A.; de Leeuw, P.W.; Schurgers, L.J. Mechanisms of arterial remodeling: Lessons from genetic diseases. Front. Genet. 2012, 3. [Google Scholar] [CrossRef] [PubMed]
- Janbakhshi, P.; Shamsollahi, M.B. ECG-derived respiration estimation from single-lead ECG using gaussian process and phase space reconstruction methods. Biomed. Signal Process. Control 2018, 45, 80–90. [Google Scholar] [CrossRef]
- Kobayashi, H. Normalization of Respiratory Sinus Arrhythmia by Factoring in Tidal Volume. Appl. Hum. Sci. J. Physiol. Anthropol. 1998, 17, 207–213. [Google Scholar] [CrossRef]
- Jung, H.K.; Noh, Y.H.; Jeong, D.U. A Design of EMD-based Filter to Remove Motion artifacts in Wireless ECG Monitoring. J. Converg. Inf. Technol. 2013, 8, 660–668. [Google Scholar] [CrossRef]
- Mostafanezhad, I.; Yavari, E.; Boric-Lubecke, O.; Lubecke, V.M.; Mandic, D.P. Cancellation of Unwanted Doppler Radar Sensor Motion Using Empirical Mode Decomposition. IEEE Sensors J. 2013, 13, 1897–1904. [Google Scholar] [CrossRef]
- Dragomiretskiy, K.; Zosso, D. Variational Mode Decomposition. IEEE Trans. Signal Process. 2014, 62, 531–544. [Google Scholar] [CrossRef]


| Non-Contact Devices | Working Principle | Limitations |
|---|---|---|
| Laser-based | Method that measures chest displacement using light. |
|
| Video motion monitoring | Method that films the displacement of the body surface. |
|
| Thermal-based | Method that, measuring temperature changes, allows a representation of the heartbeat and breathing. |
|
| Ballistocardiograph | Method that obtains the heartbeat and breathing due to repetitive movements of the human body, occurring because of acceleration of blood as it is ejected and moved in the vessels during the cardiac cycle. |
|
| Seismocardiograph | Method that measures the heartbeat and breathing due to the vibrations of the chest wall. |
|
| Radar-based | Method that captures the chest displacement due to the frequency shift (velocity measure) or phase difference (distance measure), which occurs when the target from which the radar wave is reflected moves. |
|
| Radar Technology | Frequency (GHz) | Reference Signal | Results | Additional Comments |
|---|---|---|---|---|
| CW [21] | 1.892 | Finger pulse sensor | Respiratory and heart rate | - |
| CW [22] | 2.4 | ECG and respiratory belt | HRV | Analysis of RSA effect |
| CW [23] | 15 | Contact pulse sensor (wrist) | Reconstructed pulse waveform | Best cardiac motion detection from the front but better heart-rate accuracy from the back |
| CW [24] | 24 | ECG | HRV | Thorough analysis of HRV extraction |
| CW [25] | 24 | Sphygmogram | Reconstructed pulse waveform | Correlation between radar output and sphygmogram measuring carotid, vein and ventricle pressure |
| CW [26] | 24 | ECG (Heart rate) | Heart rate | Best performance measuring from the back of a sitting patient |
| CW [27] | 24 | ECG (Identifying cardiac events) | Respiratory and heart rate | Correlation between the radar output and the overall cardiac volume conducted through skin |
| CW [28] | 228 | ECG and respiratory belt | Respiratory and heart rate | Measurements up to 50 m |
| FMCW [29] | 24.05–24.25 | Piezoelectric finger sensor | Heart rate | Simultaneously heart rate detection of multiple subjects |
| FMCW [30] | 77–81 | - | Respiratory and heart rate | Simultaneously vital sign detection of multiple subjects, uses MIMO |
| FMCW [19] | 75–85 | Philips MP70: ECG + changes | Respiratory and heart rate | - |
| FMCW [31] | 118.5–125.5 | Respiratory belt and pulsioximeter | Respiratory and heart rate | - |
| FMCW | ||||
| [this work] | 114–130 | ECG | Reconstructed breathing and heartbeat waveforms, HRV, and respiratory and heart rate | Simultaneously vital sign detection of multiple subjects and analysis of coupling between breathing and heartbeat |
| Characteristic | Value |
|---|---|
| Center Frequency (GHz) | 122 |
| Output Power (dBm) | −3 (without antennas) |
| Bandwidth (GHz) | 16 (max) |
| Sweep Time | 12 s to 18 ms |
| Beamwidth | (with the lens) |
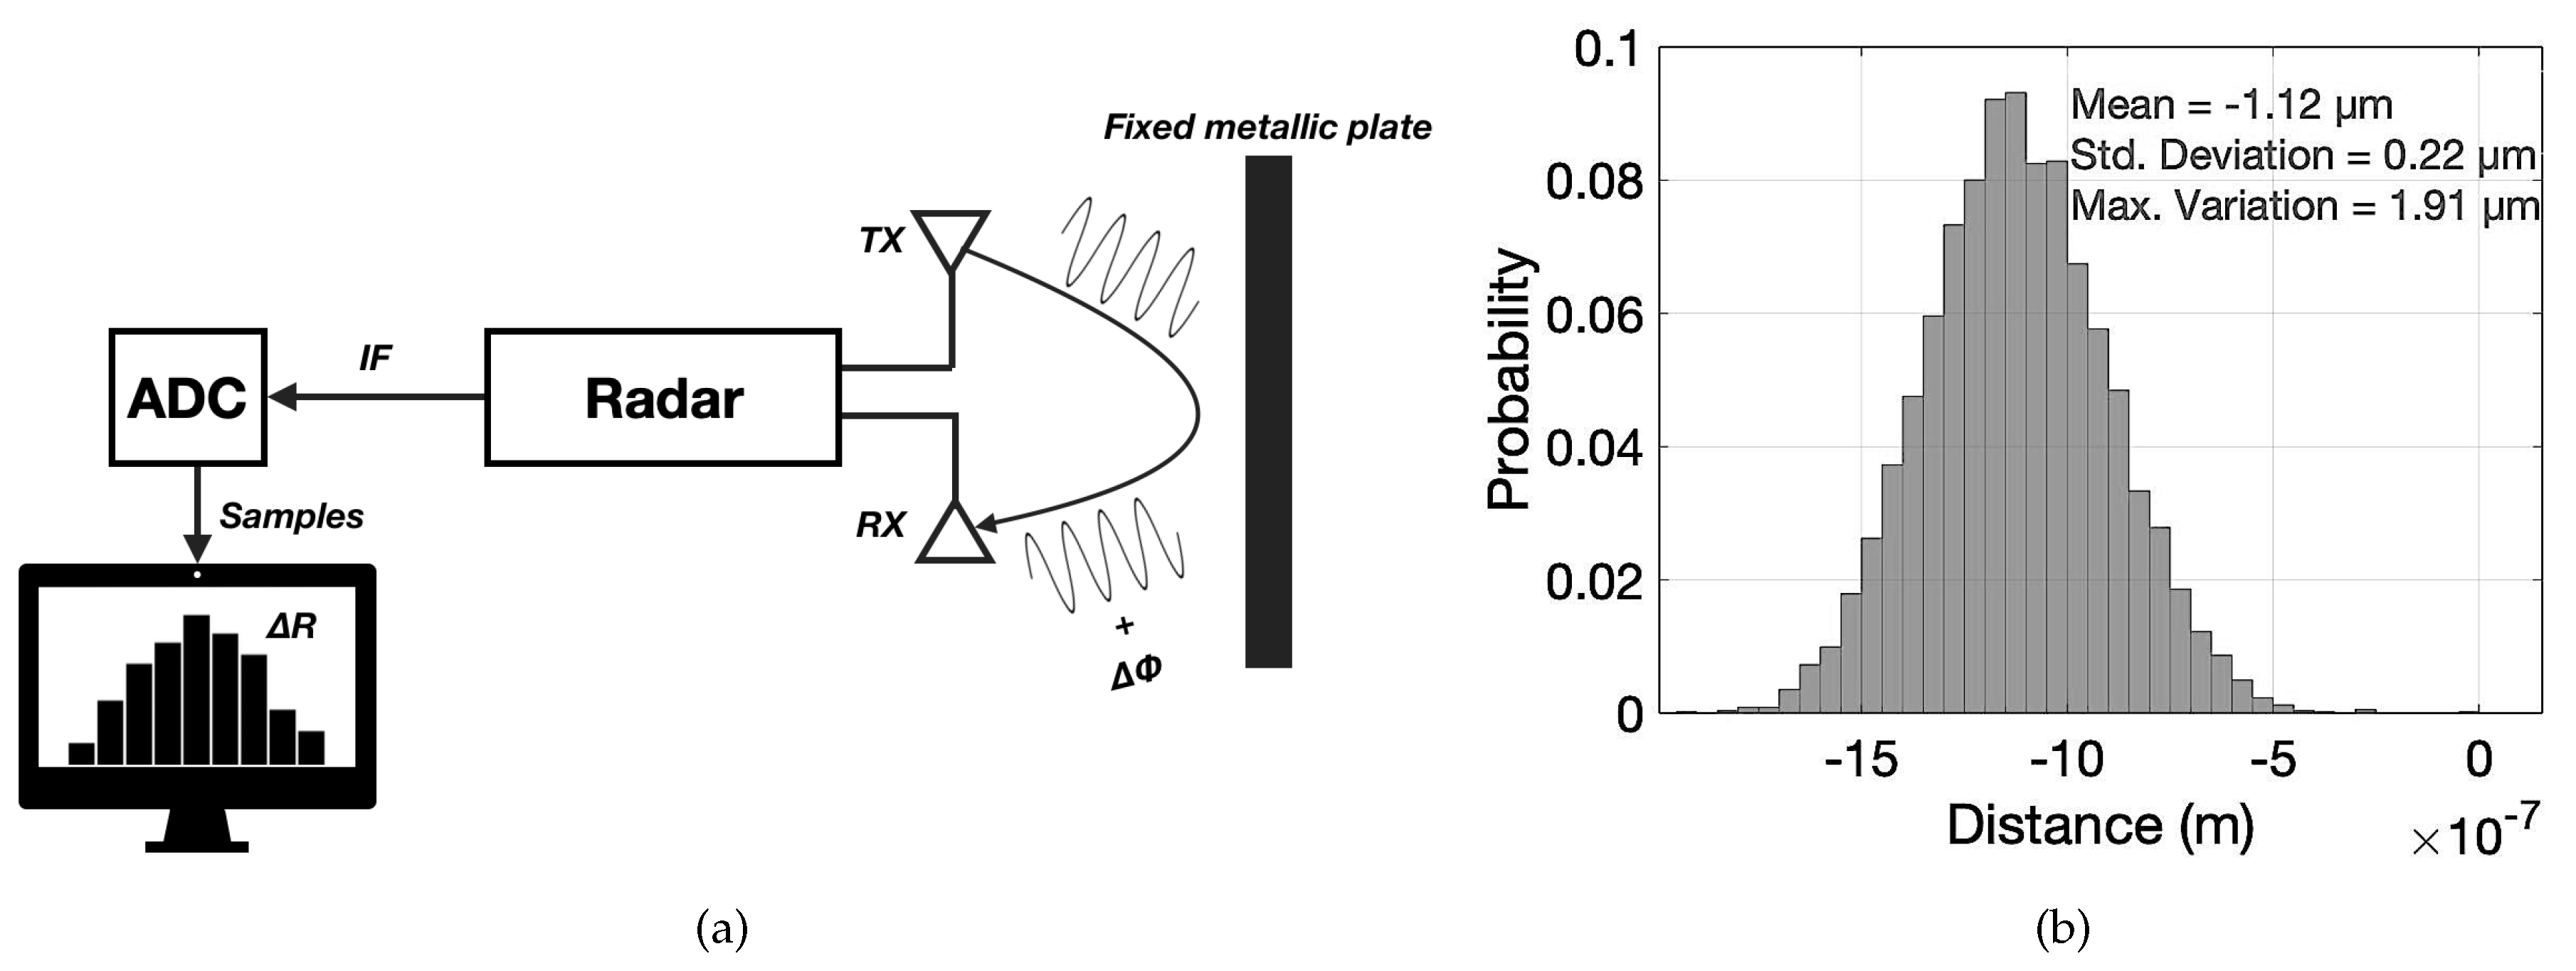
| Phase stability (m) (max) | 1.91 |
| Pre-Processing Algorithm | |
|---|---|
| 1 → | % Received signal |
| 2 → | % : Window to enhance dynamic range |
| 3 → | % Zero-padding added |
| 4 → | % FFT of each chirp |
| 5 → determined from | % Target’s frequency range from first chirp FFT: |
| 6 → | % Clipping of the FFT between and |
| 7 → | % Beat frequency is calculated for each chirp |
| 8 → | % Phase extraction using DACM algorithm |
| 9 → | % Target range is calculated from phase |
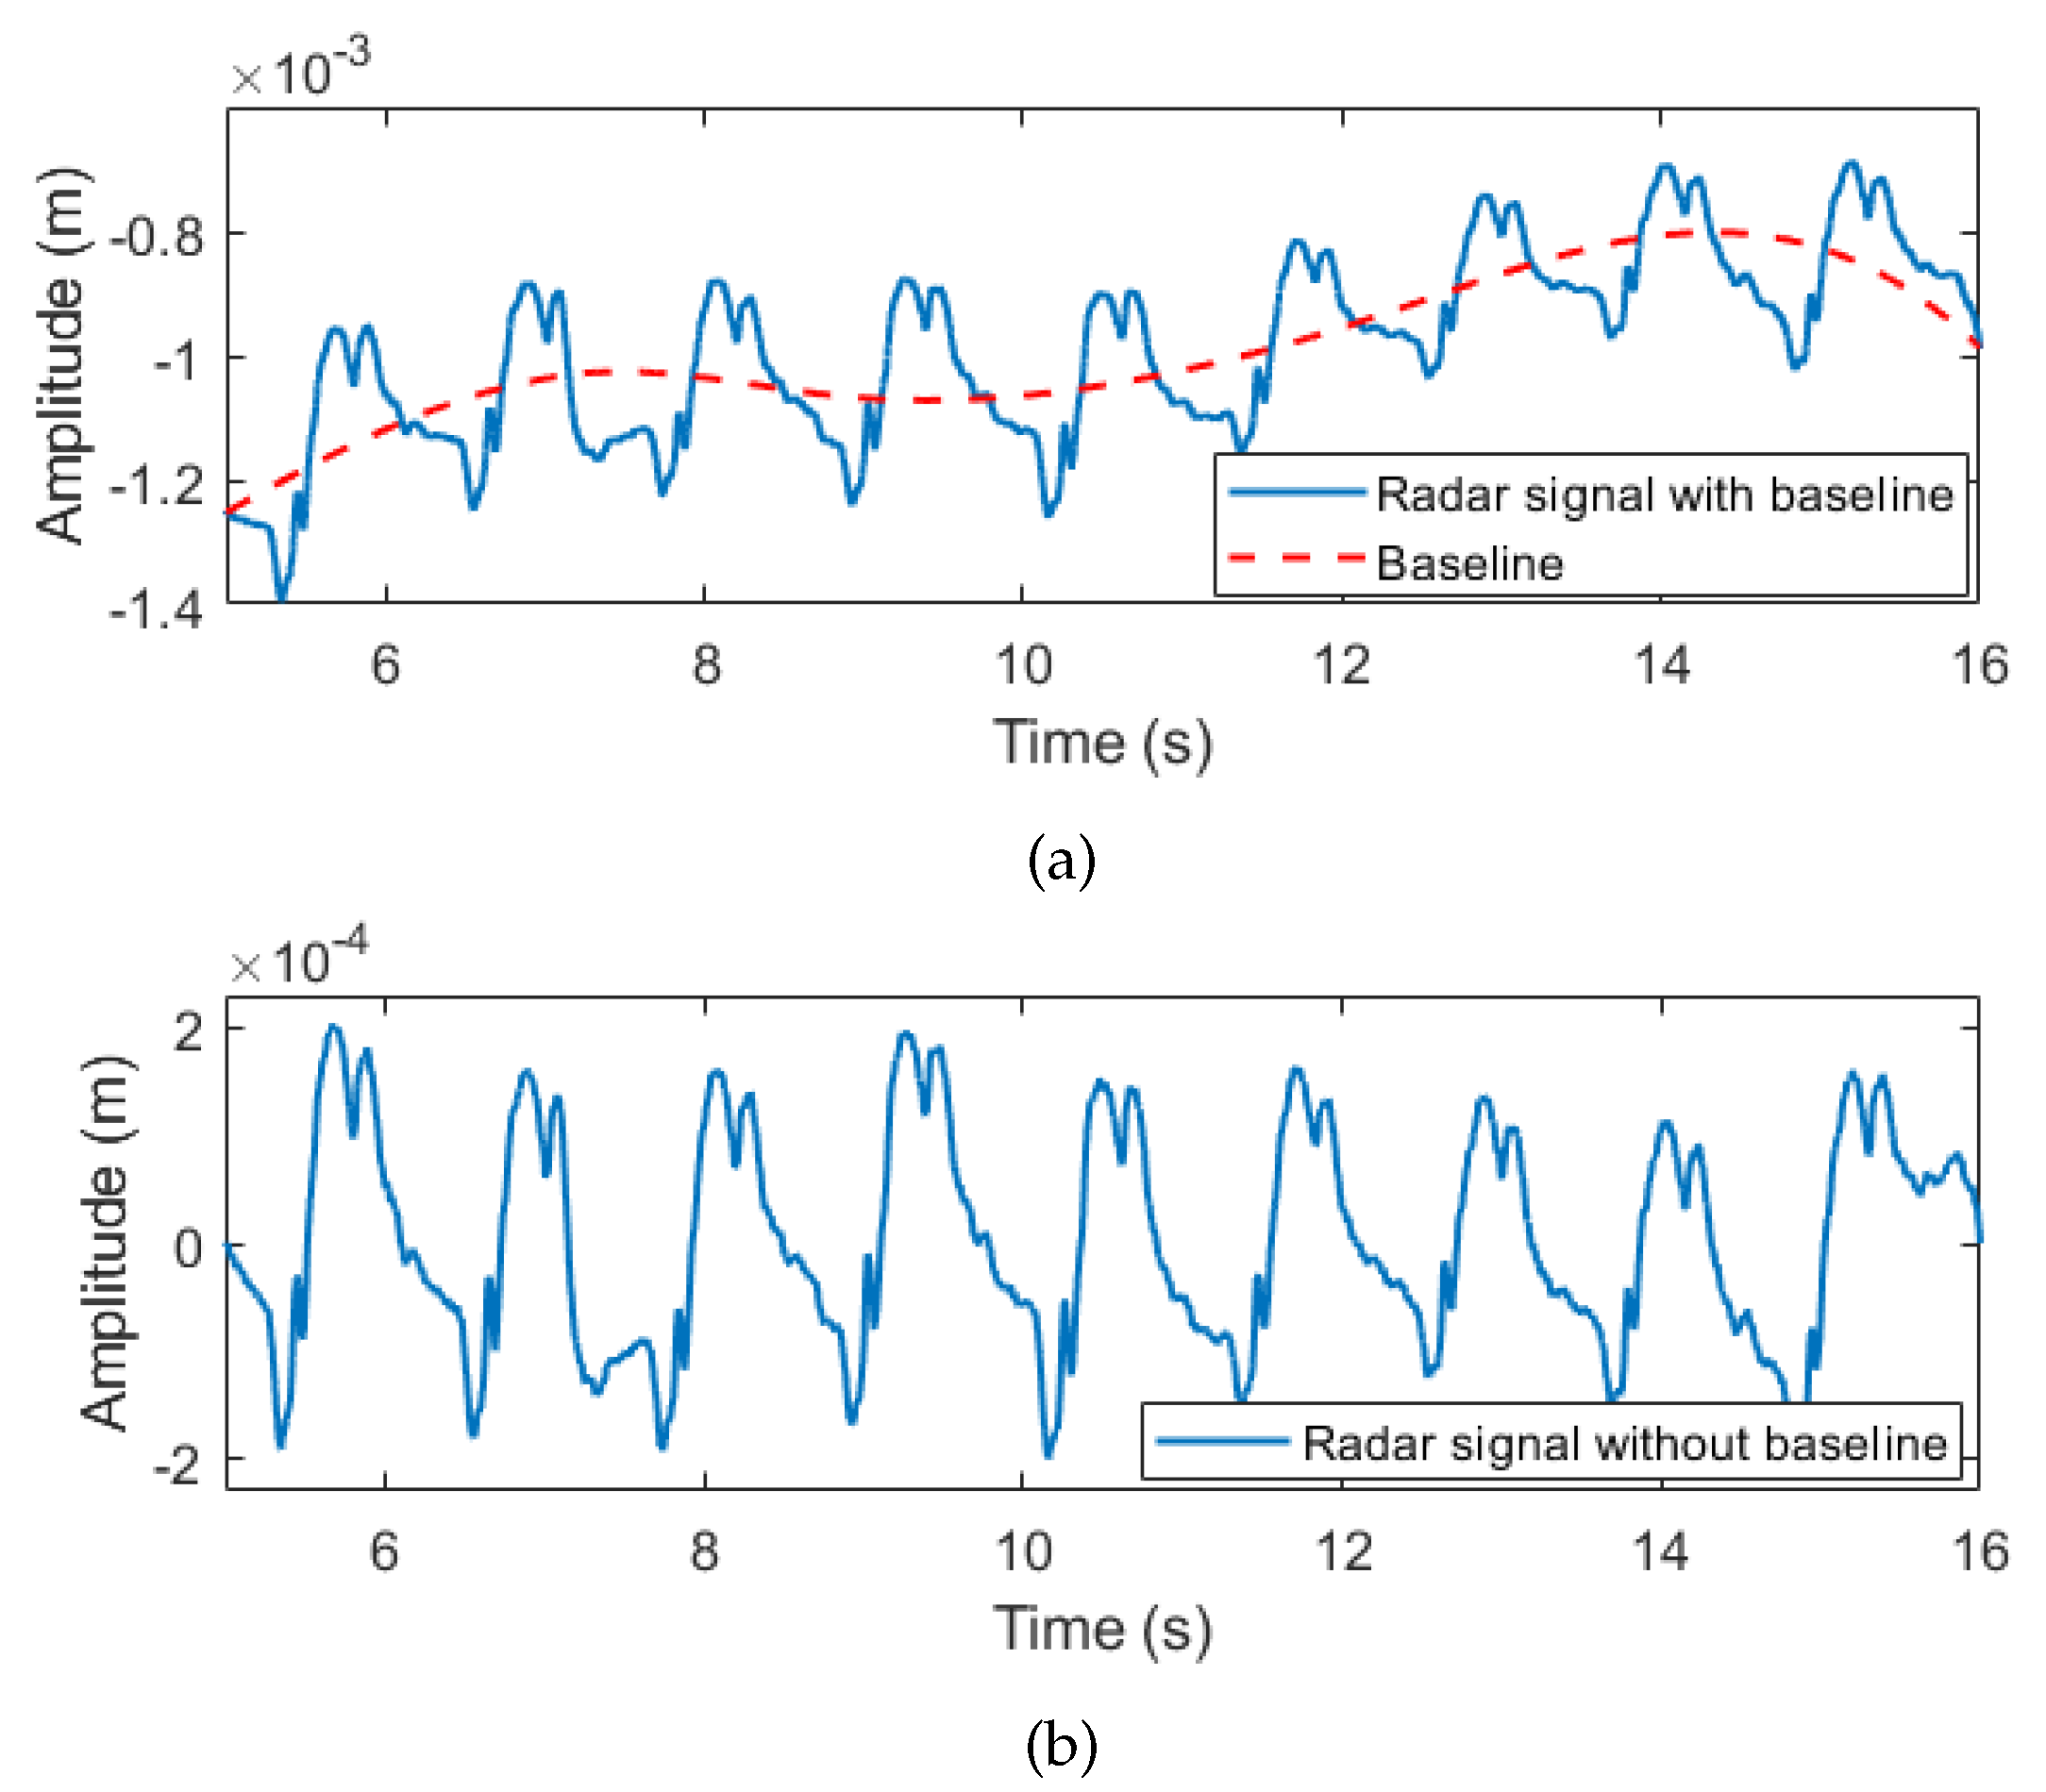
| 10 → | % The baseline wander is removed using EMD |
| Linear Filtering Algorithm | |
|---|---|
| 0 → The window cut-off frequencies are set | % Breathing: 0.05–0.8 Hz, Heartbeat: 0.8–12 Hz |
| 1 → and | % Ideal band-pass filter for each signal |
| 2 → | % FFT of the pre-processed target range |
| 3 → | % Breathing signal in the frequency domain |
| 4 → | % Heartbeat signal in the frequency domain |
| 5 → | % Breathing signal in the time domain |
| 6 → | % Heartbeat signal in the time domain |
© 2020 by the authors. Licensee MDPI, Basel, Switzerland. This article is an open access article distributed under the terms and conditions of the Creative Commons Attribution (CC BY) license (http://creativecommons.org/licenses/by/4.0/).
Share and Cite
Antolinos, E.; García-Rial, F.; Hernández, C.; Montesano, D.; Godino-Llorente, J.I.; Grajal, J. Cardiopulmonary Activity Monitoring Using Millimeter Wave Radars. Remote Sens. 2020, 12, 2265. https://doi.org/10.3390/rs12142265
Antolinos E, García-Rial F, Hernández C, Montesano D, Godino-Llorente JI, Grajal J. Cardiopulmonary Activity Monitoring Using Millimeter Wave Radars. Remote Sensing. 2020; 12(14):2265. https://doi.org/10.3390/rs12142265
Chicago/Turabian StyleAntolinos, Elías, Federico García-Rial, Clara Hernández, Daniel Montesano, Juan I. Godino-Llorente, and Jesús Grajal. 2020. "Cardiopulmonary Activity Monitoring Using Millimeter Wave Radars" Remote Sensing 12, no. 14: 2265. https://doi.org/10.3390/rs12142265
APA StyleAntolinos, E., García-Rial, F., Hernández, C., Montesano, D., Godino-Llorente, J. I., & Grajal, J. (2020). Cardiopulmonary Activity Monitoring Using Millimeter Wave Radars. Remote Sensing, 12(14), 2265. https://doi.org/10.3390/rs12142265