Hierarchical Radar Data Analysis for Activity and Personnel Recognition


Abstract
1. Introduction
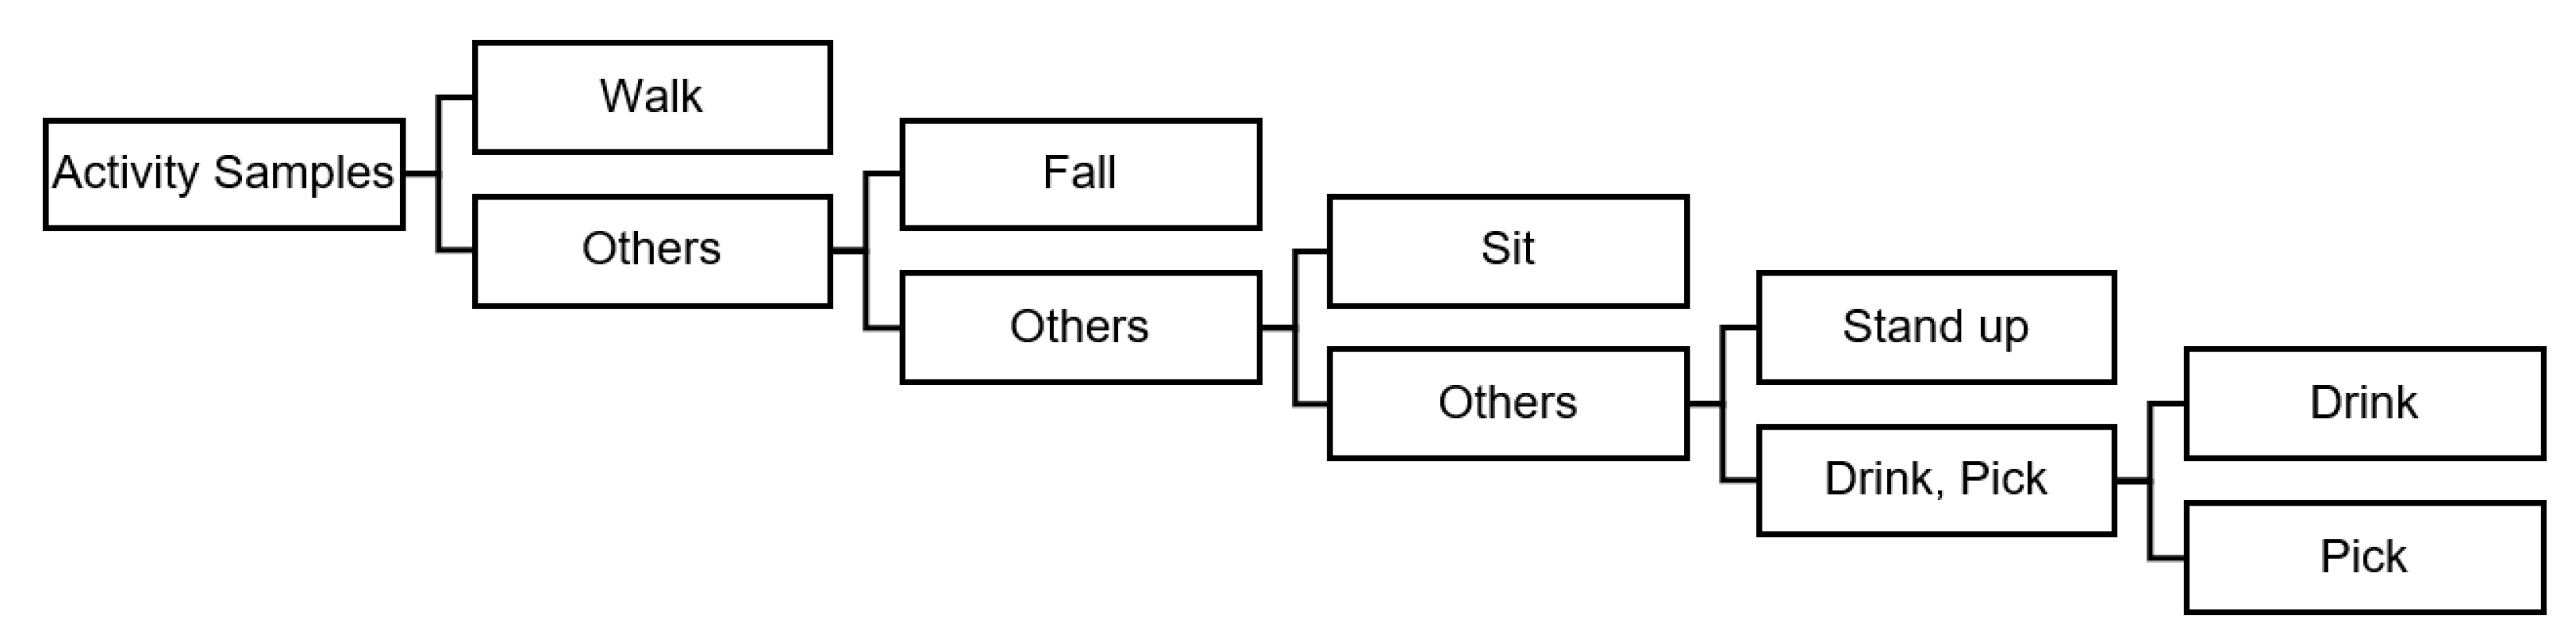
- A novel hierarchical human activity recognition scheme with optimised feature sets and classification algorithm combinations for improved performance on one-vs-all schemes;
- The provision of insight into the robustness of features for different activities by analysing which features are consistently selected for classification and which ones are flexibly selected for different activities;
- A novel personnel recognition algorithm using the combination of multiple domains—spectrogram, cadence velocity diagram, velocity diagram, and acceleration diagram to identify stable phases of walk suitable for classification first and then identify personnel;
- The provision of insight into what affects the performances for personnel recognition based on the quality of the radar signatures.
2. Data Collection and Pre-Processing
3. Feature Extraction and Validation
3.1. Activity Feature Extraction
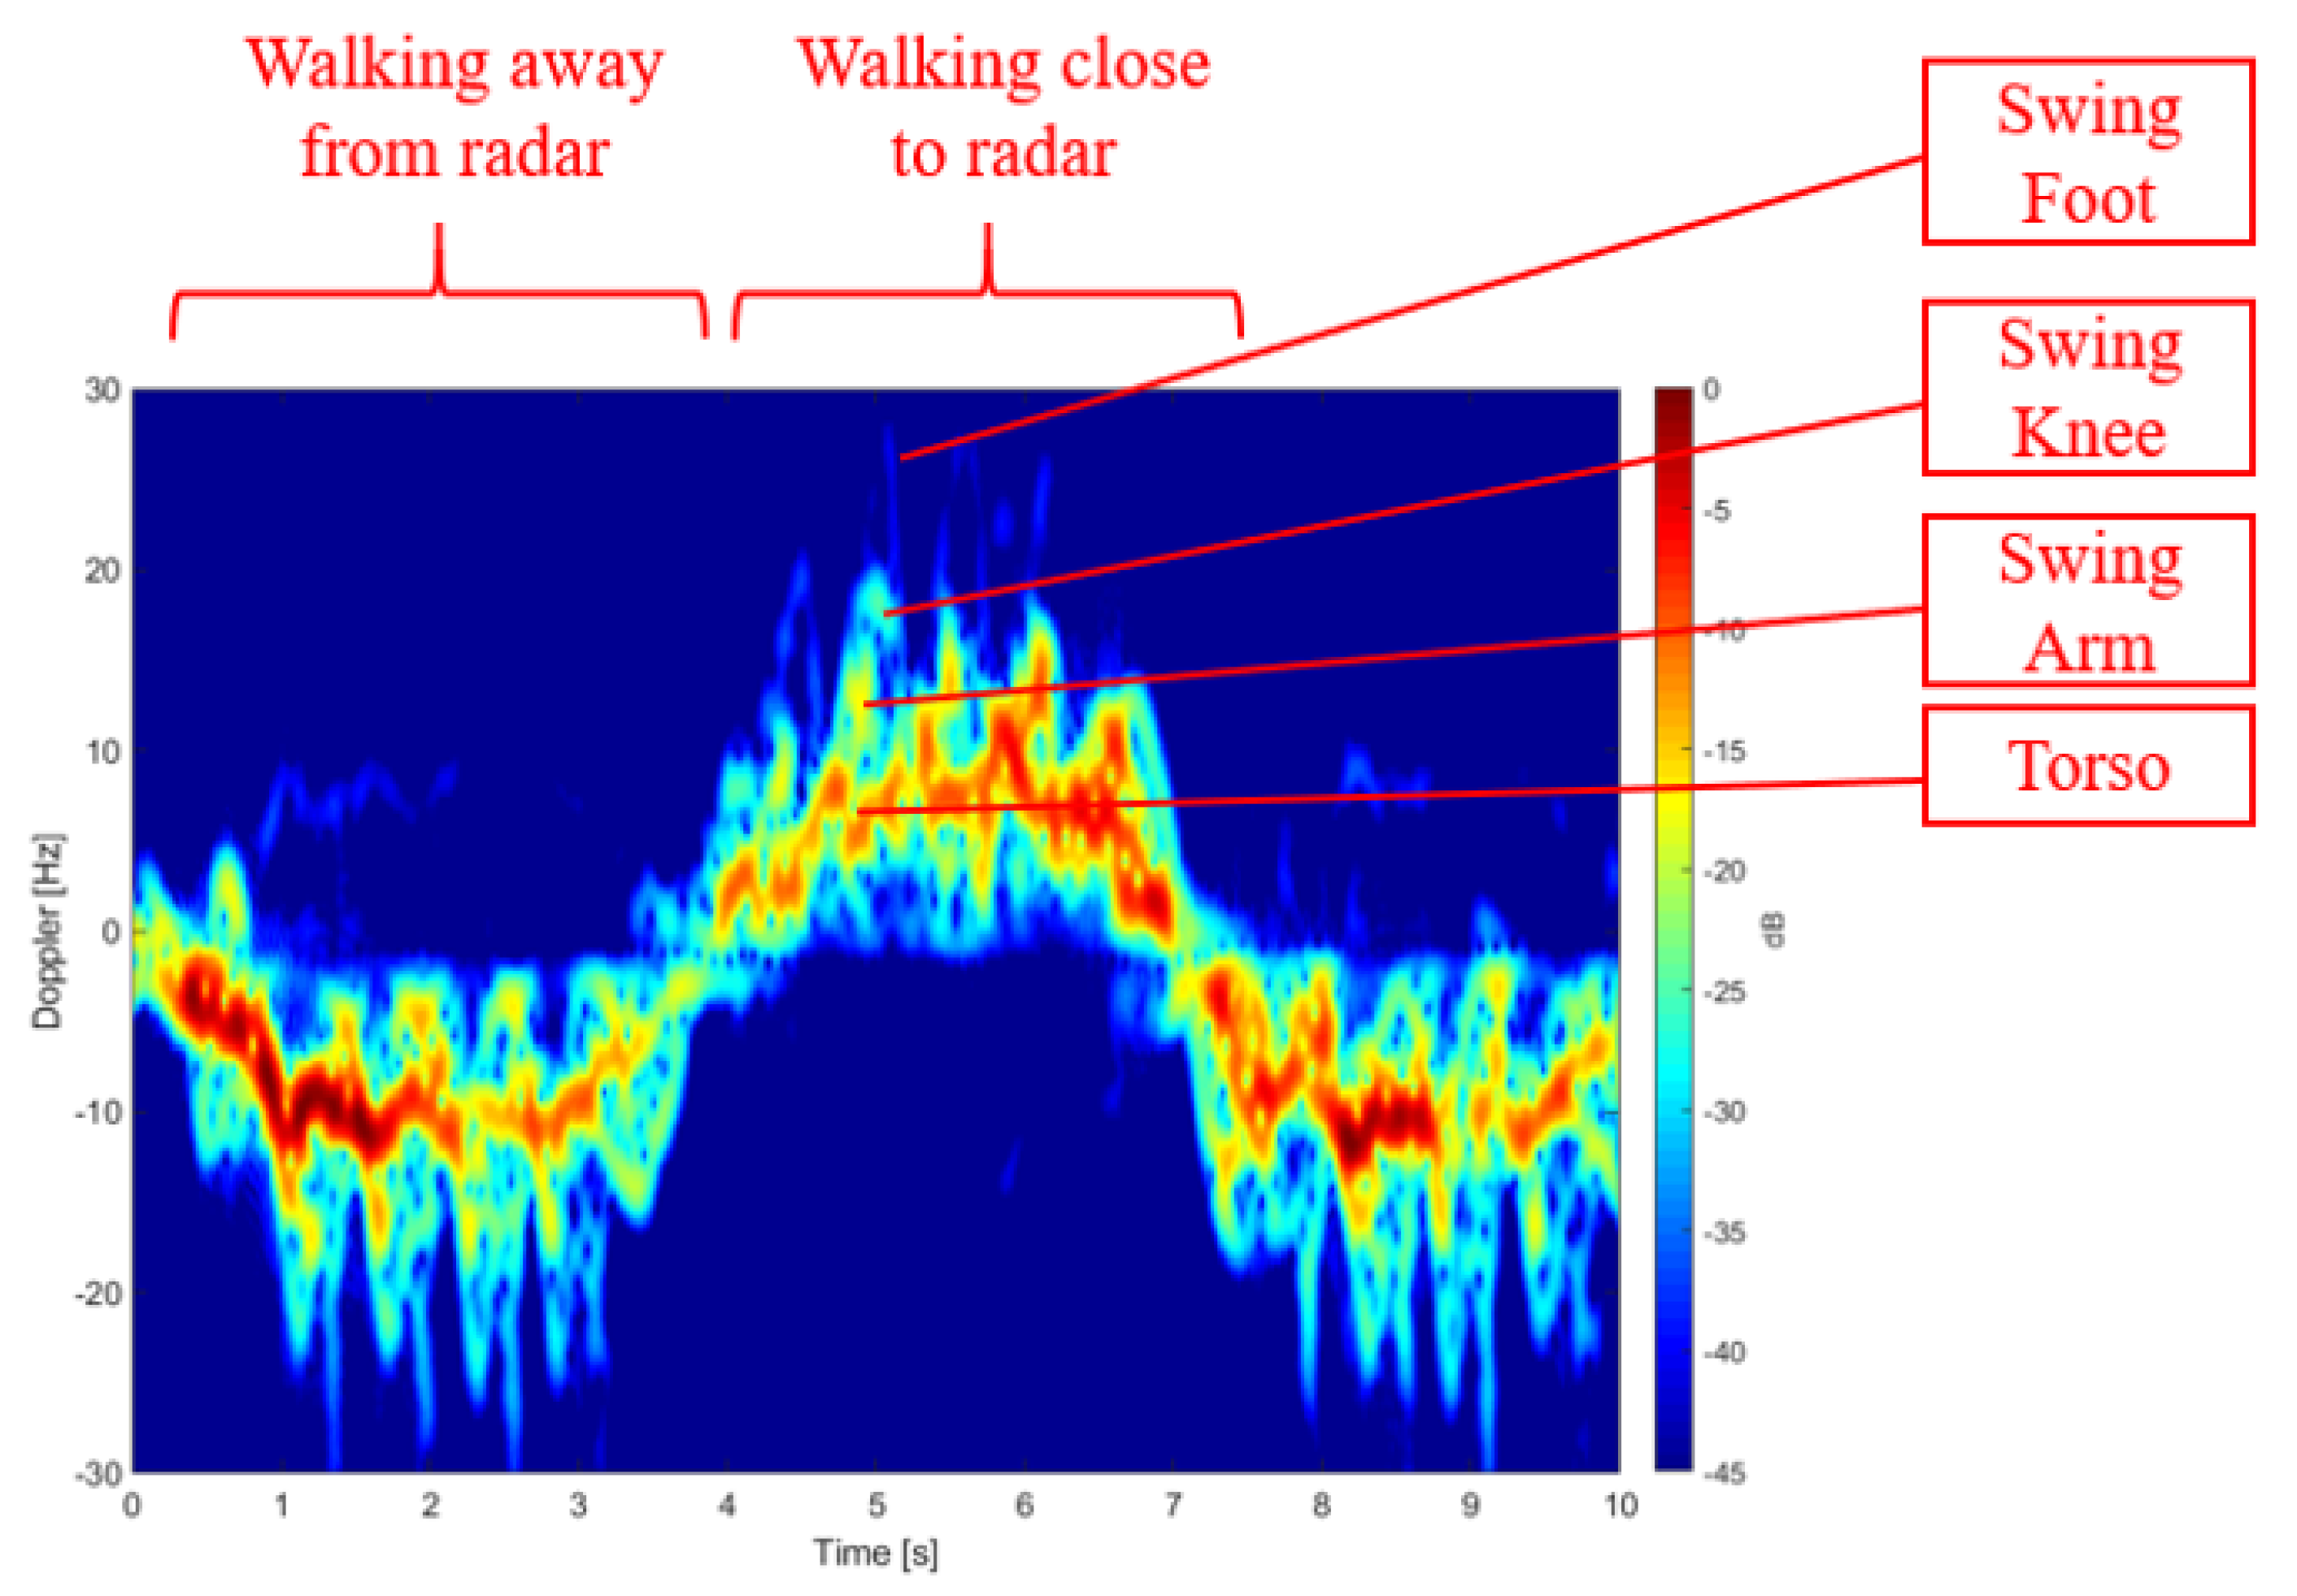
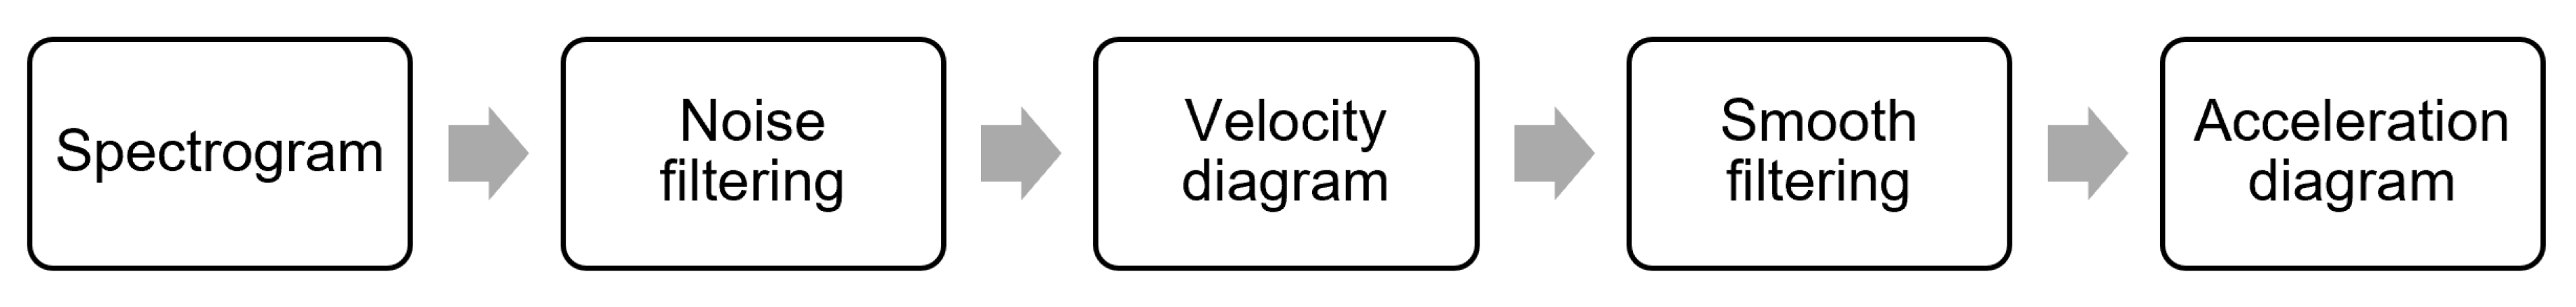
3.2. Walking Sample Processing and Gait Feature Extraction
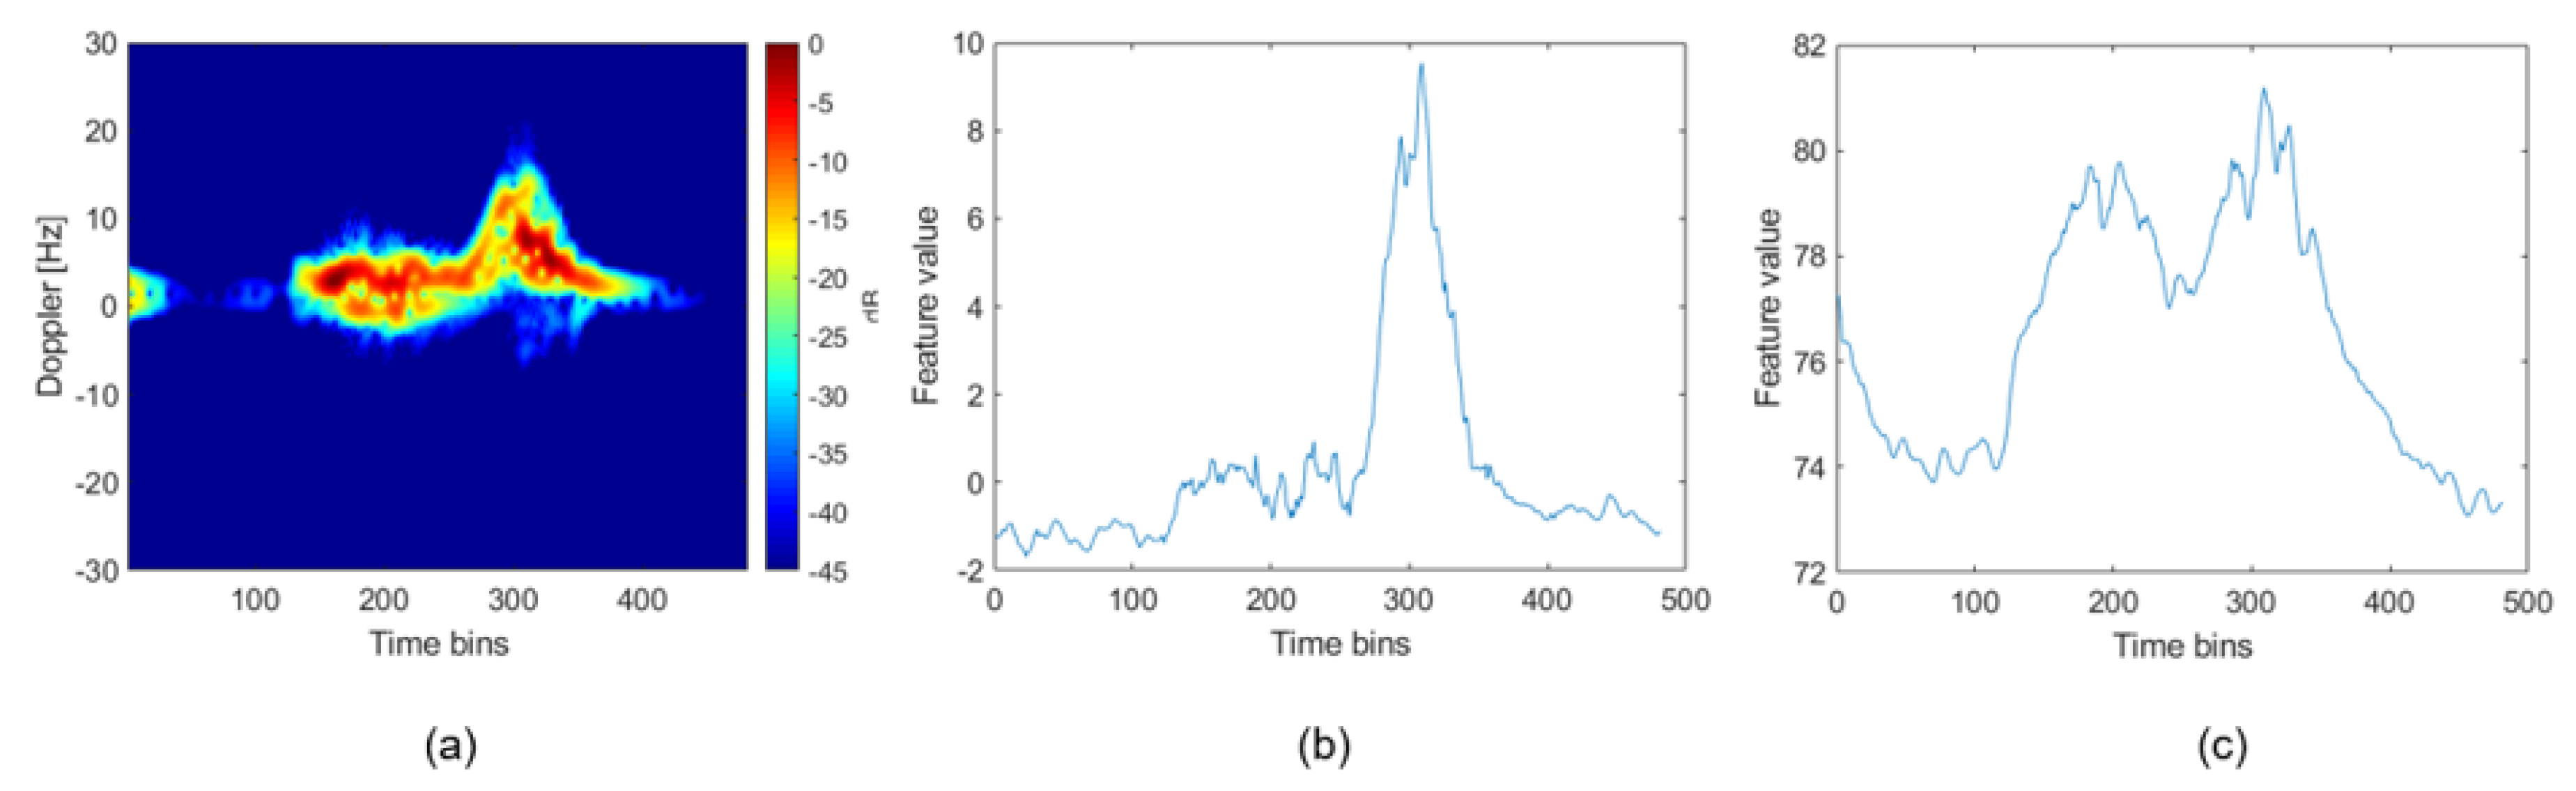
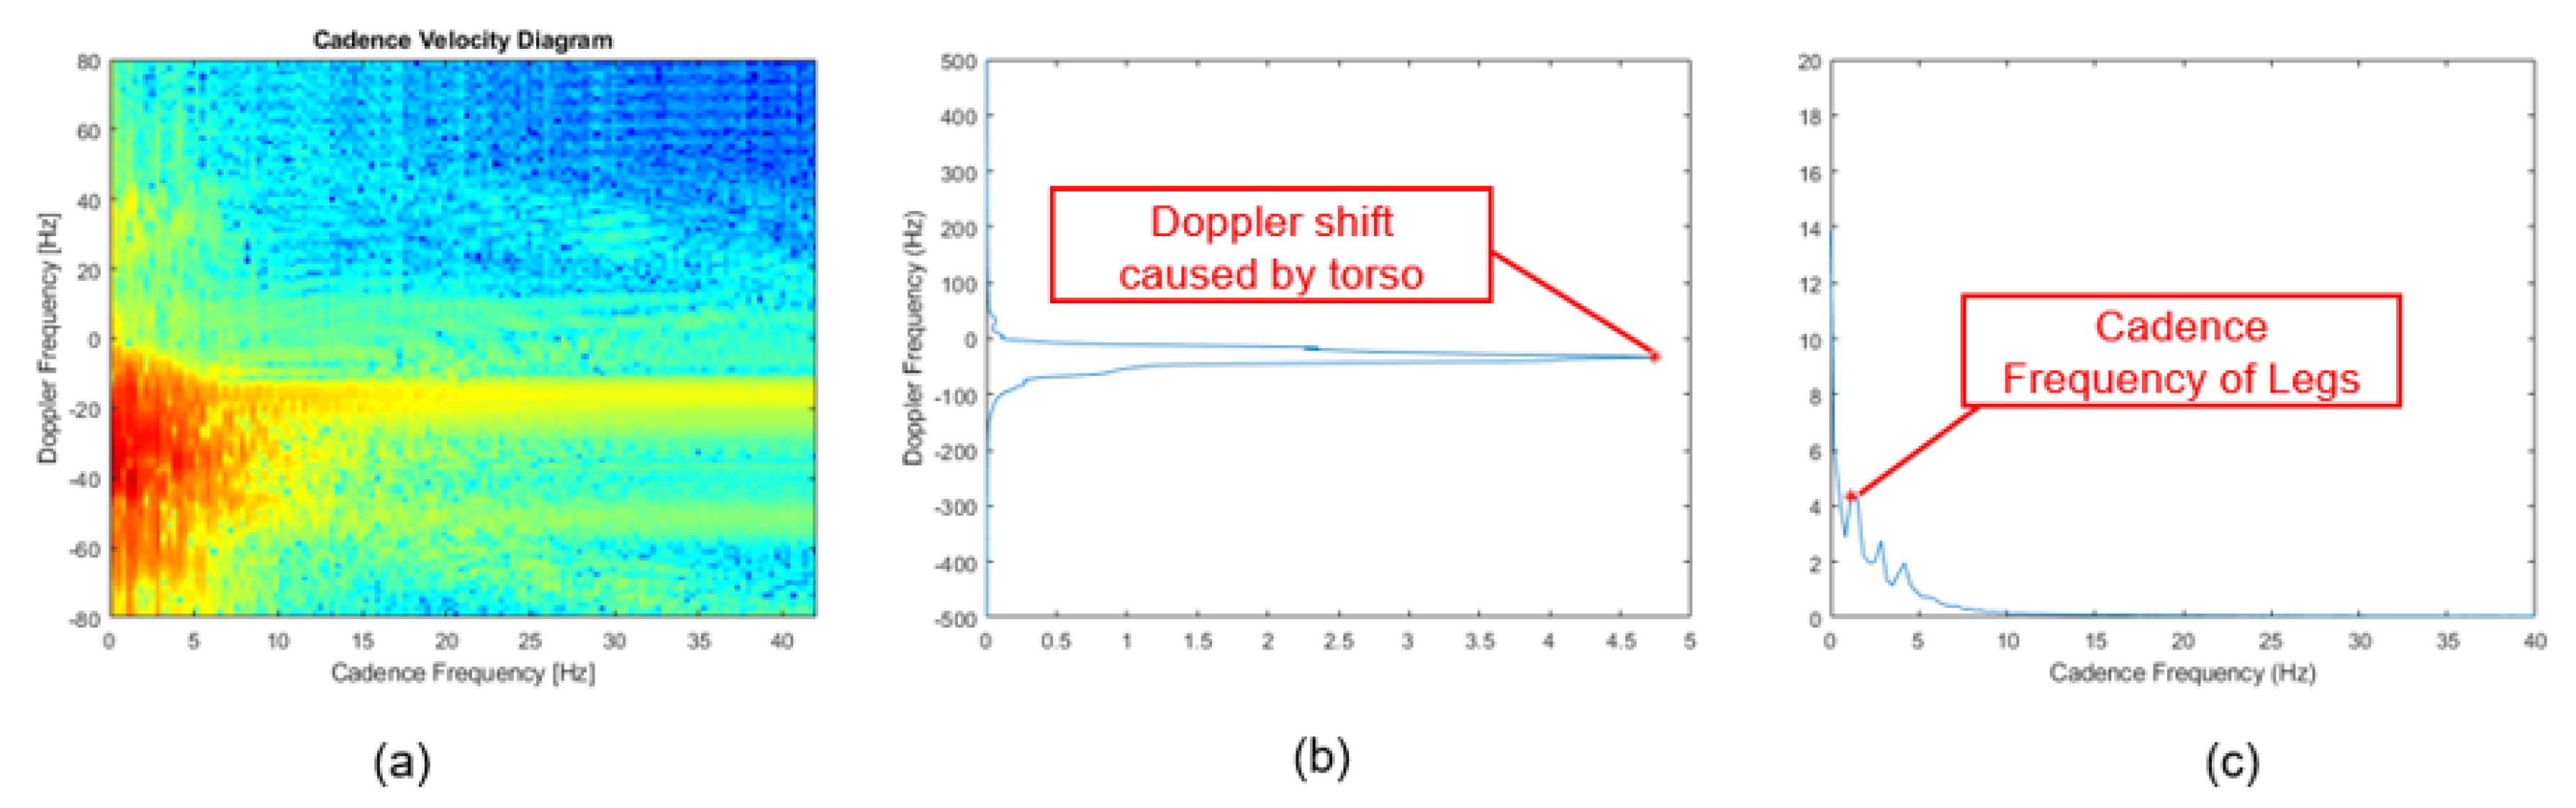
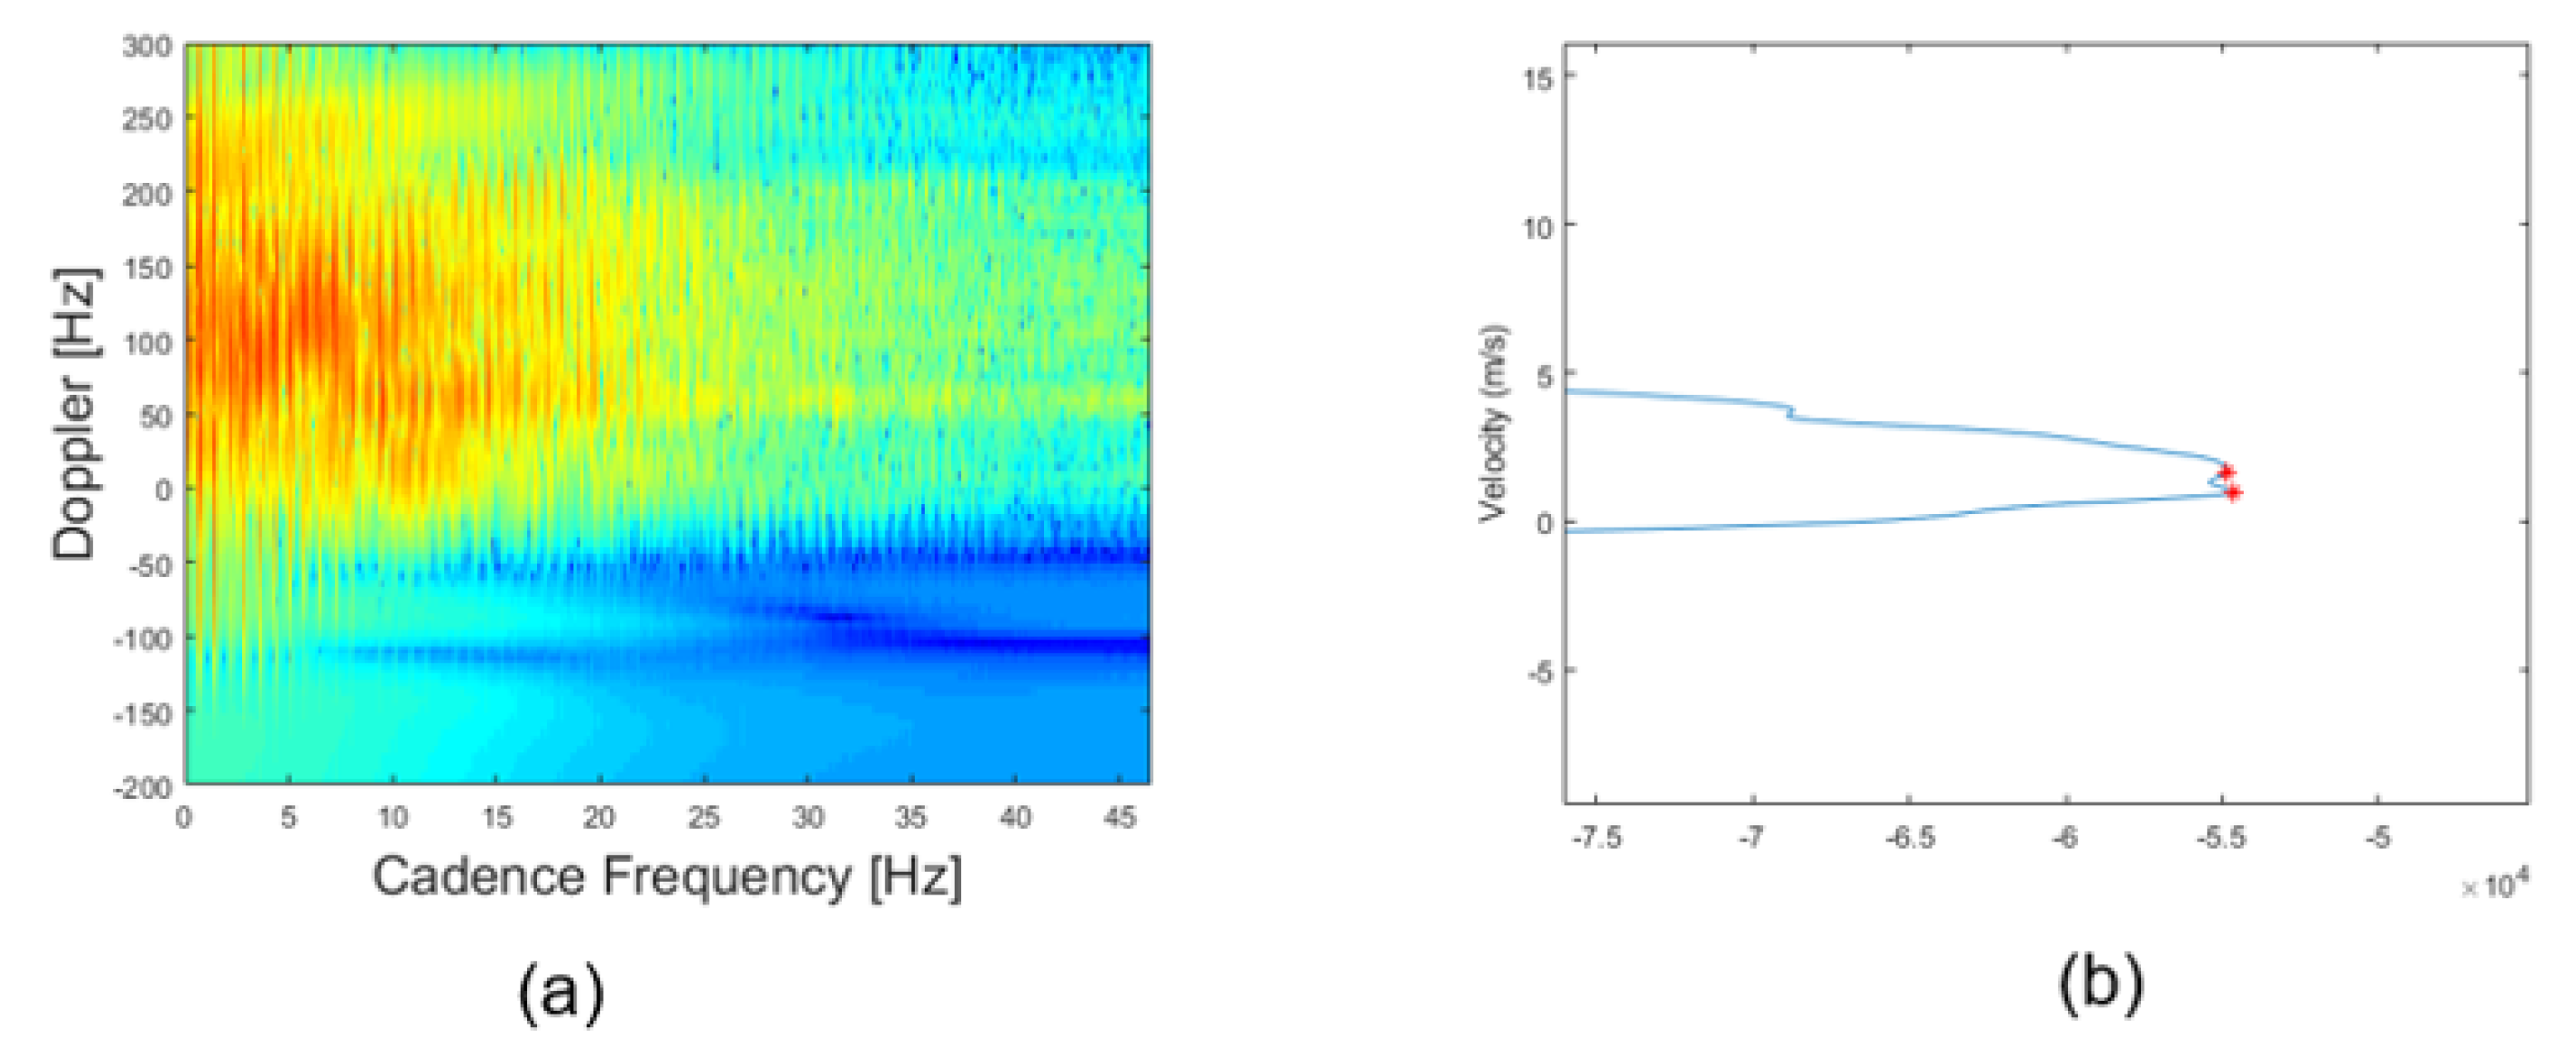
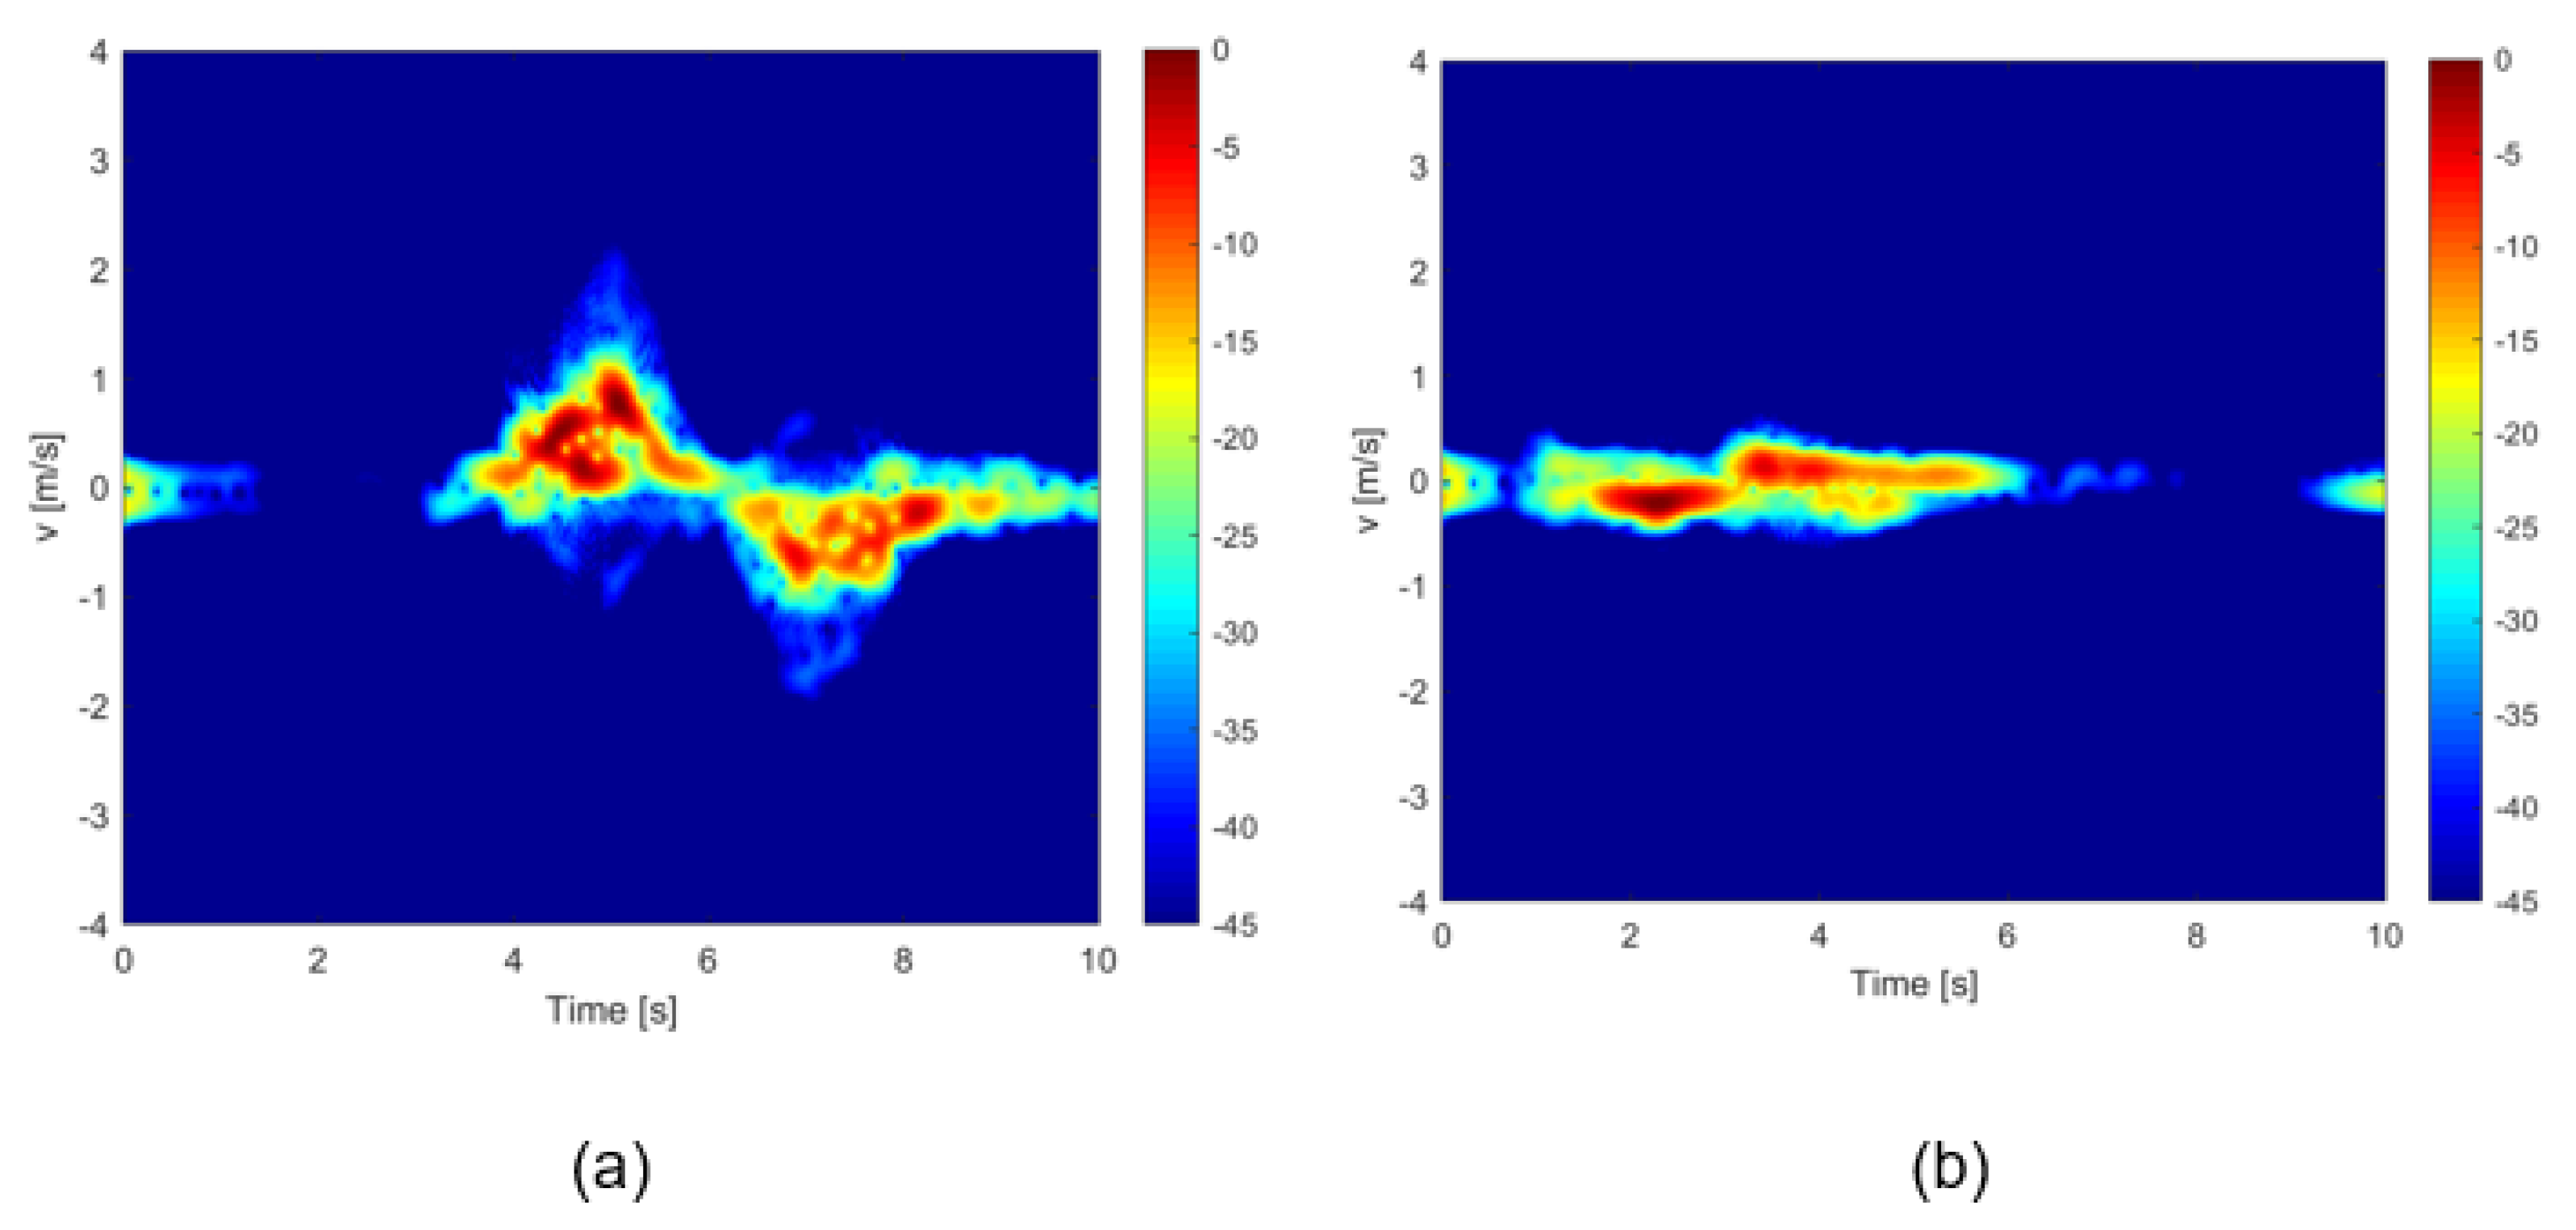
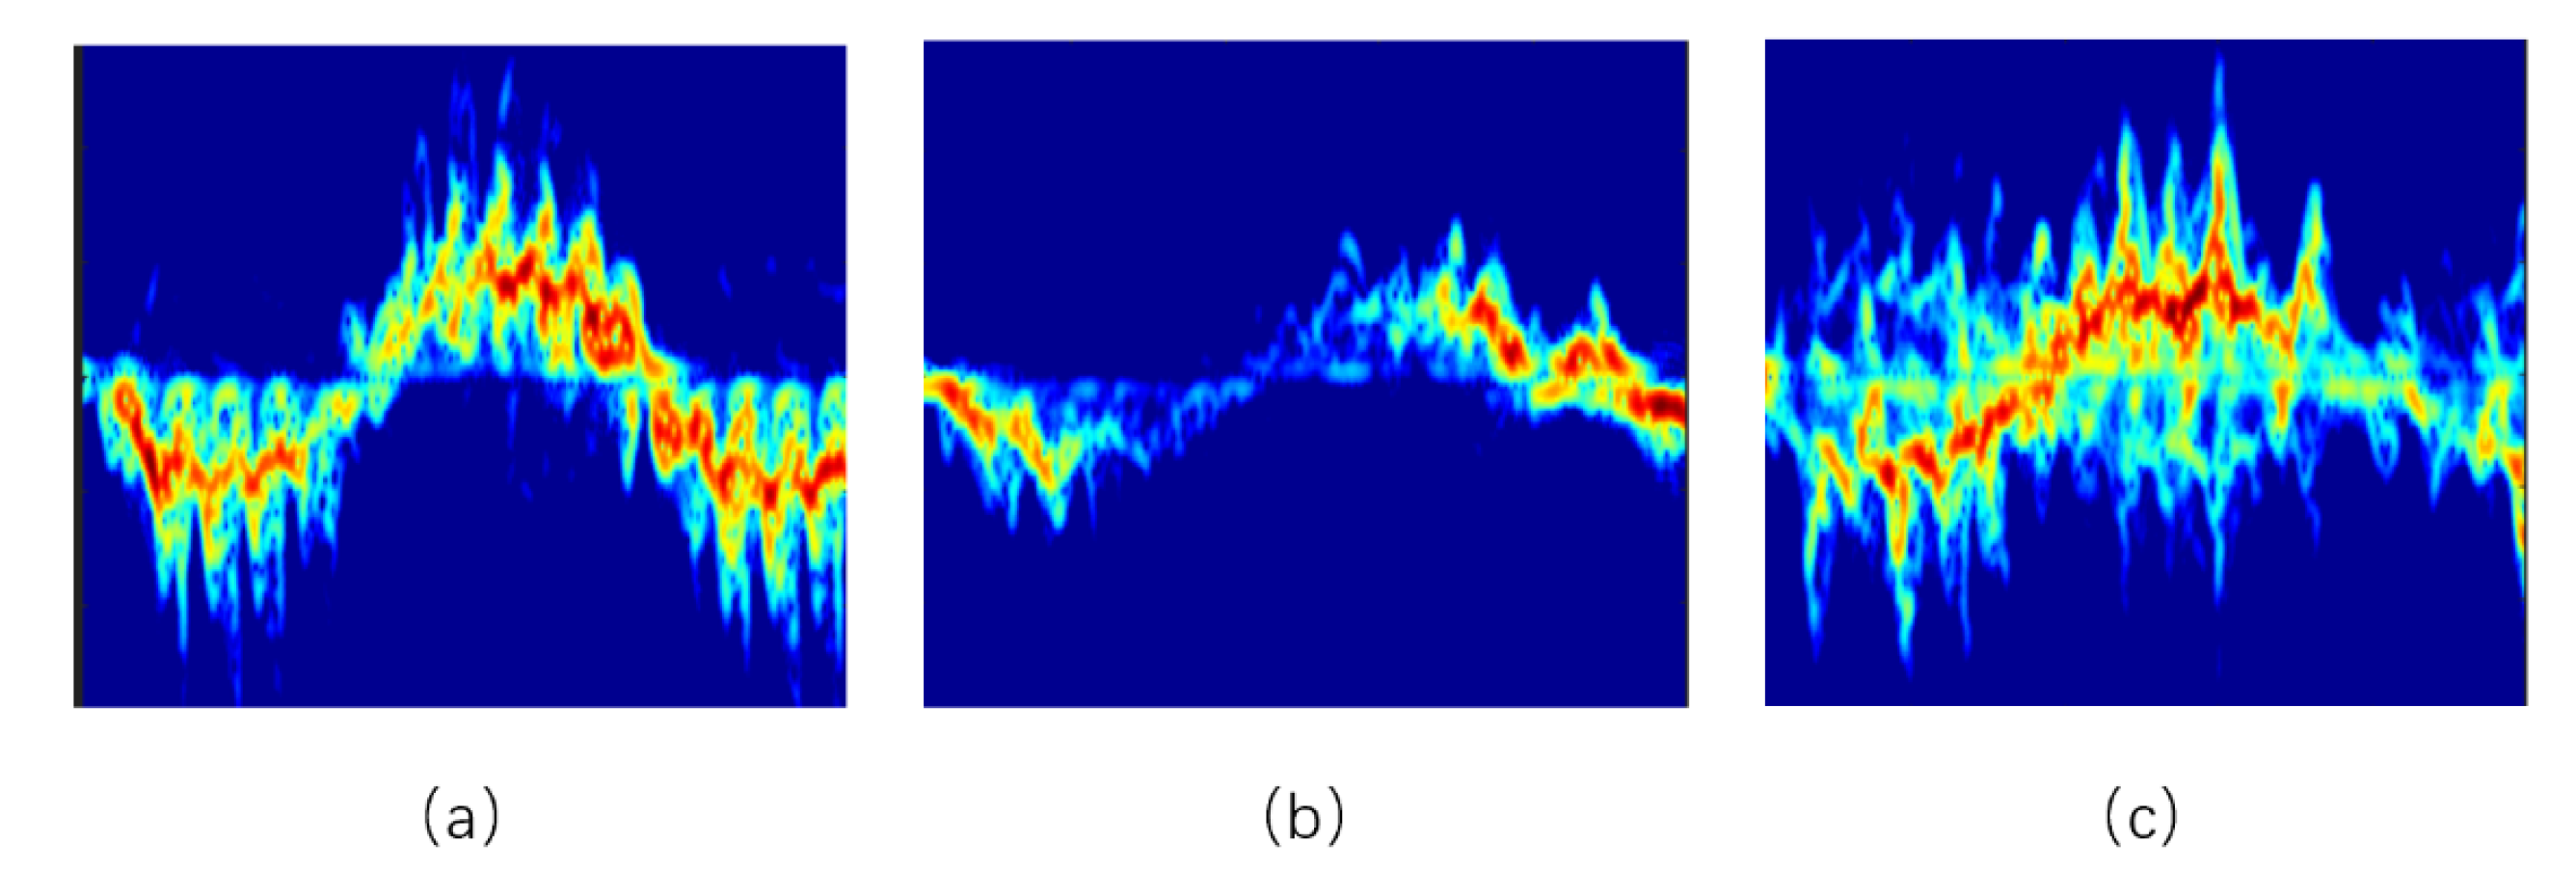
- CVD features: CVD is obtained by performing an FFT along the time axis for all Doppler bins in the micro-Doppler signatures (MDS) in the spectrograms. It can show periodic motions of limbs during walking within the MDS [27]. In this study, the FFT is applied to the extracted stable phase of walking instead of the entire length of the samples, for more accurate measurement and analysis by removing the interference of the acceleration phase and deceleration phases. Figure 8a is the CVD of the walking stable-phase of an example of walking data. Figure 8b,c give the sum of the CVD along the cadence frequency axis and Doppler frequency axis respectively where the Doppler shift and Cadence frequency of legs can be observed, and thus, the gait velocity, and the step repetition frequency can be measured.
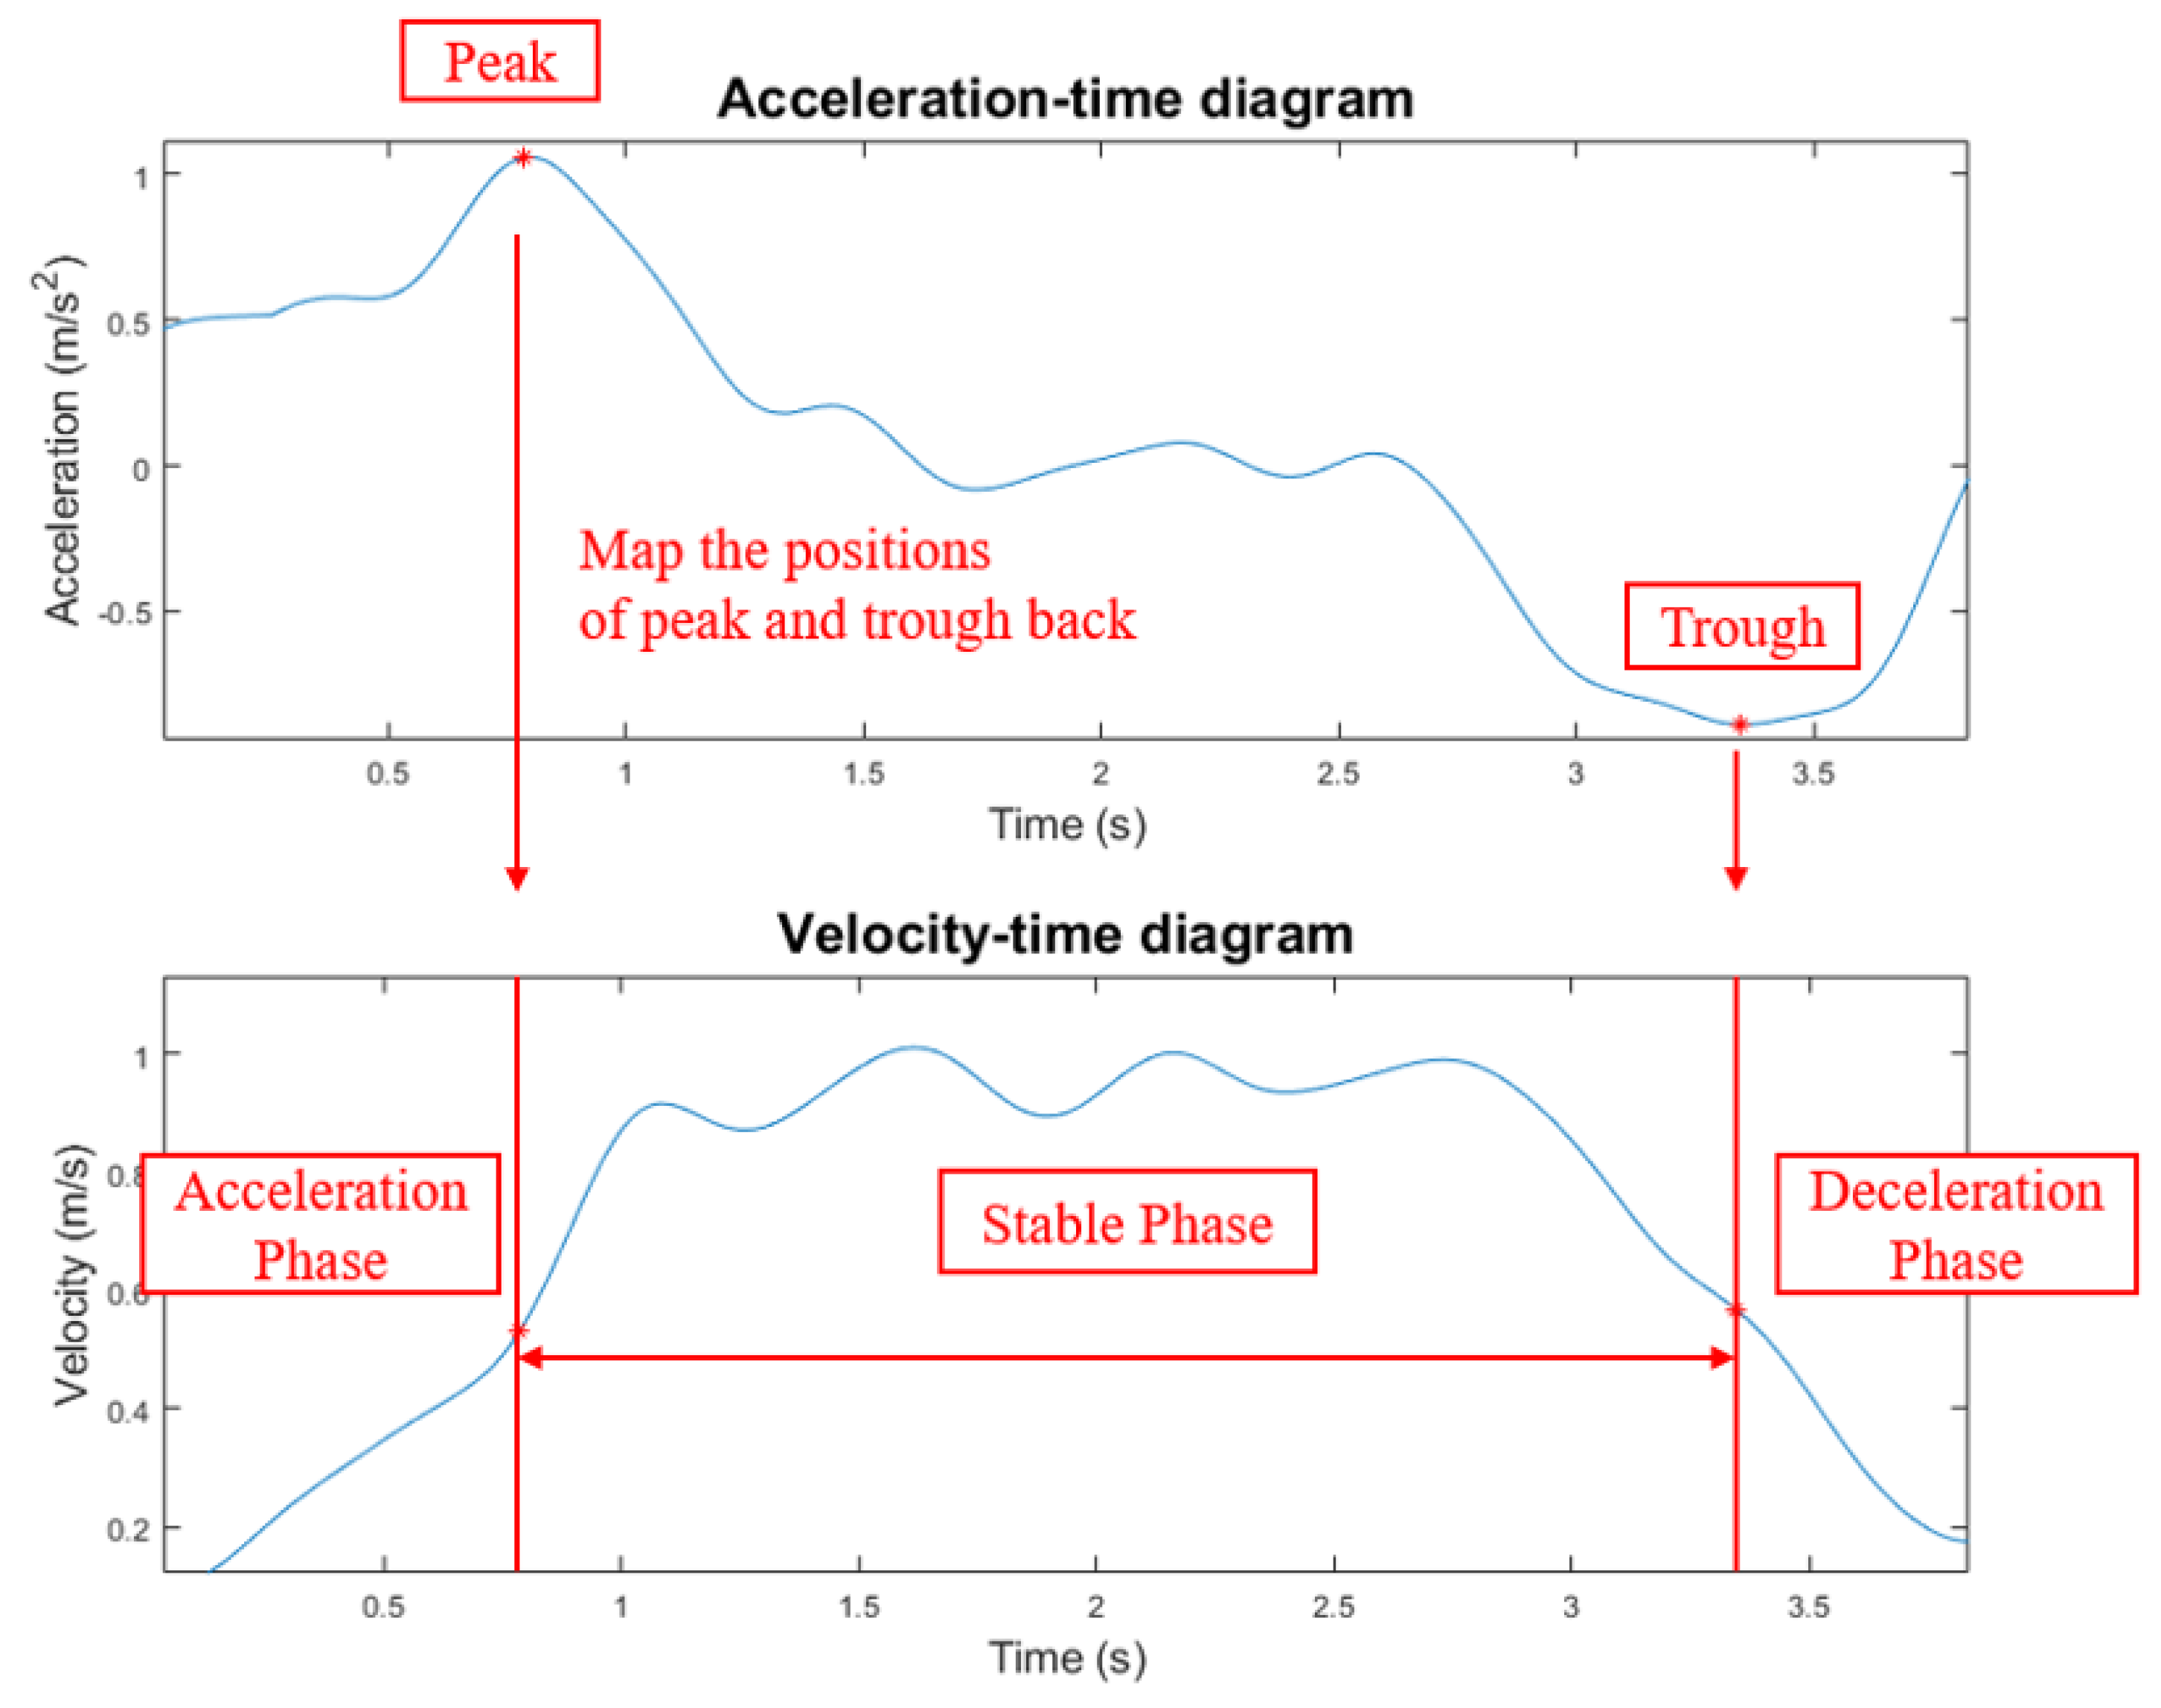
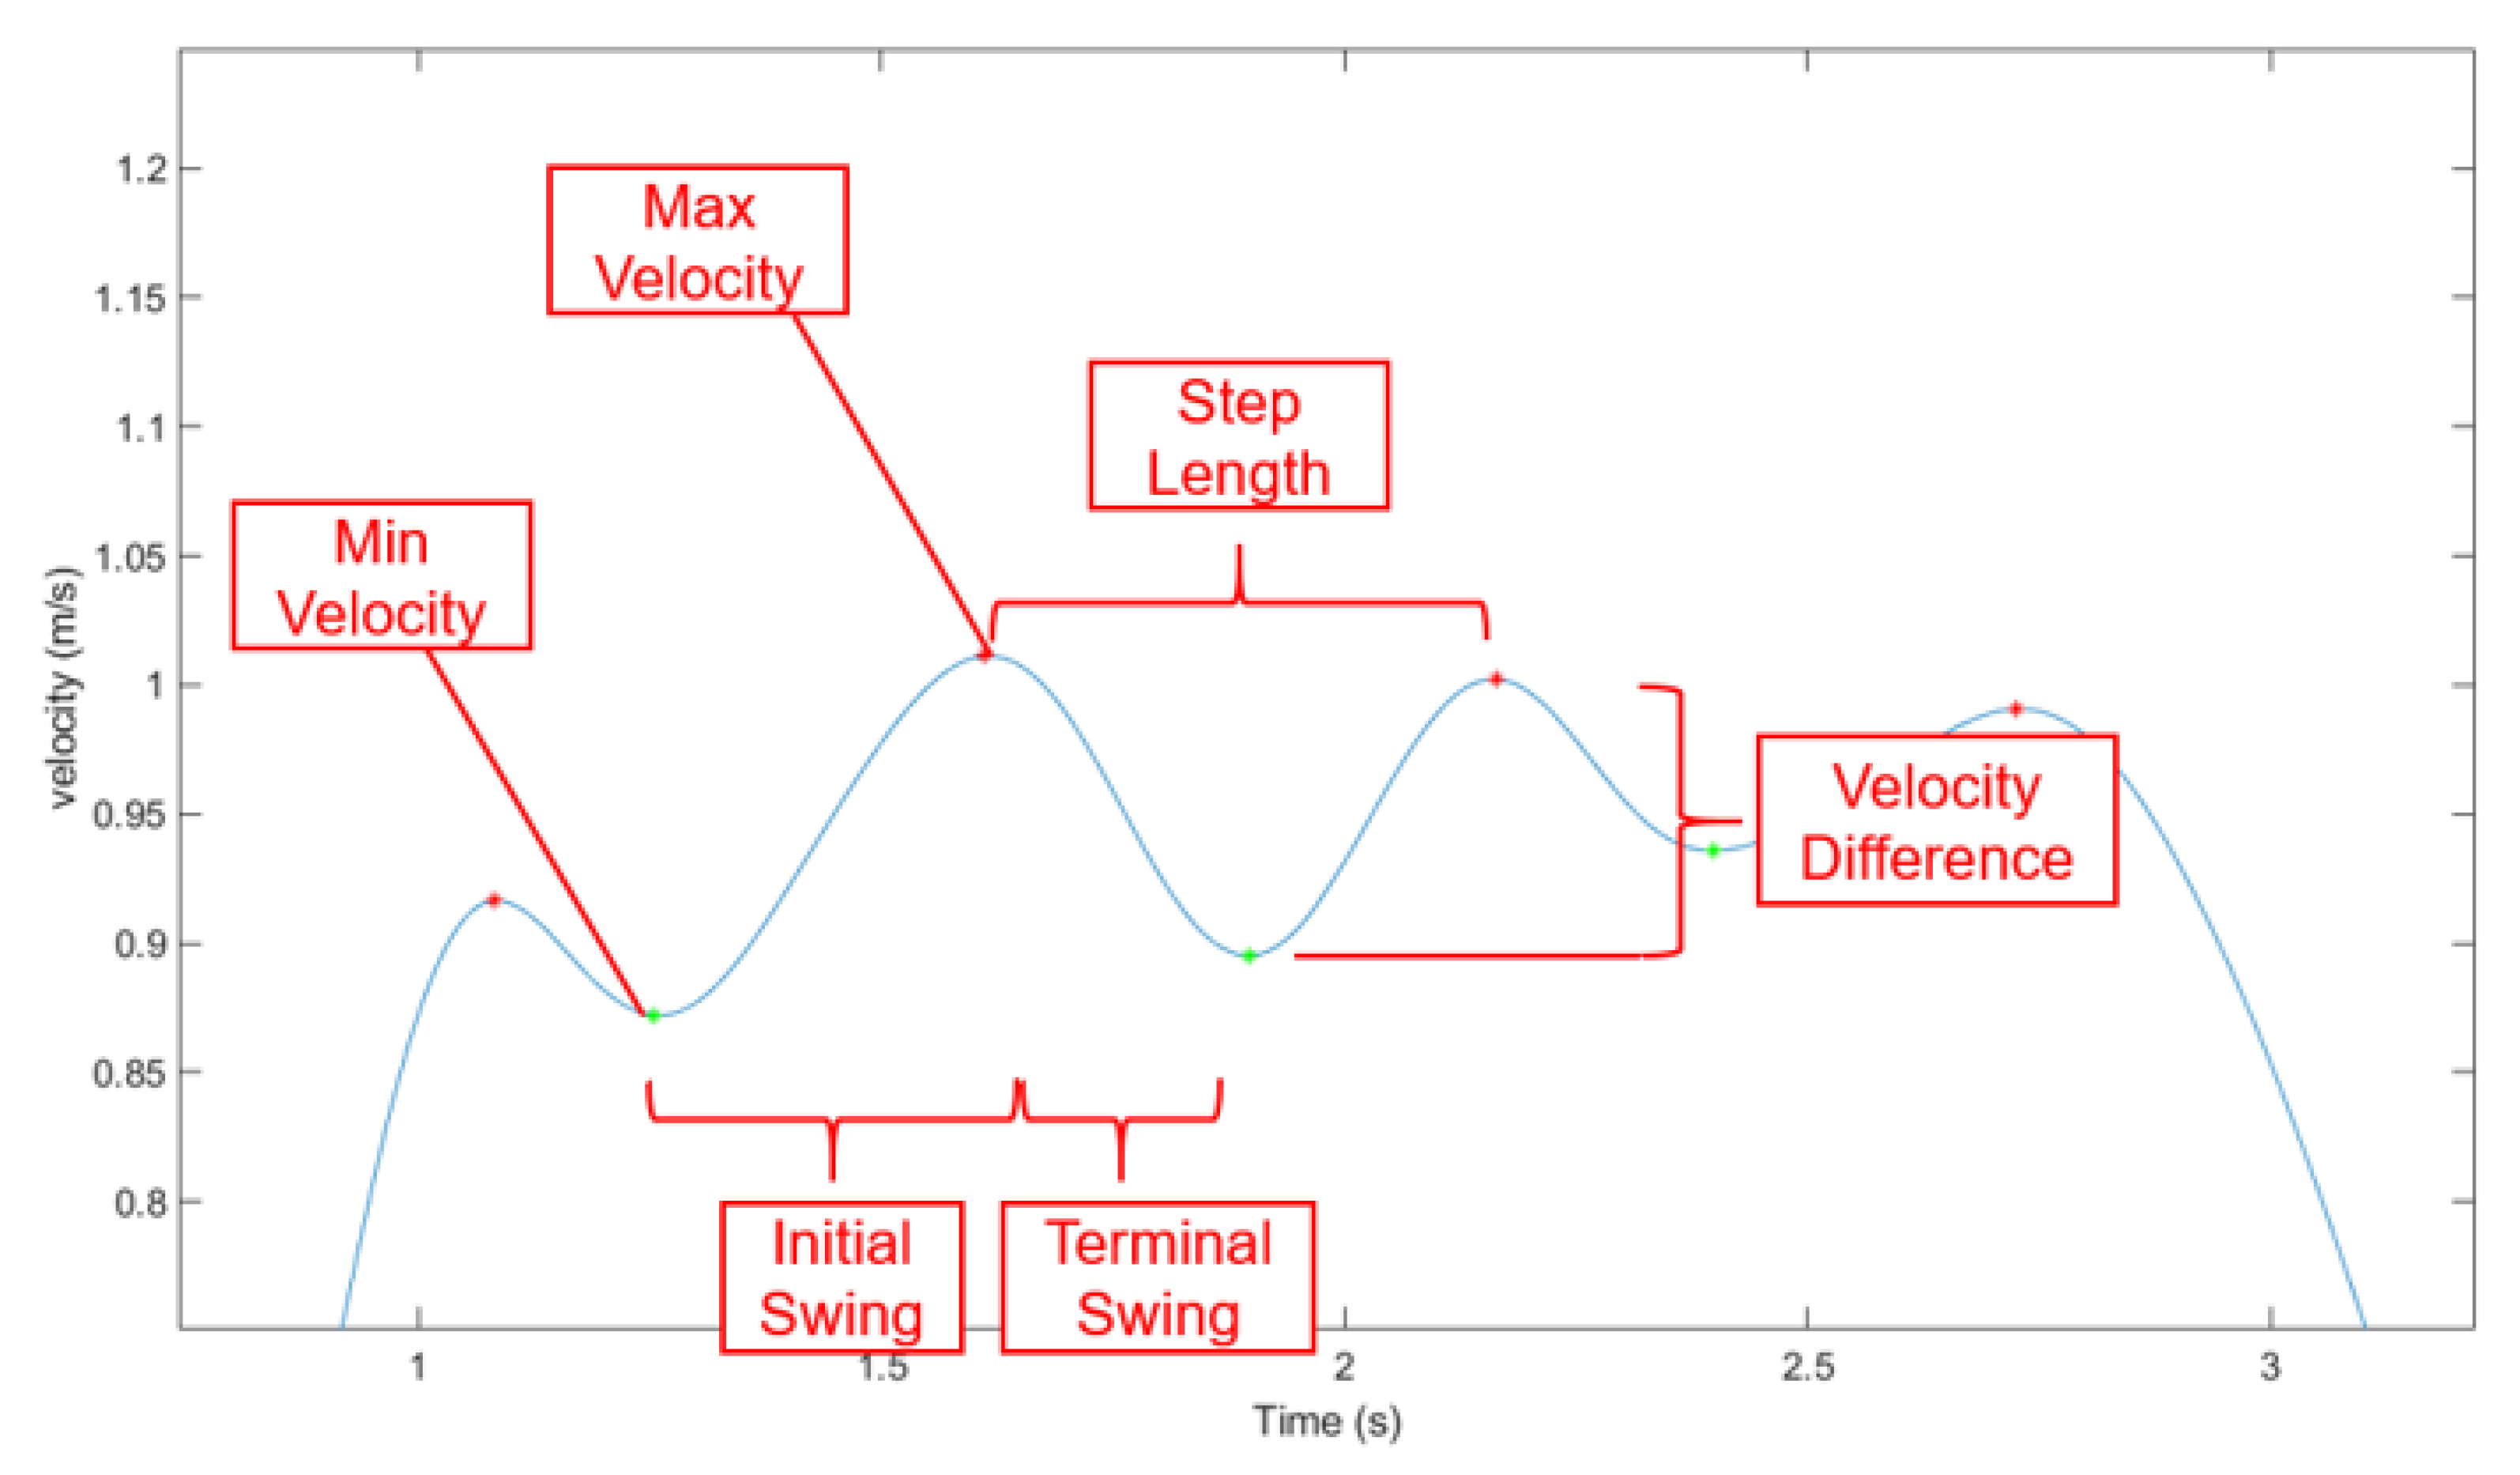
- Image-processing based velocity-time diagram features:The velocity-time graph (Figure 9) of walking can be obtained after the pre-processing and stable phase extraction. Features extracted from this data representation are listed in Table 2 where the left column lists the name of each feature and the right column lists how many corresponding features are extracted. The minimum, maximum, and average velocity can be measured directly from the curve with the corresponding velocity axis. In Figure 9, peaks are shown in red marks, and troughs are in green marks. Although the waveform is the track of the movement of the torso, the frequency component of the torso movement is synchronised with the swing frequency of the foot and has the same period. Therefore, the interval every two peaks or two troughs can be associated with a step [26], and the adjacent peak and through can present the initial swing or terminal swing of a step. Knowing the resolution of the time axis, the step length l can be calculated by integrating the multiplication of instantaneous velocity and time t given in Equation (7).The time for a half swing, as well as the velocity difference of a half swing, is also considered for potential features. Additionally, a binary feature R is calculated using Equation (8):R is the ratio between two areas where denotes the whole surface area of the stable phase walking spectrogram (Figure 10a) and denotes the area of the white pattern in binary figure (Figure 10b) converted from the spectrogram (a) using a threshold value which is determined by average pixel values of all the walking spectrograms in the dataset. In this way, a walking pattern with more intense energy and faster velocity will generate a widerspread binary pattern, and the ratio can thus indicate the intensity and the shape of the walking activity in the stable phase.
4. Results and Discussion
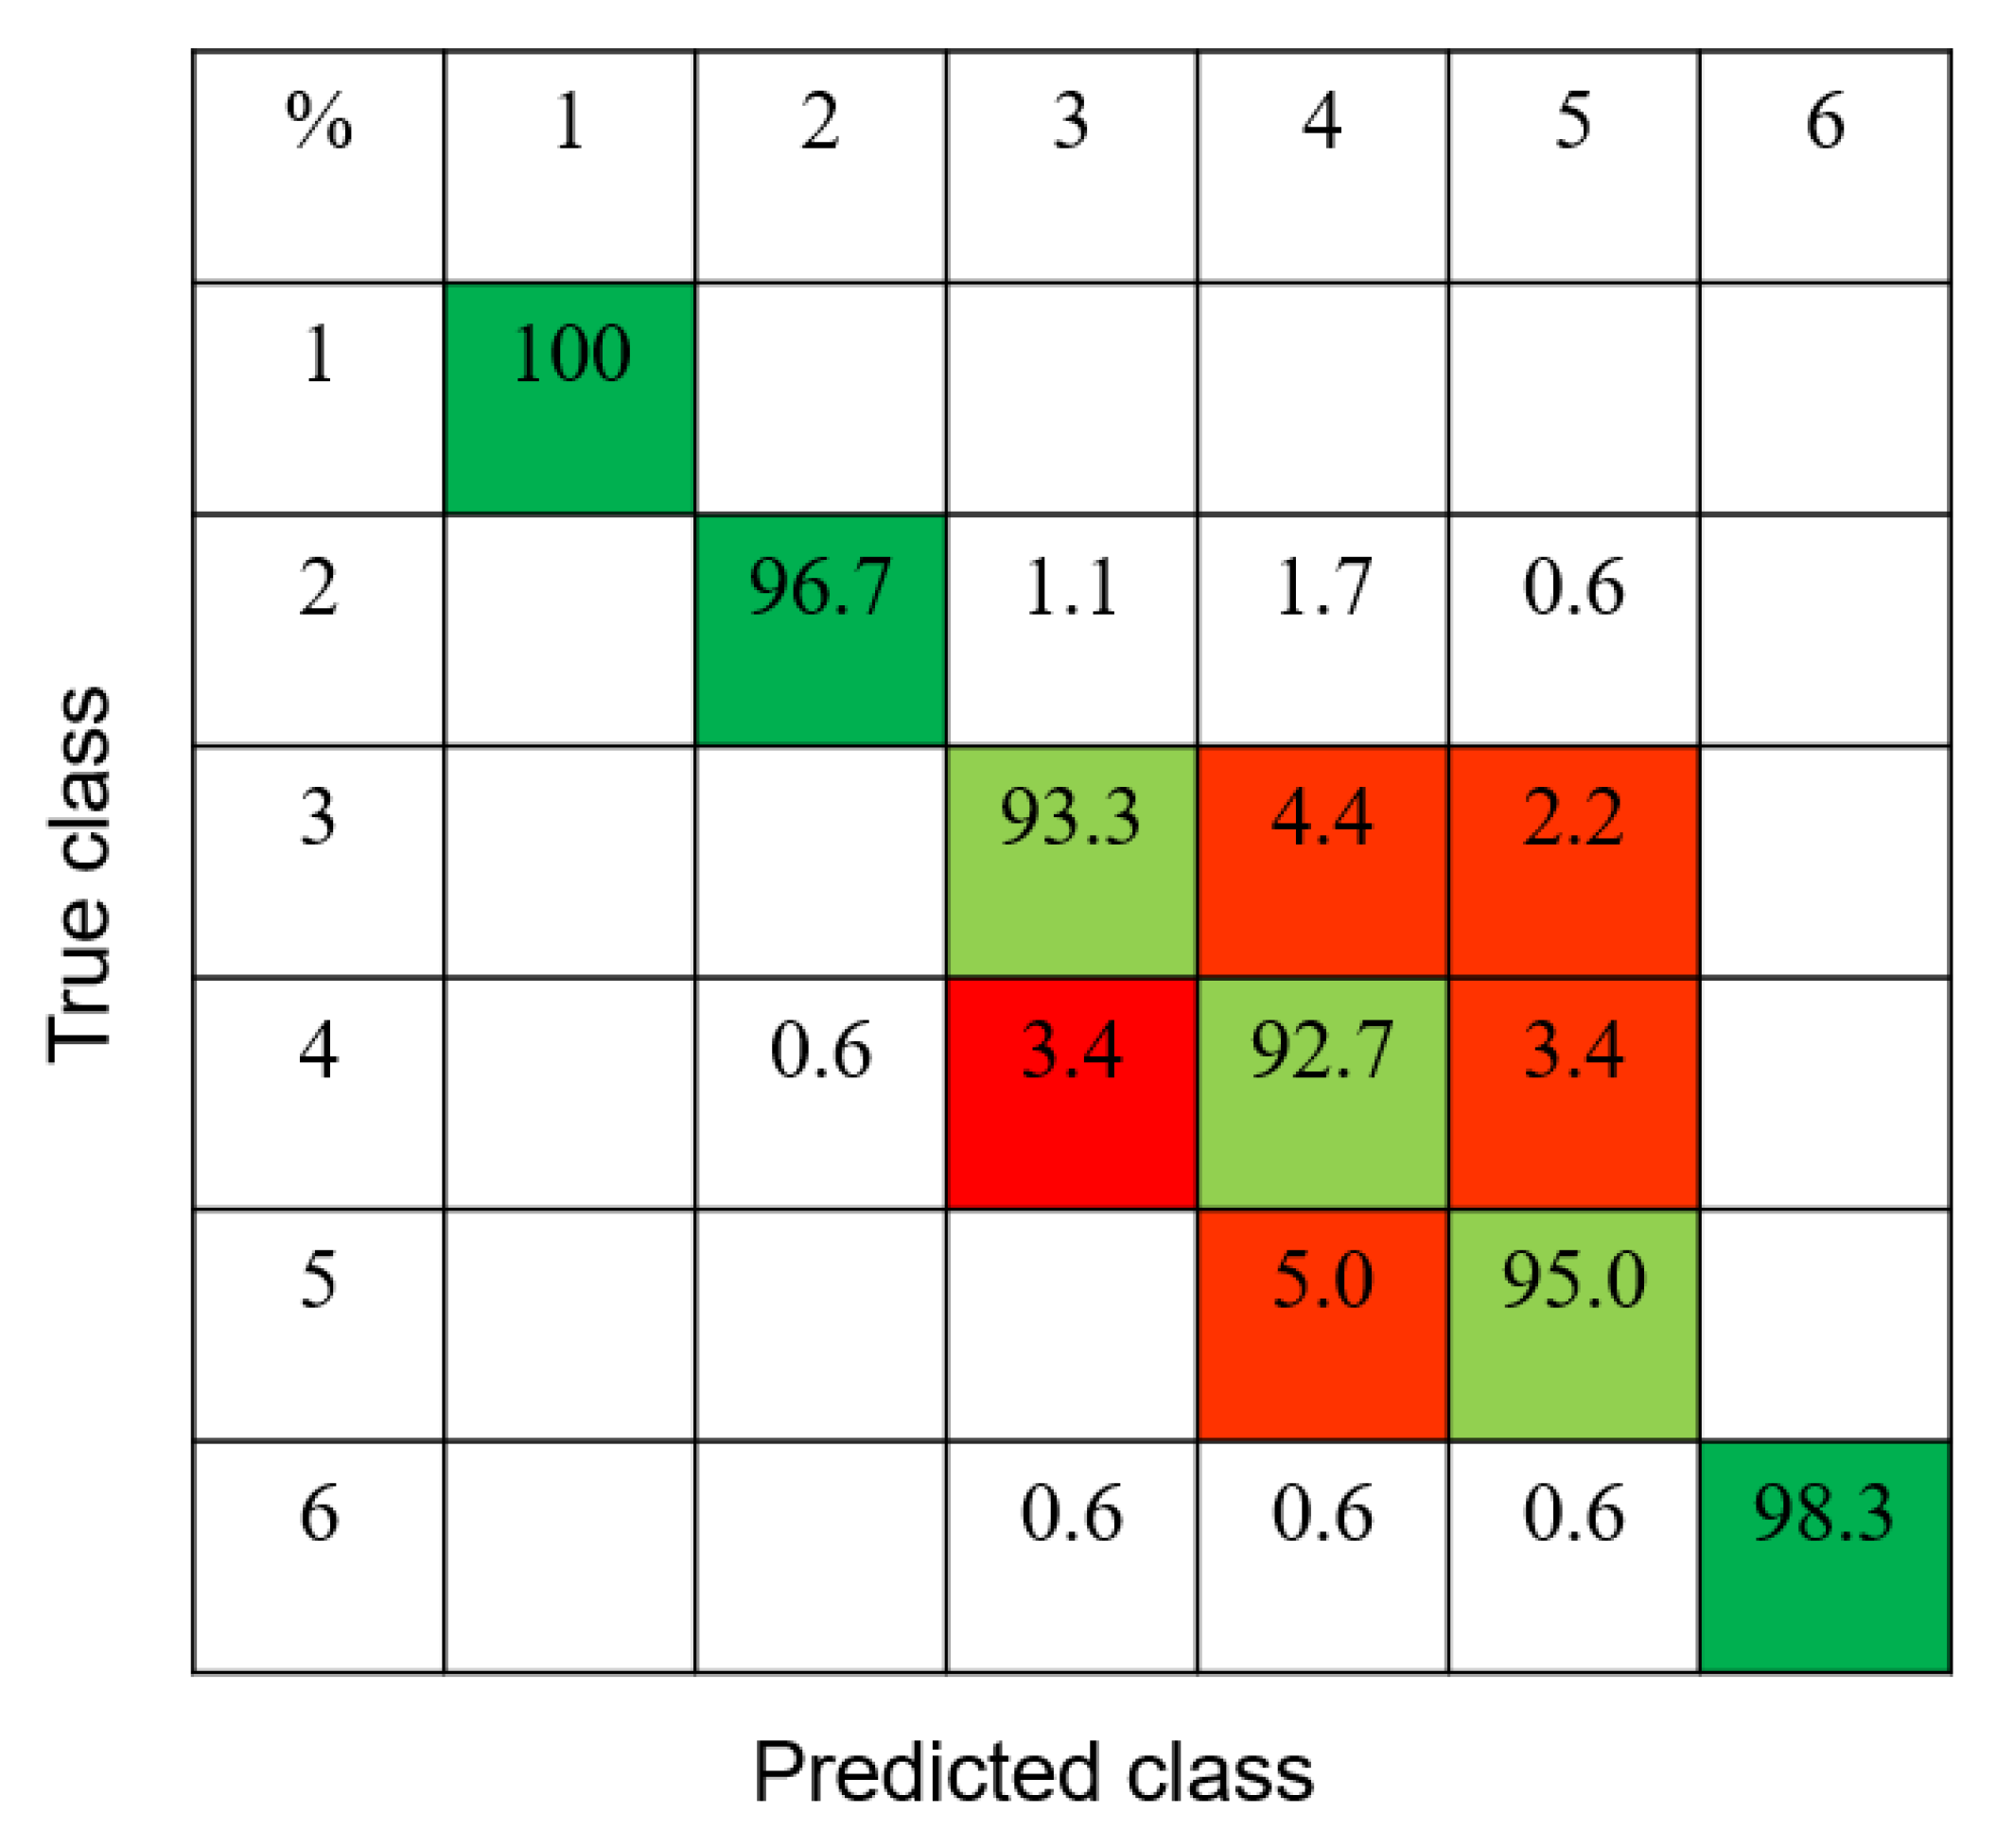
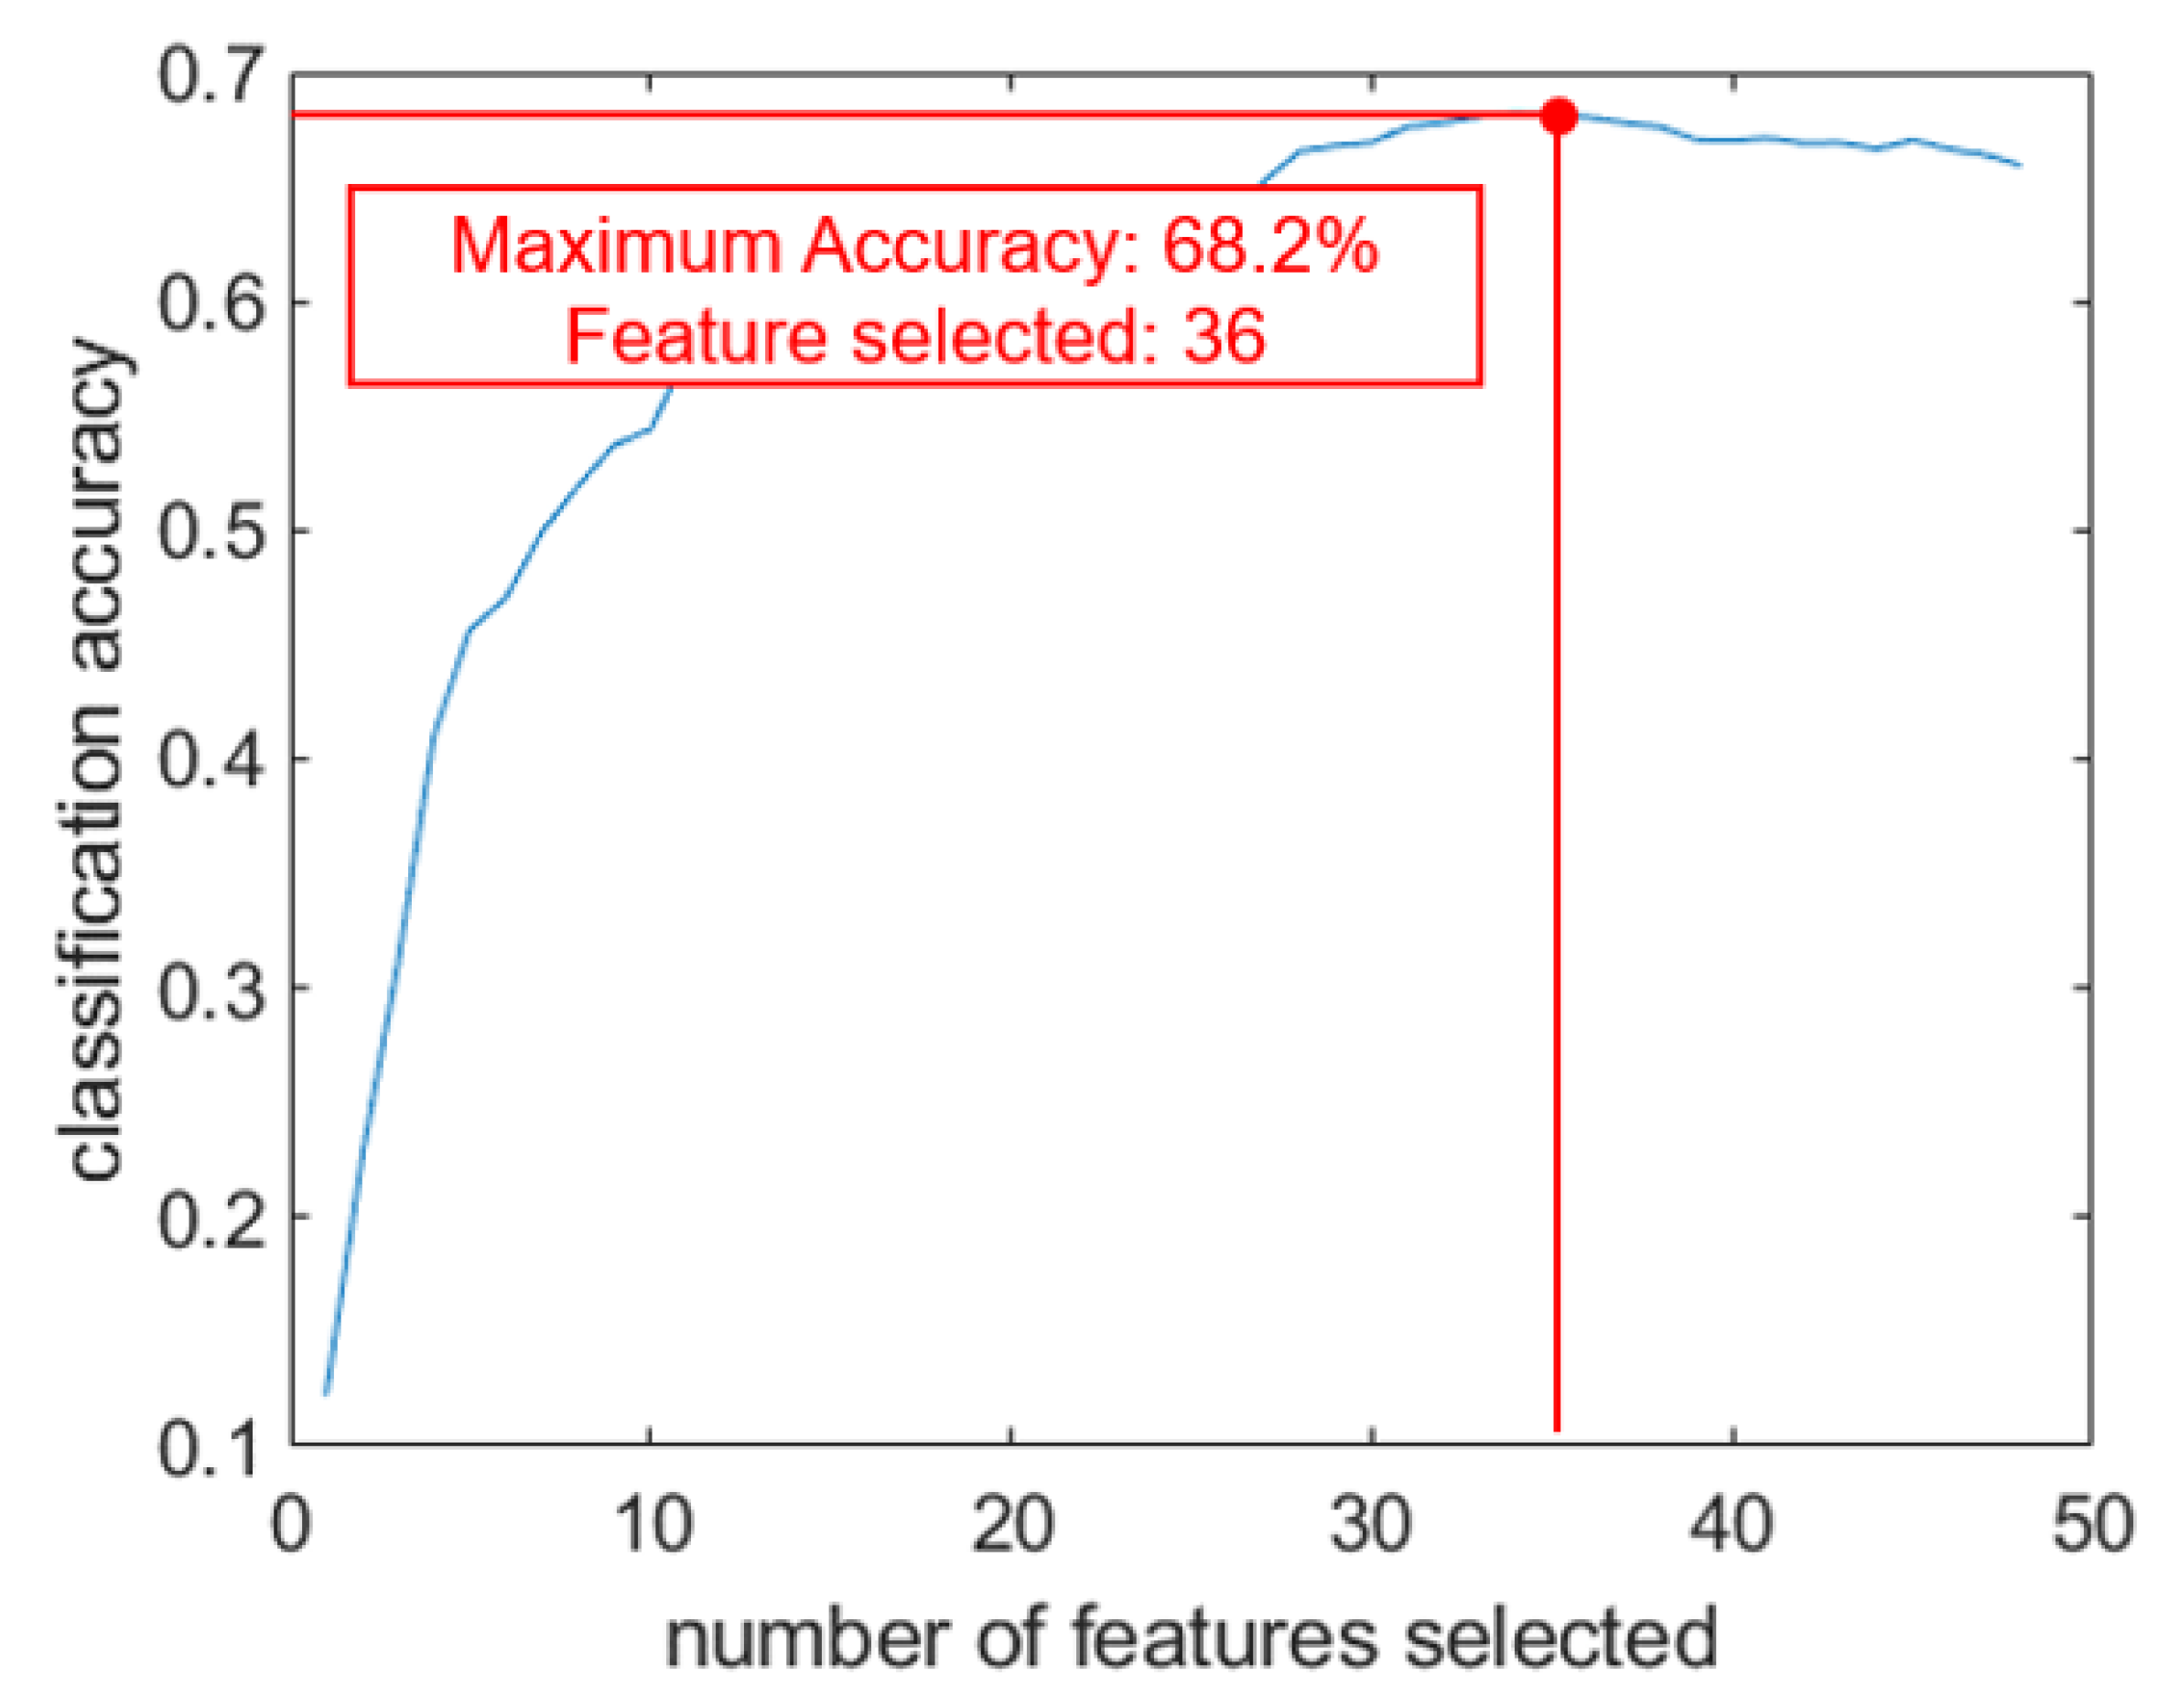
4.1. Human Activity Classification
- Filter methods, which look into the intrinsic properties of the features regardless of the training model used.
- Wrapper methods, which iterate the subsets of original features and compare their prediction errors.
- Embedded methods, which generates scores of features during the model learning process.
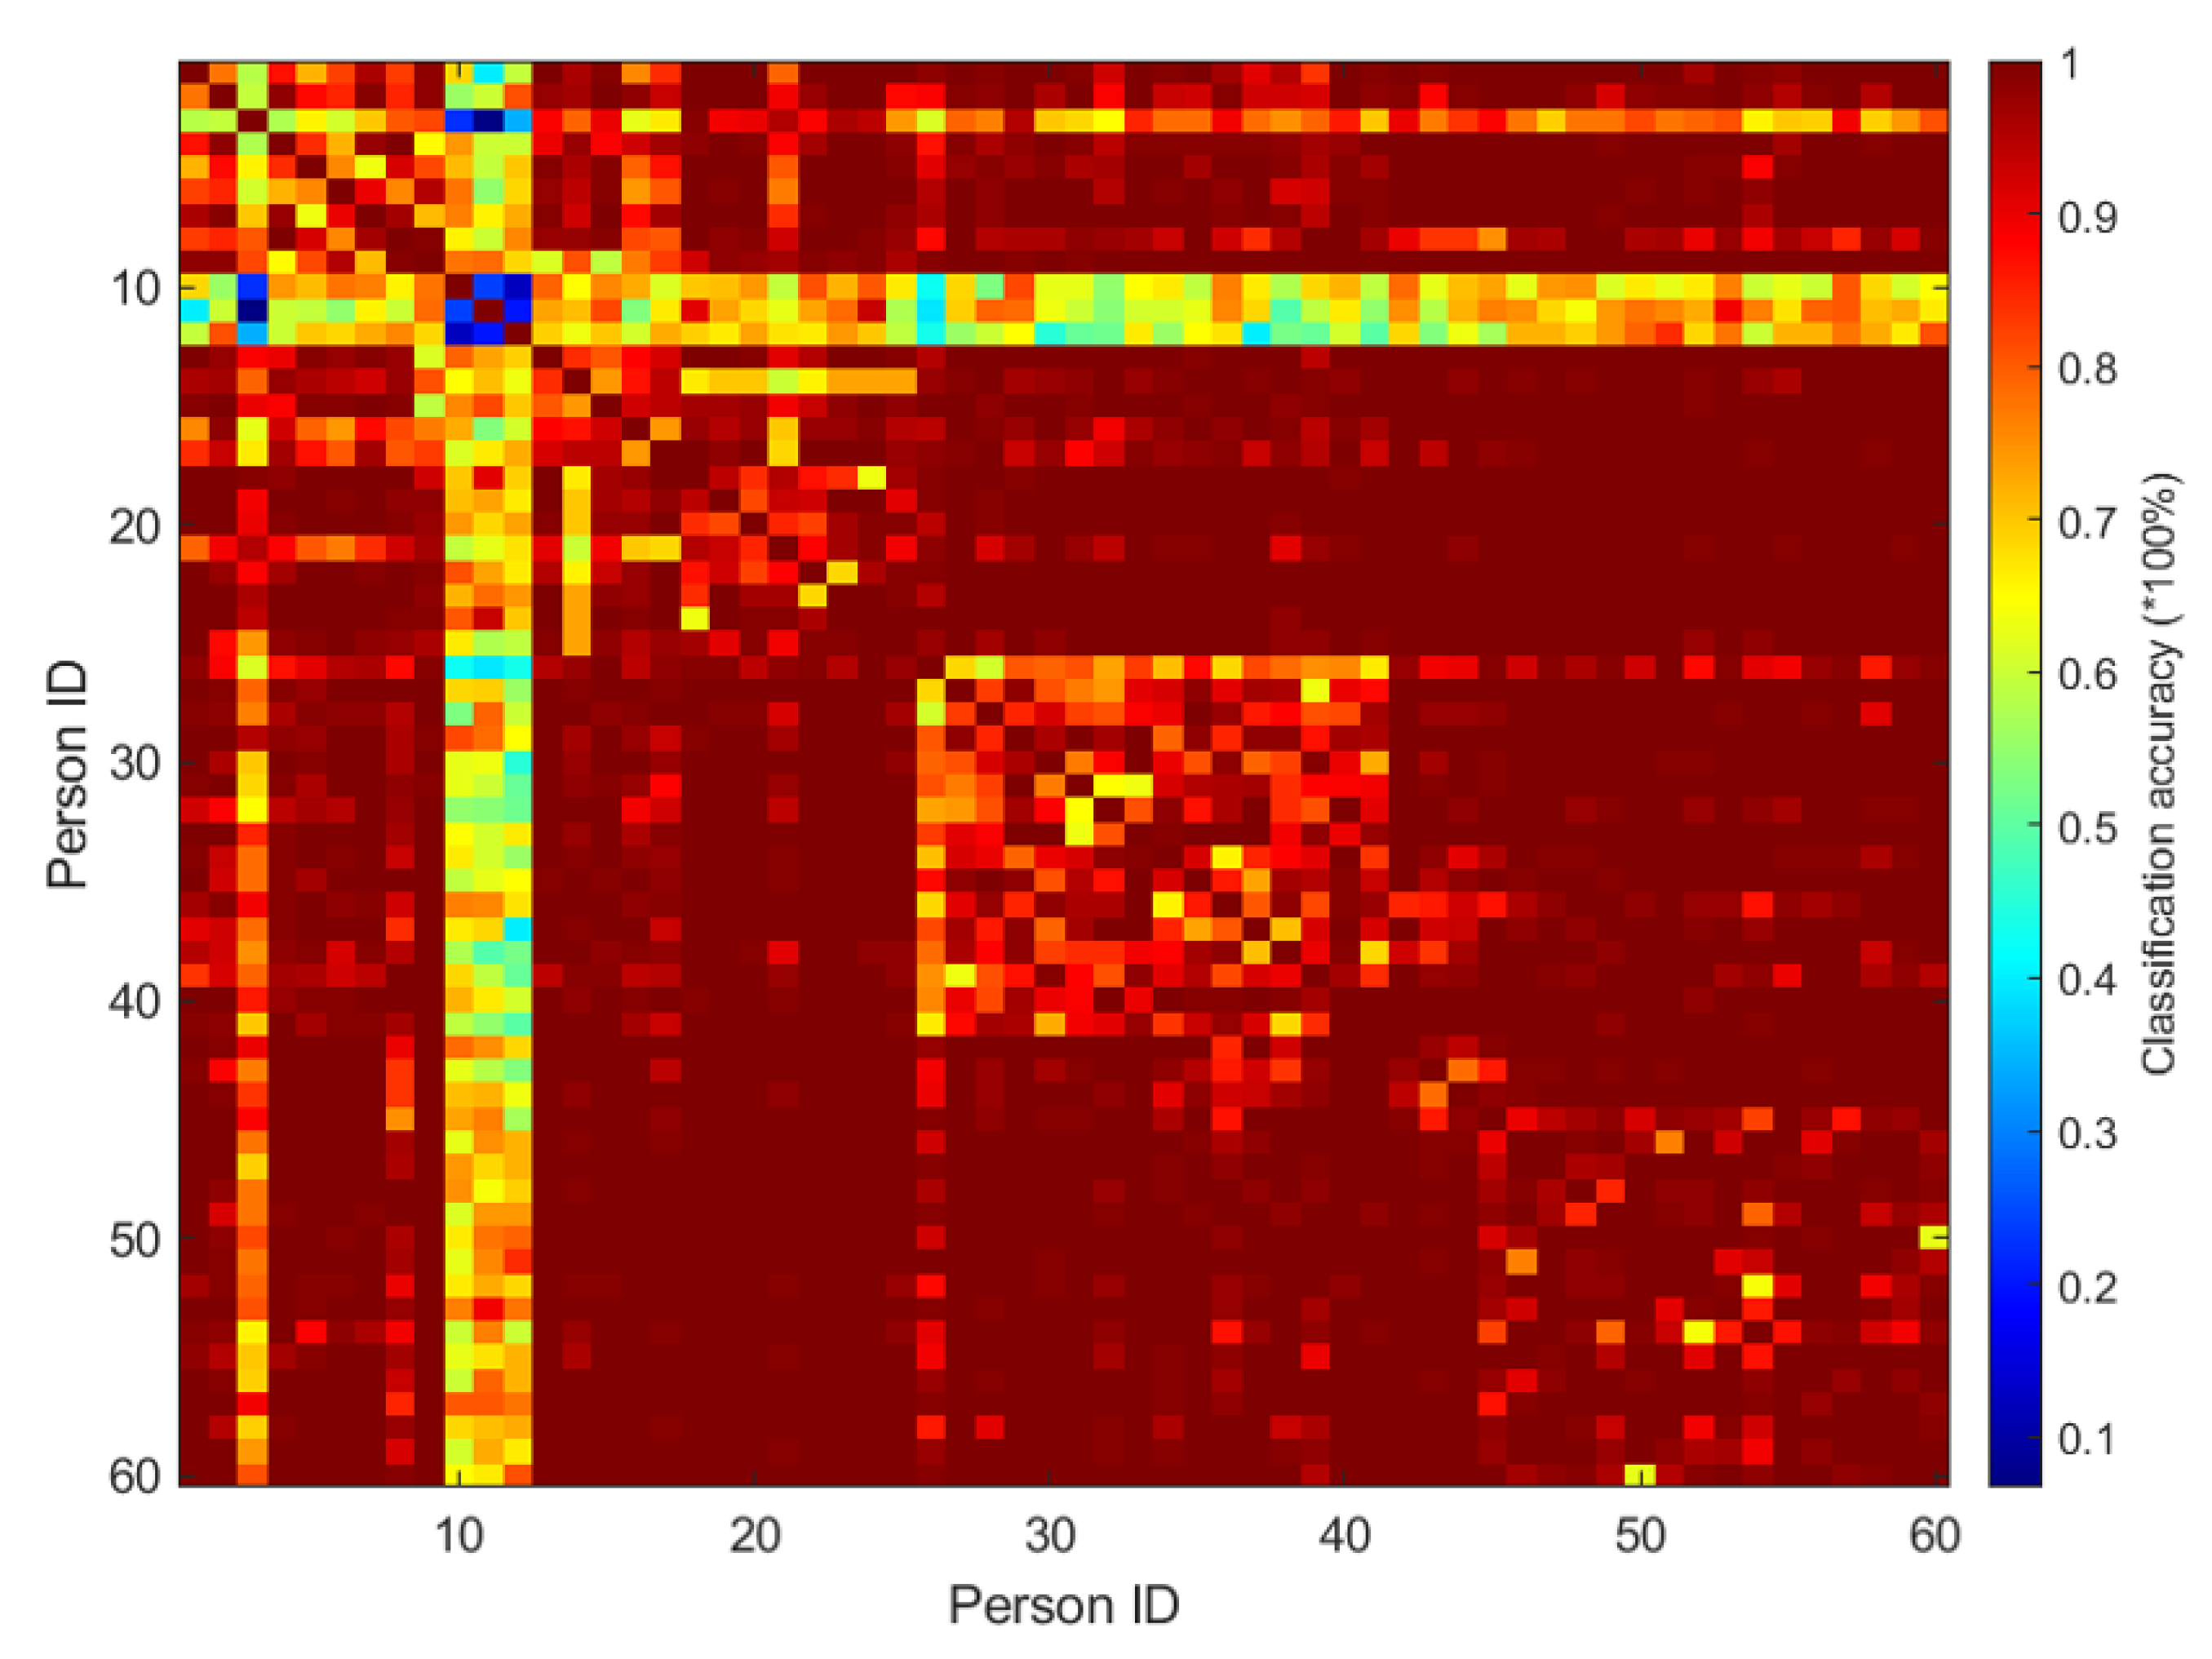
4.2. Personnel Recognition Based on Gait Analysis
5. Conclusions
Author Contributions
Funding
Acknowledgments
Conflicts of Interest
References
- Chavan, M.; Pardeshi, P.; Khoje, S.A.; Patil, M. Study of Health Monitoring System. In Proceedings of the 2018 Second International Conference on Intelligent Computing and Control Systems (ICICCS), Madurai, India, 14–15 June 2018; pp. 1779–1784. [Google Scholar]
- Terroso, M.; Rosa, N.; Marques, A.; Simoes, R. Physical consequences of falls in the elderly: A literature review from 1995 to 2010. Eur. Rev. Aging Phys. Act. 2013, 11, 51–59. [Google Scholar] [CrossRef]
- Lee, L.; Grimson, W.E.L. Gait analysis for recognition and classification. In Proceedings of the Fifth IEEE International Conference on Automatic Face Gesture Recognition, Washington, DC, USA, 21–21 May 2002; pp. 155–162. [Google Scholar]
- Ozcan, K.; Mahabalagiri, A.K.; Casares, M.; Velipasalar, S. Automatic Fall Detection and Activity Classification by a Wearable Embedded Smart Camera. IEEE J. Emerg. Sel. Top. Circuits Syst. 2013, 3, 125–136. [Google Scholar] [CrossRef]
- Alfuadi, R.; Mutijarsa, K. Classification method for prediction of human activity using stereo camera. In Proceedings of the 2016 International Seminar on Application for Technology of Information and Communication (ISemantic), Semarang, Indonesia, 5–6 August 2016; pp. 51–57. [Google Scholar]
- Zebin, T.; Scully, P.J.; Ozanyan, K.B. Evaluation of supervised classification algorithms for human activity recognition with inertial sensors. In Proceedings of the 2017 IEEE SENSORS, Glasgow, UK, 29 October–1 November 2017; pp. 1–3. [Google Scholar]
- Ding, C.; Zhang, L.; Gu, C.; Bai, L.; Liao, Z.; Hong, H.; Li, Y.; Zhu, X. Non-Contact Human Motion Recognition Based on UWB Radar. IEEE J. Emerg. Sel. Top. Circuits Syst. 2018, 8, 306–315. [Google Scholar] [CrossRef]
- Li, H.; Shrestha, A.; Heidari, H.; Kernec, J.L.; Fioranelli, F. A Multisensory Approach for Remote Health Monitoring of Older People. IEEE J. Electromagn. RF Microw. Med. Biol. 2018, 2, 102–108. [Google Scholar] [CrossRef]
- Fioranelli, F.; Ritchie, M.; Griffiths, H. Performance Analysis of Centroid and SVD Features for Personnel Recognition Using Multistatic Micro-Doppler. IEEE Geosci. Remote Sens. Lett. 2016, 13, 725–729. [Google Scholar] [CrossRef]
- Björklund, S.; Petersson, H.; Hendeby, G. Features for micro-Doppler based activity classification. IET Radar Sonar Navig. 2015, 9, 1181–1187. [Google Scholar] [CrossRef]
- Jokanovic, B.; Amin, M.; Ahmad, F. Radar fall motion detection using deep learning. In Proceedings of the 2016 IEEE Radar Conference (RadarConf), Philadelphia, PA, USA, 2–6 May 2016; pp. 1–6. [Google Scholar]
- Ghaleb, A.; Vignaud, L.; Nicolas, J.M. Micro-Doppler analysis of wheels and pedestrians in ISAR imaging. IET Signal Process. 2008, 2, 301–311. [Google Scholar] [CrossRef]
- Zrnic, B.; Andrić, M.S.; Bondzulic, B.P.; Simic, S.; Bujaković, D.M. Analysis of Radar Doppler Signature from Human Data. Radioengineering 2014, 23, 11–19. [Google Scholar]
- Seifert, A.; Zoubir, A.M.; Amin, M.G. Radar classification of human gait abnormality based on sum-of-harmonics analysis. In Proceedings of the 2018 IEEE Radar Conference (RadarConf18), Oklahoma City, OK, USA, 23–27 April 2018; pp. 0940–0945. [Google Scholar]
- Chen, Z.; Li, G.; Fioranelli, F.; Griffiths, H. Personnel Recognition and Gait Classification Based on Multistatic Micro-Doppler Signatures Using Deep Convolutional Neural Networks. IEEE Geosci. Remote Sens. Lett. 2018, 15, 669–673. [Google Scholar] [CrossRef]
- Johansson, J.; Daniel, D. Human Identification with Radar. Bachelor’s Thesis, Halmstad University, Halmstad, Sweden, 2016. [Google Scholar]
- Gurbuz, S.Z.; Amin, M.G. Radar-Based Human-Motion Recognition With Deep Learning: Promising applications for indoor monitoring. IEEE Signal Process. Mag. 2019, 36, 16–28. [Google Scholar] [CrossRef]
- Le Kernec, J.; Fioranelli, F.; Ding, C.; Zhao, H.; Sun, L.; Hong, H.; Lorandel, J.; Romain, O. Radar Signal Processing for Sensing in Assisted Living: The Challenges Associated With Real-Time Implementation of Emerging Algorithms. IEEE Signal Process. Mag. 2019, 36, 29–41. [Google Scholar] [CrossRef]
- Ancortek. Frequency-Modulated Continuous-Wave Radar; Ancortek: Fairfax, VA, USA, 2019. [Google Scholar]
- Stimson, G.W. Introduction to Airborne Radar; Mendham, N.J., Ed.; SciTech Pub.: Kolkata, India, 1998; pp. 163–176. [Google Scholar]
- Fioranelli, F.; Shah, S.A.; Li, H.; Shrestha, A.; Yang, S.; Le Kernec, J. Radar Signatures of Human Activities [Data Collection]. 2019. Available online: http://researchdata.gla.ac.uk/848/ (accessed on 5 July 2020).
- Christ, M.; Braun, N.; Neuffer, J.; Kempa-Liehr, A.W. Time Series FeatuRe Extraction on basis of Scalable Hypothesis tests (tsfresh—A Python package). Neurocomputing 2018, 307, 72–77. [Google Scholar] [CrossRef]
- Fioranelli, F.; Ritchie, M.; Griffiths, H. Centroid features for classification of armed/unarmed multiple personnel using multistatic human micro-Doppler. IET Radar Sonar Navig. 2016, 10, 1702–1710. [Google Scholar] [CrossRef]
- Marinovic, N.; Eichmann, G. An expansion of Wigner distribution and its applications. In Proceedings of the ICASSP ’85, IEEE International Conference on Acoustics, Speech, and Signal Processing, Tampa, FL, USA, 26–29 April 1985; Volume 10, pp. 1021–1024. [Google Scholar]
- Fioranelli, F.; Ritchie, M.; Griffiths, H. Classification of Unarmed/Armed Personnel Using the NetRAD Multistatic Radar for Micro-Doppler and Singular Value Decomposition Features. IEEE Geosci. Remote Sens. Lett. 2015, 12, 1933–1937. [Google Scholar] [CrossRef]
- Tahmoush, D.; Silvious, J. Radar micro-doppler for long range front-view gait recognition. In Proceedings of the 2009 IEEE 3rd International Conference on Biometrics: Theory, Applications, and Systems, Washington, DC, USA, 29–30 September 2009; pp. 1–6. [Google Scholar]
- Björklund, S.; Johansson, T.; Petersson, H. Evaluation of a micro-Doppler classification method on mm-wave data. In Proceedings of the 2012 IEEE Radar Conference, Atlanta, GA, USA, 7–11 May 2012; pp. 0934–0939. [Google Scholar]
- Li, J.; Shrestha, A.; Kernec, J.L.; Fioranelli, F. From Kinect skeleton data to hand gesture recognition with radar. J. Eng. 2019, 2019, 6914–6919. [Google Scholar] [CrossRef]
- Boulic, R.; Magnenat-Thalmann, N.; Thalmann, D. A Global Human Walking Model with Real-Time Kinematic Personification. Vis. Comput. 1990, 6, 344–358. [Google Scholar] [CrossRef]
- Guyon, I.; Elisseeff, A. An Introduction to Variable and Feature Selection. J. Mach. Learn. Res. 2003, 3, 1157–1182. [Google Scholar]
- Dash, M.; Liu, H. Feature Selection for Classification. Intell. Data Anal. 1997, 1, 131–156. [Google Scholar] [CrossRef]
- Li, H.; Shrestha, A.; Fioranelli, F.; Le Kernec, J.; Heidari, H. FMCW radar and inertial sensing synergy for assisted living. J. Eng. 2019, 2019, 6784–6789. [Google Scholar] [CrossRef]
- Garreau, G.; Andreou, C.M.; Andreou, A.G.; Georgiou, J.; Dura-Bernal, S.; Wennekers, T.; Denham, S. Gait-based person and gender recognition using micro-doppler signatures. In Proceedings of the 2011 IEEE Biomedical Circuits and Systems Conference (BioCAS), San Diego, CA, USA, 10–12 November 2011; pp. 444–447. [Google Scholar]


 |
| Feature Name | # |
|---|---|
| The velocity of the the stable phase (mean, max, min) | 3 |
| Step repetition frequency | 1 |
| Binary feature (stable phase, whole spectrogram) | 2 |
| Velocity difference in a half swing | 1 |
| Step length (mean, max, min) | 3 |
| The ratio of initial swing and terminal swing in one step cycle | 1 |
| Number of features | 11 |
| Simulated Velocity (m/s) | Measured Velocity from CVD Analysis | Measured Velocity from Velocity Diagram |
|---|---|---|
| 1.20 | 0.70 | 1.26 |
| 1.60 | 0.95 | 1.57 |
| 2.00 | 2.45 | 2.04 |
| Feature Set | Basic Feature Set | Basic Feature Set+ | Basic Feature Set+ |
|---|---|---|---|
| Accuracy | 44.12 | 45.60 | 43.83 |
| Classification Algoithms | uD Features | uD+RD+RT Features(1) | uD+RD+RT Features(2) | (1+2) |
|---|---|---|---|---|
| 25 Features | 75 Features | 627 Features | 702 Features | |
| Decision Tree (Fine model) | 88.5 | 87.9 | 63.3 | 86.3 |
| SVM (cubic kernel) | 91.8 | 17.2 | 72.0 | 20.3 |
| KNN (K=10, weighted) | 86.0 | 17.2 | 58.8 | 20.7 |
| Ensemble (Subspace, discriminant) | 90.1 | 90.7 | 70.7 | 89.2 |
| Activity | Model | Activity without Feature Selection | Activity after Feature Selection | Multiclass Accuracy |
|---|---|---|---|---|
| A1. Walk (model 1) | SVM (cubic) | 100% | 100% | 100% |
| A6. Fall (model 2) | Linear discriminant (binomial) | 96.5% | 99.3% | 98.3% |
| A2. Sit (model 3) | SVM (linear) | 96.3% | 98.7% | 96.7% |
| A3. Stand (model 4) | SVM (medium Gaussian) | 90.0% | 95.2% | 93.3% |
| A4. Pick (model 5) | SVM (cubic) | 84.8% | 96.7% | 92.7% |
| A5. Drink (model 5) | SVM (cubic) | 86.4% | 97.7% | 95.0% |
| Overall Classification accuracy | Hierarchical classification | 91.6% | 97.2% | 95.8% |
| Feature Name | # |
|---|---|
| Centroid of spectrogram (mean, variance) | 2 |
| Bandwidth of spectrogram | 2 |
| Skewness | 1 |
| SVD features (variance of U, V) | 2 |
| FFT coefficients (real and imaginary part) | 2 |
| Number of features | 9 |
| Feature Types | Feature Names | Feature Number |
|---|---|---|
| Multidomain features | Spectrogram features (Entropy, centroid and bandwidth of spectrogram, etc.) | 30 |
| CVD features (step repetition, frequency band peak, etc.) | 9 | |
| SVD features (mean, variance) | 36 | |
| Gait features | Velocity, stride length, ratio of foot swings, etc. | 11 |
| TSFRESH features | FFT coefficients, energy ratio by chunks, variance, standard deviation, etc. | 349 |
| Feature Type | Multidomain Features(1) | Gait Features(2) | TSFRESH Features(3) | (1)+(2)+(3) |
|---|---|---|---|---|
| Accuracy | 50.9 | 16.4 | 47.4 | 54.2 |
| Feature Type | Number of Features |
|---|---|
| Multidomain features | 10 |
| Gait features | 2 |
| TSFRESH features | 24 |
| % | 0 | 10 | 20 | 30 | 40 | 50 |
|---|---|---|---|---|---|---|
| 10 | 83.7 | 90.5 | 92.6 | 95.4 | 98.1 | 99.8 |
| 20 | 77.1 | 85.2 | 89.7 | 93.2 | 96.2 | |
| 30 | 73.6 | 82.0 | 86.6 | 91.4 | ||
| 40 | 70.9 | 78.7 | 84.4 | |||
| 50 | 69.0 | 76.7 | ||||
| 60 | 68.2 |
© 2020 by the authors. Licensee MDPI, Basel, Switzerland. This article is an open access article distributed under the terms and conditions of the Creative Commons Attribution (CC BY) license (http://creativecommons.org/licenses/by/4.0/).
Share and Cite
Li, X.; Li, Z.; Fioranelli, F.; Yang, S.; Romain, O.; Kernec, J.L. Hierarchical Radar Data Analysis for Activity and Personnel Recognition. Remote Sens. 2020, 12, 2237. https://doi.org/10.3390/rs12142237
Li X, Li Z, Fioranelli F, Yang S, Romain O, Kernec JL. Hierarchical Radar Data Analysis for Activity and Personnel Recognition. Remote Sensing. 2020; 12(14):2237. https://doi.org/10.3390/rs12142237
Chicago/Turabian StyleLi, Xingzhuo, Zhenghui Li, Francesco Fioranelli, Shufan Yang, Olivier Romain, and Julien Le Kernec. 2020. "Hierarchical Radar Data Analysis for Activity and Personnel Recognition" Remote Sensing 12, no. 14: 2237. https://doi.org/10.3390/rs12142237
APA StyleLi, X., Li, Z., Fioranelli, F., Yang, S., Romain, O., & Kernec, J. L. (2020). Hierarchical Radar Data Analysis for Activity and Personnel Recognition. Remote Sensing, 12(14), 2237. https://doi.org/10.3390/rs12142237