Article

Global Wildfire Outlook Forecast with Neural Networks

School of Earth and Atmospheric Sciences, Georgia Institute of Technology, Atlanta, GA 30332, USA
*
Author to whom correspondence should be addressed.
Remote Sens. 2020, 12(14), 2246; https://doi.org/10.3390/rs12142246
Submission received: 3 June 2020 / Revised: 2 July 2020 / Accepted: 9 July 2020 / Published: 13 July 2020
(This article belongs to the Special Issue Remote Sensing Applications for Wildland Urban Interfaces (WUI) Fire)

Abstract

:
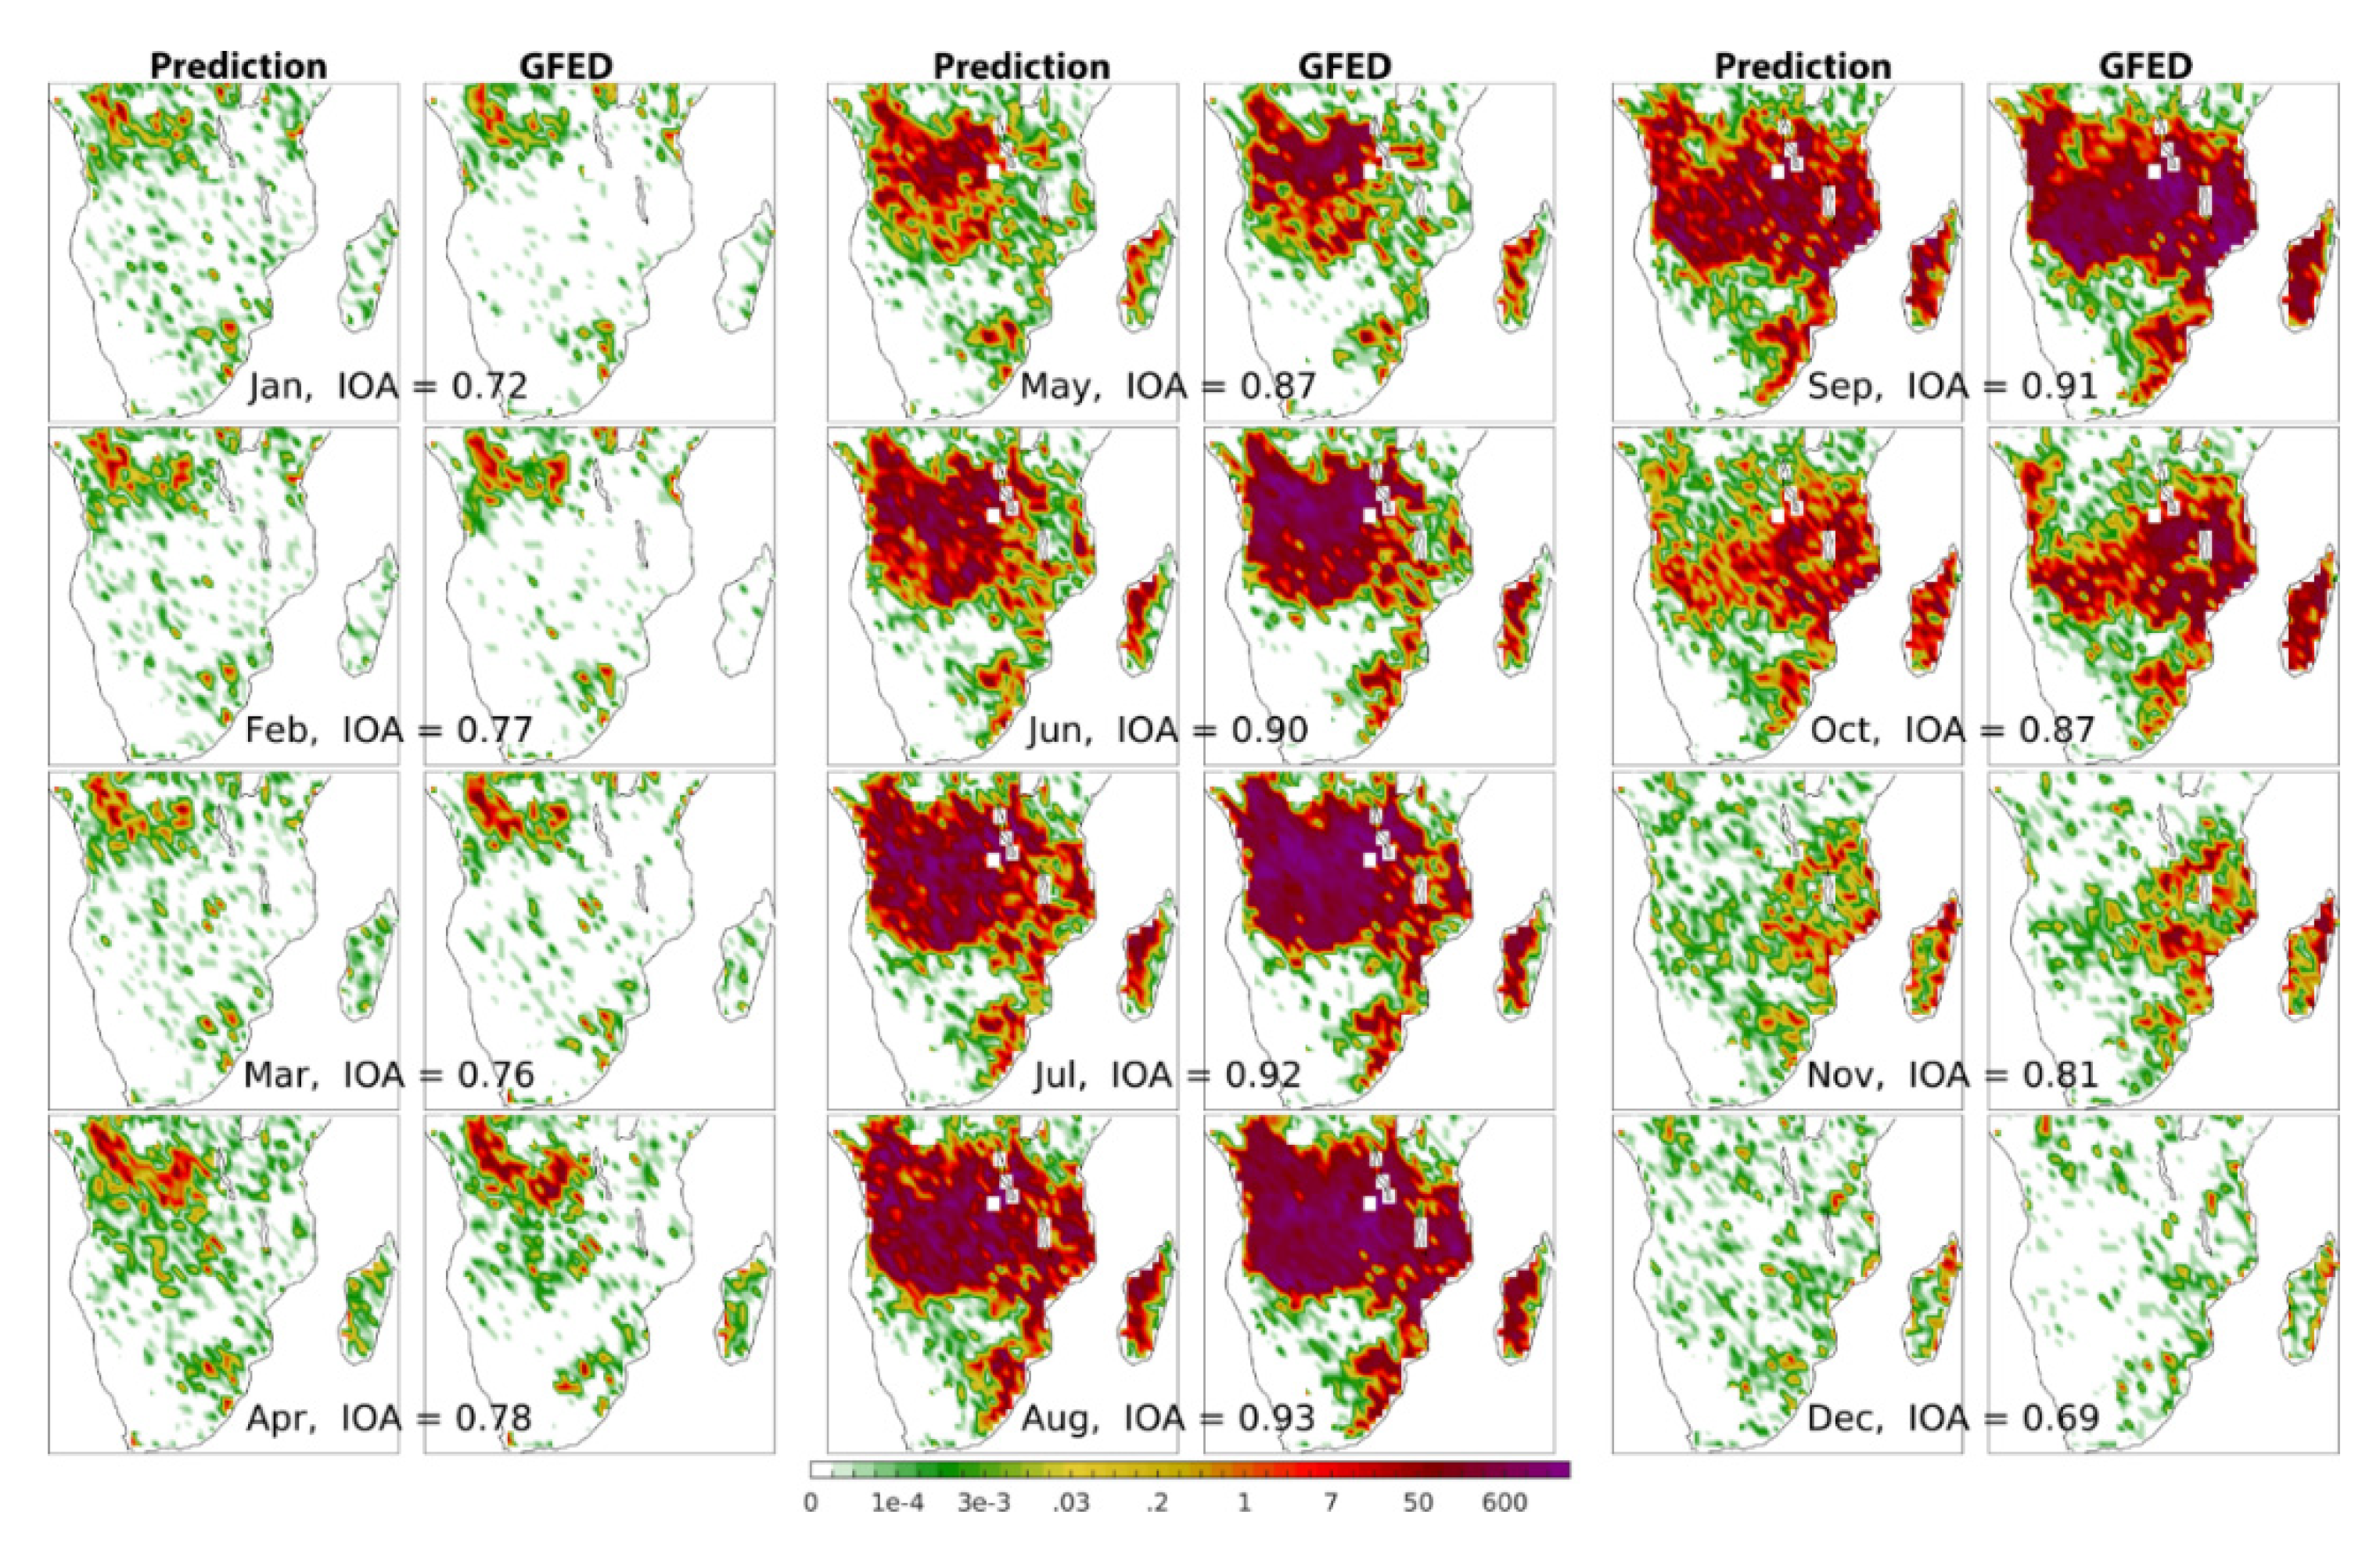
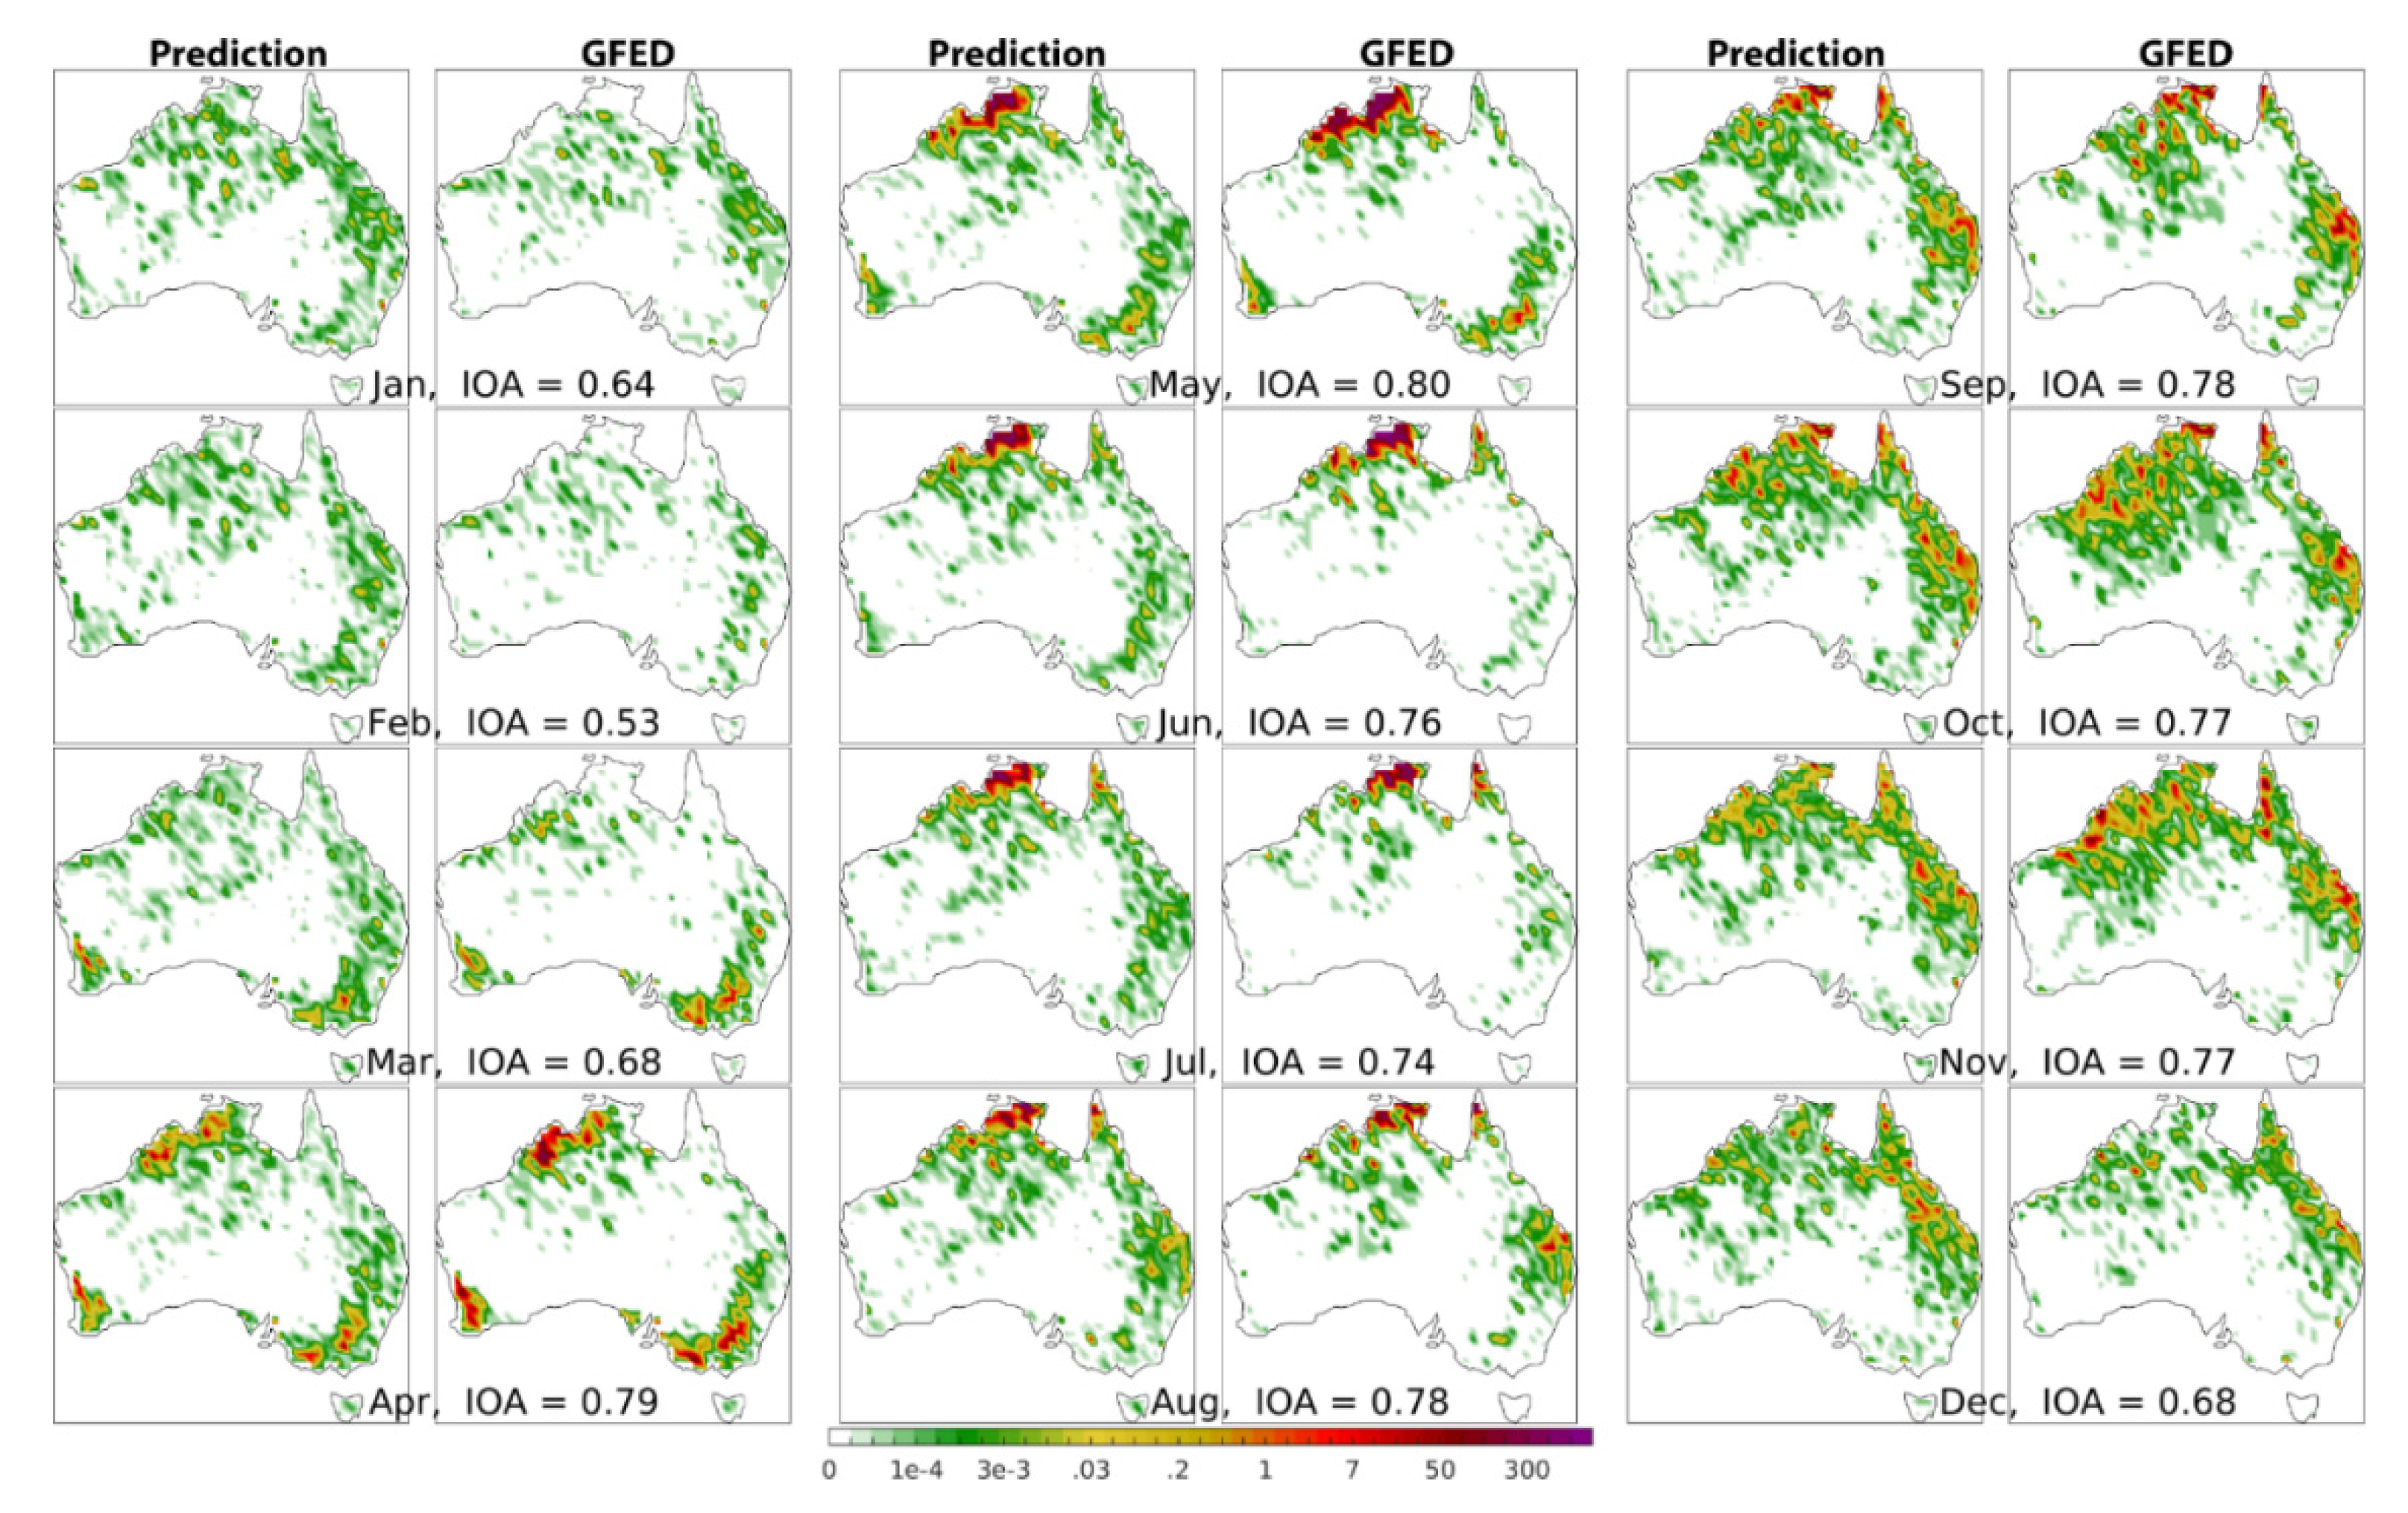
Wildfire occurrence and spread are affected by atmospheric and land-cover conditions, and therefore meteorological and land-cover parameters can be used in area burned prediction. We apply three forecast methods, a generalized linear model, regression trees, and neural networks (Levenberg–Marquardt backpropagation) to produce monthly wildfire predictions 1 year in advance. The models are trained using the Global Fire Emissions Database version 4 with small fires (GFEDv4s). Continuous 1-year monthly fire predictions from 2011 to 2015 are evaluated with GFEDs data for 10 major fire regions around the globe. The predictions by the neural network method are superior. The 1-year moving predictions have good prediction skills over these regions, especially over the tropics and the southern hemisphere. The temporal refined index of agreement (IOA) between predictions and GFEDv4s regional burned areas are 0.82, 0.82, 0.8, 0.75, and 0.56 for northern and southern Africa, South America, equatorial Asia and Australia, respectively. The spatial refined IOA for 5-year averaged monthly burned area range from 0.69 in low-fire months to 0.86 in high-fire months over South America, 0.3–0.93 over northern Africa, 0.69–0.93 over southern Africa, 0.47–0.85 over equatorial Asia, and 0.53–0.8 over Australia. For fire regions in the northern temperate and boreal regions, the temporal and spatial IOA between predictions and GFEDv4s data in fire seasons are 0.7–0.79 and 0.24–0.83, respectively. The predictions in high-fire months are better than low-fire months. This study illustrates the feasibility of global fire activity outlook forecasts using a neural network model and the method can be applied to quickly assess the potential effects of climate change on wildfires.

1. Introduction

Wildfire is a natural hazard and plays a major role in climate and ecosystem dynamics, e.g., [1]. These wildfires release large amounts of particulates, which scatter and absorb solar radiation and interact with clouds, e.g., [2,3,4,5]. The disturbance in ecosystems by wildfire is likely a driver for long-term ecosystem changes, e.g., [6,7]. In the short term, wildfires reduce the carbon pool of land biota by releasing CO2, exacerbating greenhouse warming.
Predicting wildfire is a challenging task, particularly on a global scale given the complexity and uncertainty of the causes and mechanisms of wildfire. Fire occurrence and spread are closely related to atmospheric and land-cover conditions, e.g., [8,9,10]. Numerical models have been used to investigate the wildfire variability and interaction with atmosphere and ocean and to understand the long-term trends of wildfire, e.g., [10,11,12], but fully interactive weather–fire forecast is computationally feasible only on a regional basis.
On continental and global scales, statistical models are therefore usually applied. Linear regression was applied to forecast fire season severity in South America using sea surface temperature anomalies [13,14,15] and to determine the weather factors that best explain the burned area fraction in southern Africa [16,17,18]. Several studies employed a generalized linear model (GLM) to find wildfire predictors in the United States, Africa, and Spain and demonstrated the effectiveness of the GLM [19,20,21,22]. In comparison to linear regression, the regression tree method can deal with the nonlinear relationship between independent and dependent variables [19,23,24], but it may have a poor resolution with continuous expectation variables and tends to be sensitive to small perturbations in the data [25,26]. Recently, more advanced data-driven models, created through data-adaptive machine learning methods from a large set of spatiotemporal datasets, have been employed in predicting wildfires and PM2.5 [27,28,29,30,31,32], and have obtained encouraging results. In recent years, machine learning methods have been applied to satellite fire image recognition [33], such as artificial neural network (ANN [34]), Bayesian (BN [35]), convolutional neural network (CNN [36]), Depp neural network (DNN [37]), decision tree (DT [38]), K-means clustering (KM [39]), recurrent neural network (RNN [40]). These machine learning methods are very good at satellite image recognition, especially CNN, which is widely used for face recognition and building footprint detection [41]. Additionally, machine learning methods have been applied to fire forecast meteorological data [42], including ANN [34], decision trees [38], CNN, and RNN [43]. In addition to these studies, hidden Markov models (HMM) [43] was used to predict burned area in the north-west of Tunisia with spatiotemporal factors used as model inputs. More recently, Xie Y. et al. [44] did a comparison of many machine learning methods for estimating the area burned in Montesinho natural park, Portugal. They found a tuned extreme gradient boosting GLM performed better than standard GLM for the regression task. Unlike these previous studies that targeted fire forecasts of a specific fire type, or region, or relatively short forecast time periods of days to weeks, we examine improving fire forecasts with a gridded global coverage and extended forecast periods of seasons to years. For the extensive temporospatial and fire type coverages in this study, choosing the optimal predictor variables is especially challenging. Our study combined statistical methods (non-machine learning) and machine learning methods to make computationally efficient wildfire predictions globally [45]. The statistical methods, e.g., GLM and regress tree, were used to find relevant physical parameters with significant correlations to wildfire. The machine learning method is then applied using the selected physical parameters for fire prediction. Additionally, ensemble forecasts were widely applied to reduce the prediction uncertainty of long-term meteorological forecasts; the NCEP Climate Forecast System (CFS) can provide month-to-season forecasts, which need be used carefully [46]. In this study, we apply three forecast methods (GLM, regression tree, and neural network) to examine the feasibility of the global wildfire outlook forecast.

2. Materials and Method

2.1. Observation Datasets

Fire dataset
The fire data of monthly burned area from Global Fire Emissions Database version 4 with small fires (GFEDv4s) [47] were applied in this study. We aggregated the burned area of 1997–2015 from the original 0.25° × 0.25° spatial resolution to a 0.75° × 0.75° grid to be consistent with the re-gridded meteorology data.
Meteorological datasets
The monthly meteorology dataset is from the National Centers for Environmental Prediction Climate Forecast System Reanalysis (CFSR) [48]. The CFSR reanalysis dataset is available from 1979 to the present and has T382 (~38 km) spatial resolution. We chose 12 prediction meteorological parameters from the CFSR reanalysis data to use in the predictive model of fire severity, i.e., 2 m temperature, 10 m U and V components of wind, 2 m specific humidity, surface pressure, precipitation, land-cover, vegetation type, vegetation percent, snow cover, potential evaporation, sensible heat flux, and ground heat flux. All meteorology variables were interpolated from the Gaussian grid (T382) to the same 0.75° × 0.75° grid as the burned area data by using the ESMF regridding package.
Ocean climate indices
Three long-term climate ocean indices [49], Ocean Nino Index (ONI), Atlantic Multidecadal Oscillation (AMO), and Pacific Decadal Oscillation (PDO), were selected for ocean influence on fire activities from Earth System Research Laboratory of NOAA (www.esrl.noaa.gov/psd/data/climateindices). These monthly temporal indices were replicated to all grids of 0.75° × 0.75°.

2.2. Performance Indices

A refined index of agreement
For general statistic model performance evaluation, the index of agreement is a suitable and reliable method [50]. A refined index of model performance was widely used to measure how well the prediction model simulated observed data. [51,52] to evaluate the model performance to observation. Compared with the general versions of Willmott’s index as well as four other dimensionless indices [53,54,55], the refined index of agreement (IOA) improves generally over the other six indices in terms of flexible, well behaved, and a wide range of model-performance applications. The refined index of agreement (IOA) can be expressed as
I O A = { 1 i = 1 n | P i O i | c i = 1 n | O i O ¯ | ,     w h e n   i = 1 n | P i O i | c i = 1 n | O i O ¯ | c i = 1 n | O i O ¯ | i = 1 n | P i O i | 1 ,     w h e n   i = 1 n | P i O i | > c i = 1 n | O i O ¯ |
where P is the model prediction, O is the observation, and C = 2 (recommended).
Model Performance Metrics
The mean fractional error is used to evaluate the model performance, which is defined as
M F E = 2 N i = 1 N P i m i P i + m i
where Pi and mi are the predicted and observed values, respectively, and N is the number of data [56,57]. Mean fractional error (MFE) gives equal weight to overpredictions and underpredictions due to its symmetric property. The model performance evaluated by MFE is the level of accuracy that the best model can be achieved while the performance criterion is the level of accuracy that is acceptable for standard model applications. We also used the R-squared value to evaluate the model performance because it provides the correlation between predicted and observed values.

2.3. Forecast Models and Prediction Evaluation

In our study, we used three non-linear statistical models, GLM, regression tree, and neural network, to build relationships between regional fire activities and various physical parameters. Compared to the GFED fire dataset, the neural network model shows the best forecast skill among these three non-linear model simulations, while GLM has the highest computationally efficiency. To accomplish the best forecast skill and computation efficiency, GLM was used to select the best predictor parameters combination, and the neural network method was used to do a 1-year moving forecast. All models were applied on each grid cell, then we computed regional average forecast skill (R-square and RMSE) on all grid cells.
The log distribution is widely applied to analyze wildfire variability [10,58,59,60]. Therefore, a log-linear GLM model is appropriate for investigating the relationships between meteorology variables and fire burned area. The log-linear GLM consists of three components:
  • Random component: Poisson distribution
  • Systematic component: A linear predictor g ( u ) = β 0 + β 1 X 1 + + β k X k
  • Link function: Here we use a log-linear function, g ( u ) = l o g ( u )
These three components are expressed as the Poisson regression: g ( u ) = l o g ( u ) = β 0 + β 1 X 1 + + β k X k u ( X 1 , , X k ) = e β 0 + β 1 X 1 + + β k X k .
To set up GLM of fire and meteorological variables, X1-Xk were chosen from 11 CFSR parameters and 3 climate ocean indices, which are surface temperature, u-component, v-component, specific humidity, surface pressure, surface vegetation type, surface vegetation, surface precipitation rate, surface snow cover, ONI, AMO, and PDO. We also included two lagged time variables of 6 and 12 months into X variables because the seasonal cycle has to be included for fire variation. For each fire region, not all parameters are necessarily used for fire prediction; some of them even cancel each other and reduce prediction capability. We chose carefully the best combination of parameters used for prediction in each fire region. The method we used to get the best combination of parameters for each region is to perform hindcast forecasts of all combinations of 14 parameters. The parameter combination with the highest forecast skill, higher R-square, and lower root mean square error (RMSE) between forecast and observation can be considered the best combination of parameters for this region and will be used in the above equation to perform fire prediction. There are 16,383 possibilities to create the parameter combination from 14 parameters. To find the best parameter combination of X1–Xk, we calculated R-squares and RMSE of 16,383 GLM models, the parameter combination of the highest forecast skill (higher R-square and lower RMSE) is the best parameter combination. Compared to the regression tree and neural network methods, the GLM is much more computationally efficient to select the best parameter combination. The most sensitive meteorological parameters selected in this manner for each fire region are listed in Table 1. We picked 10 major fire regions (Figure 1) from 14 GFED regions [61] in the main paper and put the results of the other 4 regions in the supplement. Precipitation and vegetation type are selected for most tropical and subtropical regions, which is consistent with the previous research findings [59,62]. In the northern temperate and boreal regions, sensitive parameters include temperature and land type in agreement with previous reports [63,64,65]. Ocean index ONI and AMO are important to South America [13,15], while ONI is important to equatorial Asia [9,66,67].
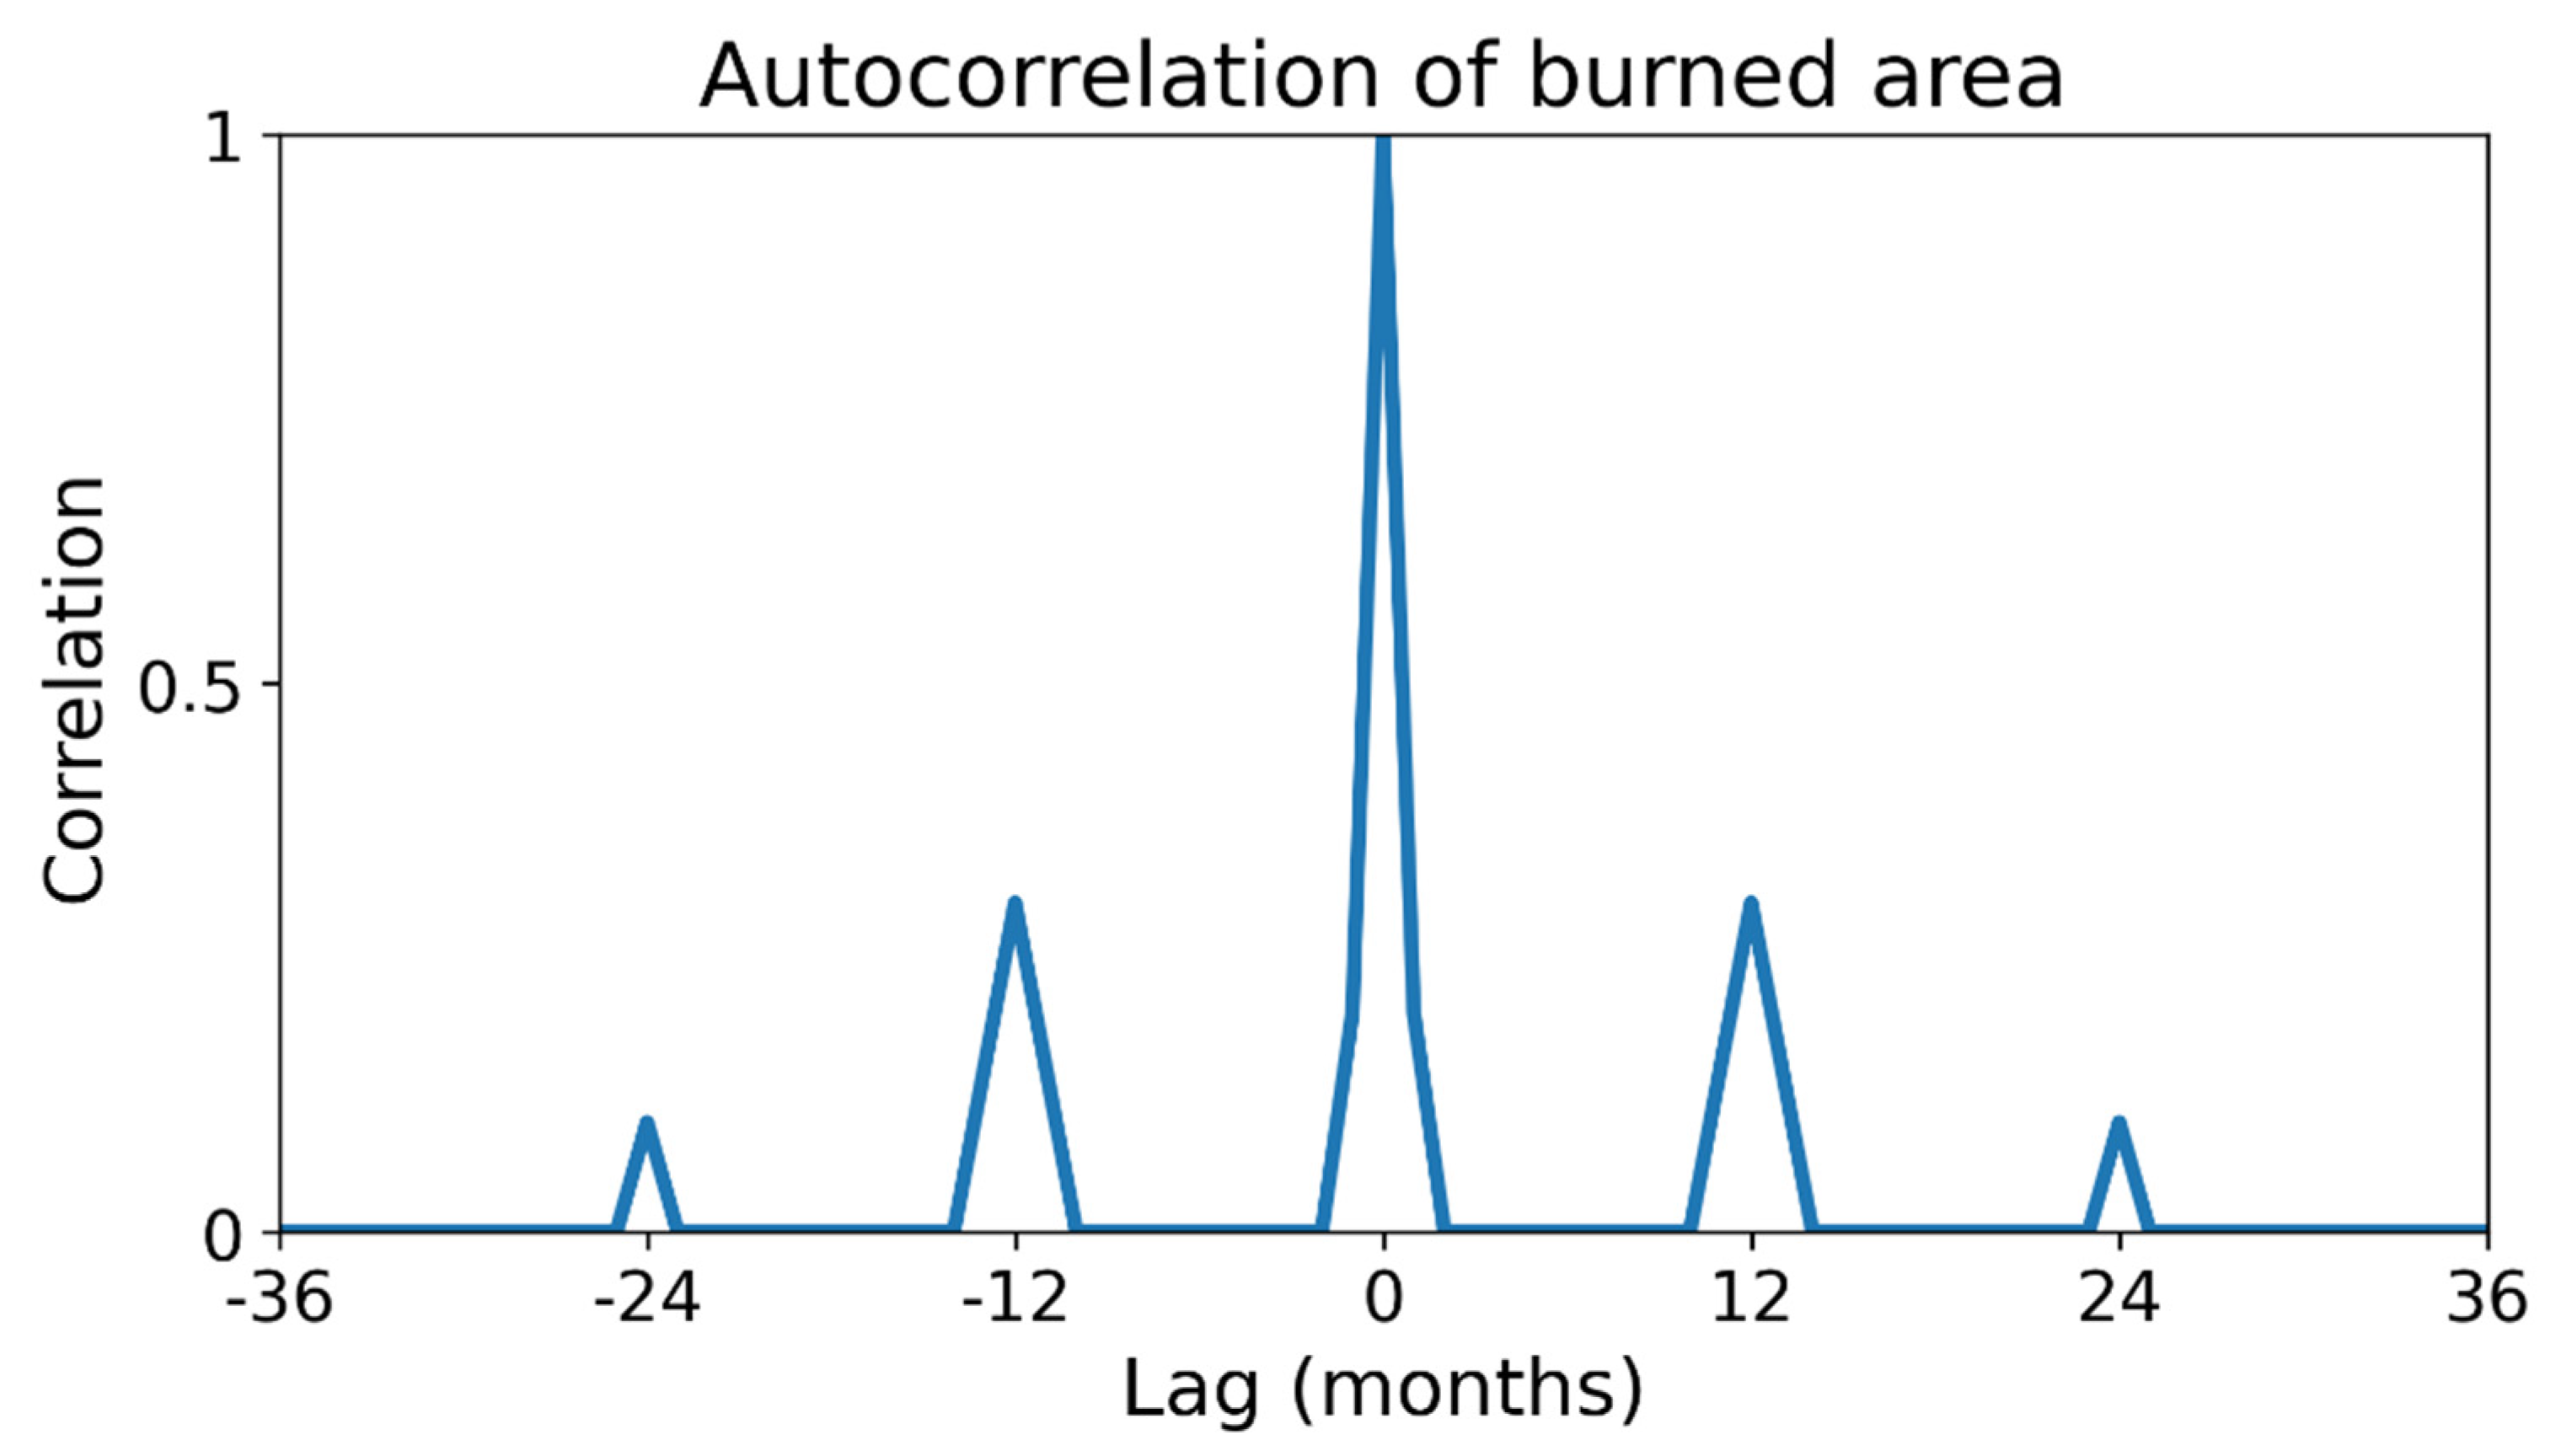
We further applied the regression tree [19,23,24] and a neural network (Levenberg-Marquardt backpropagation) [68,69,70,71,72,73] to capture the nonlinear dependence of fire burned area on the selected predictor parameters. For comparison purposes, we used the same parameters (Table 1) in these two methods as the GLM. In order to build an accurate nonlinear prediction models, we add two useful temporal predictors, month and year, as independent variables into regression tree and neural network models with the best variables combination selected by GLM (Table 1). Burned area autocorrelations (Figure 2) of most fire grids show a large autocorrelation of lagged 12 months, which suggests adding the burned area of the prior 12 months as an independent predictor in models to include temporal inheritance. All the predictors, including selected meteorological parameters, two temporal variables, and a lagged burned area of the prior 12 months, were used to train the following neural network and regression tree models. In this work, a neural network model (Levenberg-Marquardt backpropagation) was set up by the Matlab function ‘fitnet’ with a hidden layer size of 30, training function of ‘trainlm’, ’logsig’ transfer function of the first input layer. The regression tree model is set up by Matlab function ‘fitensemble’ as an ensemble of 500 bagged regression trees with ‘MinLeaf’ template, ‘LSBoost’ method, and 0.01 ‘LearnRate’. We specify that fires occur over vegetated land and that the predicted fire burned area in each cell cannot exceed the area itself.
To evaluate the performance of the three methods, we conducted continuous 1-year monthly fire predictions from 2011 to 2015, in which the models were trained with the burned area and all predictors from 1997 to the prior year to the predicted year. For example, we trained the models with predictors and burned area of 1997–2010 to predict burned area in 2011, trained models with data in 1997–2011 to predict burned area in 2012, and so on. The 1-year moving prediction results of 2011–2015 were then evaluated with the GFEDv4s data. The evaluations of these three methods with GFED burned areas are shown in Table 2. For all regions, the neural network model outperforms the regression tree method, which is better than the GLM. The mean R-square is 0.59, 0.51, and 0.41, the mean index of agreement (IOA) is 0.74, 0.65, and 0.54, the mean normalized root-mean-square deviation (NRMSD) is 0.15, 0.3, and 0.4, the mean normalized mean error (NME) is 54%, 62%, and 70%, the mean normalized mean bias (NMB) is 33%, 42%, and 54%, for the neural network, regression tree, and GLM, respectively. This reflects the nonlinear dependence of wildfires on meteorological parameters and demonstrates the ability of the neural network method to resolve nonlinear and highly variable events like wildfires [32,70,74,75]. Consequently, we show only the neural network prediction results in the following sections.

3. Results and Discussion

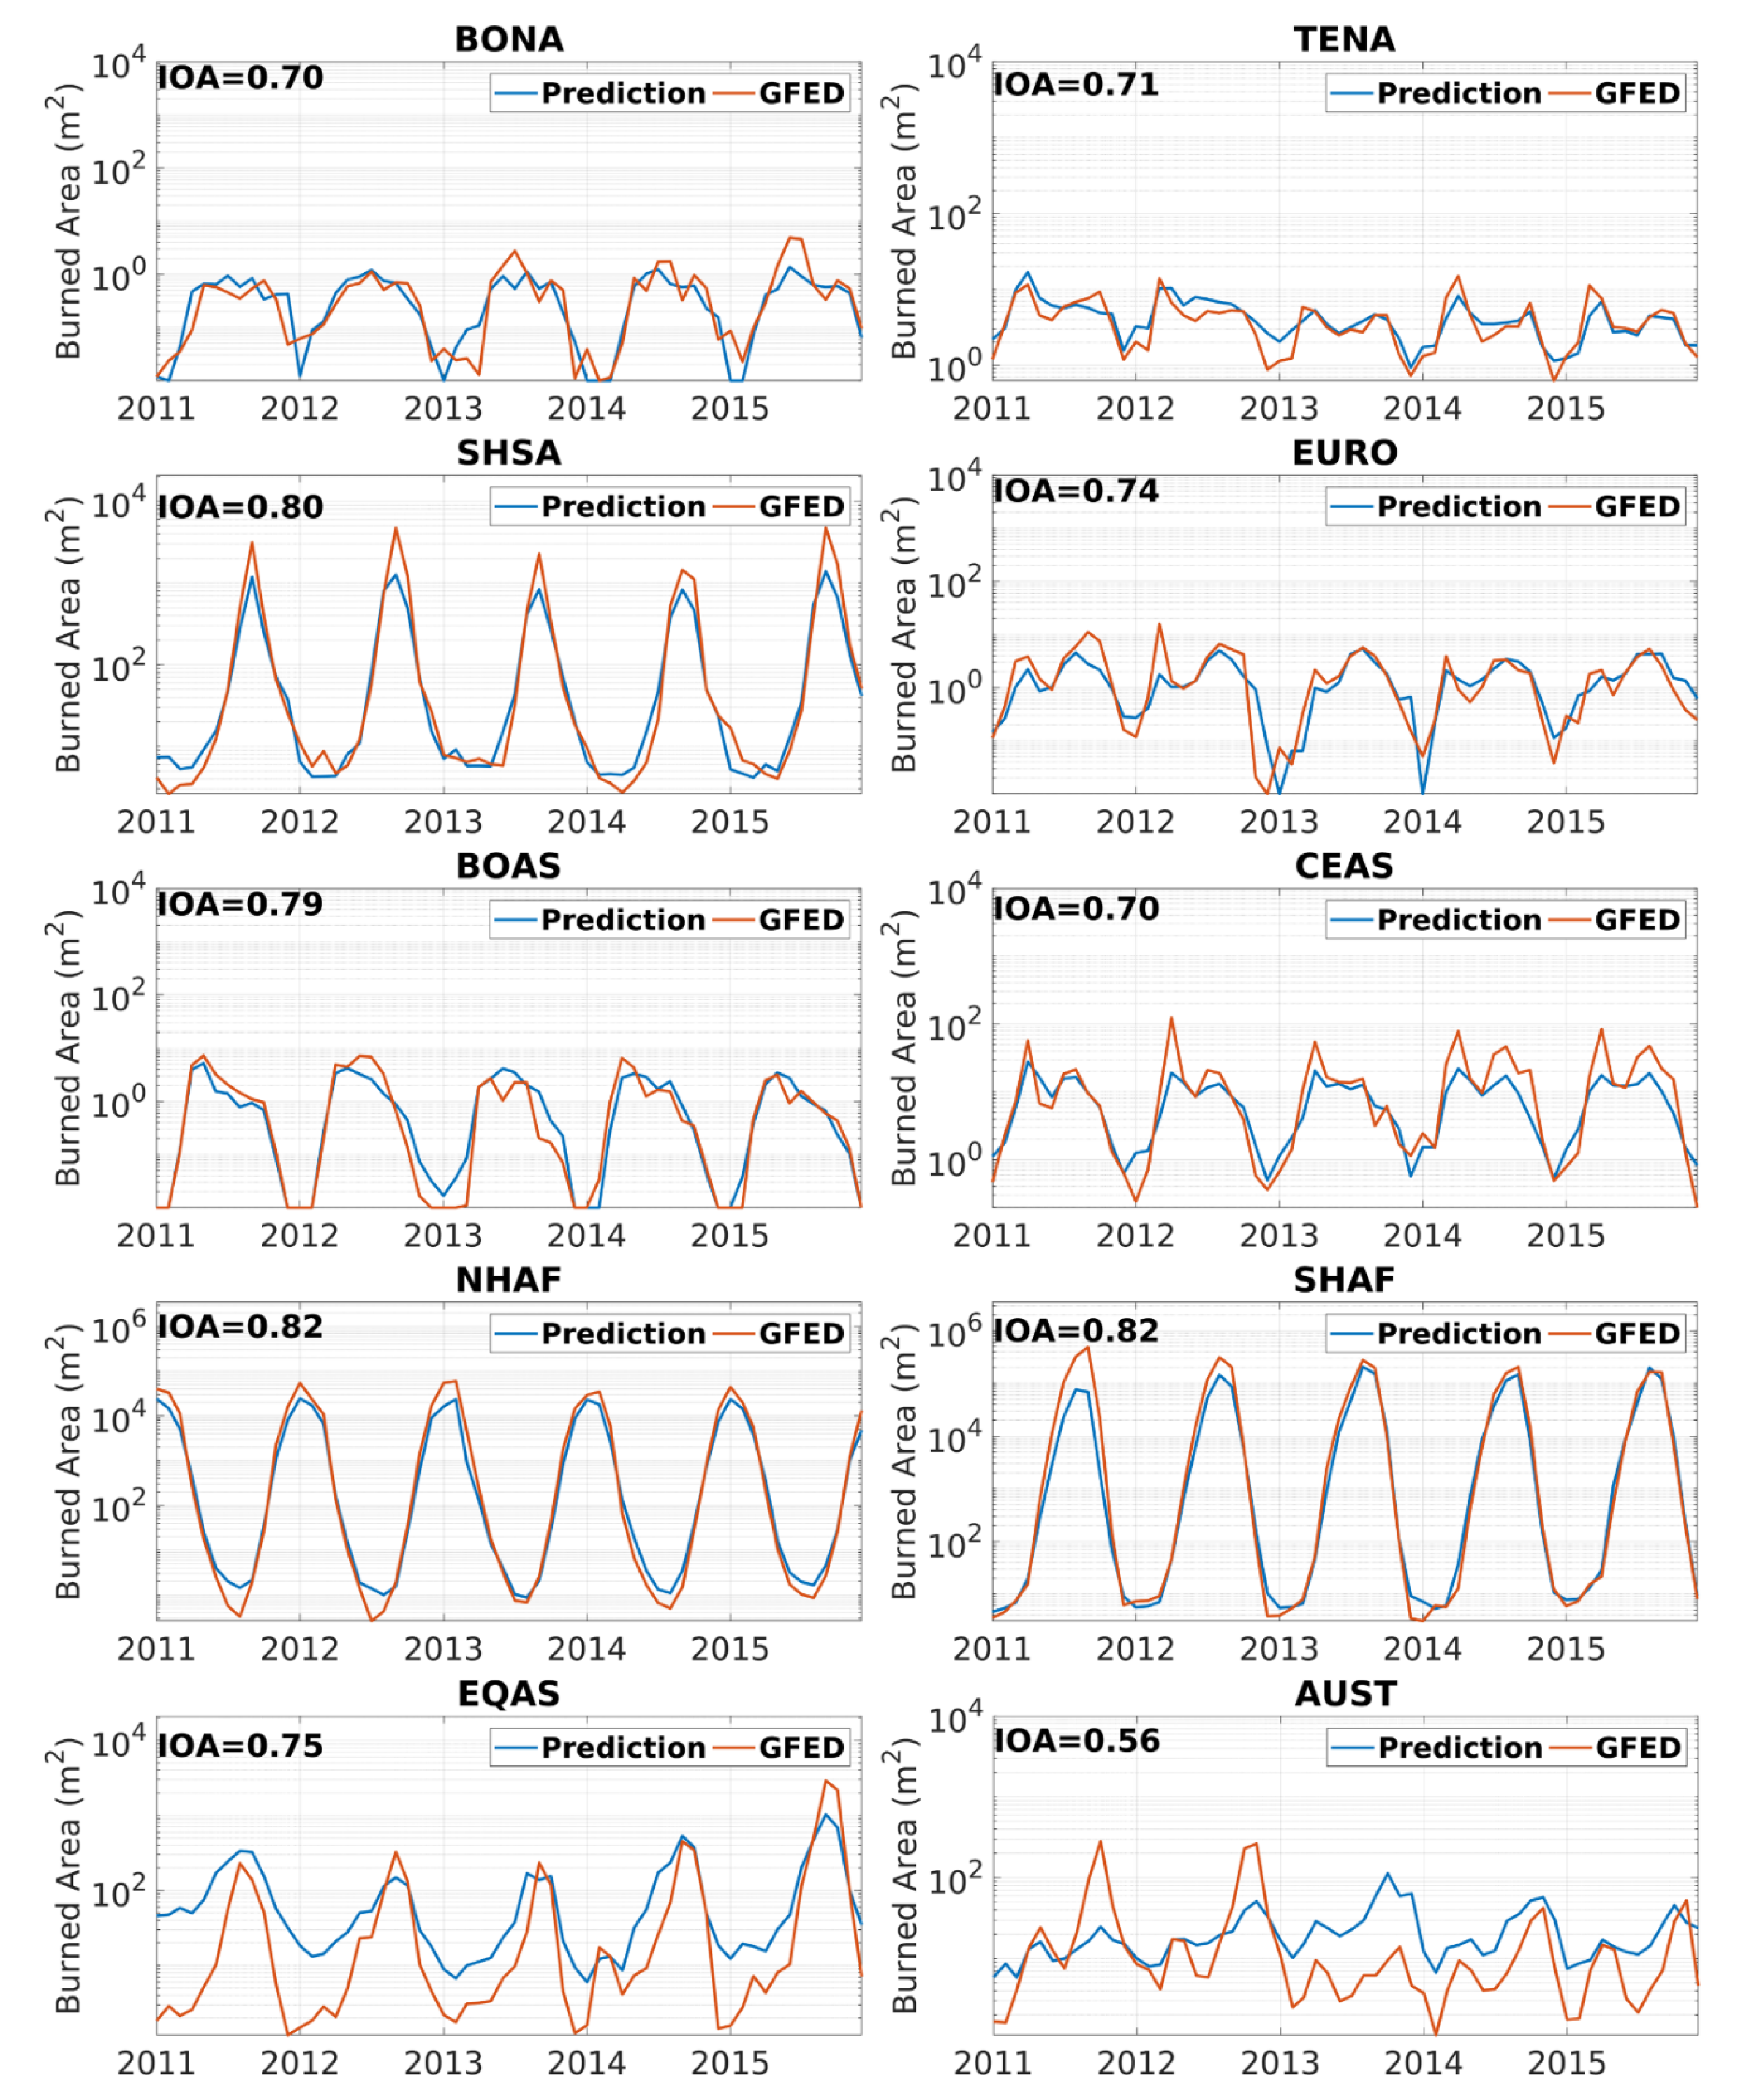
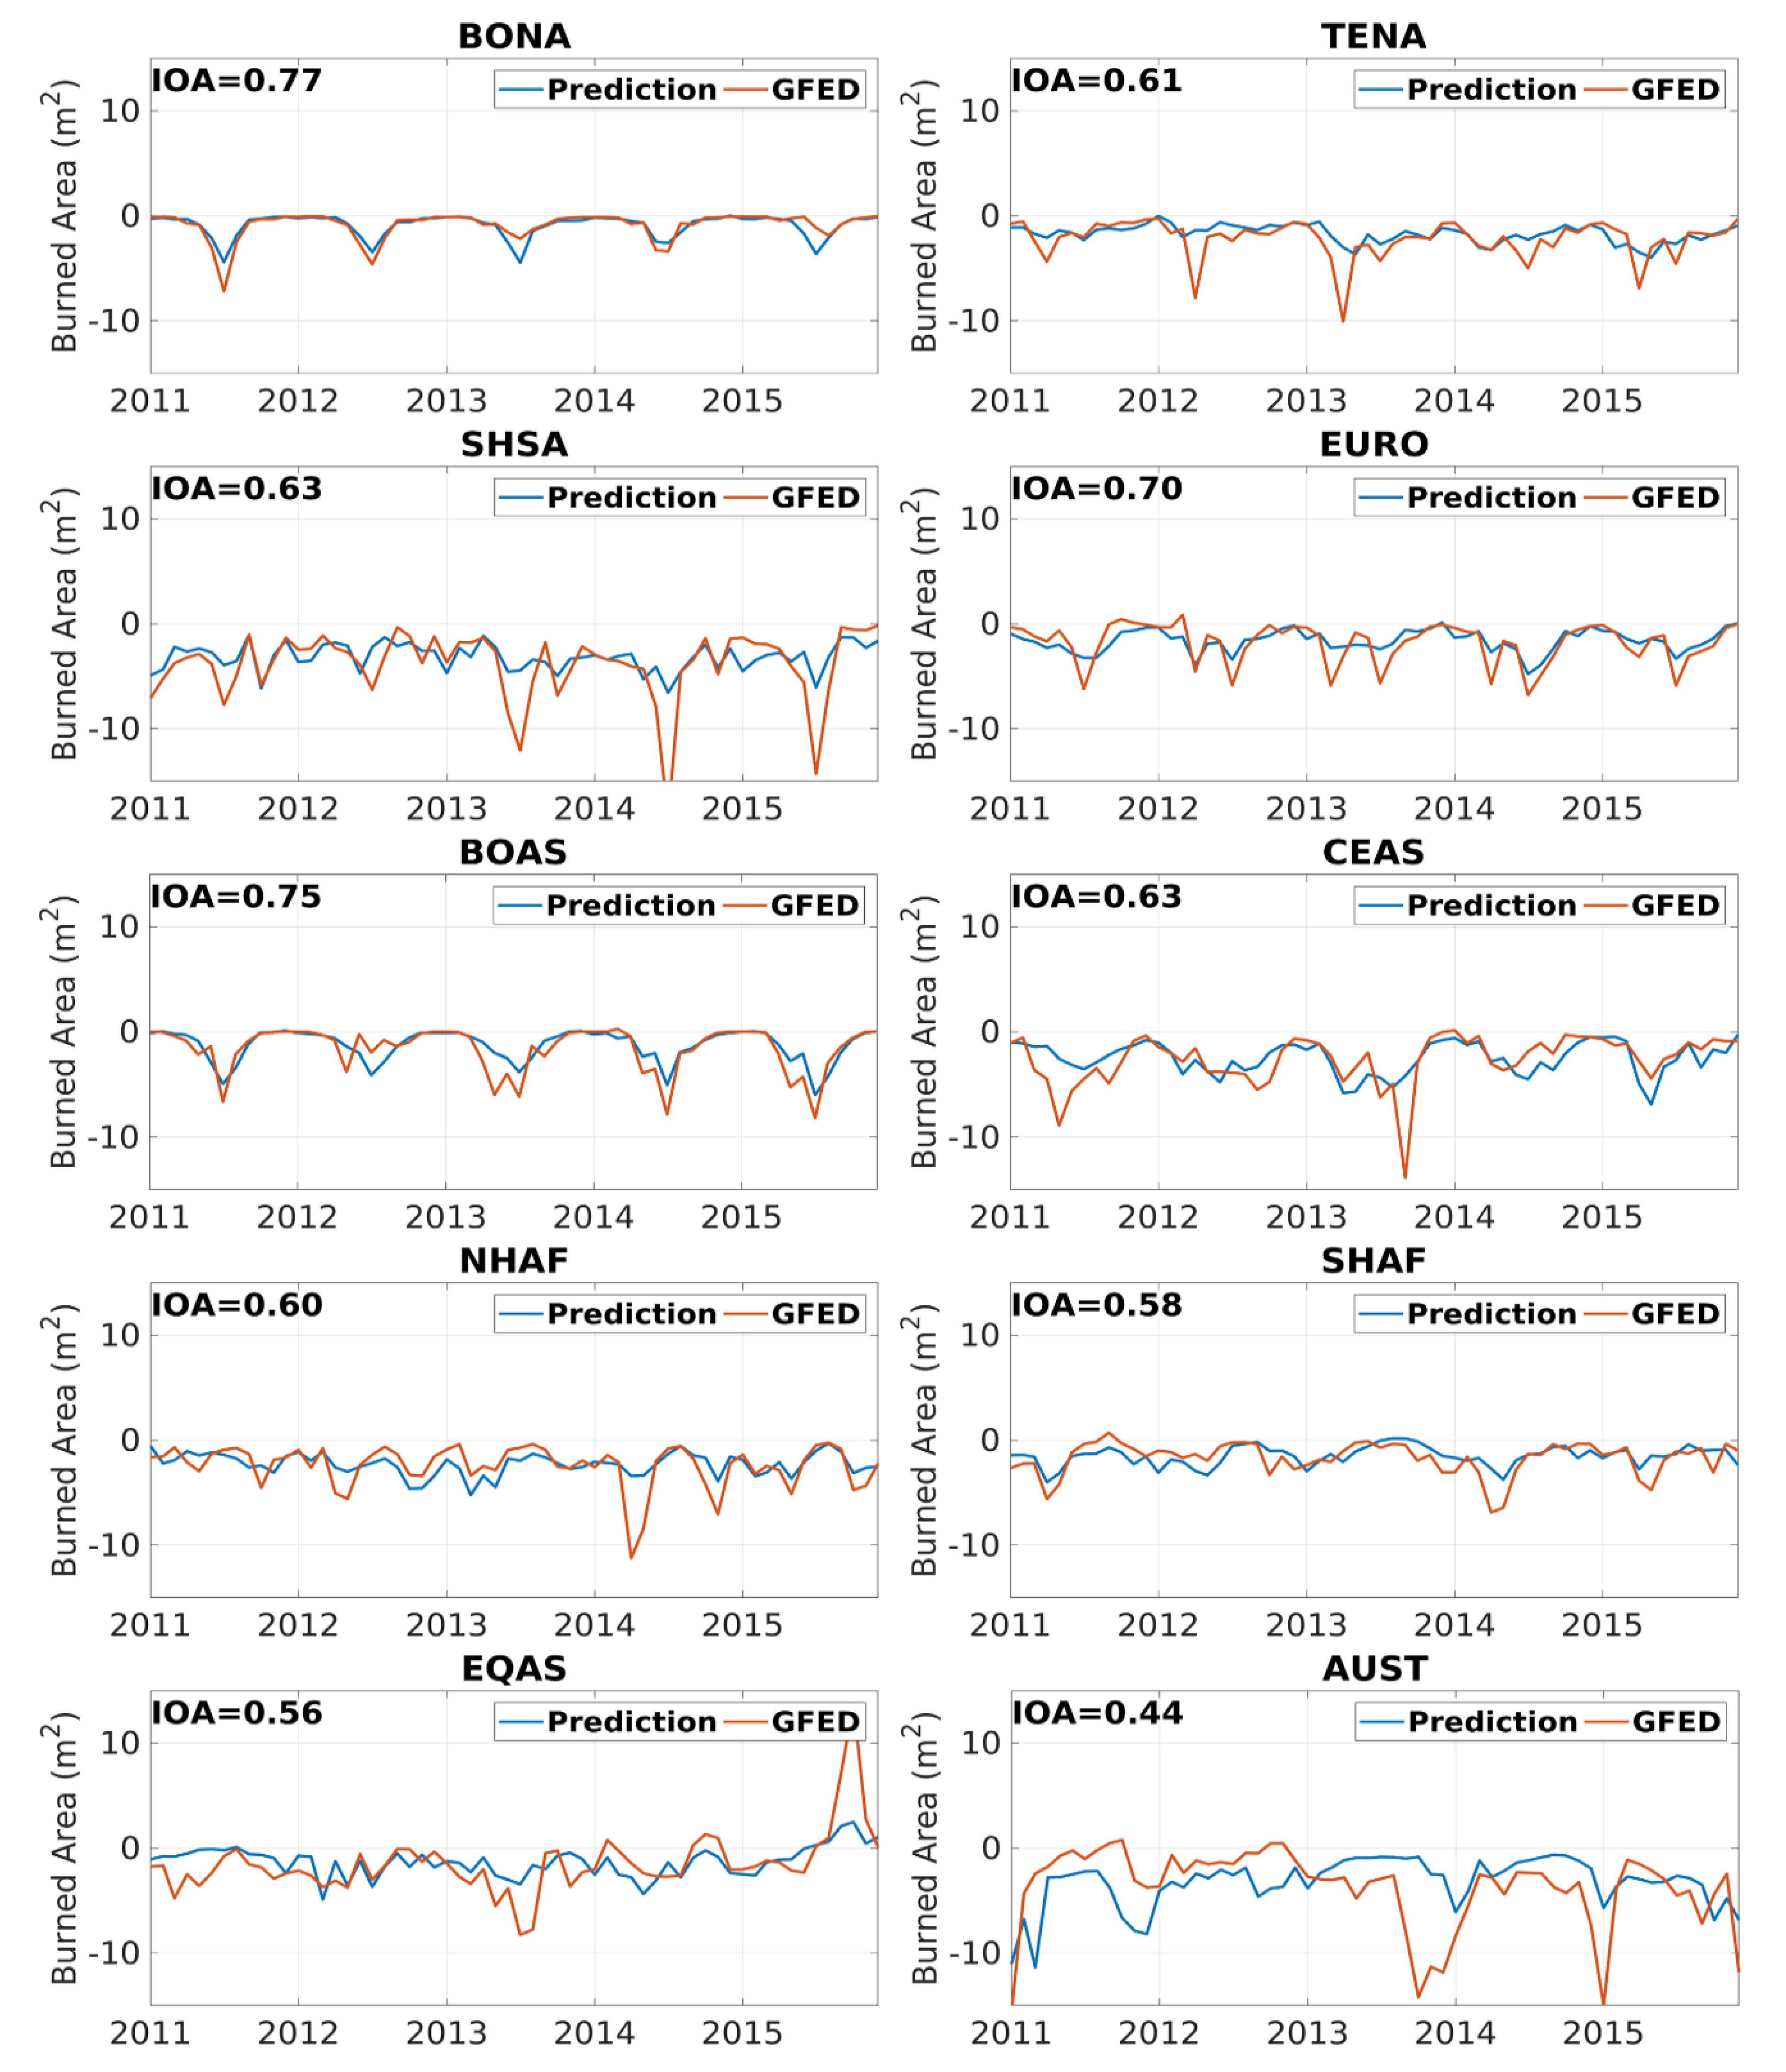
We compared the 1-year moving monthly prediction results of 2011–2015 for each fire region (Figure 1) to corresponding GFED burned area data. First, we examined the temporal variation of regional averages (Figure 3). In general, the model predicts the seasonal variations of burned area for different regions well. The regions with large burning areas are concentrated in the tropics and subtropics, e.g., northern and southern Africa, South America, and equatorial Asia. Over these regions, the yearly cycle of fire activity is clear, with a well-defined fire season corresponding to the dry season [76,77,78]. The model predicted regional monthly variation is in good agreement with the observations (IOA > 0.75). It is known that fires in equatorial Asia are strongly affected by El Niño and La Niña events over the tropical Pacific [9,61,66,67], the model prediction is fairly good (R = 0.96) when including the indices for El Niño (ONI in Table 1). An exception is Australia, where the observed burned areas are higher in 2011 and 2012 than later years, which is not simulated. Fire in Australia shows higher monthly variations than the other tropical regions and the model prediction has a lower IOA value of 0.56 relative to the GFED data. We believe that the weak seasonal cycle of Australia due to its geolocation also weakens the inherent temporal signal, which makes it harder for the prediction model. We will discuss other possible reasons in the latter section when the spatial distributions between prediction and GFED data are compared.
The seasonal variation of temperate and boreal North America, Europe, and Asia all have varying monthly peaks. In temperate regions, the predictions have IOA values in the range of 0.71–0.82, demonstrating that the model is reasonable in burned area prediction. The prediction IOA value tends to be a bit lower at 0.7 and 0.79 for boreal North America and Asia, respectively. For the boreal regions, fire predictions are not performed for snow-covered areas or when temperature is < −10 °C since fire activity is weak under these conditions (Figure S5 in the supplement).
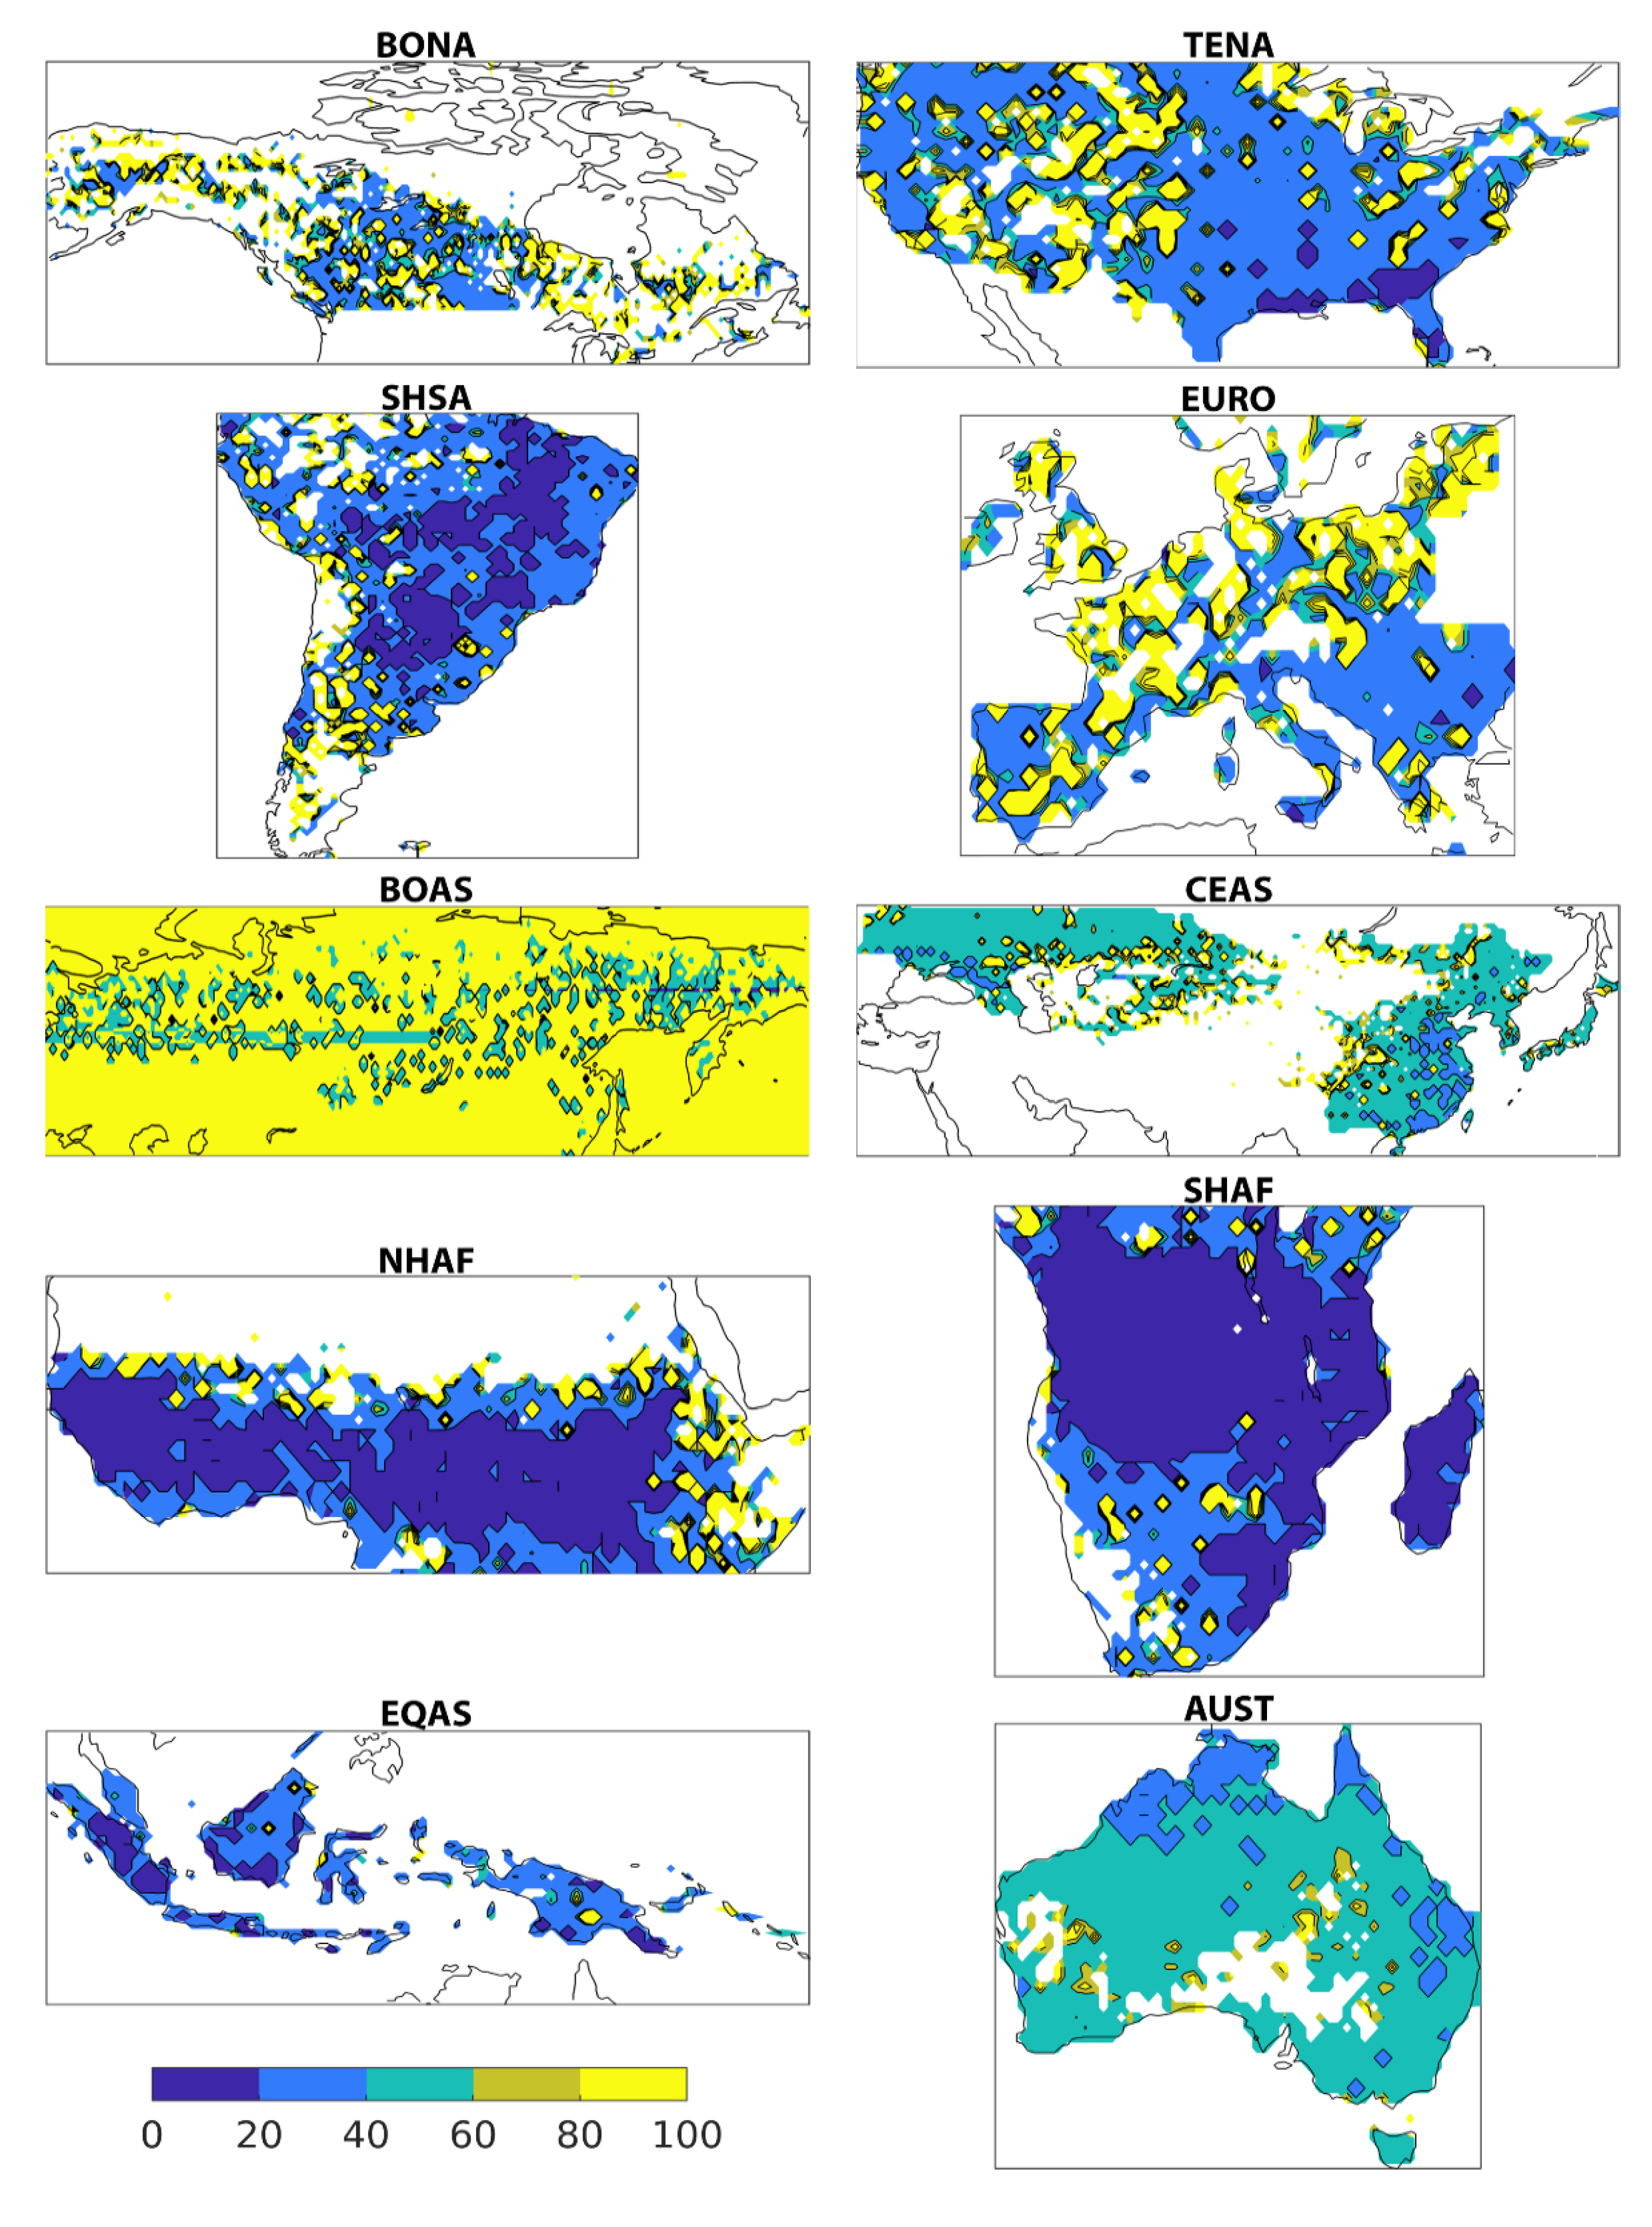
In order to find the spatial distribution of model performance for each fire region, we calculate an updated mean fractional error (MFE) [56,79] for all regions. MFEs in percentage in Figure 4 show the spatial distributions of model performance for 10 fire regions. Lower MFE (blue area) means better model performance. Our model performance is better in high-burning than low-burning regions. The model performance of South America, northern and southern Africa, and equatorial Asia are good, MFE < 20% over high burned areas in the central regions, MFE < 40% over most other regions, and MFE > 80% on edge spots. Temperate America and Europe have better model performance over the southeastern region with MFE < 40%. Boreal America and boreal Asia have better model performance over the central region with MFE < 60%. Central eastern Asia has better model performance along the east coast with MFE < 20% and Australia has better model performance over the northern coast with MFE < 20%. The spatial distributions of model performance for all regions are consistent with spatial distributions of 5-year average predictions shown later in the paper.
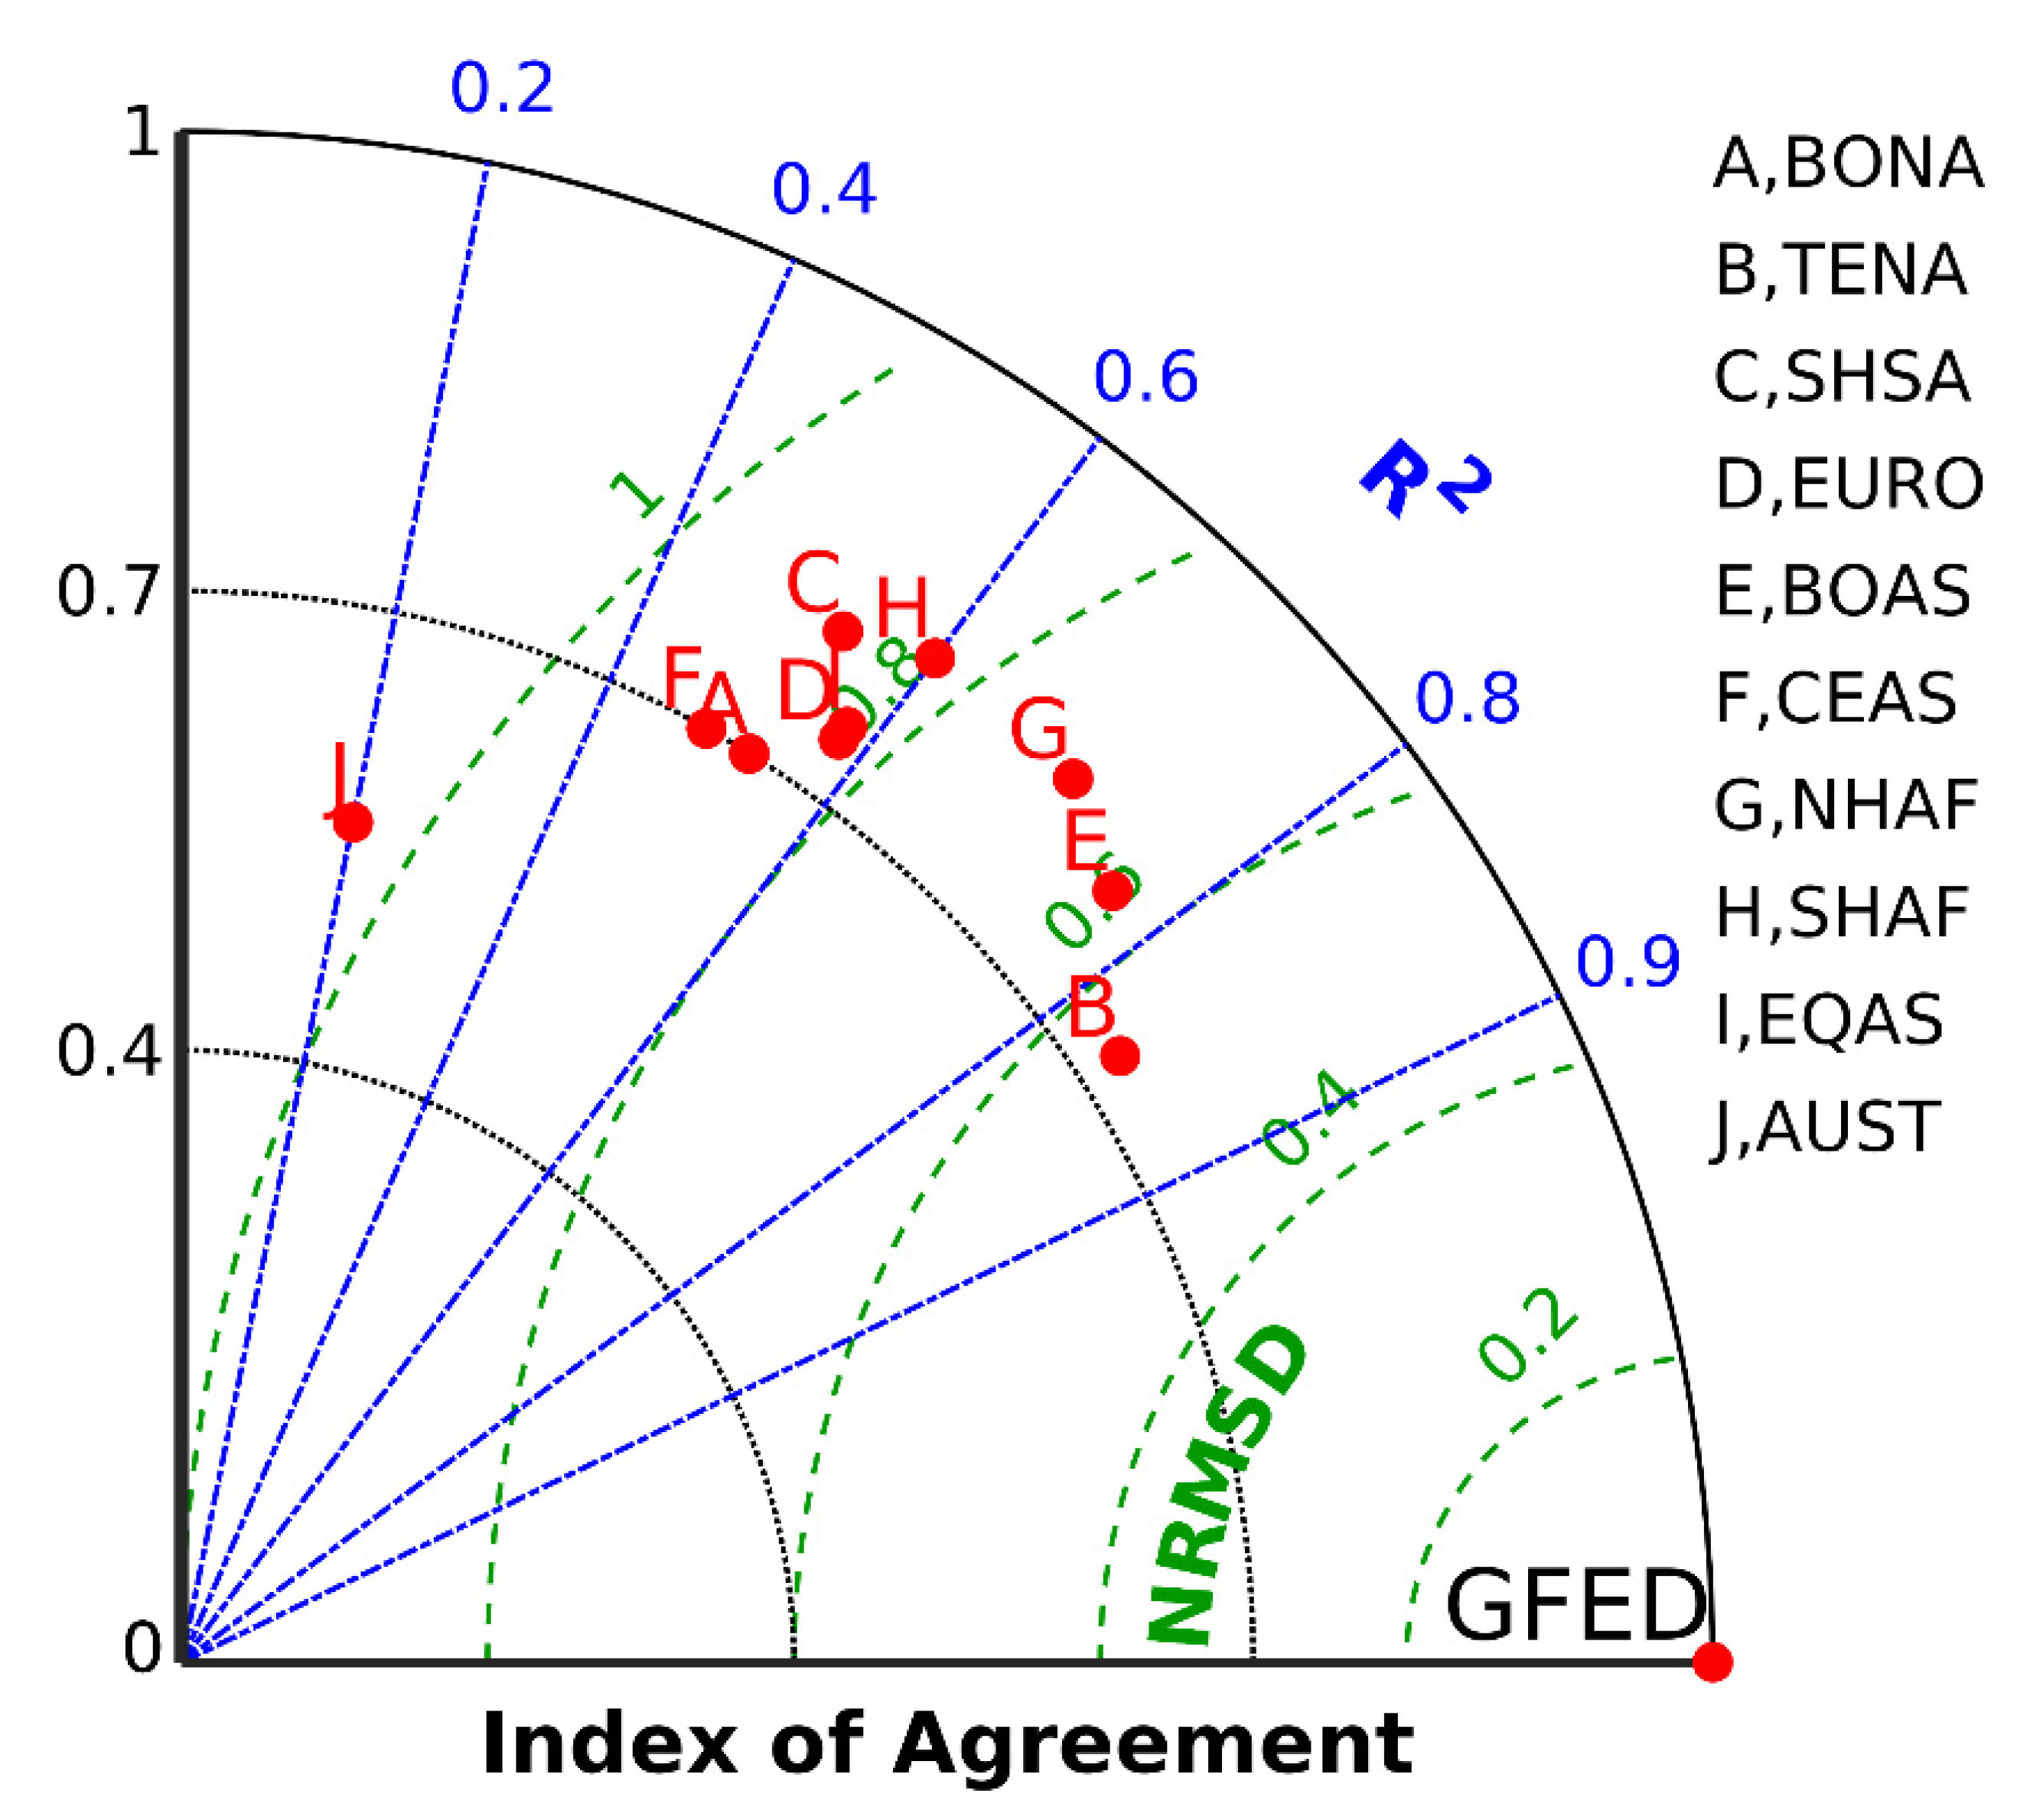
The Taylor diagram of R-square, IOA, and NRMSD of predictions for all regions is shown in Figure 5.
GFED is marked at the right end of the x-axis with perfect scores. The model prediction results over the fire regions of temperate America, northern and southern Africa, and boreal Asia are better than other regions because their performance metrics of R-square, IOA and NRMSD are closer to the GFED dot. Model prediction over Australia is the worst, and far from the GFED dot.
Figure 3 demonstrates that our model can capture well the burned area variation while the seasonal cycle is significant, especially for the regions of South America, northern and southern Africa, and equatorial Asia. For comparison purposes, we also remove the seasonal cycle by subtracting climate monthly mean values from the burned area data before performing model training and prediction to check model performance of capturing burned area interannual variability. Figure 6 shows the temporal variation of regional averages without the seasonal cycle. Relative to predictions with the seasonal cycle (Figure 3), the IOA values between prediction and GFED data in Figure 6 are generally lower for most fire regions except boreal North America. Without the seasonal cycle, IOAs of tropical and subtropical regions are reduced to 0.63, 0.6, 0.58, and 0.56 for South America, northern and southern Africa, and equatorial Asia, respectively. For temperate and boreal regions, IOAs are reduced slightly to 0.61, 0.63, 0.6, 0.7 for temperate northern America, central eastern Asia, boreal Asia, and Europe, respectively. However, one of the boreal regions, boreal northern America, has a higher IOA of 0.77. This shows that the seasonal cycle plays a more important role in burned area variation over tropical and subtropical regions than temperate and boreal regions. The IOA of Australia is also reduced slightly to 0.44, which is consistent with the insignificant seasonal cycle in Australia.
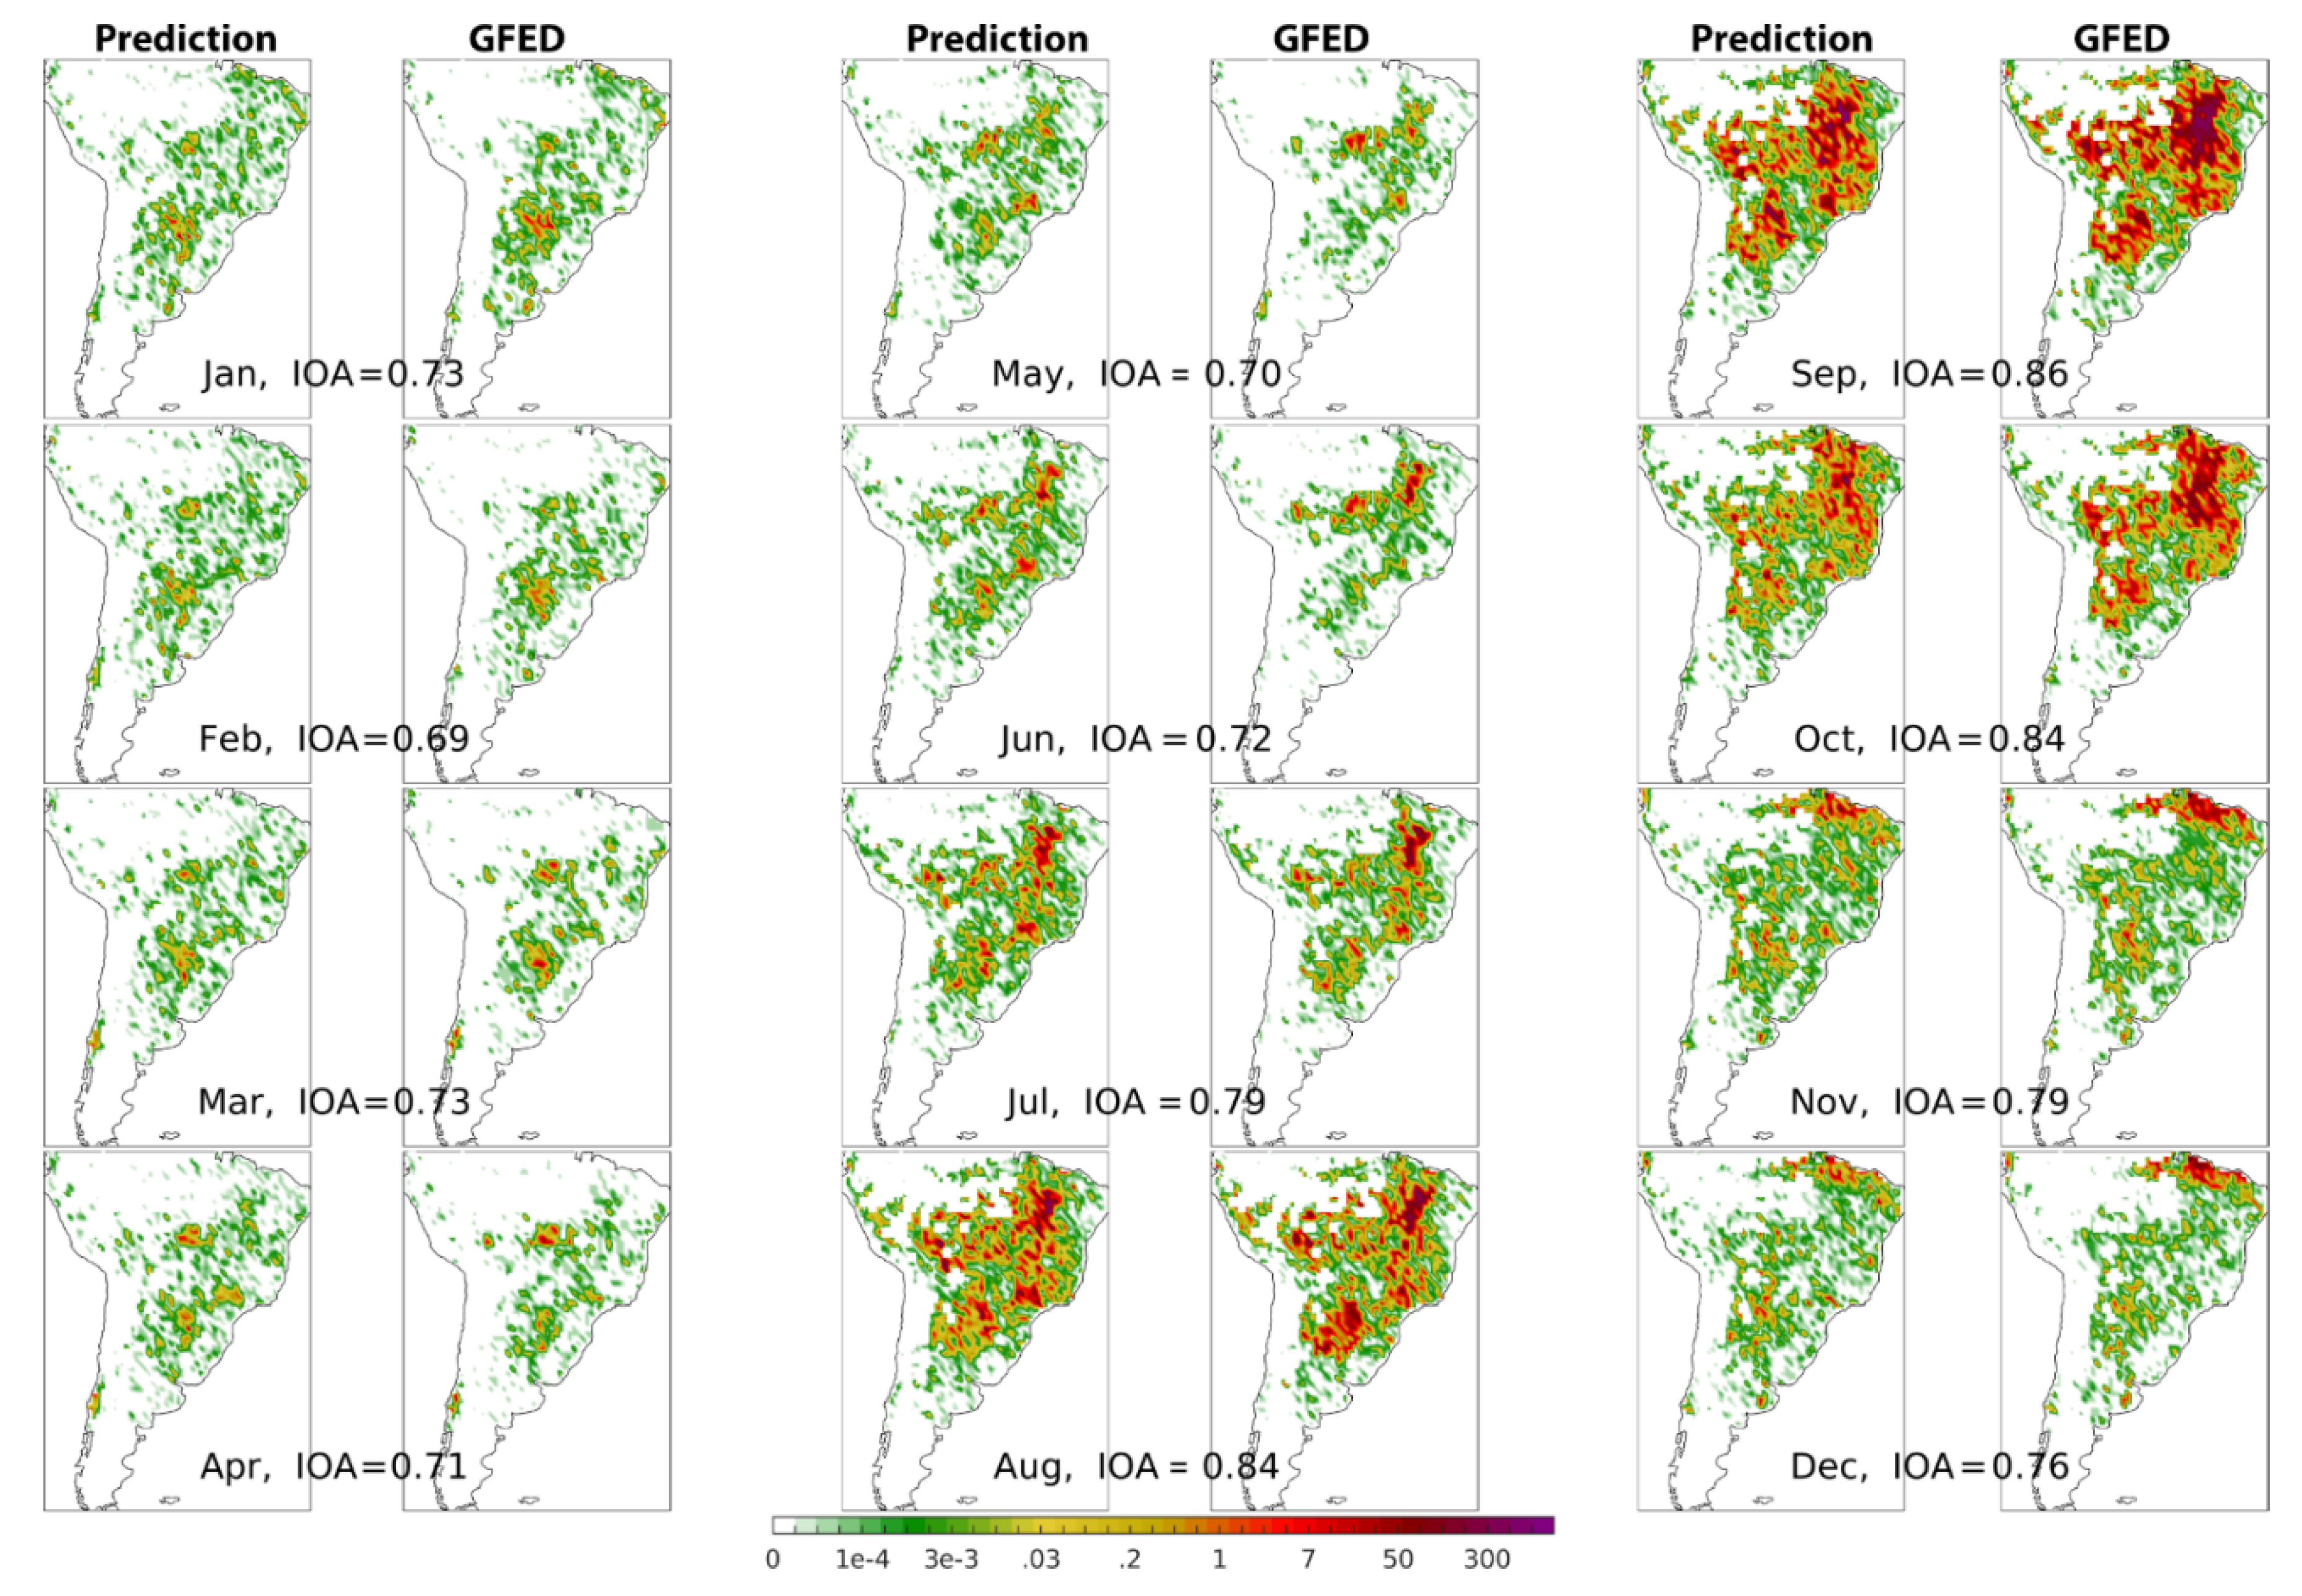
We average the monthly 1-year moving model prediction of 2011–2015 for each month and compare it to the corresponding GFED data. We show in Figure 7, Figure 8, Figure 9, Figure 10 and Figure 11 the comparisons for tropical and subtropical regions, where the total regional burned area accounts for the main portion of global fire burning. We show the comparisons for temperate and boreal northern hemisphere with and without seasonal cycle in Figures S1–S5 (in the supplement) and the spatial distribution of tropical and subtropical without the seasonal cycle in Figures S6–S10.
Over South America, large fires occur in Brazil, Bolivia, and Peru from July to October and are predicted by the model with a spatial IOA value of 0.79–0.86 (Figure 7).
Fire activities are considerably lower in November-June and the locations of high fire regions shift with season. The model predicts GFED observed changes reasonably well, with a spatial IOA value of 0.69–0.79. As we will see in other regions, the model tends to predict better when the variation of the burned area shows consistent seasonal and spatial patterns. Previous studies suggested that South American fires are affected by sea surface temperature anomaly [13,15,80]. Including both ONI and AMO indices (Table 1) in model predictors for this region may further increase the predictability of the model.
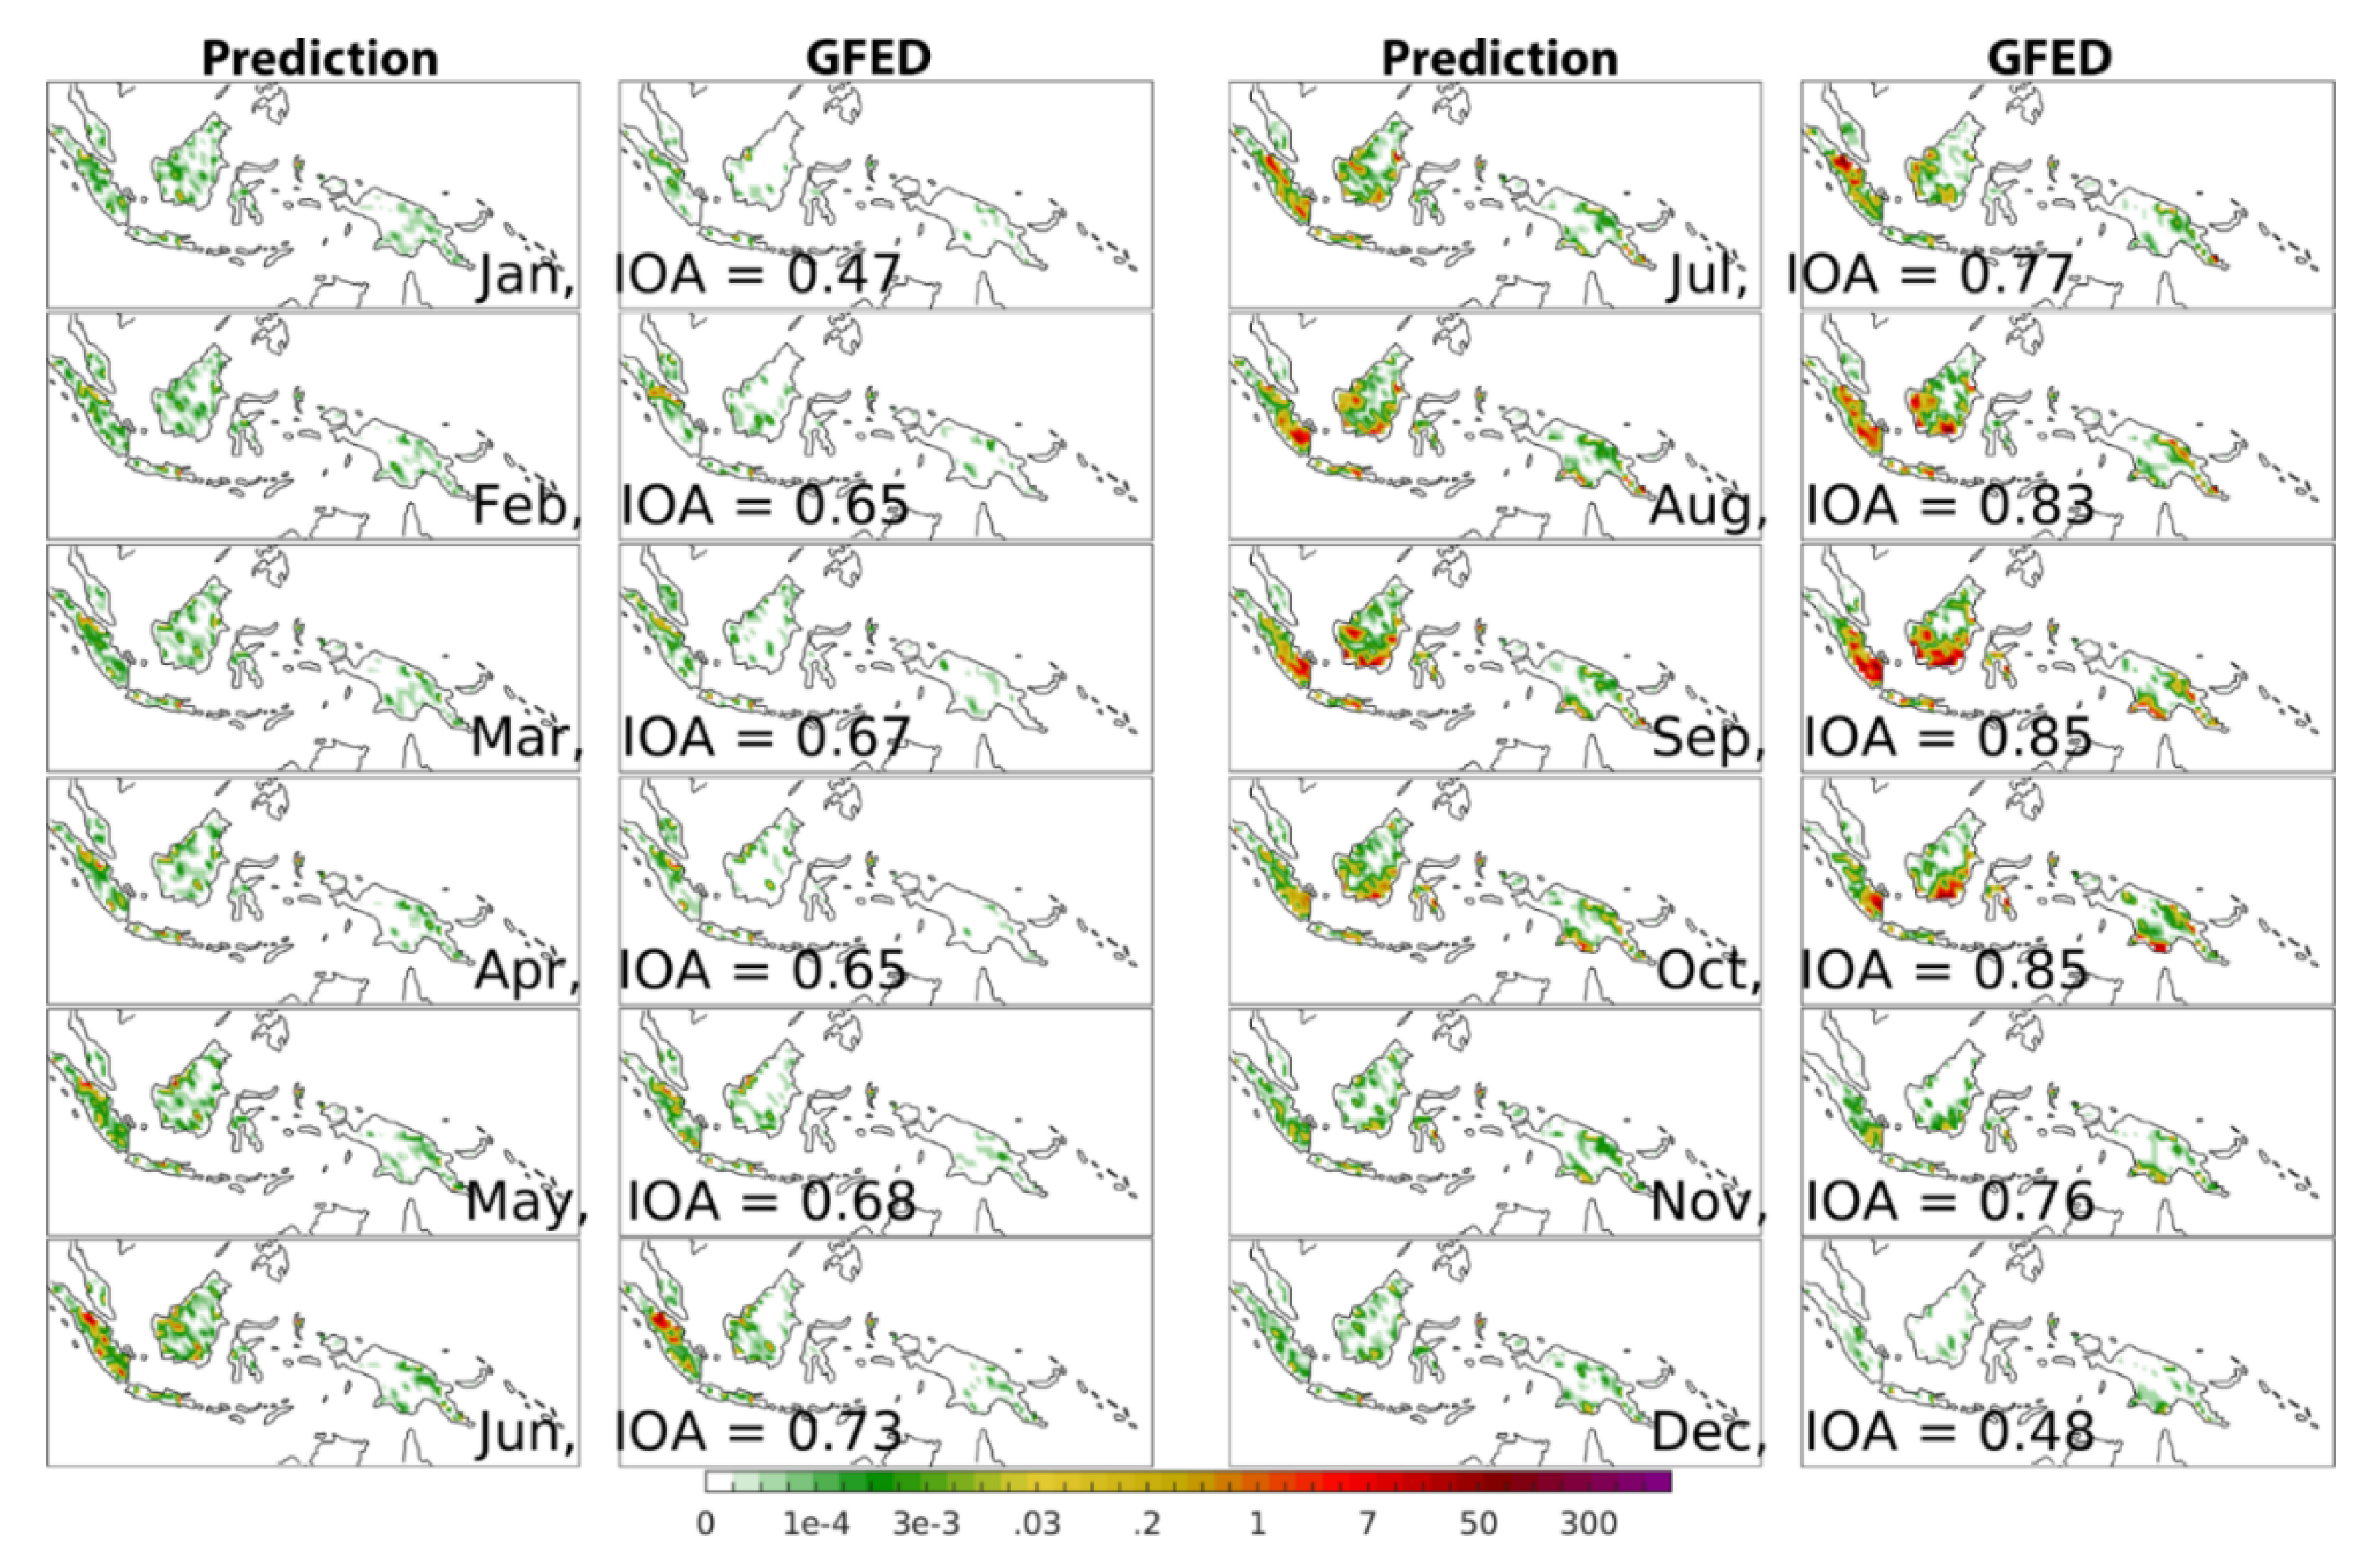
Over equatorial Asia, large fires usually occur from June to October, and the fire region shift is not as significant as South America (Figure 8).
The model prediction has a spatial IOA value of 0.73–0.85, similar to South America. In the low fire season (November–May), the prediction R value decreases to 0.47–0.76, which is also similar to South America.
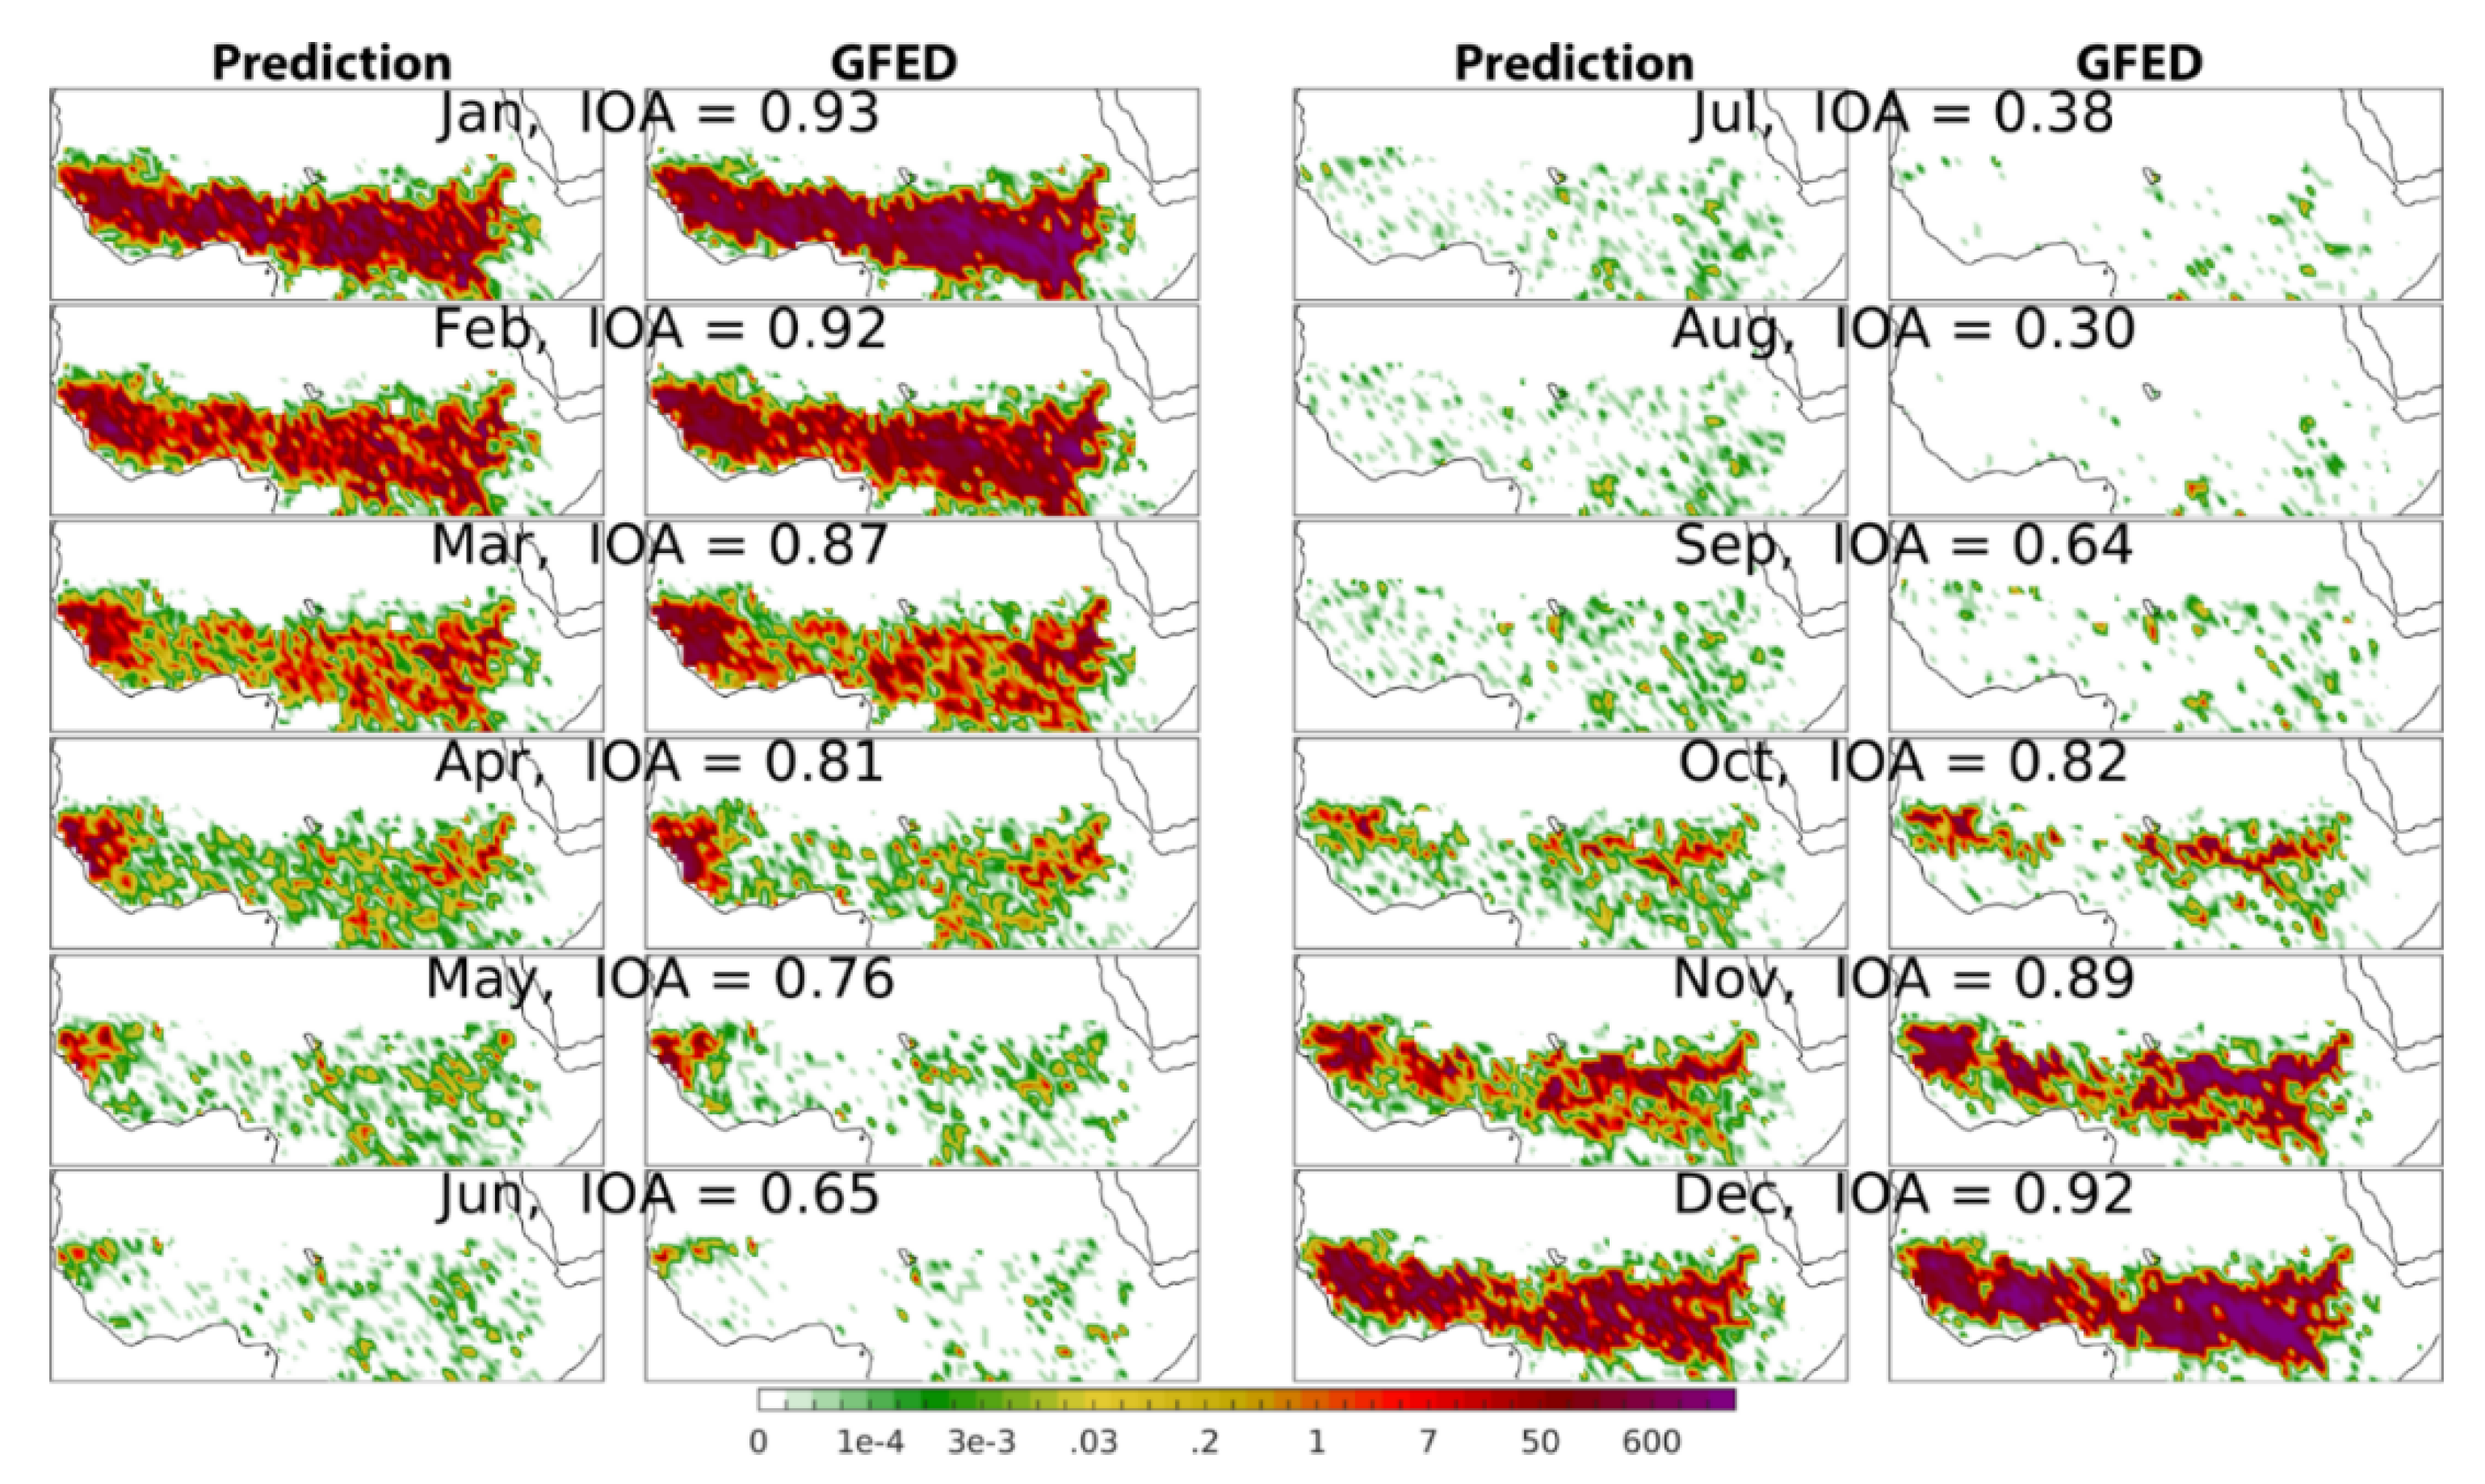
Over northern Africa, large fires occur between the equator and the Sahara Desert from November to March (Figure 9). The model prediction has a spatial IOA value of 0.87–0.93, higher than South America and equatorial Asia. In the low fire season (April–October), the prediction IOA value decreases to 0.3–0.82, similar to South America and equatorial Asia. Over southern Africa, large fires occur from May to October (Figure 10). The model prediction has similar spatial IOA values to northern Africa at 0.87–0.93 in high fire season and 0.69–0.81 in low fire season. Northern and southern Africa are the two regions with the largest wildfire burned areas in the world. The good fire predictability over northern and southern Africa is likely due to the significant fire dependence on rainfall and ecosystem type on fires over the regions [16,77,78,81]. Both parameters are selected as predictors (Table 1).
Over Australia, more fires occur from April to November than from December to March (Figure 11). The model prediction has a spatial IOA value of 0.74–0.8 in the high fire season and of 0.53–0.68 in the low fire season. Fires occur in coastal regions to the north, southeast, and southwest of Australia. Different from the other regions, the GLM model does not find a good sensitivity in either land cover or vegetation type (Table 1), which together with the weaker seasonal cycle contributes to the poorer temporal variation prediction than the other tropical and subtropical regions (Figure 3). Additional human and climate factors may also contribute to the complexity of fires in Australia, such as aboriginal hunting, El Niño and Indian Ocean Dipole events [82], and global warming [83,84]. The double peaks in austral spring and fall are unique among the tropical and subtropical regions (Figure 3), although there are some years when a smaller secondary fire peak occurs in equatorial Asia (e.g., 2014). Overall, the prediction captures the spatial variation of fires better than temporal variation (Figure 3 and Figure 11).
The spatial fire distributions over temperate and boreal regions are shown in the supplement. Fires in these regions are more temporarily varying than the tropical and subtropical regions in general and often have a secondary or tertiary peak (Figure 3). Over boreal North America (Figure S1), the spatial IOA value is 0.24–0.69, lower than the temporal IOA value of 0.7. Fires burn over larger areas in the temperate North America and the spatial correlation improves to 0.56–0.76 (Figure S2) from boreal North America, with a temporal IOA value of 0.71. Other than the low-fire season (November-February, a spatial IOA value of 0.17–0.35), the prediction in Europe has a higher spatial correlation (IOA = 0.72–0.81) with GFED than over North America (Figure S3). The prediction performance improves to a spatial IOA value of 0.79–0.82 in March-October and of 0.48–0.70 (November–February) in central Asia (Figure S4).
Compared to the reasonable prediction of fire spatial distribution of the other regions, boreal Asia proves to be difficult for the prediction model (Figure S5). However, after excluding fire prediction over snow-covered land or when temperature is below −10 °C, the model successfully predicts burned area in the winter season of December to February. From December to February, the prediction has a low spatial IOA value of <0.13 because many predicted burned area values are now excluded. The selected meteorological predictors for this region are wind speed, specific humidity, sensible heat flux, and ground heat flux, which are all continuous variables from fall to winter and from winter to spring. The ranges of winter values of the selected predictors overlap with those of spring and fall and their values do not change abruptly in winter. As a consequence, the model without additional constraints will fail to predict the step function of nearly zero-fire in winter. The model prediction has a high spatial IOA value of 0.83 and 0.8 in April and May, respectively, but the spatial IOA value is lower in the range of 0.44–0.66 in March and May-November, suggesting that other factors not included in the meteorological outputs of the CSFR model are important in determining the fire spatial distribution in the burning season of this region.
The monthly spatial IOA values of 60 months in 2011–2015 between prediction and GFED are shown in Figure S6. We can also see the signal of the seasonal cycle in spatial IOA from all regions. The tropical and subtropical regions have higher spatial IOA (up to 0.8) in fire seasons. The temperate and boreal regions have relatively low spatial IOA (up to 0.6) in fire seasons.
In addition to the 10 major fire regions, the model predictions for two relatively large fire regions of Central America and Southeast Asia are shown in Figure S7 to Figure S11. The model predictions of these two tropical regions are comparable to other tropical regions. Temporal IOA with the seasonal cycle is 0.78 and 0.81 (Figure S7), temporal IOA without seasonal cycle is 0.63 and 0.61 (Figure S8), for Central America and Southeast Asia, respectively. Spatial distributions of model performance (Figure S9) are good for these two regions. The spatial IOAs between prediction and GFED of Central America are in the range of 0.8–0.89 in the high fire months from January to June and 0.61–0.78 in the low fire months from July to December. The spatial IOAs of southeast Asia are in the range of 0.81–0.89 in the high fire months from December to May, and 0.6–0.79 in the low fire months from June to November.

4. Conclusions

In this work, we show that neural network forecast methods can provide useful outlook prediction for global fire activities when meteorological conditions are known. Using assimilated meteorological model outputs and GFEDv4s data 1 year prior to the prediction since 1997 to train the models, we apply three forecast methods, a generalized linear model, regression tree, and a neural network to produce monthly wildfire predictions. The 1-year moving monthly fire predictions of these three methods from 2011 to 2015 are evaluated with GFED data for 10 major global fire regions. The neural network method, which has been widely applied in solving nonlinear forecasting problems, has the best predictions among the three methods when the same predictor variables are used.
The prediction performance tends to be better in high-fire than low-fire seasons and the tropics and subtropics than temperate and boreal regions. In this study, fires in Australia are the most challenging to predict among the tropical and subtropical regions due to its monthly variation, which peaks in austral spring and fall. Among the northern temperate and boreal regions, fires in boreal Asia are the most challenging to predict because the prediction model fails to capture the extremely low fires in winter. In the tropical and subtropical regions, the temporal IOA between the prediction and GFED data are in the range of 0.75–0.82 except Australia (0.56) and the spatial IOA in the high-fire seasons are >0.77. In the northern temperate and boreal regions, the temporal IOA is in the range of 0.7–0.74 and the spatial IOA in high-fire seasons is in the range of 0.48–0.83.
Depending on the applications, these fire predictions can provide valuable information for long-range fire planning and management. The CFSv2 operational forecasts products of the National Center for Environmental Information already provide 9-month meteorological forecasts. Combining long-range meteorological forecast products with the neural network prediction model in this study, it is feasible to provide the global 9-month fire outlook. The uncertainties from both the prediction model and long-range meteorological forecasts need to be quantified. The uncertainty from long-range meteorological forecasts is likely larger [85,86,87]. It is conceivable that the global fire outlook forecast becomes an important part of a long-range meteorological forecast service as the quality of long-range meteorological forecast products improves, the forecast period becomes longer, and the nonlinear forecast model improves. If it is implemented with climate model results, the method can be applied for the quick assessment of the potential effects of climate change on fires.

Supplementary Materials

The following are available online at https://www.mdpi.com/2072-4292/12/14/2246/s1, Figure S1, 1-year moving monthly prediction and corresponding GFED data of burned area (km2 per 0.75 × 0.75 grid cell) averaged over 2011–2015 for boreal North America. Figure S2. Same as Figure S1 but for temperate North America. Figure S3. Same as Figure S1 but for Europe. Figure S4. Same as Figure S1 but for central Asia. Figure S5. Same as Figure S1 but for boreal Asia. Figure S6. Monthly spatial index of agreement of prediction and GFED for 10 fire regions in 2011–2015. The index of agreement between the two datasets is shown. Figure S7, Index of agreement of prediction and GFED for fire regions, Center America and Southeast Asia. Figure S8, Same as Figure S12, but with burned area without seasonal cycle. Figure S9, model performances for Center America and Southeast Asia. Figure S10, Spatial distribution comparison of prediction averaged over 2011–2015 and GFED for Center America. Figure S11, same as Figure S5, but for Southeast Asia.

Author Contributions

Y.S. and Y.W. designed the research and wrote the paper. Y.S. did the modeling and data analysis. All authors have read and agreed to the published version of the manuscript.

Funding

This work was supported by the National Science Foundation (NSF) through grant 1243220 and the NASA ACMAP program through grant 80NSSC17K0269.

Acknowledgments

We thank the high-performance computing support provided by the Computational and Information Systems Lab (CISL) of NCAR. We thank the GFED team for providing the GFED data at http://www.globalfiredata.org/.

Conflicts of Interest

The authors declare no conflict of interest.

References

  1. Liu, Y.; Goodrick, S.; Heilman, W. Wildland fire emissions, carbon, and climate: Wildfire–climate interactions. For. Ecol. Manag. 2014, 317, 80–96. [Google Scholar] [CrossRef]
  2. Herron-Thorpe, F.L.; Mount, G.H.; Emmons, L.K.; Lamb, B.K.; Jaffe, D.A.; Wigder, N.L.; Chung, S.H.; Zhang, R.; Woelfle, M.D.; Vaughan, J.K. Air quality simulations of wildfires in the Pacific Northwest evaluated with surface and satellite observations during the summers of 2007 and 2008. Atmos. Chem. Phys. 2014, 14, 12533–12551. [Google Scholar] [CrossRef] [Green Version]
  3. Miller, D.J.; Sun, K.; Zondlo, M.A.; Kanter, D.; Dubovik, O.; Welton, E.J.; Winker, D.M.; Ginoux, P. Assessing boreal forest fire smoke aerosol impacts on U.S. air quality: A case study using multiple data sets. J. Geophys. Res. Atmos. 2011, 116. [Google Scholar] [CrossRef] [Green Version]
  4. Mallia, D.V.; Lin, J.C.; Urbanski, S.; Ehleringer, J.; Nehrkorn, T. Impacts of upwind wildfire emissions on CO, CO2, and PM2.5 concentrations in Salt Lake City, Utah. J. Geophys. Res. Atmos. 2015, 120, 147–166. [Google Scholar] [CrossRef]
  5. Zou, Y.F.; Wang, Y.H.; Ke, Z.M.; Tian, H.Q.; Yang, J.; Liu, Y.Q. Development of a REgion-Specific ecosystem feedback Fire (RESFire) model in the Community Earth System Model. J. Adv. Modeling Earth Syst. 2017, 11, 417–445. [Google Scholar] [CrossRef] [Green Version]
  6. Sommers, W.T.; Loehman, R.A.; Hardy, C.C. Wild land fire emissions, carbon, and climate: Science overview and knowledge needs. For. Ecol. Manag. 2014, 317, 1–8. [Google Scholar] [CrossRef]
  7. Loehman, R.A.; Reinhardt, E.; Riley, K.L. Wildland fire emissions, carbon, and climate: Seeing the forest and the trees—A cross-scale assessment of wildfire and carbon dynamics in fire-prone, forested ecosystems. For. Ecol. Manag. 2014, 317, 9–19. [Google Scholar] [CrossRef]
  8. Paschalidou, A.K.; Kassomenos, P.A. What are the most fire-dangerous atmospheric circulations in the Eastern-Mediterranean? Analysis of the synoptic wildfire climatology. Sci. Total Environ. 2016, 539, 536–545. [Google Scholar] [CrossRef]
  9. van der Werf, G.R.; Dempewolf, J.; Trigg, S.N.; Randerson, J.T.; Kasibhatla, P.S.; Gigliof, L.; Murdiyarso, D.; Peters, W.; Morton, D.C.; Collatz, G.J.; et al. Climate regulation of fire emissions and deforestation in equatorial Asia. Proc. Natl. Acad. Sci. USA 2008, 105, 20350–20355. [Google Scholar] [CrossRef] [Green Version]
  10. Ward, D.S.; Shevliakova, E.; Malyshev, S.; Lamarque, J.F.; Wittenberg, A.T. Variability of fire emissions on interannual to multi-decadal timescales in two Earth System models. Environ. Res. Lett. 2016, 11, 125008. [Google Scholar] [CrossRef] [Green Version]
  11. Drosdowsky, W.; Wheeler, M.C. Predicting the Onset of the North Australian Wet Season with the POAMA Dynamical Prediction System. Weather Forecast. 2014, 29, 150–161. [Google Scholar] [CrossRef]
  12. Rabin, S.S.; Melton, J.R.; Lasslop, G.; Bachelet, D.; Forrest, M.; Hantson, S.; Kaplan, J.O.; Li, F.; Mangeon, S.; Ward, D.S.; et al. The Fire Modeling Intercomparison Project (FireMIP), phase 1: Experimental and analytical protocols with detailed model descriptions. Geosci. Model Dev. 2017, 10, 1175–1197. [Google Scholar] [CrossRef] [Green Version]
  13. Chen, Y.; Randerson, J.T.; Morton, D.C.; DeFries, R.S.; Collatz, G.J.; Kasibhatla, P.S.; Giglio, L.; Jin, Y.F.; Marlier, M.E. Forecasting Fire Season Severity in South America Using Sea Surface Temperature Anomalies. Science 2011, 334, 787–791. [Google Scholar] [CrossRef] [PubMed] [Green Version]
  14. Chen, Y.; Morton, D.C.; Andela, N.; Giglio, L.; Randerson, J.T. How much global burned area can be forecast on seasonal time scales using sea surface temperatures? Environ. Res. Lett. 2016, 11, 045001. [Google Scholar] [CrossRef]
  15. Chen, Y.; Randerson, J.T.; Morton, D.C. Tropical North Atlantic ocean-atmosphere interactions synchronize forest carbon losses from hurricanes and Amazon fires. Geophys. Res. Lett. 2015, 42, 6462–6470. [Google Scholar] [CrossRef] [Green Version]
  16. Archibald, S.; Roy, D.P.; van Wilgen, B.W.; Scholes, R.J. What limits fire? An examination of drivers of burnt area in Southern Africa. Glob. Chang. Biol. 2009, 15, 613–630. [Google Scholar] [CrossRef] [Green Version]
  17. Gudmundsson, L.; Rego, F.C.; Rocha, M.; Seneviratne, S.I. Predicting above normal wildfire activity in southern Europe as a function of meteorological drought. Environ. Res. Lett. 2014, 9, 084008. [Google Scholar] [CrossRef]
  18. Guo, F.T.; Su, Z.W.; Wang, G.Y.; Sun, L.; Lin, F.F.; Liu, A.Q. Wildfire ignition in the forests of southeast China: Identifying drivers and spatial distribution to predict wildfire likelihood. Appl. Geogr. 2016, 66, 12–21. [Google Scholar] [CrossRef]
  19. Finney, M.; Grenfell, I.C.; McHugh, C.W. Modeling Containment of Large Wildfires Using Generalized Linear Mixed-Model Analysis. For. Sci. 2009, 55, 249–255. [Google Scholar]
  20. Lehsten, V.; Harmand, P.; Palumbo, I.; Arneth, A. Modelling burned area in Africa. Biogeosciences 2010, 7, 3199–3214. [Google Scholar] [CrossRef] [Green Version]
  21. Bar Massada, A.; Syphard, A.D.; Stewart, S.I.; Radeloff, V.C. Wildfire ignition-distribution modelling: A comparative study in the Huron-Manistee National Forest, Michigan, USA. Int. J. Wildland Fire 2013, 22, 174–183. [Google Scholar] [CrossRef]
  22. Vilar, L.; Gomez, I.; Martinez-Vega, J.; Echavarria, P.; Riano, D.; Martin, P. Multitemporal Modelling of Socio-Economic Wildfire Drivers in Central Spain between the 1980s and the 2000s: Comparing Generalized Linear Models to Machine Learning Algorithms. PLoS ONE 2016, 11, e0161344. [Google Scholar] [CrossRef] [PubMed] [Green Version]
  23. Song, C.; Kwan, M.P.; Zhu, J.P. Modeling Fire Occurrence at the City Scale: A Comparison between Geographically Weighted Regression and Global Linear Regression. Int. J. Environ. Res. Public Health 2017, 14, 396. [Google Scholar] [CrossRef] [PubMed] [Green Version]
  24. Heaney, K.D.; Rowe, W.F. The application of linear-regression to range-of-fire estimates based on the spread of shotgun pellet patterns. J. Forensic Sci. 1983, 28, 433–436. [Google Scholar] [CrossRef]
  25. Amatulli, G.; Rodrigues, M.J.; Trombetti, M.; Lovreglio, R. Assessing long-term fire risk at local scale by means of decision tree technique. J. Geophys. Res. Biogeosc. 2006, 111. [Google Scholar] [CrossRef] [Green Version]
  26. Miquelajauregui, Y.; Cumming, S.G.; Gauthier, S. Modelling Variable Fire Severity in Boreal Forests: Effects of Fire Intensity and Stand Structure. PLoS ONE 2016, 11, e0150073. [Google Scholar] [CrossRef]
  27. Salehi, M.; Rusu, L.I.; Lynar, T.; Phan, A. Dynamic and Robust Wildfire Risk Prediction System. In Proceedings of the 22nd ACM SIGKDD International Conference on Knowledge Discovery and Data Mining—KDD ‘16, San Francisco, CA, USA, 13–17 August 2016; pp. 245–254. [Google Scholar]
  28. Rodriguez-Aseretto, D.; de Rigo, D.; Di Leo, M.; Cortes, A.; San-Miguel-Ayanz, J. A data-driven model for large wildfire behaviour prediction in Europe. Procedia Comput. Sci. 2013, 18, 1861–1870. [Google Scholar] [CrossRef] [Green Version]
  29. Reid, C.E.; Jerrett, M.; Tager, I.B.; Petersen, M.L.; Mann, J.K.; Balmes, J.R. Differential respiratory health effects from the 2008 northern California wildfires: A spatiotemporal approach. Enviorn. Res. 2016, 150, 227–235. [Google Scholar] [CrossRef] [Green Version]
  30. Reid, C.E.; Jerrett, M.; Petersen, M.L.; Pfister, G.G.; Morefield, P.E.; Tager, I.B.; Raffuse, S.M.; Balmes, J.R. Spatiotemporal Prediction of Fine Particulate Matter During the 2008 Northern California Wildfires Using Machine Learning. Environ. Sci. Technol. 2015, 49, 3887–3896. [Google Scholar] [CrossRef]
  31. San-Miguel-Ayanz, J.; Schulte, E.; Schmuck, G.; Camia, A. The European Forest Fire Information System in the context of environmental policies of the European Union. For. Policy Econ. 2013, 29, 19–25. [Google Scholar] [CrossRef]
  32. de Souza, F.T.; Koerner, T.; Chlad, R. A data-based model for predicting wildfires in Chapada das Mesas National Park in the State of Maranho. Environ. Earth Sci. 2015, 74, 3603–3611. [Google Scholar] [CrossRef]
  33. Guo, C.; Berkhahn, F. Entity Embeddings of Categorical Variables. arXiv 2016, arXiv:Abs/1604.06737. [Google Scholar]
  34. Safi, Y.; Bouroumi, A. Prediction of forest fires using Artificial neural networks. Appl. Math. Sci. 2013, 7, 271–286. [Google Scholar] [CrossRef]
  35. Sevinc, V.; Kucuk, O.; Goltas, M. A Bayesian network model for prediction and analysis of possible forest fire causes. For. Ecol. Manag. 2020, 457, 117723. [Google Scholar] [CrossRef]
  36. Yu, Y.; Omar, R.; Harrison, R.; Sammathuria, M.; Nik, A.R. Pattern clustering of forest fires based on meteorological variables and its classification using hybrid data mining methods. J. Comput. Biol. Bioinfomatics Res. 2011, 3, 47–52. [Google Scholar]
  37. Castelli, M.; Vanneschi, L.; Popovič, A. Predicting Burned Areas of Forest Fires: An Artificial Intelligence Approach. Fire Ecol. 2015, 11, 106–118. [Google Scholar] [CrossRef]
  38. Alberg, D. An Interval Tree Approach to Predict Forest Fires using Meteorological Data. Int. J. Comput. Appl. 2015, 132, 17–22. [Google Scholar] [CrossRef]
  39. Mayr, M.J.; Vanselow, K.A.; Samimi, C. Fire regimes at the arid fringe: A 16-year remote sensing perspective (2000–2016) on the controls of fire activity in Namibia from spatial predictive models. Ecol. Indic. 2018, 91, 324–337. [Google Scholar] [CrossRef]
  40. Kozik, V.; Nezhevenko, E.; Feoktistov, A. Studying the method of adaptive prediction of forest fire evolution on the basis of recurrent neural networks. Optoelectron. Instrum. Data Process. 2014, 50, 395–401. [Google Scholar] [CrossRef]
  41. Lin, G.; Milan, A.; Shen, C.; Reid, I.D. RefineNet: Multi-path Refinement Networks for High-Resolution Semantic Segmentation. In Proceedings of the IEEE Conference on Computer Vision and Pattern Recognition; 2017; pp. 5168–5177. Available online: https://arxiv.org/abs/1611.06612 (accessed on 13 July 2020).
  42. Cortez, P.; Morais, A. A Data Mining Approach to Predict Forest Fires using Meteorological Data; 2007; Available online: http://www3.dsi.uminho.pt/pcortez/fires.pdf (accessed on 13 July 2020).
  43. Liang, H.; Zhang, M.; Wang, H. A Neural Network Model for Wildfire Scale Prediction Using Meteorological Factors. IEEE Access 2019, 7, 176746–176755. [Google Scholar] [CrossRef]
  44. Xie, Y.; Peng, M. Forest fire forecasting using ensemble learning approaches. Neural Comput. Appl. 2019, 31, 4541–4550. [Google Scholar] [CrossRef]
  45. Makridakis, S.; Spiliotis, E.; Assimakopoulos, V. The M4 Competition: Results, findings, conclusion and way forward. Int. J. Forecast. 2018, 34, 802–808. [Google Scholar] [CrossRef]
  46. Saha, S.; Moorthi, S.; Wu, X.; Wang, J.; Nadiga, S.; Tripp, P.; Behringer, D.; Hou, Y.-T.; Chuang, H.-y.; Iredell, M.; et al. The NCEP Climate Forecast System Version 2. J. Clim. 2014, 27, 2185–2208. [Google Scholar] [CrossRef]
  47. Randerson, J.T.; Chen, Y.; van der Werf, G.R.; Rogers, B.M.; Morton, D.C. Global burned area and biomass burning emissions from small fires. J. Geophys. Res. Biogeosci. 2012, 117, 23. [Google Scholar] [CrossRef]
  48. Saha, S.; Moorthi, S.; Pan, H.L.; Wu, X.R.; Wang, J.D.; Nadiga, S.; Tripp, P.; Kistler, R.; Woollen, J.; Behringer, D.; et al. The NCEP climate forecast system reanalysis. Bull. Amer. Meteorol. Soc. 2010, 91, 1015–1057. [Google Scholar] [CrossRef]
  49. Chen, W.Y.; Van den Dool, H. Sensitivity of Teleconnection Patterns to the Sign of Their Primary Action Center. Mon. Weather Rev. 2003, 131, 2885–2899. [Google Scholar] [CrossRef]
  50. Liu, J.; Tang, W.; Chen, G.; Lu, Y.; Feng, C.; Tu, X.M. Correlation and agreement: Overview and clarification of competing concepts and measures. Shanghai Arch Psychiatry 2016, 28, 115–120. [Google Scholar] [CrossRef]
  51. Yang, J.M.; Yang, J.Y.; Liu, S.; Hoogenboom, G. An evaluation of the statistical methods for testing the performance of crop models with observed data. Agric. Syst. 2014, 127, 81–89. [Google Scholar] [CrossRef]
  52. Shen, M.; Chen, J.; Zhuan, M.; Chen, H.; Xu, C.-Y.; Xiong, L. Estimating uncertainty and its temporal variation related to global climate models in quantifying climate change impacts on hydrology. J. Hydrol. 2018, 556, 10–24. [Google Scholar] [CrossRef]
  53. Nash, J.E.; Sutcliffe, J.V. River flow forecasting through conceptual models part I—A discussion of principles. J. Hydrol. 1970, 10, 9. [Google Scholar] [CrossRef]
  54. Mielke, P.W.; Berry, K.J. Permutation Methods A Distance Function Approach Introduction. In Permutation Methods: A Distance Function Approach, 2nd ed.; Springer Science & Business Media: Berlin, Germany, 2007; pp. 1–10. [Google Scholar]
  55. Legates, D.R.; McCabe, G.J. Evaluating the use of “goodness-of-fit” measures in hydrologic and hydroclimatic model validation. Water Resour. Res. 1999, 35, 233–241. [Google Scholar] [CrossRef]
  56. Boylan, J.W.; Russell, A.G. PM and light extinction model performance metrics, goals, and criteria for three-dimensional air quality models. Atmos. Environ. 2006, 40, 4946–4959. [Google Scholar] [CrossRef]
  57. Ghim, Y.S.; Choi, Y.; Kim, S.; Bae, C.H.; Park, J.; Shin, H.J. Evaluation of Model Performance for Forecasting Fine Particle Concentrations in Korea. Aerosol Air Qual. Res. 2017, 17, 1856–1864. [Google Scholar] [CrossRef]
  58. Boadi, C.; Harvey, S.K.; Gyeke-dako, A. Modelling of fire count data: Fire disaster risk in Ghana. SpringerPlus 2015, 4, 794. [Google Scholar] [CrossRef] [PubMed] [Green Version]
  59. Papadopoulos, A.; Paschalidou, A.K.; Kassomenos, P.A.; McGregor, G. On the association between synoptic circulation and wildfires in the Eastern Mediterranean. Theor. Appl. Climatol. 2014, 115, 483–501. [Google Scholar] [CrossRef]
  60. Jiang, Y.Y.; Zhuang, Q.L.; Mandallaz, D. Modeling Large Fire Frequency and Burned Area in Canadian Terrestrial Ecosystems with Poisson Models. Environ. Model. Assess. 2012, 17, 483–493. [Google Scholar] [CrossRef]
  61. Giglio, L.; Randerson, J.T.; van der Werf, G.R. Analysis of daily, monthly, and annual burned area using the fourth-generation global fire emissions database (GFED4). J. Geophys. Res. Biogeosci. 2013, 118, 317–328. [Google Scholar] [CrossRef] [Green Version]
  62. Flannigan, M.D.; Krawchuk, M.A.; de Groot, W.J.; Wotton, B.M.; Gowman, L.M. Implications of changing climate for global wildland fire. Int. J. Wildland Fire 2009, 18, 483–507. [Google Scholar] [CrossRef]
  63. Frolking, S.; Talbot, J.; Jones, M.C.; Treat, C.C.; Kauffman, J.B.; Tuittila, E.S.; Roulet, N. Peatlands in the Earth’s 21st century climate system. Environ. Rev. 2011, 19, 371–396. [Google Scholar] [CrossRef]
  64. Westerling, A.L.; Bryant, B.P. Climate change and wildfire in California. Clim. Chang. 2008, 87, S231–S249. [Google Scholar] [CrossRef]
  65. Papadopoulos, A.; Paschalidou, A.K.; Kassomenos, P.A.; McGregor, G. Investigating the relationship of meteorological/climatological conditions and wildfires in Greece. Theor. Appl. Climatol. 2013, 112, 113–126. [Google Scholar] [CrossRef]
  66. Kim, P.S.; Jacob, D.J.; Mickley, L.J.; Koplitz, S.N.; Marlier, M.E.; DeFries, R.S.; Myers, S.S.; Chew, B.N.; Mao, Y.H.H. Sensitivity of population smoke exposure to fire locations in Equatorial Asia. Atmos. Environ. 2015, 102, 11–17. [Google Scholar] [CrossRef]
  67. Crippa, P.; Castruccio, S.; Archer-Nicholls, S.; Lebron, G.B.; Kuwata, M.; Thota, A.; Sumin, S.; Butt, E.; Wiedinmyer, C.; Spracklen, D.V. Population exposure to hazardous air quality due to the 2015 fires in Equatorial Asia. Sci. Rep. 2016, 6, 1–9. [Google Scholar] [CrossRef] [PubMed] [Green Version]
  68. Ruddell, B.L.; Kumar, P. Ecohydrologic process networks: 2. Analysis and characterization. Water Resour. Res. 2009, 45. [Google Scholar] [CrossRef]
  69. Ruddell, B.L.; Kumar, P. Ecohydrologic process networks: 1. Identification. Water Resour. Res. 2009, 45. [Google Scholar] [CrossRef]
  70. Imada, A. A Literature Review: Forest Management with Neural Network and Artificial Intelligence. In Neural Networks and Artificial Intelligence; Springer: Cham, Switzerland, 2014; Volume 440, pp. 9–21. [Google Scholar]
  71. Dimuccio, L.A.; Ferreira, R.; Cunha, L.; de Almeida, A.C. Regional forest-fire susceptibility analysis in central Portugal using a probabilistic ratings procedure and artificial neural network weights assignment. Int. J. Wildland Fire 2011, 20, 776–791. [Google Scholar] [CrossRef]
  72. Hagan, M.T.; Demuth, H.B.; Beale, M.; De Jesús, O. Neural Network Design; Martin, H., Ed.; 2014; Available online: https://hagan.okstate.edu/NNDesign.pdf (accessed on 13 July 2020).
  73. Hagan, M.T.; Menhaj, M.B. Training feedforward networks with the marquardt algorithm. IEEE Trans. Neural Netw. 1994, 5, 989–993. [Google Scholar] [CrossRef] [PubMed]
  74. Vasilakos, C.; Kalabokidis, K.; Hatzopoulos, J.; Matsinos, I. Identifying wildland fire ignition factors through sensitivity analysis of a neural network. Nat. Hazards 2009, 50, 125–143. [Google Scholar] [CrossRef]
  75. Li, L.M.; Song, W.G.; Ma, J.; Satoh, K. Artificial neural network approach for modeling the impact of population density and weather parameters on forest fire risk. Int. J. Wildland Fire 2009, 18, 640–647. [Google Scholar] [CrossRef]
  76. Tosca, M.G.; Diner, D.J.; Garay, M.J.; Kalashnikova, O.V. Human-caused fires limit convection in tropical Africa: First temporal observations and attribution. Geophys. Res. Lett. 2015, 42, 6492–6501. [Google Scholar] [CrossRef]
  77. Attorre, F.; Govender, N.; Hausmann, A.; Farcomeni, A.; Guillet, A.; Scepi, E.; Smit, I.P.J.; Vitale, M. Assessing the effect of management changes and environmental features on the spatio-temporal pattern of fire in an African Savanna Fire spatio-temporal pattern. J. Nat. Conserv. 2015, 28, 1–10. [Google Scholar] [CrossRef]
  78. Strydom, S.; Savage, M.J. A spatio-temporal analysis of fires in South Africa. S. Afr. J. Sci. 2016, 112, 8. [Google Scholar] [CrossRef] [Green Version]
  79. Zhang, H.L.; Chen, G.; Hu, J.L.; Chen, S.H.; Wiedinmyer, C.; Kleeman, M.; Ying, Q. Evaluation of a seven-year air quality simulation using the Weather Research and Forecasting (WRF)/Community Multiscale Air Quality (CMAQ) models in the eastern United States. Sci. Total Environ. 2014, 473, 275–285. [Google Scholar] [CrossRef] [PubMed]
  80. Chen, Y.; Morton, D.C.; Jin, Y.F.; Collatz, G.J.; Kasibhatla, P.S.; van der Werf, G.R.; DeFries, R.S.; Randerson, J.T. Long-term trends and interannual variability of forest, savanna and agricultural fires in South America. Carbon Manag. 2014, 5, 108. [Google Scholar] [CrossRef]
  81. Lehsten, V.; Tansey, K.; Balzter, H.; Thonicke, K.; Spessa, A.; Weber, U.; Smith, B.; Arneth, A. Estimating carbon emissions from African wildfires. Biogeosciences 2009, 6, 349–360. [Google Scholar] [CrossRef] [Green Version]
  82. Cai, W.; Cowan, T.; Raupach, M. Positive Indian Ocean Dipole events precondition southeast Australia bushfires. Geophys. Res. Lett. 2009, 36, 6. [Google Scholar] [CrossRef]
  83. Williams, A.A.J.; Karoly, D.J.; Tapper, N. The sensitivity of Australian fire danger to climate change. Clim. Chang. 2001, 49, 171–191. [Google Scholar] [CrossRef]
  84. King, K.J.; de Ligt, R.M.; Cary, G.J. Changes in fire and carbon dynamics for projected future climates in the south eastern Australian high country. In Proceedings of the 18th World Imacs Congress and Modsim09 International Congress on Modelling and Simulation: Interfacing Modelling and Simulation with Mathematical and Computational Sciences, Cairns, Australia, 13–17 July 2009; pp. 2569–2575. [Google Scholar]
  85. Doblas-Reyes, F.J.; Weisheimer, A.; Deque, M.; Keenlyside, N.; McVean, M.; Murphy, J.M.; Rogel, P.; Smith, D.; Palmer, T.N. Addressing model uncertainty in seasonal and annual dynamical ensemble forecasts. Q. J. R. Meteorol. Soc. 2009, 135, 1538–1559. [Google Scholar] [CrossRef] [Green Version]
  86. Mo, K.C.; Shukla, S.; Lettenmaier, D.P.; Chen, L.C. Do Climate Forecast System (CFSv2) forecasts improve seasonal soil moisture prediction? Geophys. Res. Lett. 2012, 39, 6. [Google Scholar] [CrossRef]
  87. Strobach, E.; Bel, G. Improvement of climate predictions and reduction of their uncertainties using learning algorithms. Atmos. Chem. Phys. 2015, 15, 8631–8641. [Google Scholar] [CrossRef] [Green Version]
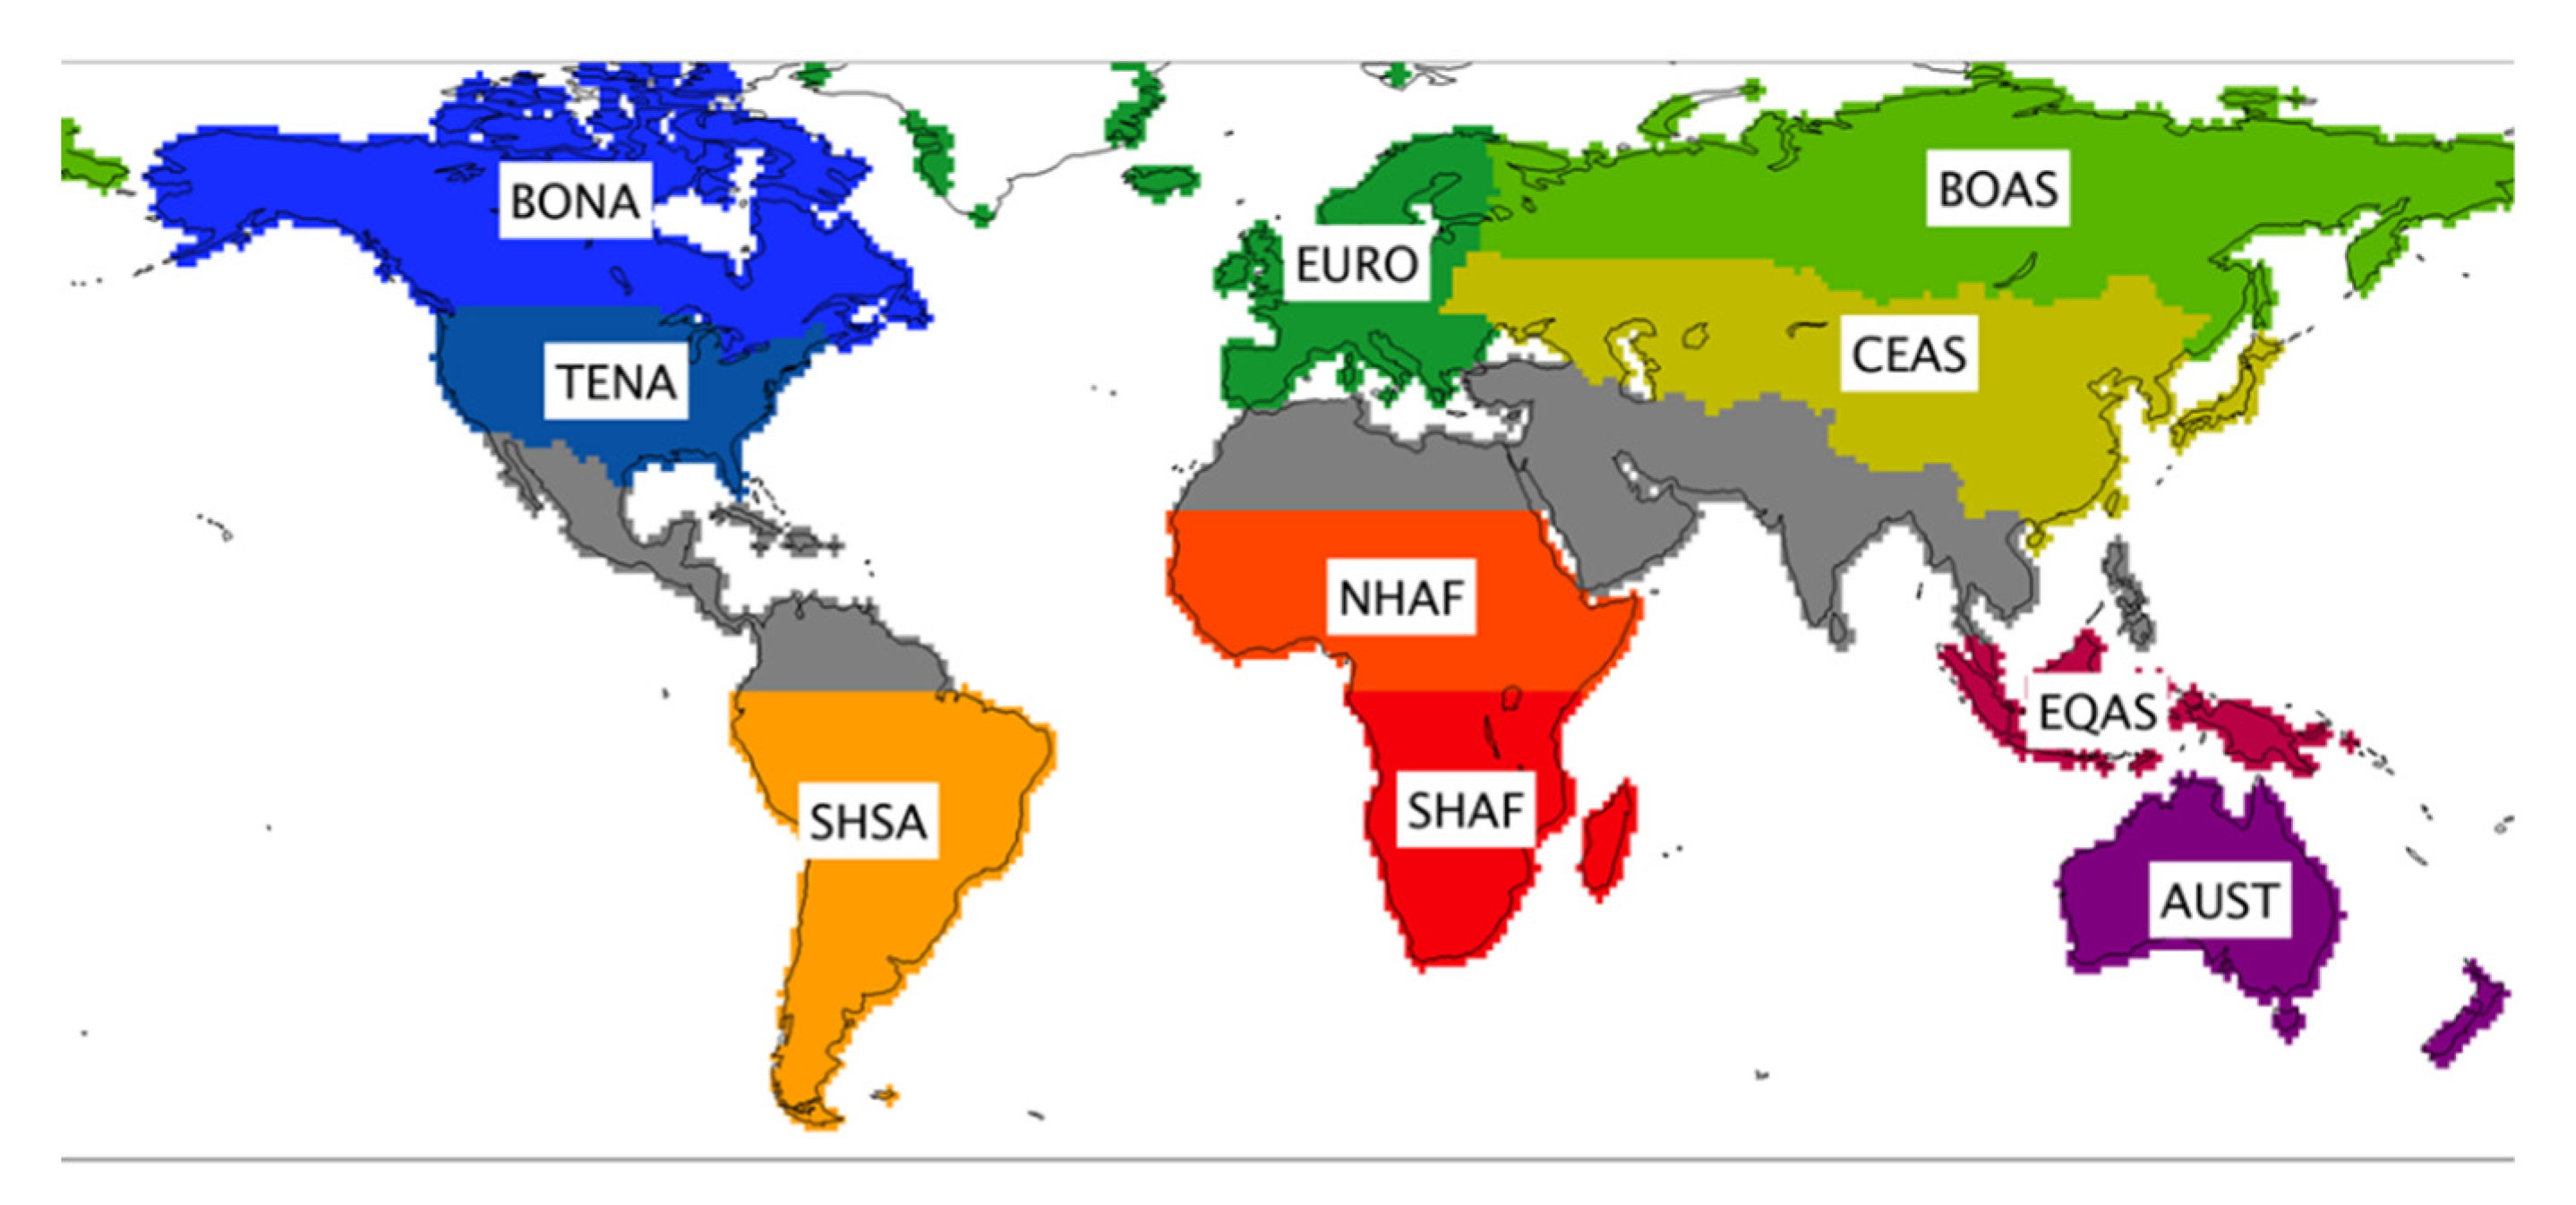
Figure 1. Major Global Fire Emissions Database (GFED) wildfire regions. The region acronyms are listed in Table 1.
Remotesensing 12 02246 g001
Figure 2. Burned area autocorrelation of common fire grids.
Remotesensing 12 02246 g002
Figure 3. Comparison of neural network 1-year moving predictions of monthly regional average burned area of 2011–2015 with corresponding GFED data for fire regions shown in Figure 1. Prediction results are in blue and GFED data are in orange. The refined index of agreement between the two datasets is shown. The y-axis range is 0–106 m2 for northern and southern Africa, and 0–104 m2 for the other regions.
Remotesensing 12 02246 g003
Figure 4. Performances of the neural network model for fire regions predictions of 2011–2015. The percentage mean fractional error (MFE) is shown.
Remotesensing 12 02246 g004
Figure 5. Taylor diagram of R-Square, index of agreement and normalized root-mean-square deviation of prediction and GFED data for the 10 fire regions.
Remotesensing 12 02246 g005
Figure 6. Same as Figure 3, but for burned area predictions without the seasonal cycle.
Remotesensing 12 02246 g006
Figure 7. One-year moving monthly prediction and corresponding GFED data of burned area (km2 per 0.75° × 0.75° grid cell) averaged over 2011–2015 for South America.
Remotesensing 12 02246 g007
Figure 8. Same as Figure 7, but for equatorial Asia.
Remotesensing 12 02246 g008
Figure 9. Same as Figure 7, but for northern Africa.
Remotesensing 12 02246 g009
Figure 10. Same as Figure 7, but for southern Africa.
Remotesensing 12 02246 g010
Figure 11. Same as Figure 7, but for Australia.
Remotesensing 12 02246 g011
Table 1. Selected sensitive predictor variables using a generalized linear model (GLM) for each fire region.
Burned Area RegionsPredictor Parameters Field
Boreal North America (BONA)Temperature, Pressure, Specific humidity, Sensible heat flux, Landcover
Temperate North America (TENA)Temperature, Pressure, Specific humidity, Precipitation, Landcover
South America (SHSA)Precipitation, Wind speed, Ground heat flux, Temperature, Vegetation type, ONI, AMO
Europe (EURO)Temperature, Pressure, Wind speed, Landcover
Boreal Asia (BOAS)Wind speed, Specific humidity, Sensible heat flux, Ground heat flux, Landcover
Central Asia (CEAS)Temperature, Pressure, Wind speed, Precipitation, Landcover
Northern Africa (NHAF)Precipitation, Potential evaporation, Vegetation type
Southern Africa (SHAF)Precipitation, Temperature, Wind speed, Ground heat flux, Vegetation type
Equatorial Asia (EQAS)Precipitation, Specific humidity, Ground heat flux, Sensible heat flux, Vegetation type, ONI
Australia (AUST)Pressure, Specific humidity, Ground heat flux, Potential evaporation
Table 2. Model performance indices of 1-year moving model prediction of the neural network, regression tree, and GLM with GFED burned area data for each fire region in the period of 2011–2015.
RegionNeural NetworkRegression TreeGLM
R2IOANRMSDNMENMBR2IOANRMSDNMENMBR2IOANRMSDNMENMB
Boreal North America (BONA)0.530.70.1554280.460.570.2863410.330.410.387258
Temperate North America (TENA)0.840.730.1429140.730.680.2643250.610.590.365641
South America (SHSA)0.540.80.1558550.430.660.366640.390.570.417366
Europe (EURO)0.580.740.1444290.490.620.353400.360.540.446552
Boreal Asia (BOAS)0.770.790.1643150.690.710.3949240.510.580.485736
Central Asia (CEAS)0.490.70.1555490.40.630.3660560.330.480.397062
Northern Africa (NHAF)0.710.820.1449480.610.740.2958540.520.640.376559
Southern Africa (SHAF)0.60.820.1450470.530.710.3157490.420.620.436863
Equatorial Asia (EQAS)0.580.750.1171160.520.650.2776340.450.540.258045
Australia (AUST)0.20.560.294250.180.550.2698360.150.460.359954
Mean of all regions0.590.740.1554330.510.650.362420.410.540.47054