Identifying and Correcting Signal Shift in DMSP-OLS Data


Abstract
1. Introduction
2. Materials and Methods
- 1
- nightlights2009shift<-raster::shift(nightlights2009,dx=0.0043894,dy=0.015704)
3. Results
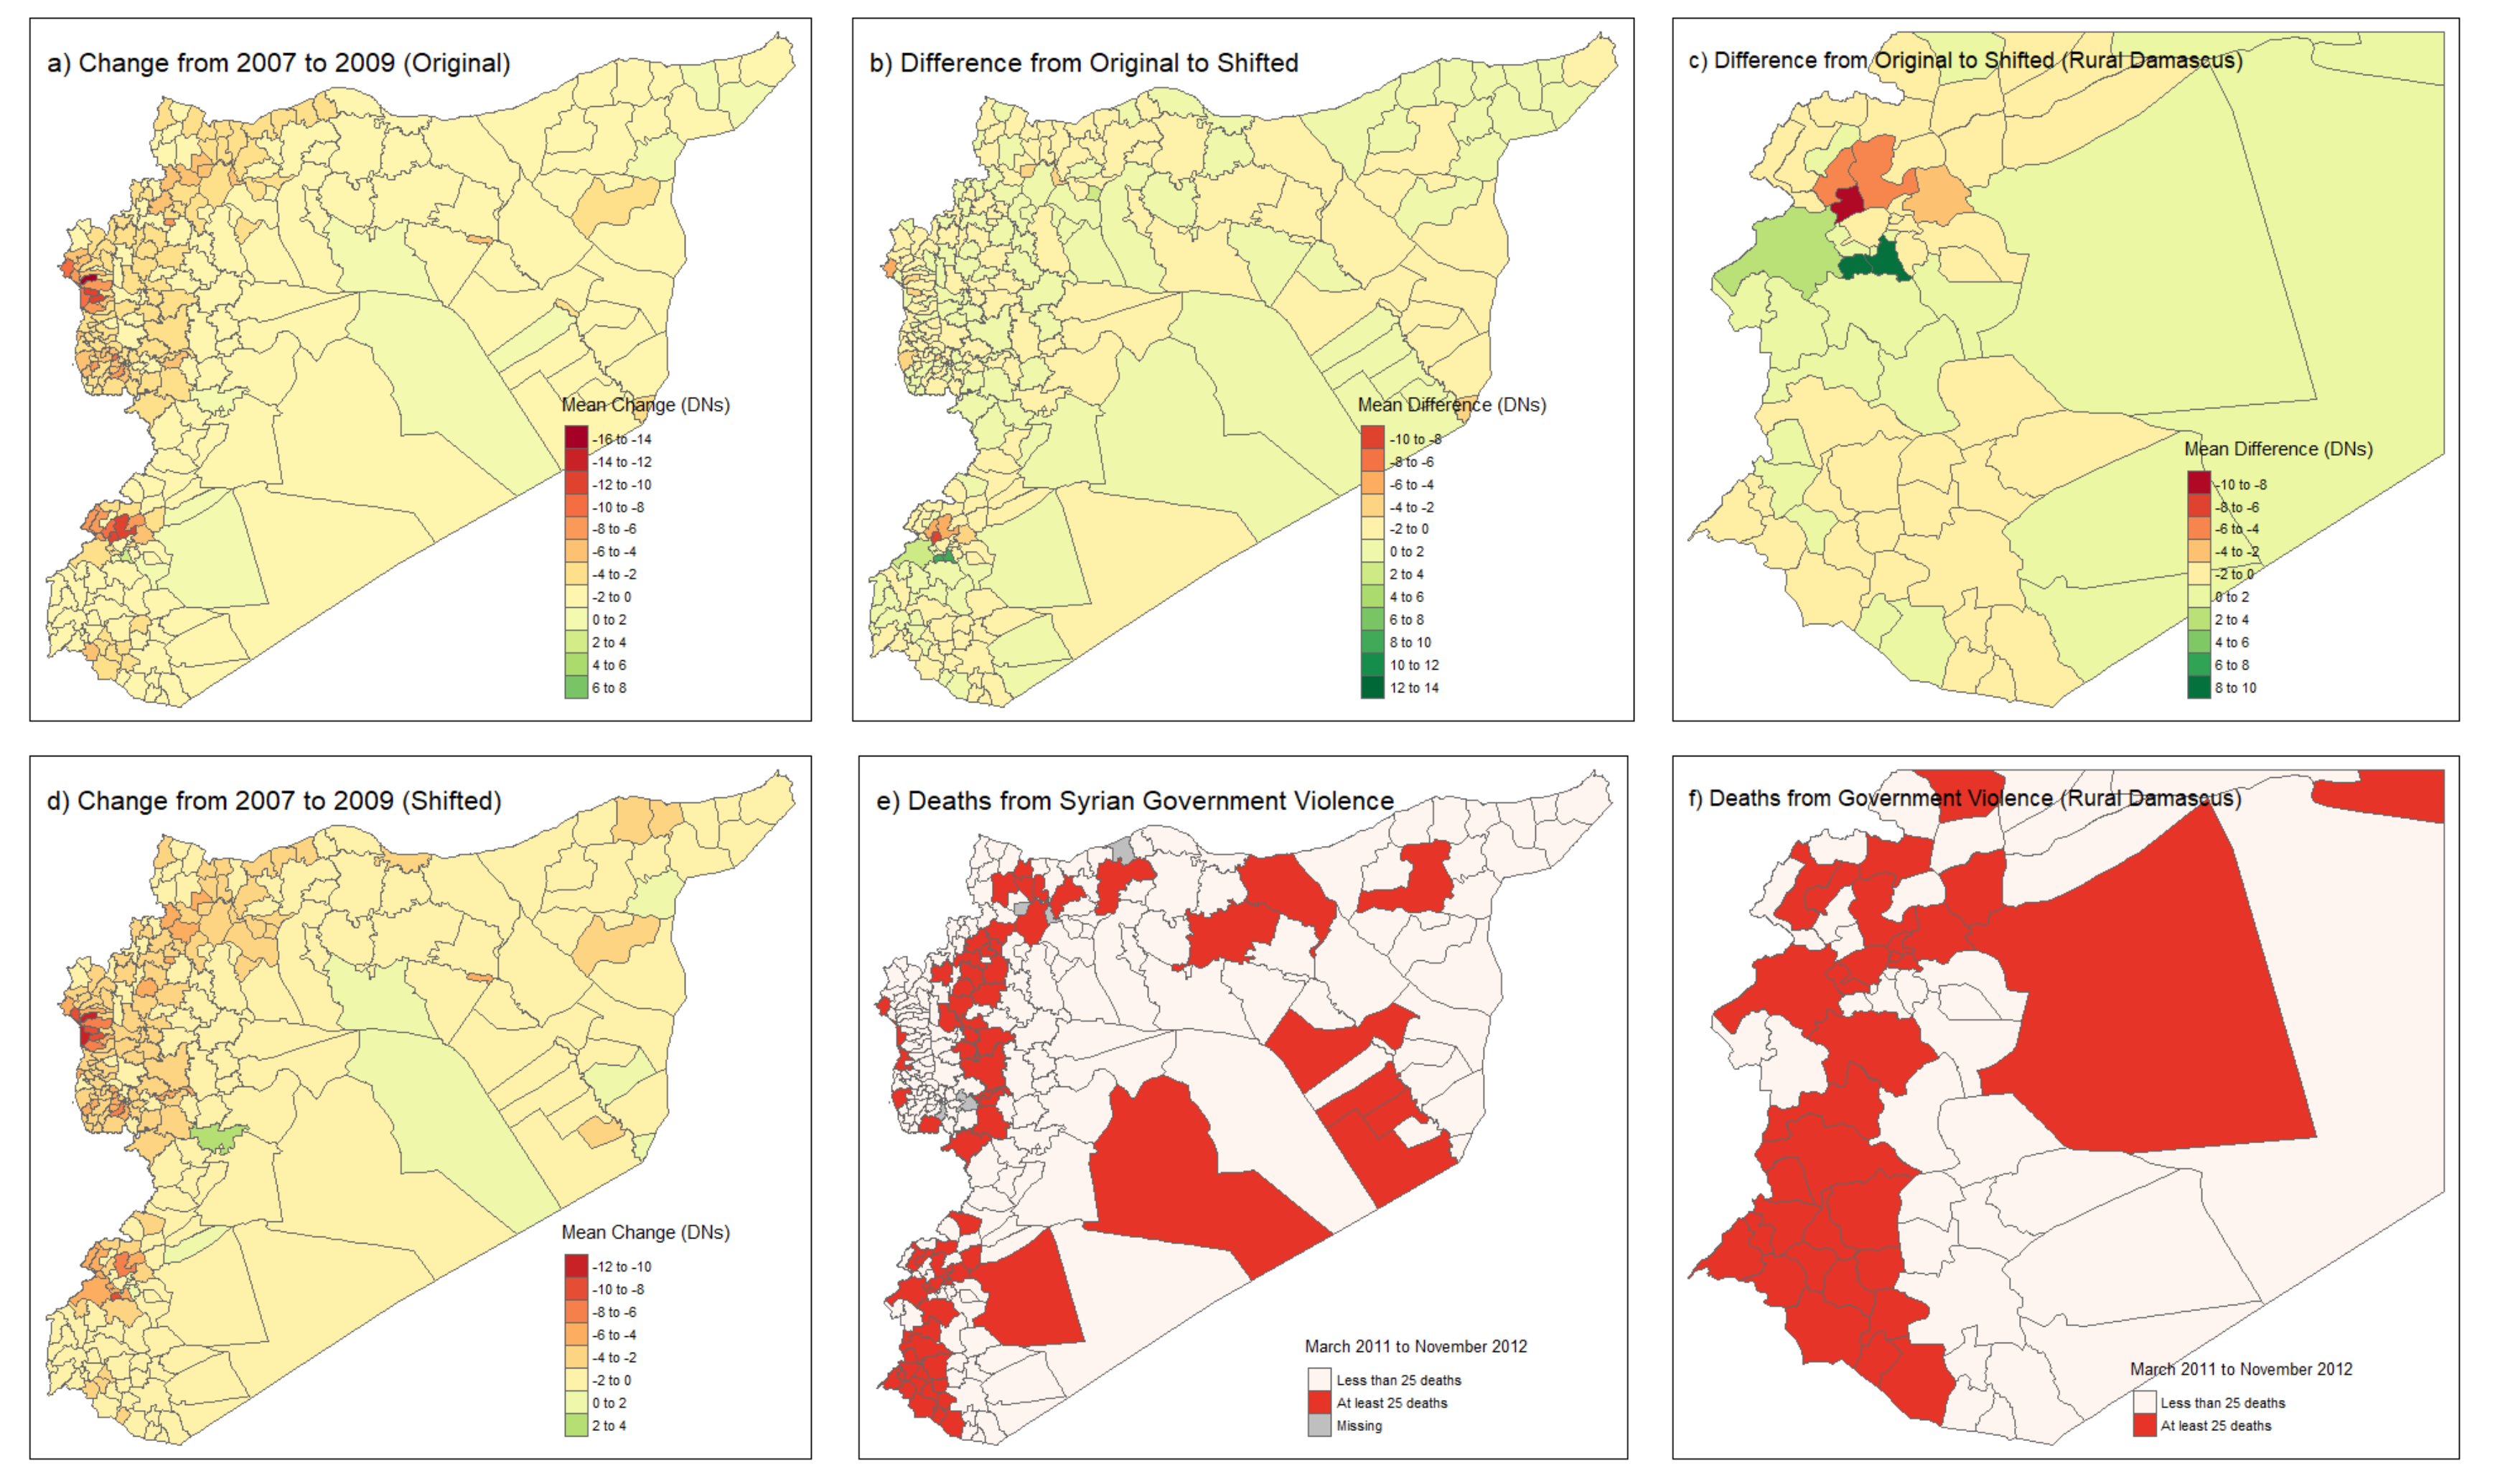
3.1. Does Signal Shift Affect Estimates of the Relationship between Load Shedding and Violence?
3.2. Did Signal Shift Produce Systematic Bias?
4. Conclusions
Supplementary Materials
Author Contributions
Funding
Acknowledgments
Conflicts of Interest
References
- Elvidge, C.D.; Hsu, F.C.; Baugh, K.E.; Ghosh, T. National Trends in Satellite Observed Lighting: 1992–2012. In Global Urban Monitoring and Assessment Through Earth Observation; Weng, Q., Ed.; CRC Press: Boulder, CO, USA, 2013. [Google Scholar]
- Sutton, P.; Roberts, D.; Elvidge, D.; Henk, M. A comparison of nighttime Satellite imagery and population density for the continental United States. Photogramm. Eng. Remote Sens. 1997, 63, 1303–1313. [Google Scholar]
- Bharti, N.; Tatem, A.J.; Ferrari, M.J.; Grais, R.F.; Djibo, A.; Grenfell, B.T. Explaining Seasonal Fluctuations of Measles in Niger Using Nighttime Lights Imagery. Science 2011, 334, 1424–1427. [Google Scholar] [CrossRef] [PubMed]
- Agnew, J.; Gillespie, T.W.; Gonzalez, J.; Min, B. Baghdad Nights: Evaluating the US Military ‘Surge’ Using Nighttime Light Signatures. Environ. Plan. A 2008, 40, 2285–2295. [Google Scholar] [CrossRef]
- Ash, K.; Obradovich, N. Climatic stress, internal migration, and Syrian civil war onset. J. Confl. Resolut. 2020, 64, 3–31. [Google Scholar] [CrossRef]
- Sutton, P.; Roberts, D.; Elvidge, C.; Baugh, K. Census from Heaven: An estimate of the global human population using night-time satellite imagery. Int. J. Remote Sens. 2001, 22, 3061–3076. [Google Scholar] [CrossRef]
- Small, C.; Pozzi, F.; Elvidge, C. Spatial analysis of global urban extent from DMSP-OLS night lights. Remote Sens. Environ. 2005, 96, 277–291. [Google Scholar] [CrossRef]
- Kroth, V.; Larcinese, V.; Wehner, J. A better life for all? Democratization and electrification in post-apartheid South Africa. J. Politics 2016, 78, 774–791. [Google Scholar] [CrossRef]
- Min, B. Power and the Vote: Elections and Electricity in the Developing World; Cambridge University Press: Cambridge, UK, 2015. [Google Scholar]
- Hodler, R.; Raschky, P.A. Regional Favoritism. Q. J. Econ. 2014, 129, 995. [Google Scholar] [CrossRef]
- Luca, G.D.; Hodler, R.; Raschky, P.A.; Valsecchi, M. Ethnic Favoritism: An Axiom of Politics? Cesifo Working Paper Series; CESifo Group: Munich, Germany, 2015. [Google Scholar]
- Besley, T.; Mueller, H. Cohesive Institutions and the Distribution of Political Rents: Theory and Evidence; Paper Prepared for the Roundtable on Institutions, Governance and Corruption organized by IEA and RIDGE in Montevideo, Uruguay on 26–27 May 2016; Palgrave Macmillan: Cham, Switzerland, 2016. [Google Scholar]
- Liu, Y.; Wang, Y.; Peng, J.; Du, Y.; Liu, X.; Li, S.; Zhang, D. Correlations between Urbanization and Vegetation Degradation across the World’s Metropolises Using DMSP/OLS Nighttime Light Data. Remote Sens. 2015, 7, 2067–2088. [Google Scholar] [CrossRef]
- Meng, L.; Graus, W.; Worrell, E.; Huang, B. Estimating CO2 (carbon dioxide) emissions at urban scales by DMSP/OLS (Defense Meteorological Satellite Program’s Operational Linescan System) nighttime light imagery: Methodological challenges and a case study for China. Energy 2014, 71, 468–478. [Google Scholar] [CrossRef]
- Shi, K.; Chen, Y.; Yu, B.; Xu, T.; Chen, Z.; Liu, R.; Li, L.; Wu, J. Modeling spatiotemporal CO2 (carbon dioxide) emission dynamics in China from DMSP-OLS nighttime stable light data using panel data analysis. Appl. Energy 2016, 168, 523–533. [Google Scholar] [CrossRef]
- Xie, Y.; Weng, Q. World energy consumption pattern as revealed by DMSP-OLS nighttime light imagery. Gisci. Remote Sens. 2016, 53, 265–282. [Google Scholar] [CrossRef]
- Shortland, A.; Christopoulou, K.; Makatsoris, C. War and famine, peace and light? The economic dynamics of conflict in Somalia 1993–2009. J. Peace Res. 2013, 50, 345–361. [Google Scholar] [CrossRef]
- Kuhn, P.M.; Weidmann, N.B. Unequal We Fight: Between- and Within-Group Inequality and Ethnic Civil War. Political Sci. Res. Methods 2015, 3, 543–568. [Google Scholar] [CrossRef]
- Mattingly, D.C. Colonial legacies and state institutions in China: Evidence from a natural experiment. Comp. Political Stud. 2017, 50, 434–463. [Google Scholar] [CrossRef]
- Ziskin, D.; Baugh, K.; Hsu, F.C.; Elvidge, C.D. Methods used for the 2006 radiance lights. Proc. Asia Pac. Adv. Netw. 2010, 30, 131–142. [Google Scholar] [CrossRef]
- Li, X.; Zhou, Y. Urban mapping using DMSP/OLS stable night-time light: A review. Int. J. Remote Sens. 2017, 38, 6030–6046. [Google Scholar] [CrossRef]
- Elvidge, C.D.; Ziskin, D.; Baugh, K.E.; Tuttle, B.T.; Ghosh, T.; Pack, D.W.; Erwin, E.H.; Zhizhin, M. A Fifteen Year Record of Global Natural Gas Flaring Derived from Satellite Data. Energies 2009, 2, 595–622. [Google Scholar] [CrossRef]
- Hsu, F.C.; Baugh, K.E.; Ghosh, T.; Zhizhin, M.; Elvidge, C.D. DMSP-OLS radiance calibrated nighttime lights time series with intercalibration. Remote Sens. 2015, 7, 1855–1876. [Google Scholar] [CrossRef]
- Elvidge, C.D.; Baugh, K.E.; Zhizhin, M.; Hsu, F.C. Why VIIRS data are superior to DMSP for mapping nighttime lights. Proc. Asia Pac. Adv. Netw. 2013, 35, 62. [Google Scholar] [CrossRef]
- Alahmadi, M.; Atkinson, P.M. Three-Fold Urban Expansion in Saudi Arabia from 1992 to 2013 Observed Using Calibrated DMSP-OLS Night-Time Lights Imagery. Remote Sens. 2019, 11, 2266. [Google Scholar] [CrossRef]
- Liu, A.; Wei, Y.; Yu, B.; Song, W. Estimation of Cargo Handling Capacity of Coastal Ports in China Based on Panel Model and DMSP-OLS Nighttime Light Data. Remote Sens. 2019, 11, 582. [Google Scholar] [CrossRef]
- Tuttle, B.T.; Anderson, S.J.; Sutton, P.C.; Elvidge, C.D.; Baugh, K. It used to be dark here: Geolocation Calibration of the Defense Meteorological Satellite Program Operational Linescan System. Photogramm. Eng. Remote Sens. 2013, 79, 287–297. [Google Scholar] [CrossRef]
- Zhao, N.; Zhou, Y.; Samson, E.L. Correcting incompatible DN values and geometric errors in nighttime lights time-series images. IEEE Trans. Geosci. Remote Sens. 2015, 53, 2039–2049. [Google Scholar] [CrossRef]
- Wu, J.; He, S.; Peng, J.; Li, W.; Zhong, X. Intercalibration of DMSP-OLS night-time light data by the invariant region method. Int. J. Remote Sens. 2013, 34, 7356–7368. [Google Scholar] [CrossRef]
- Li, X.; Chen, X.; Zhao, Y.; Xu, J.; Chen, F.; Li, H. Automatic intercalibration of night-time light imagery using robust regression. Remote Sens. Lett. 2013, 4, 45–54. [Google Scholar] [CrossRef]
- De Juan, A.; Bank, A. The Ba’athist blackout? Selective goods provision and political violence in the Syrian civil war. J. Peace Res. 2015, 52, 91–104. [Google Scholar] [CrossRef]
- Taylor, C.W. Concepts of undervoltage load shedding for voltage stability. IEEE Trans. Power Deliv. 1992, 7, 480–488. [Google Scholar] [CrossRef]
- Al Haj Saleh, Y. The Impossible Revolution; Hurst: London, UK, 2017. [Google Scholar]
- Van Dam, N. The Struggle for Power in Syria: Politics and Society Under Asad and the Ba’ath, 4th ed.; Palgrave Macmillan Press: New York, NY, USA, 2011. [Google Scholar]
- Batatu, H. Syria’s Peasantry, the Descendants of Its Lesser Rural Notables, and Their Politics; Princeton University Press: Princeton, NJ, USA, 1999. [Google Scholar]
- National Centers for Environmental Information: Earth Observation Group. Version 4 DMSP-OLS Nighttime Lights Time Series. In National Oceanic and Atmospheric Administration. Available online: https://ngdc.noaa.gov/eog/dmsp/downloadV4composites.html (accessed on 5 June 2020).
- Costanza, R. Model goodness of fit: A multiple resolution procedure. Ecol. Model. 1989, 47, 199–215. [Google Scholar] [CrossRef]
- Kuhnert, M.; Voinov, A.; Seppelt, R. Comparing raster map comparison algorithms for spatial modeling and analysis. Photogramm. Eng. Remote Sens. 2005, 71, 975–984. [Google Scholar] [CrossRef]
- Elvidge, C.D.; Baugh, K.E.; Kihn, E.A.; Kroehl, H.W.; Davis, E.R.; Davis, C.W. Relation between satellite observed visible-near infrared emissions, population, economic activity and electric power consumption. Int. J. Remote Sens. 1997, 18, 1373–1379. [Google Scholar] [CrossRef]
- Office for the Coordination of Humanitarian Affairs Services. Syrian Arab Republic—Administrative Boundaries, Populated Places. United Nations Office for the Coordination of Humanitarian Affairs. Available online: https://data.humdata.org/dataset/syrian-arab-republic-administrative-boundaries-populated-places (accessed on 5 June 2020).


| Year: | 2004 | 2005 | 2006 | 2007 | 2008 | 2009 (Unshifted) | 2009 (Shifted) |
|---|---|---|---|---|---|---|---|
| 2004 | X | 0.573 | 0.585 | 0.630 | 0.608 | 0.558 | 0.500 |
| 2005 | X | 0.659 | 0.657 | 0.614 | 0.403 | 0.528 | |
| 2006 | X | 0.665 | 0.620 | 0.420 | 0.515 | ||
| 2007 | X | 0.671 | 0.493 | 0.566 | |||
| 2008 | X | 0.512 | 0.590 |
| Longitude | Latitude | Difference | ||||
|---|---|---|---|---|---|---|
| Place | 2007 | 2009 | 2007 | 2009 | Long. | Lat. |
| Homs | 36.721 | 36.715 | 34.845 | 34.835 | 0.006 | 0.010 |
| Hama | 36.744 | 36.740 | 35.186 | 35.173 | 0.004 | 0.013 |
| Aleppo | 36.970 | 36.965 | 36.393 | 36.373 | 0.005 | 0.020 |
| Jabla | 35.903 | 35.900 | 35.356 | 35.336 | 0.003 | 0.020 |
| al-Raqqa | 38.980 | 38.975 | 35.920 | 35.908 | 0.005 | 0.012 |
| Dayr al-Zur | 40.171 | 40.169 | 35.320 | 35.308 | 0.003 | 0.012 |
| Rural Damascus 1 | 36.588 | 36.584 | 33.503 | 33.486 | 0.004 | 0.018 |
| Rural Damascus 2 | 36.302 | 36.298 | 33.646 | 33.629 | 0.004 | 0.017 |
| al-Tal | 36.189 | 36.184 | 34.028 | 34.014 | 0.005 | 0.014 |
| al-Hasaka | 40.723 | 40.718 | 36.546 | 36.532 | 0.004 | 0.015 |
| al-Qamishli | 41.208 | 41.202 | 37.023 | 37.008 | 0.006 | 0.014 |
| Tartus | 35.910 | 35.906 | 34.862 | 34.839 | 0.004 | 0.023 |
| Mean | 0.004 | 0.016 | ||||
| Standard Deviation | (0.001) | (0.004) | ||||
| T-value | 15.112 | 13.761 | ||||
| Dependent Variable: | 25 or More Deaths in Sub-District (Binary) | ||||
|---|---|---|---|---|---|
| (1) | (2) | (3) | (4) | (5) | |
| Gov. Employees | −0.012 | −0.014 | −0.008 | −0.012 | −0.006 |
| (0.028) | (0.025) | (0.027) | (0.026) | (0.028) | |
| Sunni | 0.369 | 0.439 | 0.365 | 0.414 | 0.353 |
| (0.583) | (0.572) | (0.577) | (0.567) | (0.576) | |
| Alawi | −0.022 | −0.035 | −0.066 | −0.011 | −0.044 |
| (0.547) | (0.508) | (0.476) | (0.457) | (0.438) | |
| School Enrollment | −0.046 | −0.029 | −0.006 | −0.012 | 0.009 |
| (0.113) | (0.116) | (0.136) | (0.111) | (0.127) | |
| Border Dist. (log) | −0.003 | −0.045 | −0.119 | −0.091 | −0.166 |
| (0.471) | (0.488) | (0.535) | (0.465) | (0.510) | |
| Urbanization | 2.932 | 2.672 | 2.766 | 2.583 | 2.705 |
| (0.660) | (0.524) | (0.555) | (0.559) | (0.587) | |
| Electrification | −0.008 | 0.007 | 0.000 | 0.007 | −0.001 |
| (0.100) | (0.094) | (0.119) | (0.100) | (0.125) | |
| Pct. Unemployed | −0.009 | −0.005 | −0.007 | −0.003 | −0.005 |
| (0.029) | (0.027) | (0.026) | (0.025) | (0.024) | |
| Road Density | −2.590 | −1.919 | −2.838 | −1.964 | −2.769 |
| (0.578) | (0.446) | (1.031) | (0.448) | (1.024) | |
| Population (log) | 1.932 | 1.826 | 1.981 | 1.871 | 2.032 |
| (0.701) | (0.634) | (0.495) | (0.630) | (0.513) | |
| Lights Change (Original) | −0.464 | ||||
| (0.121) | |||||
| Lights Change (Shifted) | −0.359 | ||||
| (0.225) | |||||
| Lights Change (Shifted, No Saturation) | −0.264 | ||||
| (0.246) | |||||
| Lights Change (Shifted, No Flares) | −0.250 | ||||
| (0.187) | |||||
| Lights Change (Shifted, No Sat. No Flares) | −0.165 | ||||
| (0.190) | |||||
| Constant | −1.791 | −4.060 | −6.986 | −6.194 | −8.781 |
| (17.823) | (14.744) | (14.760) | (16.400) | (16.307) | |
| Observations | 247 | 247 | 247 | 247 | 247 |
| Mean Sub-District DNs after Adjusting for Signal Shift | ||||
|---|---|---|---|---|
| Dependent Variable: | (1) | (2) | ||
| Coef. | S.E. | Coef. | S.E. | |
| Gov. Employees | −0.002 | (0.004) | −0.005 | (0.006) |
| Sunni | −0.185 | (0.211) | −0.438 | (0.364) |
| Alawi | 0.020 | (0.195) | −0.265 | (0.255) |
| School Enrollment | 0.031 | (0.012) | 0.032 | (0.044) |
| Border Dist. (log) | 0.047 | (0.082) | 0.134 | (0.182) |
| Urbanization | 0.467 | (0.387) | −0.752 | (0.432) |
| Electrification | −0.008 | (0.013) | 0.066 | (0.065) |
| Pct. Unemployed | 0.011 | (0.005) | 0.016 | (0.009) |
| Road Density | −0.965 | (0.710) | −0.011 | (0.309) |
| Population (log) | 0.036 | (0.191) | 0.259 | (0.107) |
| Constant | −1.878 | (1.499) | −13.164 | (3.339) |
| R-squared | 0.050 | 0.067 | ||
| Gas Flares | Included | Excluded | ||
| Observations | 247 | 247 | ||
© 2020 by the authors. Licensee MDPI, Basel, Switzerland. This article is an open access article distributed under the terms and conditions of the Creative Commons Attribution (CC BY) license (http://creativecommons.org/licenses/by/4.0/).
Share and Cite
Ash, K.; Mazur, K. Identifying and Correcting Signal Shift in DMSP-OLS Data. Remote Sens. 2020, 12, 2219. https://doi.org/10.3390/rs12142219
Ash K, Mazur K. Identifying and Correcting Signal Shift in DMSP-OLS Data. Remote Sensing. 2020; 12(14):2219. https://doi.org/10.3390/rs12142219
Chicago/Turabian StyleAsh, Konstantin, and Kevin Mazur. 2020. "Identifying and Correcting Signal Shift in DMSP-OLS Data" Remote Sensing 12, no. 14: 2219. https://doi.org/10.3390/rs12142219
APA StyleAsh, K., & Mazur, K. (2020). Identifying and Correcting Signal Shift in DMSP-OLS Data. Remote Sensing, 12(14), 2219. https://doi.org/10.3390/rs12142219