Article

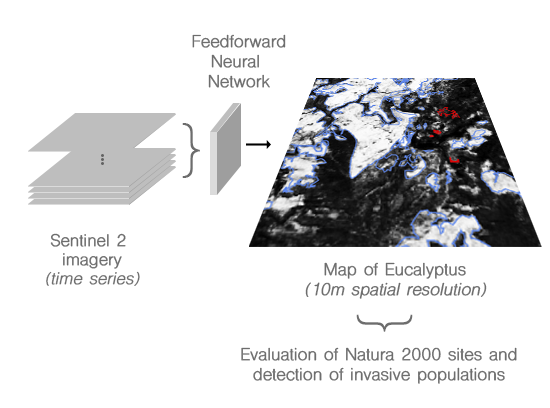
Mapping of Eucalyptus in Natura 2000 Areas Using Sentinel 2 Imagery and Artificial Neural Networks

1
Professorship for Environmental Sensing and Modeling, Technical University of Munich, 80333 Munich, Germany
2
Department of Environmental Systems Science, ETH Zürich, 8092 Zürich, Switzerland
*
Author to whom correspondence should be addressed.
Remote Sens. 2020, 12(14), 2176; https://doi.org/10.3390/rs12142176
Submission received: 1 May 2020 / Revised: 21 June 2020 / Accepted: 26 June 2020 / Published: 8 July 2020

Abstract

:
Plantations of fast-growing Eucalyptus trees have become a common sight in the western Iberian peninsula where they are planted to exploit their economic potential. Negative side-effects of large scale plantations including the invasive behavior of Eucalyptus trees outside of regular plantations have become apparent. This study uses medium resolution, multi-spectral imagery of the Sentinel 2 satellites to map Eucalyptus across Portugal and parts of Spain with a focus on Natura 2000 areas inside Portugal, that are protected under the European birds and habitats directives. This method enables the detection of small incipient as well as mixed populations outside of regular plantations. Ground truth maps were compiled using field surveys as well as high resolution satellite imagery and were used to train Feedforward Neural Networks. These models predict Eucalyptus tree cover with a sensitivity of up to 75.7% as well as a specificity of up to 95.8%. The overall accuracy of the prediction is 92.5%. A qualitative assessment of Natura 2000 areas in Portugal has been performed and 15 areas have been found to be affected by Eucalyptus of which 9 are strongly affected. This study demonstrates the applicability of multi-spectral imagery for tree-species classification and invasive species control. It provides a probability-map of Eucalyptus tree cover for the western Iberian peninsula with 10 m spatial resolution and shows the need for monitoring of Eucalyptus in protected areas.

Graphical Abstract

1. Introduction

Several species of the Eucalyptus genus have been imported from Australia to various other regions of the world including Europe in the late 18th century [1]. At first planted mostly for ornamental reasons, it was gradually discovered that some species were suitable for construction lumber and rapid in growth. In the mid-20th century a large-scale introduction of Eucalyptus globulus to the European continent started after advancements in the pulp and paper industry had made its economic potential more accessible [2]. This process was also driven by national governments, as well as international organizations, who promoted its properties of a fast-growing renewable resource [3]. While its culture has become increasingly important to industrial stakeholders, negative effects of plantations on the environment and ecosystems have become apparent [2,4,5,6].
Portugal and Spain have become two of the hotspots for plantations of the fast-growing tree. Although not recognized by Portuguese authorities as invading and being absent in regulatory legislation [7], Eucalyptus globulus has become invasive in some areas, gradually replacing autochthonous species. This poses a risk to fragile ecosystems with direct and indirect implications on humans [8].
The economic impact of invasive species in Europe has been estimated to be close to 10 billion euros per year [9] and this is likely to be an underestimate since for almost 90% of the alien species in Europe the potential environmental and economic impact are still unknown [10].
In Europe, ecosystems in the network of Natura 2000 areas are protected according to the European habitats (92/43/EEC) and birds directives (2009/147/EC) [11,12]. For each site, a list of protected species is defined and measures undertaken by the member states should ensure the conservation of the natural habitat and the protection of wild fauna and flora.
As invasive species can disturb the natural composition of habitats and especially since the presence of invasive species can lower the conservation level of the sites, monitoring of such species should be considered [13]. Invasive species monitoring usually relies on field surveys, citizens science [14], and remote sensing approaches ([15,16]), that help to quantify and localize areas where alien species penetrate ecosystems. Satellite-based remote sensing approaches can have advantages for two reasons: firstly because field surveys for large areas can become laborious and secondly because early intervention and detection of small, incipient populations is critical to achieve effective control [17].
In recent years approaches using machine learning on satellite imagery have become increasingly popular for environmental management applications [18]. Baccini et al. [19] have used data from the moderate resolution imaging spectroradiometer (MODIS) in combination with regression tree models to predict above-ground biomass. Omer et al. [20] have mapped endangered tree species using WorldView-2 imagery and Support Vector Machines and Artificial Neural Network. Estel et al. [21] have relied on unsupervised clustering techniques on MODIS time-series data to infer cropping intensity across Europe. De Alban et al. [22] have applied a supervised random forest classifier on Landsat imagery to detect change in the Mangrove forest cover in Myanmar. Detection of Eucalyptus plantations using time-series analysis of MODIS as well as Landsat imagery has been performed by Le Maire et al. [23] who have mapped Eucalyptus fast rotation plantations using their unique MODIS Normalized Difference Vegetation Index (NDVI) time-series signature. They have employed a bounding envelope as a matching function to detect if a pixel’s multi-annual NDVI time-series signature matches the one of typical Eucalyptus plantations and have compared the result to a Landsat classification. Recently Dias et al. [24] have explored the performance of several state of the art deep learning feature extractors on image representations of vegetation index time-series for the detection of Eucalyptus plantations.
Since the launch of the Sentinel-2 multi-spectral instruments, a globe-spanning data-set of medium spatial and temporal resolution is available to the public free of charge. In combination with cloud computing services such as Google Earth Engine it enables a wide range of organizations and individuals to solve geospatial analysis problems. The data-set has been widely used in studies including Shoko and Mutanga [25] who exploited the data to distinguish between C3 and C4 grass species, Förster et al. [26] who evaluated Sentinel-2 time-series to monitor the spread of invasive species in central Chile and Vaglio Laurin et al. [27] who employed Sentinel-2 data to distinguish between tropical forest types, as well as Schmidt et al. [28] who use Sentinel 2 imagery to assess the conservation status of a Natura 2000 site in Germany.
In their review on articles focused on the Natura 2000 network Orlikowska et al. [29] identified a lack of studies that cover multiple Natura 2000 sites over large spatial areas and use modelling approaches to conduct such extensive surveys. Furthermore, Mazaris and Katsanevakis [30] pointed out that insufficient and inadequate reporting of invasive species in the Mediterranean Natura 2000 sites poses a significant obstacle for conservation management. The lack of monitoring studies in the Natura 2000 areas can mostly be attributed to the lack of operational datasets and practical applicable techniques at large-scale ([28,31]).
Motivated by these gaps in research, our study presents a data-driven approach to mapping Eucalyptus trees exploiting the capabilities of Feedforward Neural Networks (FNNs) on Sentinel 2 satellite imagery. The main objective of this study is to provide a map of Eucalyptus occurrences in the western Iberian peninsula in order to contribute to an improved management of invasive species for the European Natura 2000 network. To the best of our knowledge, it is the first study to provide a 10 m spatial resolution map of Eucalyptus occurrences, even for areas outside of regular plantations, for the western Iberian peninsula. The use of Sentinel 2 imagery for invasive species detection in Natura 2000 sites on a country level, as performed by this study, is also a novelty.

2. Data and Method

2.1. Study Sites

Initially, a ground truth map of existing plantations and locations of small incipient populations that are covered with Eucalyptus was created for three study sites for the year 2018 using a combination of in-situ observations that were carried out by driving the roads and walking around inside the study area as well as the visual interpretation of high resolution satellite imagery from Google Earth. The selected sites are located inside Natura 2000 areas in Portugal, one in the Serras da Freita e Arada region, Area (1), one in the Cabeção region, Area (2), as well as one further south in the Costa Sudoeste region, Area (3), as can be seen in Figure 1.
For Area (1) ground truth maps of Eucalyptus and coniferous forests (mostly Pinus pinaster and Pinus pinea) were created using high resolution imagery from Google Earth and were validated by walking and driving around in the study area. In a first step the satellite imagery was viewed systematically inside the study area and compared to known samples of satellite imagery of Eucalyptus as visualized in Figure 2. Throughout its life cycle from sapling to a mature tree the appearance on satellite imagery of Eucalyptus trees changes and these differences in appearance were taken into account. In a second step the areas where satellite imagery suggested the occurrence of Eucalyptus were marked using polygons in Google Earth Engine [32]. In a final step knowledge gathered from ground observations was used to correct the polygons.
For the Area (2) and (3) maps were compiled using Google Earth imagery only. No validation by visiting the study sites was performed for Area (2) and (3).
The ground truth map was compiled for the year 2018 under the assumption that areas covered with Eucalyptus that were observed between October and December 2019 were already present throughout 2018. Plantations that were cut down recently and that have not been replanted thus might have been missed. The maps were created using one class for all Eucalyptus species, since Eucalyptus globulus is the species most used for industrial applications [33] and invasive populations usually have propagated from such existing plantations. Ground truth maps of coniferous forests in the study areas were created accordingly in order to measure cross-sensitivity of the algorithm.
Training was performed inside a fraction of Area (1) (Light red area in Figure 1. The validation of the algorithm was performed in the gray region of Area (1). The training was performed exclusively in Area (1) because it was the only area where validated ground truth maps were available. The maps created for the other two sites were used for the evaluation of the algorithm in different regions.

2.2. Satellite Imagery

For this study 13 bands of the two Sentinel 2 multi-spectral instruments (S2A and S2B), available in the top-of-atmosphere reflectance catalog in Google Earth Engine, were used [32]. As the spatial resolution for the bands differs, the lower resolution bands were interpolated to a 10m resolution using the nearest neighbor approach (see Table 1). In order to get a better distinction between species, images captured during four different times of the year were used by creating a median composite of cloud-masked images captured in these four time periods: Winter between 1 January and 1 March, Spring between 1 March and 30 April, Summer between 1 and 31 July as well as Autumn between 15th of October and 15 January of the following year. These dates differ from the classical definition of seasons and were chosen in order to get imagery for the mostly non vegetative winter period as well as vegetative periods. Generally, in phenological studies of the northern hemisphere the winter season is chosen to end in February [34]. The other seasons were chosen to get sufficient coverage with cloud free satellite imagery for the vegetative periods.
Satellite imagery for the western Iberian peninsula including Portugal was evaluated in small rectangular shards of approximately 25 km by 25 km and been combined to a composite image covering the whole area of interest.

2.3. Data Analysis

FNNs are a type of artificial neural network which are a commonly used tool for remote sensing applications such as the analysis of aerial photography and have been used for the detection of tree biodiversity from satellite imagery [36] as well as tree species classification tasks. They have been found to yield more accurate results than support vector machine and random forest algorithms [37,38], as well as nearest neighbor classifiers [39].
In this study a FNN architecture as visualized in Figure 3, consisting of four fully connected hidden layers with decreasing size, was used. FNNs consist of several layers of artificial neurons (AN) that are connected to each other. During the prediction process, data is passed from the input layer to the subsequent layers and altered by each AN depending on its weight and activation function to eventually produce one or multiple output values, which enables non-linear separation of data [37].
A comparison among several FNN architectures with differently sized layers showed that a network with the following configuration yielded the best results: The input layer is connected to the first hidden layer consisting of 120 rectified linear units (ReLUs). The subsequent two layers are also ReLUs with 60 and 30 units respectively. The output neuron has a sigmoidal activation function providing a float value between 0 and 1.
In order to take into account the spatial vicinity of the pixel of interest in the prediction process, pixels located inside a neighborhood region of 32 × 32 pixels (320 m × 320 m) around the pixel of interest were considered as an input to the model. The size of the neighborhood region was chosen according to two factors. Firstly, the area should be sufficiently large to extract background information, while not being too large to be prone to overfitting the model. Secondly, a compromise had to be found in respect to computational speed, which decreases with a larger size. A neighborhood region of 32 × 32 pixels satisfied these criteria well, as the computational speed is high and enough background information is collected.
The networks were trained with Adam, a gradient-based algorithm [40], and binary cross-entropy as a loss function using the Keras Python implementations [41]. Training and validation data were randomly shuffled for the training of each model. The training data-set consisted of 60,000 patches of which each patch contains the sentinel imagery inside the neighborhood region for the four seasons as well as the ground truth value. The patches were extracted randomly from the total of patches inside the training region.
The trained networks were fed with satellite imagery in the area of interest and predictions were calculated. The raw output of a network is a float value between 0 and 1 representing the probability of each pixel being covered with Eucalyptus.
A map was created by running the prediction algorithm on all pixels of the area of interest resulting in a gray-scale probability map. In order to assign the two classes “Eucalyptus” and “Not-Eucalyptus” a threshold was applied to the gray-scale map, resulting in a binary image as can be seen in Figure 4. The selection of the threshold value is discussed in more detail below.

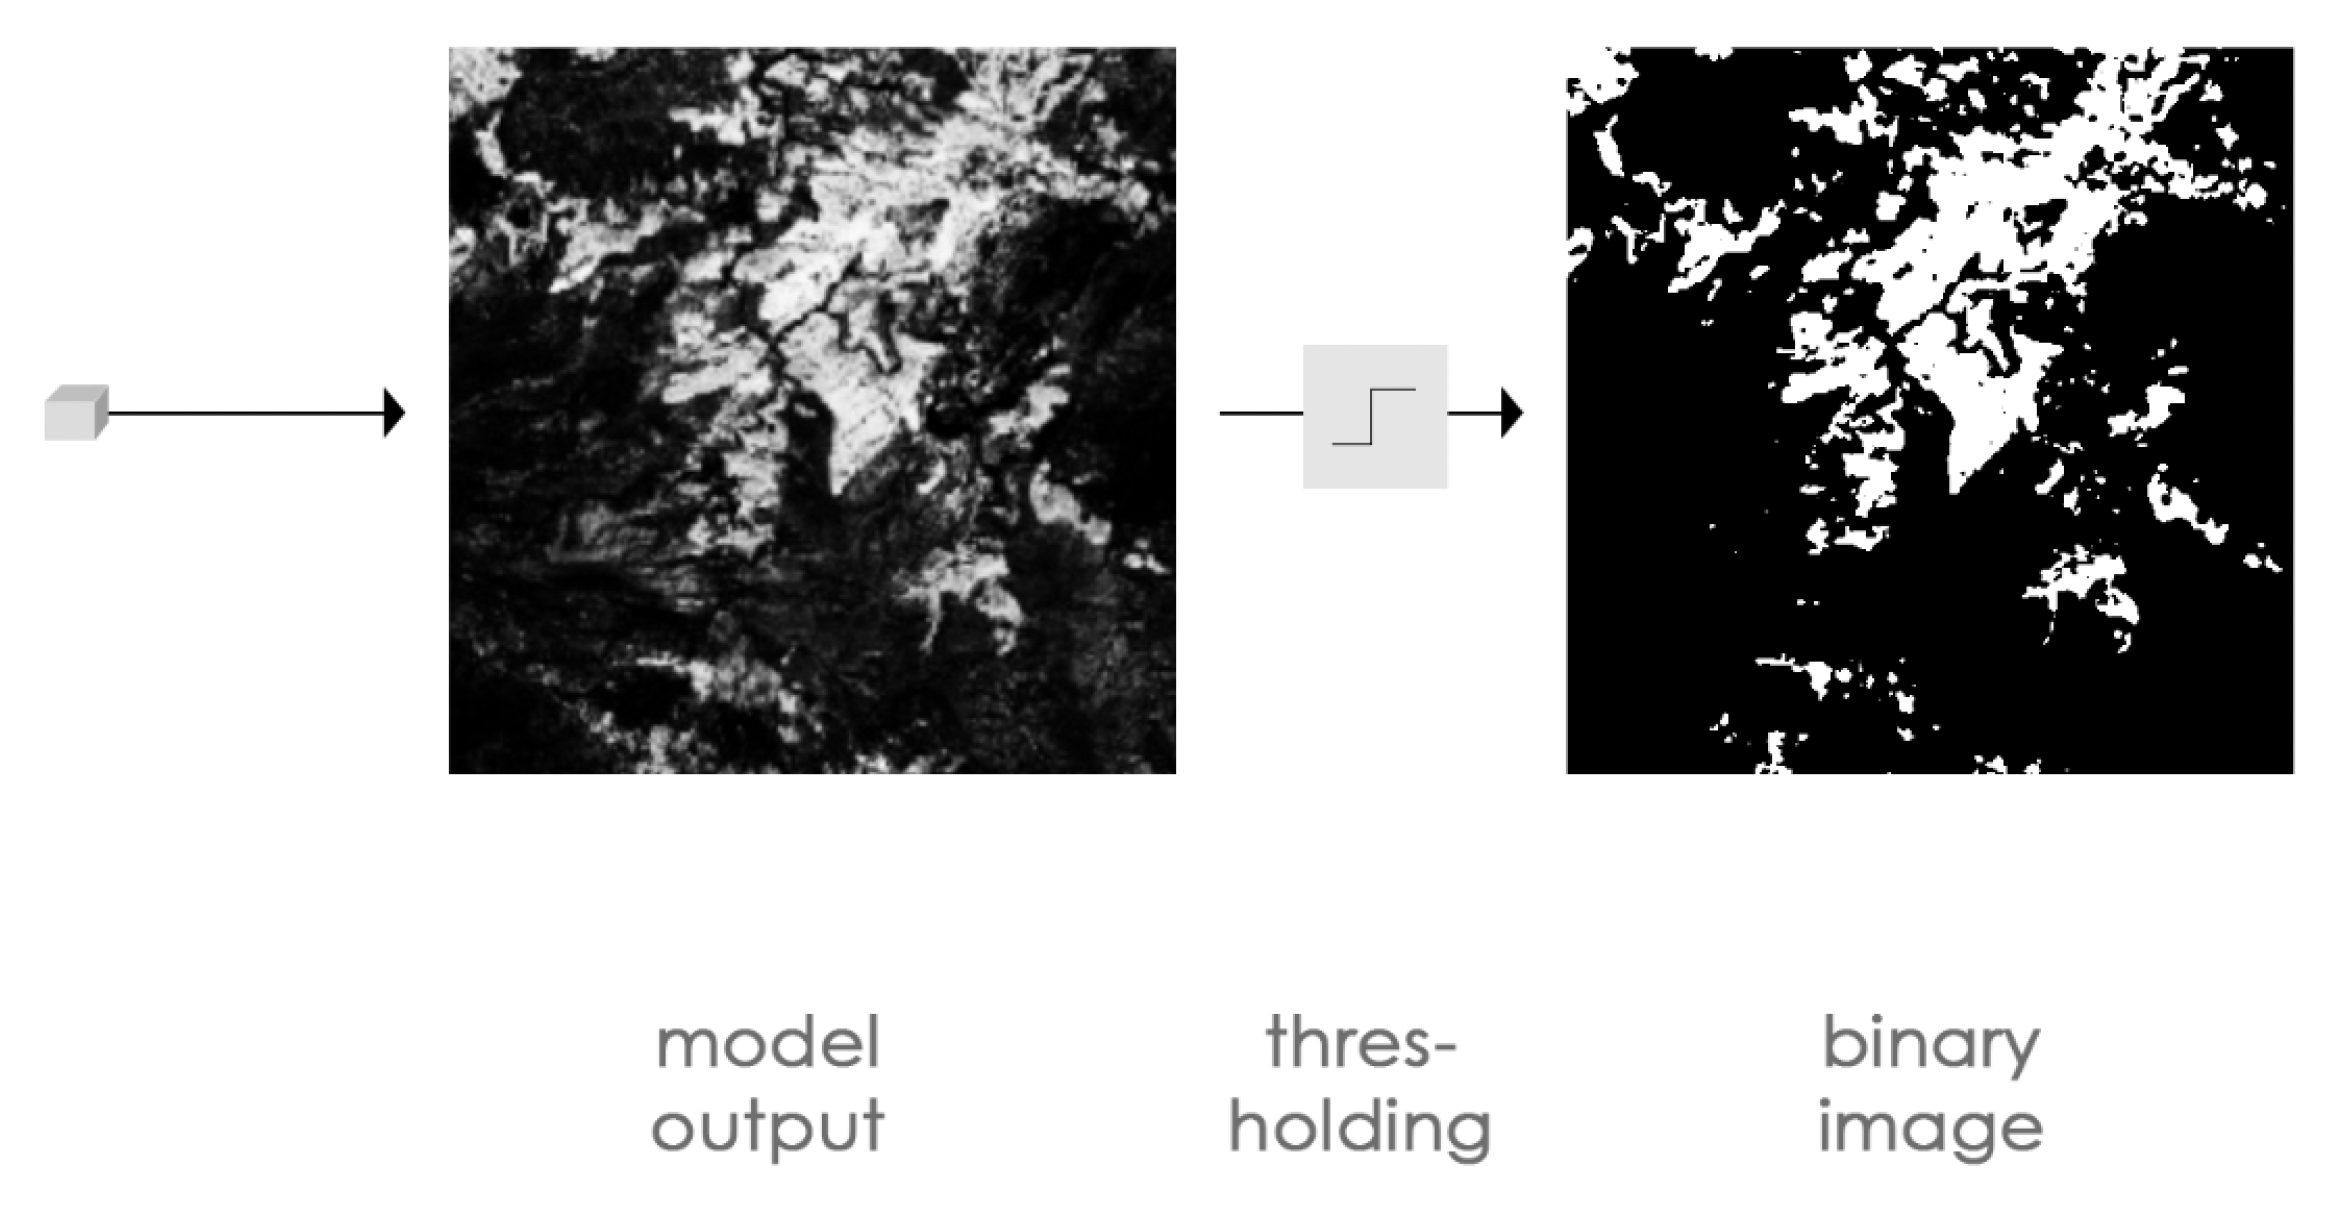
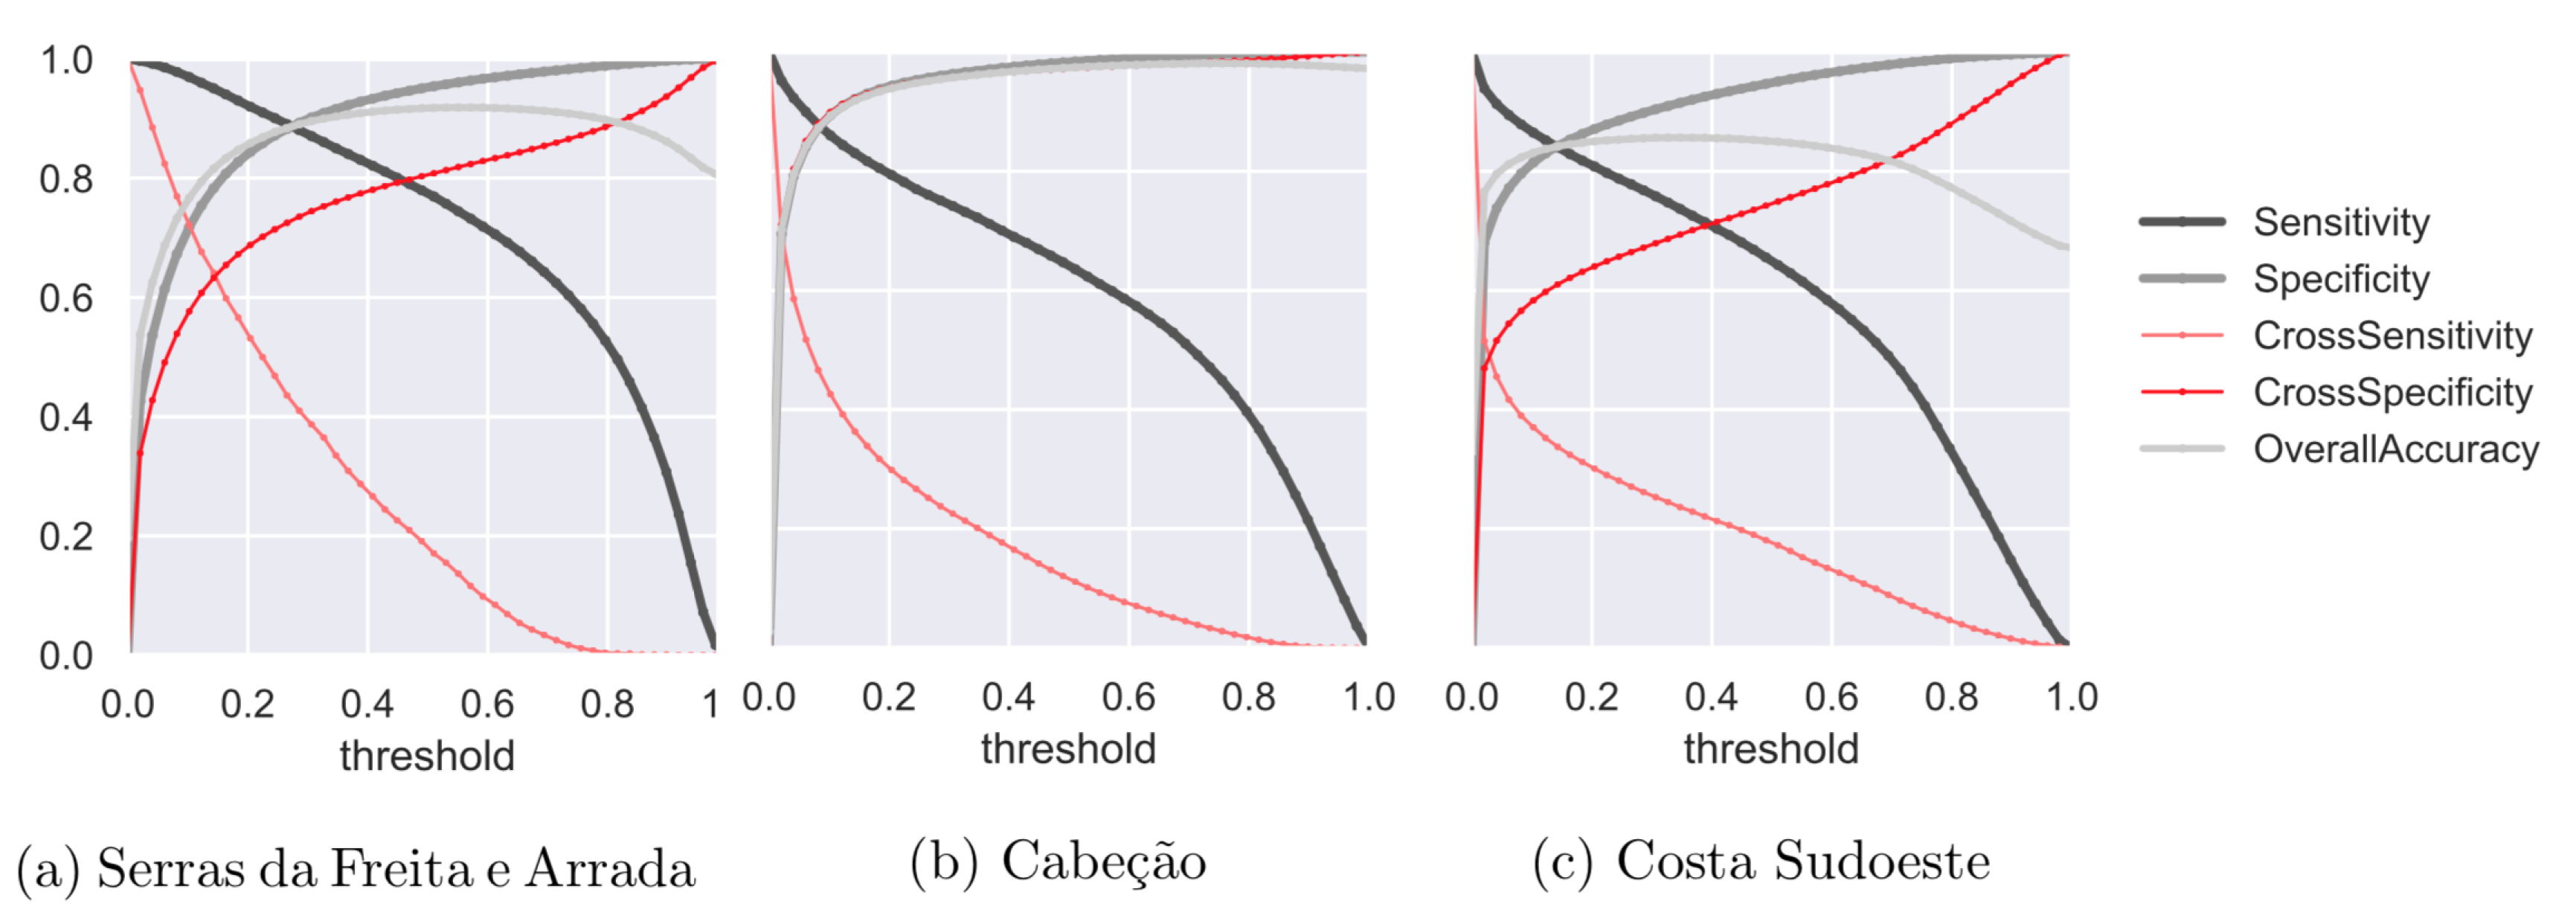
2.4. Algorithm Performance and Validation

In order to get a quantitative insight into the performance of the algorithm the model output was compared to the ground truth maps inside the three validation regions. Once in the validation region in Area (1), which is close to the training region, as well as in the two other sites where validation maps were compiled using Google Earth Imagery, Area (2) and Area (3). Inside the validation areas the polygons of the ground truth map were systematically sampled at a fixed distance of 10 m and were compared to the model output. It was determined if the samples were classified correctly or not and a confusion matrix was compiled to calculate sensitivity, specificity as well as user’s and producer’s accuracies.
The sensitivity of the algorithm expresses its ability to correctly identify pixels as being covered with Eucalyptus, while the specificity serves as a measure to quantify the true negative rate (Pixels correctly identified as Not-Eucalyptus). Sensitivity and specificity were calculated according to
S e n s i t i v i t y = P e u c a l y p t u s = T P T P + F N
where True Positives (TP) refers to the sum of the pixels in the evaluation area that were correctly identified as “Eucalyptus”, False Negatives (FN) refers to the sum of the pixels that were classified as “Not-Eucalyptus” but are in fact covered with Eucalyptus, as well as according to
S p e c i f i c i t y = P n o n e u c a l y p t u s = T N F P + T N
where True Negatives (TN) refers to the sum of the pixels that were predicted to be “Not-Eucalyptus” and are in fact not covered by Eucalyptus, as well as False Positives (FP) which refers to the sum of pixels that were identified as “Eucalyptus” but are in fact not covered by Eucalyptus. The Sensitivity is also referred to as the Producer’s Accuracy for the class Eucalyptus ( P e u c a l y p t u s ). The Specificity is equal to the Producer’s Accuracy for the class Non-Eucalyptus ( P n o n e u c a l y p t u s ).
The user’s accuracy indicates the fraction of pixels mapped as one class that actually have this class assigned in the ground truth map [42].
It was calculated according to
U e u c a l y p t u s = T P T P + F P
for the class Eucalyptus and
U n o n e u c a l y p t u s = T N F N + T N
for the class Non-Eucalyptus.
Additionally the overall accuracy (OA) was computed, which measures how well both classes are predicted. It was calculated according to
O A = T N + T P T N + T P + F N + F P .

2.5. Uncertainty Assessment

Two main sources of uncertainty were identified that influence the classification. Firstly, the uncertainty introduced in the training process: Each time the model is trained, the training data-set is shuffled randomly. This means that in each training process the neural network is presented with the same data, but the order of the items changes and the model can train differently. In order to take this into account, the model was trained 5 times and all areas of interest were evaluated with each trained model to get a set of predictions. These five predictions were averaged to get a mean probability of a pixel being covered by Eucalyptus.
Secondly, the uncertainty introduced by the selection of the threshold: as the threshold is the decisive factor for the separation of the two classes, Eucalyptus and Not-Eucalyptus, the threshold can influence an area estimate directly. To get an idea about the optimal value of the threshold the training area was divided into 31 rectangular subareas. For each sub-area and trained model, an optimal threshold was calculated. To do so, the area predicted as Eucalyptus at 50 thresholds between 0 and 1 was calculated and compared to the actual area calculated from the ground truth map. The two thresholds, which result in area estimates that are the closest to the ground truth result, were interpolated linearly to find an optimal threshold. This process was repeated for each prediction of the 5 trained models and for the 31 sub-areas. The distribution of thresholds has a mean value of μ = 0.53 and a standard deviation of σ = 0.19.

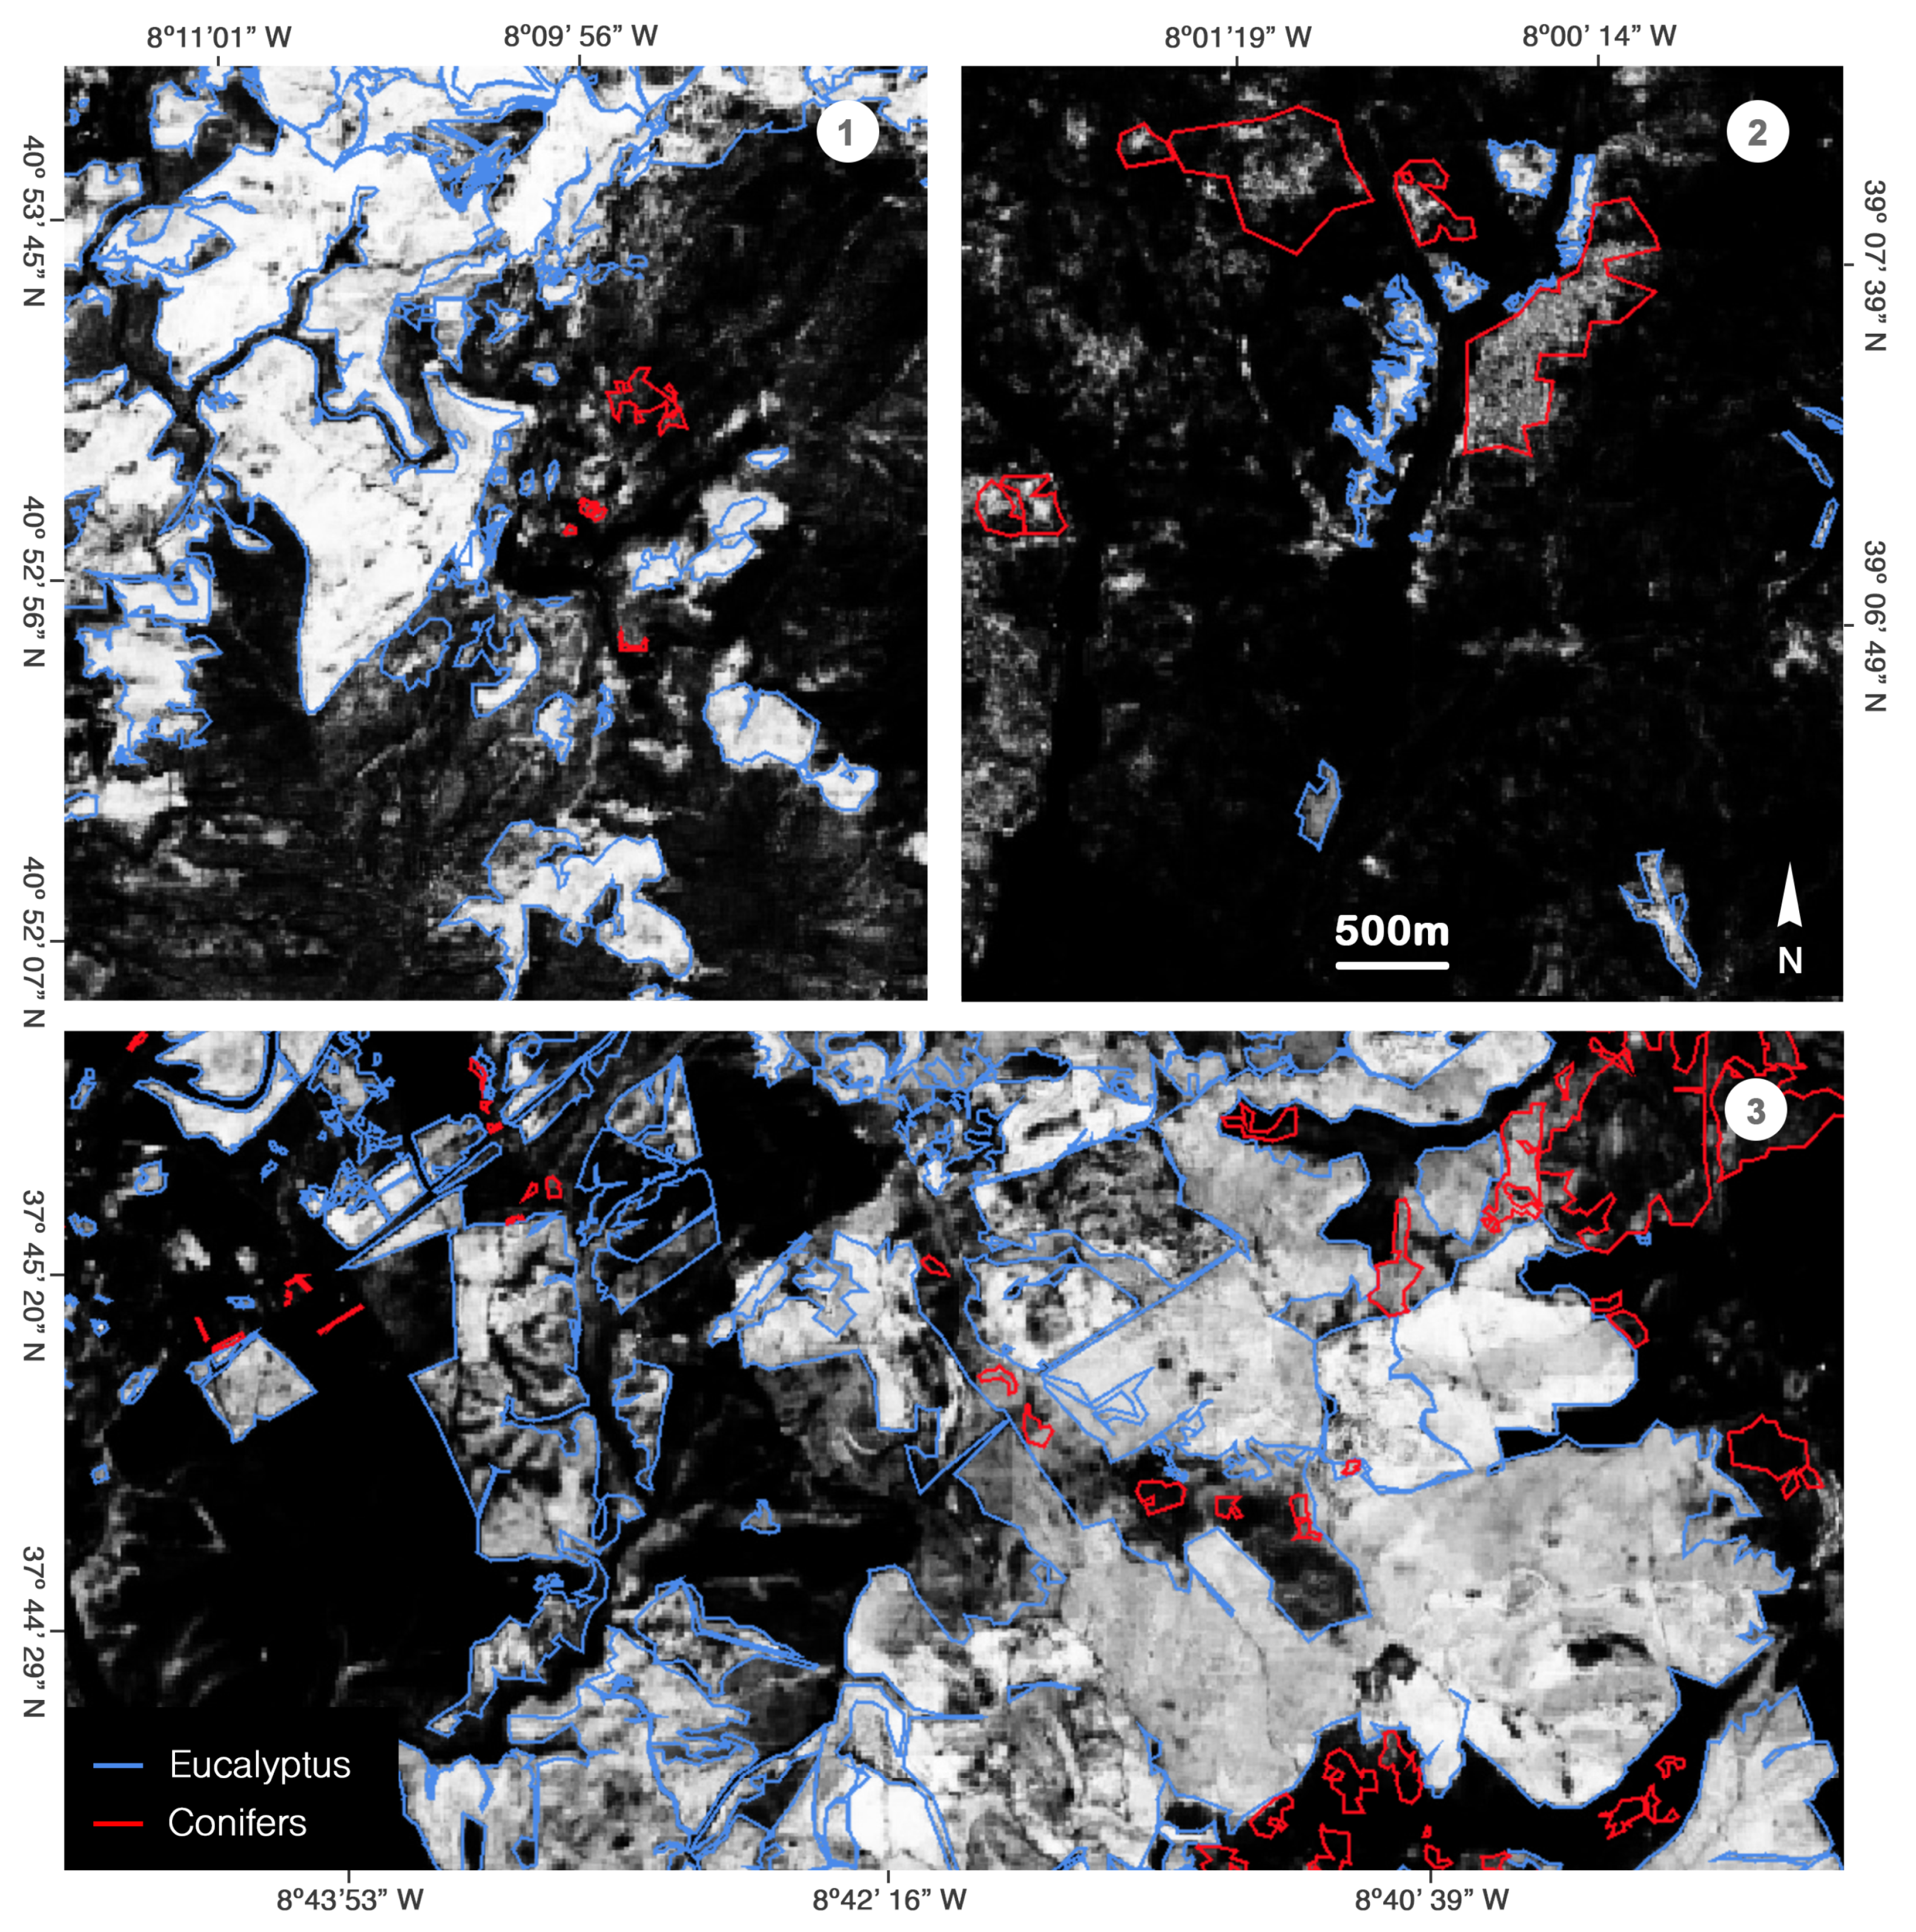
2.6. Qualitative Assessment

It was found that the predicted mean probability of a pixel being covered with Eucalyptus can give insights for early detection of invasive populations that might be missed by looking at a binary classification result only. For example, the mean probability maps serve well to assess areas qualitatively and classify the Natura 2000 sites into “not or only slightly affected”, “affected” as well as “strongly affected”. The mean probability map was viewed for all selected Natura 2000 sites in Portugal. Areas that in most parts show low probability of being covered with Eucalyptus were classified as “not or only slightly affected”. Sites that exhibit high probability to be covered with Eucalyptus in large portions were inspected in more detail by comparison to high resolution Google Earth imagery. The sites which have large portions covered with Eucalyptus were classified as affected. If it was visible from Google Earth imagery that sites had occurrences of Eucalyptus outside regular plantations these sites were classified as strongly affected. Populations were considered outside of regular plantations if it was visible that they were not part of plots with well defined borders (e.g., populations with fuzzy outlines, mixed populations with other forest types, detached incipient populations, etc.).

2.7. Quantitative Assessment and Comparison to Other Data-Sets

Additionally it was attempted to derive a quantitative estimate of the area covered by Eucalyptus trees. Therefore the area of pixels classified as Eucalyptus was calculated using each optimal threshold and each model in Google Earth Engine [32] resulting in a set of area estimates.
This set of estimates was used to calculate a mean and the standard deviation of the estimate. Where stated, uncertainty refers to the standard deviation ( s t d ) of the set of area estimates A (areas calculated for all trained models and all optimal thresholds) divided by the mean ( m e a n ).
U n c e r t a i n t y = s t d ( A ) m e a n ( A )
The results were compared to the Copernicus CORINE land cover data-set [43] and the Tree Canopy Cover data-set by the Global Land Cover Facility [44]. In order to derive a conservative estimate for the percentage of forest that is covered with Eucalyptus, the area estimated by this study was divided by the maximum forest cover of the two data-sets. As forest cover has changed significantly in some regions due to wildfires in the last decade the years 2010, 2012 and 2018 were taken into account. For the Tree Canopy Cover data-set areas with a canopy cover of more than 35% were considered. For the CORINE data-set classes between 211 and 321 were considered. Agricultural areas were included because inspection of the data-set and comparison with satellite imagery showed that much of the Eucalyptus plantations were classified in the agricultural range of the data-set.
In order to compare the study results to forest inventory data, the area covered with Eucalyptus was calculated for rectangular shards inside the evaluation area. This area was then divided by the total area of the shard as well as by the area covered with forests for better comparison with National Forest Inventory (NFI) data.

3. Results

3.1. Model Performance
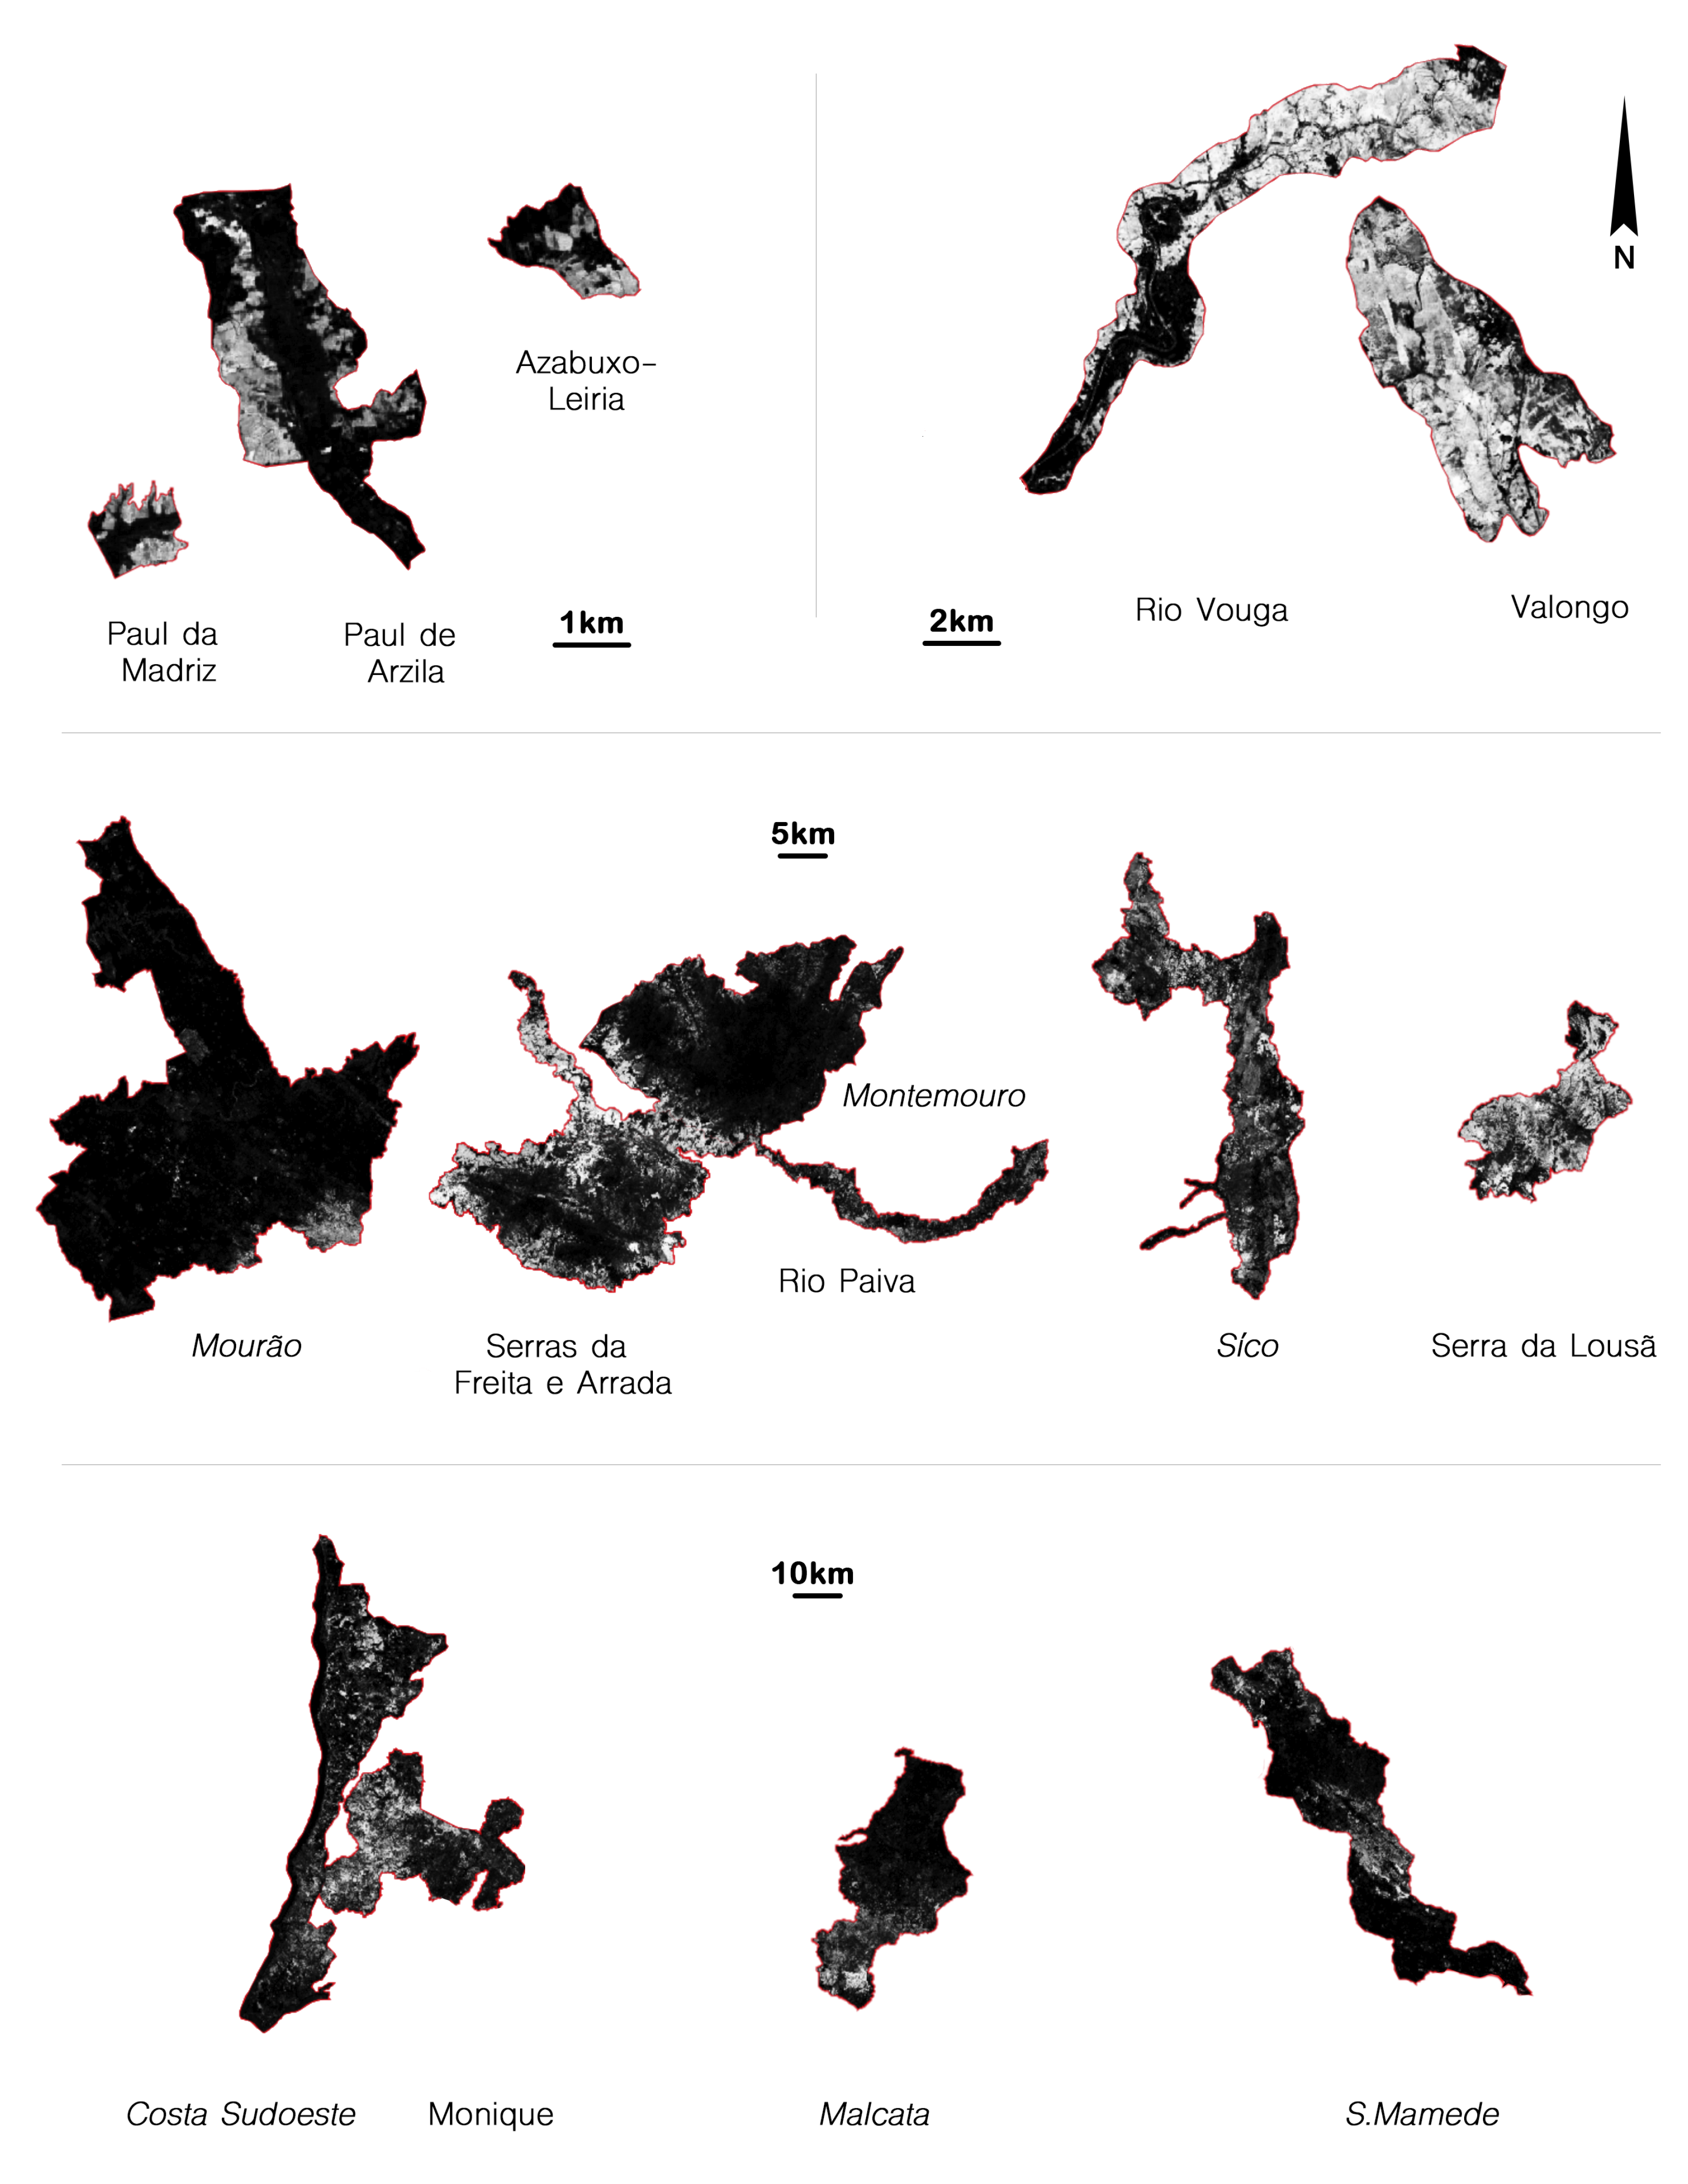
The sensitivity and specificity of the model is visualized for 50 thresholds between 0 and 1 in Figure 5 for the three study sites. In the validation region of Area (1) close to where the model was trained a sensitivity of 0.757 and specificity of 0.958 is observed while the cross-sensitivity for conifers was 0.155 at a threshold of 0.53. In the Cabeção region a sensitivity of 0.623 and a specificity of 0.985 (cross-sensitivity 0.102) was measured at a threshold of 0.53. In the Costa Sudoeste region a sensitivity of 0.629 and a specificity of 0.955 were recorded at the same threshold as well as a cross-sensitivity of 0.163 was measured.
Table 2 shows the confusion matrix of the classification at a threshold of 0.53 for the combined validation regions (Area (1), Area (2) and Area (3) combined). See Table A1, Table A2 and Table A3 for the three areas separately. High per class user’s accuracies were found: 81.4% for Eucalyptus and 94.1% for Non-Eucalyptus predictions. The accuracies for Eucalyptus vary with the validation sites and the user’s accuracy is ranging from 54.9% for Area (2) to 87.1% for Area (3). The OA for the three combined validation regions is 92.5%.

3.2. Predictions

The model predictions were compared to the ground truth maps. As can be seen in Figure 6 high Eucalyptus probabilities correlate well with the plots covered with Eucalyptus in the ground truth map. The areas which are covered with coniferous forests on the contrary mainly correlate with low probabilities. It can also be seen that in some areas the algorithm is cross-sensitive to coniferous forests, falsely marking these with high probabilities of being covered with Eucalyptus. Additionally it is visible, that in both Area (1) and Area (3), the prediction matches the ground truth data better than in Area (2). In Area (2) only small Eucalyptus plantations were present and the result shows that also coniferous forests were marked with moderately high probabilities.
One can also see that, for instance, in Area (2) a binary classification with a single threshold could obscure information. Since it is vital for invasive species control to detect even small incipient populations a probability map can provide a good guide on where to search.
Figure 7 shows the mean probability of the five model realizations for the year 2018 in the evaluation area covering Portugal and parts of Spain as well as all Portuguese Natura 2000 sites that were evaluated in this study. The map reveals the hot-spots of plantations and occurrences of Eucalyptus in the evaluation area and can be used for further analysis.
The results serve well to qualitatively analyze the Eucalyptus cover for Natura 2000 sites. In Table 3 the Natura 2000 sites that were detected to be affected by Eucalyptus are listed. Sites not listed in the table were not found to be significantly affected. The probability map for all affected sites is shown in Figure 8.
The cover with Eucalyptus is visualized for the year 2018 for the western Iberian peninsula in Figure 9. For comparison a map provided by Cerasoli et al. [33] that relies on NFI data is provided. In general the hotspots with high Eucalyptus forest cover found by this study match the NFI-data well. Most hotspots with a Eucalyptus forest cover above 75% in the NFI data-set are also detected by this study. A few exceptions indicating a higher coverage are discussed below.
From Figure 9 it can be seen that uncertainty of area estimates is especially large along the coastline. This can be attributed to the fact that for shards along the coastline the area covered with forests is low compared to the shard size and miss-classifications over seawater lead to inaccurate results. It was also found that, in general, the uncertainty is lower for shards that have a large total area covered with Eucalyptus, i.e., areas with large plantations, as compared to areas with only small populations of Eucalyptus. Some hotspots that were identified by this study which are not reported by the NFI were analysed in more detail using Google Earth Imagery. These hotspots are marked with numbers from 1 to 4 in Figure 9. For hotspot 1 and 2 the estimated Eucalyptus forest cover is larger than what the NFI reports mainly due to the fact that in these regions forest cover is very low and only little missclassifications lead to a high estimated Eucalyptus forest cover. For hotspot 4 it was found that the algorithm is particularly cross-sensitive to coniferous forests and Acacia species in this region. Hotspot 3 on the contrary was identified as covered with Eucalyptus which is not reported by the NFI with a comparable magnitude. Here the NFI here reports a cover of below 25% and this study reports a mean cover of 45%.

4. Discussion

In this study we demonstrated the use of FNNs to detect Eucalyptus forests/trees in the western Iberian Peninsula and later analyzed the Natura 2000 areas in particular, for invasive populations. The invasive behavior of Eucalyptus forests poses a risk to the high biodiversity of Natura 2000 areas and thus their detection is important for sustainable forest management and natural conservation. The classification result for Eucalyptus trees varied strongly with respect to the chosen threshold values in the model output, resulting in different sensitivity, specificity and OA. Thus, different threshold values can be selected as needed, for instance, for classification with high sensitivity or high specificity. With this method, we obtained a classification OA of 92.5%. This is a comparable result to the ones observed by different high-resolution classification studies done by Du et al. [45] for crop area using Worldview-2 satellite data, De Alban et al. [22] for mangrove forest cover and Guirado et al. [46] for tree cover estimation, using various machine learning techniques. Furthermore, our study in some regions showed slightly higher accuracy compared to an earlier study done by Le Maire et al. [23], using MODIS data. Also, our approach showed comparable or better OA, when compared with recent two-class classification studies done using Sentinel-2 imagery: Wessel et al. [47] obtained an OA of 91% using Support Vector Machine techniques to classify beech trees; Hawrylo et al. [48]—OA of 78% using Support Vector Machine techniques for the detection of scot pines; Ottosen et al. [49]—OA of 90% for mapping tree-cover using a k-means unsupervised classification technique; Adjognon et al. [50]—OA of 80% for mapping tree-cover using Random Forest technique. Our approach to automated Eucalyptus detection uses a rather simple, computationally inexpensive, yet effective model. This approach is highly scaleable and could easily be used for other medium to high resolution landcover classification tasks in different parts of the world.
Although this approach showed high accuracy, misclassifications are unavoidable. Various sources of misclassification observed in the study can be attributed to: (1) radiometric error in the imagery and percentage of clouds, (2) error due to mixed/heterogeneous pixel, and (3) error due to the algorithm and its parameters. We paid attention to obtaining cloud free imagery and thus minimized errors due to cloud coverage, and with 10 m resolution Sentinel-2 imagery the error due to mixed pixels is also minimized. Still, errors that can be attributed to the modeling approach, for example, the selection of optimal threshold values can have an impact. For this study the thresholds were calculated by comparison with the ground truth map in multiple small areas which lead to a wide distribution of optimal thresholds and made quantitative estimates challenging.
It is noteworthy to mention that classification accuracy is based on ground-truth data. There could have also been an error in the creation of these ground truth maps, especially the ones derived from Google Earth (for Area 2 and 3). The imagery provided by Google Earth is composed of imagery from different times and the creation of validation maps from it can thus be prone to errors. In the Serras da Freita e Arrada region (Area 1) this source of error was minimized by including ground observations to correct the map. The other two regions have not been validated using in-situ observations. Also the training data is to a large extent based on plantations of Eucalyptus and the samples of incipient populations are underrepresented in the training set which could influence the result. The choice of a training region inside one Natura 2000 area could also affect the result. The creation of validated ground truth maps in further areas and a training of the algorithm in multiple spatially independent regions could lead to a result that can generalize better.
Apart from being cross-sensitive to coniferous forests, it was found that the method is also cross-sensitive to species including several Acacia species such as Acacia mearnsii and Acacia longifolia, which are also considered invasive species in Portugal [8]. The cross-sensitivity of the algorithm could be connected to a similarly higher reflectance in the near-infrared wavelength region of this group of species as compared to Eucalyptus, as it was found for other invading species by Asner et al. [16]. Further investigation and quantification of the cross-sensitivity is necessary.
Finally, our study detected that 15 Natura 2000 areas in Portugal were affected, with nine of them strongly affected by Eucalyptus. These results were validated using Google Earth imagery and further investigation of the sites with field observations could strengthen the findings. As the expansion of Eucalyptus can lead to a replacement of autochthonous species, to a lowering of biodiversity [5] and can affect fungal communities in stream waters [6] further monitoring of these sites should be undertaken. We also call for future research to detect invasive species in the other Natura 2000 areas, especially the Continental and Boreal regions in the European Union. The Continental and Boreal regions are under-represented in terms of ecological research among the Natura 2000 areas [29] and furthermore these areas are experiencing an accelerated global warming [51], making them more vulnerable to biological invasions ([52,53]). Detection of invasive species with machine learning and Sentinel 2 satellite imagery, as shown by this study, could help mitigate the negative impact of these species, by conveying results to stakeholders, such as authorities who are responsible for the management of Natura 2000 sites.

5. Conclusions

Our study emphasizes the importance of multi-spectral satellite imagery for invasive species control and shows the need for monitoring of Eucalyptus especially in protected areas such as Natura 2000 areas in Europe. The results show that some Natura 2000 sites in Portugal are already strongly affected. Other areas are affected but would need sustainable management soon in order to avoid becoming strongly affected too. Our study fills the research gap on multi-site studies covering a large spatial extent of the Natura 2000 network. It is also the first study to provide a map of Eucalyptus occurrences with a 10m spatial resolution for the western Iberian peninsula.
The use of FNNs on Sentinel 2 imagery proved to be a feasible method for invasive species mapping. This method makes it possible to create moderate temporal and spatial resolution maps of Eucalyptus occurrences with an OA of 92.5%, which enable early intervention for invasive species control. More sophisticated modeling and the use of additional data could lead to improved results. Our results show that the method is suitable for qualitative and quantitative assessments and can help inform policymakers and protect Natura 2000 areas from bio-diversity loss.

Author Contributions

Conceptualization, A.F.; Data curation, A.F.; Formal analysis, A.F., A.S. and J.C.; Funding acquisition, J.C.; Investigation, A.F., A.S. and J.C.; Methodology, A.F.; Visualization, A.F.; Writing—original draft, A.F. and A.S.; Writing—review and editing, A.F., A.S. and J.C. All authors have read and agreed to the published version of the manuscript.

Funding

This research was supported in part by the Technical University of Munich - Institute for Advanced Study through the German Excellence Initiative and the European Union Seventh Framework Program under Grant Nr. 291763 and in part by the German Research Foundation (DFG) under Grant Nr. 419317138.

Acknowledgments

We are grateful to Johannes Gensheimer who has contributed to the literature review, to Oana Dociu who has contributed to the spelling and grammar check. Also we thank the association Movimento Gaio, especially Bernardo and Teresa Markowsky who helped with their knowledge as well as with providing infrastructure and transport services during the field campaign.

Conflicts of Interest

The authors declare no conflict of interest. The funders had no role in the design of the study; in the collection, analyses, or interpretation of data; in the writing of the manuscript, or in the decision to publish the results.

Appendix A

Table A1. Confusion Matrix for the model output at a threshold of 0.53 for Area (1).
Reference
EucalyptusNon-EucalyptusTotalUser’s AccuracyProducer’s Accuracy
ModelEucalyptus105,32324,052129,3750.8140.757
Non-Eucalyptus33,744546,950580,6940.9420.958
Total139,067571,002710,069
Table A2. Confusion Matrix for the model output at a threshold of 0.53 for Area (2).
Reference
EucalyptusNon-EucalyptusTotalUser’s AccuracyProducer’s Accuracy
ModelEucalyptus21,01317,26938,2820.5490.623
Non-Eucalyptus12,6971,169,3261,182,0230.9890.985
Total33,7101,186,5951,220,305
Table A3. Confusion Matrix for the model output at a threshold of 0.53 for Area (3).
Reference
EucalyptusNon-EucalyptusTotalUser’s AccuracyProducer’s Accuracy
ModelEucalyptus152,24222,464174,7060.8710.629
Non-Eucalyptus89,787472,182561,9690.8400.955
Total242,029494,646736,675
Table A4. Summary of the Natura 2000 sites that have been found not be affected or only slightly.
Natura 2000 NameSite CodeState
Alvão / MarãoPTCON0003not affected/only slightly
Alvito/CubaPTCON0035not affected/only slightly
Arade / OdeloucaPTCON0052not affected/only slightly
Arrábida / EspichelPTCON0010not affected/only slightly
BarrocalPTCON0049not affected/only slightly
CabeçãoPTCON0029not affected/only slightly
CabrelaPTCON0033not affected/only slightly
CaiaPTCON0030not affected/only slightly
CaldeirãoPTCON0057not affected/only slightly
CambarinhoPTCON0016not affected/only slightly
Carregal do SalPTCON0027not affected/only slightly
Castro VerdePTZPE0046not affected/only slightly
Complexo do AçorPTCON0051not affected/only slightly
Comporta / GaléPTCON0034not affected/only slightly
Côrno do BicoPTCON0040not affected/only slightly
Douro Internacional e Vale do ÁguedaPTZPE0038not affected/only slightly
Dunas de Mira, Gândara e GafanhasPTCON0055not affected/only slightly
Estuário do SadoPTCON0011not affected/only slightly
Estuário do TejoPTCON0009not affected/only slightly
ÉvoraPTZPE0055not affected/only slightly
Fernão Ferro / Lagoa de AlbufeiraPTCON0054not affected/only slightly
GardunhaPTCON0028not affected/only slightly
Peneda / GerêsPTCON0001not affected/only slightly
GuadianaPTCON0036not affected/only slightly
Litoral NortePTCON0017not affected/only slightly
Minas de St. AdriãoPTCON0042not affected/only slightly
MonfortePTZPE0051not affected/only slightly
MonfuradoPTCON0031not affected/only slightly
Montesinho / NogueiraPTZPE0003not affected/only slightly
MoraisPTCON0023not affected/only slightly
Moura / BarrancosPTCON0053not affected/only slightly
Nisa / Lage da PrataPTCON0044not affected/only slightly
Paul do TaipalPTZPE0040not affected/only slightly
Peniche / Sta CruzPTCON0056not affected/only slightly
PiçarrasPTZPE0058not affected/only slightly
ReguengosPTZPE0056not affected/only slightly
Ria de AveiroPTCON0061not affected/only slightly
Ria Formosa / Castro MarimPTCON0013not affected/only slightly
Rio LimaPTCON0020not affected/only slightly
Rio MinhoPTCON0019not affected/only slightly
Rios Sabor e MaçãsPTZPE0037not affected/only slightly
RomeuPTCON0043not affected/only slightly
Serra D’ArgaPTCON0039not affected/only slightly
Serra da EstrelaPTCON0014not affected/only slightly
Serra de MontejuntoPTCON0048not affected/only slightly
Serras d’Aire e CandeeirosPTCON0015not affected/only slightly
Sintra / CascaisPTCON0008not affected/only slightly
Tejo Internacional, Erges e PônsulPTZPE0042not affected/only slightly
Vale do CôaPTZPE0039not affected/only slightly
Vale do GuadianaPTZPE0047not affected/only slightly
VeirosPTZPE0052not affected/only slightly
Vila FernandoPTZPE0053not affected/only slightly

References

  1. Luzar, J. The Political Ecology of a “Forest Transition”: Eucalyptus Forestry in the Southern Peruvian. Ethnobot. Res. Appl. 2007, 5, 85–93. [Google Scholar] [CrossRef] [Green Version]
  2. Kardell, L.; Steen, E.; Fabião, A. Eucalyptus in Portugal—A threat or a promise. Ambio J. Hum. Environ. 1986, XV, 6–13. [Google Scholar]
  3. Doughty, R.W. The Eucalyptus: A Natural and Commercial History of the Gum Tree; Johns Hopkins University Press: Baltimore, MD, USA, 2000. [Google Scholar]
  4. Graça, M.A.; Pozo, J.; Canhoto, C.; Elosegi, A. Effects of Eucalyptus Plantations on Detritus, Decomposers, and Detritivores in Streams. Sci. World J. 2002, 2. [Google Scholar] [CrossRef] [PubMed] [Green Version]
  5. Becerra, P.I.; Catford, J.A.; Luce McLeod, M.; Andonian, K.; Aschehoug, E.T.; Montesinos, D.; Callaway, R.M. Inhibitory effects of Eucalyptus globulus on understorey plant growth and species richness are greater in non-native regions. Glob. Ecol. Biogeogr. 2018, 27, 68–76. [Google Scholar] [CrossRef]
  6. Ferreira, V.; Elosegi, A.; Gulis, V.; Pozo, J.; Graça, M.A.S. Eucalyptus plantations affect fungal communities associated with leaf-litter decomposition in Iberian streams. Arch. Hydrobiol. 2006, 166, 467–490. [Google Scholar] [CrossRef] [Green Version]
  7. Decreto-Lei nr 92/2019. Presidência do Conselho de Ministros Ambiente e Transição Energética-Diário da República-1a Série, Nr. 130/2019, 2019, pp. 3428–3442. Available online: https://dre.pt/home/-/dre/122289404/details/maximized (accessed on 30 April 2020).
  8. Marchante, H.; Morais, M.; Freitas, H.; Marchante, E. Guia Prático Para a Identificação de Plantas Invasoras em Portugal; Coimbra University Press: Coimbra, Portugal, 2014. [Google Scholar]
  9. European Commission (EC). Towards an EU Strategy on Invasive Species COM(2008) 789 Final; Official Journal of the European Union, Publications Office of the European Union: Luxembourg, 2008. [Google Scholar]
  10. Hulme, P.E.; Pyšek, P.; Nentwig, W.; Vilà, M. Will Threat of Biological Invasions Unite the European Union? Science 2009, 324, 40–41. [Google Scholar] [CrossRef] [Green Version]
  11. Council of the European Communities. COUNCIL DIRECTIVE 92/43/EEC of 21 May 1992 on the conservation of natural habitats and of wild fauna and flora. In Official Journal of the European Communities; Council of the European Communities, Publications Office of the European Union: Luxembourg, 1992; pp. 7–51. [Google Scholar]
  12. Council of the European Union. Directive 2009/147/EC of the European Parliament and of the Council of 30 November 2009 on the conservation of wild birds. In Official Journal of the European Union; Council of the European Union, Publications Office of the European Union: Luxembourg, 2009; pp. 7–25. [Google Scholar]
  13. Guth, J.; Kučera, T. Natura 2000 habitat mapping in the Czech Republic: Methods and general results. Ekológia (Bratislava) 2005, 24, 39–51. [Google Scholar]
  14. Delaney, D.G.; Sperling, C.D.; Adams, C.S.; Leung, B. Marine invasive species: Validation of citizen science and implications for national monitoring networks. Biol. Invasions 2008, 10, 117–128. [Google Scholar] [CrossRef]
  15. Hestir, E.L.; Khanna, S.; Andrew, M.E.; Santos, M.J.; Viers, J.H.; Greenberg, J.A.; Rajapakse, S.S.; Ustin, S.L. Identification of invasive vegetation using hyperspectral remote sensing in the California Delta ecosystem. Remote Sens. Environ. 2008, 112, 4034–4047. [Google Scholar] [CrossRef]
  16. Asner, G.P.; Jones, M.O.; Martin, R.E.; Knapp, D.E.; Hughes, R.F. Remote sensing of native and invasive species in Hawaiian forests. Remote Sens. Environ. 2008, 112, 1912–1926. [Google Scholar] [CrossRef]
  17. Bogich, T.L.; Liebhold, A.M.; Shea, K. To sample or eradicate? A cost minimization model for monitoring and managing an invasive species. J. Appl. Ecol. 2008, 45, 1134–1142. [Google Scholar] [CrossRef]
  18. Sun, A.Y.; Scanlon, B.R. How can Big Data and machine learning benefit environment and water management: A survey of methods, applications, and future directions. Environ. Res. Lett. 2019, 14, 073001. [Google Scholar] [CrossRef]
  19. Baccini, A.; Laporte, N.; Goetz, S.J.; Sun, M.; Dong, H. A first map of tropical Africa’s above-ground biomass derived from satellite imagery. Environ. Res. Lett. 2008, 3, 045011. [Google Scholar] [CrossRef] [Green Version]
  20. Omer, G.; Mutanga, O.; Abdel-Rahman, E.; Adam, E. Performance of Support Vector Machines and Artificial Neural Network for Mapping Endangered Tree Species Using WorldView-2 Data in Dukuduku Forest, South Africa. IEEE J. Sel. Top. Appl. Earth Observ. Remote Sens. 2015, 8, 1–16. [Google Scholar] [CrossRef]
  21. Estel, S.; Kuemmerle, T.; Levers, C.; Baumann, M.; Hostert, P. Mapping cropland-use intensity across Europe using MODIS NDVI time series. Environ. Res. Lett. 2016, 11, 024015. [Google Scholar] [CrossRef] [Green Version]
  22. Alban, J.D.T.D.; Jamaludin, J.; de Wen, D.W.; Than, M.M.; Webb, E.L. Improved estimates of mangrove cover and change reveal catastrophic deforestation in Myanmar. Environ. Res. Lett. 2020, 15, 034034. [Google Scholar] [CrossRef]
  23. Le Maire, G.; Dupuy, S.; Nouvellon, Y.; Loos, R.A.; Hakamada, R. Mapping short-rotation plantations at regional scale using MODIS time series: Case of eucalypt plantations in Brazil. Remote Sens. Environ. 2014, 152, 136–149. [Google Scholar] [CrossRef]
  24. Dias, D.; Dias, U.; Menini, N.; Lamparelli, R.; Maire, G.L.; Torres, R. Pixelwise Remote Sensing Image Classification Based on Recurrence Plot Deep Features. In Proceedings of the IGARSS 2019—2019 IEEE International Geoscience and Remote Sensing Symposium, Yokohama, Japan, 28 July–2 August 2019; pp. 1310–1313. [Google Scholar] [CrossRef]
  25. Shoko, C.; Mutanga, O. Examining the strength of the newly-launched Sentinel 2 MSI sensor in detecting and discriminating subtle differences between C3 and C4 grass species. ISPRS J. Photogramm. Remote Sens. 2017, 129, 32–40. [Google Scholar] [CrossRef]
  26. Förster, M.; Schmidt, T.; Wolf, R.; Kleinschmit, B.; Fassnacht, F.E.; Cabezas, J.; Kattenborn, T. Detecting the spread of invasive species in central Chile with a Sentinel-2 time-series. In Proceedings of the 2017 9th International Workshop on the Analysis of Multitemporal Remote Sensing Images (MultiTemp), Brugge, Belgium, 27–29 June 2017; pp. 1–4. [Google Scholar] [CrossRef]
  27. Laurin, G.V.; Puletti, N.; Hawthorne, W.; Liesenberg, V.; Corona, P.; Papale, D.; Chen, Q.; Valentini, R. Discrimination of tropical forest types, dominant species, and mapping of functional guilds by hyperspectral and simulated multispectral Sentinel-2 data. Remote Sens. Environ. 2016, 176, 163–176. [Google Scholar] [CrossRef] [Green Version]
  28. Schmidt, J.; Fassnacht, F.E.; Förster, M.; Schmidtlein, S. Synergetic use of Sentinel-1 and Sentinel-2 for assessments of heathland conservation status. Remote Sens. Ecol. Conserv. 2018, 4, 225–239. [Google Scholar] [CrossRef] [Green Version]
  29. Orlikowska, E.H.; Roberge, J.M.; Blicharska, M.; Mikusiński, G. Gaps in ecological research on the world’s largest internationally coordinated network of protected areas: A review of Natura 2000. Biol. Conserv. 2016, 200, 216–227. [Google Scholar] [CrossRef]
  30. Mazaris, A.D.; Katsanevakis, S. The threat of biological invasions is under-represented in the marine protected areas of the European Natura 2000 network. Biol. Conserv. 2018, 225, 208–212. [Google Scholar] [CrossRef]
  31. Corbane, C.; Lang, S.; Pipkins, K.; Alleaume, S.; Deshayes, M.; Elena, V.; Strasser, T.; Vanden Borre, J.; Toon, S.; Michael, F. Remote sensing for mapping natural habitats and their conservation status—New opportunities and challenges. Int. J. Appl. Earth Observ. Geoinf. 2015, 37, 7–16. [Google Scholar] [CrossRef]
  32. Gorelick, N.; Hancher, M.; Dixon, M.; Ilyushchenko, S.; Thau, D.; Moore, R. Google Earth Engine: Planetary-scale geospatial analysis for everyone. Remote Sens. Environ. 2017. [Google Scholar] [CrossRef]
  33. Cerasoli, S.; Caldeira, M.C.; Pereira, J.S.; Caudullo, G.; de Rigo, D. Eucalyptus globulus and other eucalypts in Europe: Distribution, habitat, usage and threats. In European Atlas of Forest Tree Species; San-Miguel-Ayanz, J., de Rigo, D., Caudullo, G., Houston Durrant, T., Mauri, A., Eds.; Publication Office of the European Union: Luxembourg, 2016; p. e01b5bb+. Available online: https://w3id.org/mtv/FISE-Comm/v01/e01b5bb (accessed on 30 April 2020).
  34. Wang, X.; Xiao, J.; Li, X.; Cheng, G.; Ma, M.; Zhu, G.; Arain, M.A.; Black, T.A.; Jassal, R.S. No trends in spring and autumn phenology during the global warming hiatus. Nat. Commun. 2019, 10, 1–10. [Google Scholar] [CrossRef] [PubMed]
  35. European Space Agency. MultiSpectral Instrument (MSI) Overview; European Space Agency: Paris, France, 2020. [Google Scholar]
  36. Foody, G.M.; Cutler, M.E.J. Tree biodiversity in protected and logged Bornean tropical rain forests and its measurement by satellite remote sensing. J. Biogeogr. 2003, 30, 1053–1066. [Google Scholar] [CrossRef]
  37. Raczko, E.; Zagajewski, B. Comparison of support vector machine, random forest and neural network classifiers for tree species classification on airborne hyperspectral APEX images. Eur. J. Remote Sens. 2017, 50, 144–154. [Google Scholar] [CrossRef] [Green Version]
  38. Xie, G.; Niculescu, S.; Lam, N.; Seveno, E. Machine Learning Methods and Classification of Vegetation in Brest, France, Proc. SPIE 11157, Remote Sensing Technologies and Applications in Urban Environments IV, 111570J; International Society for Optics and Photonics: Bellingham, WA, USA, 2019; p. 23. [Google Scholar] [CrossRef]
  39. Arboleda, E.R.; Fajardo, A.C.; Medina, R.P. Classification of coffee bean species using image processing, artificial neural network and K nearest neighbors. In Proceedings of the 2018 IEEE International Conference on Innovative Research and Development (ICIRD), Bangkok, Thailand, 11–12 May 2018; pp. 1–5. [Google Scholar]
  40. Kingma, D.P.; Ba, J. Adam: A Method for Stochastic Optimization. arXiv 2014, arXiv:cs.LG/1412.6980. [Google Scholar]
  41. Chollet, F.E.A. Keras. Available online: https://keras.io (accessed on 1 April 2020).
  42. Olofsson, P.; Foody, G.M.; Herold, M.; Stehman, S.V.; Woodcock, C.E.; Wulder, M.A. Good practices for estimating area and assessing accuracy of land change. Remote Sens. Environ. 2014, 148, 42–57. [Google Scholar] [CrossRef]
  43. European Environment Agency. Corine Land Cover 2018 (Version 20); European Environment Agency: Copenhagen, Denmark, 2019. [Google Scholar]
  44. Global Land Cover Facility. Tree Canopy Cover; Global Land Cover Facility: College Park, MD, USA, 2010. [Google Scholar]
  45. Du, Z.; Yang, J.; Ou, C.; Zhang, T. Smallholder Crop Area Mapped with a Semantic Segmentation Deep Learning Method. Remote Sens. 2019, 11, 888. [Google Scholar] [CrossRef] [Green Version]
  46. Guirado, E.; Alcaraz-Segura, D.; Cabello, J.; Puertas-Ruíz, S.; Herrera, F.; Tabik, S. Tree Cover Estimation in Global Drylands from Space Using Deep Learning. Remote Sens. 2020, 12, 343. [Google Scholar] [CrossRef] [Green Version]
  47. Wessel, M.; Brandmeier, M.; Tiede, D. Evaluation of Different Machine Learning Algorithms for Scalable Classification of Tree Types and Tree Species Based on Sentinel-2 Data. Remote Sens. 2018, 10, 1419. [Google Scholar] [CrossRef] [Green Version]
  48. Hawryło, P.; Bednarz, B.; Wężyk, P.; Szostak, M. Estimating defoliation of Scots pine stands using machine learning methods and vegetation indices of Sentinel-2. Eur. J. Remote Sens. 2018, 51, 194–204. [Google Scholar] [CrossRef] [Green Version]
  49. Ottosen, T.B.; Petch, G.; Hanson, M.; Skjøth, C.A. Tree cover mapping based on Sentinel-2 images demonstrate high thematic accuracy in Europe. Int. J. Appl. Earth Observ. Geoinf. 2020, 84, 101947. [Google Scholar] [CrossRef]
  50. Adjognon, G.S.; Rivera-Ballesteros, A.; van Soest, D. Satellite-based tree cover mapping for forest conservation in the drylands of Sub Saharan Africa (SSA): Application to Burkina Faso gazetted forests. Dev. Eng. 2019, 4, 100039. [Google Scholar] [CrossRef]
  51. Ruosteenoja, K.; Markkanen, T.; Räisänen, J. Thermal seasons in northern Europe in projected future climate. Int. J. Climatol. 2019. [Google Scholar] [CrossRef] [Green Version]
  52. Simberloff, D.; Martin, J.L.; Genovesi, P.; Maris, V.; Wardle, D.A.; Aronson, J.; Courchamp, F.; Galil, B.; García-Berthou, E.; Pascal, M.; et al. Impacts of biological invasions: What’s what and the way forward. Trends Ecol. Evol. 2013, 28, 58–66. [Google Scholar] [CrossRef] [PubMed] [Green Version]
  53. Ahmad, R.; Khuroo, A.A.; Charles, B.; Hamid, M.; Rashid, I.; Aravind, N. Global distribution modelling, invasion risk assessment and niche dynamics of Leucanthemum vulgare (Ox-eye Daisy) under climate change. Sci. Rep. 2019, 9, 1–15. [Google Scholar] [CrossRef] [Green Version]
Figure 1. Regions that were selected for training (light red rectangle), validation (gray rectangle) and evaluation (white rectangles) of the model. Site number (1) is located in the Serras da Freita e Arada area, site number (2) in the Cabeção area and site number (3) in the Costa Sudoeste region. The ground truth map for Eucalyptus (black) and Conifers (red) is overlaid.
Remotesensing 12 02176 g001
Figure 2. In the left pane shows parts of the compiled ground truth map consisting of polygons that were drawn manually for Eucalyptus and Coniferous forests. Samples of high resolution Google Earth imagery used to create this map are shown on the right. The 320 m × 320 m neighborhood region that is considered by the model as an input is visualized as an overlay.
Remotesensing 12 02176 g002
Figure 3. Visualization of the data-set and the model architecture. Dense layers consist of a number (in brackets) of artificial neurons that are fully connected to the adjoining layers. “Relu” refers to rectified linear units and “sigmoid” refers to units that have a sigmoidal activation function.
Remotesensing 12 02176 g003
Figure 4. Model output showing the probability of each pixel being covered with Eucalyptus trees. The probability is represented as a grayscale value from 0 (black) to 1 (white). In the thresholded binary image, the two classes “Eucalyptus” and “Not-Eucalyptus” are displayed as white and black respectively.
Remotesensing 12 02176 g004
Figure 5. Model performance for the validation regions in three different study locations. The continuous output of the model was thresholded at 50 values between 0 and 1. For each threshold (abscissa) the sensitivity and specificity (ordinate) was calculated. Both cross-sensitivity and cross-specificity were calculated using ground truth maps for coniferous forests in the respective regions.
Remotesensing 12 02176 g005
Figure 6. Plots of Eucalyptus (blue outlines) and coniferous (red outlines) forests in the three study areas (1–3). The predicted mean probability of a pixel being covered with Eucalyptus trees is shown in the range from 0 (black) to 1 (white) for the year 2018.
Remotesensing 12 02176 g006
Figure 7. Map of the evaluation area. The determined mean probability of a pixel being covered with Eucalyptus is shown for the study area in the range from 0 (black) to 1 (white) for the year 2018. The Natura 2000 areas that were studied are highlighted with red outlines. The landmass is visualized as a gray background.
Remotesensing 12 02176 g007
Figure 8. Map of Natura 2000 areas that are in large parts covered with Eucalyptus. The determined mean probability of a pixel being covered with Eucalyptus is shown for the study area in the range from 0 (black) to 1 (white) for the year 2018. Names of affected sites in italic font. Strongly affected sites in regular font.
Remotesensing 12 02176 g008
Figure 9. Distribution of areas covered with Eucalyptus in the western Iberian peninsula for the year 2018. The top map shows the percentage of the total area that is covered with Eucalyptus. The bottom map visualizes the percentage that is covered with Eucalyptus with respect to the maximum forest cover (FC) in the years between 2010 and 2018. Uncertainty of the estimates is shown in a separate map. For comparison a map based on data published by Cerasoli et al. [33] which relies on National Forest Inventory (NFI) data for the year 2015 is shown.
Remotesensing 12 02176 g009
Table 1. Bands of the two Sentinel 2 multispectral instruments used in this study [35].
Band NumberS2AS2BSpatial
Resolution (m)
Central
Wavelength (nm)
Bandwidth (nm)Central
Wavelength (nm)
Bandwidth (nm)
1442.721442.32160
2492.466492.16610
3559.836559.03610
4664.631665.03110
5704.115703.81620
6740.515739.11520
7782.820779.72020
8832.8106833.010610
8a864.721864.02220
9945.120943.22160
101373.5311376.93060
111613.7911610.49420
122202.41752185.718520
Table 2. Confusion Matrix for the model output at a threshold of 0.53 for all three validation regions combined.
Reference
EucalyptusNon-EucalyptusTotalUser’s AccuracyProducer’s Accuracy
ModelEucalyptus278,57863,785342,3630.8140.672
Non-Eucalyptus136,2282,188,4582,324,6860.9410.972
Total414,8062,252,2432,667,049
Table 3. Summary of the affected Natura 2000 sites that are in large parts covered with Eucalyptus. Strongly affected sites were found to have populations of Eucalyptus outside of regular plantations. See Table A4 for sites that have been found to be not affected or only slightly.
Natura 2000 NameSite CodeState
Azabuxo-LeiriaPTCON0046strongly affected
Costa SudoestePTCON0012affected
MalcataPTCON0004affected
MonchiquePTCON0037strongly affected
MontemuroPTCON0025affected
Mourão/Moura/BarrancosPTZPE0045affected
Paul da MadrizPTZPE0006strongly affected
Paul de ArzilaPTCON0005strongly affected
Rio PaivaPTCON0059strongly affected
Rio VougaPTCON0026strongly affected
S. MamedePTCON0007affected
Serras da Freita e AradaPTCON0047strongly affected
Serra da LousãPTCON0060strongly affected
Sicó / AlvaiázerePTCON0045affected
ValongoPTCON0024strongly affected

