Abstract
Transformation to Continuous Cover Forestry (CCF) is a long and difficult process in which frequent management interventions rapidly alter forest structure and dynamics with long lasting impacts. Therefore, a critical component of transformation is the acquisition of up-to-date forest inventory data to direct future management decisions. Recently, the use of single tree detection methods derived from unmanned aerial vehicle (UAV) has been identified as being a cost effective method for inventorying forests. However, the rapidly changing structure of forest stands in transformation amplifies the difficultly in transferability of current individual tree detection (ITD) methods. This study presents a novel ITD Bayesian parameter optimisation approach that uses quantile regression and external biophysical tree data sets to provide a transferable and low cost ITD approach to monitoring stands in transformation. We applied this novel method to 5 stands in a variety of transformation stages in the UK and to a independent test study site in California, USA, to assess the accuracy and transferability of this method. Requiring small amounts of training data (15 reference trees) this approach had a mean test accuracy (F-score = 0.88) and provided mean tree diameter estimates (RMSE = 5.6 cm) with differences that were not significance to the ground data (p < 0.05). We conclude that this method can be used to monitor forests stands in transformation and thus can also be applied to a wide range of forest structures with limited manual parameterisation between sites.
1. Introduction
The Intergovernmental Panel on Climate Change (IPCC) has identified climate change as a major threat to agriculture, food security and the livelihood of millions of people across the globe [1]. Forests are particularly at risk, as their long life span does not permit rapid adaptation to environmental change [2]. Climate change is predicted to alter: relative abundance of tree species within forests; tree phenology and frequency and intensity of disturbance mechanisms, including wind and forest pests [3]. Planted forests have been identified as being especially susceptible to climate change as they are generally dominated by only one or a few tree species with limited genetic diversity [4].
In its origins around the world, plantation forestry was an entity focused on producing wood products such as fuelwood or timber [5]. In the 1980s, a new paradigm emerged which emphasised the potential to manage forests for range of ecosystem services alongside more traditional forest commodities [6]. In the UK this approach is named under the collective umbrella of Continuous Cover Forestry (CCF). CCF is a management approach that maintains forest cover over time, by the selective felling of single or small patches of trees, which aims to produce a more diverse forest structure [7]. CCF silvicultural principles, such as promoting structural diversity is well suited to assist making plantations less vulnerable to the effects of climate change [8]. Transformation of even-aged plantations to CCF is a long and difficult task which needs frequent management interventions [9]. A single management intervention can have considerable, long term impacts on forest structure [10] and has been suggested to be comparable to natural pathogen infestation and sporadic fire [11]. Therefore, new methods are needed for monitoring transformation which are cost and time effective when compared against traditional field data collection methods to assist in informing management interventions.
Unmanned aerial vehicle (UAV) offer opportunities for rapid collection of remotely sensed data from which forest metrics can be achieved [12,13]. Progression of computer power and dense image matching techniques has enabled the development of dense photogrammetric points clouds from UAVs [14]. Photogrammetric generated points clouds are passive and produce detailed Canopy Height Models (CHM) but are limited in their ability to penetrate the forest canopy [15,16]. However, photogrammetry is a low cost alternative to Light Detection and Ranging (LiDAR), and enhances the possibility of using high temporal and spatial resolution to monitor of forest [17]. This development has opened up the opportunity for Individual Tree Detection (ITD), which enables detailed information to be retrieved on a tree by tree basis [18], which is vital in assisting with monitoring forests through transformation to CCF [19]. ITD methods revolve around three sequential steps which involve tree detection, feature extraction and estimation of tree attributes [20]. A variety of approaches have been developed to delineate individual trees from both LiDAR and photogrammetry [21], but generally they can be divided into two categories, i.e., raster based and point based methods. Point based methods are usually considered more computationally demanding but allows the whole three-dimensional data to be considered. To-date raster based approaches have been preferred in ITD studies [22]. A variety of approaches to delineating individual trees from the CHM have been developed: local maxima detection, valley following, template matching and marked point processes [23,24,25]. Raster based approaches are relatively more simple, computationally efficient over large areas and the CHM can be generated using cost effective photogrammetry.
The performance of ITD methods has been found to vary with forest structure [26], species [27] and sensor type [28]. Achieving optimal ITD accuracies is heavily dependant upon two factors: (i) the extraction methods [29], and (ii) the parameter combinations [30,31]. Investigation into parameter choice in ITD is in its infancy, with the majority of studies conducting sensitivity analyses by changing one parameter at a time whilst keeping the other constant (instead of globally) [31,32], thereby not integrating multi-way parameter interaction [33,34]. Monitoring transformation using ITD methods is made additionally challenging by rapid structural alterations which occur during selective tree felling to promote natural regeneration. Selective felling has been found to alter the allometric relationships of the remaining trees and therefore ITD parameterisation is necessary to incorporate these changes and is vital in determining transferability of ITD methods across stages of transformation [35,36]. Therefore, ITD methods used to monitor transformation to CCF must be able to efficiently and accurately self-parametrise to different forest structures to maintain cost effectiveness.
This study address the aforementioned practical challenges by: (i) presenting a novel Bayesian optimisation approach of parameterising an ITD framework that uses external tree data, removing the need for site specific allometric models, (ii) demonstrate the effectiveness of this framework against combinations of fixed sized local maxima search windows which is a well established ITD approach and, (iii) investigate the transferability of this approach to retrieve tree biophysical variables from forest stands in a range of transformation stages.
2. Materials and Methods
2.1. Study Sites
Five study sites located in the UK were identified by experienced CCF practitioners as being in differing stages of transformation to CCF.
Sites 1 to 4 are forest stands located in Bryn Arau Duon, Carmarthenshire, Wales (520724.0, 35002) (Figure 1). Sites 1, 3 and 4 represent “promoting regeneration” and site 2 represents the “differentiation” stage of Schütz [9] transformation stages. Bryn Arau Duon is a 600 ha Sitka Spruce (Picea sitchensis (Bong.) Carr.) dominated plantation, standing at an elevation of 400 m. The initial planting density was 2500 (stems ha−1). Stands 1 to 4 were planted between 1973 and 1980 and the first thinnings for the stands were carried out between 2002 and 2004. Since then the stands have been regularly thinned in order to progress them through transformation stages. Site 5 is located in Wiltshire, England at Stourhead Estate (510646.8, 22103). This mixed species stand is dominated by Douglas fir (Pseudotsuga menziesii (Mirb) Franco.), with the presence of other coniferous species (e.g., Picea abies (L.) Karst., Larix europea Mill.) and broadleaves species (e.g., Quercus robur L., Fraxinus excelsior L., Alnus glutinosa L. Gaertn.). Site 5 has formally been in transformation to CCF since 1997 and is the most diverse in terms of structure and tree species of the study sites and represents the “structuration” stage of Schütz [9] transformation stages (Table 1).
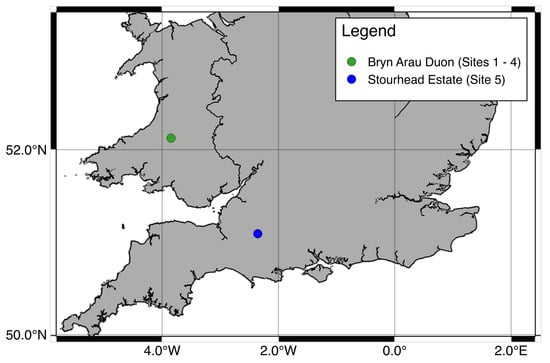
Figure 1.
Location of study sites. Sites one to four are located in Bryn Arau Duon and site five is located in the Stourhead Estate.

Table 1.
Stand information.
2.1.1. UAV Photogrammetry Data
UAV data were acquired during the winters of 2018 and 2019 using a DJI Phantom 4 advanced. The Phantom 4 advanced is a low cost (<£1800), off-the-shelf drone which has proven to be capable of retrieving forest structure variables [37]. The imaging sensor used was a 1-inch 20 megapixels red, green and blue (RGB) sensor with mechanical shutter and focal length of 8.8 mm. Shutter speed, aperture and ISO were left automatic in order to adjust to changes of light conditions.
The sites were flown at 90 m Above Ground Level (AGL), North to South with a 90% forward and 80% sides ways overlap to ensure efficient coverage and high resolution images. The images were processed through Agisoft Photoscan v1.0.0 software to generate a digital surface model (DSM) and orthomosaic. Agisoft Metashape v1.4.0 (www.agisoft.com) software (Agisoft LLC, St. Petersburg, Russia) is a commercial software that uses structure from motion to generate a 3D reconstruction from a collection of overlapping photographs, providing a dense and accurate 3D point cloud [38]. Detailed descriptions of the Agisoft Metashape workflow can be found in Lucieer et al. [39] and Turner et al. [40]. To collect information on tree height, digital terrain models (DTMs) were generated by extracting the lowest photogrammetric points and interpolating between them using an inverse distance weighting method [41]. Using the processed data and images which were generated through Agisoft Metashape, a canopy height model (CHM) was generated using the following equation, from which tree variables were extracted:
The imagery was georeferenced using absolute GPS coordinates from a minimum of 5 Differential Global Positioning System points for each site. This has been shown to increase horizontal/vertical accuracy of the photogrammetric product [42].
2.1.2. Forest Inventory
A ground survey collected biophysical parameters for individual trees for sites 1–5 using a variable plot based on a Basal Area Factor (BAF) of three, following the AFI plot protocol [43]. The coordinates of the centre of inventory plots were recorded with a Trimble R10 GNSS receiver and post processed using local base stations to achieve sub-meter accuracy. Plot centres were randomly located in the forests and a BAF of 3 was used to identify trees to be included in the measurements. Trees which met the BAF requirement had their diameter, height (Vertex V® hypsometer (Langsele, Sweden)), four crown radius measurements (InLife 40 m/131 ft Laser Distance) and distance and bearing from the centre of the plot recorded. This sampling method has been used at these sites since they started to undergo transformation to CCF. In total 35 plots were used to produce 515 reference trees.
2.2. Independent Study Site
An independent study site located in the Teakettle Experimental Forest (TEF), California was used to investigate the transferablility of this approach to differing forest structures. The TEF is located in the Southern Sierra Nevada Mountains (365800, 19 0100). The TEF is a mixed conifer forest, with red fir (Abies magnifica A. Murray) and white fir (Abies concolor (Gord. & Glend.) Hildebr.) consisting of around 86% of the basal area, while the remaining 14% consisting of Jeffrey pine (Pinus jeffreyi Grev.), white sugar pine (Pinus lambertiana Dougl.) and incense cedar (Calocedrus decurrens Torr.). The study site in total was 1600 ha in a south-to-north oriented strip.
2.2.1. LiDAR Data—Independent Study Site
Airborne LiDAR was collected from 28th June to 6th July 2017 by the NEON AOP onboard a DeHavilland DHC-6 Twin Otter aircraft, which returned approximately four laser points per square meter. A CHM was derived for the site in the Teakettle Experimental Forest from the LiDAR point cloud and was used for further analysis. The LiDAR data is publicly available on the NEON Data Portal (http://data.neonscience.org/).
2.2.2. Forest Inventory—Independent Study Site
The independent study site reference tree data consisted of combining eight forest transects which recorded species, stem diameter and plot data collected by the University of New Mexico which were used to investigate thinning effects on forest structure and dynamics [44]. Reference trees with poor horizontal GPS accuracy (>1 m) were removed and trees with diameter < 7.5 cm were also removed to maintain consistency with Sites 1–5. The remaining reference trees had their crowns manually digitised using the CHM and orthomosaic. This resulted in 713 reference trees which ranged from 7.5 cm to 90 cm diameter. Further information on the field data collection and study site can be found at Fricker et al. [45].
2.3. Secondary Tree Data
An external data set of biophysical tree measurements were used to derive allometric relationships utilised in the ITD framework. The Association Futaie Irrégulière (AFI) was formed in France in 2001 to promote the silviculture of irregular forest stands [43]. The AFI established a network of research stands across France and the UK to monitor and demonstrate irregular silviculture. In doing so the network has accumulated an extensive data set of 63,000 trees with measurements on tree height, diameter, crown radius and species. The AFI data set was used to build the height-diameter (h-d) and height-crown radius (h-cr) models utilised in the ITD framework.
2.4. Individual Tree Detection
2.4.1. Bayesian Optimisation Variable Window (BOVW)
Parametrisation of ITD is an important aspect of achieving optimal tree segmentation results [30]. Many previous studies have focused on selecting ITD parameters by using site specific allometric relationships derived from field data [46], extensive parameter grid searches [47] and parameter sets based on prior studies [48]. These approaches to parameter selection either require the collection of additional field measurements, are inefficient or are not parametrised to achieve the optimal results for the site. The method presented here addresses the issues by adopting a Bayesian Optimisation (BO) approach to ITD parametrisation which utilises external datasets. BO is commonly used approach in environmental sciences [49], medical research and is gaining traction in aspects of forestry research [50]. BO investigates the influence of parameters on an objective function and attempts to improve the result through informed choice. The parameter space is characterised using a probability distribution which is updated iteratively. The advantage being that the parameters are progressively refined by informed choice, making BO highly efficient, reducing the number of iterations necessary to identify optimal parameter combinations. In this study, BO was carried out using the R package “rBayesianOptimization” which implements a BO with Gaussian processes.
The BOVW framework goes through the following steps for ITD (Figure 2): (a) the CHM resolution is set. If the CHM is too-course then a higher number of undetected trees is expected and if too fine then the potential for false positives increases [51]; (b) a Gaussian smoothing window is passed over the CHM to reduce spurious points. Previous ITD studies have shown that the strength of smoothing to achieve optimum segmentation results depends on species composition, but generally, overly heavy smoothing results in an increase in undetected trees [52]; (c) the local maximum is detected in a circular variable search window (VW) which scaling is determined by a h-cr relationship; and (d) the segmentation accuracy (F-score) is determined using reference tree data. The parameters in these steps are iteratively optimised using BO to achieve the highest F-score. The F-score is a commonly used measure of tree segmentation success (explained further in Section 2.7.1) [53,54]. The parameters optimised and boundaries for parameter exploration used in the BOVW approach can be viewed in Table 2.
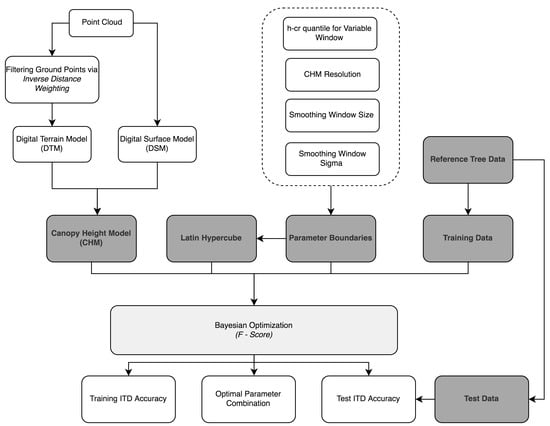
Figure 2.
Workflow of BOVW methodology.
Table 2.
BOVW optimised parameters.
The boundaries were selected based on previous studies [52,55]. To ensure that the methodology can adapt to different forest structures it was decided to expand the parameter boundaries wider. In this study the initial parameter probability distribution was built using a Latin hypercube sample of 10 parameters combinations. After the initial 10 parameter set combinations, 20 optimised parameter sets were tested. The parameter set which returned the highest F-score was then used to retrieve biophysical estimates. The BOVW workflow can be viewed in Figure 2.
2.4.2. Variable Window (VW)
The VW used in the BOVW approach is based on Popescu and Wynne [56] and uses the relationship between crown radius and tree height to scale the search window. Thereby, it considers that taller trees have larger crowns diameter and small trees have smaller crown diameters. H-cr allometric relationships often exhibit high levels of variation between forests [55], species [57] and environmental conditions [58]. High levels of variation are exhibited in the h-cr relationship in the AFI data set and the field data collected from Sites 1–5 (Figure 3). High levels of variation found in the h-cr relationship might be attributed to the frequency and intensity of management interventions involved with transformation, which rapidly alters the environmental conditions within the stand. Typically a single relationship derived between field measured tree heights and crown radius is used to scale the VW [55]. However, collecting crown radius measurements is time costly and therefore it is not often considered when completing forest inventories. Many previous studies have attempted to overcome these issues by using h-cr relationships from previous studies or using grid searches to derive h-cr relationships [59,60]. However, these approaches may result in sub-optimal tree detection accuracies through not incorporating the correct h-cr relationship to scale the search window, which may result in increased false positives or undetected trees and grid searches are inefficient in deriving the appropriate window scaling. The BOVW approach attempts to overcomes these issue by utilising external datasets and a quantile regression approach.
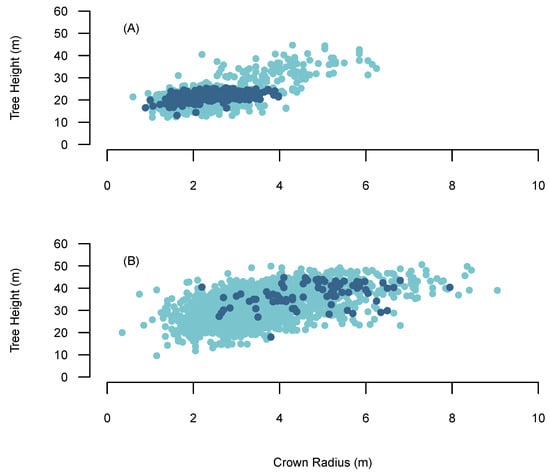
Figure 3.
The relationship between crown radius and tree height. The light blue points are AFI tree data and the dark blue point represents reference data. (A) Sitka Spruce, (B) Douglas fir.
Quantile regression gives the advantage of testing relationships other than the central tendency, allowing the exploration of a range of h-cr allometric relationships. For instance, lower quantiles represent high inter-tree competition with slender crowns, indicating a plantation that has not been thinned. While higher quantiles represent trees with very broad crowns at a given height, depicting a heavily thinned stand where trees have reacted to an increase in availability of light. Thereby, using this method we can test multiple h-cr relationships within a large dataset and optimise it to the site using BO. The h-cr relationships which are passed to the VW were built using the AFI data set. Given the high variation and non-linearity in the h-cr relationship in the AFI data we used a second order polynomial quantile regression approach. As Sites 1–4 were mono-specific, the h-cr model was built using AFI Sitka Spruce data and applied individually to the sites. Douglas fir was the dominant species in Site 5 and therefore the h-cr model was built exclusively using AFI Douglas fir data.
2.5. Optimised Fixed Window (OFW)
An effective ITD framework presented by Mohan et al. [61] was used as a comparison against the BOVW approach. Following Mohan et al. [61] framework, we used a 0.5 m CHM and tested four fixed search window size (FWS) (3 × 3, 5 × 5, 7 × 7 and 9 × 9 pixels) first on an unsmoothed CHM, and then on smoothed CHMs. Smoothing was carried out using a mean smoothing filter with a fixed window size (SWS) of 3 × 3, 5 × 5 and 7 × 7 pixels. The tree detection accuracy was determined using the reference tree data.
Tree Detection—Independent Test Site
The independent test site followed the same methodology as Sites 1–5 for both the BOVW and Optimised Fixed Window (OFW). As no individual tree measurements were available for the species present, Douglas fir was used as a proxy species to produce the h-cr allometric models used to scale the VW in the BOVW framework.
2.6. Tree Diameter
Individual tree diameters in Sites 1–5 were predicted directly from the height of the detected trees using quantile regression. The h-d models were built externally, using the AFI tree data. As Sites 1–4 were mono-specific, the h-d relationships were built using AFI Sitka Spruce data and applied individually to the sites. Douglas fir was the dominate species in Site 5 and therefore the h-d relationship was built exclusively using AFI Douglas fir data. The h-d relationship for both species shows non-linearity and therefore second order polynomial regression was applied at nine quantiles (0.1, 0.2, 0.3, 0.4, 0.5, 0.6, 0.7, 0.8, 0.9). The quantile prediction with the lowest RMSE when compared to the field data was selected as the model to retrieve diameters from the segmented tree heights. To compare the quantile approach to a site specific model a Weibull h-d model was fitted to the field data for each site. Weibull h-d models have been found to achieve good results in a range of forest types and species compositions [62].
2.7. Accuracy Assessment
2.7.1. Individual Tree Segmentation Accuracy Assessment
The accuracy of the ITD methods was computed by determining if there was a detected tree located in the crown of a reference tree [31]. The reference tree crowns were sized according to the crown diameter measurements taken in the field. If there were two or more points located in the reference tree crown, then the highest point was assumed to be the correct tree top and the other were assumed to be spurious points. To evaluate the accuracy, we calculated recall (r), precision (p) and F-score using the following equations [53,54]:
True positives (TP) are the number of true matches, false positives (FP) are the number of oversegmentations and false negatives (FN) are the number of missed reference trees. Precision is inversely related to commission error and recall is inversely related to omission. The F-score is the harmonic mean of p and r. Thus, a higher F-score indicates a higher r and p value. If all the trees were correctly segmented, then r and p would be equal to one, which would result in the F being equal to one. In each reference site we split the reference tree data in half to create a training and test set.
2.7.2. Tree Biophysical Variable Assessment
In this study, the root mean square error (RMSE), R2 and relative root mean square error (rRMSE) were used to evaluate the accuracy of tree characteristics. The differences in distribution of biophysical variables between the field measurements and the UAV predicted variables was evaluated by first using a Shapiro–Wilk W test to allow correct selection of the appropriate statistical test (Student’s t-test or Wilcoxon).
3. Results
3.1. Individual Tree Detection Accuracy
The detection of individual trees and subsequent estimation of forest stand variables using the BOVW took on average 4 min/ha, while the OFW took on average 1 min/ha using a single 8th-generation Core i5 processor. Assessment of the tree detection accuracy are summarised in Table 3 and a visual example can be viewed in Figure 4.
Table 3.
The highlighted grey colour represents the highest test results, which were determined by comparing the F-score. The highest F-score values were selected as the best results.
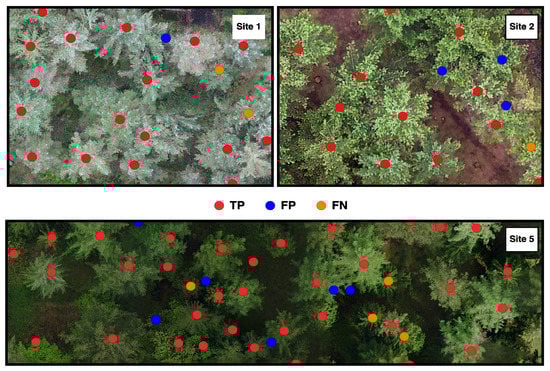
Figure 4.
Individual tree detection from the BOVW method for Sites 1, 2 and 5. Red dots represent true positive trees (TP), blue dots represent commission (FN) and orange dots represent omission (FN).
The results revealed that the BOVW approach had a higher detection rate in all sites when compared with the OFW approach and attained a higher mean test accuracy (F-score = 0.88) in comparison to the OFW mean test accuracy (F-score = 0.83). The highest test accuracy was achieved in the Test site (F-score = 0.93) and the result was attributed to the low tree density found in the study site. The overall test performance of both methods achieved test F-scores within the range 0.80 to 0.93 and the test precision (p) ranged from 0.85 to 1. The largest difference between the two methods occurs between the recall (r), where the mean test recall for the BOVW (r = 0.84) was 0.6 higher than the mean test result for the OFW (r = 0.78) approach.
The tree detection percentage accuracy was found to vary with different diameter classes. Figure 5A shows that both ITD methods achieved lower detection rates for small diameter trees (<27.5 cm) than larger trees (>27.5 cm), which aligns with previous studies as they have been found to be poorly represented in the CHM due to overstory trees [52,63]. However, the BOVW was able to achieve a higher detection percentage for smaller diameter trees than the OFW. The overall tree detection percentage for the BOVW increased with increasing tree size from a minimum of 66% to a maximum of 94% for tree size classes in the ranges <27.5 cm and >45 cm, respectively. The largest difference in tree detection between the two methods occurs in tree sizes <27.5 cm, where the BOWV detected 15% more trees (Figure 5A). Ensuring high detection rates in larger diameter trees is considered important as these retain the highest overall volume and monetary value in respect to the total stand and have been found to have disproportionate ecological impact on forest structure [64,65]. The relationship between tree detection percentage and diameter class was also apparent in the independent test site (Figure 5A). Which similarly found that the BOVW approach was able to detect a higher percentage of smaller diameter trees (<27.5 cm) than the OFW approach and both detected almost identical percentages of large diameter trees (>47.5 cm) over all sites.
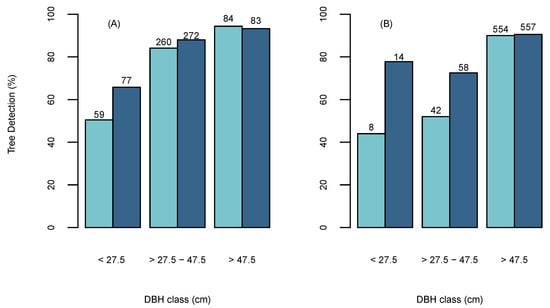
Figure 5.
The percentage of detected trees using the Optimised Fixed Window (OFW) (Light Blue) and BOVW (Dark Blue) in diameter classes for (A) Sites 1-5 and (B) independent test site. The frequencies are located above the bars.
The ITD parameter combinations selected for each site are displayed in Table 4. The optimisation process found no absolute agreement of optimal parameter sets, however, the 0.40 m CHM resolutions were consistent across all sites. These parameter sets indicate that the BOVW framework is adjusting to the respective forest structure.
Table 4.
Optimal parameters sets for the BOVW and OFW for each of the reference sites.
3.1.1. Retrieval of Biophysical Estimates
The comparison between the UAV-derived and field based individual tree metrics was conducted only for trees that were correctly detected by the BOVW (N = 438). Figure 6A presents the relationship between observed and UAV derived tree heights. The height values ranged from 12.6 to 44.9 m, with a mean value of 23.1 m. Detected tree heights showed a strong relationship with field data (R2 = 0.93, RMSE = 2.10 m (9%)), however, there was a significant difference between UAV predicted and observed tree height ( = 0.05).
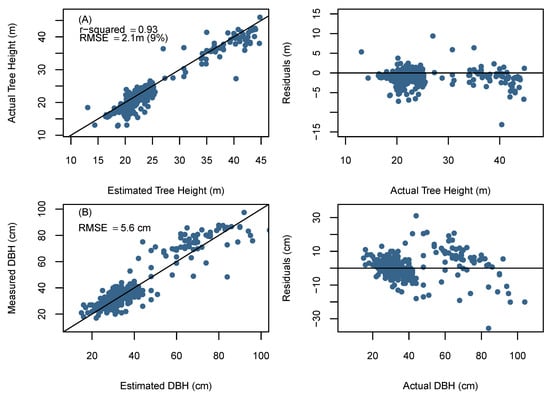
Figure 6.
(A) Unmanned aerial vehicle (UAV) determined tree height compared to field-measured tree height; (B) UAV determined tree diameters compared to field-measured tree diameters. The solid line represents the 1:1 line the diameter RMSE is the mean RMSE across all sites.
Similarly, to tree height validation, the estimated diameter values obtained from the h-d model were only compared to trees that were correctly detected by the BOVW. The detected field DBH values ranged from 16 to 95 cm with a mean value of 38 cm. Tree diameter errors and their respective h/d quantile for each site are displayed in Table 5.
Table 5.
UAV predicted diameter errors for each of the reference sites.
Site 5 had the highest diameter RMSE and achieved a more accurate diameter estimate using the site specific allometric relationship. This result was expected given the larger range of species composition and diameter distribution within the stand in comparison to the monospecific plantations of Sites 1–4. Overall, pooled predicted results from Sites 1–5 were able to achieve a mean diameter RMSE of 5.6 cm. The pooled diameter distribution formed from the individual tree DBH measurements is shown in comparison to field data DBH distribution in Figure 7. The Kolmogorov–Smirnov test used for comparing empirical and predicted distributions, revealed that all sites aside from Site 3 provided differences that were not significant relative to the reference data ( = 0.05). The pooled DBH distribution (Figure 7) was also found to accurately reflected differences that were not significant relative to the pooled reference diameter data ( = 0.05) when using a Kolmogorov–Smirnov test. The site specific Weibull h-d model provided similar mean diameter predictions (mean RMSE = 6.8 cm) and were not significantly different to each other ( = 0.05). Thereby, indicating that it is possible to achieve diameter results similar to a site specific h-d model when using this approach.
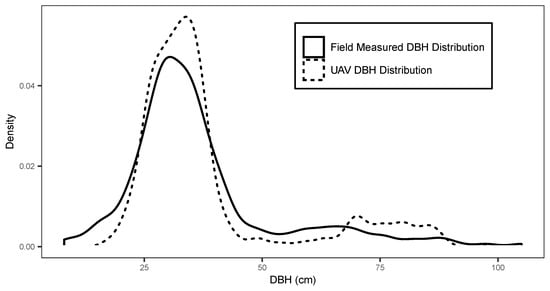
Figure 7.
Pooled tree diameter distribution in 4 cm intervals for field measurements (line) and UAV predicted diameters (dashed line).
3.1.2. BOVW Training Data
The BOVW methodology requires reference data to optimise ITD and diameter parameters. Therefore we explored the relationship between the amount of training data and the accuracy and precision. The relationship was examined by incrementally selecting random training trees from the pool of reference trees, optimising to the randomly selected trees and then validating the accuracy against all the reference trees. Twenty replicates for each training set size was completed to retrieve a mean and standard deviations of the F-score. Sites 1 and 5 were selected as being the most structurally contrasting.
Figure 8 presents the relationship between training set size and the impact on the precision and accuracy of the F-score. Site 1 (Figure 8A) shows a gradual improvement in accuracy (F-score) and precision with increasing numbers of reference trees. This relationships starts to plateau around 20 reference trees. Thus, adding more training samples may not lead to significantly more accurate tree detection. Site 5 (Figure 8B) presents a steeper learning curve in comparison with Site 1 and appeared to plateau around 60 reference trees. The differences in the learning curves maybe attributed to differences in forest structure. Site 5 is more heterogeneous than Site 1 and therefore the preliminary results indicate that heterogeneous sites require more training data when using this approach.
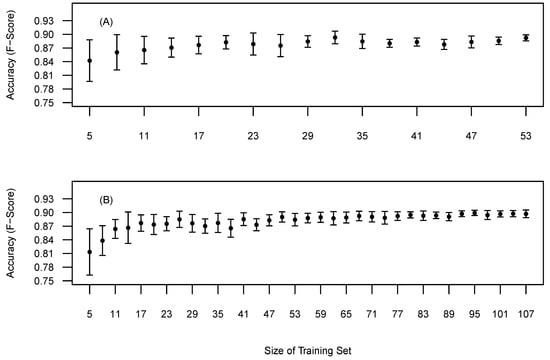
Figure 8.
Mean tree detection accuracy based on selected training data on all reference data. (A) Site 1, (B) Site 5. Bars represent the standard deviation around the mean.
The amount of training data needed to precisely determine the quantile used to derive the h-d relationship is shown in Figure 9. This relationship was derived from field measured tree heights to remove the errors associated with UAV obtained tree heights. Visually, Sites 1 and 5 require 15 and 25 reference trees to ensure precision and accuracy similar to utilising all the training data. Similarly to the relationship between training data and tree detection accuracy, Site 5 required more training data before the learning curve plateaued in comparison to Site 1 and has been attributed to the increased variation of tree sizes found in Site 5.
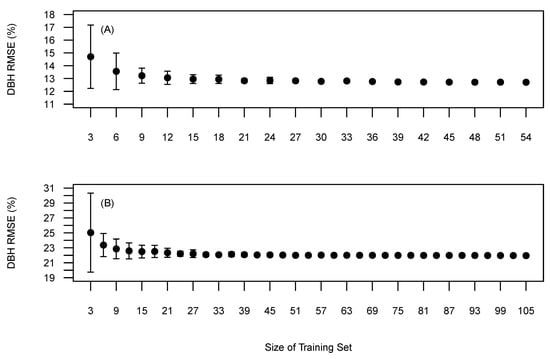
Figure 9.
Mean tree diameter RMSE (%) based on selected training data on all reference data. (A) Site 1, (B) Site 5. Bars represent the standard deviation around the mean.
4. Discussion
This research developed a novel self-parametrising, transferable photogrammetric based UAV method capable of monitoring transformation to CCF at the individual tree level, which could also be transferred to any high resolution CHM, such as delivered from LiDAR. Our results demonstrate a robust and efficient framework for monitoring even-aged plantations to CCF, capable of providing accurate biophysical estimates from a range of forest structures. In the following sections, we discuss our findings in relation to other studies to identify the effectiveness of this approach and outline future improvements.
4.1. Accuracy of Individual Tree Detection
Our findings indicate that the BOVW can self-parametise to achieve respectable tree detection accuracies (mean test F-score = 0.88) and resulted in a significant improvement of F-score in comparison to the OFW approach ( = 0.05). Improvements of 5% in tree detection, as found in this study in comparison to the OFW method, can have significant enhancements on forest inventory estimates as tree detection has been found to be the primary source of error in forest inventory estimates when using ITD [66]. Despite the inclusion of a range of forest structure and species compositions, we achieved segmentation results comparable with studies applied in similar forest types with minimal input changes between sites [23]. Vega et al. [67], using the PTrees ITD method reported to segment individual trees in a conifer plantation in south western France to an F-score of 0.95. Lahivaara et al. [68] was able to achieve a reported accuracy of 70.2% in a managed boreal forest in Eastern Finland and Maltamo et al. [69] detected only 39.5% of all trees in southern Finland using local maxima techniques.
The independent test site results were consistent with Sites 1–5 in which the BOVW achieved a higher test tree detection accuracy in comparison to the OFW. While providing evidence for transferability of this approach, the results for the independent test site could be further improved by advancements in the raw data collection and the inputs to the BOVW. The low point densities (4/m2) used to create the CHM for the independent test site meant that smaller diameter trees were less well represented in the CHM and therefore increased the difficulty in their detection. The h-cr quantiles used in the VW were derived from Douglas fir data and not the species present in the test site. Therefore, with access to individual tree measurements of the species present at the site would allow the integration of the correct allometric relationships into the optimisation process. Whilst the BOVW results are viewed favourably, caution should be taken when comparing ITD results across studies given the differences in stand complexity and species composition [22].
4.2. Biophysical Estimates
Our results confirmed the general statement that tree heights are mostly underestimated from UAV photogrammetry, but provided a strong relationship with the observed tree height (R2 = 0.93). On the other hand, tree height errors (RMSE = 2.1 m) reported in this study exceeded the accuracy reported by other UAV photogrammetry research and could be attributed to several errors [70,71]. Firstly, DTMs derived from photogrammetry are based only on the canopy surface which is viewable from the sky. Therefore, in areas of high canopy cover there are significant areas of omission, which have been coined as dead ground [72] and results in DTM extrapolation. The undulating topography and varying densities of canopy cover found in the study sites caused fluctuating difficulty in DTM production. Secondly, vertex measurements are also error prone with operator skill and canopy closure affecting the accuracy of the tree height measurements [73], with discrepancies being reported up to 1.3 m in coniferous plots [20]. Thirdly, the quality of the UAV photogrammetric product. Environmental conditions have a significant impact on the quality of the photogrammetric data set, with wind speed being shown to impact height by up to 0.5 m [74]. Accumulatively, these factors could explain the discrepancy in tree height estimations. The addition of a LiDAR DTM it is expected to improve tree height estimations using this approach, as it has been found to provide accurate DTMs in forests with high canopy cover [75].
Monitoring tree diameter distributions is a common method of discerning the stage of transformation and providing direction for future management interventions [76]. Although a relatively simple model, quantile regression is rarely used in deriving diameter estimates in ITD studies. The results from this approach are encouraging (mean RMSE = 5.6 cm), especially when considering:(a) predictions were based upon h-d models parameterised using external data sets, (b) the method required limited training data to select the correct quantile (Figure 9) and (c) used tree height as the sole predictor which had errors (RMSE = 2.1 m) exceeding that of other studies [77,78]. Allometric models are highly vulnerable to errors in their input data, especially when using one predictor and therefore improvements in diameter predictions are expected with enhancements in tree height accuracies. Similar mean diameter accuracies were achieved by developing site specific Weibull h-d models (RMSE = 6.8 cm) and using either approach would result in predictions within the broad range found in the wider literature which fluctuates from 15% to 23% rRMSE [69]. Vastaranta et al. [79], using a multi-source ITD inventory in a range of forest stands in Finland, reported dbh accuracies ranging from 10.9% to 19.9% RMSE.Valbuena-Rabadán et al. [80] reported in a Scots pine (Pinus sylvestris L). plantation dbh estimates of 18.97% RMSE. The comparison of ITD biophysical estimates is complex and caution must be taken as it is highly data dependant [81]. Comparable diameter predictions results found in this study provides evidence that the quantile approach could be used as an alternative when site specific h-d relationships are not available and when collecting only a few tree heights possible due to the labour intensive nature of collecting tree heights.
4.3. BOVW Parametrisation
We consider the following aspects relevant advantages of the proposed BOVW approach: (i) the proposed approach is structured and follows the same steps regardless of the parameters being tuned or the person tuning it. In contrast, the steps taken, the depth and choice of parameter exploration is predetermined by the user when using approaches such as grid searches or manual parametrisation, requiring previous knowledge, (ii) parametrisation occurs globally. Incorporating multi-way parameter interactions, addresses weaknesses identified in previous studies which sought optimal parameter sets by altering one parameter whilst keeping others constant and thereby not integrating multi-way parameter interactions, (iii) transferability. This approach maintained successful segmentation accuracies with minimal input changes across sites of different forest structures, including the independent test site. The only input change between sites was selecting the dominant tree species and (iv) training sample size. The BOVW approach requires a limited number of training samples to achieve the same accuracy as using all the training data, implying that it could be cost efficient in the field. However, further research is required to investigate the influence of forest structure on the required training sample size. These advantages ensure the BOVW is easy to use, adaptable and efficient, making it highly attractive to forest managers and research projects which require ITD components. Thus far, BO has been is little exploited in relation to ITD parametrisation.
4.4. Future Work
Issues of automated parametrisation are addressed in this study, but the main unsolved obstacle to ITD is still present with the difficulty of delineating suppressed and understory trees [63]. Improvements can be seen with the BOVW approach presented here when compared with the OFW approach, however, there is still a tendency to miss smaller suppressed trees. The tendency of missing trees will increase in multi-layered, dense forests [82]. Some methods have been developed to improve segmentation accuracies of suppressed trees, however these are still experimental and generally computationally expensive over large areas [83].
This framework could be further improved through including multiple segmentation methods in the optimisation stage, allowing BO to fit the segmentation method to the forest structure. Previous research has shown that tree segmentation approaches differ in their accuracies in regards to forest structure [29] and therefore, allowing multiple segmentation approaches to be incorporated should improve tree detection accuracies. Integrating multiple segmentation methods into this approach would allow the whole processing chain to be optimised to the forest.
5. Conclusions
In this study, we compared a novel Bayesian optimisation individual tree approach to an established and effective individual tree detection (ITD) approach over five sites in transformation to Continuous Cover Forestry (CCF) and to a test site located in the Teakettle Experimental Forest, California, USA. The novel method (BOVW) uses a variable search window and a Bayesian optimisation approach of parameterisation which utilises external tree data to derive the correct allometric relationship. The established method (OFW) uses a combination of fixed sized search windows to smooth and identify individual trees from the canopy height model.
Our investigation demonstrated that the novel BOVW method was transferable between sites with limited manual parameterisation and was able to achieve advantageous results in comparison to the OFW ITD method. The BOVW was also able to achieve higher detection rates for smaller diameter trees than in comparison to the OFW. Currently, the BOVW approach uses a variable window search approach, however future research could be focused on integrating multiple segmentation methods and thereby optimising the entire processing chain to the forest and further improve tree detection accuracies.
This study presents a transferable, self-paramatising ITD method which is capable of adjusting to changing forest structures which occur during transformation to CCF. Requiring limited training data, little prior knowledge of optimal parameters and the use of external data sets to derive allometric relationships results in a highly effective, easily applied and cost effective ITD method which can be used to monitor transformation to CCF at the individual tree level.
Author Contributions
Conceptualization, G.B., A.H. and P.B.; methodology, G.B., A.H. and P.B.; validation, G.B.; formal analysis, G.B.; resources, P.M.; data curation, G.B., A.F. and P.M.; writing—original draft preparation, G.B.; writing—review and editing, G.B., A.H., A.F. and P.B.; supervision, A.H., P.B. All authors have read and agreed to the published version of the manuscript.
Funding
This research was funded through the Knowledge Economy Skills Scholarships (KESS2) initiative (kess2.ac.uk) which develops research projects with partner companies. KESS2 is a pan-Wales higher education initiative led by Bangor University and part-funded by the Welsh Government’s European Social Fund (ESF) convergence program for West Wales and the Valleys. SelectFor, the KESS2 company partner, initiated this PhD into Irregular Silviculture. SelectFor offers specialist continuous cover consultancy and promotes, instigates and contributes to research in various aspects of continuous cover forest management.
Conflicts of Interest
The authors declare no conflict of interest.
Abbreviations
The following abbreviations are used in this manuscript:
| CHM | Canopy Height Model |
| BO | Bayesian Optimisation |
| BOVW | Bayesian Optimisation Variable Window |
| OFW | Optimised Fixed Window |
| ITD | Individual Tree Detection |
References
- Arnell, N.W.; Brown, S.; Gosling, S.N.; Gottschalk, P.; Hinkel, J.; Huntingford, C.; Lloyd-Hughes, B.; Lowe, J.A.; Nicholls, R.J.; Osborn, T.J.; et al. The impacts of climate change across the globe: A multi-sectoral assessment. Clim. Chang. 2016, 134, 457–474. [Google Scholar] [CrossRef]
- Lindner, M.; Maroschek, M.; Netherer, S.; Kremer, A.; Barbati, A.; Garcia-Gonzalo, J.; Seidl, R.; Delzon, S.; Corona, P.; Kolström, M.; et al. Climate change impacts, adaptive capacity, and vulnerability of European forest ecosystems. For. Ecol. Manag. 2010, 259, 698–709. [Google Scholar] [CrossRef]
- Seidl, R.; Thom, D.; Kautz, M.; Martin-Benito, D.; Peltoniemi, M.; Vacchiano, G.; Wild, J.; Ascoli, D.; Petr, M.; Honkaniemi, J.; et al. Forest disturbances under climate change. Nat. Clim. Chang. 2017, 7, 395–402. [Google Scholar] [CrossRef]
- Pawson, S.M.; Brin, A.; Brockerhoff, E.G.; Lamb, D.; Payn, T.W.; Paquette, A.; Parrotta, J.A. Plantation forests, climate change and biodiversity. Biodivers. Conserv. 2013, 22, 1203–1227. [Google Scholar] [CrossRef]
- O’Hara, K.L. What is close-to-nature silviculture in a changing world? Forestry 2016, 89, 1–6. [Google Scholar] [CrossRef]
- Franklin, J. Towards a new forestry. Am. For. 1989, 95, 37–44. [Google Scholar]
- Mason, B.; Kerr, G. Transforming Even-Aged Conifer Stands to Continuous Cover Management; Technical Report; Forestry Commission: Edinburgh, UK, 2000.
- Brang, P.; Spathelf, P.; Larsen, J.B.; Bauhus, J.; Boncčìna, A.; Chauvin, C.; Drössler, L.; García-Güemes, C.; Heiri, C.; Kerr, G.; et al. Suitability of close-to-nature silviculture for adapting temperate European forests to climate change. For. Int. J. For. Res. 2014, 87, 492–503. [Google Scholar] [CrossRef]
- Schütz, J.P. Opportunities and strategies of transforming regular forests to irregular forests. For. Ecol. Manag. 2001, 151, 87–94. [Google Scholar] [CrossRef]
- Swift, D.E.; Canadian Wood Fibre Centre; Ung, C.H.; Wang, X.; Gagné, R. Impacts of Partial Harvesting on Stand Dynamics and Tree Grades for Northern Hardwoods of the Acadian Forest Region; Technical Report; NRCan, Canadian Forest Service—Canadian Wood Fibre Centre: Ottawa, ON, Canada, 2013. [Google Scholar]
- Pommerening, A.; Pallarés Ramos, C.; Kȩdziora, W.; Haufe, J.; Stoyan, D. Rating experiments in forestry: How much agreement is there in tree marking? PLoS ONE 2018, 13, e0194747. [Google Scholar] [CrossRef]
- Wallace, L.; Lucieer, A.; Watson, C.; Turner, D. Development of a UAV-LiDAR System with Application to Forest Inventory. Remote Sens. 2012, 4, 1519–1543. [Google Scholar] [CrossRef]
- Torresan, C.; Berton, A.; Carotenuto, F.; Di, S.F.; Gioli, B.; Matese, A.; Miglietta, F.; Zaldei, A.; Wallace, L.; Torresan, C.; et al. Forestry applications of UAVs in Europe: A review Forestry applications of UAVs in Europe: A review. Int. J. Remote Sens. 2016, 1–21. [Google Scholar] [CrossRef]
- Zhang, J.; Hu, J.; Lian, J.; Fan, Z.; Ouyang, X.; Ye, W. Seeing the forest from drones: Testing the potential of lightweight drones as a tool for long-term forest monitoring. Biol. Conserv. 2016, 198, 60–69. [Google Scholar] [CrossRef]
- Baltsavias, E.; Gruen, A.; Eisenbeiss, H.; Zhang, L.; Waser, L.T. High-quality image matching and automated generation of 3D tree models. Int. J. Remote Sens. 2008, 29, 1243–1259. [Google Scholar] [CrossRef]
- Yu, X.; Hyyppä, J.; Karjalainen, M.; Nurminen, K.; Karila, K.; Vastaranta, M.; Kankare, V.; Kaartinen, H.; Holopainen, M.; Honkavaara, E.; et al. Comparison of Laser and Stereo Optical, SAR and InSAR Point Clouds from Air- and Space-Borne Sources in the Retrieval of Forest Inventory Attributes. Remote Sens. 2015, 7, 15933–15954. [Google Scholar] [CrossRef]
- Matese, A.; Toscano, P.; Di Gennaro, S.; Genesio, L.; Vaccari, F.; Primicerio, J.; Belli, C.; Zaldei, A.; Bianconi, R.; Gioli, B. Intercomparison of UAV, Aircraft and Satellite Remote Sensing Platforms for Precision Viticulture. Remote Sens. 2015, 7, 2971–2990. [Google Scholar] [CrossRef]
- Wang, L.; Gong, P.; Biging, G.S. Individual Tree-Crown Delineation and Treetop Detection in High-Spatial-Resolution Aerial Imagery. Photogramm. Eng. Remote Sens. 2004, 70, 351–357. [Google Scholar] [CrossRef]
- Helliwell, R.; Wilson, T. Continuous cover forestry in Britain. Q. J. For. 2012, 106, 214–224. [Google Scholar]
- Vauhkonen, J.; Maltamo, M.; McRoberts, R.E.; Næsset, E. Introduction to Forestry Applications of Airborne Laser Scanning. In Forestry Applications of Airborne Laser Scanning; Springer: Dordrecht, The Netherlands, 2014; pp. 1–16. [Google Scholar] [CrossRef]
- Wallace, L.; Lucieer, A.; Watson, C.S. Evaluating Tree Detection and Segmentation Routines on Very High Resolution UAV LiDAR Data. IEEE Trans. Geosci. Remote Sens. 2014, 52. [Google Scholar] [CrossRef]
- Zhen, Z.; Quackenbush, L.; Zhang, L. Trends in Automatic Individual Tree Crown Detection and Delineation—Evolution of LiDAR Data. Remote Sens. 2016, 8, 333. [Google Scholar] [CrossRef]
- Silva, C.A.; Hudak, A.T.; Vierling, L.A.; Loudermilk, E.L.; O’Brien, J.J.; Hiers, J.K.; Jack, S.B.; Gonzalez-Benecke, C.; Lee, H.; Falkowski, M.J.; et al. Imputation of Individual Longleaf Pine (Pinus palustris Mill.) Tree Attributes from Field and LiDAR Data. Can. J. Remote Sens. 2016, 42, 554–573. [Google Scholar] [CrossRef]
- Perrin, G.; Descombes, X.; Zerubia, J. A marked point process model for tree crown extraction in plantations. In Proceedings of the IEEE International Conference on Image Processing (ICIP), Genova, Italy, 14 September 2005; Volume 1, pp. 661–664. [Google Scholar] [CrossRef]
- Lee, J.H.; Biging, G.S.; Fisher, J.B. An Individual Tree-Based Automated Registration of Aerial Images to LiDAR Data in a Forested Area. Photogramm. Eng. Remote Sens. 2016, 82, 699–710. [Google Scholar] [CrossRef]
- Falkowski, M.J.; Smith, A.M.; Gessler, P.E.; Hudak, A.T.; Vierling, L.A.; Evans, J.S. The influence of conifer forest canopy cover on the accuracy of two individual tree measurement algorithms using lidar data. Can. J. Remote Sens. 2008, 34, S1–S13. [Google Scholar] [CrossRef]
- Koch, B.; Heyder, U.; Weinacker, H. Detection of Individual Tree Crowns in Airborne Lidar Data. Photogramm. Eng. Remote Sens. 2006, 72, 357–363. [Google Scholar] [CrossRef]
- Lindberg, E.; Holmgren, J. Individual Tree Crown Methods for 3D Data from Remote Sensing. Curr. For. Rep. 2017, 3, 19–31. [Google Scholar] [CrossRef]
- Kaartinen, H.; Hyyppä, J.; Yu, X.; Vastaranta, M.; Hyyppä, H.; Kukko, A.; Holopainen, M.; Heipke, C.; Hirschmugl, M.; Morsdorf, F.; et al. An International Comparison of Individual Tree Detection and Extraction Using Airborne Laser Scanning. Remote Sens. 2012, 4, 950–974. [Google Scholar] [CrossRef]
- Monnet, J.M.; Mermin, E.; Chanussot, J.; Berger, F.; Emgr, U. Tree top detection using local maxima filtering: A parameter sensitivity analysis Tree top detection using local maxima filtering: A parameter sensitivity analysis Tree top detection using local maxima filtering: A parameter sensitivity analysis. In Proceedings of the 10th International Conference on LiDAR Applications for Assessing Forest Ecosystems (Silvilaser 2010), Freiburg, Germany, 14–17 September 2010. [Google Scholar]
- Wu, X.; Shen, X.; Cao, L.; Wang, G.; Cao, F. Assessment of Individual Tree Detection and Canopy Cover Estimation using Unmanned Aerial Vehicle based Light Detection and Ranging (UAV-LiDAR) Data in Planted Forests. Remote Sens. 2019, 11, 908. [Google Scholar] [CrossRef]
- Yao, W.; Krull, J.; Krzystek, P.; Heurich, M. Sensitivity analysis of 3D individual tree detection from LiDAR point clouds of temperate forests. Forests 2014, 5, 1122–1142. [Google Scholar] [CrossRef]
- Saltelli, A.; Annoni, P. How to avoid a perfunctory sensitivity analysis. Environ. Model. Softw. 2010, 25, 1508–1517. [Google Scholar] [CrossRef]
- Saltelli, A.; Aleksankina, K.; Becker, W.; Fennell, P.; Ferretti, F.; Holst, N.; Li, S.; Wu, Q. Why so many published sensitivity analyses are false: A systematic review of sensitivity analysis practices. Environ. Model. Softw. 2019, 114, 29–39. [Google Scholar] [CrossRef]
- Dulamsuren, C.; Khishigjargal, M.; Leuschner, C.; Hauck, M. Response of tree-ring width to climate warming and selective logging in larch forests of the Mongolian Altai. J. Plant Ecol. 2014, 7, 24–38. [Google Scholar] [CrossRef]
- Montoro Girona, M.; Rossi, S.; Lussier, J.M.; Walsh, D.; Morin, H. Understanding tree growth responses after partial cuttings: A new approach. PLoS ONE 2017, 12, e0172653. [Google Scholar] [CrossRef] [PubMed]
- Alonzo, M.; Andersen, H.E.; Morton, D.; Cook, B. Quantifying Boreal Forest Structure and Composition Using UAV Structure from Motion. Forests 2018, 9, 119. [Google Scholar] [CrossRef]
- Puliti, S.; Olerka, H.; Gobakken, T.; Næsset, E. Inventory of Small Forest Areas Using an Unmanned Aerial System. Remote Sens. 2015, 7, 9632–9654. [Google Scholar] [CrossRef]
- Lucieer, A.; Turner, D.; King, D.H.; Robinson, S.A. Using an Unmanned Aerial Vehicle (UAV) to capture micro-topography of Antarctic moss beds. Int. J. Appl. Earth Obs. Geoinf. 2014, 27, 53–62. [Google Scholar] [CrossRef]
- Turner, D.; Lucieer, A.; Wallace, L. Direct Georeferencing of Ultrahigh-Resolution UAV Imagery. IEEE Trans. Geosci. Remote Sens. 2014, 52, 2738–2745. [Google Scholar] [CrossRef]
- Remke, A.; Rodrigo-Comino, J.; Gyasi-Agyei, Y.; Cerdà, A.; Ries, J. Combining the Stock Unearthing Method and Structure-from-Motion Photogrammetry for a Gapless Estimation of Soil Mobilisation in Vineyards. ISPRS Int. J. Geo-Inf. 2018, 7, 461. [Google Scholar] [CrossRef]
- Grayson, B.; Penna, N.T.; Mills, J.P.; Grant, D.S. GPS precise point positioning for UAV photogrammetry. Photogramm. Rec. 2018, 33, 427–447. [Google Scholar] [CrossRef]
- Susse, R.; Morgan, P.P.; Association Futaie Irrégulière. Management of Irregular Forests: Developing the Full Potential of the Forest: Economic Aspects, Environmental Aspects, Social Aspects; Azur Multimedia: Saint-Maime, France, 2011; p. 144. [Google Scholar]
- Meyer, M.D.; North, M.P.; Gray, A.N.; Zald, H.S.J. Influence of soil thickness on stand characteristics in a Sierra Nevada mixed-conifer forest. Plant Soil 2007, 294, 113–123. [Google Scholar] [CrossRef]
- Fricker, G.A.; Ventura, J.D.; Wolf, J.A.; North, M.P.; Davis, F.W.; Franklin, J. A Convolutional Neural Network Classifier Identifies Tree Species in Mixed-Conifer Forest from Hyperspectral Imagery. Remote Sens. 2019, 11, 2326. [Google Scholar] [CrossRef]
- Thiel, C.; Schmullius, C. Comparison of UAV photograph-based and airborne lidar-based point clouds over forest from a forestry application perspective. Int. J. Remote Sens. 2017, 38, 2411–2426. [Google Scholar] [CrossRef]
- Fujimoto, A.; Haga, C.; Matsui, T.; Machimura, T.; Hayashi, K.; Sugita, S.; Takagi, H. An End to End Process Development for UAV-SfM Based Forest Monitoring: Individual Tree Detection, Species Classification and Carbon Dynamics Simulation. Forests 2019, 10, 680. [Google Scholar] [CrossRef]
- Birdal, A.C.; Avdan, U.; Türk, T. Estimating tree heights with images from an unmanned aerial vehicle. Geomat. Nat. Hazards Risk 2017, 8, 1144–1156. [Google Scholar] [CrossRef]
- Georganos, S.; Grippa, T.; Vanhuysse, S.; Lennert, M.; Shimoni, M.; Wolff, E. Very High Resolution Object-Based Land Use–Land Cover Urban Classification Using Extreme Gradient Boosting. IEEE Geosci. Remote Sens. Lett. 2018, 15, 607–611. [Google Scholar] [CrossRef]
- Deckmyn, G.; Mali, B.; Kraigher, H.; Torelli, N.; Op de Beeck, M.; Ceulemans, R. Using the process-based stand model ANAFORE including Bayesian optimisation to predict wood quality and quantity and their uncertainty in Slovenian beech. Silva Fenn. 2009, 43. [Google Scholar] [CrossRef]
- Sačkov, I.; Kulla, L.; Bucha, T. A Comparison of Two Tree Detection Methods for Estimation of Forest Stand and Ecological Variables from Airborne LiDAR Data in Central European Forests. Remote Sens. 2019, 11, 1431. [Google Scholar] [CrossRef]
- Tanhuanpää, T.; Saarinen, N.; Kankare, V.; Nurminen, K.; Vastaranta, M.; Honkavaara, E.; Karjalainen, M.; Yu, X.; Holopainen, M.; Hyyppä, J. Evaluating the Performance of High-Altitude Aerial Image-Based Digital Surface Models in Detecting Individual Tree Crowns in Mature Boreal Forests. Forests 2016, 7, 143. [Google Scholar] [CrossRef]
- Sokolova, M.; Japkowicz, N.; Szpakowicz, S. Beyond Accuracy, F-Score and ROC: A Family of Discriminant Measures for Performance Evaluation; Springer: Berlin/Heidelberg, Germany, 2006; pp. 1015–1021. [Google Scholar] [CrossRef]
- Goutte, C.; Gaussier, E. A Probabilistic Interpretation of Precision, Recall and F-Score, with Implication for Evaluation. In Advances in Information Retrieval; Springer: Berlin/Heidelberg, Germany, 2005; pp. 345–359. [Google Scholar] [CrossRef]
- Barnes, C.; Balzter, H.; Barrett, K.; Eddy, J.; Milner, S.; Suárez, J.C. Remote sensing Individual Tree Crown Delineation from Airborne Laser Scanning for Diseased Larch Forest Stands. Remote Sens. 2017, 9, 231. [Google Scholar] [CrossRef]
- Popescu, S.C.; Wynne, R.H. Seeing the trees in the forest: Using lidar and multispectral data fusion with local filtering and variable window size for estimating tree height. Photogramm. Eng. 2004. [Google Scholar] [CrossRef]
- Pretzsch, H.; Biber, P.; Uhl, E.; Dahlhausen, J.; Rötzer, T.; Caldentey, J.; Koike, T.; van Con, T.; Chavanne, A.; Seifert, T.; et al. Crown size and growing space requirement of common tree species in urban centres, parks, and forests. Urban For. Urban Green. 2015, 14, 466–479. [Google Scholar] [CrossRef]
- Dai, X.; Jia, X.; Zhang, W.; Bai, Y.; Zhang, J.; Wang, Y.; Wang, G. Plant height-crown radius and canopy coverage-density relationships determine above-ground biomass-density relationship in stressful environments. Biol. Lett. 2009, 5, 571–573. [Google Scholar] [CrossRef]
- Brieger, F.; Herzschuh, U.; Pestryakova, L.A.; Bookhagen, B.; Zakharov, E.S.; Kruse, S. Advances in the Derivation of Northeast Siberian Forest Metrics Using High-Resolution UAV-Based Photogrammetric Point Clouds. Remote Sens. 2019, 11, 1447. [Google Scholar] [CrossRef]
- Nuijten, R.; Coops, N.; Goodbody, T.; Pelletier, G. Examining the Multi-Seasonal Consistency of Individual Tree Segmentation on Deciduous Stands Using Digital Aerial Photogrammetry (DAP) and Unmanned Aerial Systems (UAS). Remote Sens. 2019, 11, 739. [Google Scholar] [CrossRef]
- Mohan, M.; Silva, C.; Klauberg, C.; Jat, P.; Catts, G.; Cardil, A.; Hudak, A.; Dia, M. Individual Tree Detection from Unmanned Aerial Vehicle (UAV) Derived Canopy Height Model in an Open Canopy Mixed Conifer Forest. Forests 2017, 8, 340. [Google Scholar] [CrossRef]
- Staudhammer, C.; LeMay, V. Height prediction equations using diameter and stand density measures. For. Chron. 2000, 76, 303–309. [Google Scholar] [CrossRef]
- Goldbergs, G.; Maier, S.; Levick, S.; Edwards, A. Efficiency of Individual Tree Detection Approaches Based on Light-Weight and Low-Cost UAS Imagery in Australian Savannas. Remote Sens. 2018, 10, 161. [Google Scholar] [CrossRef]
- Lutz, J.A.; Larson, A.J.; Freund, J.A.; Swanson, M.E.; Bible, K.J. The Importance of Large-Diameter Trees to Forest Structural Heterogeneity. PLoS ONE 2013, 8, e82784. [Google Scholar] [CrossRef]
- Fichtner, A.; Forrester, D.I.; Härdtle, W.; Sturm, K.; von Oheimb, G. Facilitative-Competitive Interactions in an Old-Growth Forest: The Importance of Large-Diameter Trees as Benefactors and Stimulators for Forest Community Assembly. PLoS ONE 2015, 10, e0120335. [Google Scholar] [CrossRef]
- Vastaranta, M.; Holopainen, M.; Yu, X.; Hyyppä, J.; Mäkinen, A.; Rasinmäki, J.; Melkas, T.; Kaartinen, H.; Hyyppä, H. Effects of Individual Tree Detection Error Sources on Forest Management Planning Calculations. Remote Sens. 2011, 3, 1614–1626. [Google Scholar] [CrossRef]
- Vega, C.; Hamrouni, A.; El Mokhtari, S.; Morel, J.; Bock, J.; Renaud, J.P.; Bouvier, M.; Durrieu, S. PTrees: A point-based approach to forest tree extraction from lidar data. Int. J. Appl. Earth Obs. Geoinf. 2014, 33, 98–108. [Google Scholar] [CrossRef]
- Lahivaara, T.; Seppanen, A.; Kaipio, J.P.; Vauhkonen, J.; Korhonen, L.; Tokola, T.; Maltamo, M. Bayesian approach to tree detection based on airborne laser scanning data. IEEE Trans. Geosci. Remote Sens. 2014, 52, 2690–2699. [Google Scholar] [CrossRef]
- Maltamo, M.; Kallio, E.; Bollandsås, O.M.; Næsset, E.; Gobakken, T.; Pesonen, A. Assessing Dead Wood by Airborne Laser Scanning. In Forestry Applications of Airborne Laser Scanning; Springer: Dordrecht, The Netherlands, 2014; pp. 375–395. [Google Scholar] [CrossRef]
- Krause, S.; Sanders, T.G.; Mund, J.P.; Greve, K. UAV-Based Photogrammetric Tree Height Measurement for Intensive Forest Monitoring. Remote Sens. 2019, 11, 758. [Google Scholar] [CrossRef]
- Marques, P.; Pádua, L.; Adão, T.; Hruška, J.; Peres, E.; Sousa, A.; Sousa, J.J. UAV-Based Automatic Detection and Monitoring of Chestnut Trees. Remote Sens. 2019, 11, 855. [Google Scholar] [CrossRef]
- Wolf, P.R.; Dewitt, B.A. Elements of Photogrammetry: With Applications in GIS; McGraw-Hill: New York, NY, USA, 2000; p. 608. [Google Scholar]
- Wang, Y.; Lehtomäki, M.; Liang, X.; Pyörälä, J.; Kukko, A.; Jaakkola, A.; Liu, J.; Feng, Z.; Chen, R.; Hyyppä, J. Is field-measured tree height as reliable as believed—A comparison study of tree height estimates from field measurement, airborne laser scanning and terrestrial laser scanning in a boreal forest. ISPRS J. Photogramm. Remote Sens. 2019, 147, 132–145. [Google Scholar] [CrossRef]
- Dandois, J.; Olano, M.; Ellis, E. Optimal Altitude, Overlap, and Weather Conditions for Computer Vision UAV Estimates of Forest Structure. Remote Sens. 2015, 7, 13895–13920. [Google Scholar] [CrossRef]
- Leitold, V.; Keller, M.; Morton, D.C.; Cook, B.D.; Shimabukuro, Y.E. Airborne lidar-based estimates of tropical forest structure in complex terrain: Opportunities and trade-offs for REDD+. Carbon Balance Manag. 2015, 10, 3. [Google Scholar] [CrossRef]
- Sterba, H. Equilibrium curves and growth models to deal with forests in transition to uneven-aged structure-application in two sample stands. Silva Fenn. 2004, 38, 413–423. [Google Scholar] [CrossRef]
- Maltamo, M.; Peuhkurinen, J.; Malinen, J.; Vauhkonen, J.; Packalén, P.; Tokola, T. Predicting tree attributes and quality characteristics of Scots pine using airborne laser scanning data. Silva Fenn. 2009, 43. [Google Scholar] [CrossRef]
- Vauhkonen, J.; Korpela, L.; Maltamo, M.; Tokola, T. Imputation of single-tree attributes using airborne laser scanning-based height, intensity, and alpha shape metrics. Remote Sens. Environ. 2010, 114, 1263–1276. [Google Scholar] [CrossRef]
- Vastaranta, M.; Saarinen, N.; Kankare, V.; Holopainen, M.; Kaartinen, H.; Hyyppä, J.; Hyyppä, H. Multisource Single-Tree Inventory in the Prediction of Tree Quality Variables and Logging Recoveries. Remote Sens. 2014, 6, 3475–3491. [Google Scholar] [CrossRef]
- Valbuena-Rabadán, M.Á.; Santamaría-Peña, J.; Sanz, F. Estimation of diameter and height of individual trees for Pinus sylvestris L. based on the individualising of crowns using airborne LiDAR and the National Forestry Inventory data. For. Syst. 2016, 25, 1. [Google Scholar] [CrossRef]
- Saarinen, N.; Vastaranta, M.; Kankare, V.; Tanhuanpää, T.; Holopainen, M.; Hyyppä, J.; Hyyppä, H. Urban-Tree-Attribute Update Using Multisource Single-Tree Inventory. Forests 2014, 5, 1032–1052. [Google Scholar] [CrossRef]
- Lee, A.C.; Lucas, R.M. A LiDAR-derived canopy density model for tree stem and crown mapping in Australian forests. Remote Sens. Environ. 2007, 111, 493–518. [Google Scholar] [CrossRef]
- Hamraz, H.; Contreras, M.A.; Zhang, J. Forest understory trees can be segmented accurately within sufficiently dense airborne laser scanning point clouds. Sci. Rep. 2017, 7, 6770. [Google Scholar] [CrossRef] [PubMed]


© 2020 by the authors. Licensee MDPI, Basel, Switzerland. This article is an open access article distributed under the terms and conditions of the Creative Commons Attribution (CC BY) license (http://creativecommons.org/licenses/by/4.0/).