Abstract
The fraction of absorbed photosynthetically active radiation (FAPAR) is an essential climate variable (ECV) widely used for various ecological and climate models. However, all the current FAPAR satellite products correspond to instantaneous FAPAR values acquired at the satellite transit time only, which cannot represent the variations in photosynthetic processes over the diurnal period. Most studies have directly used the instantaneous FAPAR as a reasonable approximation of the daily integrated value. However, clearly, FAPAR varies a lot according to the weather conditions and amount of incoming radiation. In this paper, a temporal upscaling method based on the cosine of the solar zenith angle (SZA) at local noon () is proposed for converting instantaneous FAPAR to daily integrated FAPAR. First, the diurnal variations in FAPAR were investigated using PROSAIL (a model of Leaf Optical Properties Spectra (PROSPECT) integrating a canopy radiative transfer model (Scattering from Arbitrarily Inclined Leaves, SAIL)) simulations with different leaf area index (LAI) values corresponding to different latitudes. It was found that the instantaneous black sky FAPAR at 09:30 AM provided a good approximation for the daily integrated black sky FAPAR; this gave the highest correlation (R2 = 0.995) and lowest Root Mean Square Error (RMSE = 0.013) among the instantaneous black sky FAPAR values observed at different times. Secondly, the difference between the instantaneous black sky FAPAR values acquired at different times and the daily integrated black sky FAPAR was analyzed; this could be accurately modelled using the cosine value of solar zenith angle at local noon () for a given vegetation scene. Therefore, a temporal upscaling method for typical satellite products was proposed using a cos(SZA)-based upscaling model. Finally, the proposed cos(SZA)-based upscaling model was validated using both the PROSAIL simulated data and the field measurements. The validated results indicated that the upscaled daily black sky FAPAR was highly consistent with the daily integrated black sky FAPAR, giving very high mean R2 values (0.998, 0.972), low RMSEs (0.007, 0.014), and low rMAEs (0.596%, 1.378%) for the simulations and the field measurements, respectively. Consequently, the cos(SZA)-based method performs well for upscaling the instantaneous black sky FAPAR to its daily value, which is a simple but extremely important approach for satellite remote sensing applications related to FAPAR.
1. Introduction
The fraction of absorbed photosynthetically active radiation (FAPAR) is defined as the fraction of incoming solar radiation in the range of 400–700 nm that is absorbed by vegetation. FAPAR characterizes the growth status of the vegetation and expresses its capacity to absorb energy. FAPAR is, therefore, considered to be one of the key climate variables for tracing mass and energy exchanges, and is also recognized as such by the Global Terrestrial Observing System (GTOS) and Global Climate Observing System (GCOS) [1]. Additionally, numerous ecological and climate models, including the community land model, the community earth system model, and crop growth models, generally use FAPAR as an essential input variable [2,3,4,5].
Nowadays, several satellite FAPAR products have already emerged and can be obtained free of charge, including the moderate resolution imaging spectroradiometer (MODIS) [6,7], multiangle imaging spectroradiometer (MISR) [8], medium resolution imaging spectrometer (MERIS) [9], carbon cycle and change in land observational products from an ensemble of satellites (CYCLOPES) [10], global biophysical products terrestial carbon studies (GLOBCARBON) [11], global land surface satellite (GLASS) [12], energy balance residual (EBR) [13], joint research center two-stream inversion package (JRC-TIP) [14], and European Space Agency (ESA) products [15], which have been extensively validated with RMSE values varying from 0.08 to 0.23 [12,16,17,18,19,20,21].
However, the above FAPAR products have the following drawbacks. First, for most current FAPAR products acquired by satellites, the FAPAR values only correspond to the instantaneous FAPAR at the satellite transit time and cannot represent the diurnal FAPAR. Second, the daily integrated FAPAR is acquired for the productivity models instead of the instantaneous FAPAR obtained by satellites, especially for GPP estimates. Furthermore, FAPAR is dependent on the incident radiation; it is correlated with the sun zenith angle (SZA) and also the atmospheric conditions or diffuse light intensity [22]. Therefore, the diurnal FAPAR is dynamic and closely related to vegetation structure and solar illumination [23]. Thus, it can be seen that the current FAPAR products can not satisfy the requirements of vegetation productivity or the carbon cycle estimates.
Due to the lack of diurnal FAPAR products, the assumption that the instantaneous FAPAR at the satellite transit time (about 10:00 AM) is a good approximation of the daily integrated black sky FAPAR [17,23,24,25,26] is widely accepted, and satellite FAPAR products are approximated to represent the daily integrated FAPAR in most cases. Nevertheless, it is not clear how well the instantaneous FAPAR agrees with the daily integrated FAPAR, and relying on this assumption definitely leads to the propagation of errors in vegetation productivity and growth models [27]. Moreover, the absolute bias of the daily integrated FAPAR approximated by the instantaneous FAPAR is larger than 0.05 [28], which is the maximum acceptable error in FAPAR for agricultural and other applications. Moreover, there are several studies that have focused on the diurnal variation in FAPAR, and the results have demonstrated that there are obvious diurnal variations in FAPAR. For example, Majasalmi et al. found that diurnal FAPAR values for a young pine stand ranged from 0.63 to 0.98 [29], and Xie et al. observed wide fluctuations in diurnal FAPAR [30]. The upscaling of instantaneous FAPAR to the daily scale is, therefore, highly necessary.
Generally, daily integrated FAPAR is obtained by integrating the instantaneous the black sky FAPAR from sunrise to sunset and from white sky FAPAR weighted by the diffuse ratio [22,31], as shown in Equation (1):
where is the daily integrated FAPAR; is the instantaneous black sky FAPAR for direct radiation from sunrise to sunset; is the white sky FAPAR under diffuse radiation conditions; is the ratio of diffuse PAR; and is the sun zenith angle. However, all the current global FAPAR products are acquired by satellites in synchronous orbits and only the instantaneous value of FAPAR corresponding to the satellite overpass time is available. The question is how to convert the instantaneous observations to the daily integrated value. Until now, this problem has not been solved.
This study focused on developing a temporal upscaling method for converting an instantaneous FAPAR observation to the corresponding daily integrated value for the currently available satellite products. Using both simulated and measured data, we aimed to: (1) investigate the diurnal variation in the black sky FAPAR for different vegetation canopies in different seasons and locations, and to clarify the main variable driving the diurnal FAPAR variation; (2) present a cosine value of solar zenith angle (cos(SZA))-based correction model for upscaling the instantaneous FAPAR to a daily value; and (3) assess the performance of the cos(SZA)-based FAPAR upscaling model and give a solution for how to upscale the current instantaneous satellite FAPAR products to daily products.
2. Materials and Methods
In this section, the materials and methods used for modeling and validating the upscaling method of the instantaneous FAPAR are described below, presenting two separate parts, including both the synthetical analysis (Section 2.1, Section 2.2, Section 2.3 and Section 2.4) and the in situ analysis (Section 2.5).
2.1. PROSAIL Simulated Datasets
For assessing the performance of the temporal upscaling method proposed in this paper, an instantaneous black sky FAPAR dataset from the 15th day of each month in the year 2017 was simulated using the PROSAIL model [32]. The PROSAIL model integrates a leaf radiative transfer model (a model of Leaf Optical Properties Spectra, PROSPECT) [33] and a canopy radiative transfer model (scattering from arbitrarily inclined leaves, SAIL) [34]. The PROSPECT model contains four main leaf optical parameters, including the leaf chlorophyll content (Cab), leaf water-equivalent thickness (Cw), leaf dry matter content (Cdm), and a leaf internal structure variable (N) that quantifies the growth status of the vegetation. The SAIL model considers vegetation to be a turbid medium and assumes a uniform blade azimuth distribution, taking into account any inclination to simulate the directional reflectance of the vegetation canopy. The leaf reflectance and transmittance simulated by the PROSPECT model are used as input parameters to the SAIL model. According to the statistical values of the biochemical vegetation contents in related research [35,36,37,38], the fixed values or ranges were assigned to these parameters to represent the most natural vegetation conditions, namely 40 μg/cm2 for Cab and a range from 1 to 7 for leaf area index (LAI), while the other parameters were set as the default values of the PROSAIL model. In addition, a spherical structure type was selected as an approximation for most vegetation canopy types. The main input includes the leaf biochemical properties, canopy structure parameters, imaging geometry, and time information (Table 1). In the end, the diurnal instantaneous black sky FAPAR data covering the most common vegetation statuses and most global regions (latitude range corresponding to to ) were obtained.

Table 1.
The main input variables of the PROSAIL (a model of Leaf Optical Properties Spectra (PROSPECT) integrating a canopy radiative transfer model (Scattering from Arbitrarily Inclined Leaves, SAIL)) model in the simulation experiment.
2.2. 6S Simulated Datasets
To model the atmospheric radiation transfer processes, the second simulation of the satellite signal in the solar spectrum radiative transfer model (6S model) [39] was employed.
Here, in order to retrieve the diffuse ratio , we used the 6S model (Version 1.0B) to simulate the radiation under different illumination conditions, including direct and diffuse radiation. Based on the model parameters, including the total atmospheric water vapor content, ozone, aerosol optical thickness (AOT), and solar zenith angle (SZA), the direct and diffuse radiation could be modelled for the given parameters, which covered most natural atmospheric and illumination conditions. Finally, a total of 589 simulations were generated. Table 2 shows the main parameters used in the 6S model in this paper.
Table 2.
The main inputs to the 6S model.
2.3. Field FAPAR Measurements
All of the field FAPAR measurements were collected using a FAPARnet system (StarViewer, Beijing, China) to make observations of a summer maize canopy at Gucheng, Baoding City, China, as described in the study by Zhao et al. [40]. The experimental area covered a rectangular plot of 24 m2. The photosynthetically active radiation (PAR) values were automatically and continuously measured between 07:00 AM and 18:00 PM every day from 15th July to 2nd August, 2017, at the top and bottom of the canopy, respectively, during the jointing growth period and tasseling stage. Four PAR components were recorded by the FAPARnet, including the total PAR arriving at the top of the canopy (), the PAR reflected to the atmosphere (), the PAR transmitted to the soil background (), and the soil reflected PAR (). The canopy FAPAR can be calculated using the four PAR components [41,42]:
The average values for each PAR component, as measured by nine independent sensors, were used in Equation (2) to calculate FAPAR. As illustrated in Figure 1, these sensors were assembled into a metal container with an equal interval (5 cm), and all the PAR signals were measured using double-sided metal rods placed above and below the canopy (a distance of 15 cm was retained for the lower rod and the soil background).
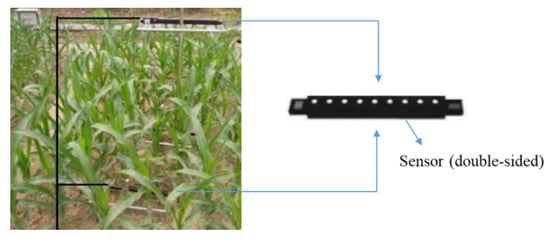
Figure 1.
Diagram showing the fraction of absorbed photosynthetically active radiation (FAPAR) automatic observation system.
2.4. Method of Upscaling Instantaneous FAPAR to Daily FAPAR
There is an obvious diurnal variation in black sky FAPAR, as observed in satellite FAPAR products, which is related to latitudinal and temporal variations. The corresponding SZA values are generally used to explicate the influence of the above factors. For clear sky observations, cos(SZA) can be regarded as a proxy of solar radiation, and has been widely used to account for the influence of latitude and seasons in solar-induced chlorophyll fluorescence (SIF) temporal upscaling [43,44,45,46,47]. Inspired by this, in this study, a cos(SZA)-based upscaling method was developed to convert a single, instantaneous FAPAR measurement to a daily integrated value.
A flowchart of the cos(SZA)-based upscaling method is shown in Figure 2. First, the mean daily black sky FAPAR value was integrated using the continuous instantaneous black sky FAPAR simulations according to Equation (3) (introduced in the next section). Secondly, the relative difference between the daily integrated black sky FAPAR and the instantaneous black sky FAPAR at a certain moment (the satellite transit time) was computed. Thirdly, the correction model based on the cosine value of the noon SZA () was developed to convert the instantaneous black sky FAPAR from the time of the satellite overpass (for example, 10:00 AM) to the daily integrated value. Finally, the cos(SZA)-based upscaling method was validated using the PROSAIL simulated datasets as well as field measurements.
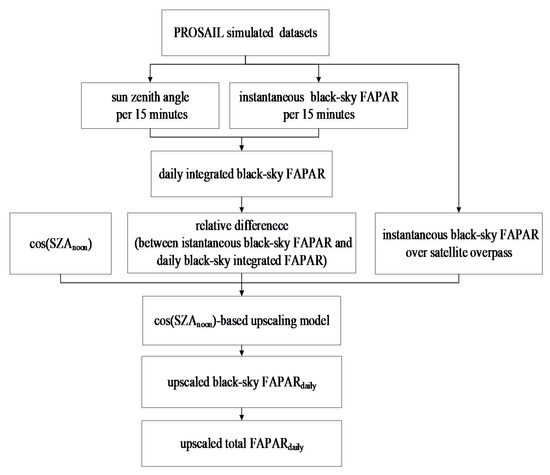
Figure 2.
Flowchart of the upscaling method for the instantaneous black sky fraction of absorbed photosynthetically active radiation (FAPAR).
2.4.1. Integrating Continuous Observations to Daily Mean FAPAR
The instantaneous black sky FAPAR is a variable whose value depends on the illumination angle, which, in turn, is correlated with the SZA. Generally, a simple integration formula is used to approximate the daily integrated black sky FAPAR:
where depicts the daily integrated black sky FAPAR, is the instantaneous black sky FAPAR at different times from sunrise to sunset, and is the sun zenith angle.
2.4.2. Correction Model for Converting Instantaneous FAPAR to Daily FAPAR
In order to correct the instantaneous black sky FAPAR acquired at a certain moment (that of the satellite transit time) to daily integrated black sky FAPAR, the relative difference between these two FAPAR values needed to be calculated first:
where is the relative difference between the instantaneous black sky FAPAR and the daily integrated black sky FAPAR; is the daily integrated black sky FAPAR.
Secondly, the daily integrated black sky FAPAR was calculated by Equation (2) using the instantaneous black sky FAPAR dataset simulated by the PROSAIL model. We investigated the relationship between the relative difference between the instantaneous and daily FAPAR values and the cosine value of sun zenith angle at local noon (12:00) (), and found that the relative difference could be accurately fitted using a linear function of and the instantaneous black sky FAPAR at the satellite transit time based on the PROSAIL simulated data:
where is the fitted relative difference between the instantaneous black sky FAPAR and the daily integrated black sky FAPAR; is the instantaneous black sky FAPAR at the time of the satellite overpass; and a, b, and c are the coefficients of the linear regression function.
Finally, the instantaneous black sky FAPAR was upscaled to a daily integrated value using:
where is the upscaled black sky FAPAR (daily integrated black sky FAPAR).
The cos(SZA)-based upscaling model was validated using a subset of the PROSAIL simulations; 70% of the simulations (training dataset) were randomly selected to model the linear model and the remaining 30% were used for validation (validation dataset).
2.5. Validation Method for the Field Measurements
As explained in the field experiment section, we collected continuous observations of FAPAR for a maize canopy. As the field experiment was conducted under incoming solar radiation, which included both direct and diffuse radiation, these field measurements were of the total FAPAR—a weighted sum of FAPAR values under both direct and diffuse radiation. In order to validate the cos(SZA)-based correction model for black sky FAPAR, it was necessary to design an approach to retrieve the diffuse ratio and also to separate the black sky FAPAR from the total FAPAR.
2.5.1. Method Used to Retrieve the Diffuse Ratio
In the field experiment, no diffuse ratio measurements were made. Therefore, we designed a look-up table (LUT) approach to retrieve the diffuse ratio. The 6S atmosphere radiation transfer model was utilized to model both direct and diffuse radiation under most natural atmospheric conditions, covering values of the atmospheric optical depth (AOD) from 0–0.6, with intervals of 0.01 and a solar zenith angle range of 0–90 with intervals of 5. Based on the modelled 6S data, the diffuse ratio corresponding to different atmospheric and illumination conditions was obtained, and a look-up table (LUT) consisting of PAR was established. When the incoming PAR was recorded, the diffuse ratio could then be retrieved by minimizing the following cost function:
where is the squared error; and are the PAR simulated by 6S and the field-measured PAR, respectively.
In this paper, the LUT approach was constructed using the 70% randomly selected data simulated by the 6S model, and the remaining 30% was retained to test the LUT-based method. The validation results showed that the diffuse ratio was accurately retrieved, giving an R² of 0.773 and a relative RMSE of 12.5%.
2.5.2. Separating Black Sky FAPAR From the Field-Measured Total FAPAR
The field measurements of FAPAR corresponded to the total FAPAR, which was computed as a sum of FAPAR values weighted by the diffuse ratio () under both direct and diffuse radiation, as shown in equation (8).
In order to obtain FAPAR under both direct and diffuse radiation, it was assumed that the black sky FAPAR did not vary between two adjacent moments (an interval of five minutes) and the white sky FAPAR was considered to be a constant within a day [48]. FAPAR measurements from two adjacent moments when the instantaneous PAR changed dramatically (i.e., the weather conditions changed a lot) were selected to build the equation set:
where denotes the total FAPAR at the selected moments; and are the black sky FAPAR and the diffuse ratio at these two times (i = 1, 2). Note that is assumed to be equal to .
Using Equation (9), FAPAR values under both direct and diffuse radiation could be obtained simultaneously. If we also assumed that the white sky FAPAR did not vary at all during the whole day, the instantaneous black sky FAPAR at other times could be easily calculated using Equation (8), because the diffuse ratio and white sky FAPAR had already been determined. Finally, the daily integrated black sky FAPAR could be calculated using the continuous field records of instantaneous black sky FAPAR.
3. Results
3.1. Upscaling Model Based on the PROSAIL Model
Using the data simulated by PROSAIL, the cos(SZA)-based upscaling model for converting one instantaneous black sky FAPAR value from the overpass time to its daily integrated value could be determined. Table 3 illustrates the model parameters for four current satellite FAPAR products (the medium resolution imaging spectrometer (MERIS), geoland-2 version 1 (GEOV1), moderate resolution imaging spectroradiometer (MODIS)/multiangle imaging spectroradiometer (MISR) and sea wide field-of-view sensor (SeaWiFS) products) corresponding to the satellite overpass time. The corresponding values of R2 are also shown.
Table 3.
The cosine value of solar zenith angle (cos(SZA))-based correction model and its parameters for four current satellite FAPAR products.
3.2. Validation of the Difference Prediction Model
3.2.1. Validation Based on the PROSAIL Model
The cos(SZA)-based correction models for the four current satellite FAPAR products listed in Table 3 were validated using the validation dataset (Figure 3); both the instantaneous and upscaled daily FAPAR values were compared to the “true” daily integrated FAPAR. A comparison of the results indicated that the upscaled daily FAPAR samples were concentrated on the two sides of the 1:1 line and had a very low RMSE and relatively low mean absolutely error (rMAE), while the values of the instantaneous black sky FAPAR from the satellite overpass times were always lower than the true value (below the 1:1 line) and had a larger RMSE (about three times of that of the upscaled FAPAR) and larger relative Mean Absolute Errors (rMAEs).
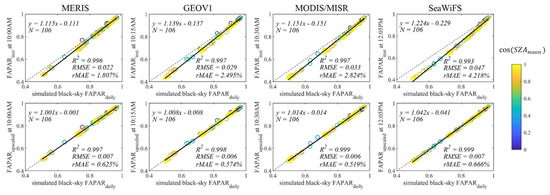
Figure 3.
Scatterplots of the true daily integrated black sky FAPAR at different satellite overpass times against the instantaneous black sky FAPAR (upper row) and the upscaled daily black-sky FAPAR (upscaled , lower row). The legend represents the different values of the cosine value of solar zenith angle at local noon (). N denotes the number of points.
Moreover, the instantaneous black sky FAPAR obtained at 09:30 AM was found to best approximate the daily integrated black sky FAPAR, with an RMSE of 0.013, an rMAE of 1.072%, and an R2 of 0.995 (Figure 4).
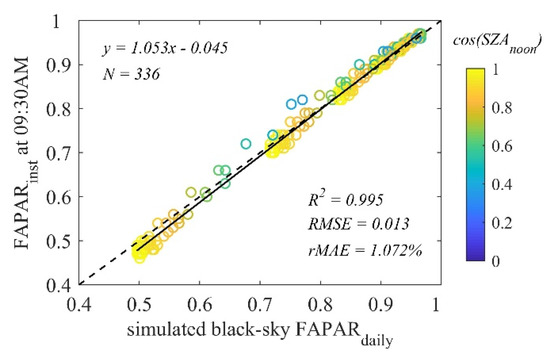
Figure 4.
Scatterplot of the instantaneous black sky FAPAR from 09:30 AM against the simulated daily integrated black sky FAPAR. N denotes the number of points.
3.2.2. Validation Based on the Field Measurements
The cos(SZA)-based correction models for the four current satellite FAPAR products were also validated using the corresponding in situ measurements. However, for the field measurements, only measurements of the total FAPAR were available, and there were some uncertainties involved in retrieving black sky FAPAR for both upscaled and measured data. The cos(SZA)-based upscaling model was, therefore, validated using the in situ daily total FAPAR data. Figure 5 illustrates scatterplots of the upscaled daily total FAPAR () and the measured instantaneous total FAPAR () against the true daily total FAPAR (measured total ) at different satellite overpass times (10:00 AM, 10:15 AM, 10:30 AM, and 12:05 PM). The results show a high agreement between the upscaled total and the measured daily total FAPAR, with R2 values ranging from 0.974 to 0.981, an RMSE value of about 0.013, and rMAE values varying from 1.360% to 1.412%. The systematic underestimation between instantaneous total FAPAR at 12:00 AM and its daily FAPAR was well corrected. Therefore, the cos(SZA)-based upscaling model accurately upscales a single instantaneous black sky FAPAR measurement to the daily integrated value.
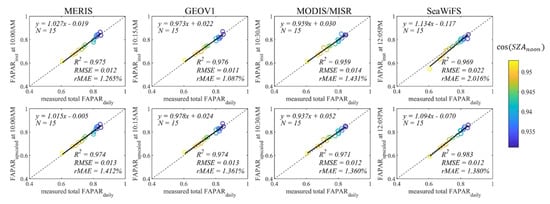
Figure 5.
Scatterplots of the measured daily total FAPAR against the instantaneous total FAPAR (upper row), and the upscaled daily total FAPAR (lower row) for different satellite overpasses. The legend represents the different values of . N denotes the number of points.
4. Discussion
4.1. Significance of the Upscaling of Instantaneous FAPAR
As FAPAR is a function of the incident radiation, it varies with the sun zenith angle and the atmospheric conditions. The diurnal variation in FAPAR may be dramatic under changing irradiation conditions [45]. Therefore, a simple approximation of the daily integrated FAPAR using the instantaneous observation from the time of a satellite overpass may introduce a large bias. In this paper, a method for upscaling the instantaneous black sky FAPAR from the satellite transit time to its daily value has been proposed, and the validation results have demonstrated that the upscaled daily FAPAR agrees well with both the simulated and the measured daily FAPAR.
Figure 6 shows the RMSE before and after upscaling of the instantaneous black sky FAPAR to the daily averaged black sky FAPAR for different LAI conditions (an LAI range of 1–7); a similar comparison between the upscaled daily FAPAR and the daily averaged black sky FAPAR is also shown. The results show that the RMSE for the instantaneous black sky FAPAR is much bigger than that for the upscaled daily FAPAR, especially for a canopy with a small LAI and for instantaneous observations made at noon (12:05 PM: the SeaWiFs overpass time); this situation gives the largest RMSE (0.083), which shows the necessity of acquiring the FAPAR products corresponding to a daily scale.
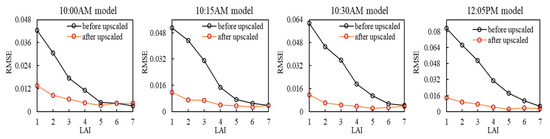
Figure 6.
The root mean square error (RMSE) of the instantaneous black sky FAPAR to the daily averaged black sky FAPAR before and after upscaled under different leaf area index (LAI) conditions.
4.2. Uncertainty Due to Differences in Vegetation Types
As described above, FAPAR is closely related to the incident radiation, and the difference between the instantaneous FAPAR and daily integrated FAPAR is related to the sun zenith angle and the canopy structure, as measured by the LAI, leaf angle distribution (LAD), and clumping index (CI). In this paper, canopies with different LAIs but only a spherical LAD were simulated and investigated. The differences due to other canopy structural types (such as differences in LAD and CI) were not taken into consideration, which will have introduced some uncertainties. Nonetheless, according to the validations made using the PROSAIL simulated data under different LAI conditions (as shown in Table 4), the RMSE in the upscaled was quite small, ranging from 0.0022 to 0.0138. This indicates that the errors caused by the differences in LAI were of an acceptable size, and the impact of other canopy structure parameters, such as the leaf angle distribution (LAD), will be further analyzed in future studies.
Table 4.
The mean RMSE and the RMSE ranges for different satellite models under different LAI conditions (LAI range 1–7).
4.3. Uncertainty Involved in Retrieving the Black Sky FAPAR from the Field Measurements
As the black sky FAPAR was obtained from the measured total FAPAR using the diffuse ratio retrieved from the 6S model, the retrieval errors of the diffuse ratio certainly caused uncertainties. The input parameters in the 6S model, such as Aerosol Optical Thickness (AOT), the ground reflectance type, and the aerosol model, were set with fixed values or ranges covering most atmospheric conditions. The impacts of other atmospheric parameters and cloudy conditions were not considered in this study. Therefore, if a measured dataset of the diffuse ratio is available, it could be used to calculate the black sky FAPAR directly.
5. Conclusions
Current global FAPAR products are based on instantaneous measurements of FAPAR from the time of satellite overpasses, and no daily satellite FAPAR products are yet available. Although instantaneous FAPAR values have been widely used as the daily integrated FAPAR in many ecological and agricultural applications, this approximation may introduce an unacceptable bias. In this paper, a cos(SZA)-based method was presented to transform a single instantaneous black sky FAPAR measurement to its daily mean value. Temporal upscaling models for the different current satellite FAPAR products, including those based on MERIS, MODIS, GEOV1, and SeaWiFs data, were also developed. The temporal FAPAR upscaling method was validated using both PROSAIL simulated data and field measurements made on a maize canopy. The results showed that the upscaled daily FAPAR was highly consistent with the daily integrated FAPAR, giving very high mean R2 values (0.998, 0.972), low RMSEs (0.007, 0.014), and low rMAEs (0.596%, 1.378%) for the simulated and measured datasets, respectively. Therefore, it can be concluded that the proposed cos(SZA)-based method can accurately upscale instantaneous black sky FAPAR to daily integrated FAPAR, thus providing a simple but extremely important method for use in satellite remote sensing applications related to FAPAR.
Author Contributions
Conceptualization, S.C. and L.L.; methodology, S.C. and L.L.; software, S.C.; validation, S.C., X.H., and Z.L.; formal analysis, S.C.; investigation, S.C. and L.L.; writing—original draft preparation, S.C.; writing—review and editing, L.L. and D.P.; supervision, L.L. and D.P. All authors have read and agreed to the published version of the manuscript.
Funding
This research was funded by the National Key Research and Development Program of China, grant number 2017YFA0603001, the Key Research Program of the Chinese Academy of Sciences, grant number ZDRW-ZS-2019-1, and the National Natural Science Foundation of China, grant number 41825002.
Conflicts of Interest
The authors declare no conflict of interest.
References
- Gobron, N.; Knorr, W.; Belward, A.S.; Pinty, B. Fraction of absorbed photosynthetically active radiation (FAPAR). Bull. Am. Meteorol. Soc. 2010, 91, S50–S51. [Google Scholar]
- Bonan, G.B.; Oleson, K.W.; Vertenstein, M.; Levis, S.; Zeng, X.; Dai, Y.; Dickinson, R.E.; Yang, Z.L. The land surface climatology of the community land model coupled to the NCAR community climate model. J. Clim. 2002, 15, 3123–3149. [Google Scholar] [CrossRef]
- Kaminski, T.; Knorr, W.; Scholze, M.; Gobron, N.; Pinty, B.; Giering, R.; Mathieu, P.-P. Consistent assimilation of MERIS FAPAR and atmospheric CO 2 into a terrestrial vegetation model and interactive mission benefit analysis. Biogeosciences 2012, 9, 3173–3184. [Google Scholar] [CrossRef]
- Maselli, F.; Chiesi, M.; Fibbi, L.; Moriondo, M. Integration of remote sensing and ecosystem modelling techniques to estimate forest net carbon uptake. Int. J. Remote Sens. 2008, 29, 2437–2443. [Google Scholar] [CrossRef]
- Tian, Y.; Dickinson, R.E.; Zhou, L.; Zeng, X.; Dai, Y.; Myneni, R.; Knyazikhin, Y.; Zhang, X.; Friedl, M.; Yu, H. Comparison of seasonal and spatial variations of leaf area index and fraction of absorbed photosynthetically active radiation from Moderate Resolution Imaging Spectroradiometer (MODIS) and Common Land Model. J. Geophys. Res. Atmos. 2004, 109, D01103. [Google Scholar] [CrossRef]
- Myneni, R.B.; Hoffman, S.; Knyazikhin, Y.; Privette, J.L.; Glassy, J.; Tian, Y.; Wang, Y.; Song, X.; Zhang, Y.; Smith, G.R.; et al. Global products of vegetation leaf area and fraction absorbed PAR from year one of MODIS data. Remote Sens. Environ. 2002, 83, 214–231. [Google Scholar] [CrossRef]
- Knyazikhin, Y.; Martonchik, J.; Myneni, R.B.; Diner, D.; Running, S.W. Synergistic algorithm for estimating vegetation canopy leaf area index and fraction of absorbed photosynthetically active radiation from MODIS and MISR data. J. Geophys. Res. Atmos. 1998, 103, 32257–32275. [Google Scholar] [CrossRef]
- Knyazikhin, Y.; Martonchik, J.V.; Diner, D.J.; Myneni, R.B.; Verstraete, M.; Pinty, B.; Gobron, N. Estimation of vegetation canopy leaf area index and fraction of absorbed photosynthetically active radiation from atmosphere-corrected MISR data. J. Geophys. Res. Atmos. 1998, 103, 32239–32256. [Google Scholar] [CrossRef]
- Gobron, N.; Pinty, B.; Verstraete, M.; Govaerts, Y. The MERIS Global Vegetation Index (MGVI): Description and preliminary application. Int. J. Remote Sens. 1999, 20, 1917–1927. [Google Scholar] [CrossRef]
- Baret, F.; Hagolle, O.; Geiger, B.; Bicheron, P.; Miras, B.; Huc, M.; Berthelot, B.; Niño, F.; Weiss, M.; Samain, O. LAI, fAPAR and fCover CYCLOPES global products derived from VEGETATION: Part 1: Principles of the algorithm. Remote Sens. Environ. 2009, 110, 275–286. [Google Scholar] [CrossRef]
- Plummer, S.; Arino, O.; Simon, M.; Steffen, W. Establishing a earth observation product service for the terrestrial carbon community: The Globcarbon initiative. Mitig. Adapt. Strateg. Glob. Chang. 2006, 11, 97–111. [Google Scholar] [CrossRef]
- Xiao, Z.; Liang, S.; Rui, S.; Wang, J.; Bo, J. Estimating the fraction of absorbed photosynthetically active radiation from the MODIS data based GLASS leaf area index product. Remote Sens. Environ. 2015, 171, 105–117. [Google Scholar] [CrossRef]
- Liu, L.; Zhang, X.; Xie, S.; Liu, X.; Song, B.; Chen, S.; Peng, D. Global White-Sky and Black-Sky FAPAR retrieval using the energy balance residual method: Algorithm and Validation. Remote Sens. 2019, 11, 1004. [Google Scholar] [CrossRef]
- Pinty, B.; Clerici, M.; Andredakis, I.; Kaminski, T.; Taberner, M.; Verstraete, M.M.; Gobron, N.; Plummer, S.; Widlowski, J.-L. Exploiting the MODIS albedos with the Two-stream Inversion Package (JRC-TIP): 2. Fractions of transmitted and absorbed fluxes in the vegetation and soil layers. J. Geophys. Res. 2011, 116, D09106. [Google Scholar] [CrossRef]
- Disney, M.; Muller, J.P.; Kharbouche, S.; Kaminski, T.; Voßbeck, M.; Lewis, P.; Pinty, B. A new global fAPAR and LAI dataset derived from optimal albedo estimates: Comparison with MODIS products. Remote Sens. 2016, 8, 275. [Google Scholar] [CrossRef]
- Wang, Y.; Tian, Y.; Zhang, Y.; Elsaleous, N.; Knyazikhin, Y.; Vermote, E.; Myneni, R.B. Investigation of product accuracy as a function of input and model uncertainties - Case study with SeaWiFS and MODIS LAI/FPAR algorithm. Remote Sens. Environ. 2000, 78, 299–313. [Google Scholar] [CrossRef]
- Camacho, F.; Cernicharo, J.; Lacaze, R.; Baret, F.; Weiss, M. GEOV1: LAI, FAPAR essential climate variables and FCOVER global time series capitalizing over existing products. Part 2: Validation and intercomparison with reference products. Remote Sens. Environ. 2013, 137, 310–329. [Google Scholar] [CrossRef]
- Gobron, N.; Pinty, B.; Aussedat, O.; Taberner, M.; Faber, O.; Mélin, F.; Lavergne, T.; Robustelli, M.; Snoeij, P. Uncertainty estimates for the FAPAR operational products derived from MERIS—Impact of top-of-atmosphere radiance uncertainties and validation with field data. Remote Sens. Environ. 2008, 112, 1871–1883. [Google Scholar] [CrossRef]
- Dech, S. Validation of the collection 5 MODIS FPAR product in a heterogeneous agricultural landscape in arid Uzbekistan using multitemporal RapidEye imagery. Int. J. Remote Sens. 2012, 33, 6818–6837. [Google Scholar]
- Pickett-Heaps, C.A.; Canadell, J.G.; Briggs, P.R.; Gobron, N.; Haverd, V.; Paget, M.J.; Pinty, B.; Raupach, M.R. Evaluation of six satellite-derived Fraction of Absorbed Photosynthetic Active Radiation (FAPAR) products across the Australian continent. Remote Sens. Environ. 2014, 140, 241–256. [Google Scholar] [CrossRef]
- Xin, T.; Liang, S.; Wang, D. Assessment of five global satellite products of fraction of absorbed photosynthetically active radiation: Intercomparison and direct validation against ground-based data. Remote Sens. Environ. 2015, 163, 270–285. [Google Scholar]
- Weiss, M.; Baret, F. fAPAR (fraction of Absorbed Photosynthetically Active Radiation) estimates at various scale. In Proceedings of the 34th International Symposium for Remote Sensing of the Environment (ISRSE), Sydney, Australia, 10–15 April 2011; pp. 10–15. [Google Scholar]
- Mõttus, M.; Sulev, M.; Frederic, B.; Lopez-Lozano, R.; Noorma, A. Photosynthetically Active Radiation: Measurement and Modeling. In Encyclopedia of Sustainability Science and Technology; Meyers, R., Ed.; Springer: New York, NY, America, 2011; pp. 7970–8000. [Google Scholar]
- Baret, F.; Makhmara, H.; Lacaze, R.; Smets, B. Biopar product user manual LAI, FAPAR, FCover, NDVI version 1 from SPOT/VEGETATION data. In EC Proposal FP-7; Geoland2: Immenstaad, Germany, 2012; Volume 218795. [Google Scholar]
- Baret, F.; Weiss, M.; Lacaze, R.; Camacho, F.; Makhmara, H.; Pacholcyzk, P.; Smets, B. GEOV1: LAI and FAPAR essential climate variables and FCOVER global time series capitalizing over existing products. Part1: Principles of development and production. Remote Sens. Environ. 2013, 137, 299–309. [Google Scholar] [CrossRef]
- Martínez, B.; Camacho, F.; Verger, A.; García-Haro, F.J.; Gilabert, M. Intercomparison and quality assessment of MERIS, MODIS and SEVIRI FAPAR products over the Iberian Peninsula. Int. J. Appl. Earth Obs. Geoinf. 2013, 21, 463–476. [Google Scholar] [CrossRef]
- Ryu, Y.; Baldocchi, D.D.; Kobayashi, H.; Ingen, C.V.; Roupsard, O. Integration of MODIS land and atmosphere products with a coupled-process model to estimate gross primary productivity and evapotranspiration from 1 km to global scales. Glob. Biogeochem. Cycles 2011, 25, 25. [Google Scholar] [CrossRef]
- Majasalmi, T.; Stenberg, P.; Rautiainen, M. Comparison of ground and satellite-based methods for estimating stand-level fPAR in a boreal forest. Agric. For. Meteorol. 2017, 232, 422–432. [Google Scholar] [CrossRef]
- Majasalmi, T.; Rautiainen, M.; Stenberg, P. Modeled and measured fPAR in a boreal forest: Validation and application of a new model. Agric. For. Meteorol. 2014, 189, 118–124. [Google Scholar] [CrossRef]
- Xie, D.; Wang, Y.; Wang, P.; Yan, G.; Song, J. Analyzing the characteristics of FPAR from maize canopies measured in Northwest China. In Proceedings of the 2013 IEEE International Geoscience and Remote Sensing Symposium-IGARSS, Melbourne, VIC, Australia, 21–26 July 2013; pp. 2802–2805. [Google Scholar]
- Liu, R.; Liang, S.; He, H.; Liu, J.; Zheng, T. Mapping incident photosynthetically active radiation from MODIS data over China. Remote Sens. Environ. 2008, 112, 998–1009. [Google Scholar]
- Jacquemoud, S.; Verhoef, W.; Baret, F.; Bacour, C.; Zarco-Tejada, P.J.; Asner, G.P.; François, C.; Ustin, S.L. PROSPECT+SAIL models: A review of use for vegetation characterization. Remote Sens. Environ. 2009, 113, S56–S66. [Google Scholar] [CrossRef]
- Jacquemoud, S.; Baret, F. PROSPECT: A model of leaf optical properties spectra. Remote Sens. Environ. 1990, 34, 75–91. [Google Scholar] [CrossRef]
- Verhoef, W. Light scattering by leaf layers with application to canopy reflectance modeling: The SAIL model. Remote Sens. Environ. 1984, 16, 125–141. [Google Scholar] [CrossRef]
- Feret, J.-B.; François, C.; Asner, G.P.; Gitelson, A.A.; Martin, R.E.; Bidel, L.P.; Ustin, S.L.; Le Maire, G.; Jacquemoud, S. Prospect-4 and 5: Advances in the leaf optical properties model separating photosynthetic pigments. Remote Sens. Environ. 2008, 112, 3030–3043. [Google Scholar] [CrossRef]
- Liu, L.; Song, B.; Su, Z.; Liu, X. A novel principal component analysis method for the reconstruction of leaf reflectance spectra and retrieval of leaf biochemical contents. Remote Sens. 2017, 9, 1113. [Google Scholar] [CrossRef]
- Bacour, C.; Jacquemoud, S.; Tourbier, Y.; Dechambre, M.; Frangi, J.P. Design and analysis of numerical experiments to compare four canopy reflectance models. Remote Sens. Environ. 2002, 79, 72–83. [Google Scholar] [CrossRef]
- Liu, L.; Wang, J.H.; Huang, W.J.; Zhao, C.J.; Zhang, B.; Tong, Q.X. Estimating winter wheat plant water content using red edge parameters. Int. J. Remote Sens. 2004, 25, 3331–3342. [Google Scholar] [CrossRef]
- Vermote, E.F.; Tanré, D.; Deuze, J.L.; Herman, M.; Morcette, J.-J. Second simulation of the satellite signal in the solar spectrum, 6S: An overview. IEEE Trans. Geosci. Remote Sens. 1997, 35, 675–686. [Google Scholar] [CrossRef]
- Zhao, L.; Liu, Z.; Xu, S.; He, X.; Ni, Z.; Zhao, H.; Ren, S. Retrieving the diurnal FPAR of a maize canopy from the jointing stage to the tasseling stage with vegetation indices under different water stresses and light conditions. Sensors 2018, 18, 3965. [Google Scholar] [CrossRef]
- Chen, J.M. Canopy architecture and remote sensing of the fraction of photosynthetically active radiation absorbed by boreal conifer forests. IEEE Trans. Geosci. Remote Sens. 1996, 34, 1353–1368. [Google Scholar] [CrossRef]
- Liu, L.; Peng, D.; Hu, Y.; Jiao, Q. A novel in situ FPAR measurement method for low canopy vegetation based on a digital camera and reference panel. Remote Sens. 2013, 5, 274–281. [Google Scholar] [CrossRef]
- Frankenberg, C.; Fisher, J.B.; Worden, J.; Badgley, G.; Saatchi, S.S.; Lee, J.E.; Toon, G.C.; Butz, A.; Jung, M.; Kuze, A. New global observations of the terrestrial carbon cycle from GOSAT: Patterns of plant fluorescence with gross primary productivity. Geophys. Res. Lett. 2011, 38. [Google Scholar] [CrossRef]
- Zhang, Y.; Xiao, X.; Zhang, Y.; Wolf, S.; Zhou, S.; Joiner, J.; Guanter, L.; Verma, M.; Sun, Y.; Yang, X. On the relationship between sub-daily instantaneous and daily total gross primary production: Implications for interpreting satellite-based SIF retrievals. Remote Sens. Environ. 2018, 205, 276–289. [Google Scholar] [CrossRef]
- Köhler, P.; Guanter, L.; Kobayashi, H.; Walther, S.; Yang, W. Assessing the potential of sun-induced fluorescence and the canopy scattering coefficient to track large-scale vegetation dynamics in Amazon forests. Remote Sens. Environ. 2018, 204, 769–785. [Google Scholar] [CrossRef]
- Hu, J.; Liu, L.; Guo, J.; Du, S.; Liu, X. Upscaling solar-induced chlorophyll fluorescence from an instantaneous to daily scale gives an improved estimation of the gross primary productivity. Remote Sens. 2018, 10, 1663. [Google Scholar] [CrossRef]
- Goward, S.N.; Huemmrich, K.F. Vegetation canopy PAR absorptance and the normalized difference vegetation index: An assessment using the SAIL model. Remote Sens. Environ. 1992, 39, 119–140. [Google Scholar] [CrossRef]
- Li, W. Estimation of direct, diffuse, and total FPARs from Landsat surface reflectance data and ground- based estimates over six FLUXNET sites. J. Geophys. Res. Biogeosci. 2015, 120, 96–112. [Google Scholar] [CrossRef]


© 2020 by the authors. Licensee MDPI, Basel, Switzerland. This article is an open access article distributed under the terms and conditions of the Creative Commons Attribution (CC BY) license (http://creativecommons.org/licenses/by/4.0/).