Abstract
This study estimates the photovoltaic (PV) energy production from the rooftop solar plant of the National Institute of Technology Karnataka (NITK) and the impact of clouds and aerosols on the PV energy production based on earth observation (EO)-related techniques and solar resource modeling. The post-processed satellite remote sensing observations from the INSAT-3D have been used in combination with Copernicus Atmosphere Monitoring Service (CAMS) 1-day forecasts to perform the Indian Solar Irradiance Operational System (INSIOS) simulations. NITK experiences cloudy conditions for a major part of the year that attenuates the solar irradiance available for PV energy production and the aerosols cause performance issues in the PV installations and maintenance. The proposed methodology employs cloud optical thickness (COT) and aerosol optical depth (AOD) to perform the INSIOS simulations and quantify the impact of clouds and aerosols on solar energy potential, quarter-hourly monitoring, forecasting energy production and financial analysis. The irradiance forecast accuracy was evaluated for 15 min, monthly, and seasonal time horizons, and the correlation was found to be 0.82 with most of the percentage difference within 25% for clear-sky conditions. For cloudy conditions, 27% of cases were found to be within ±50% difference of the percentage difference between the INSIOS and silicon irradiance sensor (SIS) irradiance and it was 60% for clear-sky conditions. The proposed methodology is operationally ready and is able to support the rooftop PV energy production management by providing solar irradiance simulations and realistic energy production estimations.
1. Introduction
There has been an intense promotion of sustainable energy by governments and international organizations focusing on the reduction in the growing emission of carbon dioxide from fossil fuel burning []. In this direction, power generation from the renewable sector has increased from about 80 TWh in 2000 to over 200 TWh in 2015 []. Since in India blackouts and load-shedding is very common due to inadequate transmission and distribution capacity, renewable energy is a crucial source to minimize the influence of such events. Due to the load shedding schedules of certain cities and states, people are using renewables for their households to secure the supply of electricity during these hours. The manufacturing sector also uses renewable units to ensure a continuous supply of power. The report of the Green Energy Corridor found that smart grid technologies like forecasting methods are required, while the establishment of renewable energy management centers are required to support the integration of renewables into the electricity grid [].
The population of India is increasing at a rapid rate and India will be the world’s most populous country by 2030 [] with 1.5 billion people compared to the current population of 1.3 billion []. The urban population will increase from 415 to 610 million which is an increase from 32% to 40% of the population. This will require an establishment of about 200 new cities of around 100 million people. This will lead to a steep increase in the power requirements of the country which needs to be fulfilled with a combination of conventional energy sources and renewables. This will require an increase in today’s non-fossil fuel capacity of 84.5 GW, which comprises 42 GW of large hydro, 37 GW of renewable energy, and 5.5 GW of nuclear, to 320 GW in 2030. The increases in the total electricity capacity of India from now till 2030 will be around three times which will require a quadruple increase in the non-fossil fuel capacity in order to reach the target of a 40% share of the total energy production [].
Late industrialization along with economic and political hurdles have made it difficult for India to accelerate the production of solar panels and cells []. Given these circumstances, the National Solar Mission (NSM) of India has increased the installed solar energy capacity in India and has provided attractive tariffs. However, domestic manufacturing still lags behind. The Jawaharlal Nehru National Solar Mission (JNNSM) has targeted the deployment of 100 gigawatts (GW) of grid-connected solar power which includes 40 GW of grid-connected rooftop solar installations [] by 2022 along with a reduction in tariffs and with a hope of reaching grid parity, but lagged in the manufacturing of solar cells and panels. However, followed by the JNSSM, the solar energy sector emerged as a fast-growing sector attributed to the 5000 trillion kWh of solar energy received by India per year which is above the global annual average []. There are estimates that solar energy in India has the potential to meet up to 94% of the country’s additional electricity needed by 2031–2032 []. Moreover, the expansion of renewable energy generation will increase energy security in India.
“Development of Solar Cities” is a program initiated by Ministry of New and Renewable Energy (MNRE) for 60 identified cities to become ‘Renewable Energy Cities’ or ‘Solar Cities’ with an aim to meet at least 10% of their projected energy demand through renewable energy sources and energy efficiency measures at the end of five years [,]. One of the main pillars of the Smart Cities is ‘Smart Energy’ in which the contribution of solar energy is significant for reducing conventional energy dependency. Some smart cities have proposed to meet the energy requirements of 15–20% from renewable sources []. To meet this energy demand, it is important to know the availability of the solar energy resource over these cities which can be obtained from proper solar resource monitoring and forecasting. In [], authors have computed the monthly and annual solar insolation for these smart cities. They have also estimated the grid-connected rooftop PV to be 10.02 GW with 103.51 TWh of energy potential per year for 98 Smart Cities of India. This will support the country in attaining the goal of 40 GW of grid-connected solar rooftop installations by 2022. Such a study provides support to the urban local bodies and policy-makers in accomplishing the vision of “smart energy.”
Among the solar energy technologies, photovoltaic system installation has seen tremendous growth providing carbon-free and renewable electricity [,]. Power generation from PV plants is dependent on many factors one of which is solar irradiance []. This enhances the need for analyzing and predicting solar irradiance to support the PV operators to effectively manage the available energy. In PV technology, the solar energy incident on the solar panels is converted directly into electricity and the PV systems can be integrated on the roofs and facades of the building []. PV panels are installed on tilted planes in order to increase the performance and reduce maintenance by avoiding the accumulation of dust and water. Moreover, for rooftop PV plants, the PV panels are installed with some tilt angle and a specific orientation to fit in the area available on the buildings or surrounding environments. The optimal tilt angle for improving the PV generation efficiency depends on climatic conditions of the location, period of use, and the geographical latitude [,]. Hence, the optimum tilt angle of the collectors is kept equal to the geographic latitude and in the Northern Hemisphere, the azimuth is kept due south throughout the year []. Due to the high cost of installation of SIS at various tilt angles, solar irradiance is measured on horizontal surfaces. Since the solar radiation incident on the PV panels is affected by the orientation and the installation angle of the panels [,,], there is a necessity to obtain solar irradiance on a tilted surface. In urban areas, the solar energy incident on the rooftop of a building is also affected by the shadows from the orientation of the roof, adjacent structures, urban canopy causing sky obstruction, and reflections produced by multiple non-lambertian surfaces []. There are several factors that significantly affect the performance of PV panels by causing shadow effects, some of which are the orientation of the surface, surrounding obstacles, and land-surface gradient [,]. During the summer season, solar rays strike the ground more directly in the Northern Hemisphere due to the fact that the Northern Hemisphere is oriented more towards the sun while in the winter season, the Northern Hemisphere is oriented away from the sun []. Hence, in order to obtain the strongest intensity of sunlight, a southern exposure is generally optimal for the installation of the solar PV in the Northern Hemisphere [,]. Grid-connected rooftop solar installations are the rooftop installations of industrial, commercial, institutional, and residential buildings whose electricity generation is used to feed the power grid at regulated feed-in tariffs. In standalone installations, the generated electricity is used for self-consumption of the building.
In urban areas, solar energy supplies are mostly dominated by rooftop technologies having photovoltaic installations that use the solar energy incident on its surface to produce electricity and solar domestic water heating systems to generate thermal energy []. In early applications of remote sensing technologies in radiation models, data from geostationary satellites were used to measure the radiation reflected from the ground and the atmosphere for the estimation of incoming radiation. HELIOSAT is a method which is based on the correlation of the information about the cloud cover as derived from satellite data and the ground-based irradiance data []. Methods such as HELIOSAT is an extensively tested model and is widely used in the estimation of irradiance using remote sensing technologies at a broad spatial resolution [,]. For the estimation of the irradiance for individual buildings at the spatial scale, requires the sensors mounted to aerial and satellite platforms to populate the irradiance models. Tools such as orthophotographs along with automated feature techniques are used for the determination of the area of the roof that is suitable for installing photovoltaic technologies []. In recent applications, integrated methods are used to carry on the irradiance modeling in urban areas with the help of remote sensing products at various spatial scales such as the urban surface models, the terrain models, and the atmospheric transmission [].
A physical model to estimate the global irradiances as used in [] is well suited for geostationary satellite retrievals with many grid points. An eigenvector hybrid method based on look-up tables (LUTs) as described in [] was used by authors in [] in which they combined the multifunctional transport satellite (MTSAT) and the moderate resolution imaging spectro-radiometer (MODIS) data so as to obtain the solar radiation for northern China. MODIS is a key instrument aboard the Terra and Aqua satellites that keep a view of the entire surface of the Earth every 1 to 2 days, acquiring the data in 36 spectral bands []. In [], the authors developed the INSIOS model to run for Indian geographical and climatological state and optimized for the current Indian remote sensing capabilities (e.g., the Indian National Satellite System (INSAT-3D)) []. INSIOS is able to estimate solar radiation in near real-time and it is built on libRadtran-based LUTs that cover a broad range of atmospheric and cloud conditions. This includes the cloud and aerosol optical properties that can produce almost instantaneous output. In INSIOS, the multi-polynomial regression technique was used which was based on the outputs from libRadtran [,] along with the radiative transfer simulations using LUTs. The INSIOS system was developed for accomplishing multivariate studies of the interactions between the radiation, aerosols, and clouds in the atmosphere as well as to produce solar irradiance real-time maps using the real-time satellite inputs and aerosol forecasts.
This study deals with the application of a remote sensing and RTM-based model i.e., INSIOS in a rooftop PV plant of NITK and it accesses the accuracy and reliability of this model in India, which experiences extreme climatic events. The region of NITK experiences heavy and prolonged monsoon season and rains even in the winter season. Also, the aerosol content of the area is high. This gives us an opportunity to analyze the effect of the two extreme phenomena (clouds and aerosols) on solar radiation and PV power production.
The innovation of this study has to do with the solar energy management from space using earth observation data and technologies. The ability to perform energy management remotely forms the current smart grid operational use and exploitation. To this end, we replicated and upgraded the work performed in previous studies and technical reports (e.g., [,,]), as to be applied for roof-top PV installations. For the simulation procedure, we firstly estimated the surface solar radiation reaching the PV panels on the horizontal plane []. Then, we made the transformations as to simulate the radiation at the tilted plane and finally we performed the conversions to reproduce the real PV energy production []. As a result, based on the simulation outputs, we compared the simulations with the real radiation and PV energy production values. This ‘simulation to reality’ aspect was initially introduced by authors in [], and with this study, we took it one step further by simulating the shadow effects at the roof-top level for the atmospheric, topographic, and geographical conditions of India.
The INSAT-3D, rooftop PV, and solar sensor data used in this analysis are presented in Section 2.1, followed by methodology in Section 2.2 that includes solar irradiance simulation, energy production calculation, and the assumptions used for the calculations. The results are presented in Section 3 that includes the comparison of solar irradiance (INSIOS vs. silicon irradiance sensor), reliability of energy production estimations and cloud, and shadow effect on the produced energy. Section 4 deals with the discussion of the PV energy production management and the financial analysis (economic impact of cloud and aerosol uncertainity) and finally the conclusions are presented in Section 5.
2. Data and Methodology
2.1. Data
2.1.1. INSAT-3D
Varying, unstable, and extreme climatic conditions of Southern Asia, such as cloud covers and heavy rainfall during monsoon season, dust storms during summers, and heavy fog and smog during winters, provides an opportunity to explore the variation in solar radiation. An Indian meteorological satellite, INSAT-3D, is used to obtain the cloud microphysical parameters for the Indian region with a temporal resolution of 30 min and a spatial resolution of 4 km []. It monitors the Asian region from the latitude of −10.5°N to 45.5°N and longitude of 44.5°E to 104.5°E []. Unlike Meteosat satellites which are dedicated for meterological purposes alone, INSAT satellites by India are multipurpose satellites which serve other purposes also in addition to meteorology. INSAT-3D provides high resolution and continuous near-global data both at the same time in context with the Indian region. This is required to study various processes associated with cloud microphysics and is advantageous as it offers a high spatial resolution of 1 km in the visible and short-wave infrared (SWIR) bands. INSAT-3D provide cloud microphysical properties (CMP) at a half-hourly temporal resolution that consists of cloud optical thickness and cloud effective radius information. COT is a post-processed data obtained from the INSAT-3D visible band data by LUT approach through the development of a forward model as described in []. INSAT-3D CMP data were obtained in the hierarchical data format [,] for NITK from which COT data were extracted for each time step. The INSAT-3D COT data is found to vary from 8.44 to 57.71 for the NITK region over a year.
Copernicus Atmosphere Monitoring Service (CAMS) Monitoring Atmospheric Composition and Climate (MACC) provides near real-time daily global forecasts of aerosol optical depth at 550 nm up to 5 days [,]. The spatial resolution of the AOD data from MACC near real-time analysis is 0.4° and the temporal resolution is 1 h. It provides forecasted AOD data with intialization time of 0 UTC and 12 UTC which include AOD, organic carbon, dust, sulfates, black carbon, and sea salt. In this work, the available data were interpolated to obtain such values for the study region at a temporal resolution of 15 min, as done in []. CAMS MACC 1-day forecast of total aerosol optical depth at 550 nm is extracted for NITK initialized at 0 UTC (Coordinated Universal Time) and 3 h time step varying from 0 to 12 UTC. There is uncertainty in CAMS AOD forecast that varies from 0.1 to 0.2 for mean bias when compared to Aeronet ground data []. The AOD at 550 nm was found to vary from 0.037 to 1.380 for NITK region over a year.
2.1.2. Rooftop PV
In tropical regions like India, flat-type modules are most widely used for fixed PV systems than tracking PV systems due to low humidity and a high amount of beam radiation [,]. Tracking is better under all conditions but it is not economically efficient []. So, the solution of flat-type modules is the simplest way to exploit solar power, especially at a roof-top level and at regions with high solar energy potential. The rooftop PV plant of NITK is spread over an area of 914 m2 and installed at a tilt angle of 10° and an azimuth angle of 0° due south. The module material is silicon polycrystalline with a power rating of 310 Wp manufactured by Vikram Solar Eldora. It has a DC nominal power of 148 kWp and an AC nominal power of 120 kW. The PV energy output data of NITK is available in kWh with a temporal resolution of 15 min. The installation of the rooftop PV plant was made in such a way that it provides significant energy output and is cost-effective and reliable. The deficit in the supply from solar PV and the demand is fulfilled by Mangalore Electricity Supply Company Limited (MESCOM) energy supply which contributes to around 70-90% of the total energy consumption.
2.1.3. Solar Sensor
The Si-13TC-T silicon irradiance sensor (SIS) was used to measure the solar radiation as the short-circuit current is proportional to the irradiance. These sensors are made of a monocrystalline Si solar cell and are reliable, robust, and economical. The sensor elements are designed so as to suit as an ideal reference for monitoring the photovoltaic systems []. The extension “TC” in the sensor element represents an active temperature compensation with the help of a temperature sensor that is laminated to the back surface of the solar cell in order to minimize the influences of temperature to the measuring signal. The SIS is a cost-effective, but rugged and reliable solution for the measurement of solar irradiance, especially for the monitoring of Photovoltaic systems. Their spectral response which is comparable to PV modules as well as the inclination error allows an exact analysis of PV energy yields using SIS data. All these sensors are calibrated in artificial sunlight against a reference cell calibrated at the Physikalisch-Technische Bundesanstalt (PTB, National Metrology Institute of Germany).
The installed SIS is of the same tilt as the PV panels to represent the incoming solar irradiance that the plant realistically receives. Hence, an angular correction is needed for the silicon irradiance sensors which are incorporated in all the readings taken under consideration as shown in Table 1. The SIS angular correction calculations were performed to reform the tilted global irradiance of the sensor to the horizontal plane so as to make them directly comparable with the INSIOS simulations. The INSIOS tilt corrections are used to convert the horizontal INSIOS (GHI) to tilted plane irradiance as to be directly comparable with the SIS and the PV energy production conditions. The tilt angle of the rooftop PV panel used in this analysis is 10°. The correction factor for converting the titled SIS radiation to horizontal irradiance for a surface with 10° tilt angle is calculated using
where R is the tilt factor, is the incidence angle and is the solar zenith angle which is described in Section 2.2.2. The diffuse component of the solar radiation on a horizontal surface is calculated as []
where DHI is the diffuse horizontal irradiance and DNI is the direct normal irradiance. The modeling of the diffuse radiation received on a tilted surface is difficult as the spatial distribution is not known and is time-dependent. However, there are certain models that estimate solar radiation on inclined surfaces []. The isotropic model proposed by Badescu [] is used in this analysis for obtaining the diffused radiation on a tilted surface as
where is the diffuse component of the solar radiation on a tilted surface inclined to the horizontal surface at an angle and is the diffuse solar irradiance on the horizontal surface.

Table 1.
SIS and INSIOS corrections based on the solar zenith angle and time of day. SIS: silicon irradiance sensor, INSIOS: Indian Solar Irradiance Operational System.
Figure 1 shows the location of National Institute of Technology Karnataka on the map of India with the rooftop image of PV panels and the surroundings. NITK is located at a latitude of 13.0 N and a longitude of 74.8 E and an altitude of 24 m. The south Indian state of Karnataka leads Indian states in new rooftop PV attractiveness index [].
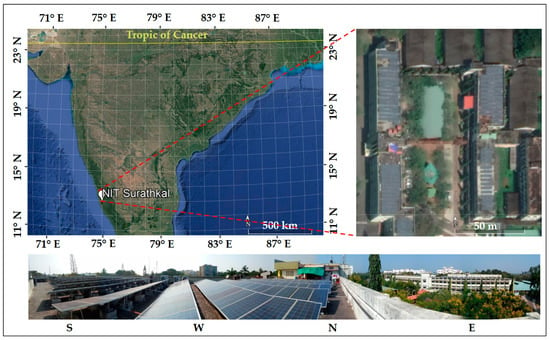
Figure 1.
Map of National Institute of Technology Karnataka with rooftop image.
2.2. Methodology
2.2.1. Solar Irradiance Simulation (INSIOS)
The INSIOS technique has been developed for fast and near real-time estimations of solar irradiance to be applied to the Indian climatological conditions and is a useful tool for solar energy production management for the Indian region. It also has the potential to be included for on-the-fly solar radiation calculations in the operating and retrieving algorithms of INSAT-3D. The output of the Solar Energy Nowcasting SystEm (SENSE) [] and radiative transfer modeling (RTM) was used for the training of the analytical function of INSIOS. The INSIOS GHI and DNI are obtained using the multi-polynomial regression function as shown in []. The INSIOS estimations are applied on the rooftop PV plant to study the energy production management in India. Polynomial functions were used for clear-sky (CS) and cloudy (CD) conditions according to the work presented in [] as
where is the sza and is COT or AOD depending on cloudy or clear-sky conditions, respectively. The coefficients of Equation (4) are obtained from []. For CS conditions, solar radiation was expressed as a function of aerosol optical depth and solar zenith angle. While for CD conditions, solar radiation was taken as a function of cloud optical thickness and solar zenith angle. This method can be used, with lesser computational time, to obtain the RTM simulations of solar radiation, and hence, it can be used for near real-time applications. Cloud optical thickness data required for CD solar radiation estimation were obtained from INSAT-3D and the aerosol optical depth needed for CS solar radiation estimation was obtained from CAMS 1-day AOD forecasts.
Figure 2 shows the flowchart of the usefulness of INSIOS on energy production management and it’s direct socio-economic impact. The atmospheric parameters like clouds and aerosols are obtained from satellite images and forecasts, respectively. The information about clouds is monitored through the satellite data on cloud optical thickness obtained from the INSAT-3D satellite. The aerosol information is obtained from the CAMS MACC 1-day forecast. These parameters are then fed to the INSIOS system to simulate the solar radiation available in a region for a particular day and time. The forecasted solar radiation is then used for rooftop PV simulations to get energy produced from the PV panels. This is followed by solar power management and financial analysis for the use of solar produced power in smart cities.

Figure 2.
A flowchart for the usefulness of INSIOS on energy production management with direct socio-economic impact. INSIOS: Indian Solar Irradiance Operational System.
2.2.2. Energy Production Calculation
The amount of electrical energy produced from a PV system depends on many external factors [] among which the foremost one is the solar radiation incident on the surface of the PV panels which in turn depends on local atmospheric conditions along with the installation of the PV modules like inclination angle, fixed or tracking, etc. []. Solar radiation reaching the surface of the Earth consists of three components beam, diffuse, and reflected radiations. Beam radiation is the solar radiation that is neither reflected nor scattered and directly reaches the surface []. Diffuse radiation is the radiation scattered into the atmosphere and then reaches the ground []. The reflected radiation is a small part of the radiation which is reflected on the inclined receiver from the ground. All these components of the solar radiation combined are known as global radiation.
The geometric relationship between the incoming radiation and the plane of a particular orientation relative to the surface of Earth at a time can be described in terms of certain angles as shown in Figure 3 in which the tilt angle of the PV panel and the incidence angle of the solar ray is explained. The azimuth angle () is defined as the angular displacement of the beam radiation projected on the horizontal plane from the south. Solar zenith angle is defined as
where is the latitude of the considered region, is the declination angle and is the hour angle. The latitude of the considered region (in this case NITK) is the position of the area north or south relative to the Equator (positive for the Northern Hemisphere and negative for the Southern Hemisphere) which varies from 0 to 90 being 0 at the Equator and 90 at the poles. Declination Angle () as shown in Equation (5) is defined as the angular distance from the sun north or south to the equator of the Earth which is calculated as
where is the day of the year. On 21st December, the northern hemisphere is inclined 23.45 far away from the sun some time which is the winter solstice for the northern hemisphere. Similarly, during summer solstice the southern hemisphere is positioned in a way that it is 23.45 away from the sun on 21st June. Moreover, during the autumn and the spring equinoxes on 21st March and 21st September respectively, the sun is directly over the equator [].

Figure 3.
Azimuth angle, solar zenith angle, and geometry of the tilted surface.
Hour Angle () is the angular distance between the meridian of the observer and the meridian of the sun’s plane. It is used to describe the rotation of the earth around its polar axis which is described in terms of the angle as 15 for an hour before noon and 15 per hour afternoon. Hour angle is zero at the noon [] and can be obtained as
where ST is true solar time and is calculated as
where LT is the local standard time which in this study is Indian Standard Time (IST) related to Universal Time (UTC) as
In Equation (8), LS is the standard meridian for a local zone which is equal to 82.5 E for India, LL is the longitude of the location under study in degrees which in this analysis is 74.8 E as shown in Figure 1. ET used in Equation (8) is the equation of time given as
where
where n is the day in year (same as that used in Equation (6)).
The solar azimuth angle () is the angular displacement of the projection of beam radiation on the horizontal plane from south and is calculated as
Here, if ω is positive, then the value of function is 1 and if ω is negative, then function is 1.
2.2.3. Assumptions
PV calculations have been done by assuming a realistic efficiency of 16% based on the PV material which is silicon polycrystalline in this analysis and a shadowing effect of 4% from the surrounding has been considered. An efficiency of 80% has been considered in the conversion of the simulated irradiance into PV output energy based on nominal power and the electricity converter technology and AC/DC efficiency. For the financial analysis of the PV energy generation, there is a requirement of the price of electricity generation in USD per kWh. The PV output energy is converted into the price of electricity as
The price of electricity used in Equation (13) is taken as 0.081 USD/kWh for India []. Financial losses are calculated as
where FL is the financial loss in USD, is the maximum energy produced in kWh considering the atmosphere to be clean and clear i.e., with AOD and COT being zero and is the actual energy produced by considering AOD for CS condition and COT for the CD condition. The price of electricity is in USD per kWh. Adequacy is calculated in terms of the total energy consumption as the difference between the total energy produced/consumed and the energy produced from renewable (or solar in this analysis). Adequacy percentage is the ratio of the energy consumed from renewable to the total energy consumed/produced.
All proposed transformations, simulations, and calculations presented in the previous Section 2.1.3, Section 2.2.1 and Section 2.2.2 are followed by the corresponding uncertainties. For example, the INSIOS simulations and uncertainties against ground-based measurements were presented in []. The uncertainties from the transformation of the simulated irradiance into real PV production were presented by []. As a result, the reliability of energy production estimations depends on how realistic are the calculations, simulations, and transformations. On the other hand, there are also other factors that may reduce the estimation’s reliability, which are independent of the simulations, and have to do with the PV panels maintenance and cleaning or other reasons (e.g., solar blocking and shadows). All these factors affect the reliability, but nevertheless, the whole approach is able to provide the critical information of roof-top PV energy production using remote sensing techniques forming a new market (i.e., energy management from space). In coming years, this method has to be tested to additional roof-top PV installations at different regions and conditions (e.g., city scale will high building, multiple PV material technologies (e.g., CdTe, Monocrystalline silicon etc.)) for more generalized energy production estimations.
3. Result
3.1. Comparison of Solar Irradiance (INSIOS vs. SIS)
In this section, a comparison has been made between the solar irradiances obtained from the INSIOS simulations and the SIS measurements. Figure 4 shows the correlation of the INSIOS simulated irradiance and the irradiance measured from the silicon irradiance sensor. The temporal resolution of the irradiance in this analysis is 15 min. The coefficient of correlation is found to be 0.82 with a median difference of 39.40 W/m2. The dot plot with error bars is constructed by taking the average of the INSIOS irradiance for every 100 W/m2 averaged SIS irradiance and the error is calculated as the difference between the INSIOS and the SIS irradiances. It is observed that maximum cases have overestimations from INSIOS as compared to the SIS data while some cases have underestimations too. The error is seen to increase from 5 W/m2 to 173 W/m2 for the SIS irradiance varying from 100 to 500 W/m2, respectively and then decreases to 11 W/m2 for 900 W/m2 SIS irradiance with a sudden increase of 58 W/m2 at 1000 W/m2 of the SIS irradiance.
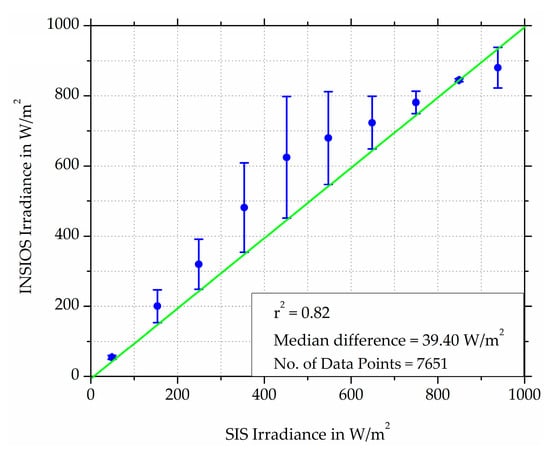
Figure 4.
Totally clear sky scatter plot of INSIOS irradiance as compared to SIS measurements.
The irradiance received at the Earth’s surface under a cloud-free atmosphere is keen to the production of aerosol from dust storms, biomass burning, and atmospheric particulate matter []. When the atmosphere is clear i.e., free of clouds, the aerosols present in the atmosphere play a major role in the transfer of solar radiation. The uncertainties in the determination of atmospheric aerosols affect the estimation of solar radiation. In [,,], the authors showed that there was underestimation from CAMS AOD predictions under high aerosol loads. There is a problem with MACC in emulating the spatial and temporal complexity of the aerosol mixture. This posses a difficulty in capturing the exact effect of the atmospheric parameters on the solar irradiance over a specific location and at a particular time. In [], the authors showed that after 2009, there was a rapid dimming in the surface solar radiation measurements. The decrease in the solar radiation might be due to changes in the aerosol climatology, CS aerosol loading measurements, and instrumentation biases. The variation in the 1-day solar radiation bias was found to be from −100 to 200 W/m2. The air molecules, dust, and other suspended particulate matter present in the atmosphere also scatter the incoming solar radiation. The aerosols comprising small water droplets, smoke particles, dust and haze, scatter the solar radiation and the scattering depends on the actual atmospheric conditions. In some cases, aerosols can cause a reduction in solar radiation by up to 80% as shown in [,,,,].
Figure 5 shows the percentage difference of INSIOS GHI as compared to SIS irradiance for CS and CD conditions respectively. The percentages represent the number of cases out of the total number of data points for clear sky and cloudy sky conditions separately. It is seen from Figure 5 that there are 16%, 28%, 42%, and 60% cases within 5%, 10%, 20%, and 50% difference of INSIOS GHI as compared to SIS irradiance, respectively for CS. Similarly, for CD condition, it can be observed that the number of cases for 5%, 10%, 20% and 50% difference are 2%, 4%, 8%, and 27%, respectively. These differences for clear sky and cloudy conditions are related to the aerosol (MACC) uncertainties (mostly underestimates AOD) and the limited ability of the INSAT-3D resolution to identify smaller clouds ([,]). The prediction in the case of CD condition is poor as compared to the CS condition as the clouds tend to attenuate most of the incoming solar radiation while the effect of attenuation by aerosols is less as compared to clouds. The poor prediction in the presence of clouds is due to the fact that the clouds are not well represented by the INSAT-3D data. The errors in the CS condition are due to the uncertainties in the aerosol prediction of CAMS MACC data. The median values of the data are found to decrease as the SZA increases. It is also observed that there are overestimations from INSIOS under clear-sky conditions. The maximum values of irradiance were found to decrease from 1254 to 245 W/m2 in case of SIS irradiance and from 943 to 295 W/m2 in case of INSIOS irradiance as the solar zenith angle increases from 0 to 90 which is due to the fact that SZA is minimum at solar noon [] and hence as SZA increases the irradiance decreases. The minimum irradiance value is close to zero for SIS and decreases in the case of INSIOS. The median difference between the INSIOS and the SIS data varies as 187 W/m2, 256 W/m2, 244 W/m2, 245 W/m2, 94 W/m2, and 26 W/m2 for SZA between 015, 1530, 3045, 4560, 6075, and 7590, respectively. The percentage difference of the median difference increases as 27%, 44%, 49%, 54%, 59%, and 90% for SZA between 015, 1530, 3045, 4560, 6075, and 7590, respectively. This shows that as the SZA increases the prediction becomes poor.
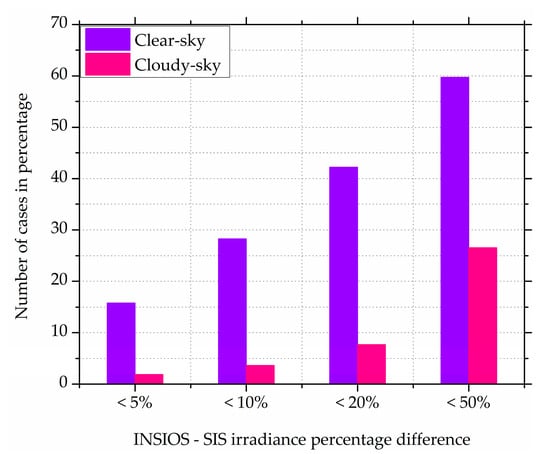
Figure 5.
Column plot of percentage difference of INSIOS vs. SIS irradiance for clear-sky and cloudy cases.
Figure 6 shows the scatterplot of the CS irradiance percentage difference between INSIOS simulations and SIS measurements. It was found that at lower solar zenith angles the percentage differences are close to 25% and vary from 25% to 120%. Mostly, there are underestimations from the INSIOS simulations as compared to the SIS measurements which are also observed from Figure 4. The main reason for these INSIOS underestimation has to do with the unobserved cloud presence, fog, and aerosol loads which are subsequent phenomena of the Indian monsoon []. This effect has to do with the INSAT-3D and MACC uncertainties and hence introduce errors into the INSIOS outputs. In addition, comparison principles of point irradiance measurements with a satellite-based image are responsible for part of the observed deviations. As a result, the SIS measurements could fluctuate more than 100% depending on whether the sun is in reality visible or whether unobserved clouds attenuate the direct component of the solar irradiance. An additional factor of underestimation for has to do with the angular response of the SIS. The angular response of such sensors could cause uncertainties of the measured solar irradiance, especially for SZA higher than 70 degrees [,,]. The angular error is common for instruments using flat diffusers. However, the measurements at such angles have a small contribution to the measurement of the total solar daily energy.
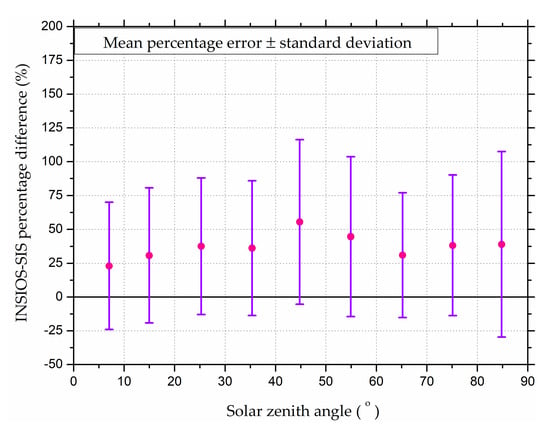
Figure 6.
Variation of vs. INSIOS-SIS irradiance percentage difference for clear-sky with solar zenith angle.
3.2. Reliability of Energy Production Estimations
There are certain factors that affect the performance of PV modules. These include conversion efficiency that depends on the temperature of the module, the level of irradiance, and changes in the efficiency of the PV module due to the variation in the spectrum of the sunlight (which in turn depends on sun height and meteorological conditions) []. Another factor is the tilt angle which is kept approximately equal to the latitude of the region and pointed directly at the sun in order to capture the maximum amount of solar radiation. Long-term exposure of the modules to the outdoor environmental conditions and shading of the modules with surroundings like trees or buildings can also reduce the output from the PV panels. Certain other factors affecting the PV energy production are component failures or maintenance leading to system downtime, cables, and interconnections losses and transformers, inverters, and other power electronics efficiencies [,].
Figure 7 shows the effect of clouds, aerosols, and shadow on the percentage difference between the RPV and the INSIOS energy generations. From Figure 7a, it can be seen that the percentage difference between RPV and INSIOS energy generations increases from 38% to 75% for COT between 19 and 40. It increases sharply from 52% to 75% for COT between 28 and 37. Hence, the accuracy of generation estimation from INSIOS decreases with an increase in COT. From Figure 7b, it can be seen that the percentage difference between RPV and INSIOS energy generations decreases sharply from 88% to 13% for the aerosol optical depth of around 0.09 to 0.22, respectively. The percentage difference is within 15% for AOD varying from 0.22 to 0.55. Figure 7c shows that the percentage difference between RPV and INSIOS energy generations fluctuates between 45% to 15% for the solar zenith angle varying from 71 to . It decreases sharply from 32% to 0% for SZA varying between 83 to 86 and becomes positive beyond 86 SZA and starts increasing to 48% for 89 SZA.
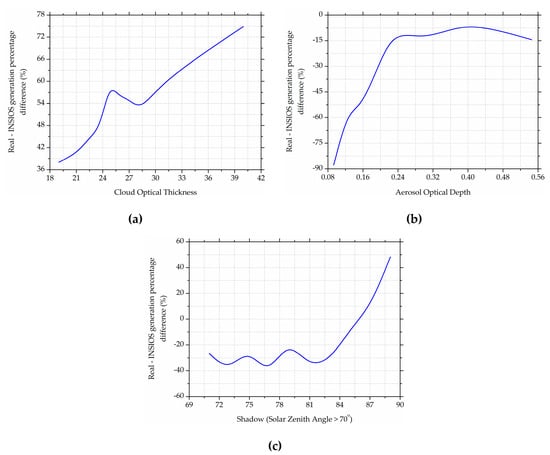
Figure 7.
Effect of (a) cloud, (b) aerosol and (c) shadow (SZA > 70°) on the percentage difference between rooftop photovoltaic and INSIOS generations.
Figure 8 shows the variation of the ratio of the energy generation from RPV and the INSIOS for a year. It is seen that there are underestimations during monsoon and summer months while there are mostly overestimations for the rest of the year. In this analysis, the criteria used for distinguishing the CS time-steps from the CD ones are very strict in the manner as it eradicates all the cloud-contaminated situations and rejects some events of heavy aerosol loadings. The severity of the cloud screening is the cost of ensuring that only the impact of the aerosols is considered for examining the so-called cloud-free cases or the CS cases. Also, the classification is done on the basis of INSAT-3D COT data whose unavailability makes the time-step to be classified as CS while it might be a CD time-step. Under CS conditions, the global irradiance is proportional to the reciprocal of the air mass at large solar zenith angles while more solar radiation is received from the side by the atmosphere column above. A cosine-corrected pixel appears to be brighter than expected because of the side-lit bright atmosphere column above the selected point which causes the scattering of the radiation back to the satellite []. This can be another inference for the overestimation of solar irradiance under CS conditions. Also, there are regional, intraseasonal, and interannual variations in the aerosol properties and uncertainties in indirect radiative effects of aerosols for the Indian subcontinent []. The reason for the underestimation of the energy generated during monsoon might occur because of an overestimation of INSAT-3D COT in which the cloud-free conditions might have been classified as cloudy. The reason for this might be the abnormally high albedo at certain sun positions. The errors impending on the GHI estimations are expected to be mainly the impact of errors in the inputs as the INSIOS is a physical-based model. This enhances the need for having higher quality inputs which will certainly improve the INSIOS estimations.
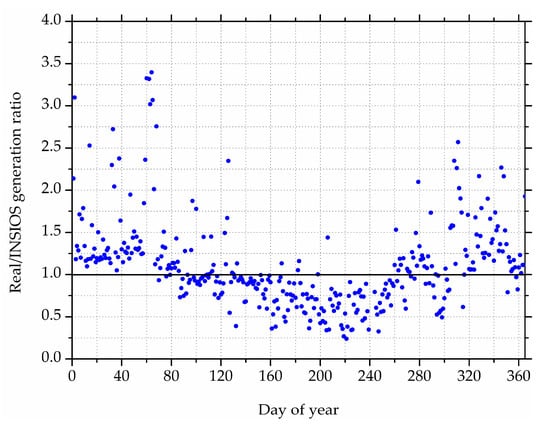
Figure 8.
Variation of the ratio between RPV and INSIOS energy generation over a year.
Figure 9 shows the contour plot of the annual variation of the percentage difference between the RPV energy production from the rooftop PV plant and the simulated energy production from INSIOS. For the RPV energy production, during sunrise and sunset, the values are found to vary from 0 to 5 kWh. For RPV energy production, the value increases as the sun rises high in the sky from 5 kWh and reaches the maximum production of around 30 kWh when the sun is directly overhead. The variation of the INSIOS energy simulations with time and day over a year shows similar behavior with greater variation during monsoon season. It is observed that the percentage difference is larger during monsoon and autumn season with overestimations reaching 100%. The percentage difference is moderate during winter and some part of summer with underestimations reaching 100%. The largest differences are near sunset and sunrise mainly because these percentages are at high solar zenith angles. This means that at such low solar elevation, small absolute differences could result in large percentage differences (e.g., 100% difference for 0.1 kWh real PV output and 0.2 kWh simulated output). In [], authors analyzed the performance of a grid-connected rooftop solar PV plant located in coastal regions of Andhra Pradesh. They performed the simulations using PVGIS, PV Watts, and PV Syst and found that the errors in the simulated monthly energy potential as compared to the actual data has reached up to 72%.
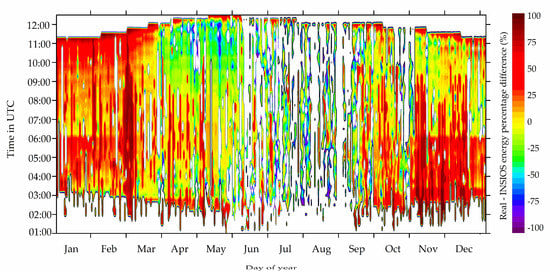
Figure 9.
Contour plot for Real-INSIOS generation percentage difference (%).
Figure 10 shows the seasonal and annual variation of the absolute difference between the simulated generation from INSIOS and the RPV generation. The median is around zero for summer and autumn, the values being 0.82 kWh and 0.97 kWh, respectively which shows a good estimate of PV energy generation from INSIOS. While the median for winter and monsoon are 3.52 kWh and 4.08 kWh, respectively. There is overprediction during summer and monsoon seasons and underprediction during winter and autumn seasons which is also observed from Figure 8. It is also observed in Figure 9 that the estimations of solar irradiance are poor for the monsoon season which is consistent with the variation of energy generation shown in Figure 8 and Figure 9. The deviation during monsoon and autumn is attributed to high cloud cover [].
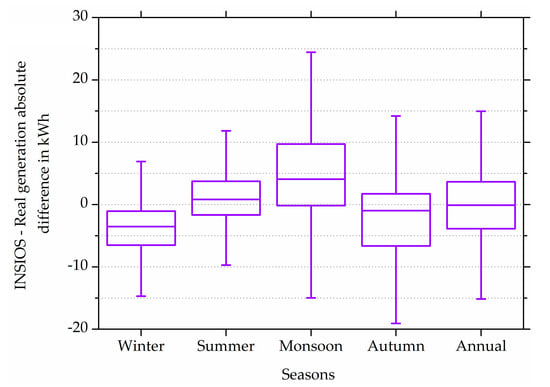
Figure 10.
Seasonal and annual box plot of the absolute difference between INSIOS and RPV generation in kWh.
Figure 11 shows the Taylor diagram of the INSIOS energy production for CS, all-sky and different seasons. The standard deviation and the root mean square deviation were normalized with respect to the mean values. It can be observed that the correlation coefficient varies as 0.70, 0.64, 0.57, 0.53, 0.52, and 0.49 for CS, winter, summer, monsoon, all-sky, and autumn, respectively. The correlation in the case of CS is not so good due to uncertainties in the forecasted AOD data obtained from CAMS MACC. Similarly, the correlation for all-sky is much poor due to uncertainties in the input parameters to the model which is INSAT-3D COT in this case. The value of standard deviations is maximum for summer and then decreases for autumn, monsoon, winter, CS, and all-sky cases from 0.8 to 0.3. The root mean square deviation is found to vary from 0.9 to 0.7 for autumn, monsoon, summer, all-sky, winter, and CS cases.
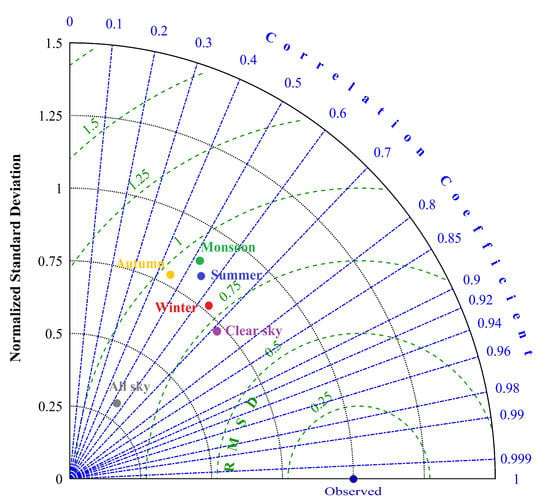
Figure 11.
Taylor diagram for INSIOS energy production.
3.3. Cloud and Shadow Effect
Figure 12 shows the variation of the difference between the simulated and the RPV energy production with monthly cloud time-steps. It is seen that the presence of clouds is fluctuating between 6% and 11% from December to April during which the absolute energy difference between RPV and simulated energy productions follow the same trend of fluctuation between 2250 to 4500 kWh when only CD time-steps are considered as observed from Figure 12a. During this period, there is overestimation from INSIOS simulations and the absolute energy difference between simulated and RPV energy productions first increase from around 3500 to 5500 kWh from December to March and then decreases to 0 kWh during April when all time-steps are taken into account as can be seen from Figure 12b. From May onwards, the cloud presence slowly increases from 6% to 13% with a steep increase during October and November. During this period, the energy difference for CD time-steps first decreases from 1500 kWh in May to a minimum of 370 kWh in August and then increases monotonically to 4900 kWh in November. The energy difference in all time-steps observes underestimations from INSIOS simulations from April to July with values increasing from 0 to 5250 kWh which starts decreasing beyond this to 0 kWh in October and then the nature of the estimations changes to overprediction which increases up to 5400 kWh in November. The overestimation is related to the monsoon period and the subsequent phenomena which are also shown in Figure 8 and Figure 10. From Figure 12a, it is observed that the error in the INSIOS energy estimation as compared to the real PV generation is following the presence of clouds. As the presence of clouds intensifies, the capability to monitor cloud properties through remote sensing technologies decreases which in turn decreases the accuracy of the model and hence increases the error in PV energy production estimation as compared to the real PV generation.
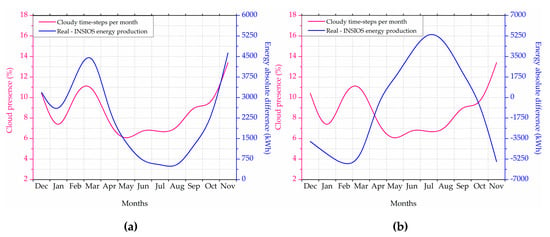
Figure 12.
Effect of monthly cloud time-steps on the absolute difference between simulated and RPV energy production for (a) CD-sky and (b) all-sky.
There is high uncertainty in the atmospheric inputs available in Southern Asia (CAMS AOD and INSAT-3D COT) []. The correlation between the INSIOS GHI and the SIS irradiance was not so good as compared to the bibliography as we are dealing with the extreme conditions of monsoon [,,]. The relevant studies that have better results were located mainly in Europe, where the climate is much more stable with no extreme atmospheric phenomena [,,,,]. Solar radiation is mostly attenuated by the clouds present in the atmosphere. The variation in the solar radiation reaching the Earth’s surface depends on the area covered by the clouds, their thickness, the content of water droplets, and the reflected irradiance from the cloud surface also depends on the type and texture of the cloud. There is high uncertainty in the solar radiation simulation in the presence of clouds and small fluctuations in the cloud optical properties and cloudiness [].
Figure 13 shows the annual variation of the absolute energy losses of the roof-top PV in terms of azimuthal shadows from the surrounding environment. The shadow effect on PV energy production was simulated by using an anisotropic sky model [] in conjunction with the shadow mapping and the calculation of the sky view factor as described in []. The necessary digital terrain and surface modeling data were retrieved by Google Earth. For the NITK roof-top PV, the shading is caused mainly by a nearby building and trees which are present in the south direction of the panels (i.e., 120–180 azimuth degrees). From the calculations performed, an analytical diagram of the position of the sun (elevation and azimuth) was created. The superimposition of this information by the shape of the azimuthal shading profile, determines when the path of the sun to the panels is blocked, and hence, provides the shadow effect. From the aforementioned simulations we found that the shadow effect applies to SZA greater than 70°. We also note that both AOD and COT effects were considered equal to zero for these simulations to represent only the shadow effect. It is observed that the absolute azimuthal shadow effect remains within 200 kWh for azimuth varying from 0 to 90° and 210 to 360°. It is around 500 kWh for 120° and 180° azimuth angles and is maximum at 150° reaching almost 1800 kWh. The total effect of shadows is found to be 1.83% of the total energy production. At south, southeast direction there is the highest blocking because of a building, at a particular time at NITK, and are fixed and hence the SZA and the solar azimuth angles were calculated as shown in Equations (4) and (11), respectively. The lines of constant declination labeled as winter, summer, monsoon, and autumn are shown in Figure 13. The curves for different seasons are calculated using the median day of each season and they represent the declination angle of that particular day. These curves are constant for a particular latitude and day. Similar curve was shown in [] for a latitude of 15°.
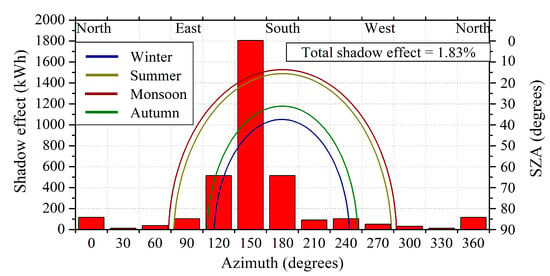
Figure 13.
Annual percentage energy losses in terms of azimuthal shadows.
4. Discussions
4.1. PV Energy Production Management
Figure 14 shows the monthly energy adequacy for RPV data and simulated data in which adequacy is calculated as shown in Section 2.2.3. The monthly energy consumption varies from 430,000 to 640,000 kWh over a year. Renewable energy adequacy is calculated as the difference between the total energy produced and the energy produced from solar which is found to vary from 35,000 to 50,000 kWh over a year with a dip during monsoon months. The percentage error from PV simulated production as compared to the RPV measurements varies from −30% to 50% over a year. It can be seen from Figure 14 that there are underestimations from INSIOS simulations from December to April and in October and November while there are overestimations between May and September. The monthly energy consumption increases from 52,000 kWh in December to 67,000 kWh in April and then decreases to a minimum of 44,000 kWh in June with a further increase to 64,000 kWh in November. The renewable energy adequacy increases from 41,000 kWh in December to 53,000 kWh in April and decreases from 38,000 kWh in May to a minimum of 35,000 kWh in June with a further increase to 53,000 kWh in November. The PV energy adequacy is found to be 19.7% which is calculated as the average of the monthly PV energy adequacy. The underestimation percentage difference in energy production increases from 22% in December to 26% in March becoming zero in April while it is 1% in October and 28% in November. The overestimation percentage difference increases from 8% in May to a peak of 57% in August becoming zero during October.
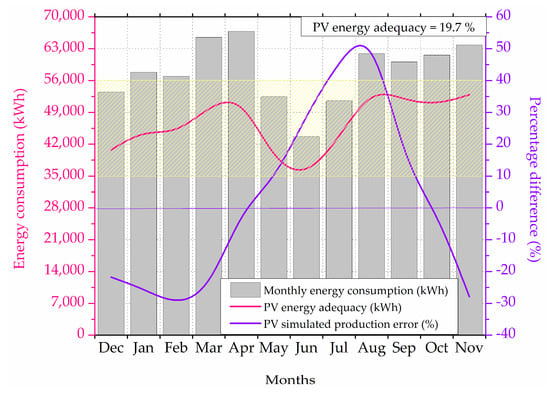
Figure 14.
Monthly energy adequacy for RPV data and simulated irradiance.
Figure 15 shows the monthly energy consumption from MESCOM and solar PV and their share in the total energy consumption. It can be seen that the contribution from MESCOM varies between 70–90% while that from solar PV varies between 10–30% in the total energy consumption. The percentage share of MESCOM in total energy consumption remains constant at around 78% between December and April. A similar trend is observed for the solar share which remains constant at around 22% for the same period. The MESCOM share is seen to decrease to 72% in May which is due to the increase in solar contribution to 27% from April. MESCOM share then increases from 79% in June to 88% in August which is attributed to a decrease in solar contribution from 21% to 12% during the same period. Further, the MESCOM share decreases from 86% in September to 83% in November which is due to an increase in solar contribution from 14% in September to 17% in November. The total energy consumption is found to increase from 53,000 kWh to 67,000 kWh from December to April which decreases from 52,000 kWh in May to a minimum of 44,000 kWh in June. It increases further till 62,000 kWh in August and remains almost constant at 62,000 kWh till November. The energy consumption from solar PV is found to be maximum in March with a value of 15,000 kWh and minimum in June and August with values as 7000 kWh and 9000 kWh, respectively. The MESCOM energy consumption is observed to be maximum in April and August with the values of 53,000 kWh and 54,000 kWh and minimum in June with a value of 35,000 kWh. In the monsoon month of June, the total energy consumption is minimum which may be due to a decrease in air conditioning load. The minimum solar energy production in June is due to the fact that NITK receives heavy monsoon rainfall during this period. Due to the minimum total consumption and production from solar, MESCOM energy consumption is also minimum in the month of June.
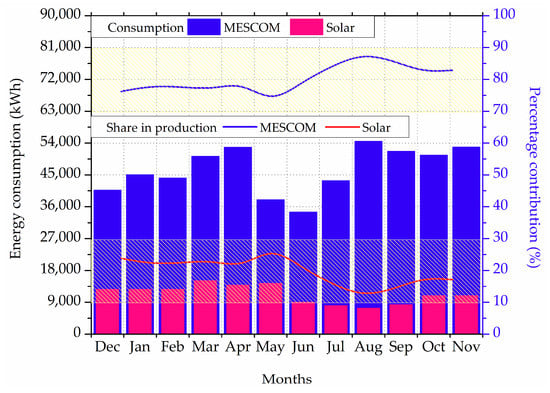
Figure 15.
Monthly energy consumption from MESCOM and solar PV and their share in the total energy consumption. MESCOM: Mangalore Electricity Supply Company Limited, PV: photovoltaic.
The monthly share of the simulated energy production from INSIOS to the total energy consumption can be seen from Figure 16. The INSIOS energy share in the total energy consumption is found to decrease from 18.6% in December to 16.0% in February which further increases from 17% in March to 30% in May. From June onwards, it decreases from 27% to 12% in November.
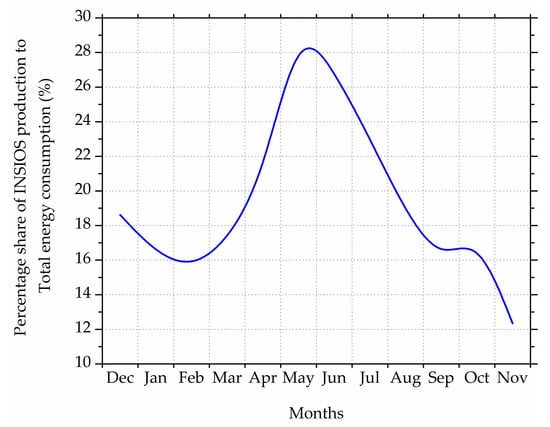
Figure 16.
Monthly share of simulated energy production to total energy consumption.
4.2. Financial Analysis (Economic Impact of Cloud and Aerosol Uncertainty)
Figure 17 shows the financial analysis of the aerosol and cloud uncertainty of the INSIOS simulations as compared to the RPV generation. The energy and economic impact of the clouds and aerosols were quantified in terms of monthly means, energy losses (EL), and financial losses (FL). The monthly energy generated varies from 19,000 to 21,000 kWh from January to May, then decreases from 13,000 to 8000 kWh from June to August, again increases from 14,000 to 19,000 kWh from September to November and then decreases to 17,000 kWh in December. There is a dip in the energy production from June to August which is due to the presence of deep cloud cover during monsoon season. The energy potential is the total energy production (or consumption) which is reduced during the monsoon season as there is less air conditioning load as compared to summer season and less heating load as compared to the winter season. In the case of CS conditions, the aerosol EL is found to vary from 326 to 1072 kWh with annual aerosol EL as 7346 kWh and the aerosol FL varies from 26 to 87 USD with annual aerosol FL as 595 USD. Similarly, in the cloudy case, the cloud EL is found to vary from 2018 to 5914 kWh with annual cloud EL as 42,177 kWh and the cloud FL varies from 163 to 479 USD with annual cloud FL as 3416 USD. In [], the authors analyzed a 10 MW NTPC photovoltaic grid-connected power plant which is located at a longitude of 18.75°N, latitude 79.46°E, and at an altitude of 169 m at Ramagundam. They analyzed the energy production per month from the plant and found that over a year’s span, the minimum yield was during the months of July and August and the percentage variation between the maximum and minimum yield was found to be around 40%. In our study, we have also found the minimum PV energy output during these months and the percentage variation between the maximum and minimum yield was found to be around 49%.
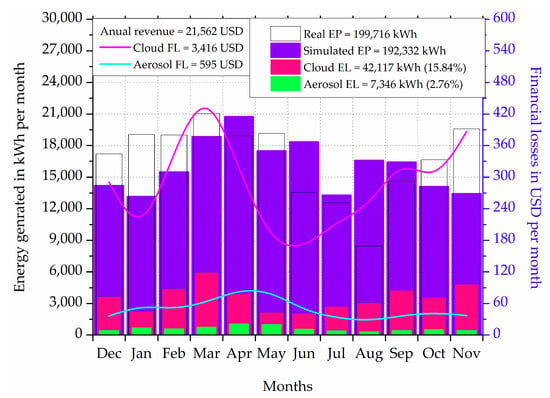
Figure 17.
Economic impact of the aerosol and cloud uncertainty. EP: energy potential, EL: energy losses, FL: financial losses.
The percentage of energy loss from aerosol is 2.76% and that from clouds is 15.84%. The financial losses incurring due to the presence of clouds and aerosols can be reduced if high accuracy aerosols and clouds input data are available for India. As we can see from Figure 17, the energy losses due to the presence of clouds is at the maximum in March and minimum in May and June, while the financial losses are huge during the months of March and November, while it is minimum during May and June. This can help the grid operators to plan and schedule their supply and industrial personnel to plan their loan payments. In [], the authors have shown that for the uncertainties in the indirect radiative effects of aerosols to be less, there is a need for appropriate and more detailed measurements of atmospheric parameters. This can be enforced by establishing several observatories all over India for carrying out in-situ measurements of cloud parameters as well as chemical composition, mixing state, size, and shape of aerosols. A detailed observation of the types of aerosol, their horizontal and vertical distribution is another important step in this regard. In [], a comparison was made between the AOD obtained from MODIS with the AERONET and it was found that there was a high level of uncertainty between the two data sources which enhances the need to have an AOD retrieval system with better spatial resolution and more accuracy for India which has a complex climatology. This will improve the estimations of solar radiation which are based on satellite data. A moderate correlation (coefficient of correlation was 0.6 in January, to 0.4 in February, to 0.73 in July) was observed between INSAT-3D and MODIS data as shown in [], which is the base for the COT calculation from INSAT-3D satellite data. Availability of more accurate cloud microphysical parameters for India would improve the energy prediction in the presence of clouds.
5. Conclusions
Prediction of solar power generation allows this cheaper and freely available energy source to be widely used in developing countries like India where the renewable energy sector remains underdeveloped, without having reliability for grid-integration and affordability for the citizens. This enhances the need for setting up an improved remote sensing-based estimation and forecasting services of solar energy. PV potential map forms the basis of the precondition and foundation of large-scale development of the PV system in India. Though India has an abundant solar resource, yet the speed of development of the rooftop PV is far less than expected. The escalation of the deployment of large-scale PV requires high-precision planning, hence, there is a need to estimate and quantify the potential for rooftop solar photovoltaics.
The near real-time and fast estimations of solar irradiance are made possible by the INSIOS technique for the Indian region which is capable of management of solar energy production in India. In this analysis, solar radiation estimations from INSIOS is applied to the rooftop PV plant of NITK to study the management of solar power along with the financial analysis in urban smart cities.
The correlation between the INSIOS solar energy simulations and the SIS measurements shows a coefficient of determination as 0.82 and median of their difference as 39.40 W/m2 and it is observed that there are overestimations for maximum cases and also underestimations for some of the cases. The underestimations lie mainly for the solar zenith angle greater than 75°. It was found that for CS condition, the percentage of cases within ±5%, ±10%, ±20%, and ±50% were 16%, 28%, 42%, and 60%, respectively, while for CD conditions, these values were 2%, 4%, 8%, and 27%, respectively. The percentage difference of the median difference between the INSIOS and SIS data varies from 27% for SZA between 0–15° to 90% for SZA between 45–60°. The percentage difference between INSIOS simulations and SIS measurement for CS irradiance varies from −100% to 100% and most of the percentage difference lies within 25%. The effect of clouds on energy generation is quantified as the variation of the percentage difference between the RPV and the INSIOS energy generations with COT which increases from 38% to 75% for COT between 19 and 40, respectively and then increases sharply from 52% to 75% for COT between 28 and 37, respectively. The effect of aerosols is seen as a sharp decrease in the percentage difference between RPV and INSIOS energy generations from −88% to −13% for a variation in the AOD from around 0.09 to 0.22, respectively and being within −15% for AOD varying from 0.22 to 0.55. The shadow effect on the percentage difference between RPV and INSIOS energy generations is observed to fluctuate between −45% to −15% for the solar zenith angle varying from 71° to 83°, decreases sharply from −32% to 0% for SZA between 83° and 86° and becomes positive beyond 86° and starts increasing till 48% for 89° SZA.
The median of the absolute difference between the simulated generation from the INSIOS and the RPV generation is found to be around 0.82 kWh and −0.97 kWh for summer and autumn, respectively, and −3.52 kWh and 4.08 kWh for winter and monsoon, respectively. Statistical analysis shows that the INSIOS energy production for the CS, CD sky and different seasons shows that the correlation coefficient varies as 0.70, 0.64, 0.57, 0.53, 0.52, and 0.49 for CS, winter, summer, monsoon, all-sky and autumn, respectively. Standard deviations were found to decrease as 0.8 to 0.3 from autumn, monsoon, winter, CS, and all-sky cases and were maximum for summer. While the root mean square deviation was found to vary from 0.9 to 0.7 for autumn, monsoon, summer, all-sky, winter, and CS cases. The monthly energy consumption is found to vary from around 430,000 to 620,000 kWh over a year with the renewable energy adequacy varying from 300,000 to 400,000 kWh and the percentage error from PV simulated production from −30 to 60%. The energy loss is found to vary from 326 to 1072 kWh and 2018 to 5914 kWh for CS and CD conditions, respectively. CS is characterized by the absence of clouds and the presence of aerosols, while CD conditions attribute to the presence of clouds neglecting the presence of aerosols. The financial losses due to the presence of clouds and aerosols are found to vary from 163 to 479 USD with annual cloud FL as 3416 USD and from 26 to 87 USD with annual aerosol FL as 595 USD, respectively. The percentage of energy loss is higher in the case of clouds (21.12%) than aerosols (3.68%).
The Government of India has set an ambitious target to increase the solar rooftop installation by 10-fold by 2022 [] which requires exploiting roofs/covered surfaces of urban areas. Albedo, atmospheric turbidity, casting shadows and 3D heterogeneity affect the solar irradiance of these regions. These distributed factors can be taken into account with the help of active and passive remote sensing techniques and advanced GIS modeling so as to carry on a more realistic estimation of the energy potential of rooftop PV systems in urban regions. In order to utilize the roofs for PV power generation, proper representation of building covers, their 3D geometric and radiometric parameters are needed. However, the lack of information regarding the roof surfaces makes it mandatory to use remote sensing-based technologies.
The identification and characterization of rooftops are essential for the assessment of rooftop solar PV potential in mega-cities so as to determine their surface area and assess if the orientation, slope, shadings, and the presence of obstructions, etc. are appropriate. Effective exploitation of renewable energy resources needs a proper availability of tools and methodologies to support the assessment of the potential that can be implemented []. To supporting PV potential assessment, mapping of the solar radiation using GIS is done [,]. The solar irradiance can be evaluated on the basis of the orientation and exposure parameters which can be obtained from the digital representation of natural elevations stored in digital elevation model so as to get a more realistic estimate in the urban area.
Author Contributions
P.K. designed and conceptualized the idea for this study; A.M. and P.K. analyzed the data, prepared the graphs and wrote the manuscript; A.M., P.K. and A.B. are the developers of INSIOS; P.K, Y.K. and S.K. arranged the rooftop PV data; A.B., P.K., Y.K. and S.K. reviewed the manuscript; A.B. and P.K. supervised A.M. All authors have read and agreed to the published version of the manuscript.
Funding
This research received no external funding.
Acknowledgments
A.M., P.K., Y.K., S.K. and A.B. acknowledge the Copernicus, INSAT-3D, NITK and CleanMax Solar for providing the data related to aerosols, clouds, solar irradiance, PV energy production and building consumption that has been used in this study. P.K. acknowledges the EuroGEO e-shape project under grant agreement 820852 and the ERA-PLANET SMURBS project under grant agreement 689443.
Conflicts of Interest
The authors declare no conflict of interest.
References
- Ellabban, O.; Abu-Rub, H.; Blaabjerg, F. Renewable energy resources: Current status, future prospects and their enabling technology. Renew. Sustain. Energy Rev. 2014, 39, 748–764. [Google Scholar] [CrossRef]
- Gielen, D.; Saygin, D.; Wagner, N.; Ghosh, A.; Chawla, K. Renewable Energy Prospects for India, a Working Paper Based on REmap; International Renewable Energy Agency: Abu Dhabi, UAE, 2017. [Google Scholar]
- Transmission Plan for Envisaged Renewable Capacity. Green Energy Corridor Report Vol-1; Power Grid Corporation of India Ltd.: Gurgaon, India, 2012.
- Commercial Real Estate India. India 2030 Exploring the Future; Commercial Real Estate India: New Delhi, India, 2019. [Google Scholar]
- Anuta, A.; Ralon, P.; Taylor, M. Renewable Power Generation Costs in 2018; International Renewable Energy Agency: Abu Dhabi, UAE, 2018. [Google Scholar]
- Behuria, P. The politics of late late development in renewable energy sectors: Dependency and contradictory tensions in India’s National Solar Mission. World Dev. 2020, 126, 104726. [Google Scholar] [CrossRef]
- Sharma, S.; Jain, G.; Mishra, S.; Bhattacharya, B. Assessment of Roof-Top Solar Energy Potential in Proposed Smart Cities of India; Space Applications Centre: Jodhpur, India, 2017.
- Sharma, N.K.; Tiwari, P.K.; Sood, Y.R. Solar energy in India: Strategies, policies, perspectives and future potential. Renew. Sustain. Energy Rev. 2012, 16, 933–941. [Google Scholar] [CrossRef]
- Harriss-white, B.; Rohra, S.; Singh, N. Political Architecture of India’s Technology System for Solar Energy. Econ. Political Wkly. 2009, 44, 47. [Google Scholar]
- 60 Solar Cities to Be Developed across Country. Available online: https://pib.gov.in/Pressreleaseshare.aspx?PRID=1519372 (accessed on 5 April 2020).
- Pune Municipal Corporation. Reimagining Pune: Mission Smart City; Pune Municipal Corporation: Pune, India, 2015. [Google Scholar]
- Singh, G.K. Solar power generation by PV (Photovoltaic) technology: A review. Energy 2013, 53, 1–13. [Google Scholar] [CrossRef]
- Lund, H. Renewable energy strategies for sustainable development. Energy 2007, 32, 912–919. [Google Scholar] [CrossRef]
- Angelis-Dimakis, A.; Biberacher, M.; Dominguez, J.; Fiorese, G.; Gadocha, S.; Gnansounou, E.; Guariso, G.; Kartalidis, A.; Panichelli, L.; Pinedo, I.; et al. Methods and tools to evaluate the availability of renewable energy sources. Renew. Sustain. Energy Rev. 2011, 15, 1182–1200. [Google Scholar] [CrossRef]
- International Energy Agency. Potential for Building Integrated Photovoltaics; International Energy Agency: Paris, France, 2002. [Google Scholar]
- Gharakhani Siraki, A.; Pillay, P. Study of optimum tilt angles for solar panels in different latitudes for urban applications. Sol. Energy 2012, 86, 1920–1928. [Google Scholar] [CrossRef]
- Tiris, M.; Tiris, C. Optimum collector slope and model evaluation: Case study for Gebze, Turkey. Energy Convers. Manag. 1998, 39, 167–172. [Google Scholar] [CrossRef]
- Rowlands, I.H.; Kemery, B.P.; Beausoleil-Morrison, I. Optimal solar-PV tilt angle and azimuth: An Ontario (Canada) case-study. Energy Policy 2011, 39, 1397–1409. [Google Scholar] [CrossRef]
- El-Sebaii, A.A.; Al-Hazmi, F.S.; Al-Ghamdi, A.A.; Yaghmour, S.J. Global, direct and diffuse solar radiation on horizontal and tilted surfaces in Jeddah, Saudi Arabia. Appl. Energy 2010, 87, 568–576. [Google Scholar] [CrossRef]
- Koussa, M.; Saheb-Koussa, D.; Hamane, M.; Boussaa, Z.; Lalaoui, M.A. Effect of a Daily Flat Plate Collector Orientation Change on the Solar System Performances. In Proceedings of the 7th International Renewable Energy Congress, Hammamet, Tunisia, 2016; Available online: https://ieeexplore.ieee.org/document/7478942 (accessed on 5 April 2020).
- Demain, C.; Journée, M.; Bertrand, C. Evaluation of different models to estimate the global solar radiation on inclined surfaces. Renew. Energy 2013, 50, 710–721. [Google Scholar] [CrossRef]
- Ko, L.; Wang, J.C.; Chen, C.Y.; Tsai, H.Y. Evaluation of the development potential of rooftop solar photovoltaic in Taiwan. Renew. Energy 2015, 76, 582–595. [Google Scholar] [CrossRef]
- Arán Carrión, J.; Espín Estrella, A.; Aznar Dols, F.; Zamorano Toro, M.; Rodríguez, M.; Ramos Ridao, A. Environmental decision-support systems for evaluating the carrying capacity of land areas: Optimal site selection for grid-connected photovoltaic power plants. Renew. Sustain. Energy Rev. 2008, 12, 2358–2380. [Google Scholar] [CrossRef]
- Wiginton, L.K.; Nguyen, H.T.; Pearce, J.M. Quantifying rooftop solar photovoltaic potential for regional renewable energy policy. Comput. Environ. Urban Syst. 2010, 34, 345–357. [Google Scholar] [CrossRef]
- Mulherin, A.; Pratson, L. A Spatial Approach to Determine Solar PV Potential for Durham Homeowners; Duke University: Durham, NC, USA, 2011. [Google Scholar]
- Snow, M.; Prasad, D. Designing with Solar Power: A Source Book for Building Integrated Photovoltaics; Earthscan: London, UK, 2005; ISBN 978-1-31506-573-1. [Google Scholar] [CrossRef]
- Tooke, T.R.; Coops, N.C. A Review of Remote Sensing for Urban Energy System Management and Planning. Proceeding of the Joint Urban Remote Sensing Event, Sao Paulo, Brazil, 21–23 April 2013; pp. 167–170. [Google Scholar]
- Beyer, H.G.; Costanzo, C.; Heinemann, D. Modifications of the Heliosat procedure for irradiance estimates from satellite images. Sol. Energy 1996, 56, 207–212. [Google Scholar] [CrossRef]
- Hammer, A.; Heinemann, D.; Hoyer, C.; Kuhlemann, R.; Lorenz, E.; Müller, R.; Beyer, H.G. Solar energy assessment using remote sensing technologies. Remote Sens. Environ. 2003, 86, 423–432. [Google Scholar] [CrossRef]
- Lefèvre, M.; Oumbe, A.; Blanc, P.; Espinar, B.; Gschwind, B.; Qu, Z.; Wald, L.; Schroedter-Homscheidt, M.; Hoyer-Klick, C.; Arola, A.; et al. McClear: A new model estimating downwelling solar radiation at ground level in clear-sky conditions. Atmos. Meas. Tech. 2013, 6, 2403–2418. [Google Scholar] [CrossRef]
- Mueller, R.W.; Matsoukas, C.; Gratzki, A.; Behr, H.D.; Hollmann, R. The CM-SAF operational scheme for the satellite based retrieval of solar surface irradiance—A LUT based eigenvector hybrid approach. Remote Sens. Environ. 2009, 113, 1012–1024. [Google Scholar] [CrossRef]
- Huang, G.; Ma, M.; Liang, S.; Liu, S.; Li, X. A LUT-based approach to estimate surface solar irradiance by combining MODIS and MTSAT data. Geophys. Res. Atmos. 2011, 116, 1–14. [Google Scholar] [CrossRef]
- MODIS Web. Available online: https://modis.gsfc.nasa.gov/about/ (accessed on 26 May 2020).
- Masoom, A.; Kosmopoulos, P.; Bansal, A.; Kazadzis, S. Solar Energy Estimations in India Using Remote Sensing Technologies and Validation with Sun Photometers in Urban Areas. Remote Sens. 2020, 12, 254. [Google Scholar] [CrossRef]
- Mayer, B.; Kylling, A. Technical Note: The libRadtran software package for radiative transfer calculations—description and examples of use. Atmos. Chem. Phys. 2005, 5, 1855–1877. [Google Scholar] [CrossRef]
- Mayer, B.; Kylling, A.; Emde, C.; Buras, R.; Hamann, U.; Gasteiger, J.; Richter, B. LibRadtran User’s Guide. 2017. Available online: http://libradtran.org/doc/libRadtran.pdf (accessed on 16 March 2020).
- Kosmopoulos, P.G.; Kazadzis, S.; El-Askary, H.; Taylor, M.; Gkikas, A.; Proestakis, E.; Kontoes, C.; El-Khayat, M.M. Earth-Observation-Based Estimation and Forecasting of Particulate Matter Impact on Solar Energy in Egypt. Remote Sens. 2018, 10, 1870. [Google Scholar] [CrossRef]
- Evenflow SPRL. Business Plan for the Establishment, Operation and Exploitation of a Solar Farm: Aswan’s Solar Plant Project Extension of Sir Magdi Yacoub Heart Hospital; Evenflow SPRL: Aswan, Egypt, 2017. [Google Scholar]
- John, J.; Dey, I.; Pushpakar, A.; Sathiyamoorthy, V.; Shukla, B.P. INSAT-3D cloud microphysical product: Retrieval and validation. Int. J. Remote Sens. 2019, 40, 1481–1494. [Google Scholar] [CrossRef]
- National Satellite Meteorological Centre. INSAT-3D Products Catalog; India Meteorological Department: New Delhi, India, 2014.
- Meteorological & Oceanographic Satellite Data Archival Centre | Space Applications Centre, ISRO. Available online: https://www.mosdac.gov.in/ (accessed on 8 June 2019).
- Atmospheric Monitoring Service | Copernicus. Available online: https://atmosphere.copernicus.eu/data (accessed on 16 November 2019).
- Schroedter-Homscheidt, M.; Hoyer-klick, C.; Killius, N.; Lefèvre, M. User’s Guide to the CAMS Radiation Service. Copernicus Atmosphere Monitoring Service; German Aerospace Center: Cologne, Germany, 2017. [Google Scholar]
- Eissa, Y.; Korany, M.; Aoun, Y.; Boraiy, M.; Wahab, M.M.A.; Alfaro, S.C.; Blanc, P.; El-Metwally, M.; Ghedira, H.; Hungershoefer, K.; et al. Validation of the Surface Downwelling Solar Irradiance Estimates of the HelioClim-3 Database in Egypt. Remote Sens. 2015, 7, 9269–9291. [Google Scholar] [CrossRef]
- Copernicus Atmosphere Monitoring Service. Validation Report of the CAMS Near-Real Time Global Atmospheric Composition Service; Royal Netherlands Meteorological Institute: De Bilt, Netherlands, 2019. [Google Scholar]
- Shukla, A.K.; Sudhakar, K.; Baredar, P. Design, simulation and economic analysis of standalone roof top solar PV system in India. Sol. Energy 2016, 136, 437–449. [Google Scholar] [CrossRef]
- Cebecauer, T.; Huld, T.; Suri, M. Using High-Resolution Digital Elevation Model for Improved PV Yield Estimates. In Proceedings of the 22nd European Photovoltaic Solar Energy Conference, Milano, Italy, 3–7 September 2007; pp. 3553–3557. [Google Scholar]
- Solar Irradiance Sensors: Ingenieurbüro Mencke & Tegtmeyer GmbH. Available online: https://www.imt-solar.com/solar-irradiance-sensors/ (accessed on 19 April 2020).
- Duffee, J.A.; Bechman, W.A. Solar Energy of Thermal Processes, 4th ed.; John Wiley & Sons: Hoboken, NJ, USA, 2013; ISBN 978-04-7087-366-3. [Google Scholar] [CrossRef]
- Maleki, S.A.M.; Hizam, H.; Gomes, C. Estimation of Hourly, Daily and Monthly Global Solar Radiation on Inclined Surfaces: Models Re-Visited. Energies 2017, 10, 134. [Google Scholar] [CrossRef]
- Badescu, V. 3D isotropic approximation for solar diffuse irradiance on tilted surfaces. Renew. Energy 2002, 26, 221–233. [Google Scholar] [CrossRef]
- Karnataka leads Indian States in New Rooftop PV Attractiveness Index. Available online: https://list.solar/news/karnataka-leads/ (accessed on 29 May 2020).
- Kosmopoulos, P.G.; Kazadzis, S.; Taylor, M.; Raptis, P.I.; Keramitsoglou, I.; Kiranoudis, C.; Bais, A.F. Assessment of surface solar irradiance derived from real-time modelling techniques and verification with ground-based measurements. Atmos. Meas. Tech. 2017, 11, 907–924. [Google Scholar] [CrossRef]
- Rajput, D.S.; Sudhakar, K. Effect of Dust on the Performance of Solar PV. In Proceedings of the International Conference on Global Scenario in Environment and Energy, Bhopal, India, 14–16 March 2013; pp. 1083–1086. [Google Scholar]
- Shukla, K.N.; Rangnekar, S.; Sudhakar, K. Comparative study of isotropic and anisotropic sky models to estimate solar radiation incident on tilted surface: A case study for Bhopal India. Energy Rep. 2015, 1, 96–103. [Google Scholar] [CrossRef]
- Šúri, M.; Huld, T.A.; Dunlop, E.D.; Ossenbrink, H.A. Potential of solar electricity generation in the European Union member states and candidate countries. Sol. Energy 2007, 81, 1295–1305. [Google Scholar] [CrossRef]
- Eck, T.F.; Holben, B.N.; Slutsker, I.; Setzer, A.; Intercomparison, T. Measurements of irradiance attenuation and estimation of aerosol single scattering albedo for biomass burning aerosols in Amazonia. Geophys. Res. Atmos. 1998, 103, 31865–31878. [Google Scholar] [CrossRef]
- Kosmopoulos, P.G.; Kazadzis, S.; Taylor, M.; Athanasopoulou, E.; Speyer, O.; Raptis, P.I.; Marinou, E.; Proestakis, E.; Solomos, S.; Gerasopoulos, E.; et al. Dust Iimpact on surface solar irradiance assessed with model simulations, satellite observations and ground-based measurements. Atmos. Meas. Tech. 2017, 10, 2435–2453. [Google Scholar] [CrossRef]
- Eskes, H.; Huijnen, V.; Arola, A.; Benedictow, A.; Blechschmidt, A.M.; Botek, E.; Boucher, O.; Bouarar, I.; Chabrillat, S.; Cuevas, E.; et al. Validation of Rreactive gases and aerosols in the MACC global analysis and forecast system. Geosci. Model Dev. 2015, 8, 3523–3543. [Google Scholar] [CrossRef]
- Riihelä, A.; Kallio, V.; Devraj, S.; Sharma, A.; Lindfors, A.V. Validation of the SARAH-E Satellite-Based Surface Solar Radiation Estimates over India. Remote Sens. 2018, 10, 392. [Google Scholar] [CrossRef]
- Maghami, M.R.; Hizam, H.; Gomes, C.; Radzi, M.A.; Rezadad, M.I.; Hajighorbani, S. Power loss due to soiling on solar panel: A review. Renew. Sustain. Energy Rev. 2016, 59, 1307–1316. [Google Scholar] [CrossRef]
- Rieger, D.; Steiner, A.; Bachmann, V.; Gasch, P.; Förstner, J.; Deetz, K.; Vogel, B.; Vogel, H. Impact of the 4 April 2014 Saharan dust outbreak on the photovoltaic power generation in Germany. Atmos. Chem. Phys. 2017, 17, 13391–13415. [Google Scholar] [CrossRef]
- Neher, I.; Buchmann, T.; Crewell, S.; Evers-Dietze, B.; Pfeilsticker, K.; Pospichal, B.; Schirrmeister, C.; Meilinger, S. Impact of atmospheric aerosols on photovoltaic energy production Scenario for the Sahel zone. Energy Procedia 2017, 125, 170–179. [Google Scholar] [CrossRef]
- Solar Radiation Basics | Department of Energy. Available online: https://www.energy.gov/eere/solar/articles/solar-radiation-basics (accessed on 15 April 2020).
- Kosmopoulos, P.G.; Kazadzis, S.; Lagouvardos, K.; Kotroni, V.; Bais, A. Solar energy prediction and verification using operational model forecasts and ground-based solar measurements. Energy 2015, 93, 1918–1930. [Google Scholar] [CrossRef]
- Sengupta, M.; Gotseff, P.; Myers, D.; Stoffel, T. Performance Testing Using Silicon Devices—Analysis of Accuracy. In Proceedings of the IEEE Photovoltaic Specialists Conference, Austin, TX, USA, 3–8 June 2012. [Google Scholar]
- Driesse, A.; Zaaiman, W. Characterization of Global Irradiance Sensors for Use with PV Systems. In Proceedings of the IEEE 42nd Photovoltaic Specialists Conference, New Orleans, LA, USA, 14–19 June 2015; pp. 2–6. [Google Scholar]
- Dunlop, E.D.; Halton, D. The performance of crystalline silicon photovoltaic solar modules after 22 years of continuous outdoor exposure. Prog. Photovolt. Res. Appl. 2006, 14, 53–64. [Google Scholar] [CrossRef]
- Huld, T.; Gottschalg, R.; Beyer, H.G.; Topič, M. Mapping the performance of PV modules, effects of module type and data averaging. Sol. Energy 2010, 84, 324–338. [Google Scholar] [CrossRef]
- Huld, T.; Cebecauer, T.; Šúri, M.; Dunlop, E.D. Analysis of one-axis tracking strategies for PV systems in Europe. Prog. Photovolt. Res. Appl. 2010, 18, 183–194. [Google Scholar] [CrossRef]
- Perez, R.; Cebecauer, T.; Šúri, M. Semi-Empirical Satellite Models. In Solar Energy Forecasting and Resource Assessment, 1st ed.; Kleissl, J., Ed.; Academic Press: Cambridge, MA, USA, 2013; pp. 21–48. ISBN 978-0-1239-7772-4. [Google Scholar] [CrossRef]
- Ramachandran, S.; Kedia, S. Aerosol-Precipitation Interactions over India: Review and Future Perspectives. Adv. Meteorol. 2013, 2013, 649156. [Google Scholar] [CrossRef]
- Thotakura, S.; Kondamudi, S.C.; Xavier, J.F.; Quanjin, M.; Reddy, G.R.; Gangwar, P.; Davuluri, S.L. Operational performance of megawatt-scale grid integrated rooftop solar PV system in tropical wet and dry climates of India. Case Stud. Therm. Eng. 2020, 18, 100602. [Google Scholar] [CrossRef]
- Climate and Average Monthly Weather in Mangalore (Karnataka), India. Available online: https://weather-and-climate.com/average-monthly-Rainfall-Temperature-Sunshine,Mangalore,India (accessed on 1 April 2020).
- Polo, J.; Zarzalejo, L.F.; Cony, M.; Navarro, A.A.; Marchante, R.; Martín, L.; Romero, M. Solar radiation estimations over India using Meteosat satellite images. Sol. Energy 2011, 85, 2395–2406. [Google Scholar] [CrossRef]
- Dunning, C.M.; Turner, A.G.; Brayshaw, D.J. The impact of monsoon intraseasonal variability on renewable power generation in India. Environ. Res. Lett. 2015, 10, 6064002. [Google Scholar] [CrossRef]
- Sendanayake, S.; Miguntanna, N.P.; Jayasinghe, M.T.R. Predicting solar radiation for tropical islands from rainfall data. Urban Environ. Eng. 2015, 9, 109–118. [Google Scholar] [CrossRef]
- Deneke, H.M.; Feijt, A.J.; Roebeling, R.A. Estimating surface solar irradiance from METEOSAT SEVIRI-derived cloud properties. Remote Sens. Environ. 2008, 112, 3131–3141. [Google Scholar] [CrossRef]
- Perez, R.; Stewart, R.; Arbogast, C.; Seals, R.; Scott, J. An anisotropic hourly diffuse radiation model for sloping surfaces: Description, performance validation, site dependency evaluation. Sol. Energy 1986, 36, 481–497. [Google Scholar] [CrossRef]
- Desthieux, G.; Carneiro, C.; Camponovo, R.; Ineichen, P.; Morello, E.; Boulmier, A.; Abdennadher, N.; Dervey, S.; Ellert, C. Solar Energy Potential Assessment on Rooftops and Facades in Large Built Environments Based on Lidar Data, Image Processing, and Cloud Computing. Methodological Background, Application, and Validation in Geneva (Solar Cadaster). Front. Built Environ. 2018, 4. [Google Scholar] [CrossRef]
- Shiva Kumar, B.; Sudhakar, K. Performance evaluation of 10 MW grid connected solar photovoltaic power plant in India. Energy Rep. 2015, 1, 184–192. [Google Scholar] [CrossRef]
- Ministry of New and Renewable Energy. State Rooftop Solar Attractiveness Index; Ministry of New and Renewable Energy: New Delhi, India, 2018.
- Izquierdo, S.; Rodrigues, M.; Fueyo, N. A method for estimating the geographical distribution of the available roof surface area for large-scale photovoltaic energy-potential evaluations. Sol. Energy 2008, 82, 929–939. [Google Scholar] [CrossRef]
- Huld, T.A.; Suri, M.; Kenny, R.P.; Dunlop, E.D. Estimating PV Performance over Large Geographical Regions. In Proceedings of the Photovoltaic Specialists IEEE Conference, Lake Buena Vista, FL, USA, 3–7 January 2005; pp. 1679–1682. [Google Scholar]
- Ŝúri, M.; Hofierka, J. A New GIS-Based Solar Radiation Model and Its Application to Photovoltaic Assessments. Trans. GIS 2004, 8, 175–190. [Google Scholar] [CrossRef]
© 2020 by the authors. Licensee MDPI, Basel, Switzerland. This article is an open access article distributed under the terms and conditions of the Creative Commons Attribution (CC BY) license (http://creativecommons.org/licenses/by/4.0/).