Investigating Lunar Boulders at the Apollo 17 Landing Site Using Photogrammetry and Virtual Reality

 ,
,  , ,
, ,
Abstract
:
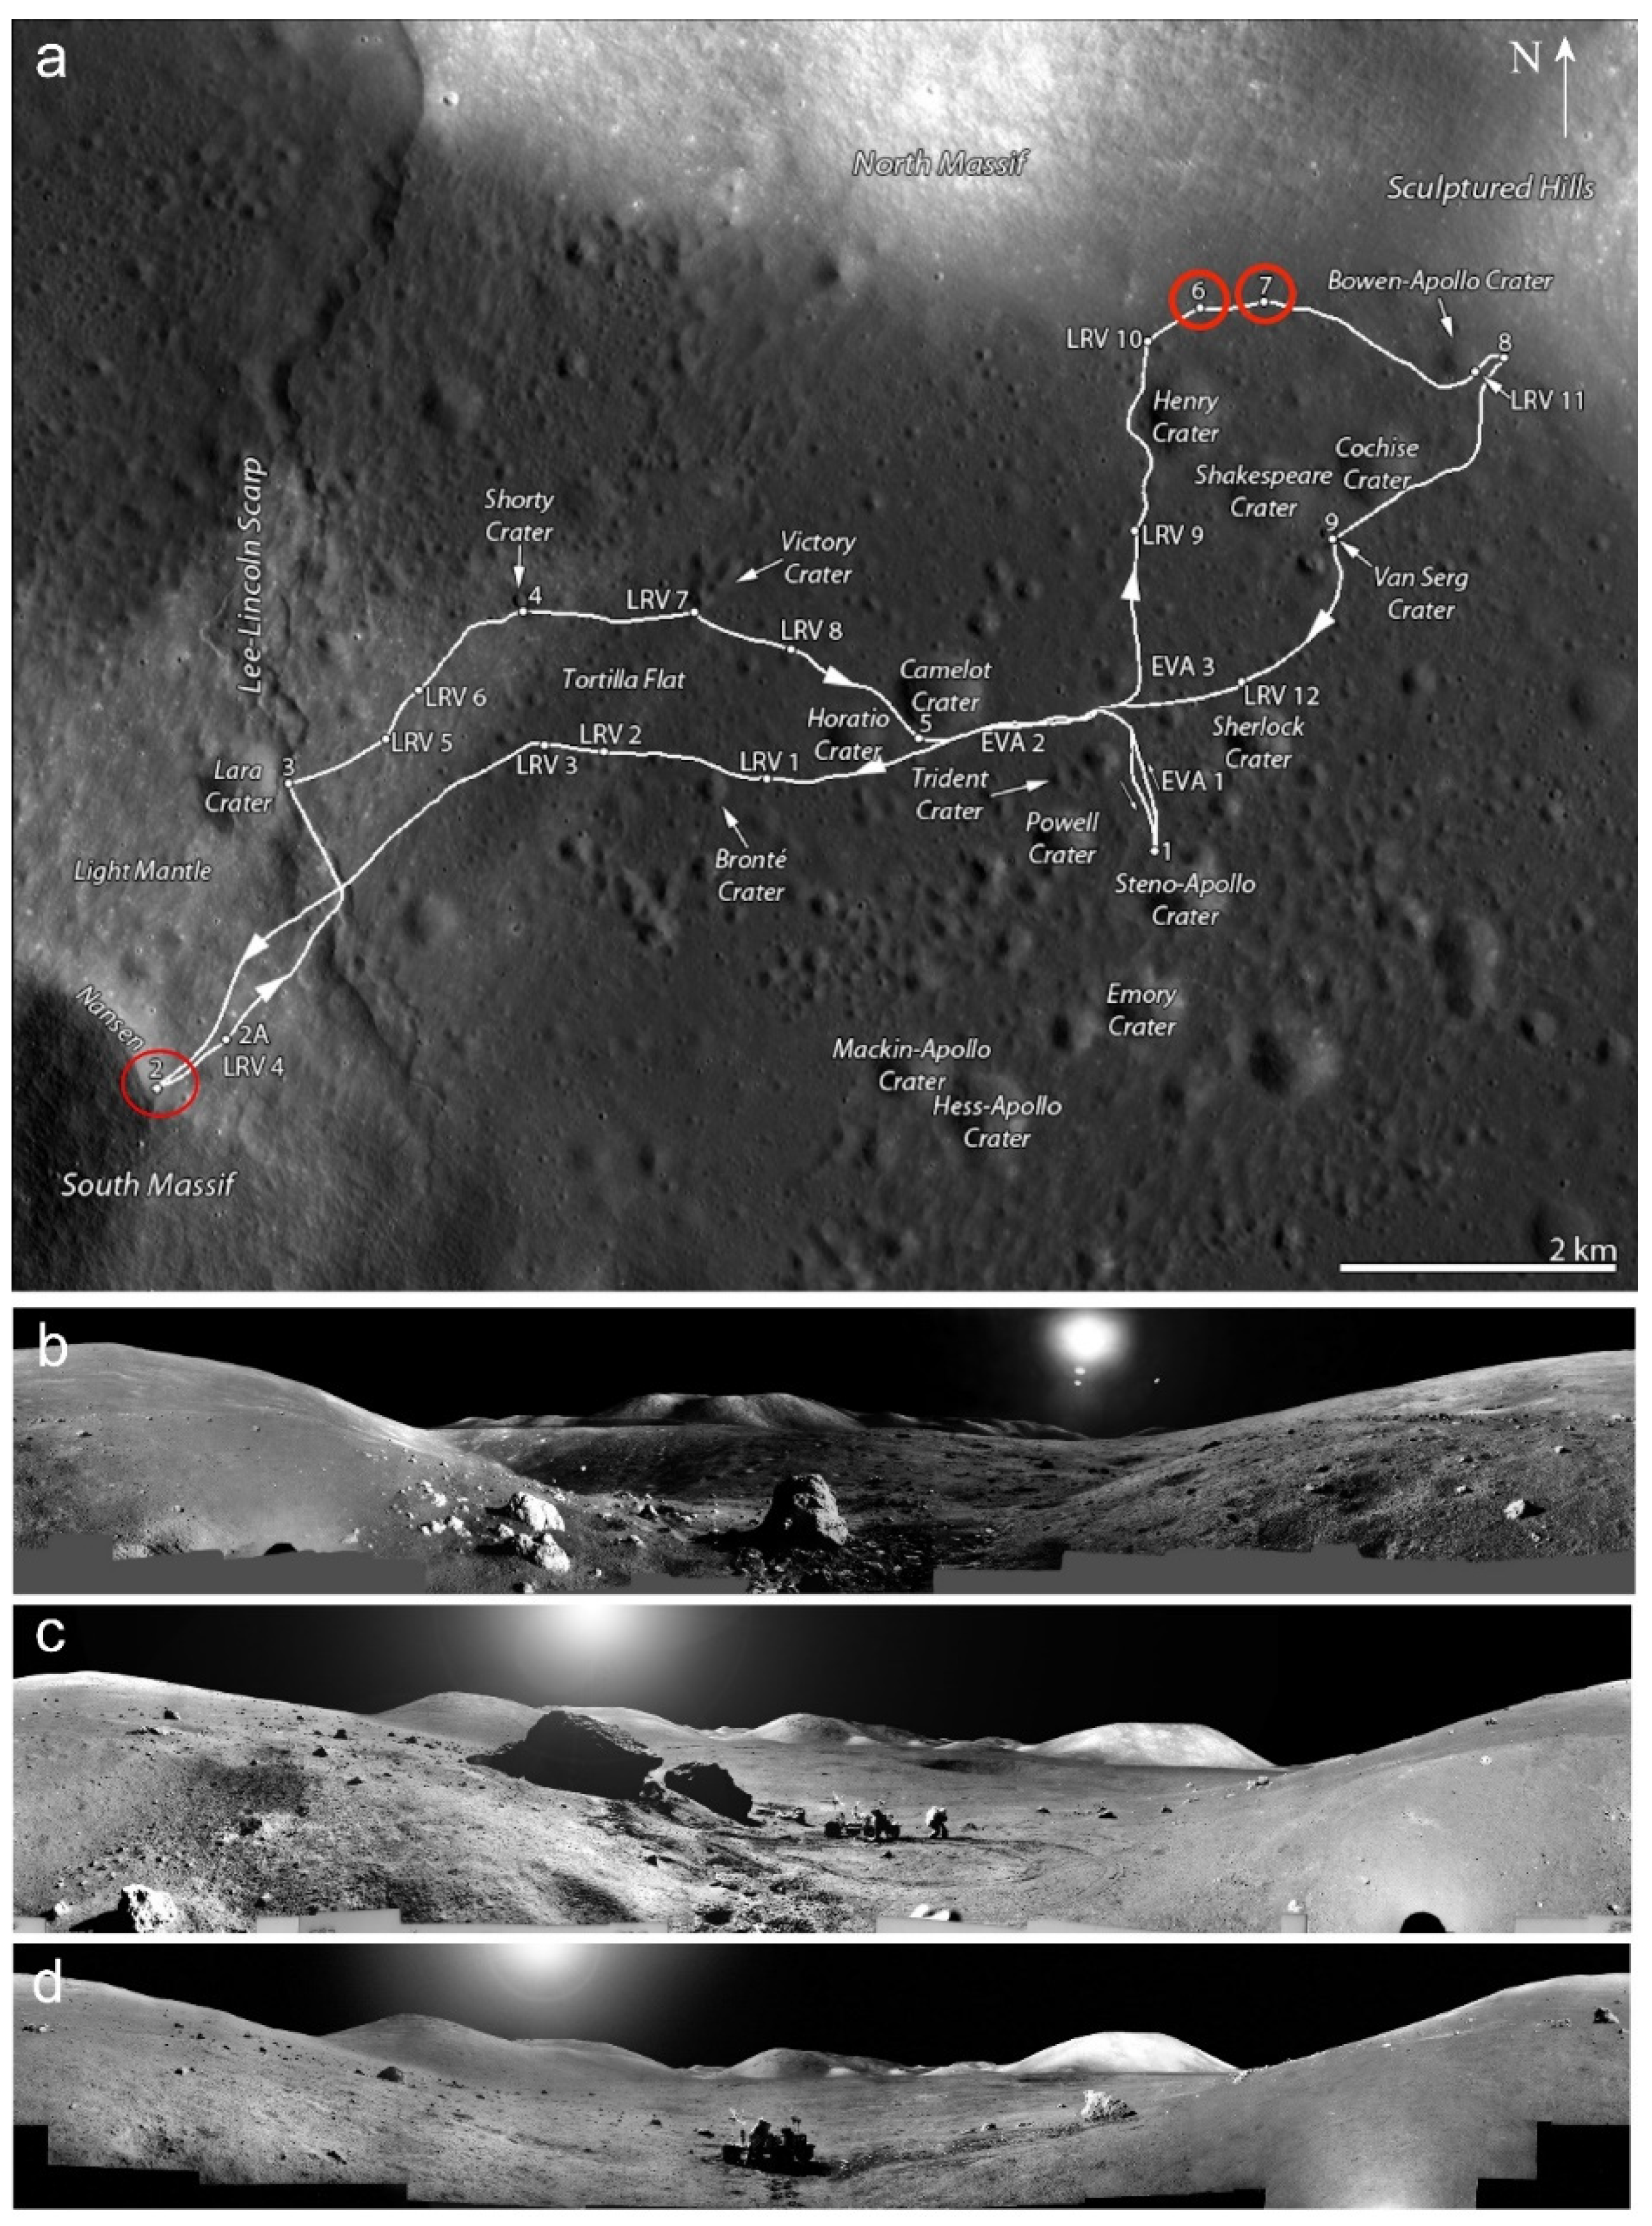
1. Introduction
2. Materials and Methods
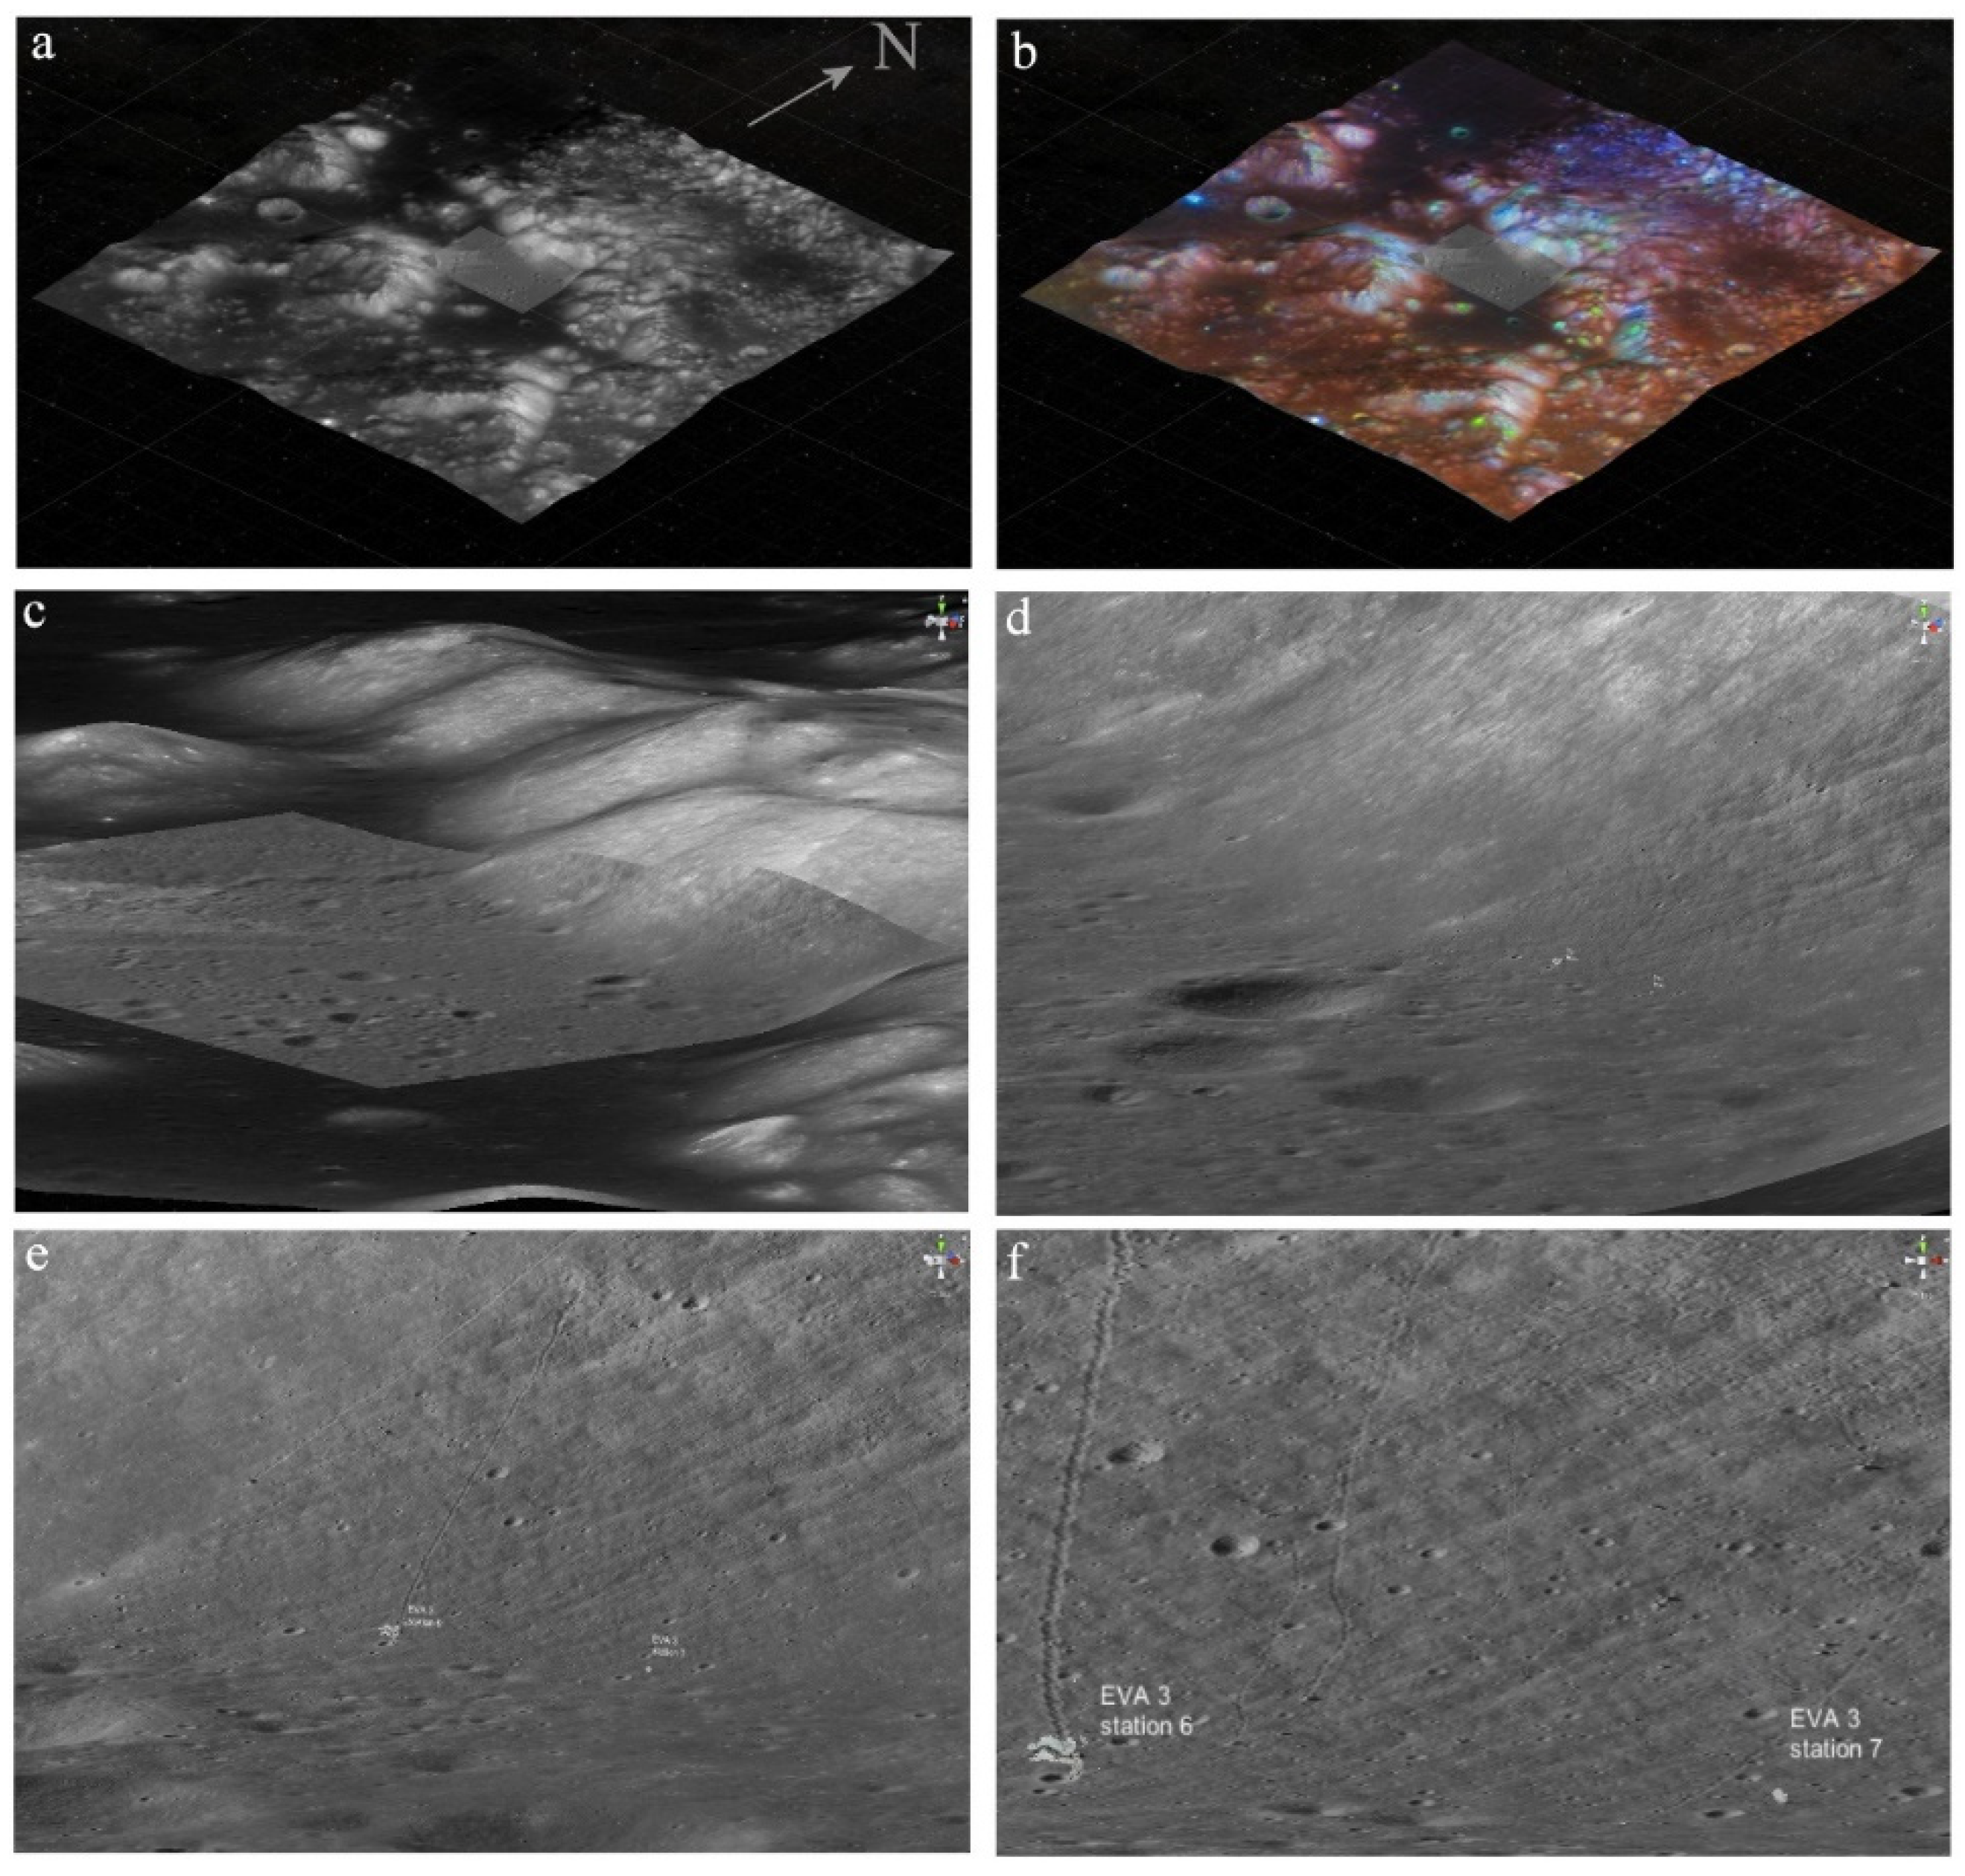
2.1. Context Orbital Imagery
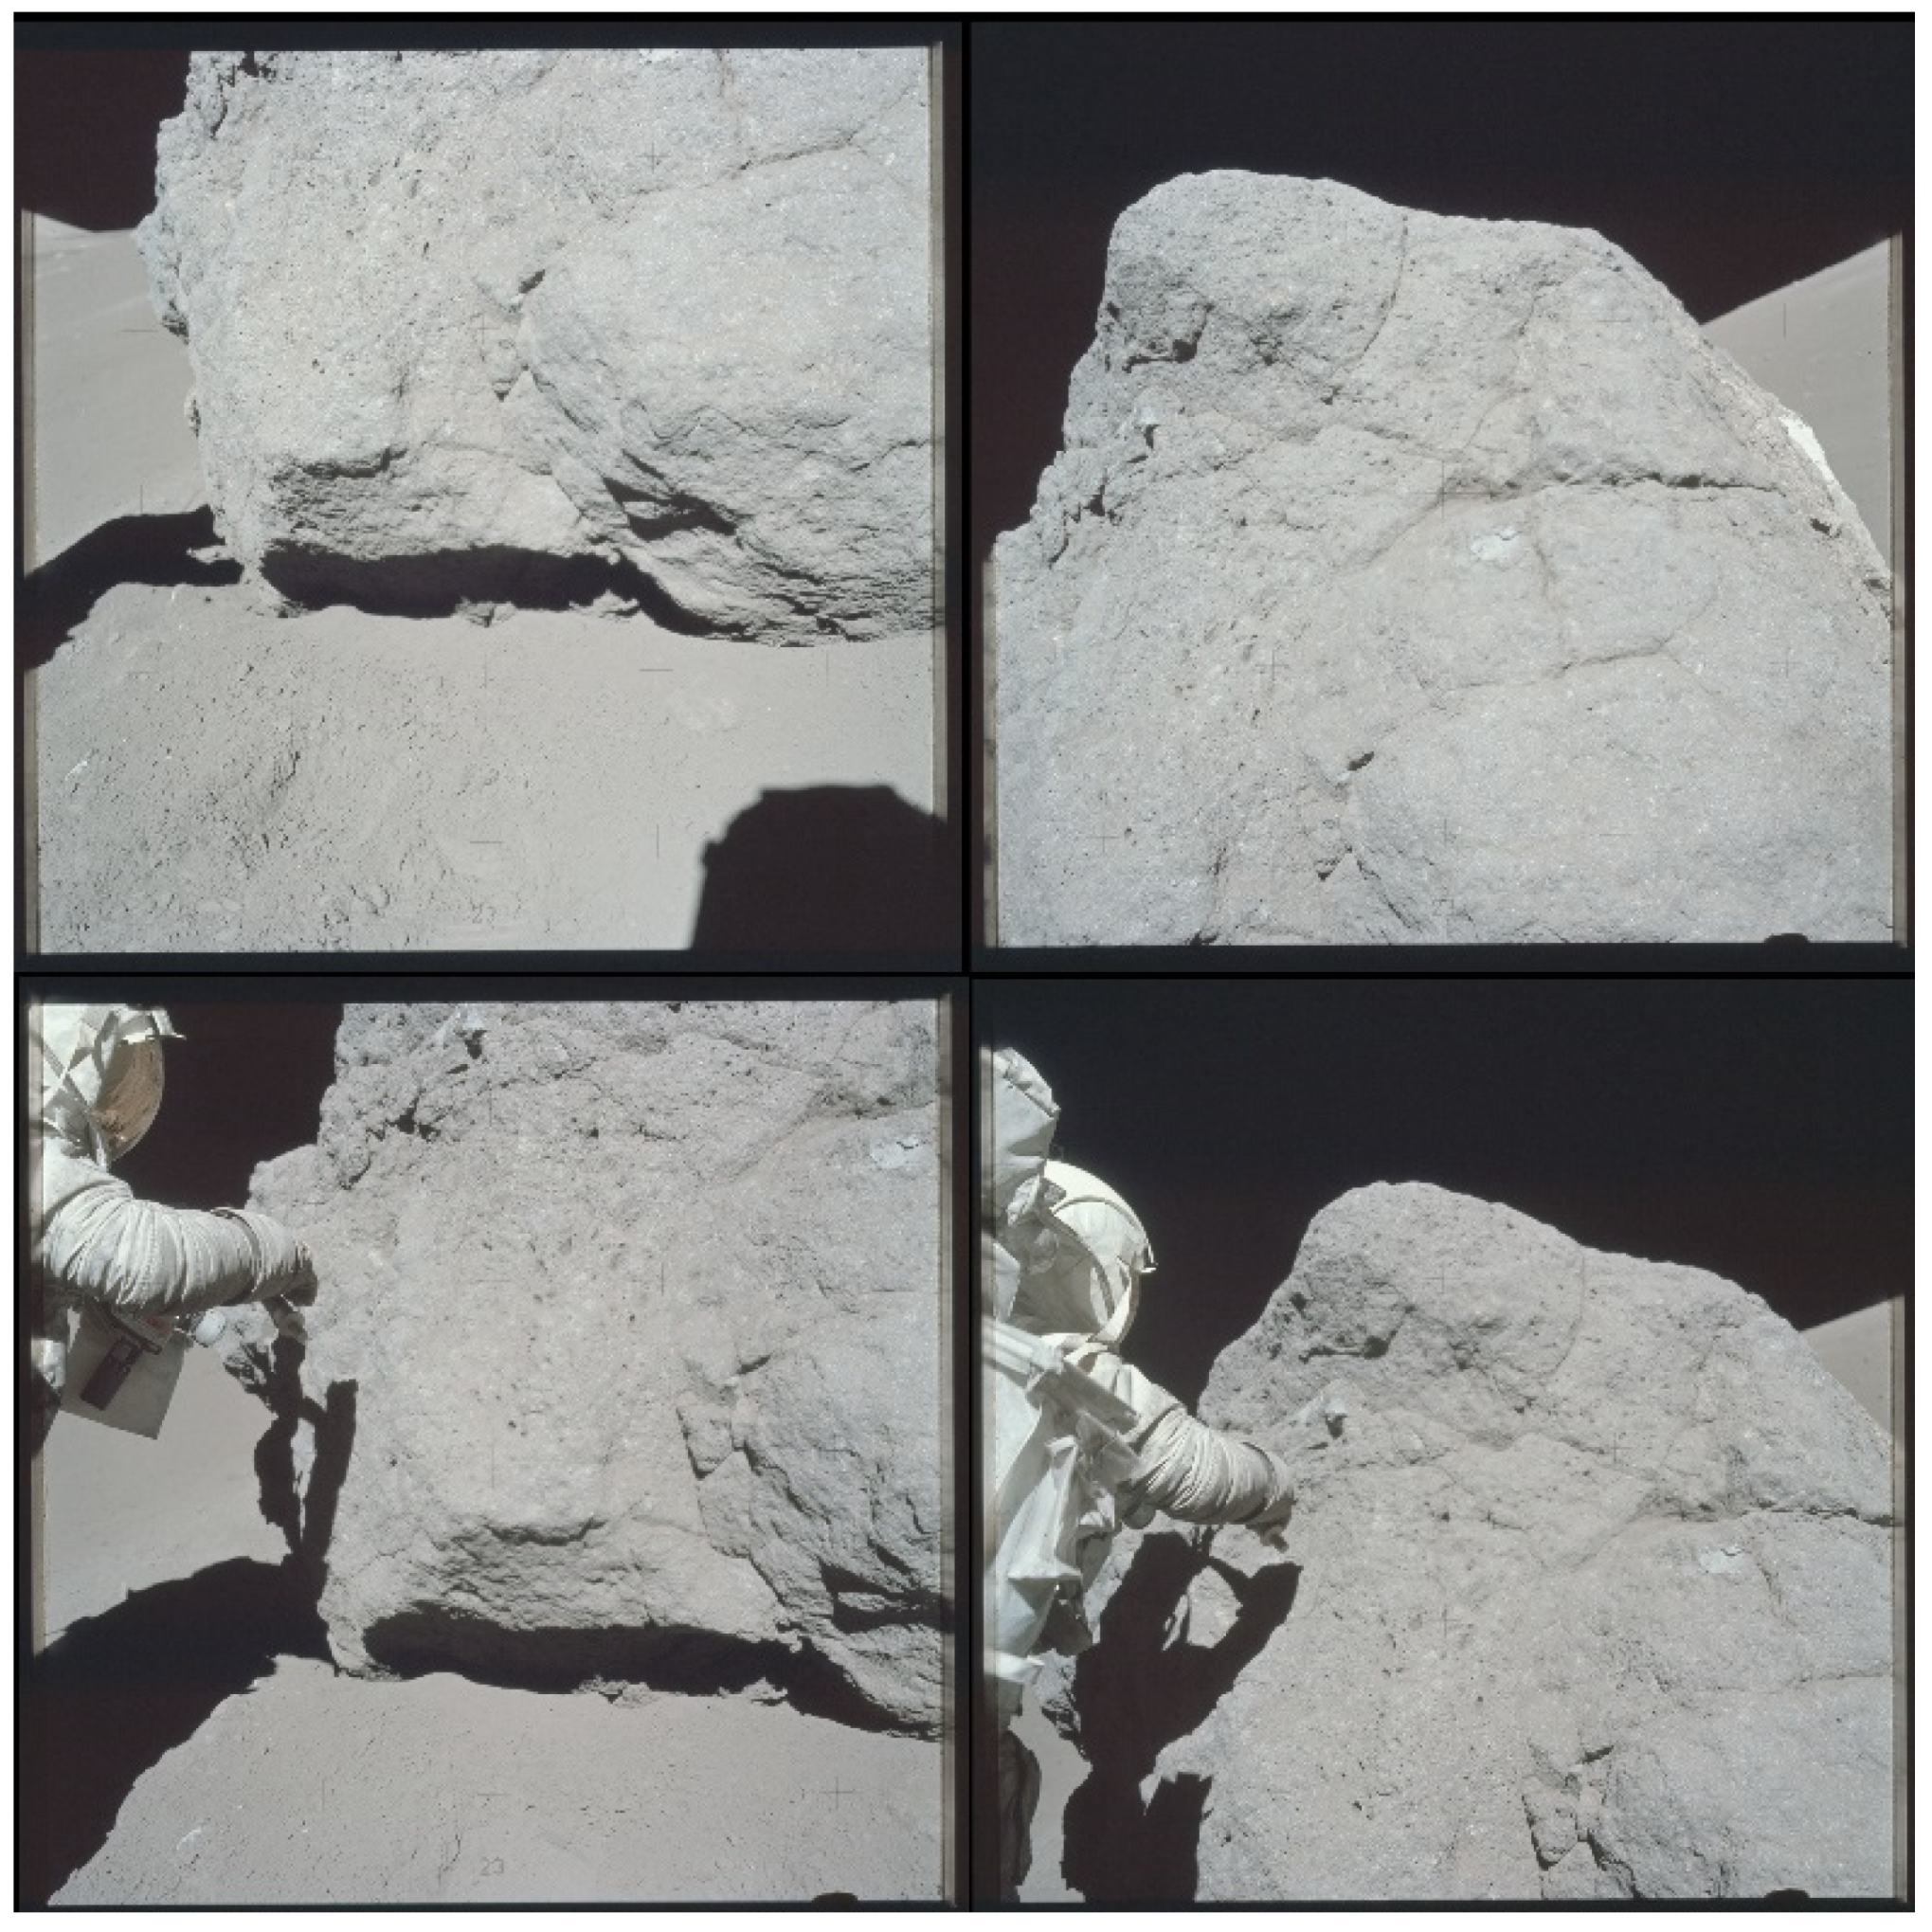
2.2. The Hasselblad Surface Image Data Set
2.3. Structure from Motion Principle and Software Choice
3. Results
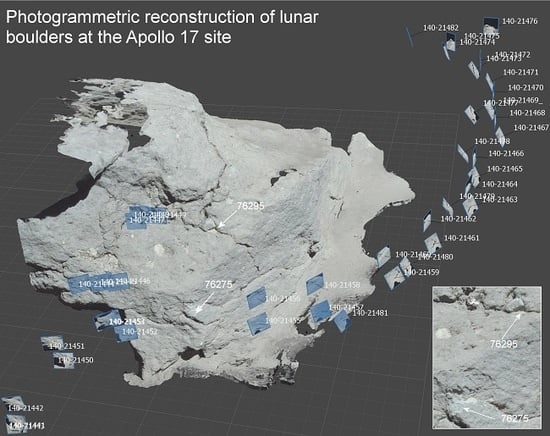
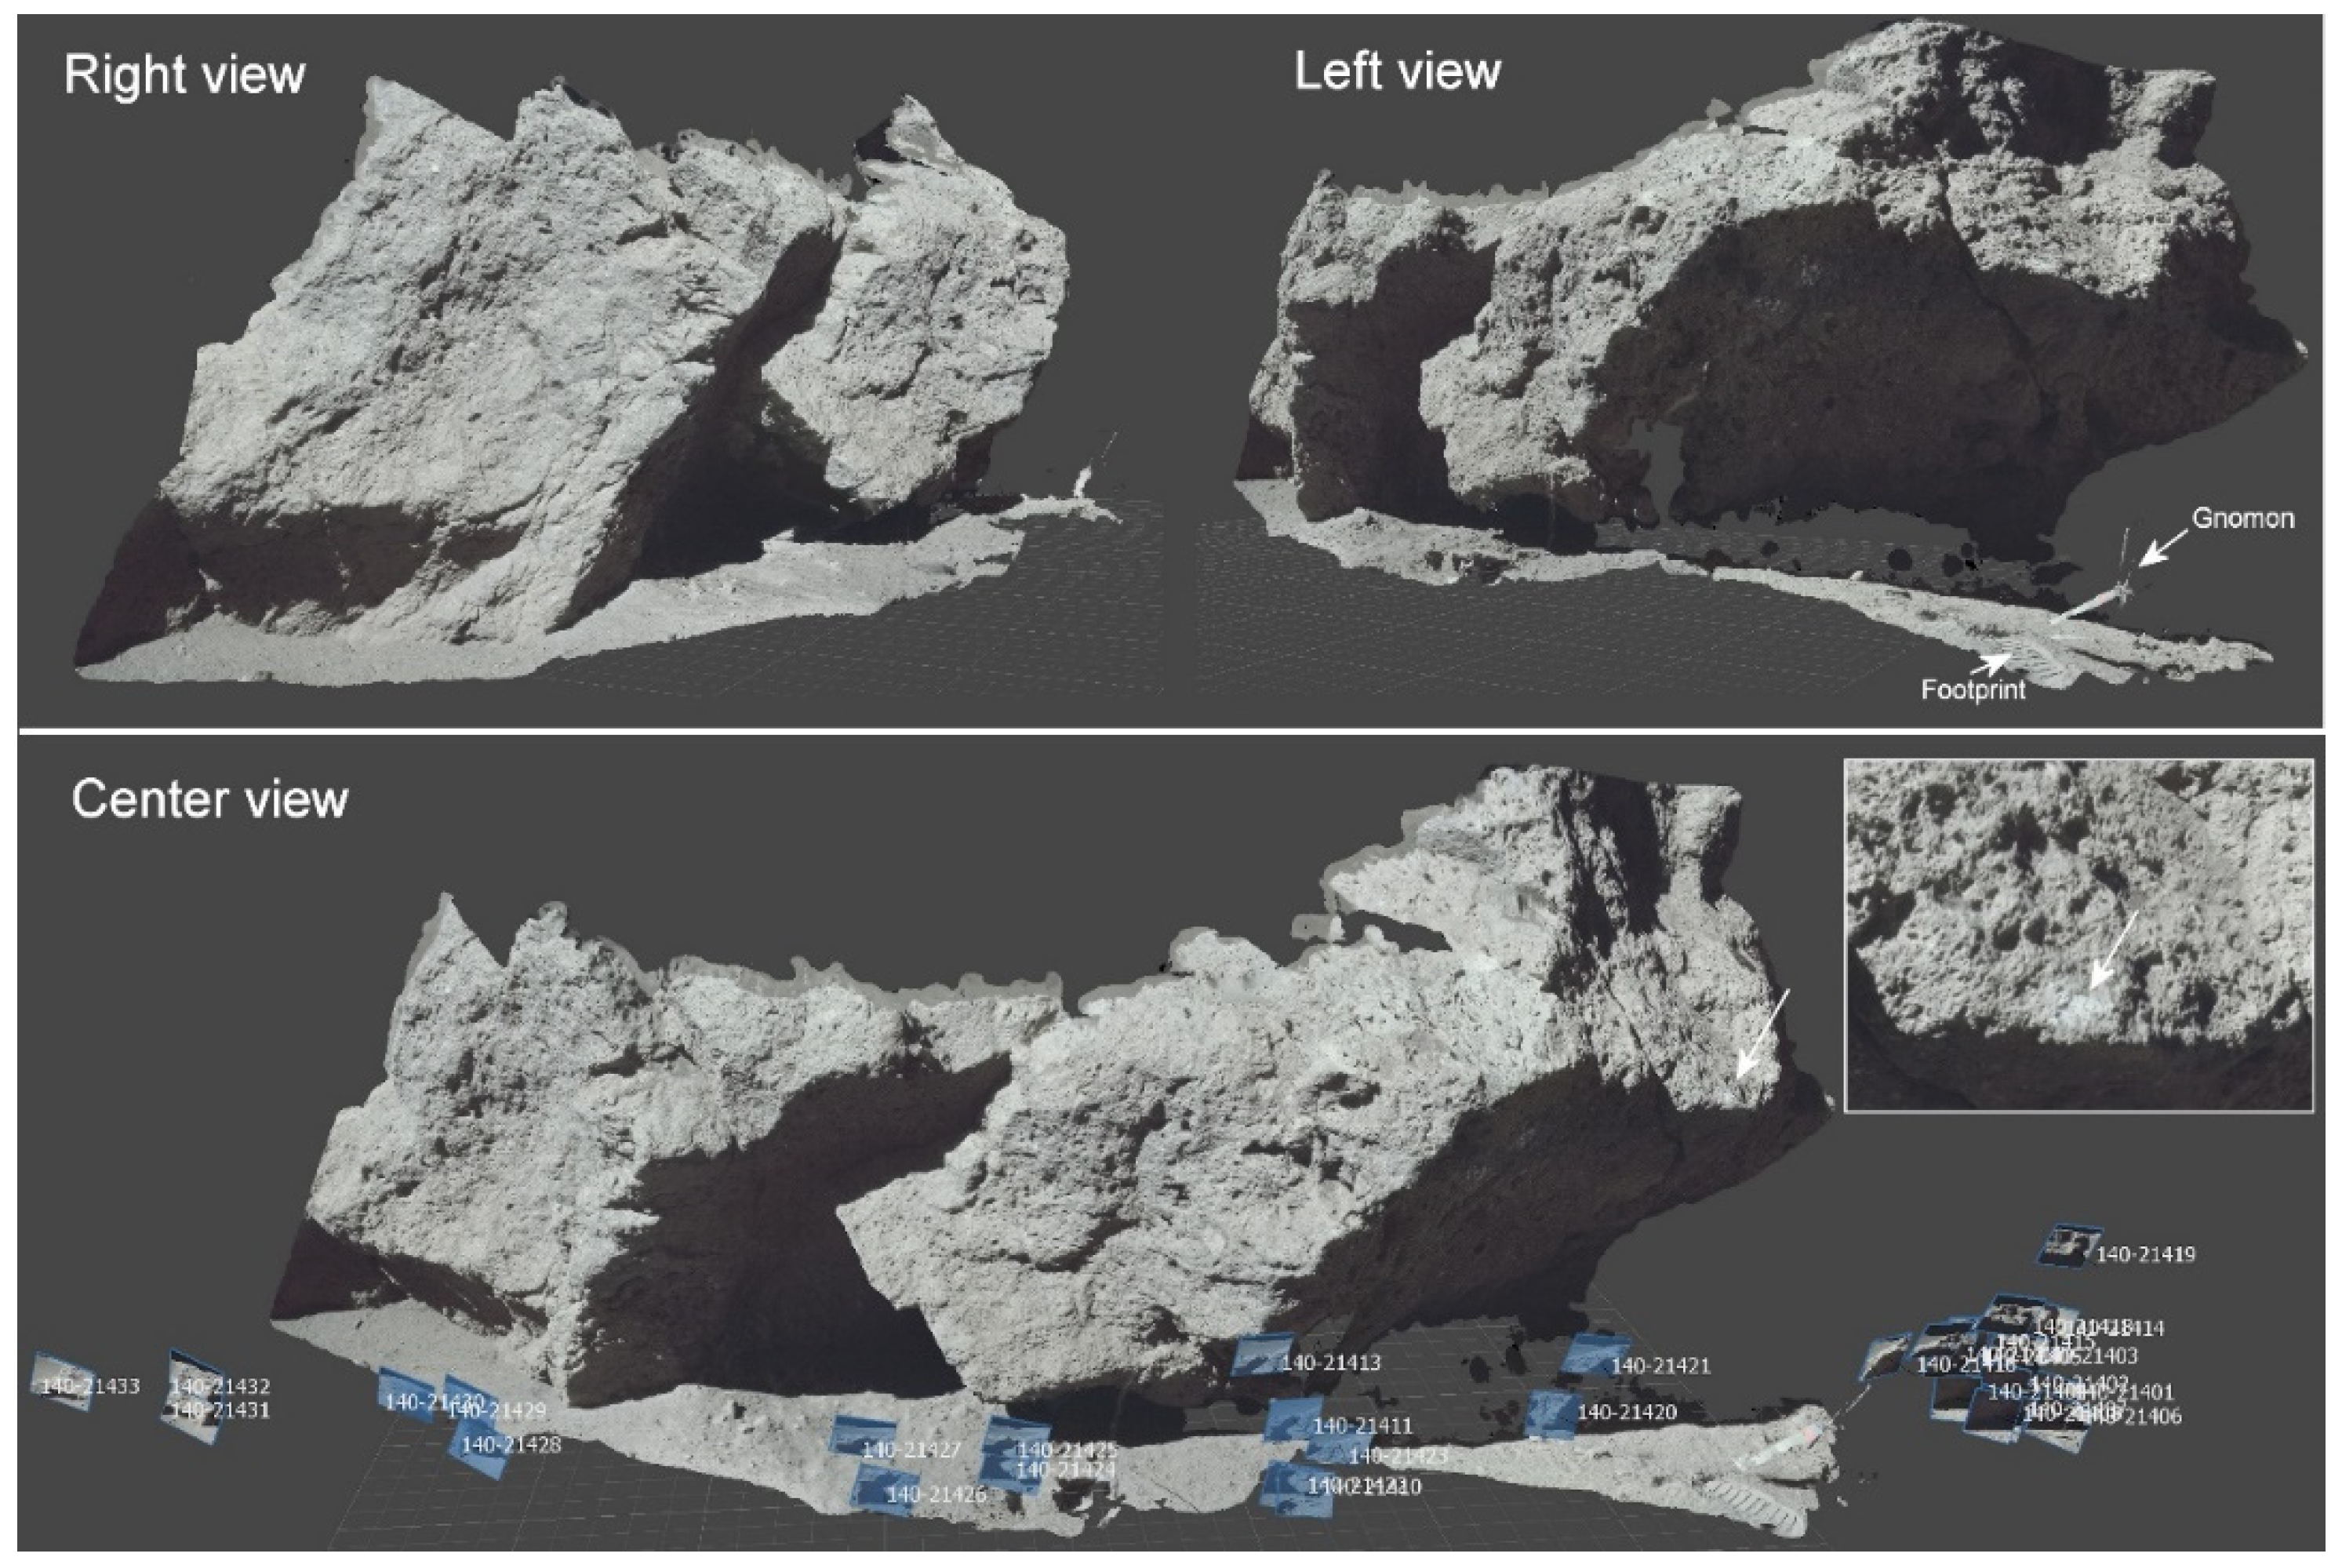
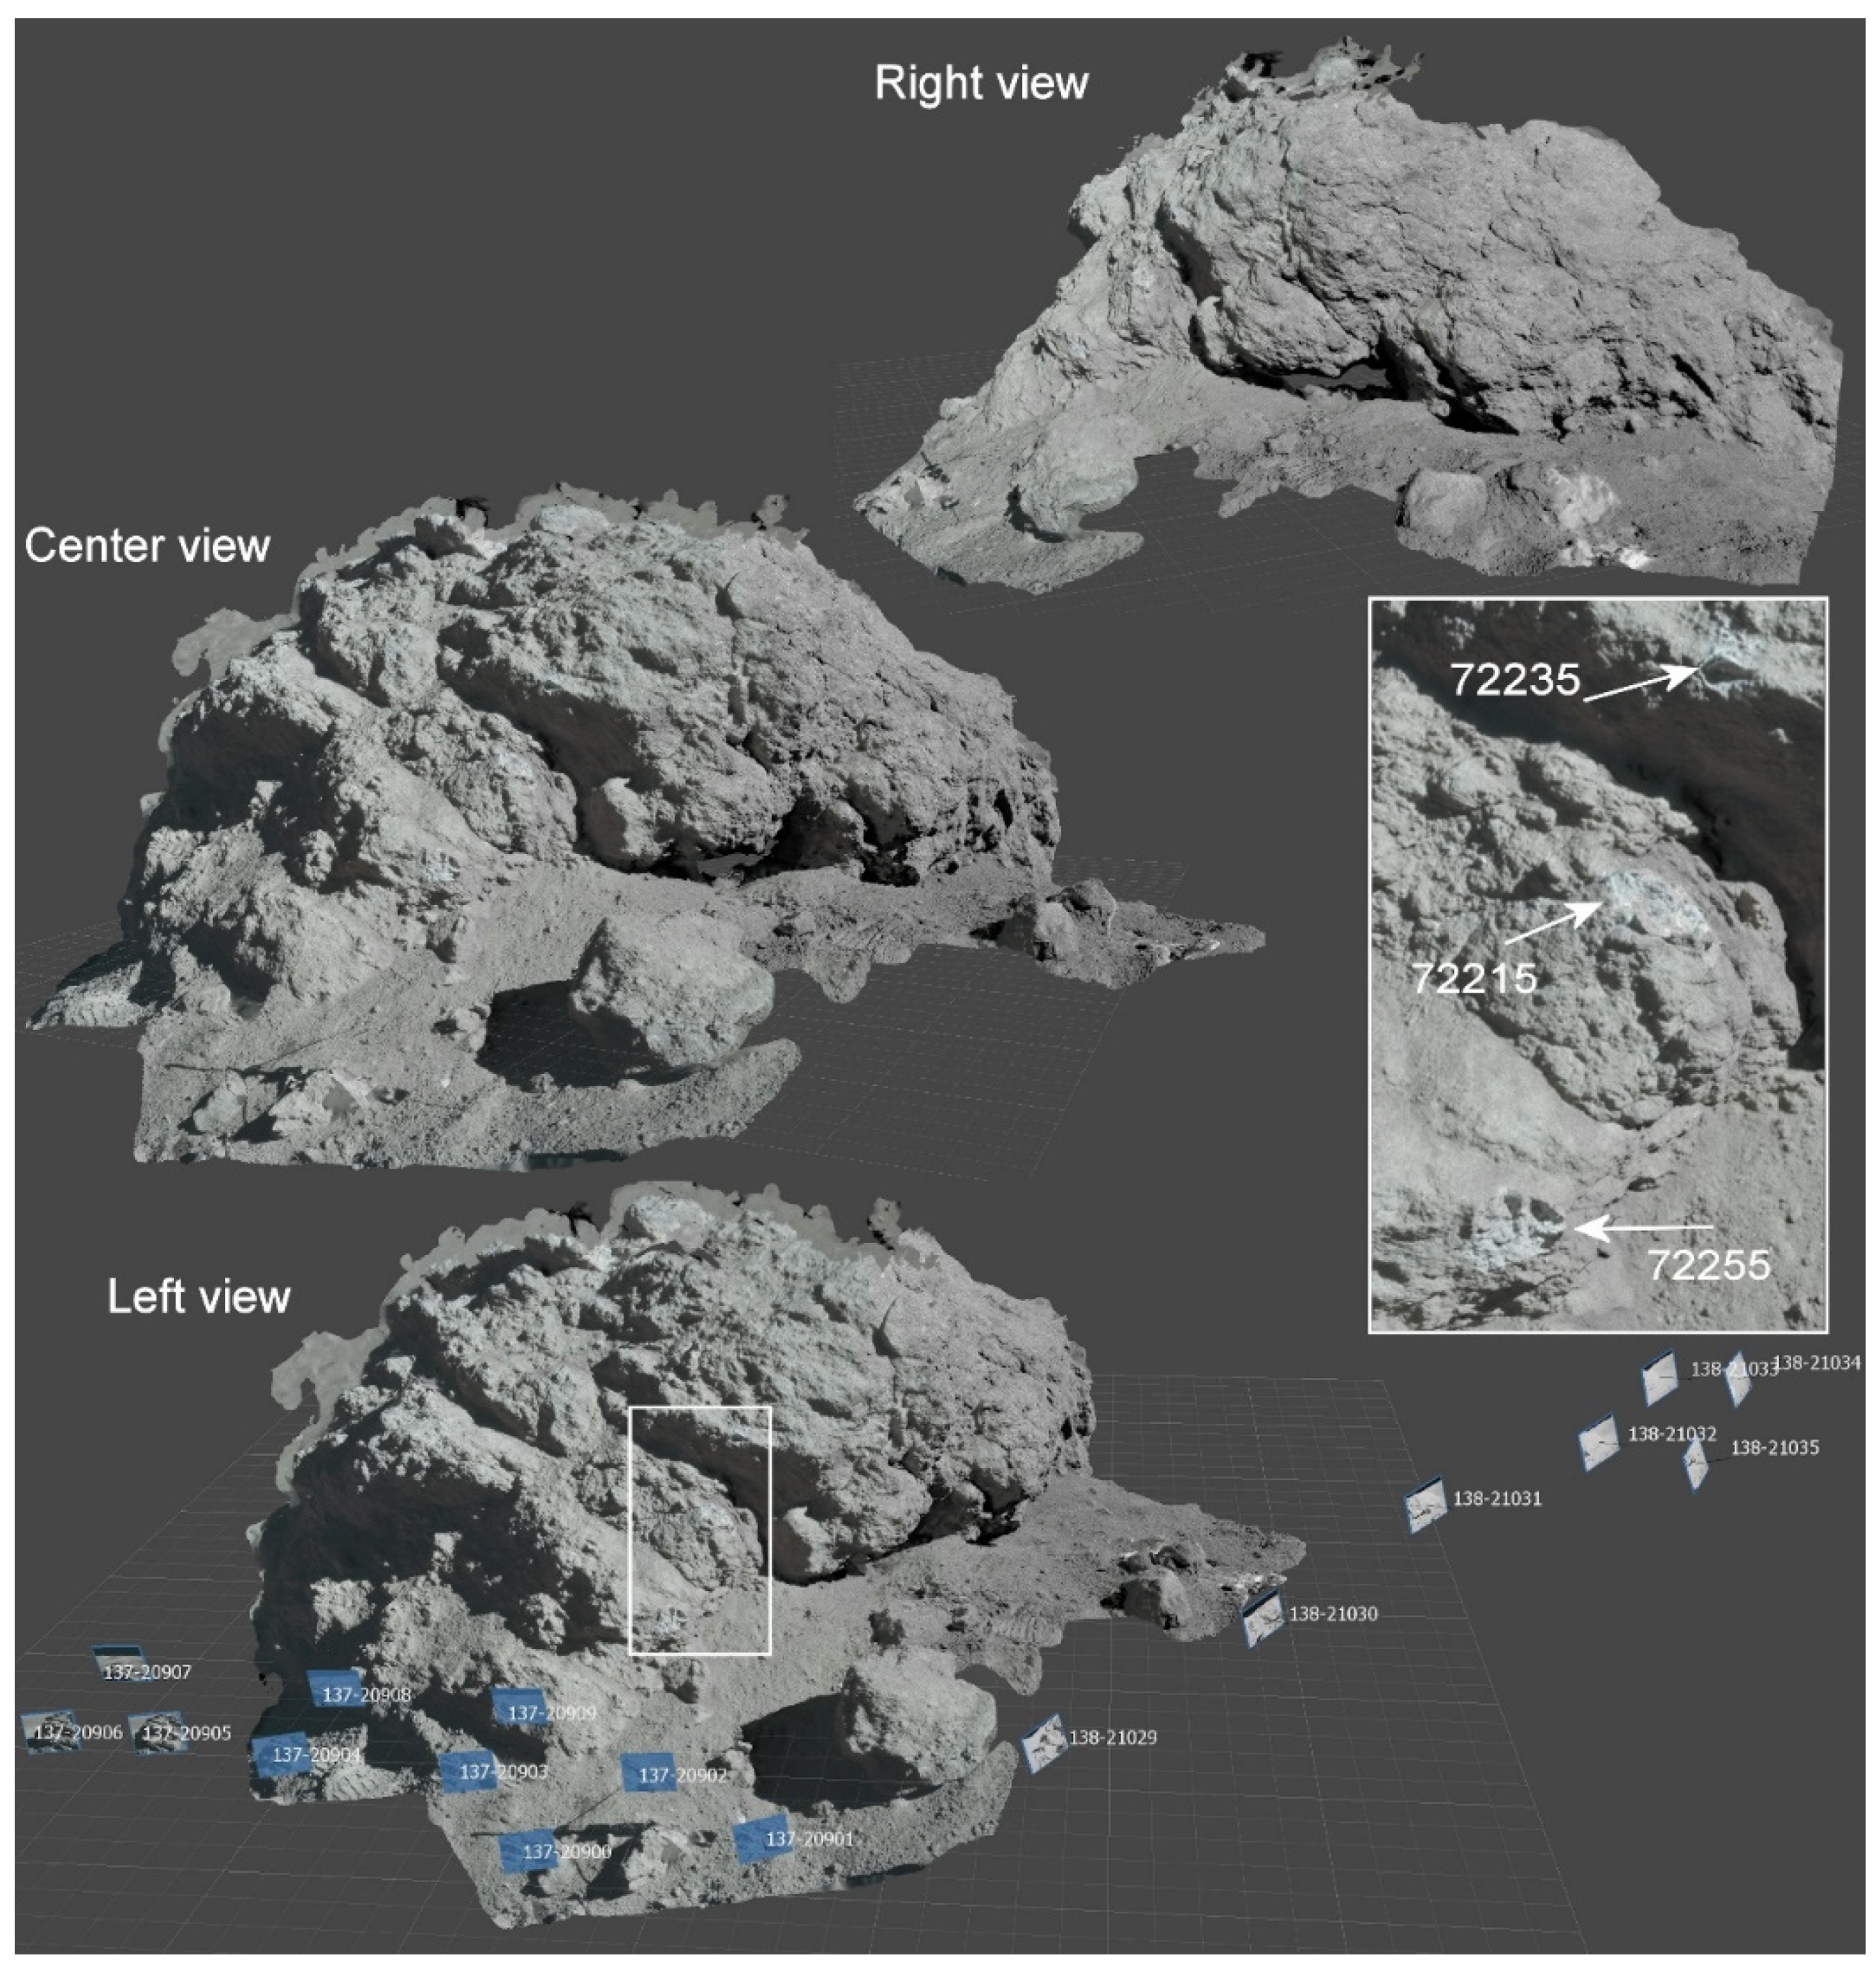
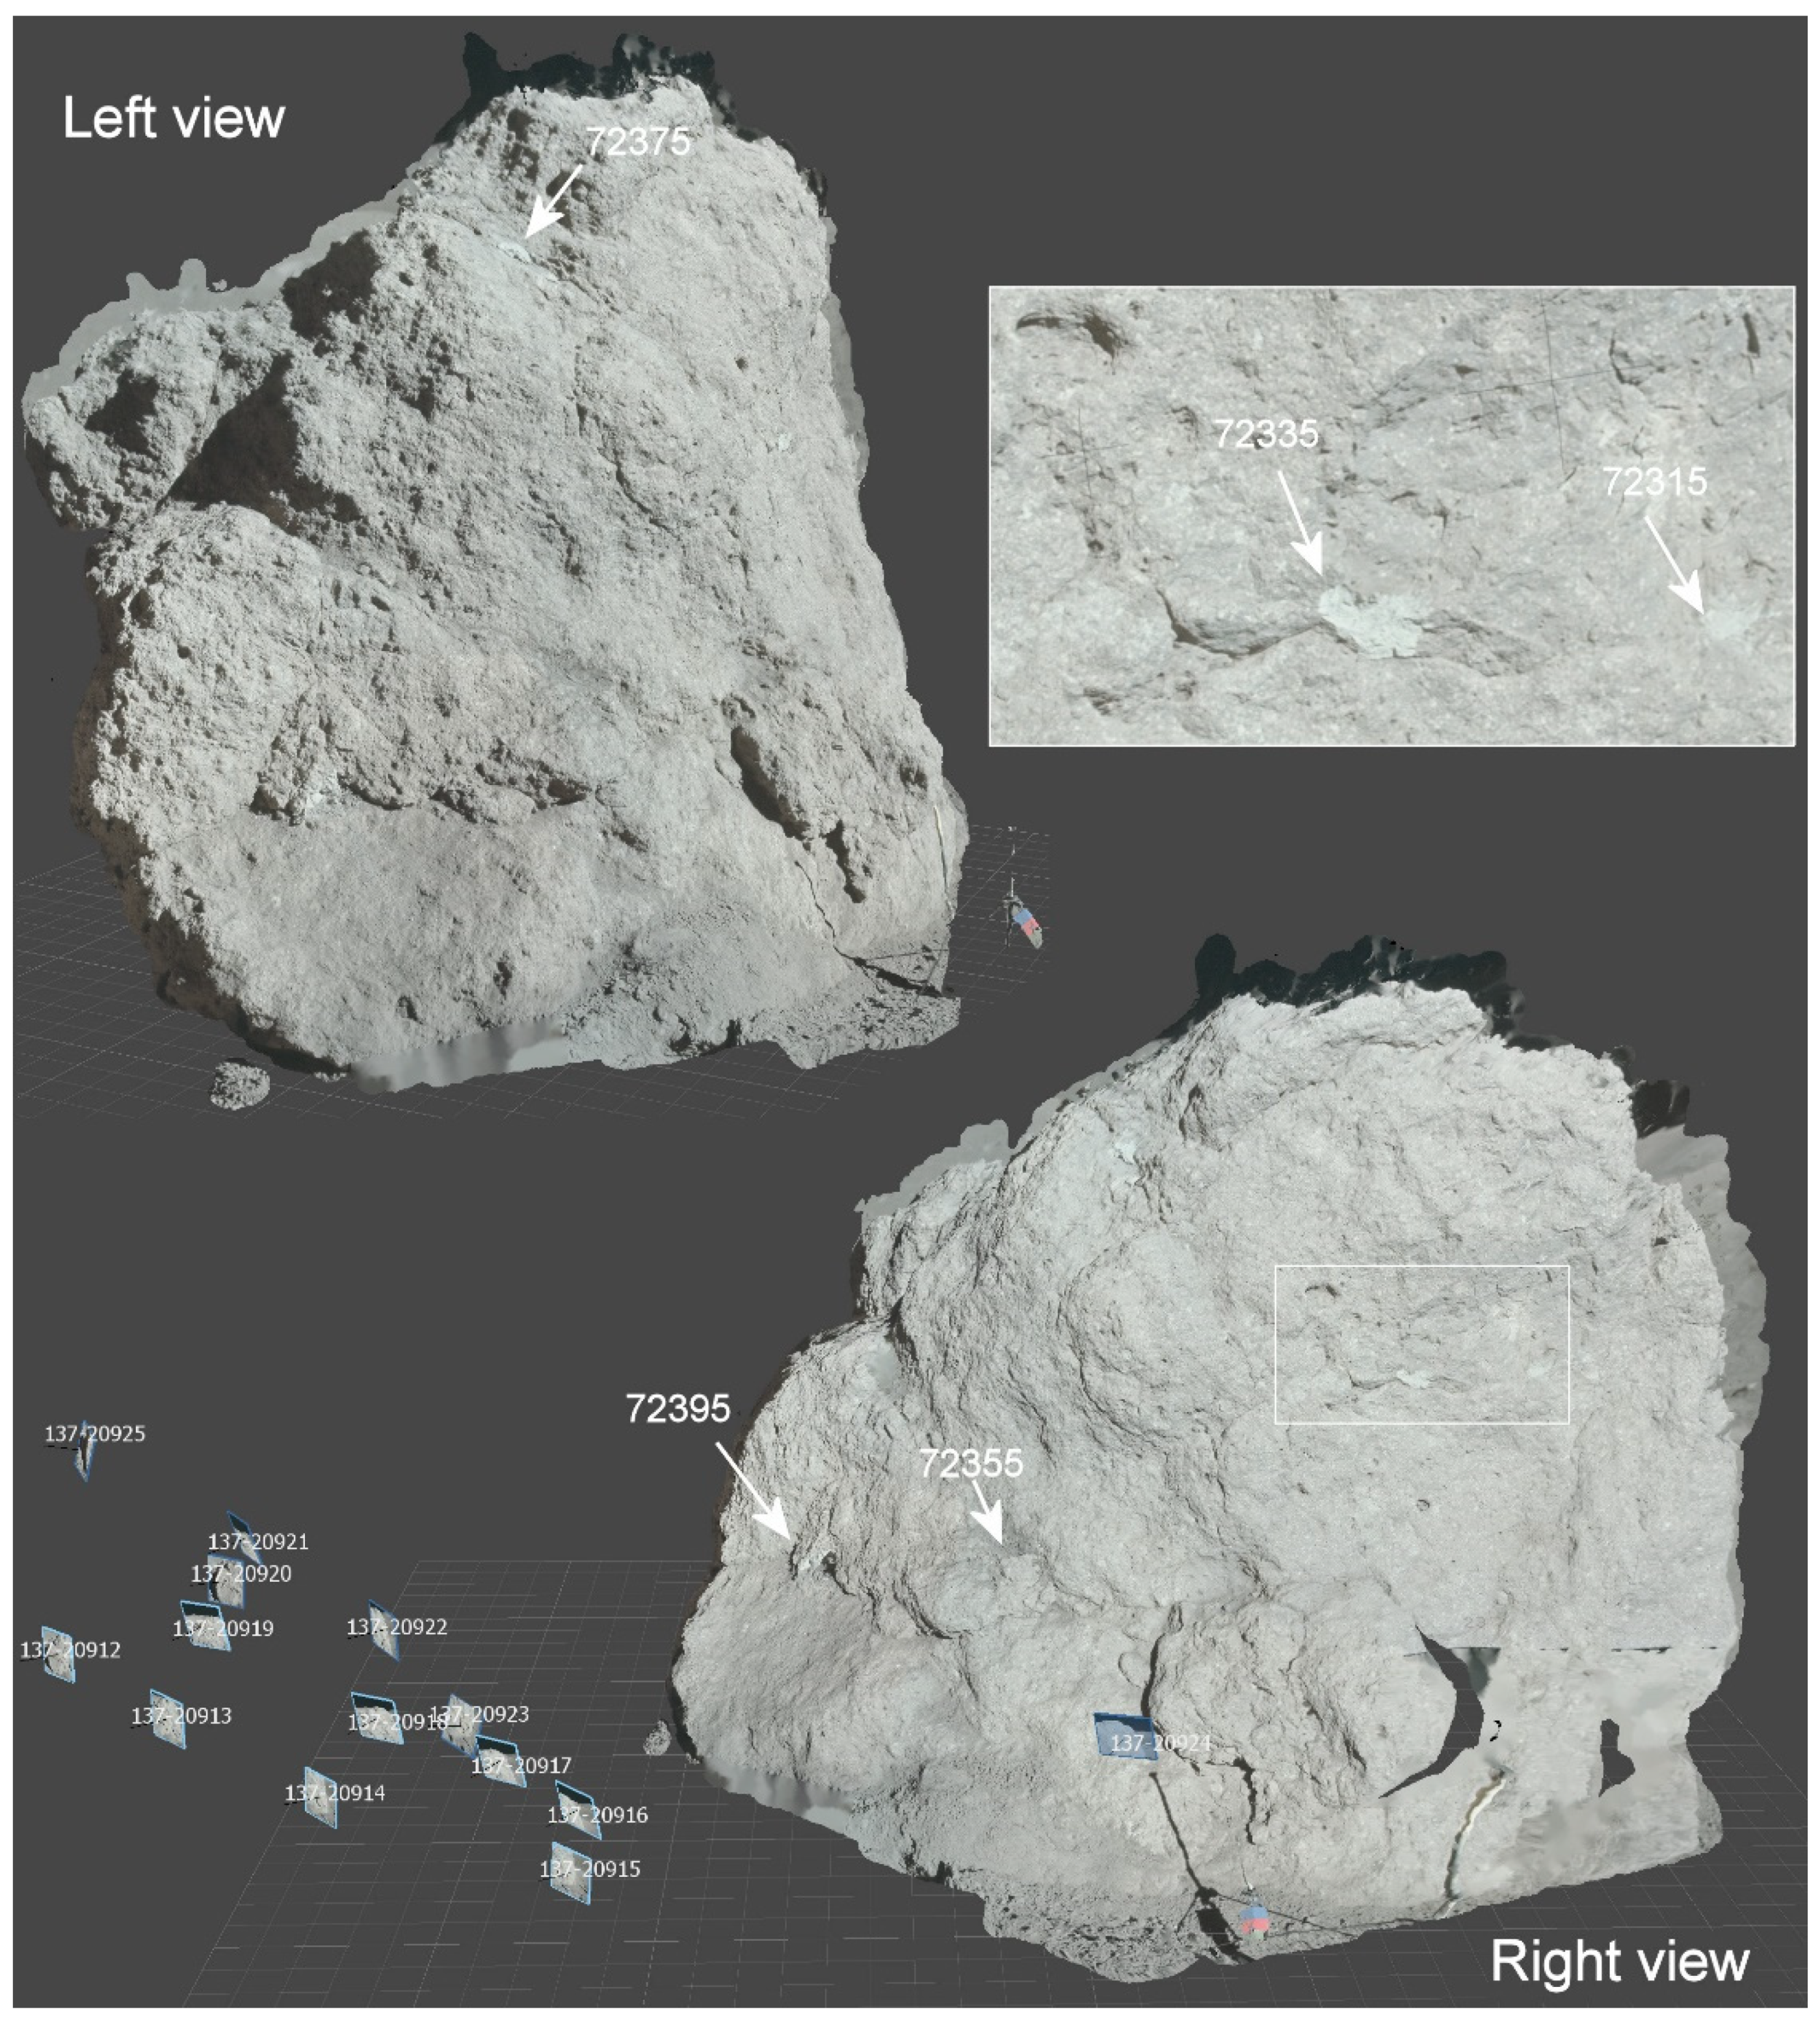
3.1. Three-Dimensional Reconstruction of the Station 7 Boulder
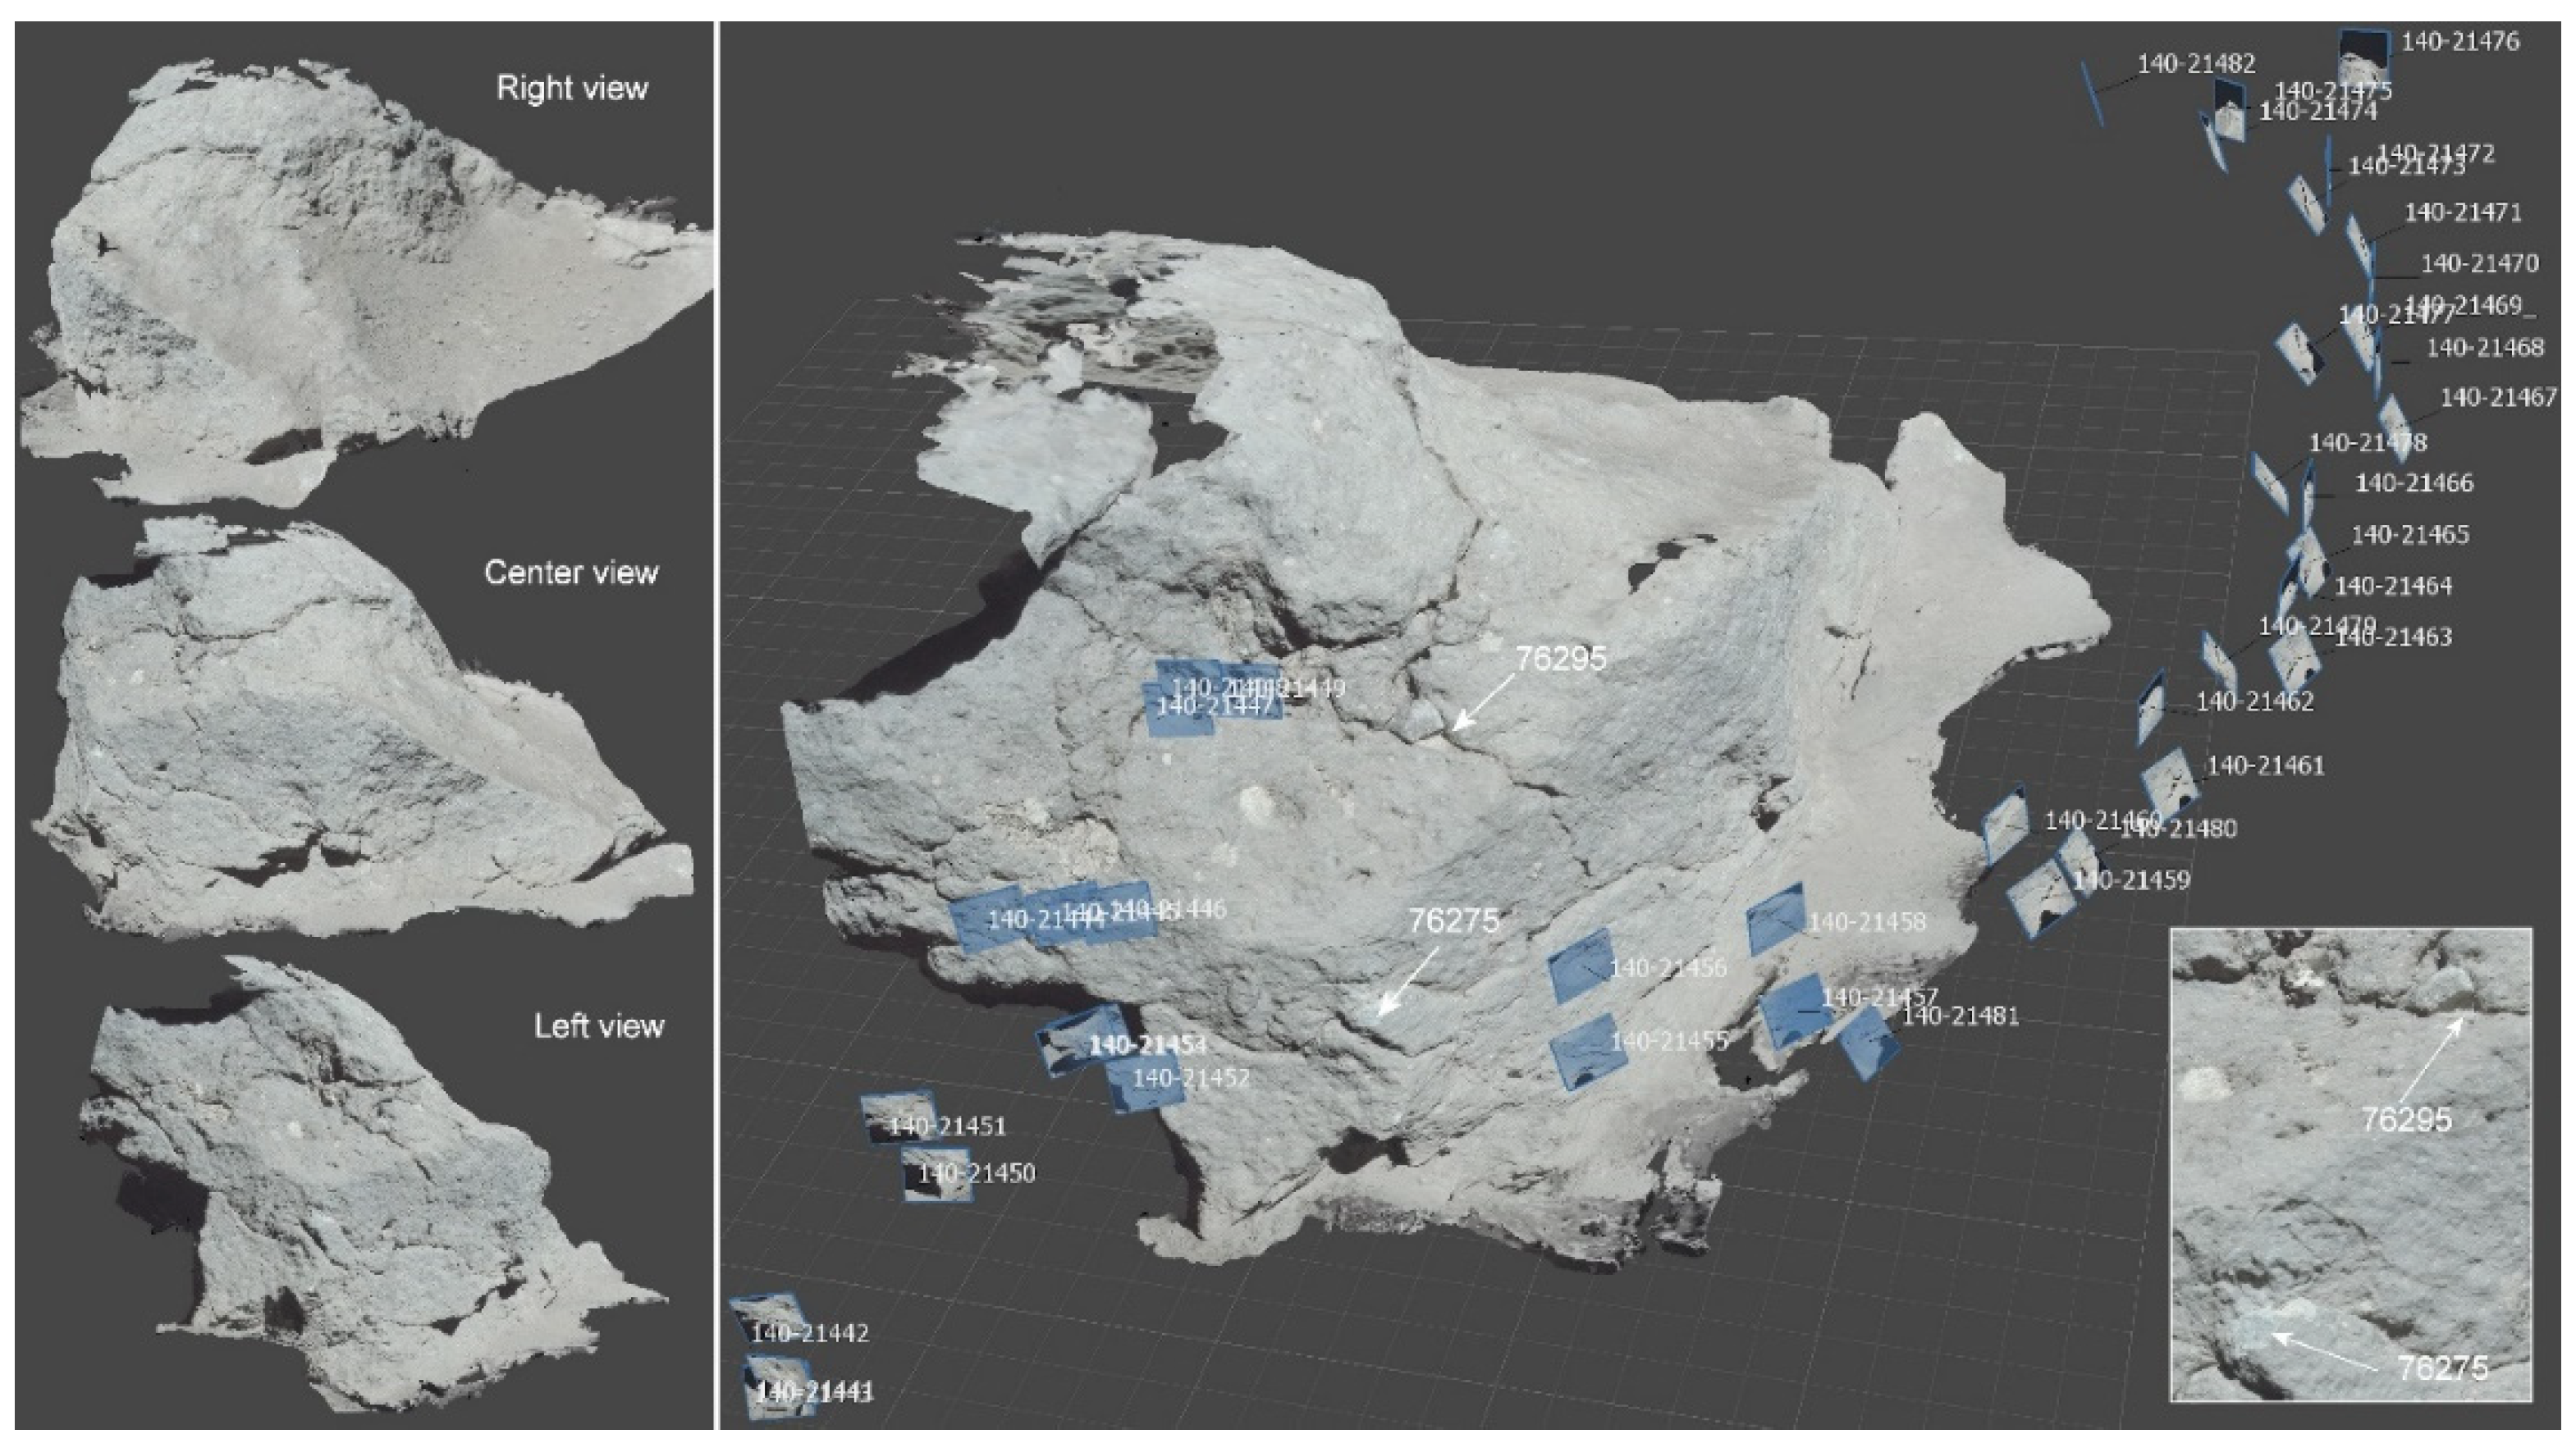
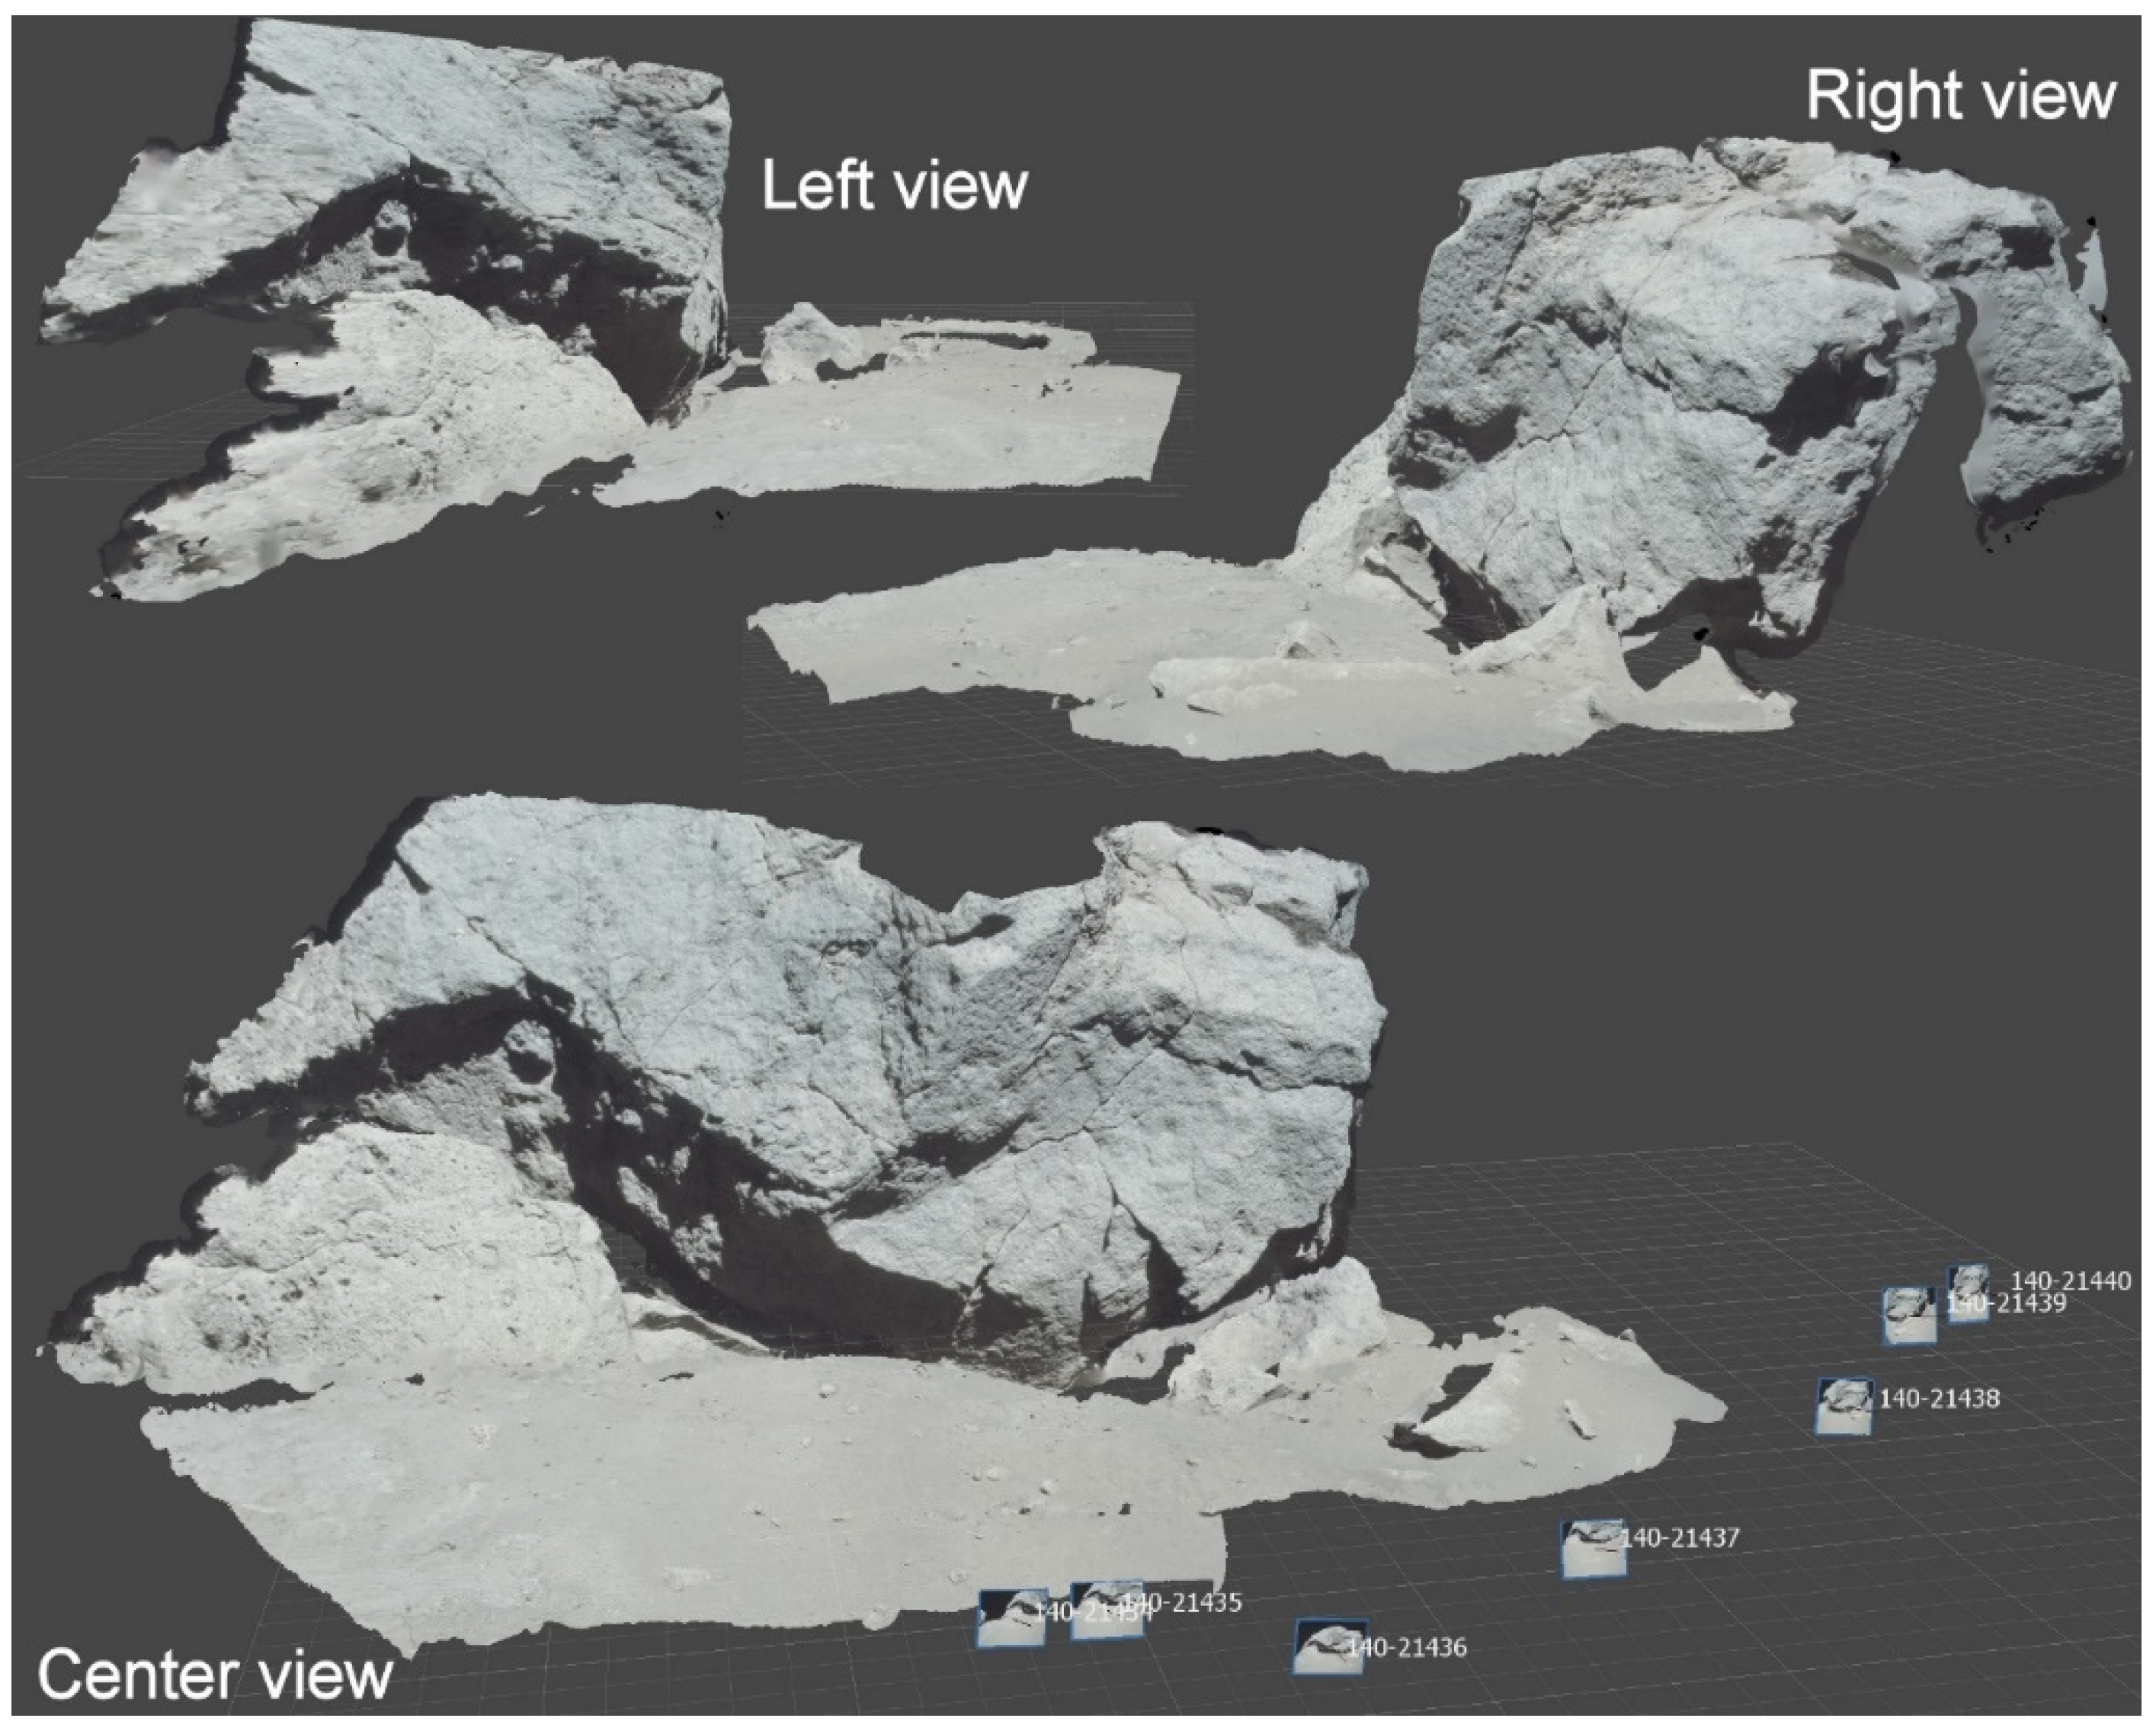
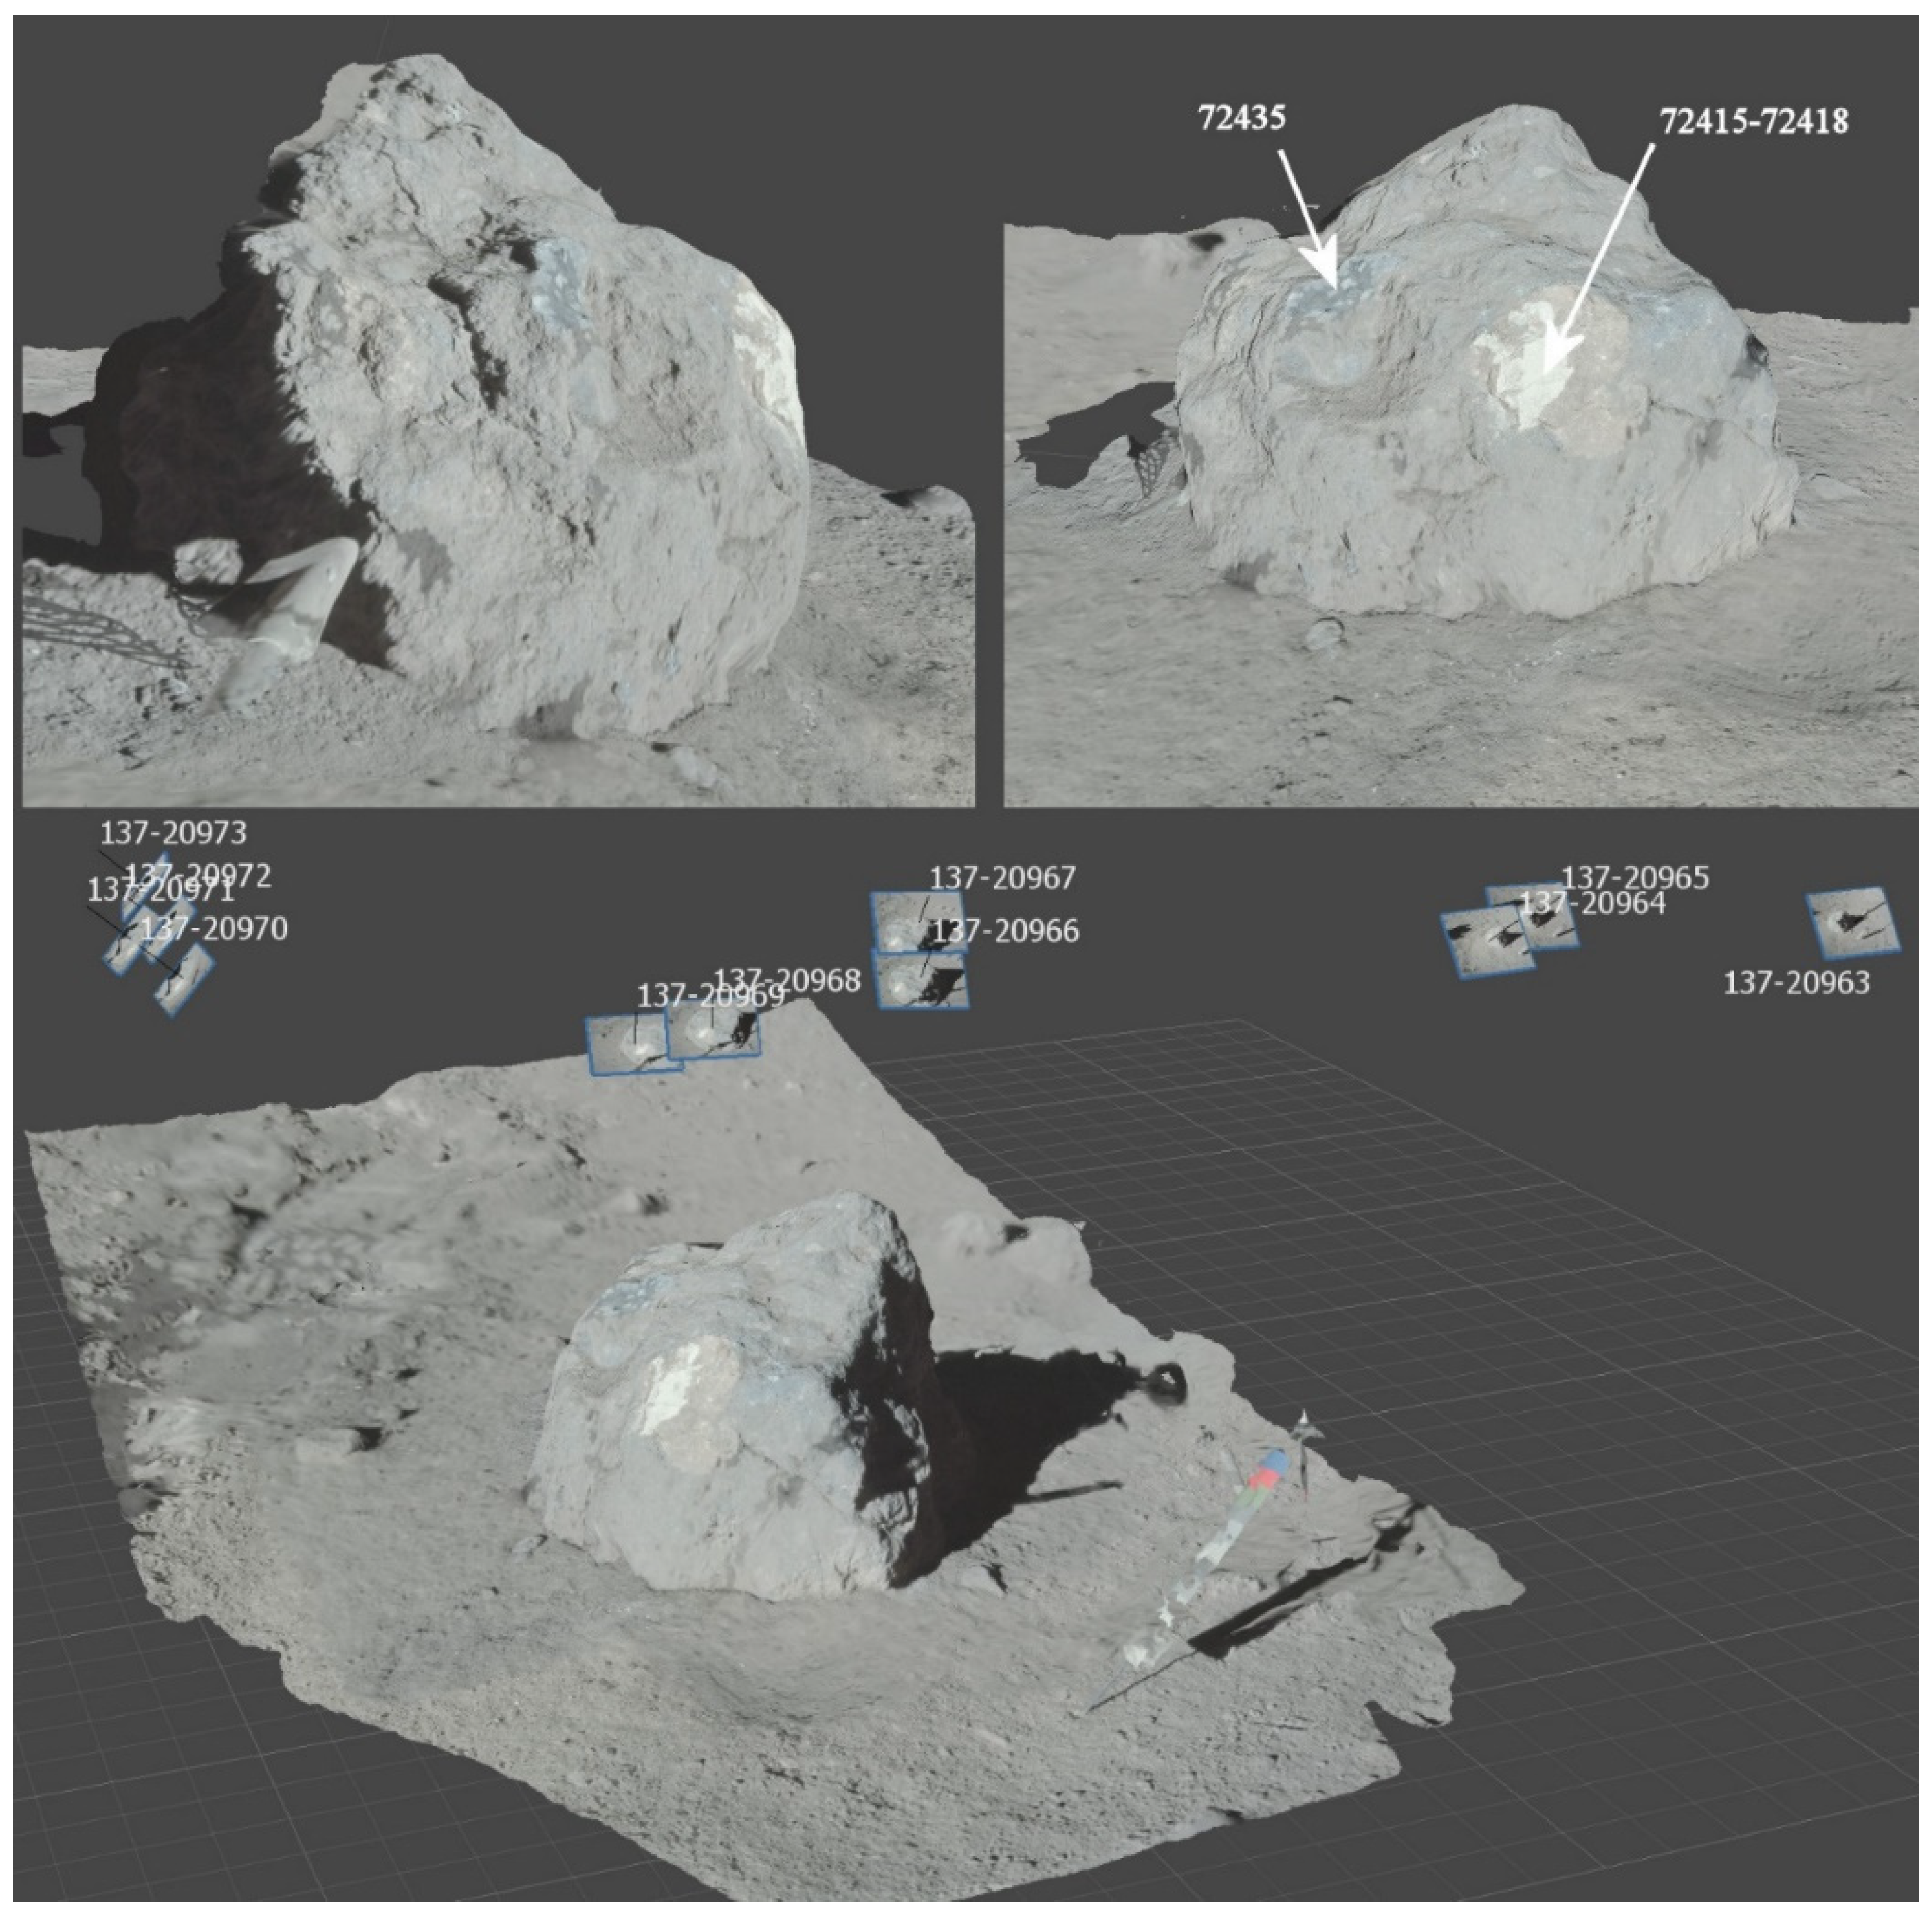
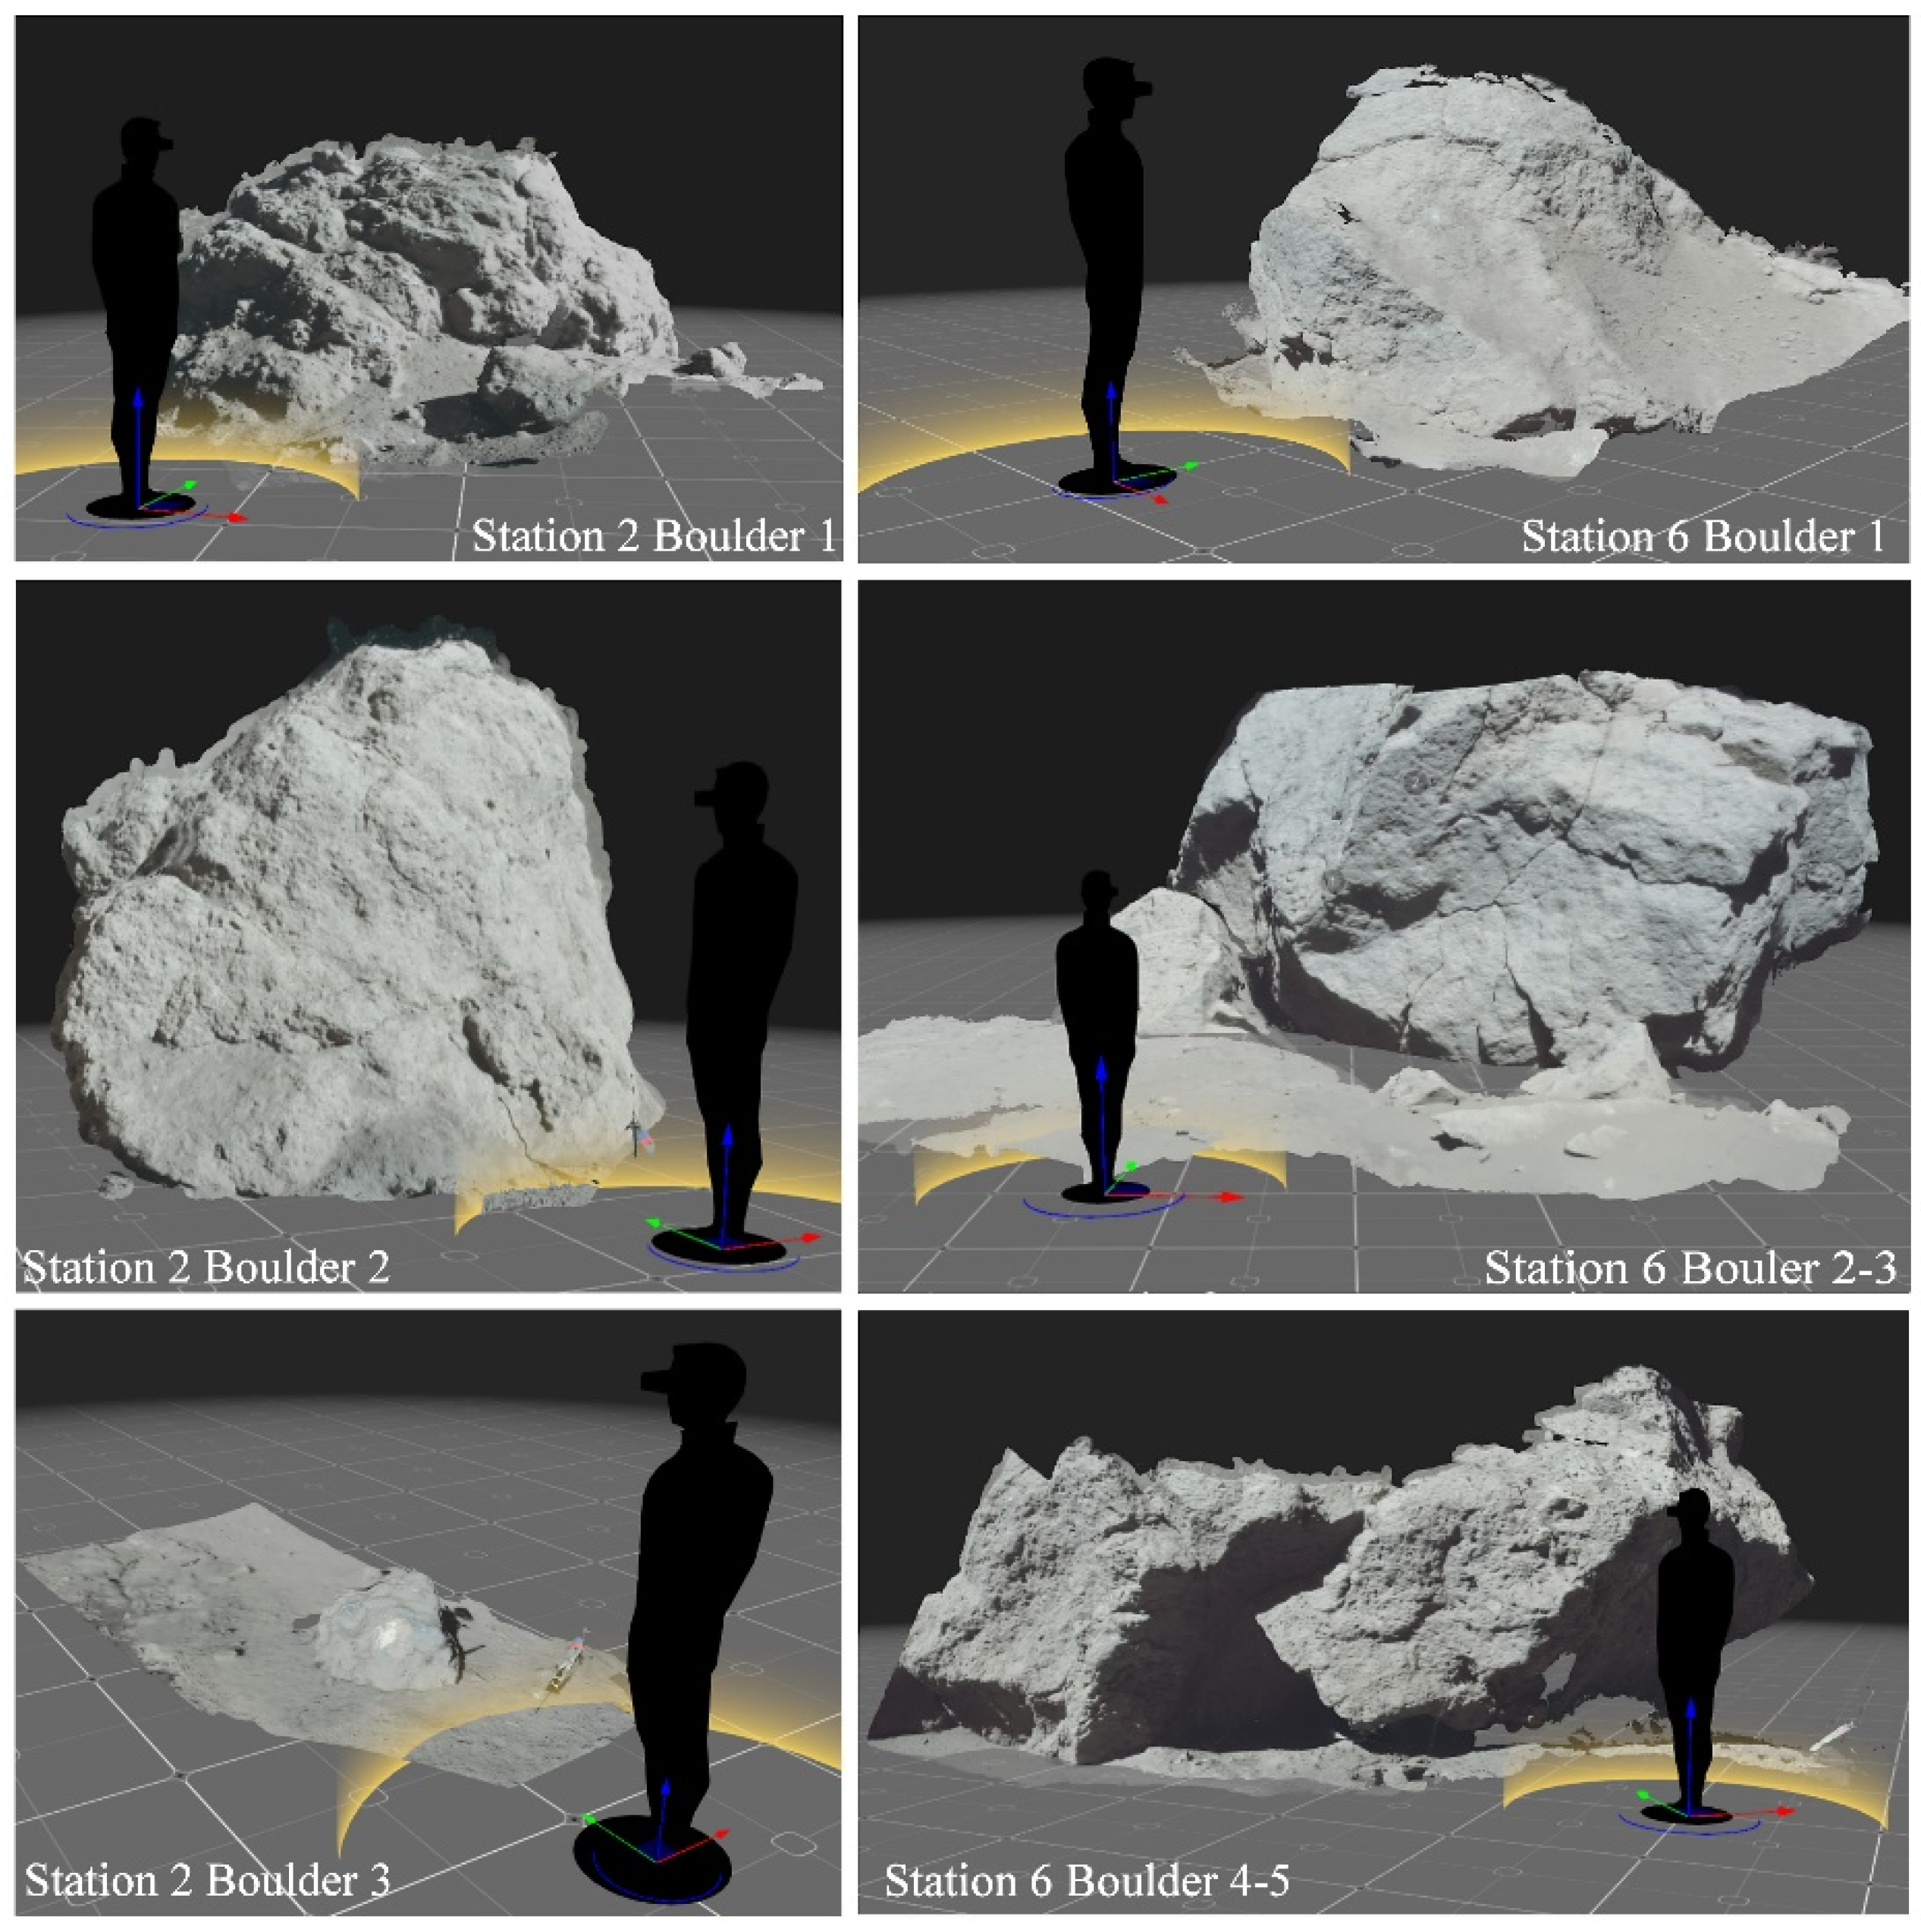
3.2. Three-Dimensional Reconstruction of the Station 6 Boulders
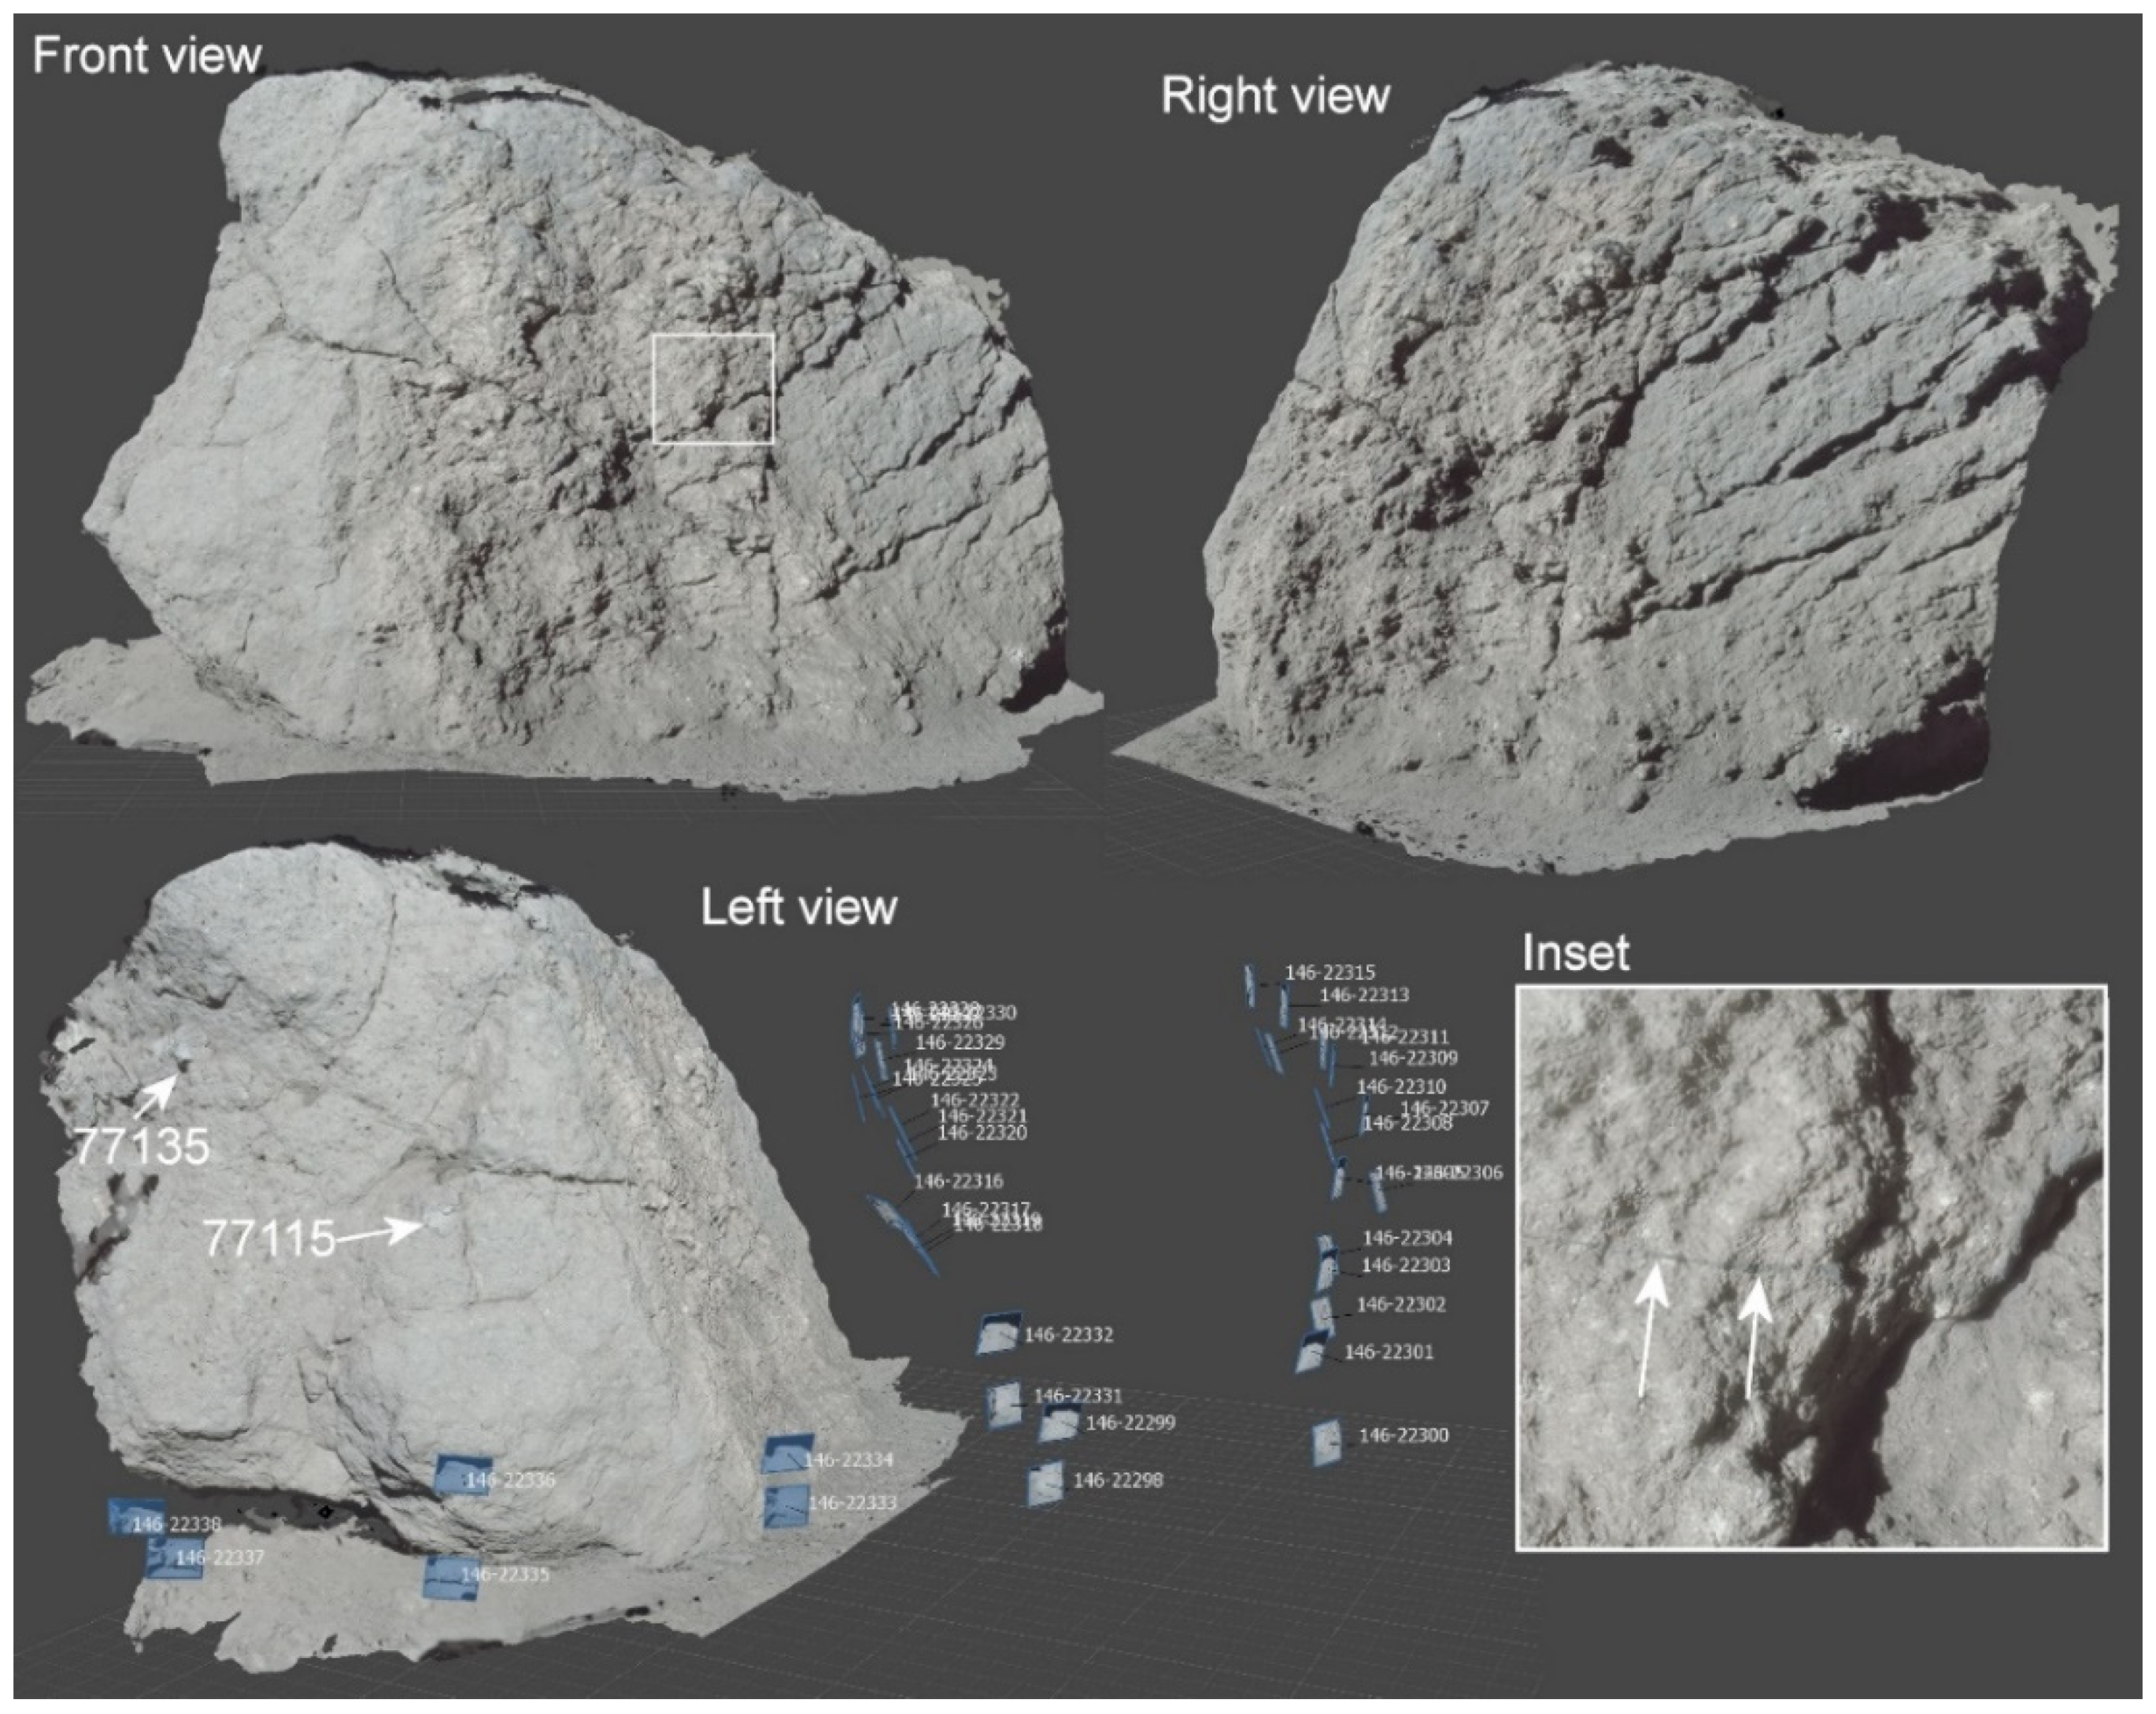
3.3. Three-Dimensional Reconstruction of the Station 2 Boulders
3.4. Integration into Virtual Reality of the 3-D Models
3.4.1. Publication of the Models on a Web-Based Platform
3.4.2. Integration into a Game Engine
4. Discussion and Future Work
5. Conclusions
Author Contributions
Funding
Acknowledgments
Conflicts of Interest
References
- McGreevy, M.W. Virtual reality and planetary exploration. In Virtual Reality; Elsevier: Amsterdam, The Netherlands, 1993; pp. 163–197. ISBN 0-12-745045-9. [Google Scholar]
- Ullman, S. The interpretation of structure from motion. Proc. R. Soc. Lond. Ser. B Biol. Sci. 1979, 203, 405–426. [Google Scholar] [CrossRef]
- Verhoeven, G. Taking computer vision aloft-archaeological three-dimensional reconstructions from aerial photographs with photoscan. Archaeol. Prospect. 2011, 18, 67–73. [Google Scholar] [CrossRef]
- Favalli, M.; Fornaciai, A.; Isola, I.; Tarquini, S.; Nannipieri, L. Multiview 3D reconstruction in geosciences. Comput. Geosci. 2012, 44, 168–176. [Google Scholar] [CrossRef] [Green Version]
- Arbuées, P.; García-Sellés, D.; Granado, P.; Lopez-Blanco, M.; Muñoz, J. A method for producing photorealistic digital outcrop models. In Proceedings of the 74th EAGE Conference and Exhibition Incorporating EUROPEC, Copenhagen, Denmark, 4–7 June 2012; p. cp-293-00121, Abstract #D029. [Google Scholar]
- Tavani, S.; Granado, P.; Corradetti, A.; Girundo, M.; Iannace, A.; Arbués, P.; Muñoz, J.A.; Mazzoli, S. Building a virtual outcrop, extracting geological information from it, and sharing the results in Google Earth via OpenPlot and Photoscan: An example from the Khaviz Anticline (Iran). Comput. Geosci. 2014, 63, 44–53. [Google Scholar] [CrossRef]
- Ostwald, A.; Hurtado, J. 3D models from structure-from-motion photogrammetry using Mars science laboratory images: Methods and implications. In Proceedings of the 48th Lunar and Planetary Science Conference, The Woodlands, TX, USA, 20–24 March 2017. LPI Contribution No. 1964, id.1787. [Google Scholar]
- Schmitt, H.H.; Petro, N.E.; Wells, R.A.; Robinson, M.S.; Weisss, B.P.; Mercer, C.M. Revisiting the field geology of Taurus-Littrow. Icarus 2017, 298, 2–33. [Google Scholar] [CrossRef]
- Civet, F.; Le Mouélic, S.; Le Menn, E.; Beaunay, S. Using Virtual Reality for Outreach Purposes in Planetology. In Proceedings of the American Astronomical Society, DPS meeting #48, Washington, DC, USA, 16–21 October 2016. id.419.10. [Google Scholar]
- Le Mouélic, S.; L’Haridon, J.; Civet, F.; Mangold, N.; Triantafyllou, A.; Massé, M.; Le Menn, E.; Beaunay, S. Using virtual reality to investigate geological outcrops on planetary surfaces. In Proceedings of the 20th EGU General Assembly, EGU2018, Conference held, Vienna, Austria, 4–13 April 2018; p. 13366. [Google Scholar]
- Triantafyllou, A.; Watlet, A.; Le Mouélic, S.; Camelbeeck, T.; Civet, F.; Kaufmann, O.; Quinif, Y.; Vandycke, S. 3-D digital outcrop model for analysis of brittle deformation and lithological mapping (Lorette cave, Belgium). J. Struct. Geol. 2019, 120, 55–66. [Google Scholar] [CrossRef]
- Caravaca, G.; Le Mouélic, S.; Mangold, N.; L’Haridon, J.; Le Deit, L.; Massé, M. 3D digital outcrop model reconstruction of the Kimberley outcrop (Gale crater, Mars) and its integration into Virtual Reality for simulated geological analysis. Planet. Space Sci. 2020, 182, 104808. [Google Scholar] [CrossRef]
- Mat, R.C.; Shariff, A.R.M.; Zulkifli, A.N.; Rahim, M.S.M.; Mahayudin, M.H. Using game engine for 3D terrain visualisation of GIS data: A review. In IOP Conference Series: Earth and Environmental Science; IOP Publishing: Bristol, UK, 2014; Volume 20, p. 012037. [Google Scholar]
- Nesbit, P.R.; Boulding, A.D.; Hugenholtz, C.H.; Durkin, P.R.; Hubbard, S.M. Visualization and Sharing of 3D Digital Outcrop Models to Promote Open Science. GSA Today 2020, 30, 4–10. [Google Scholar] [CrossRef] [Green Version]
- Haase, I.; Wählisch, M.; Gläser, P.; Oberst, J.; Robinson, M. Coordinates and Maps of the Apollo 17 Landing Site. Earth Space Sci. 2019, 6, 59–95. [Google Scholar] [CrossRef]
- Wolfe, E.W.; Bailey, N.G.; Lucchitta, B.K.; Muehlberger, W.R.; Scott, D.H.; Sutton, R.L.; Wilshire, H.G. Geologic investigation of the Taurus-Littrow Valley: Apollo 17 landing site. U.S. Geol. Surv. Prof. Pap. 1981, 1080, 225–280. [Google Scholar]
- Haruyama, J.; Matsunaga, T.; Ohtake, M.; Morota, T.; Honda, C.; Yokota, Y.; Torii, M.; Ogawa, Y. LISM Working Group. Global lunar-surface mapping experiment using the Lunar Imager/Spectrometer on SELENE. Earth Planets Space 2008, 60, 243–255. [Google Scholar] [CrossRef] [Green Version]
- Barker, M.K.; Mazarico, E.; Neumann, G.A.; Zuber, M.T.; Haruyama, J.; Smith, D.E. A new lunar digital elevation model from the Lunar Orbiter Laser Altimeter and SELENE Terrain Camera. Icarus 2016, 273, 346–355. [Google Scholar] [CrossRef] [Green Version]
- McEwen, A.S.; Robinson, M.S. Mapping of the Moon by Clementine. Adv. Space Res. 1997, 19, 1523–1533. [Google Scholar] [CrossRef]
- Lucey, P.G.; Blewett, D.T.; Taylor, G.J.; Hawke, B.R. Imaging of lunar surface maturity. J. Geophys. Res. Planets 2000, 105, 20377–20386. [Google Scholar] [CrossRef]
- Kammerer, J.; Zeiss, C. The moon camera and its lenses. Opt. Eng. 1972, 11, 73–78. [Google Scholar] [CrossRef]
- Batson, R.M.; Larson, K.B.; Tyner, R.L. Apollo 17 lunar surface photography, in Geologic Investigation of the Taurus-Littrow Valley: Apollo 17 Landing Site. U.S. Geol. Surv. Prof. Pap. 1981, 1080, 225–280. [Google Scholar]
- Lawrence, S.J.; Robinson, M.S.; Broxton, M.; Stopar, J.D.; Close, W.; Grunsfeld, J.; Ingram, R.; Jefferson, L.; Locke, S.; Mitchell, R.; et al. The Apollo digital image archive: New research and data products. In Proceedings of the NLSI Lunar Science Conference, California, CA, USA, 22–23 July 2008; p. 2066. Available online: https://www.lpi.usra.edu/meetings/nlsc2008/pdf/2066.pdf (accessed on 11 May 2020).
- Borgeson, W.T.; Batson, R.M. Photogrammetric Calibration of Apollo Film Cameras; Usgs Open-File Report N69-N27911; U.S. Geological Survey: Reston, VA, USA, 1969.
- iWitnessPro. 2015. Available online: https://www.photometrix.com.au/iwitness/ (accessed on 11 May 2020).
- Manheim, M.; Wagner, R.; Klem, S.; Robinson, M. Photoscan DEMs from Apollo 15 Hasselblad photographs. In Proceedings of the European Planetary Science Congress, Berlin, Germany, 16–21 September 2018; Volume 12. EPSC2018-996. [Google Scholar]
- Agisoft LLC. Metashape Professional. 2020. Available online: https://www.agisoft.com (accessed on 30 January 2020).
- Meyer, C. Lunar Sample Compendium. In Proceedings of the 41st Lunar and Planetary Science Conference, The Woodlands, TX, USA, 1–5 March 2010; p. 1016, LPI Contribution No. 1533. [Google Scholar]
- Reimold, W.U. Pseudotachylite in impact structures—generation by friction melting and shock brecciation?: A review and discussion. Earth Sci. Rev. 1995, 39, 247–265. [Google Scholar] [CrossRef]
- Schmitt, H.H.; Cernan, E.; Lyndon, B.; Johnson Space Center. Apollo 17: Preliminary Science Report; Scientific and Technical Information Office: Washington, DC, USA, 1973. [Google Scholar]
- Papanastassiou, D.A.; Wasserburg, G.J. Rb-Sr study of a lunar dunite and evidence for early lunar differentiates. In Proceedings of the Lunar and Planetary Science Conference, New York, NY, USA, 17–21 March 1975; pp. 1467–1489. [Google Scholar]
- Ryder, G. Chemical variation and zoning of olivine in lunar dunite 72415: Near-surface accumulation. In Proceedings of the 22nd Lunar and Planetary Science Conference, Houston, TX, USA, 18–22 March 1991; Lunar Planetary Institute: Houston, TX, USA, 1992; pp. 373–380. [Google Scholar]
- Schmitt, H.H. Symplectites in dunite 71415 and troctolite 76535 indicate mantle overturn beneath lunar near-side. In Proceedings of the 47th Lunar and Planetary Science Conference, The Woodlands, TX, USA, 21–25 March 2016; p. 2339, LPI Contribution No. 1903. [Google Scholar]
- Binet, R.; Grizonnet, M.; Torres, A.; Malapert, J.-C.; Jocteur-Bronzier, F. Lunar Landing Site Localization, Trajectory Inversion, and DTM Update from CHANG′E-3 Descent Images. In Proceedings of the Lunar and Planetary Science Conference, The Woodlands, TX, USA, 18–22 March 2019. LPI Contribution No. 2132, id.2433. [Google Scholar]
© 2020 by the authors. Licensee MDPI, Basel, Switzerland. This article is an open access article distributed under the terms and conditions of the Creative Commons Attribution (CC BY) license (http://creativecommons.org/licenses/by/4.0/).
Share and Cite
Le Mouélic, S.; Enguehard, P.; Schmitt, H.H.; Caravaca, G.; Seignovert, B.; Mangold, N.; Combe, J.-P.; Civet, F. Investigating Lunar Boulders at the Apollo 17 Landing Site Using Photogrammetry and Virtual Reality. Remote Sens. 2020, 12, 1900. https://doi.org/10.3390/rs12111900
Le Mouélic S, Enguehard P, Schmitt HH, Caravaca G, Seignovert B, Mangold N, Combe J-P, Civet F. Investigating Lunar Boulders at the Apollo 17 Landing Site Using Photogrammetry and Virtual Reality. Remote Sensing. 2020; 12(11):1900. https://doi.org/10.3390/rs12111900
Chicago/Turabian StyleLe Mouélic, Stéphane, Pauline Enguehard, Harrison H. Schmitt, Gwénaël Caravaca, Benoît Seignovert, Nicolas Mangold, Jean-Philippe Combe, and François Civet. 2020. "Investigating Lunar Boulders at the Apollo 17 Landing Site Using Photogrammetry and Virtual Reality" Remote Sensing 12, no. 11: 1900. https://doi.org/10.3390/rs12111900
APA StyleLe Mouélic, S., Enguehard, P., Schmitt, H. H., Caravaca, G., Seignovert, B., Mangold, N., Combe, J.-P., & Civet, F. (2020). Investigating Lunar Boulders at the Apollo 17 Landing Site Using Photogrammetry and Virtual Reality. Remote Sensing, 12(11), 1900. https://doi.org/10.3390/rs12111900