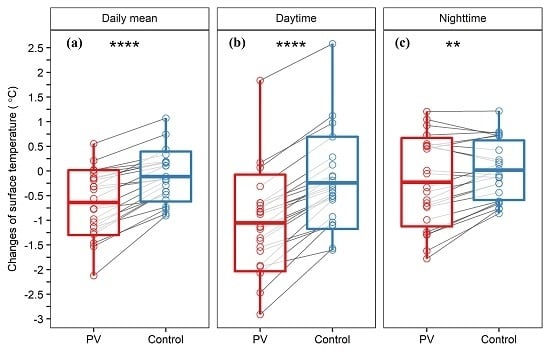
Assessing the Effects of Photovoltaic Powerplants on Surface Temperature Using Remote Sensing Techniques
Abstract
1. Introduction
2. Materials and Methods
2.1. Study Area and the Photovoltaic (PV) Powerplants Selection
2.2. Quantifying the Effects of the PV Powerplants on Surface Temperature
2.3. Normalized Difference Vegetation Index (NDVI) and Albedo Data
2.4. Climate Factors
3. Results
3.1. The Effects of Photovoltaic (PV) Powerplants on Surface Temperature
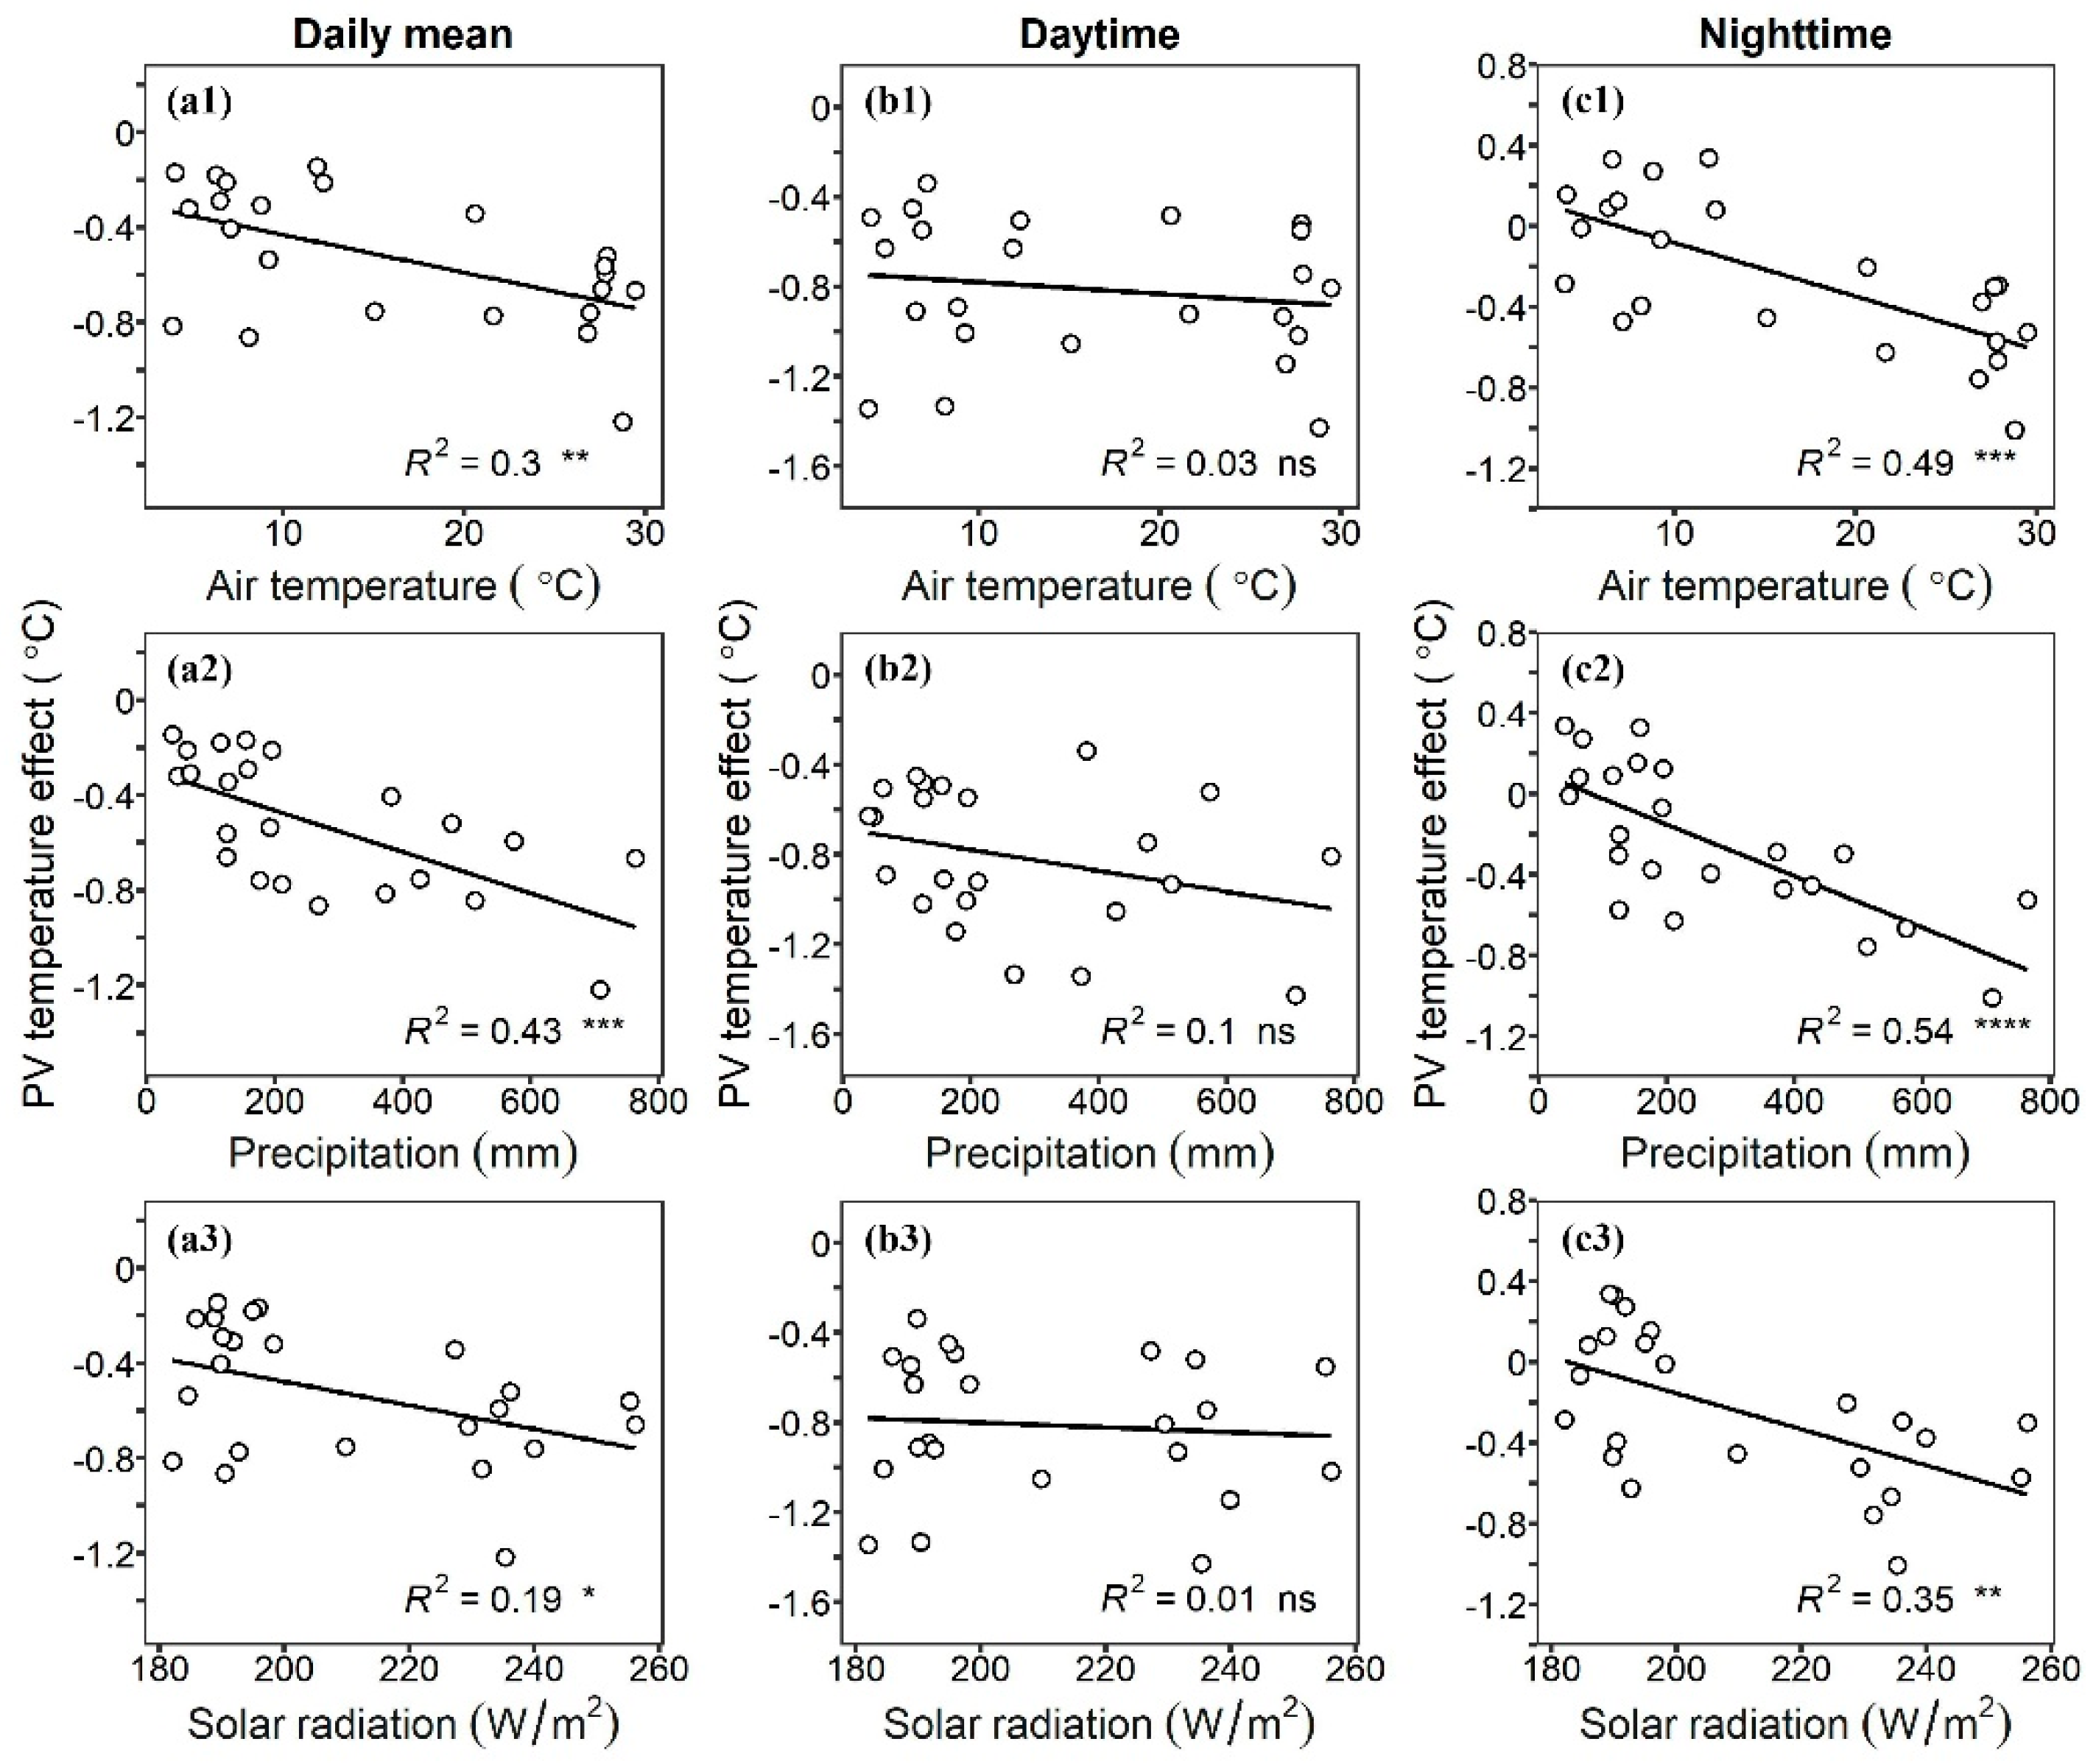
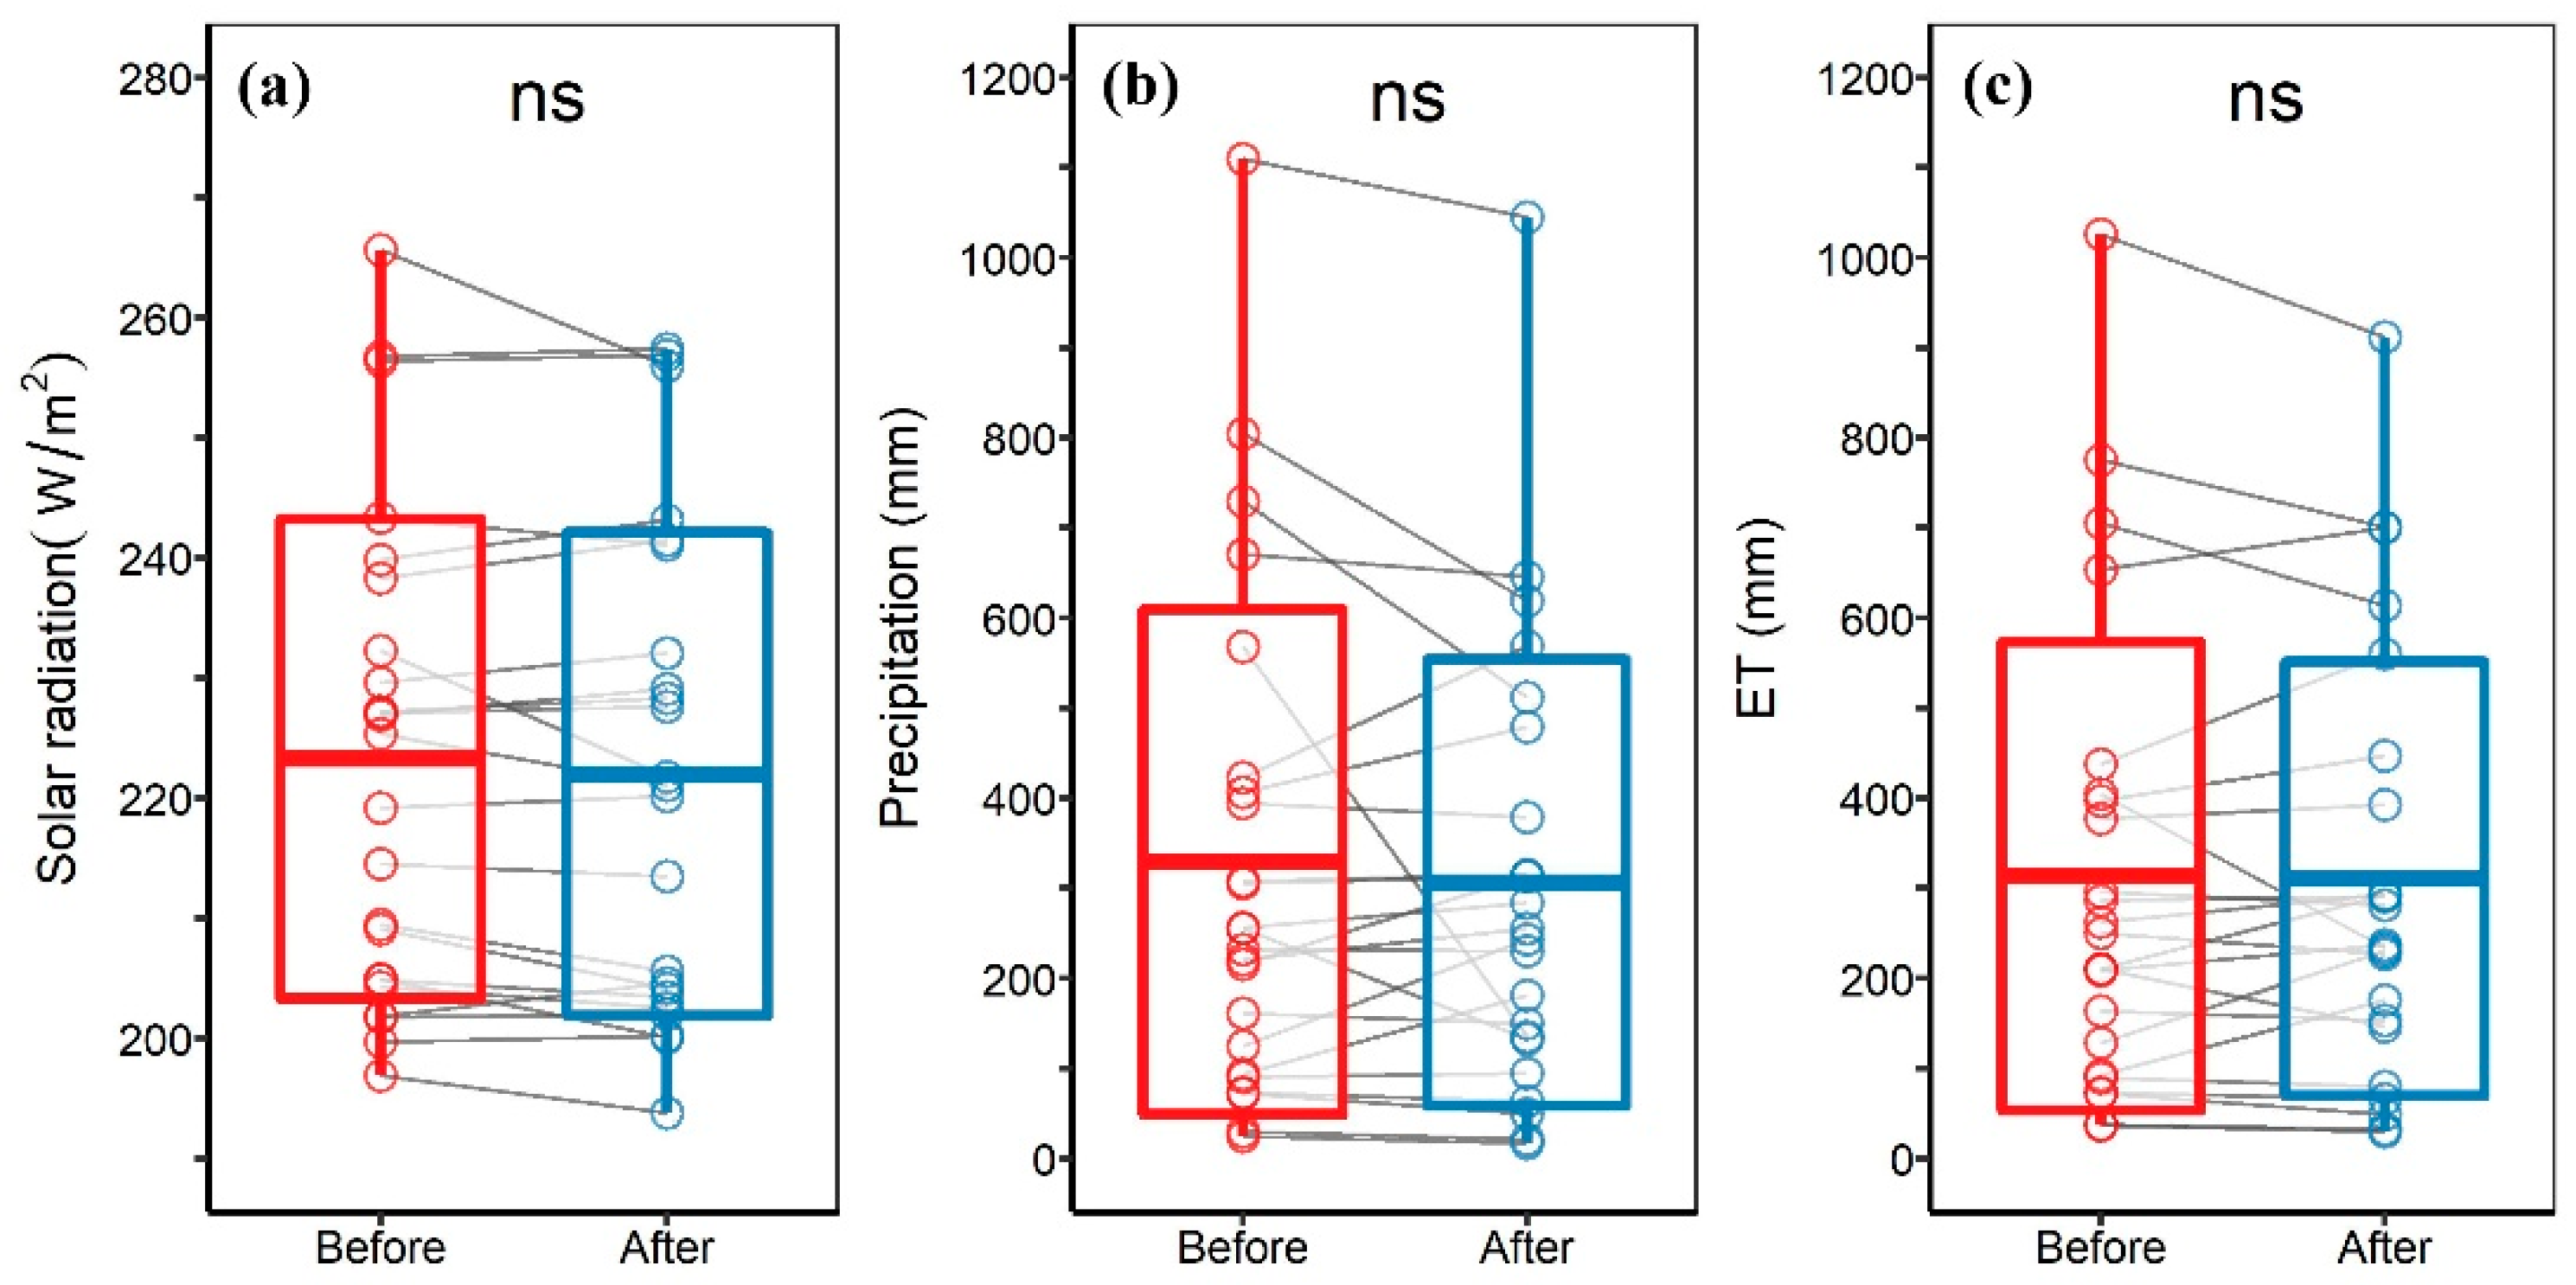
3.2. The PV Temperature Effect Varied with Geographical and Climatic Conditions
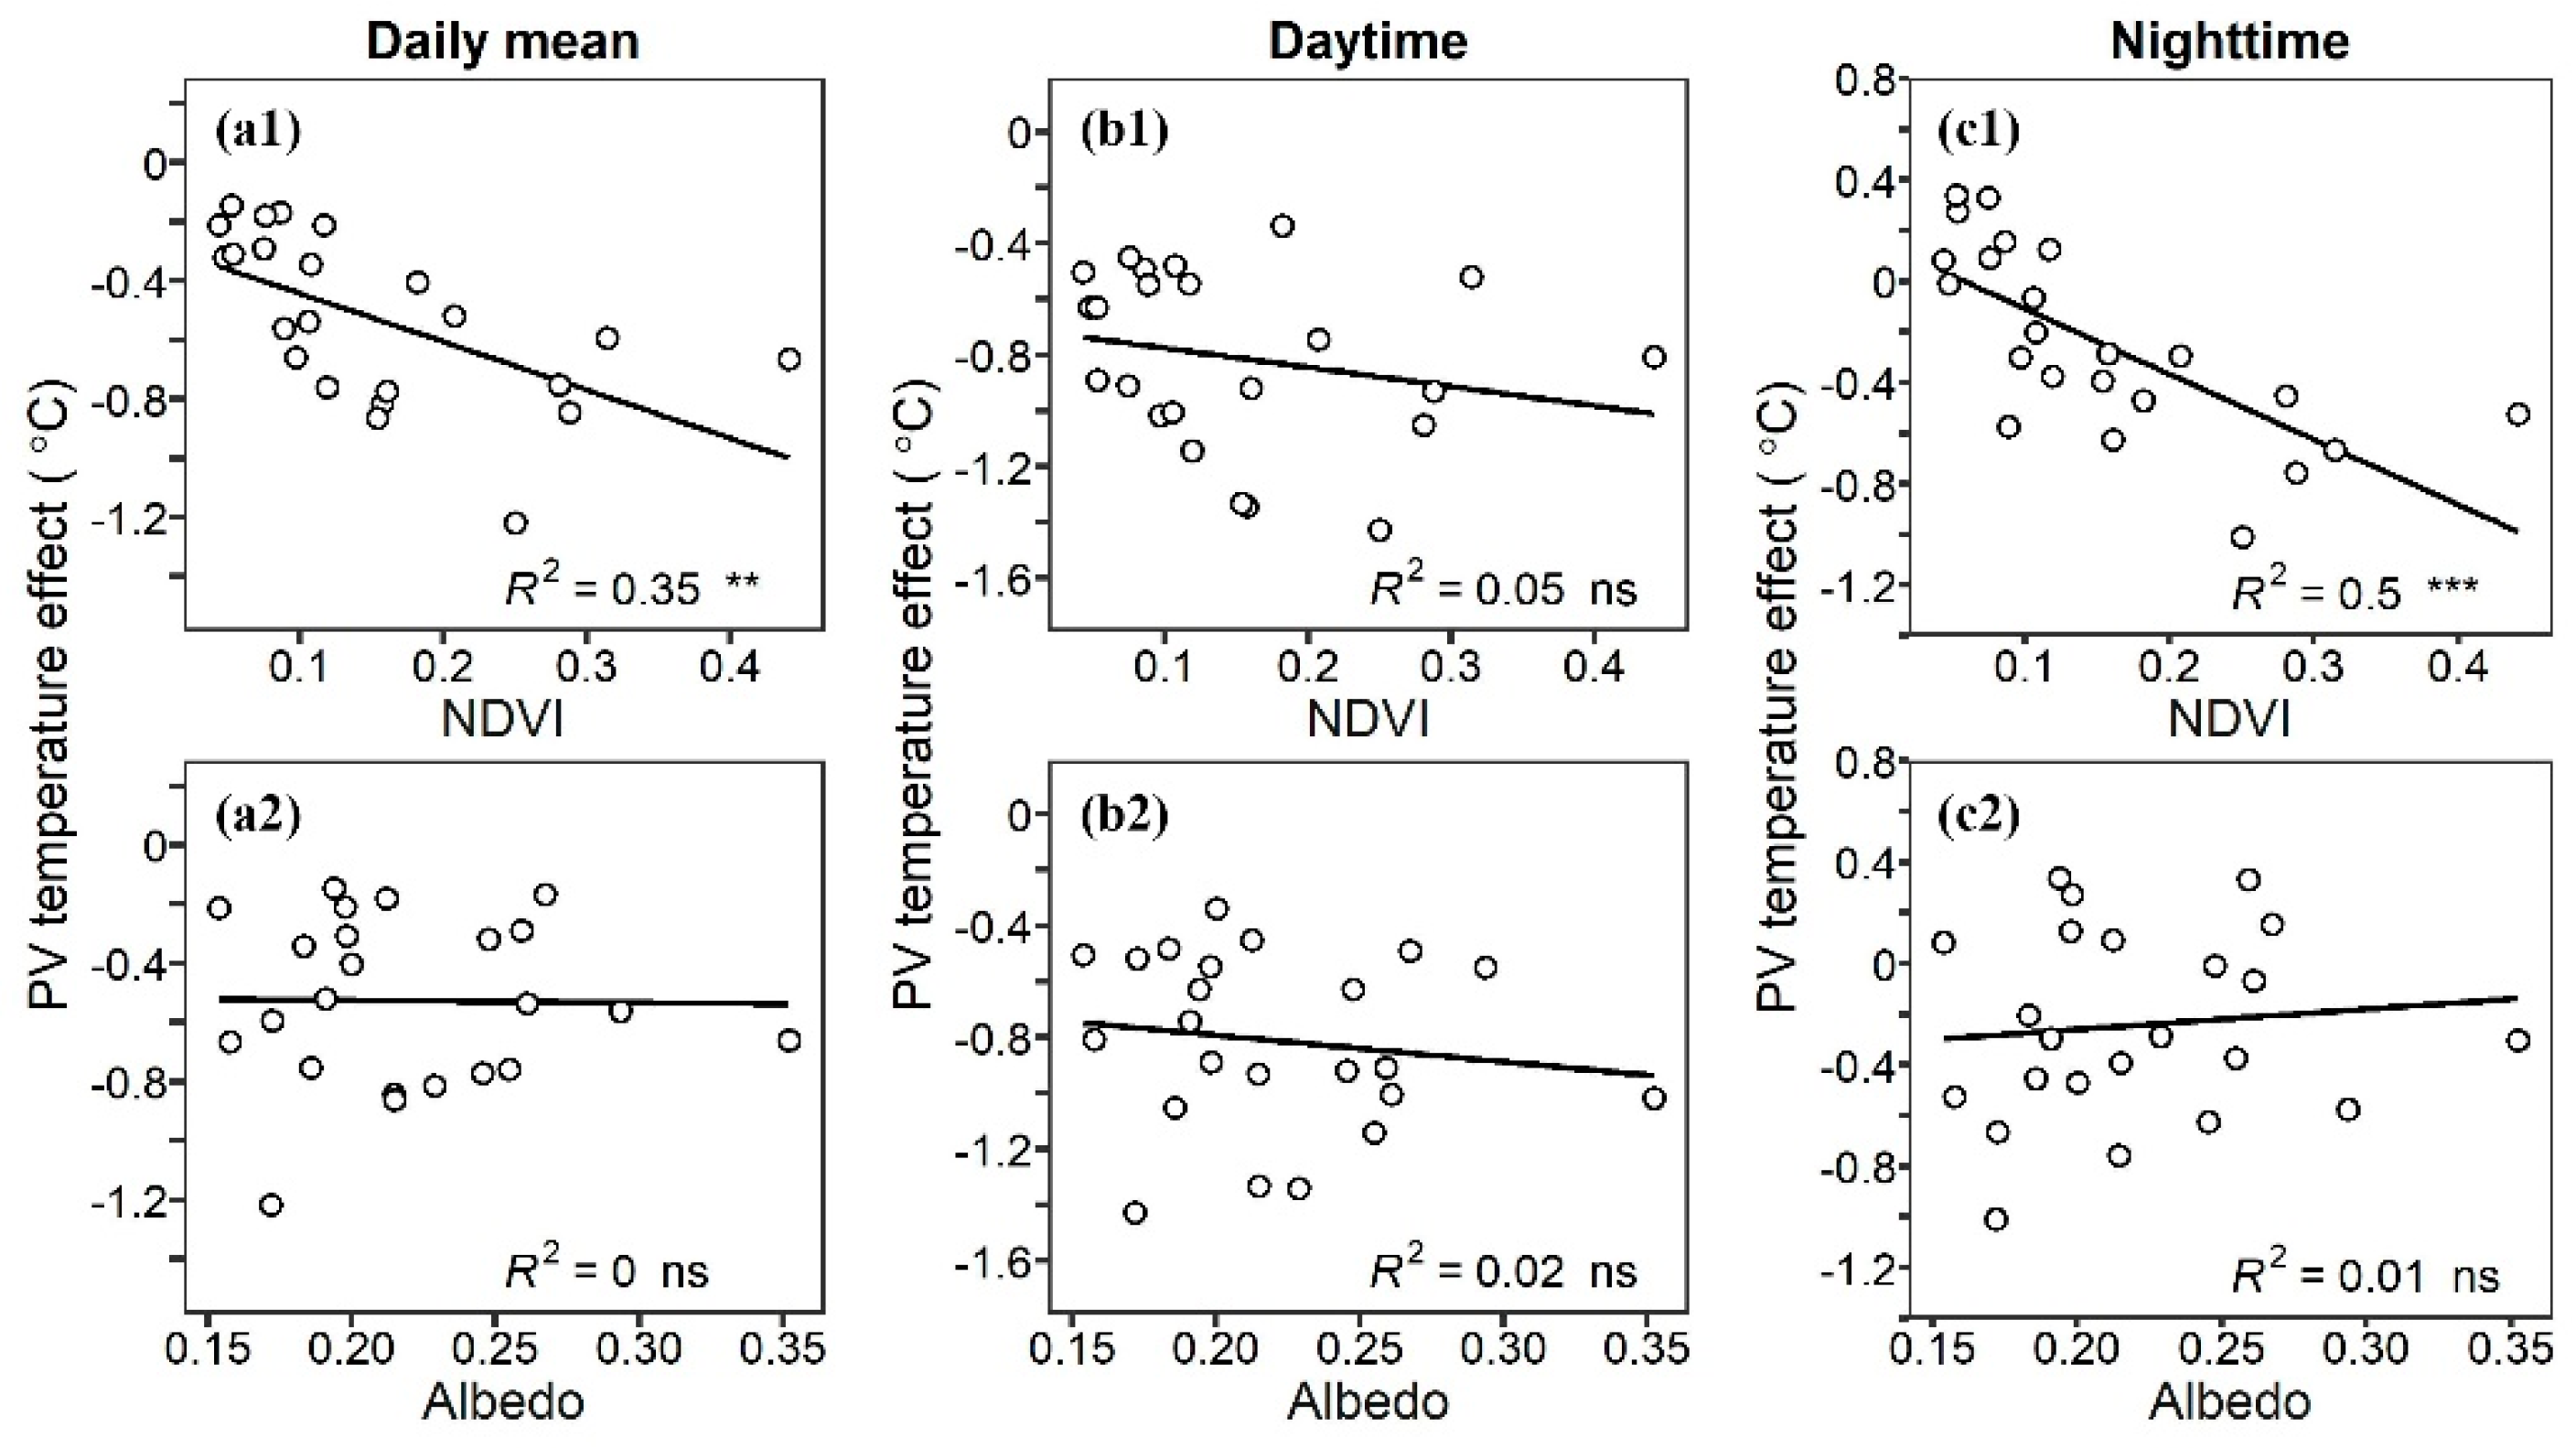
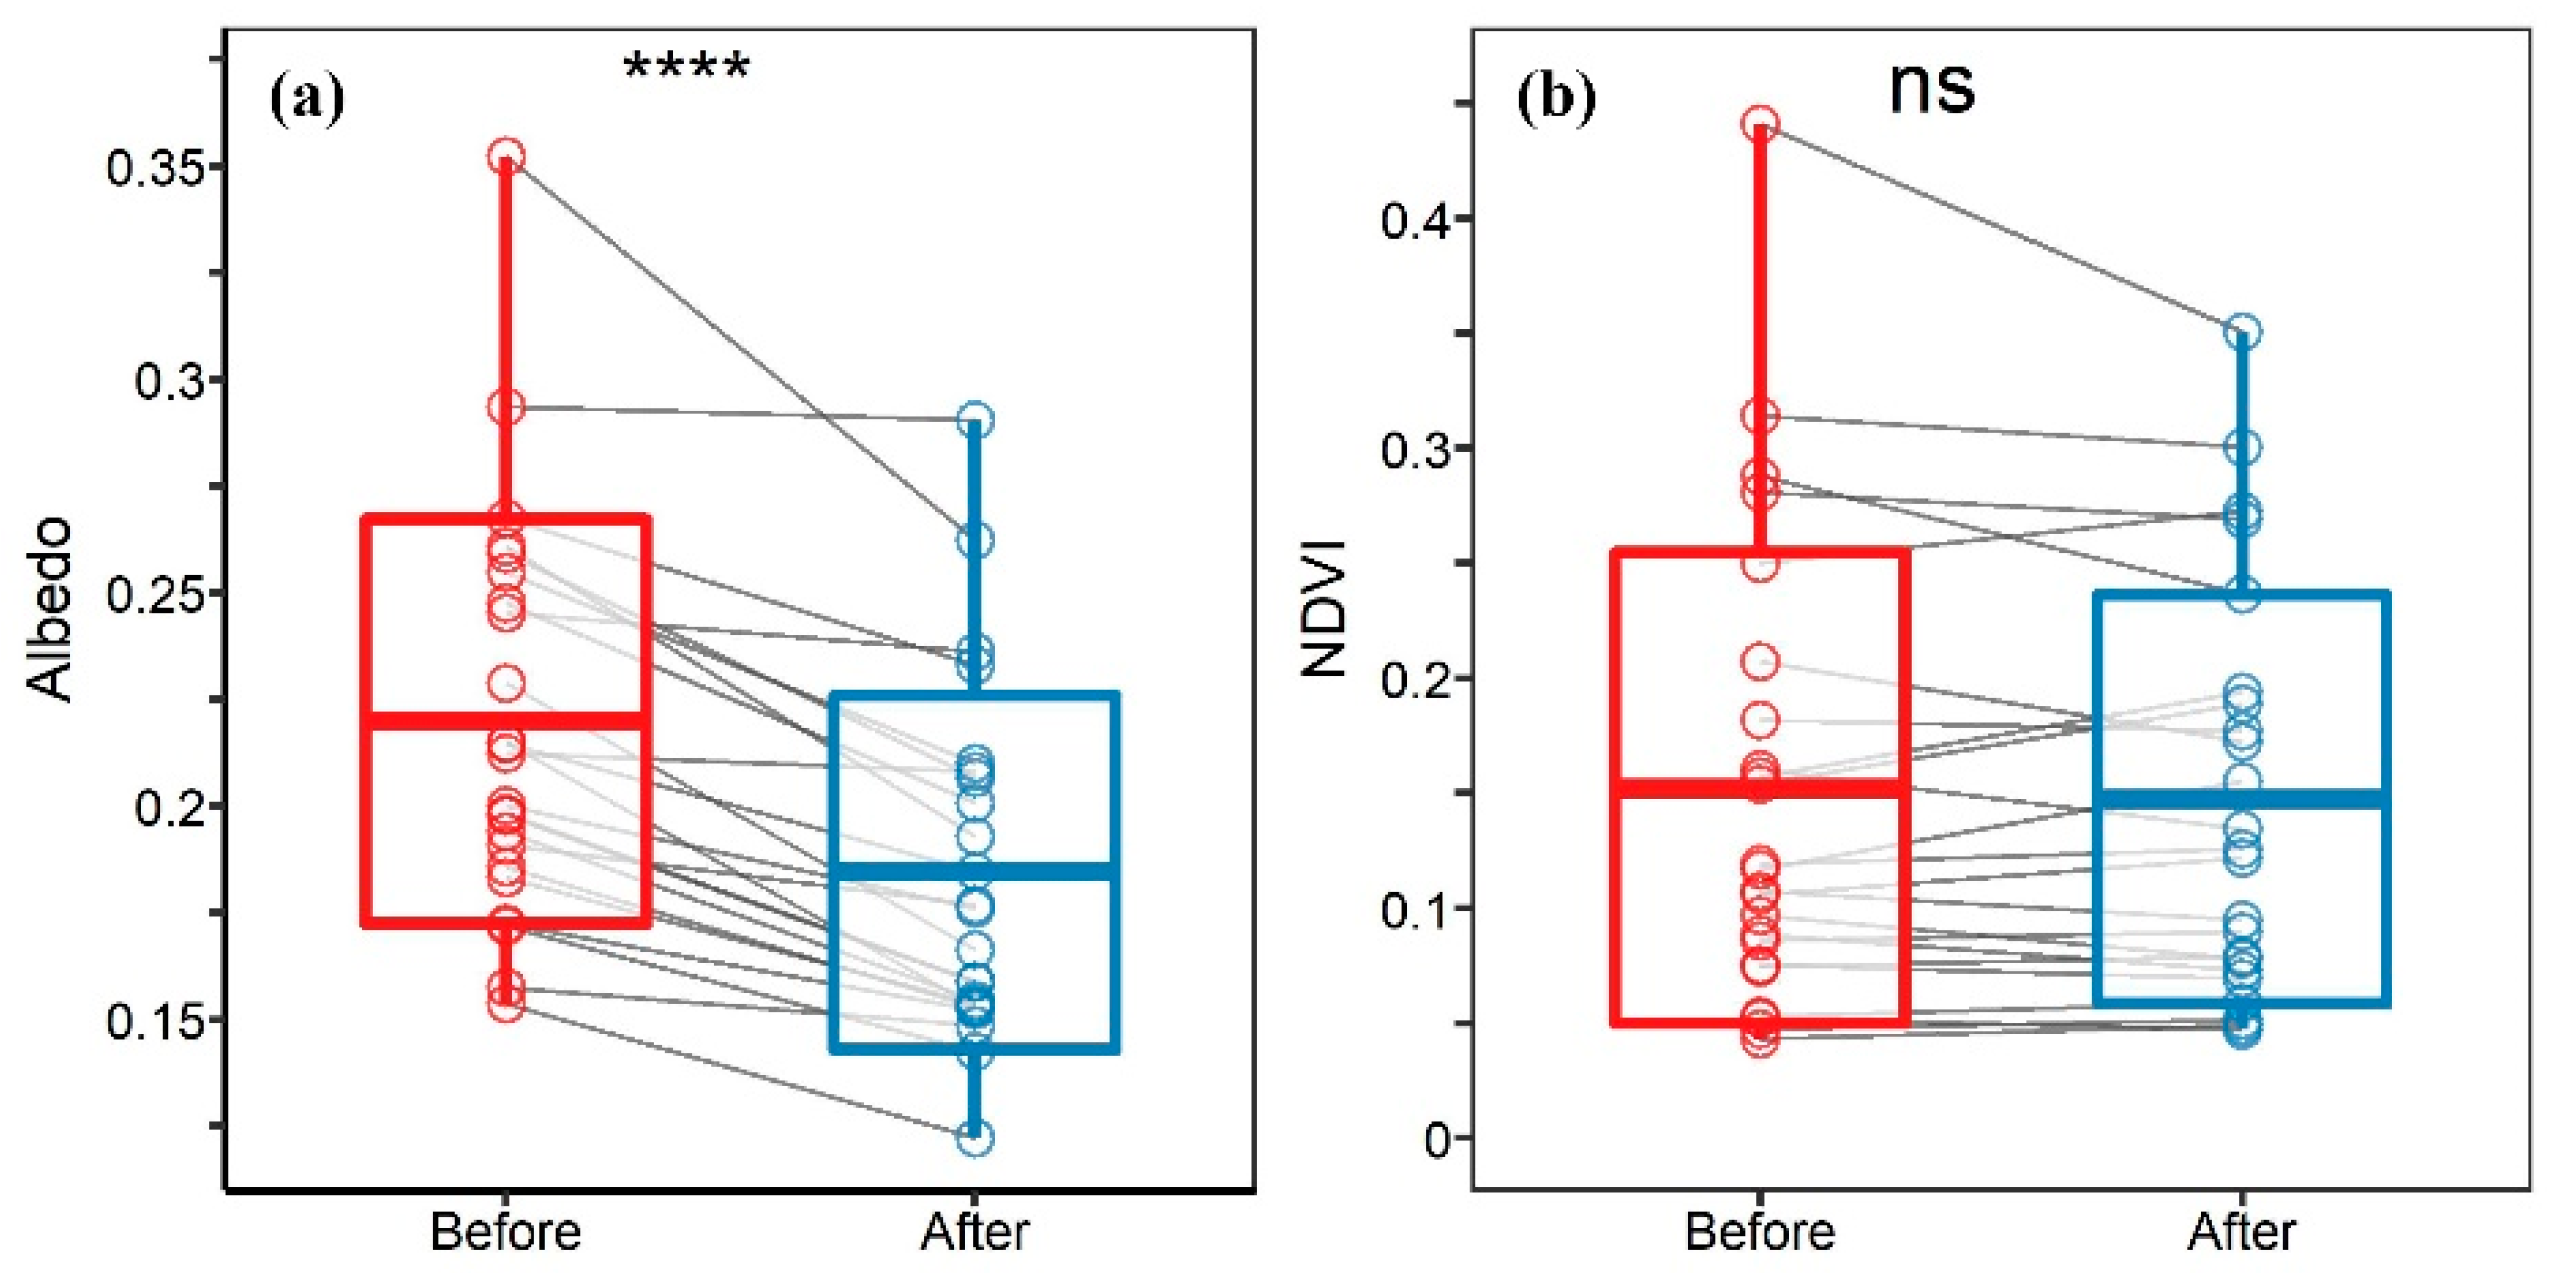
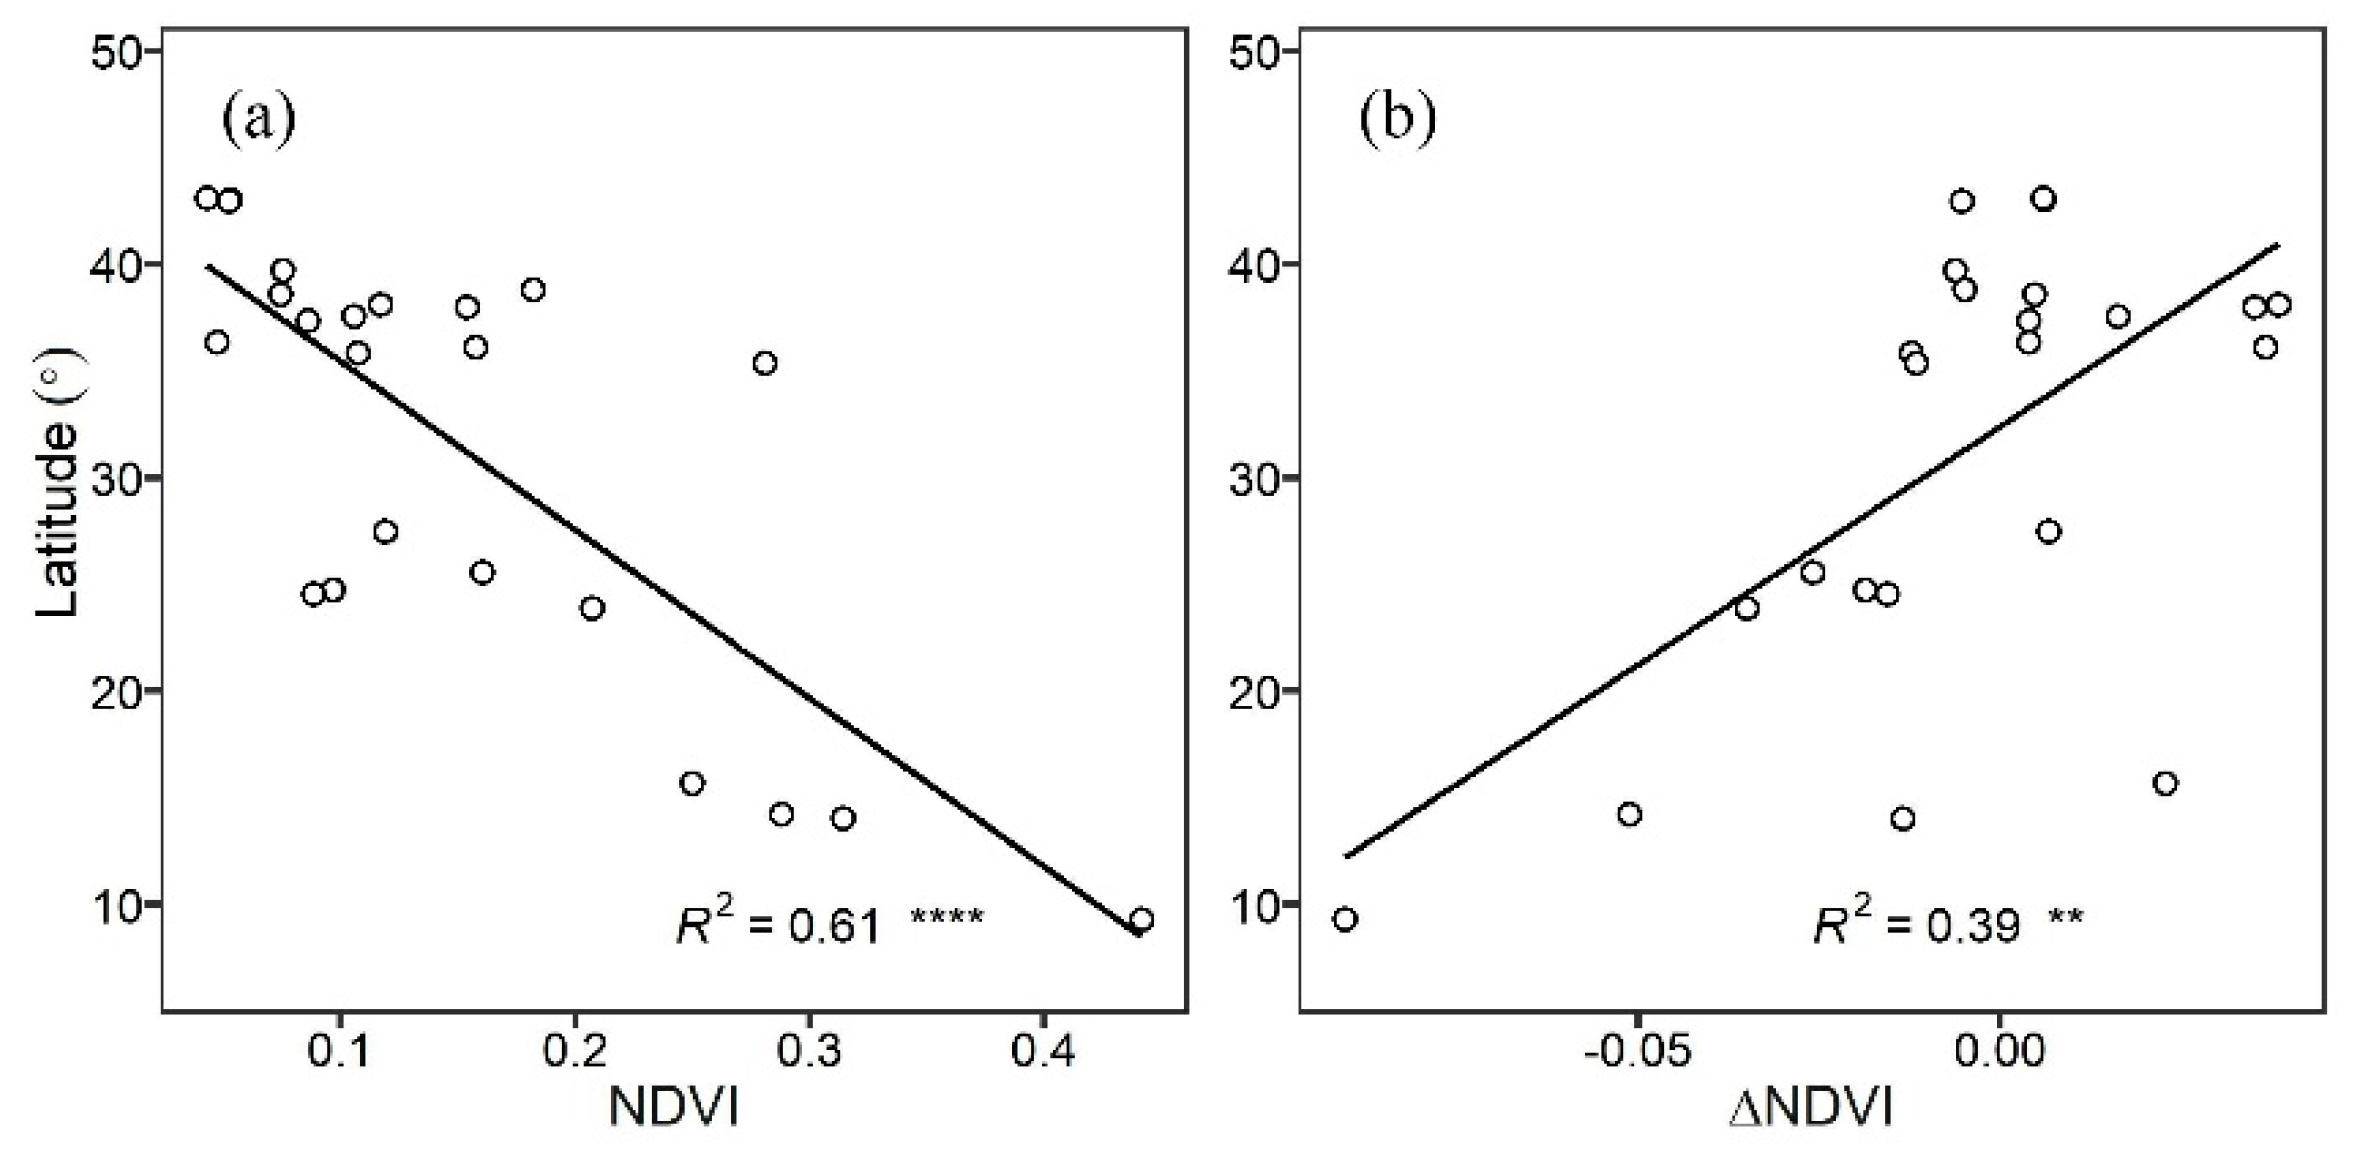
3.3. Impacts of Surface Conditions on the PV Temperature Effect
3.4. Modelling the PV Temperature Effect
4. Discussion
4.1. Uncertainties in MODIS Surface Temperature and Emissivity
4.2. Effects of Albedo and Electrical Energy Conversion on Surface Temperature
4.3. Solar Panel Shading and Evapotranspiration Cooling Effects on Surface Temperature
4.4. Convective Cooling Effect on Surface Temperature of Solar Panels
4.5. Association of the PV Temperature Effect with Geographic, Climatic, and Vegetation Factors
5. Conclusions
Supplementary Materials
Author Contributions
Funding
Acknowledgments
Conflicts of Interest
Appendix A. Cavity Effect of the PV Powerplants
References
- Johansson, T.B.; Patwardhan, A.P.; Nakićenović, N.; Gomez-Echeverri, L. Global Energy Assessment: Toward a Sustainable Future; Cambridge University Press: Cambridge, UK, 2012. [Google Scholar]
- Nemet, G.F. Net radiative forcing from widespread deployment of photovoltaics. Environ. Sci. Technol. 2009, 43, 2173–2178. [Google Scholar] [CrossRef]
- Akella, A.; Saini, R.; Sharma, M.P. Social, economical and environmental impacts of renewable energy systems. Renew. Energy 2009, 34, 390–396. [Google Scholar] [CrossRef]
- Muneer, T.; Asif, M.; Kubie, J. Generation and transmission prospects for solar electricity: UK and global markets. Energy Convers. Manag. 2003, 44, 35–52. [Google Scholar] [CrossRef]
- Zou, H.; Du, H.; Brown, M.A.; Mao, G. Large-scale PV power generation in China: A grid parity and techno-economic analysis. Energy 2017, 134, 256–268. [Google Scholar] [CrossRef]
- Taha, H. The potential for air-temperature impact from large-scale deployment of solar photovoltaic arrays in urban areas. Solar Energy 2013, 91, 358–367. [Google Scholar] [CrossRef]
- Hernandez, R.R.; Easter, S.; Murphy-Mariscal, M.L.; Maestre, F.T.; Tavassoli, M.; Allen, E.B.; Barrows, C.W.; Belnap, J.; Ochoa-Hueso, R.; Ravi, S. Environmental impacts of utility-scale solar energy. Renew. Sust. Energy Rev. 2014, 29, 766–779. [Google Scholar] [CrossRef]
- Zhai, P.; Larsen, P.; Millstein, D.; Menon, S.; Masanet, E. The potential for avoided emissions from photovoltaic electricity in the United States. Energy 2012, 47, 443–450. [Google Scholar] [CrossRef]
- Duan, H.-B.; Zhang, G.-P.; Zhu, L.; Fan, Y.; Wang, S.-Y. How will diffusion of PV solar contribute to China’s emissions-peaking and climate responses? Renew. Sust. Energy Rev. 2016, 53, 1076–1085. [Google Scholar] [CrossRef]
- Aliprandi, F.; Stoppato, A.; Mirandola, A. Estimating CO2 emissions reduction from renewable energy use in Italy. Renew. Energy 2016, 96, 220–232. [Google Scholar] [CrossRef]
- Krauter, S.; Rüther, R. Considerations for the calculation of greenhouse gas reduction by photovoltaic solar energy. Renew. Energy 2004, 29, 345–355. [Google Scholar] [CrossRef]
- Peng, J.; Lu, L.; Yang, H. Review on life cycle assessment of energy payback and greenhouse gas emission of solar photovoltaic systems. Renew. Sust. Energ. Rev. 2013, 19, 255–274. [Google Scholar] [CrossRef]
- Battisti, R.; Corrado, A. Evaluation of technical improvements of photovoltaic systems through life cycle assessment methodology. Energy 2005, 30, 952–967. [Google Scholar] [CrossRef]
- Dones, R.; Frischknecht, R. Life-cycle assessment of photovoltaic systems: Results of Swiss studies on energy chains. Prog. Photovolt. 1998, 6, 117–125. [Google Scholar] [CrossRef]
- Salamanca, F.; Georgescu, M.; Mahalov, A.; Moustaoui, M.; Martilli, A. Citywide impacts of cool roof and rooftop solar photovoltaic deployment on near-surface air temperature and cooling energy demand. Bound. Layer Meteorol. 2016, 161, 203–221. [Google Scholar] [CrossRef]
- Masson, V.; Bonhomme, M.; Salagnac, J.-L.; Briottet, X.; Lemonsu, A. Solar panels reduce both global warming and urban heat island. Front. Environ. Sci. 2014, 2, 14. [Google Scholar] [CrossRef]
- Hu, A.; Levis, S.; Meehl, G.A.; Han, W.; Washington, W.M.; Oleson, K.W.; van Ruijven, B.J.; He, M.; Strand, W.G. Impact of solar panels on global climate. Nat. Clim. Change. 2016, 6, 290. [Google Scholar] [CrossRef]
- Millstein, D.; Menon, S. Regional climate consequences of large-scale cool roof and photovoltaic array deployment. Environ. Res. 2011, 6, 034001. [Google Scholar] [CrossRef]
- Li, Y.; Kalnay, E.; Motesharrei, S.; Rivas, J.; Kucharski, F.; Kirk-Davidoff, D.; Bach, E.; Zeng, N. Climate model shows large-scale wind and solar farms in the Sahara increase rain and vegetation. Science 2018, 361, 1019–1022. [Google Scholar] [CrossRef]
- Broadbent, A.M.; Krayenhoff, E.S.; Georgescu, M.; Sailor, D.J. The observed effects of utility-scale photovoltaics on near-surface air temperature and energy balance. J. Appl. Meteorol. Climatol. 2019, 58, 989–1006. [Google Scholar] [CrossRef]
- Yang, L.; Gao, X.; Lv, F.; Hui, X.; Ma, L.; Hou, X. Study on the local climatic effects of large photovoltaic solar farms in desert areas. Solar Energy 2017, 144, 244–253. [Google Scholar] [CrossRef]
- Barron-Gafford, G.A.; Minor, R.L.; Allen, N.A.; Cronin, A.D.; Brooks, A.E.; Pavao-Zuckerman, M.A. The photovoltaic heat island effect: Larger solar power plants increase local temperatures. Sci. Rep. 2016, 6, 35070. [Google Scholar] [CrossRef] [PubMed]
- Chang, R.; Shen, Y.; Luo, Y.; Wang, B.; Yang, Z.; Guo, P. Observed surface radiation and temperature impacts from the large-scale deployment of photovoltaics in the barren area of Gonghe, China. Renew. Energy 2018, 118, 131–137. [Google Scholar] [CrossRef]
- Fu, G.; Shen, Z.; Zhang, X.; Shi, P.; Zhang, Y.; Wu, J. Estimating air temperature of an alpine meadow on the northern Tibetan Plateau using MODIS land surface temperature. Acta Ecol. Sinica 2011, 31, 8–13. [Google Scholar] [CrossRef]
- Vancutsem, C.; Ceccato, P.; Dinku, T.; Connor, S.J. Evaluation of MODIS land surface temperature data to estimate air temperature in different ecosystems over Africa. Remote Sens. Environ. 2010, 114, 449–465. [Google Scholar] [CrossRef]
- Shamir, E.; Georgakakos, K.P. MODIS Land surface temperature as an index of surface air temperature for operational snowpack estimation. Remote Sens. Environ. 2014, 152, 83–98. [Google Scholar] [CrossRef]
- Zhu, W.; Lű, A.; Jia, S. Estimation of daily maximum and minimum air temperature using MODIS land surface temperature products. Remote Sens. Environ. 2013, 130, 62–73. [Google Scholar] [CrossRef]
- Zhu, W.; Lű, A.; Jia, S.; Yan, J.; Mahmood, R. Retrievals of all-weather daytime air temperature from MODIS products. Remote Sens. Environ. 2017, 189, 152–163. [Google Scholar] [CrossRef]
- Luo, D.; Jin, H.; Marchenko, S.S.; Romanovsky, V.E. Difference between near-surface air, land surface and ground surface temperatures and their influences on the frozen ground on the Qinghai-Tibet Plateau. Geoderma 2018, 312, 74–85. [Google Scholar] [CrossRef]
- Justice, C.; Townshend, J.; Vermote, E.; Masuoka, E.; Wolfe, R.; Saleous, N.; Roy, D.; Morisette, J. An overview of MODIS Land data processing and product status. Remote Sens. Environ. 2002, 83, 3–15. [Google Scholar] [CrossRef]
- Peng, S.; Piao, S.; Ciais, P.; Friedlingstein, P.; Ottle, C.; Bréon, F.o.-M.; Nan, H.; Zhou, L.; Myneni, R.B. Surface urban heat island across 419 global big cities. Environ. Sci. Technol. 2011, 46, 696–703. [Google Scholar] [CrossRef]
- Lazzarini, M.; Marpu, P.R.; Ghedira, H. Temperature-land cover interactions: The inversion of urban heat island phenomenon in desert city areas. Remote Sens. Environ. 2013, 130, 136–152. [Google Scholar] [CrossRef]
- Neteler, M. Estimating daily land surface temperatures in mountainous environments by reconstructed MODIS LST data. Remote Sens. 2010, 2, 333–351. [Google Scholar] [CrossRef]
- Anderson, M.C.; Allen, R.G.; Morse, A.; Kustas, W.P. Use of Landsat thermal imagery in monitoring evapotranspiration and managing water resources. Remote Sens. Environ. 2012, 122, 50–65. [Google Scholar] [CrossRef]
- Westermann, S.; Langer, M.; Boike, J. Spatial and temporal variations of summer surface temperatures of high-arctic tundra on Svalbard—Implications for MODIS LST based permafrost monitoring. Remote Sens. Environ. 2011, 115, 908–922. [Google Scholar] [CrossRef]
- Dousset, B.; Gourmelon, F. Satellite multi-sensor data analysis of urban surface temperatures and landcover. Int. J. Photogramm. Remote Sens. 2003, 58, 43–54. [Google Scholar] [CrossRef]
- Guangmeng, G.; Mei, Z. Using MODIS land surface temperature to evaluate forest fire risk of northeast China. IEEE Geosci. Remote Sens. Lett. 2004, 1, 98–100. [Google Scholar] [CrossRef]
- Imhoff, M.L.; Zhang, P.; Wolfe, R.E.; Bounoua, L. Remote sensing of the urban heat island effect across biomes in the continental USA. Remote Sens. Environ. 2010, 114, 504–513. [Google Scholar] [CrossRef]
- Weng, Q.; Lu, D.; Schubring, J. Estimation of land surface temperature-vegetation abundance relationship for urban heat island studies. Remote Sens. Environ. 2004, 89, 467–483. [Google Scholar] [CrossRef]
- Wan, Z. New refinements and validation of the collection-6 MODIS land-surface temperature/emissivity product. Remote Sens. Environ. 2014, 140, 36–45. [Google Scholar] [CrossRef]
- Gorelick, N.; Hancher, M.; Dixon, M.; Ilyushchenko, S.; Thau, D.; Moore, R. Google earth engine: Planetary-scale geospatial analysis for everyone. Remote Sens. Environ. 2017, 202, 18–27. [Google Scholar] [CrossRef]
- Global Solar Atlas 2.0, a Free, Web-Based Application is Developed and Operated by the Company Solargis S.R.O. on Behalf of the World Bank Group, Utilizing Solargis Data, with Funding Provided by the Energy Sector Management Assistance Program (ESMAP). Available online: https://globalsolaratlas.info (accessed on 17 May 2020).
- Chang, R.; Luo, Y.; Zhu, R. Simulated local climatic impacts of large-scale photovoltaics over the barren area of Qinghai, China. Renew. Energy 2020, 145, 478–489. [Google Scholar] [CrossRef]
- Wang, K.; Wan, Z.; Wang, P.; Sparrow, M.; Liu, J.; Haginoya, S. Evaluation and improvement of the MODIS land surface temperature/emissivity products using ground-based measurements at a semi-desert site on the western Tibetan Plateau. Int. J. Remote Sens. 2007, 28, 2549–2565. [Google Scholar] [CrossRef]
- Wan, Z.; Dozier, J. A generalized split-window algorithm for retrieving land-surface temperature from space. IEEE Trans. Geosci. Remote Sens. 1996, 34, 892–905. [Google Scholar]
- Wan, Z. Estimate of noise and systematic error in early thermal infrared data of the moderate resolution imaging spectroradiometer (MODIS). Remote Sens. Environ. 2002, 80, 47–54. [Google Scholar] [CrossRef]
- Wan, Z. MODIS Land Surface Temperature Products Users’ Guide; Institute for Computational Earth System Science: Santa Barbara, CA, USA, 2006. [Google Scholar]
- Homer, N.; Merriman, B.; Nelson, S.F. BFAST: An alignment tool for large scale genome resequencing. PLoS ONE 2009, 4, e7767. [Google Scholar] [CrossRef]
- Rouse, J.W., Jr.; Haas, R.; Schell, J.; Deering, D. Monitoring vegetation systems in the great plains with ERTS. NASAS 1974, 351, 309. [Google Scholar]
- Huete, A.; Didan, K.; Miura, T.; Rodriguez, E.P.; Gao, X.; Ferreira, L.G. Overview of the radiometric and biophysical performance of the MODIS vegetation indices. Remote Sens. Environ. 2002, 83, 195–213. [Google Scholar] [CrossRef]
- Li, Y.; Zhao, M.; Motesharrei, S.; Mu, Q.; Kalnay, E.; Li, S. Local cooling and warming effects of forests based on satellite observations. Nat. Commun. 2015, 6, 6603. [Google Scholar] [CrossRef]
- Fick, S.E.; Hijmans, R.J. WorldClim 2: New 1-km spatial resolution climate surfaces for global land areas. Int. J. Climatol. 2017, 37, 4302–4315. [Google Scholar] [CrossRef]
- Panagos, P.; Ballabio, C.; Meusburger, K.; Spinoni, J.; Alewell, C.; Borrelli, P. Towards estimates of future rainfall erosivity in Europe based on REDES and WorldClim datasets. J. Hydrol. 2017, 548, 251–262. [Google Scholar] [CrossRef]
- Beck, H.E.; Vergopolan, N.; Pan, M.; Levizzani, V.; van Dijk, A.I.J.M.; Weedon, G.P.; Brocca, L.; Pappenberger, F.; Huffman, G.J.; Wood, E.F. Global-scale evaluation of 22 precipitation datasets using gauge observations and hydrological modeling. Hydrol. Earth Syst. Sci. 2017, 21, 6201–6217. [Google Scholar] [CrossRef]
- Beck, H.E.; Zimmermann, N.E.; McVicar, T.R.; Vergopolan, N.; Berg, A.; Wood, E.F. Present and future Köppen-Geiger climate classification maps at 1-km resolution. Sci. Data 2018, 5, 180214. [Google Scholar] [CrossRef] [PubMed]
- Hersbach, H.; Dee, D. ERA5 reanalysis is in production. ECMWF Newsletter 2016, 147, 5–6. [Google Scholar]
- Barnes, W.L.; Pagano, T.S.; Salomonson, V.V. Prelaunch characteristics of the moderate resolution imaging spectroradiometer (MODIS) on EOS-AM1. IEEE Trans. Geosci. Remote Sens. 1998, 36, 1088–1100. [Google Scholar] [CrossRef]
- Li, Z.-L.; Tang, B.-H.; Wu, H.; Ren, H.; Yan, G.; Wan, Z.; Trigo, I.F.; Sobrino, J.A. Satellite-derived land surface temperature: Current status and perspectives. Remote Sens. Environ. 2013, 131, 14–37. [Google Scholar] [CrossRef]
- Sobrino, J.A.; Cuenca, J. Angular variation of thermal infrared emissivity for some natural surfaces from experimental measurements. Appl. Opt. 1999, 38, 3931–3936. [Google Scholar] [CrossRef]
- Ghent, D.; Veal, K.; Trent, T.; Dodd, E.; Sembhi, H.; Remedios, J. A new approach to defining uncertainties for MODIS land surface temperature. Remote Sens. 2019, 11, 1021. [Google Scholar] [CrossRef]
- Becker, F. The impact of spectral emissivity on the measurement of land surface temperature from a satellite. Int. J. Remote Sens. 1987, 8, 1509–1522. [Google Scholar] [CrossRef]
- Wan, Z. New refinements and validation of the MODIS land-surface temperature/emissivity products. Remote Sens. Environ. 2008, 112, 59–74. [Google Scholar] [CrossRef]
- Snyder, W.C.; Wan, Z.; Zhang, Y.; Feng, Y.-Z. Classification-based emissivity for land surface temperature measurement from space. Int. J. Remote Sens. 1998, 19, 2753–2774. [Google Scholar] [CrossRef]
- Hulley, G.C.; Hook, S.J. Intercomparison of versions 4, 4.1 and 5 of the MODIS land surface temperature and emissivity products and validation with laboratory measurements of sand samples from the Namib desert, Namibia. Remote Sens. Environ. 2009, 113, 1313–1318. [Google Scholar] [CrossRef]
- Rubio, E.; Caselles, V.; Badenas, C. Emissivity measurements of several soils and vegetation types in the 8–14 m wave band: Analysis of two field methods. Remote Sens. Environ. 1997, 59, 490–521. [Google Scholar] [CrossRef]
- Labuhn, D.; Kabelac, S. The spectral directional emissivity of photovoltaic surfaces. Int. J. Thermophys. 2001, 22, 1577–1592. [Google Scholar] [CrossRef]
- Thermography-A Quick Analysis. Available online: https://www.avisolar.com/post/thermography-quick-analysis (accessed on 15 April 2020).
- Yamamoto, Y.; Ishikawa, H. Thermal land surface emissivity for retrieving land surface temperature from Himawari-8. J. Meteorol. Soc. Jpn. Ser. II 2018, 96, 43–58. [Google Scholar] [CrossRef]
- Peres, L.F.; Dacamara, C.C. Emissivity maps to retrieve land-surface temperature from MSG/SEVIRI. IEEE Trans. Geosci. Remote Sens. 2005, 43, 1834–1844. [Google Scholar] [CrossRef]
- Caselles, V.; Sobrino, J. Determination of frosts in orange groves from NOAA-9 AVHRR data. Remote Sens. Environ. 1989, 29, 135–146. [Google Scholar] [CrossRef]
- Liu, Y.; Zhang, R.Q.; Huang, Z.; Cheng, Z.; López-Vicente, M.; Ma, X.R.; Wu, G.L. Solar photovoltaic panels significantly promote vegetation recovery by modifying the soil surface microhabitats in an arid sandy ecosystem. Land Degrad. Dev. 2019. [Google Scholar] [CrossRef]
- Araki, K.; Nagai, H.; Lee, K.-H.; Yamaguchi, M. Analysis of impact to optical environment of the land by flat-plate and array of tracking PV panels. Solar Energy 2017, 144, 278–285. [Google Scholar] [CrossRef]
- Kurokawa, K. Energy from the Desert: Feasibility of Very Large Scale Power Generation (VLS-PV) Systems; Routledge: Abingdon, UK, 2012. [Google Scholar]
- Jasechko, S.; Sharp, Z.D.; Gibson, J.J.; Birks, S.J.; Yi, Y.; Fawcett, P.J. Terrestrial water fluxes dominated by transpiration. Nature 2013, 496, 347. [Google Scholar] [CrossRef]
- Nghiem, J.; Potter, C.; Baiman, R. Detection of vegetation cover change in renewable energy development zones of southern california using MODIS NDVI time series analysis, 2000 to 2018. Environments 2019, 6, 40. [Google Scholar] [CrossRef]
- Armstrong, S.; Hurley, W.G. A thermal model for photovoltaic panels under varying atmospheric conditions. Appl. Therm. Eng. 2010, 30, 1488–1495. [Google Scholar] [CrossRef]
- Yadav, A.K.; Chandel, S.S. Tilt angle optimization to maximize incident solar radiation: A review. Renew. Sust. Energ. Rev. 2013, 23, 503–513. [Google Scholar] [CrossRef]
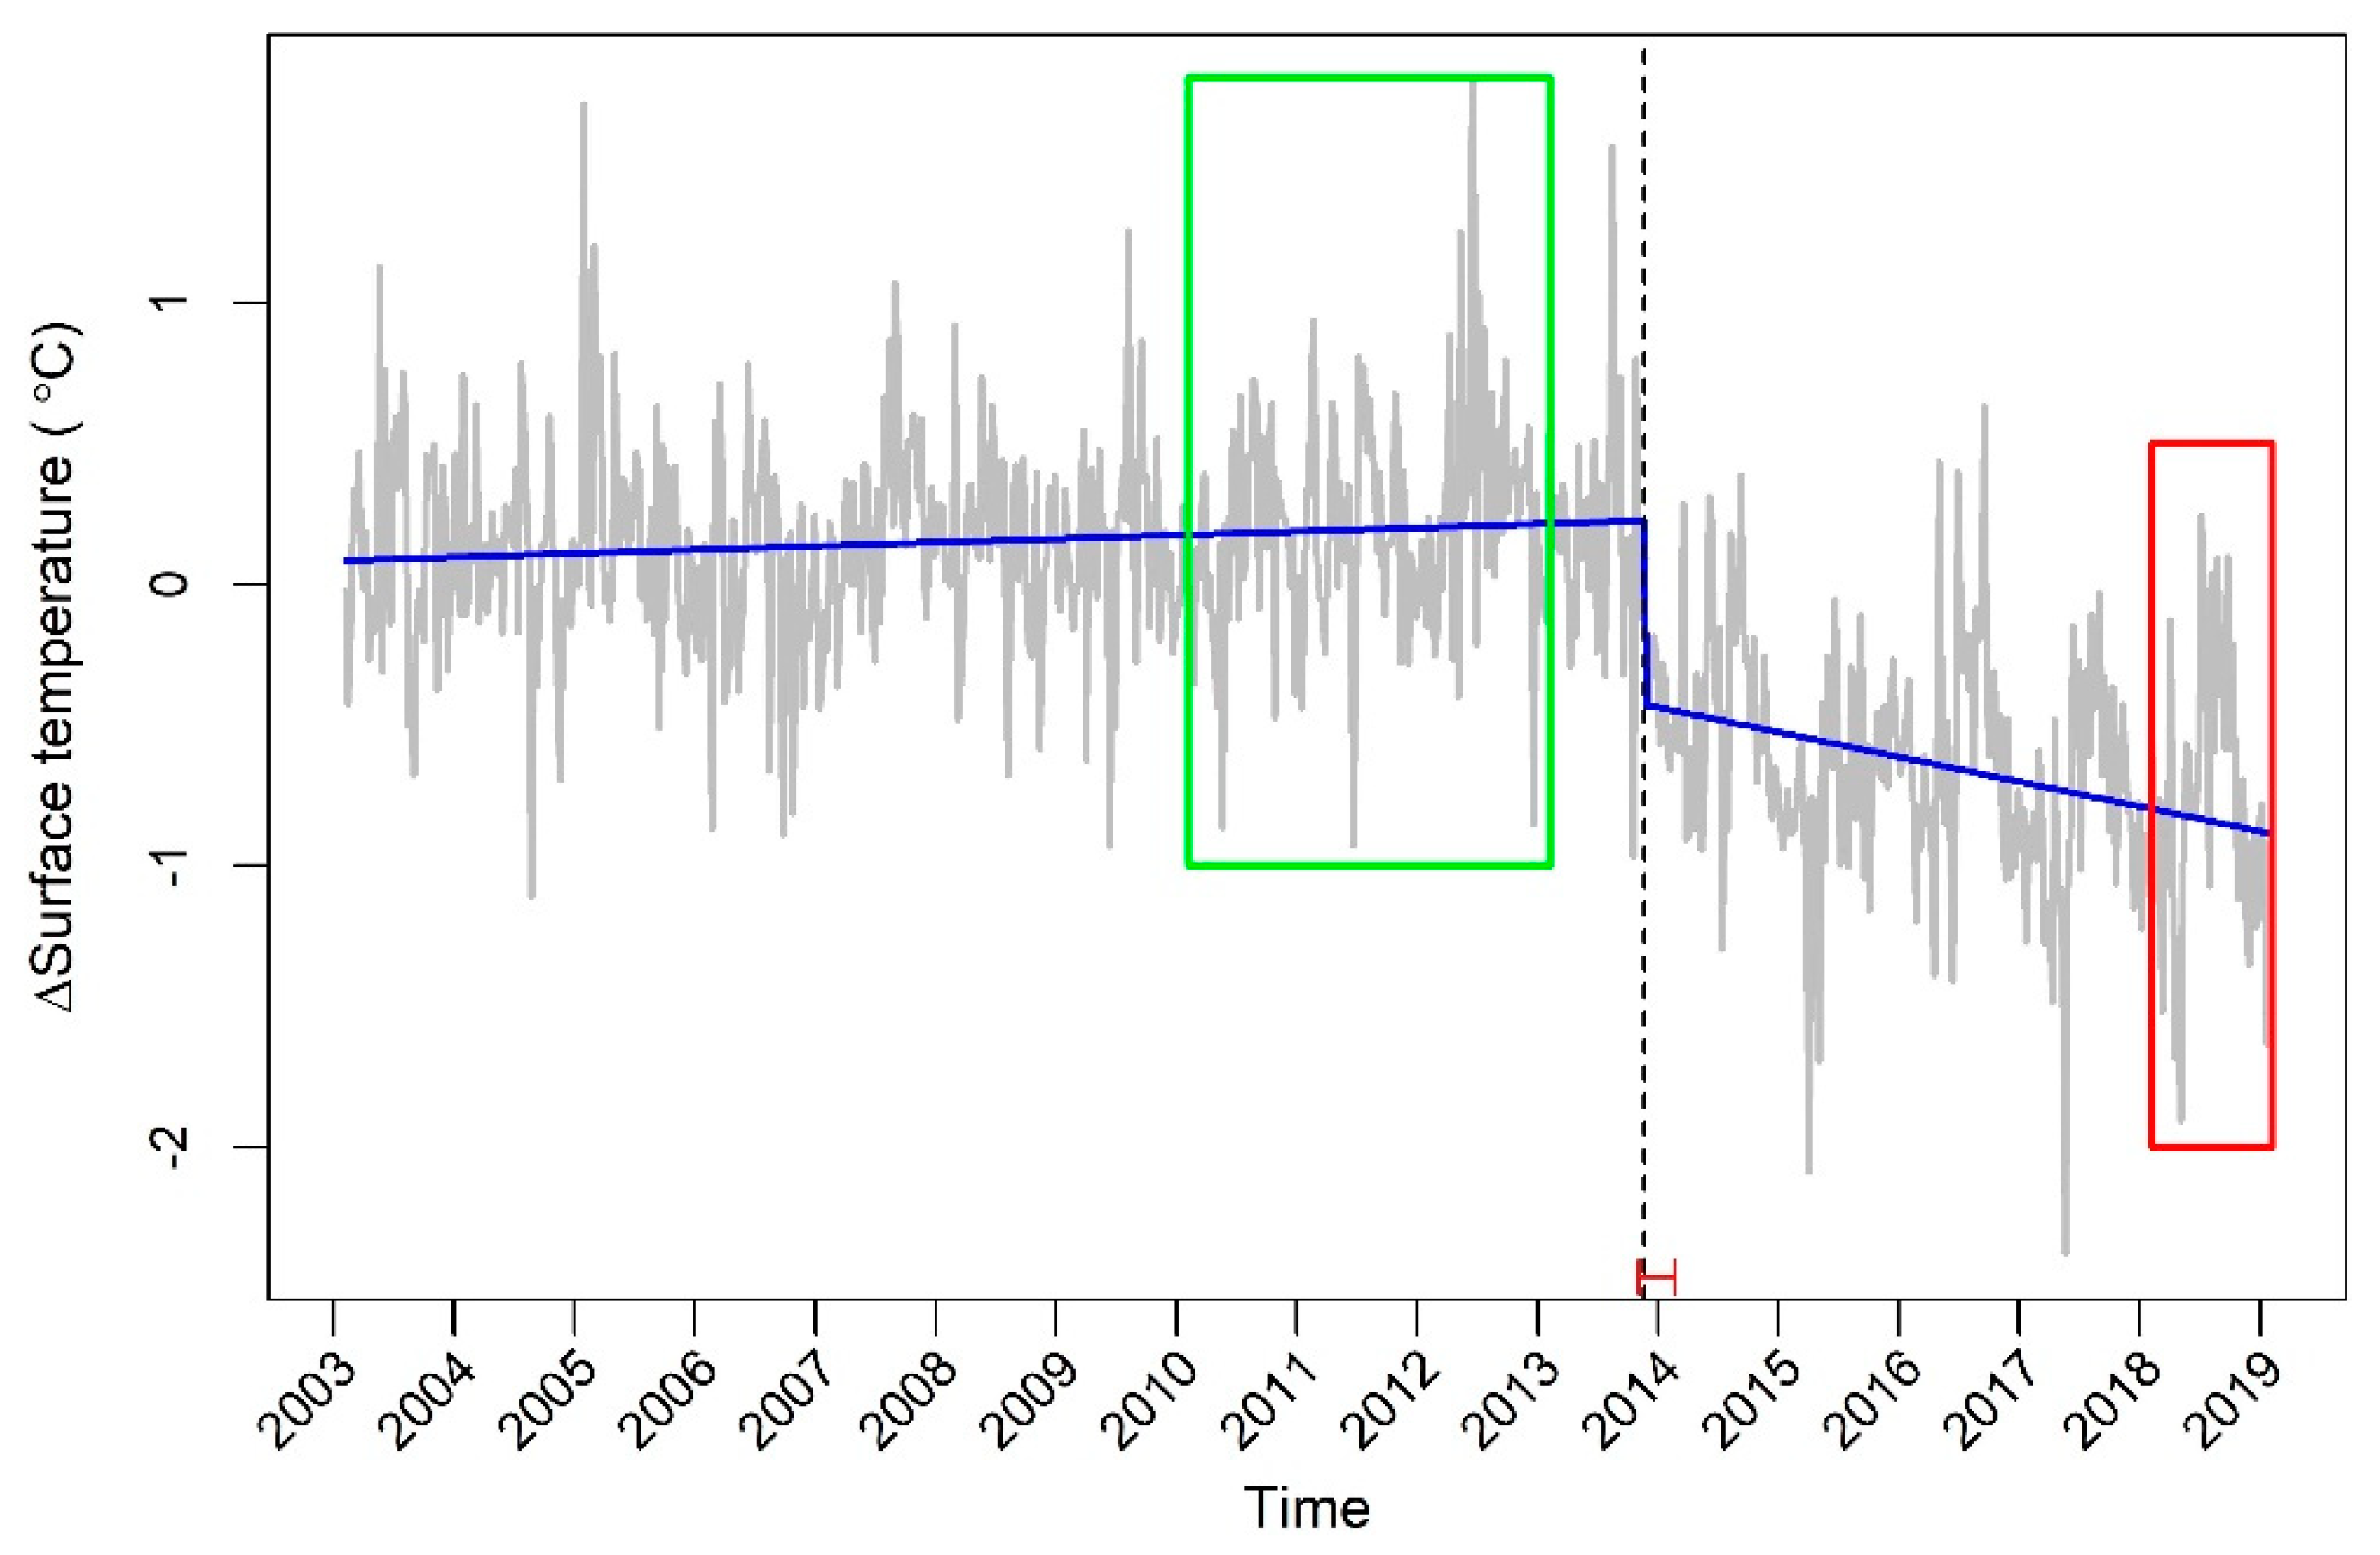
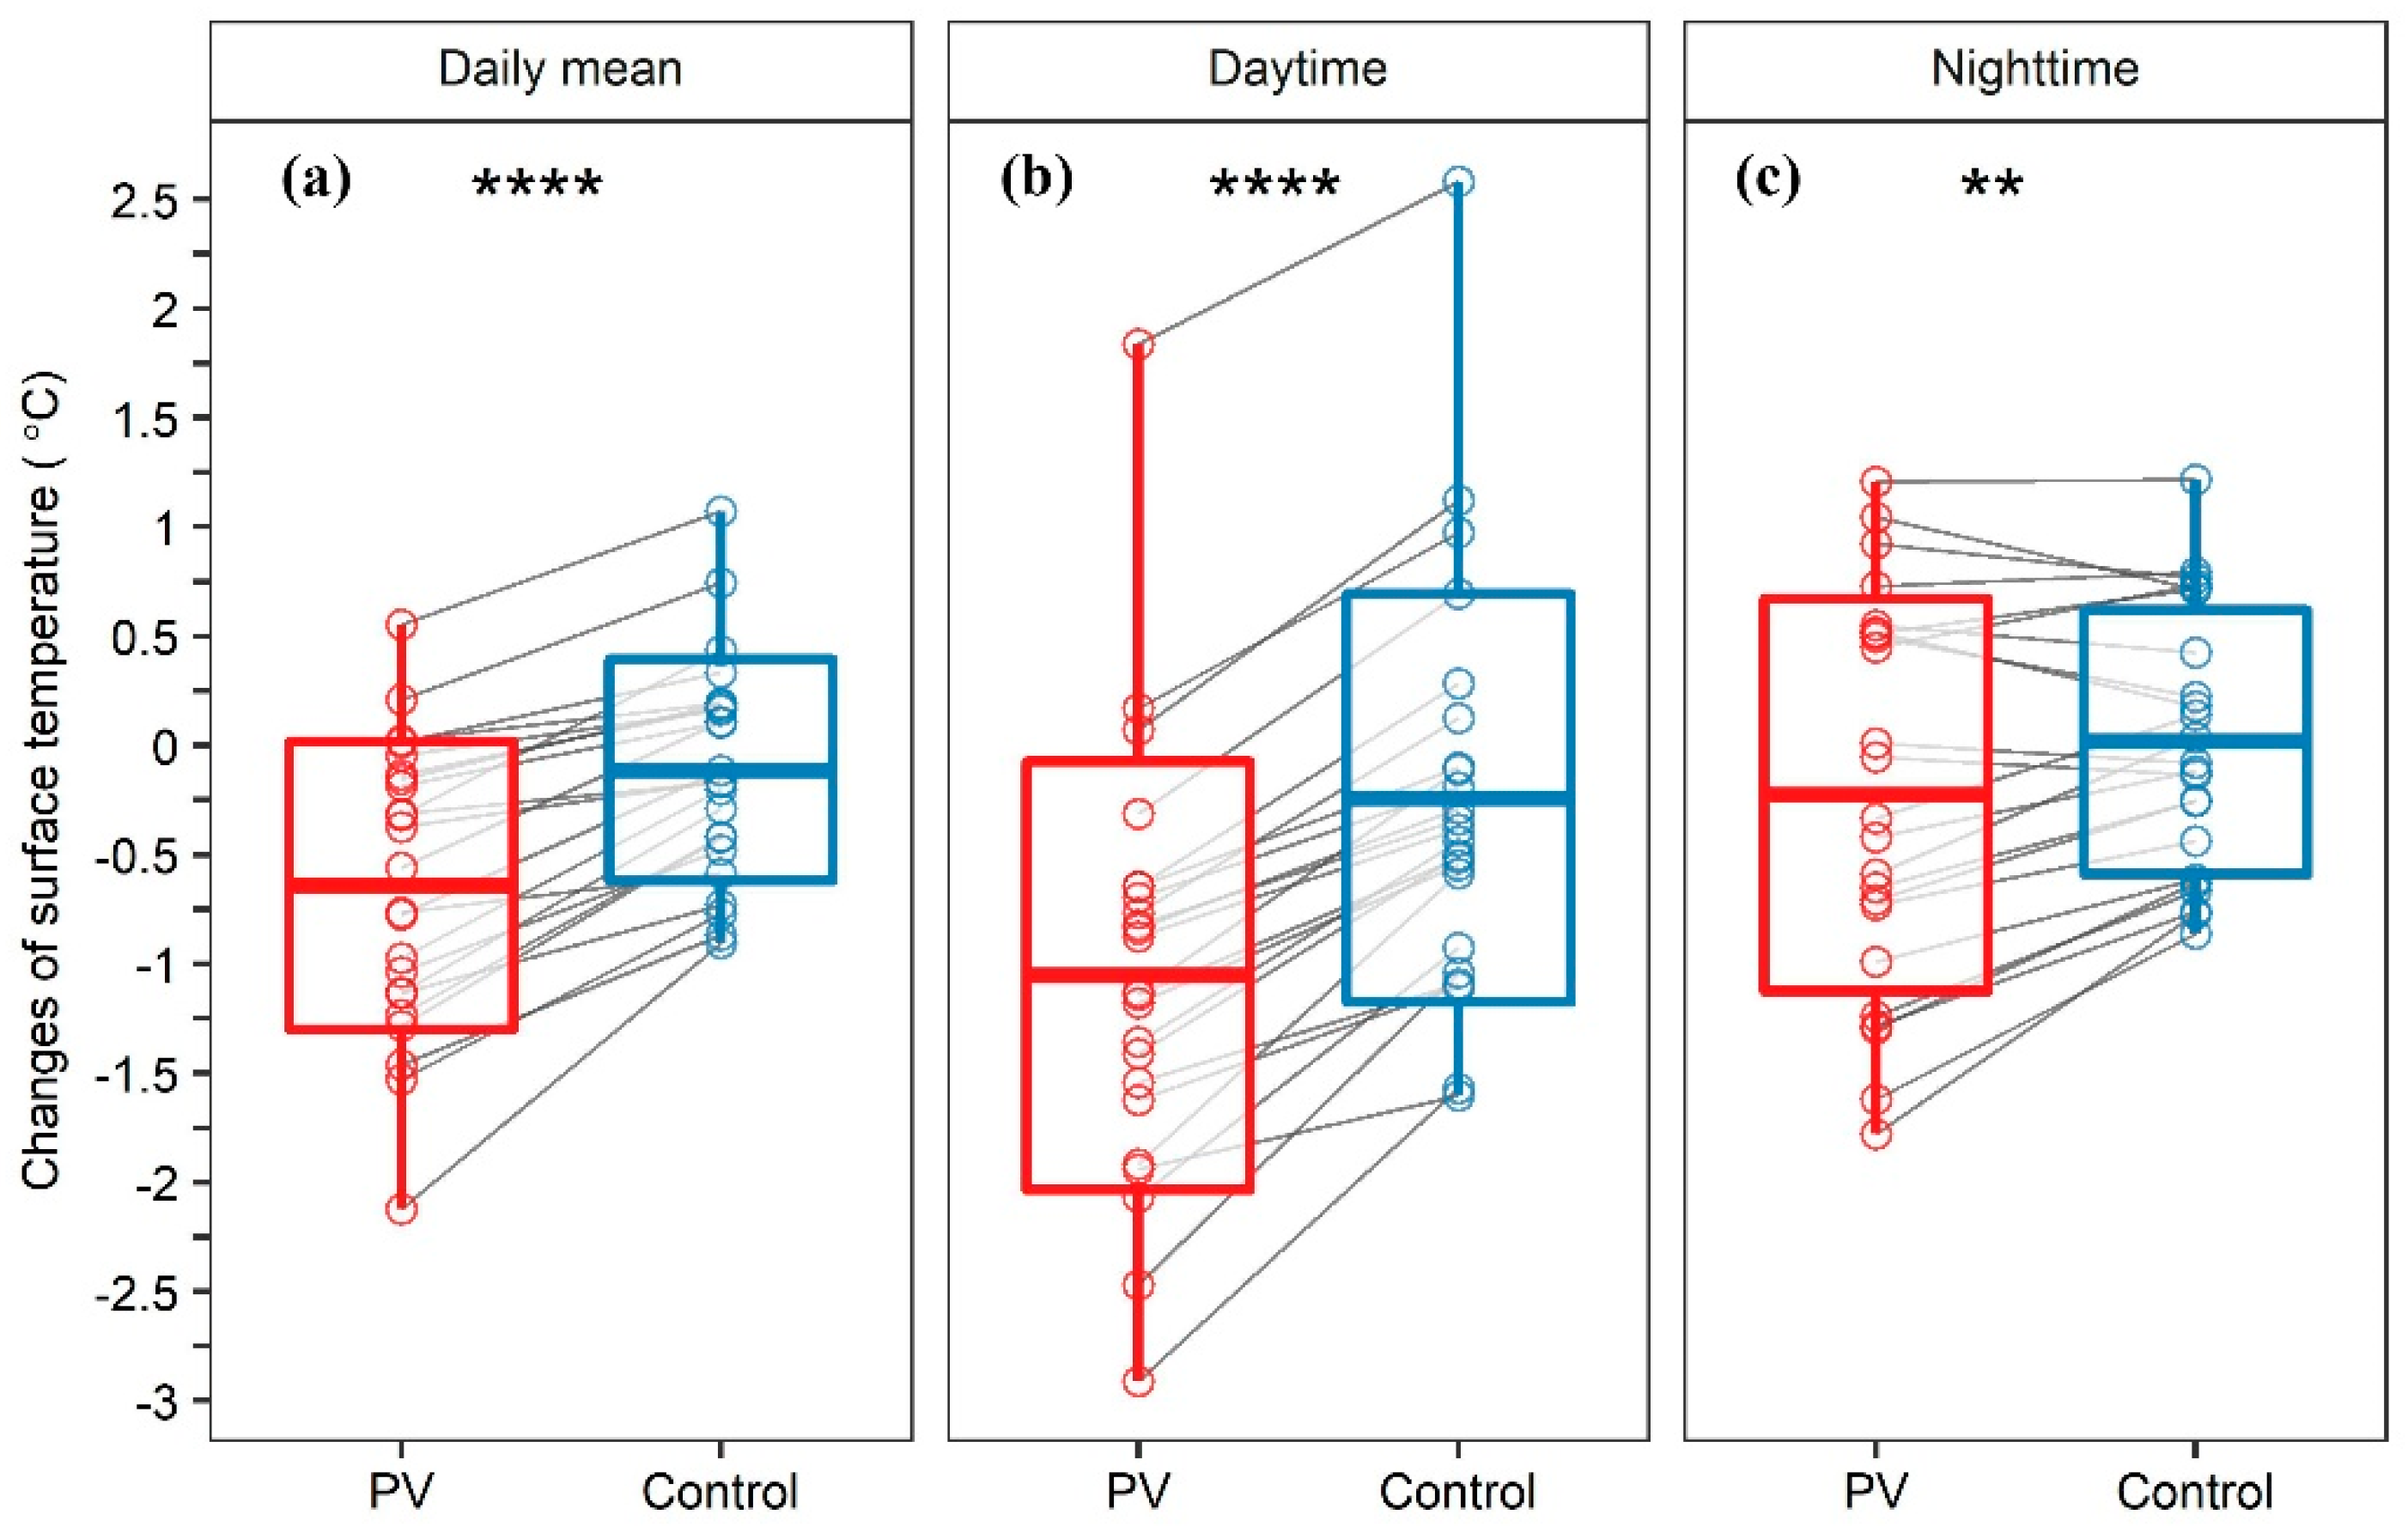
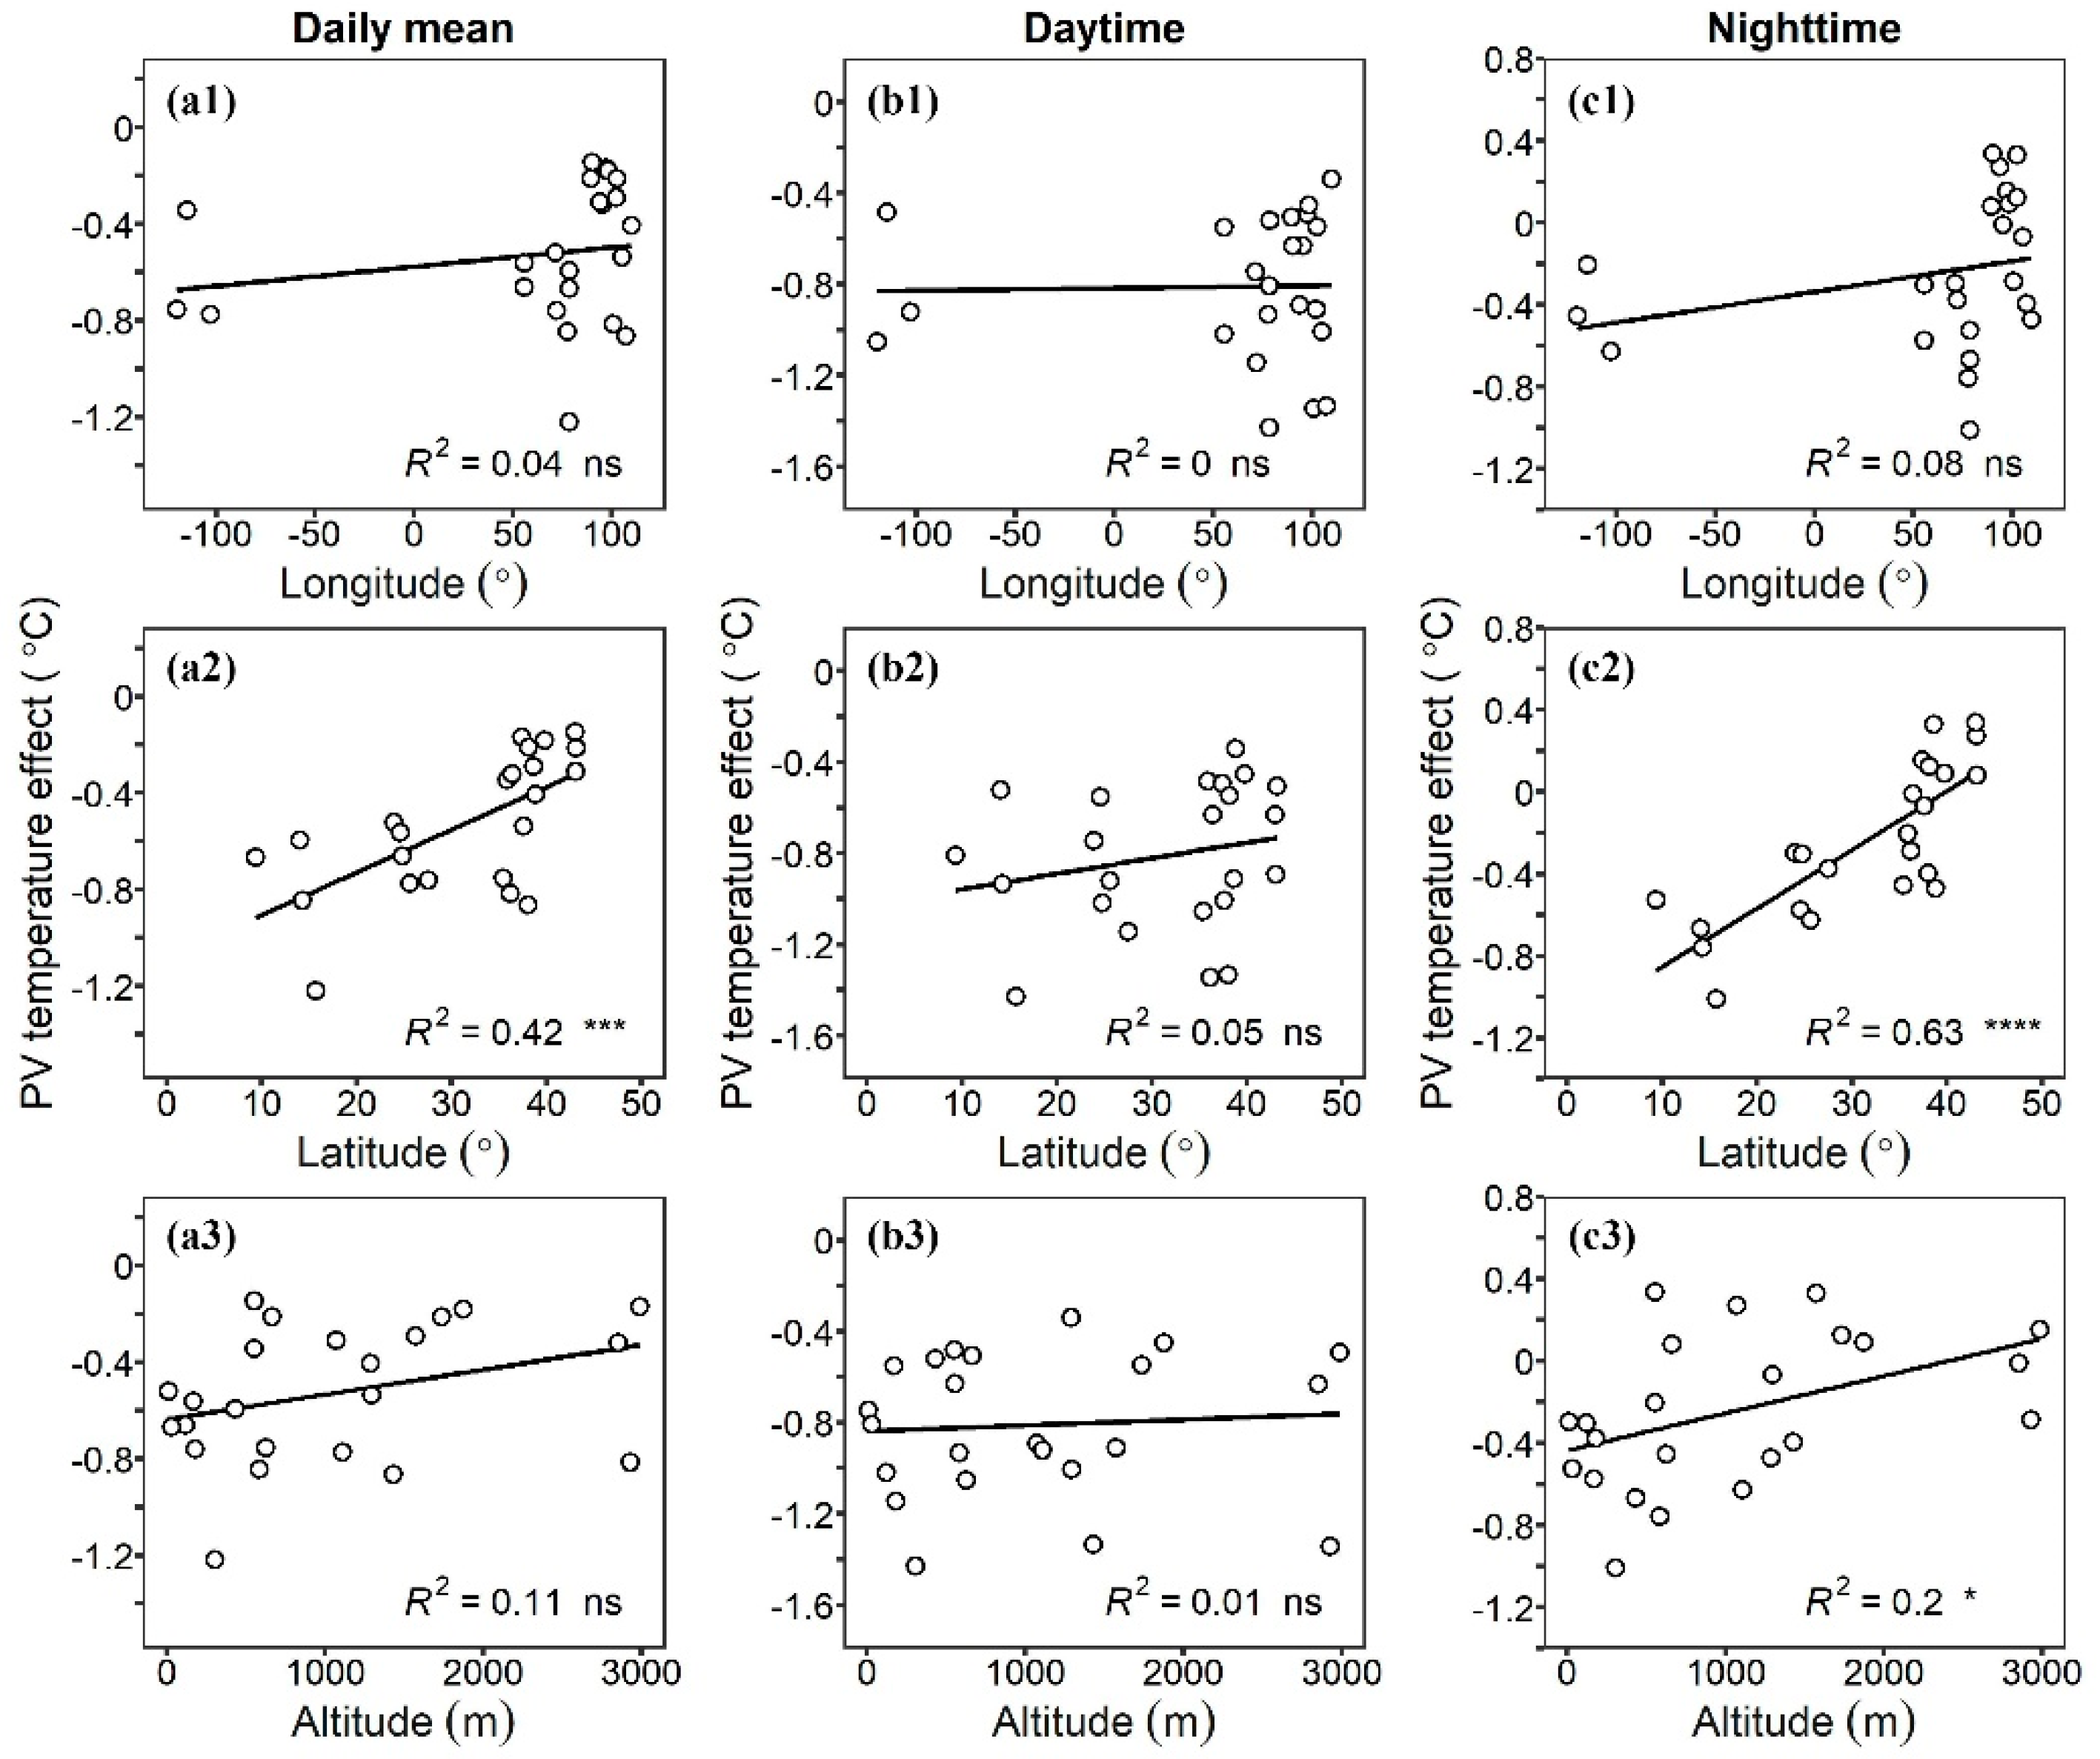
| PV Power Plant No. | Area (km2) | Located Country | Installation Year | Longitude (°) | Latitude (°) | Altitude (m.a.s.l) | Potential Electricity Production Per Unit Capacity (KWh/KWp) | Potential Annual Electricity Production (TWh) |
|---|---|---|---|---|---|---|---|---|
| 1 | 91.9 | China | 2013 | 100.54 | 36.13 | 2926.4 | 1788.2 | 8.22 |
| 2 | 56.6 | China | 2012 | 95.15 | 36.37 | 2850.0 | 1778.7 | 5.03 |
| 3 | 26.3 | China | 2013 | 102.12 | 38.60 | 1571.7 | 1650.7 | 2.17 |
| 4 | 21.4 | China | 2012 | 93.63 | 43.03 | 1069.4 | 1652.8 | 1.77 |
| 5 | 21.4 | Mexico | 2017 | −103.04 | 25.58 | 1107.0 | 1921.9 | 2.06 |
| 6 | 20.7 | China | 2013 | 105.03 | 37.56 | 1292.8 | 1618.9 | 1.68 |
| 7 | 18.4 | India | 2017 | 78.28 | 15.67 | 302.9 | 1551.3 | 1.43 |
| 8 | 16.9 | USA | 2013 | −120.03 | 35.37 | 624.1 | 1856.2 | 1.57 |
| 9 | 16.2 | USA | 2012 | −114.96 | 35.83 | 550.8 | 1860.5 | 1.51 |
| 10 | 16.2 | China | 2013 | 98.07 | 39.73 | 1872.3 | 1626.8 | 1.32 |
| 11 | 15.2 | China | 2012 | 102.31 | 38.10 | 1733.1 | 1623.7 | 1.23 |
| 12 | 15.1 | China | 2016 | 106.99 | 37.98 | 1428.0 | 1611.6 | 1.22 |
| 13 | 15.0 | China | 2011 | 97.19 | 37.36 | 2985.6 | 1857.3 | 1.39 |
| 14 | 13.7 | India | 2017 | 71.93 | 27.49 | 179.2 | 1691.4 | 1.16 |
| 15 | 13.5 | China | 2016 | 109.68 | 38.80 | 1286.8 | 1643.1 | 1.11 |
| 16 | 12.3 | India | 2016 | 71.20 | 23.90 | 9.6 | 1654.3 | 1.02 |
| 17 | 11.3 | India | 2013 | 77.47 | 14.25 | 583.4 | 1602.8 | 0.91 |
| 18 | 10.3 | China | 2017 | 90.03 | 42.96 | 551.9 | 1523.4 | 0.785 |
| 19 | 9.2 | India | 2013 | 78.38 | 9.32 | 29.1 | 1501.3 | 0.69 |
| 20 | 9.1 | UAE | 2016 | 55.38 | 24.75 | 118.8 | 1780.6 | 0.81 |
| 21 | 8.8 | China | 2016 | 89.33 | 43.12 | 661.4 | 1495.0 | 0.66 |
| 22 | 6.7 | UAE | 2017 | 55.44 | 24.54 | 167.5 | 1788.5 | 0.60 |
| 23 | 5.4 | India | 2013 | 78.43 | 14.03 | 430.5 | 1560.2 | 0.42 |
| PV Powerplant No. | Ta (°C) | P (mm) | Rs (W/m2) | Vp (kPa) | Ws (m/s) |
|---|---|---|---|---|---|
| 1 | 3.9 | 372.6 | 182.1 | 0.43 | 2.5 |
| 2 | 4.8 | 47.6 | 198.2 | 0.31 | 2.9 |
| 3 | 6.5 | 157.6 | 190.0 | 0.50 | 2.7 |
| 4 | 8.8 | 67.7 | 191.7 | 0.44 | 3.3 |
| 5 | 21.6 | 211.0 | 192.7 | 1.25 | 2.3 |
| 6 | 9.2 | 192.5 | 184.5 | 0.66 | 2.3 |
| 7 | 28.7 | 708.3 | 235.3 | 2.11 | 2.0 |
| 8 | 15.0 | 426.6 | 209.7 | 0.91 | 2.8 |
| 9 | 20.6 | 126.6 | 227.2 | 0.66 | 3.8 |
| 10 | 6.3 | 115.2 | 194.9 | 0.44 | 2.9 |
| 11 | 6.8 | 194.9 | 188.8 | 0.53 | 2.6 |
| 12 | 8.1 | 268.1 | 190.4 | 0.67 | 2.6 |
| 13 | 4.0 | 154.4 | 195.8 | 0.32 | 3.0 |
| 14 | 26.9 | 176.4 | 239.9 | 1.70 | 1.9 |
| 15 | 7.1 | 381.6 | 189.8 | 0.65 | 2.6 |
| 16 | 27.8 | 476.4 | 236.1 | 1.90 | 2.2 |
| 17 | 26.7 | 513.3 | 231.5 | 2.08 | 2.2 |
| 18 | 11.8 | 40.2 | 189.3 | 0.56 | 3.1 |
| 19 | 29.4 | 763.5 | 229.4 | 2.71 | 2.8 |
| 20 | 27.6 | 124.6 | 256.1 | 1.77 | 3.0 |
| 21 | 12.2 | 62.8 | 185.9 | 0.58 | 3.0 |
| 22 | 27.7 | 125.5 | 255.2 | 1.61 | 2.9 |
| 23 | 27.8 | 574.0 | 234.3 | 2.27 | 2.0 |
| Daily Mean Temperature (°C) | Daytime Temperature (°C) | Nighttime Temperature (°C) | |||||||||||||||||||
|---|---|---|---|---|---|---|---|---|---|---|---|---|---|---|---|---|---|---|---|---|---|
| PV Power Plant No. | PV Powerplant | Control Zone | PV Temperature Effect | PV Powerplant | Control Zone | PV Temperature Effect | PV Powerplant | Control Zone | PV Temperature Effect | ||||||||||||
| Before | After | Change | Before | After | Change | Before | After | Change | Before | After | Change | Before | After | Change | Before | After | Change | ||||
| 1 | 8.98 | 7.75 | −1.23 | 8.96 | 8.54 | −0.42 | −0.81 | 23.59 | 20.68 | −2.91 | 23.57 | 22.01 | −1.57 | −1.34 | −5.64 | −5.19 | 0.45 | −5.65 | −4.92 | 0.73 | −0.29 |
| 2 | 12.61 | 12.62 | 0.01 | 12.44 | 12.78 | 0.33 | −0.32 | 30.40 | 29.23 | −1.18 | 29.85 | 29.30 | −0.55 | −0.63 | −5.19 | −3.98 | 1.21 | −4.97 | −3.75 | 1.22 | −0.01 |
| 3 | 14.70 | 14.52 | −0.18 | 14.26 | 14.36 | 0.11 | −0.29 | 27.65 | 26.23 | −1.41 | 27.05 | 26.55 | −0.50 | −0.91 | 1.75 | 2.80 | 1.04 | 1.46 | 2.18 | 0.71 | 0.33 |
| 4 | 16.42 | 16.28 | −0.13 | 16.33 | 16.51 | 0.17 | −0.31 | 29.12 | 28.36 | −0.77 | 28.88 | 29.00 | 0.12 | −0.89 | 3.71 | 4.21 | 0.50 | 3.79 | 4.02 | 0.22 | 0.27 |
| 5 | 28.03 | 27.06 | −0.97 | 27.98 | 27.78 | −0.20 | −0.77 | 41.35 | 39.99 | −1.36 | 40.80 | 40.36 | −0.44 | −0.92 | 14.72 | 14.13 | −0.59 | 15.16 | 15.19 | 0.04 | −0.63 |
| 6 | 14.24 | 14.44 | 0.21 | 14.36 | 15.10 | 0.74 | −0.54 | 27.53 | 27.22 | −0.31 | 27.31 | 28.00 | 0.69 | −1.01 | 0.94 | 1.67 | 0.73 | 1.40 | 2.20 | 0.79 | −0.07 |
| 7 | 32.70 | 30.58 | −2.12 | 32.35 | 31.45 | −0.91 | −1.22 | 42.42 | 39.95 | −2.47 | 41.78 | 40.73 | −1.04 | −1.43 | 22.99 | 21.21 | −1.78 | 22.93 | 22.16 | −0.77 | −1.01 |
| 8 | 20.72 | 20.41 | −0.32 | 21.12 | 21.55 | 0.43 | −0.75 | 34.62 | 34.69 | 0.07 | 35.09 | 36.22 | 1.12 | −1.05 | 6.83 | 6.12 | −0.71 | 7.15 | 6.89 | −0.25 | −0.45 |
| 9 | 24.71 | 24.56 | −0.15 | 24.87 | 25.06 | 0.19 | −0.34 | 38.18 | 37.36 | −0.82 | 38.38 | 38.04 | −0.34 | −0.48 | 11.25 | 11.76 | 0.51 | 11.37 | 12.08 | 0.72 | −0.20 |
| 10 | 12.92 | 12.16 | −0.77 | 12.90 | 12.31 | −0.59 | −0.18 | 26.50 | 24.96 | −1.54 | 26.48 | 25.39 | −1.09 | −0.45 | −0.66 | −0.65 | 0.01 | −0.68 | −0.76 | −0.08 | 0.09 |
| 11 | 12.52 | 12.47 | −0.05 | 12.23 | 12.39 | 0.16 | −0.21 | 24.65 | 24.01 | −0.65 | 24.16 | 24.05 | −0.10 | −0.55 | 0.39 | 0.94 | 0.55 | 0.30 | 0.73 | 0.43 | 0.13 |
| 12 | 13.02 | 11.74 | −1.28 | 12.94 | 12.52 | −0.42 | −0.86 | 26.03 | 24.11 | −1.92 | 26.00 | 25.41 | −0.58 | −1.33 | 0.01 | −0.64 | −0.65 | −0.11 | −0.37 | −0.26 | −0.39 |
| 13 | 9.97 | 9.99 | 0.02 | 9.24 | 9.43 | 0.19 | −0.17 | 23.64 | 22.76 | −0.88 | 22.62 | 22.23 | −0.38 | −0.49 | −3.70 | −2.78 | 0.92 | −4.14 | −3.37 | 0.77 | 0.16 |
| 14 | 32.25 | 30.72 | −1.53 | 32.26 | 31.49 | −0.77 | −0.76 | 44.59 | 42.53 | −2.07 | 44.43 | 43.50 | −0.93 | −1.14 | 19.91 | 18.92 | −0.99 | 20.09 | 19.47 | −0.61 | −0.37 |
| 15 | 11.10 | 9.96 | −1.14 | 11.02 | 10.28 | −0.73 | −0.40 | 22.95 | 21.01 | −1.94 | 22.65 | 21.04 | −1.60 | −0.34 | −0.75 | −1.09 | −0.33 | −0.61 | −0.47 | 0.14 | −0.47 |
| 16 | 30.83 | 31.38 | 0.55 | 31.74 | 32.81 | 1.07 | −0.52 | 40.70 | 42.54 | 1.84 | 41.91 | 44.49 | 2.58 | −0.74 | 20.96 | 20.23 | −0.73 | 21.57 | 21.13 | −0.44 | −0.30 |
| 17 | 30.48 | 29.35 | −1.13 | 30.30 | 30.01 | −0.29 | −0.84 | 39.80 | 39.15 | −0.65 | 39.28 | 39.57 | 0.28 | −0.93 | 21.17 | 19.55 | −1.62 | 21.31 | 20.45 | −0.86 | −0.76 |
| 18 | 18.63 | 18.31 | −0.31 | 18.63 | 18.46 | −0.17 | −0.15 | 32.13 | 30.99 | −1.14 | 31.89 | 31.37 | −0.51 | −0.63 | 5.12 | 5.64 | 0.52 | 5.37 | 5.55 | 0.18 | 0.34 |
| 19 | 32.13 | 31.57 | −0.56 | 32.00 | 32.10 | 0.11 | −0.67 | 40.27 | 40.43 | 0.17 | 40.01 | 40.98 | 0.98 | −0.81 | 23.99 | 22.70 | −1.28 | 23.98 | 23.22 | −0.76 | −0.52 |
| 20 | 32.87 | 32.09 | −0.77 | 32.87 | 32.75 | −0.12 | −0.66 | 45.63 | 44.50 | −1.13 | 45.70 | 45.59 | −0.11 | −1.02 | 20.11 | 19.69 | −0.42 | 20.03 | 19.91 | −0.12 | −0.30 |
| 21 | 18.60 | 18.23 | −0.38 | 18.55 | 18.38 | −0.16 | −0.21 | 30.67 | 29.97 | −0.70 | 30.61 | 30.42 | −0.19 | −0.50 | 6.54 | 6.49 | −0.05 | 6.48 | 6.35 | −0.13 | 0.08 |
| 22 | 34.05 | 33.02 | −1.03 | 33.80 | 33.32 | −0.48 | −0.55 | 47.41 | 46.58 | −0.83 | 46.92 | 46.63 | −0.29 | −0.54 | 20.70 | 19.46 | −1.24 | 20.68 | 20.01 | −0.67 | −0.57 |
| 23 | 31.48 | 30.02 | −1.46 | 31.28 | 30.41 | −0.87 | −0.59 | 40.03 | 38.41 | −1.62 | 39.68 | 38.58 | −1.10 | −0.52 | 22.92 | 21.62 | −1.30 | 22.88 | 22.25 | −0.63 | −0.67 |
| Mean | 21.48 | 20.84 | −0.64 | 21.41 | 21.30 | −0.11 | −0.53 | 33.90 | 32.85 | −1.05 | 33.69 | 33.45 | −0.24 | −0.81 | 9.04 | 8.81 | −0.23 | 9.12 | 9.13 | 0.01 | −0.24 |
| Subscript No. | Equation (1) (a) | Equation (2) (b) | Equation (3) (c) |
|---|---|---|---|
| 0 | 1.239 × 101 | 6.225 × 10⁻¹ | 6.402 × 10⁻⁹ |
| 1 | 1.001 × 10⁻¹ | 1.061 ×10⁻² | 1.385 × 10⁻¹⁰ |
| 2 | 1.659 × 10⁻³ | 3.975 ×10⁻⁶ | 2.645 × 10⁻¹³ |
| 3 | −2.865 × 10⁻⁶ | 9.671 × 10⁻⁸ | 1.013 × 10⁻¹⁵ |
| 4 | −1.726 × 10⁻¹ | −1.212 ×10⁻² | −1.428 × 10⁻¹⁰ |
| 5 | 4.143 × 10⁻⁴ | 2.817 × 10⁻⁵ | 3.322 × 10⁻¹³ |
| 6 | −4.463 | −3.158 × 10⁻¹ | −3.955 × 10⁻⁹ |
| 7 | 1.077 | 5.161 × 10⁻² | 6.173 × 10⁻¹⁰ |
| 8 | 3.184 | 2.785 × 10⁻¹ | 3.729 × 10⁻⁹ |
| 9 | −6.294 × 10⁻¹ | −5.492 × 10⁻² | −7.287 × 10⁻¹⁰ |
| 10 | −4.381 | −1.303 × 10⁻¹ | −1.289 × 10⁻⁹ |
| 11 | 3.369 × 101 | 3.997 | 4.922 × 10⁻⁸ |
| 12 | −8.060 × 101 | −9.889 | −1.211 × 10⁻⁷ |
| 13 | −8.405 × 10⁻³ |
© 2020 by the authors. Licensee MDPI, Basel, Switzerland. This article is an open access article distributed under the terms and conditions of the Creative Commons Attribution (CC BY) license (http://creativecommons.org/licenses/by/4.0/).
Share and Cite
Zhang, X.; Xu, M. Assessing the Effects of Photovoltaic Powerplants on Surface Temperature Using Remote Sensing Techniques. Remote Sens. 2020, 12, 1825. https://doi.org/10.3390/rs12111825
Zhang X, Xu M. Assessing the Effects of Photovoltaic Powerplants on Surface Temperature Using Remote Sensing Techniques. Remote Sensing. 2020; 12(11):1825. https://doi.org/10.3390/rs12111825
Chicago/Turabian StyleZhang, Xunhe, and Ming Xu. 2020. "Assessing the Effects of Photovoltaic Powerplants on Surface Temperature Using Remote Sensing Techniques" Remote Sensing 12, no. 11: 1825. https://doi.org/10.3390/rs12111825
APA StyleZhang, X., & Xu, M. (2020). Assessing the Effects of Photovoltaic Powerplants on Surface Temperature Using Remote Sensing Techniques. Remote Sensing, 12(11), 1825. https://doi.org/10.3390/rs12111825


