Abstract
Tree-level information can be estimated based on light detection and ranging (LiDAR) point clouds. We propose to develop a quantitative structural model based on terrestrial laser scanning (TLS) point clouds to automatically and accurately estimate tree attributes and to detect real trees for the first time. This model is suitable for forest research where branches are involved in the calculation. First, the Adtree method was used to approximate the geometry of the tree stem and branches by fitting a series of cylinders. Trees were represented as a broad set of cylinders. Then, the end of the stem or all branches were closed. The tree model changed from a cylinder to a closed convex hull polyhedron, which was to reconstruct a 3D model of the tree. Finally, to extract effective tree attributes from the reconstructed 3D model, a convex hull polyhedron calculation method based on the tree model was defined. This calculation method can be used to extract wood (including tree stem and branches) volume, diameter at breast height (DBH) and tree height. To verify the accuracy of tree attributes extracted from the model, the tree models of 153 Chinese scholartrees from TLS data were reconstructed and the tree volume, DBH and tree height were extracted from the model. The experimental results show that the DBH and tree height extracted based on this model are in better consistency with the reference value based on field survey data. The bias, RMSE and R2 of DBH were 0.38 cm, 1.28 cm and 0.92, respectively. The bias, RMSE and R2 of tree height were −0.76 m, 1.21 m and 0.93, respectively. The tree volume extracted from the model is in better consistency with the reference value. The bias, root mean square error (RMSE) and determination coefficient (R2) of tree volume were −0.01236 m3, 0.03498 m3 and 0.96, respectively. This study provides a new model for nondestructive estimation of tree volume, above-ground biomass (AGB) or carbon stock based on LiDAR data.
1. Introduction
Currently, LiDAR technology is widely used to extract tree location, tree height, diameter at breast height (DBH), tree crown and tree species classification, etc. [1,2]. It also provides basic data for tree volume, biomass and carbon stock estimation. A common approach is to input tree attributes (DBH, tree height and specific wood density) into an allometric model established by destructive methods to estimate tree volume or above-ground biomass (AGB) [3,4,5,6]. These indirect methods are often based on different assumptions, which makes it difficult to carry out any meaningful verification of the measured results. Uncertainty is hard to quantify or even unknown [7]. This indirect estimation method introduces the error propagation chain, and the largest source of error comes from the allometric equation [6,8]. The real and direct measurement of tree volume or biomass is to cut down and weigh the mass of all the trees in the plot. However, this method is expensive and inefficient, so indirect measurement methods are needed [9]. The reconstruction of trees 3D model based on LiDAR point clouds can measure the tree attributes with less practical difficulties, and it is not destructive to trees [10,11]. The reconstructed tree model contains the geometry and topology of the tree, and the attributes of branches or stem can be derived quickly and accurately [12,13,14]. In general, estimating tree attributes in forestry focuses more on the shape and mass of the stem than on the size and structure of the branches [15,16]. However, higher order branch structures and topologies are important for estimating tree volume, AGB, carbon stock, canopy gap, canopy size and other more general ecological characteristics [17,18,19]. The geometric and statistical properties of trees are crucial to forest management, especially pre-harvest forecasting. For example, there are attributes such as the base and height of the canopy, the volume of the stem or branch, the structure and size distribution of the branch [20,21]. However, many features are difficult or even impossible to measure. Estimation of carbon cycle, stand stock, biomass, tree mass and decline time of branches all require accurate estimation of branch size and tree attributes [22,23].
Three-dimensional reconstruction of trees based on terrestrial laser scanning (TLS) point clouds can directly obtain the structure or size distribution of main-branch of trees, the base and height of tree canopy [24,25,26,27]. The proposed method produces a geometric model that describes the components of a complete overground tree in hierarchical order [3,28,29]. This model can be called quantitative structural model (QSM). To date, some QSM methods based on LiDAR data are used for 3D reconstruction of trees. The QSM method still relies on destructive measurements for accurate verification. Compared with the method based on the allometric model, the QSM method can directly measure the volume of stem or branch, canopy volume and the total volume of trees on the ground under the condition of the known size and geometric distribution of higher-order branches [20,30,31,32,33]. Moreover, the AGB or carbon stock can be derived by QSM method [32,34,35]. One of the key differences that may arise in the application of a forest management-specific approach to a more general approach is the identification and accurate modeling of higher-order branches. The QSM method can calculate the length or volume of higher order branches. These problems can be solved by providing estimates of the volume of a single tree level or stock of a plot level. The estimation of tree volume, AGB and other attributes by QSM method is independent of the allometric model. There is no deviation in the size distribution of the tree, and the uncertainty can be quantified [8,36,37]. To date, the TreeQSM developed by Pasi Raumonen et al. is a model that has been used many times. Destructive experiments have verified the high accuracy of TreeQSM [26], which is also used by some researchers to model trees. However, the TreeQSM still has some areas for improvement, such as the reconstructed tree model cannot guarantee that the branches have a reasonable geometric topology. Other QSM methods include PypeTree and SimpleTree [17,27]. PypeTree gives only a rough description of the topological structure of the tree and does not attempt to restore branch geometry. The process of model reconstruction by SimpleTree is very complicated. Moreover, the user needs to enter key parameters (such as the radius of the branch). It requires a near-perfect input, namely a complete point clouds of trees, which is rarely satisfied in practice [17,31]. In addition, SimpleTree cannot detect the cylinder of the branch and restore the branch geometry. In general, the current tree quantitative structural models are still relatively rare and have some shortcomings. Therefore, it is necessary to develop QSM based on TLS point clouds to estimate tree attributes. Moreover, it is necessary to study QSM methods that do not rely on the allometric models to non-destructively estimate tree volume, biomass or other more general ecological characteristics.
Following the practice of QSM, a tree quantitative structure model based on TLS point clouds was developed. From this model, overground tree volume, stem and branch structure distribution or size, DBH and tree height were calculated. Our model has a higher topological and geometric accuracy and can non-destructively estimate tree volume or AGB without relying on the allometric model. The AdTree is a high-precision tree geometric structure reconstruction method [31]. However, it cannot yet quantitatively calculate tree attributes, so we improved and extended the AdTree method. The tree is transformed from a set of generalized cylinders into a completely closed polyhedron. To effectively extract wood (including tree stem and branches) volume, DBH and tree height from the tree reconstruction model, the convex hull polyhedron calculation method was defined. To verify the accuracy of the tree attributes, the tree model from 153 Chinese scholartrees TLS point clouds was reconstructed. Statistical methods were used to analyze the experimental data. The experimental results show that the method is effective and has better consistency with the reference values.
2. Materials and Methods
2.1. Data Preparation
2.1.1. Acquisition and Processing of TLS Data
This study used FARO FOCUS150 terrestrial laser scanner (FARO Technologies, Inc., www.faro.com) to collect point clouds from Chinese scholartrees (Sophora japonica) in spring 2018. The scanner had a horizontal field of view of 360°, a vertical field of view of 300° and a minimum horizontal and vertical step size of 0.009°. The maximum data acquisition rate of the laser scanner was 976,000 points/s, and the acquisition rate used in this study was 244,000 points/s. The scanner’s full hemispherical scan contained approximately 40,000 laser pulses. It used a 1500 nm continuous wave to measure distances up to 153 m. The laser scanning level of the scanner was one level. The distance error of the system in 25 m range was less than 1 mm, which was helpful to obtain high-precision forest sample plot data. FARO Scene (FARO Technologies, Inc., version 7.1.0) was the software that comes with the laser scanner for post-processing of original point clouds. FARO Scene software was used to assess the quality of point clouds data and to filter out “ghost points” and discrete points. The function of “Clear Sky” and “Clear Contour” was used to obtain more reliable 3D spatial data.
Studies have shown that multiple scans (MS) can extract tree stem more accurately than a single scan [9,38,39]. To minimize the influence of trees occlusion or ground vegetation, we used multi-scan method to obtain a circular plot with a radius of 20 m with better point clouds coverage. Five scan locations were established within a radius of 20 m in the center of the circular plot [38,40]. One scan location was in the center and the other four scan locations were around (Figure 1). The trees were continuously scanned in a clockwise order, and the circular plot point cloud with a radius of 20 m was finally obtained. Twelve artificial target high reflection spheres were distributed throughout the field. Moreover, at least three spheres must have been visible for every two consecutive scan locations. FARO Scene software was used to achieve the registration of point clouds in different scan locations, with the registration accuracy within 1 cm. In this study, data collection was carried out under the condition of no wind, which was helpful to avoid the inconsistency of spatial location of the same branches in different scanning locations. To eliminate the influence of different resolutions on the modeling results, all tree scanning data were collected at the same scanning resolution.
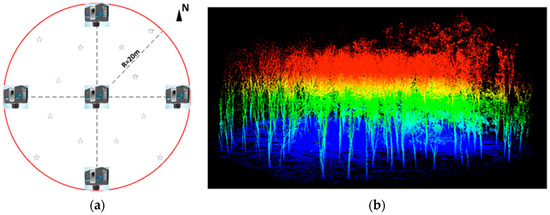
Figure 1.
Geometry of the reference plot and the point clouds of Chinese scholartree derived by terrestrial laser scanning (TLS). (a) Circular reference plots for multi-scan mode TLS field work and the reference targets spheres were illustrated using stars; (b) semi-automatic segmentation of TLS point clouds at the classification points of ground (dark blue) and vegetation (RGB color according to height).
The accuracy of single-tree segmentation can directly affect the accuracy of our model and thus affect the estimation accuracy of tree attributes. First, LiDAR360 software (Beijing Digital Green Earth Technology Co., Ltd., www.LiDAR360.com) was used in this study to extract single-tree point clouds. This software used an improved progressive triangulation densification algorithm to classify ground points and generates the DEM through the irregular triangulation interpolation algorithm. The normalization operations of the plot cloud data were completed [41,42,43,44]. Then, the 3D coordinate data of 180 Chinese scholartrees were obtained by single-tree segmentation based on seed points. The top of the tree or near the top of the tree was selected as the seed point. Finally, the point clouds of a single tree after segmentation was checked one-by-one, and the trees with incorrect classification were manually re-segmented in this study. Trees with incomplete stem or canopy point clouds were not involved in modeling. Point clouds that diverge significantly from the tree were manually removed. Finally, 153 Chinese scholartrees were modeled.
2.1.2. Field Data
The DBH and tree height of Chinese scholartree were obtained by the traditional forest survey method. In this study, the total station (KTS-44R4LCN total station, South Surveying & Mapping Technology CO., LTD) was used to measure the tree height accurately based on the triangulation principle. The DBH of each tree (1.3 m perpendicular to the ground from the bottom of the tree) was measured manually using a DBH tape with millimeter accuracy. The DBH and height measured in the field were the reference values of TLS data. The reference value of DBH ranged from 5.6 cm to 23.6 cm. The reference value of tree height ranged from 4.91 m to 21.86 m. The average value and standard deviation of DBH were 13.4 cm and 4.1 cm, and the average value and standard deviation of tree height were 13.44 m and 3.25 m. Figure 2 shows the histogram of DBH and tree height distribution. To match the field measurement data with the point clouds, we placed 5 target poles in the plot. Every two poles were visible to each other, the scanner scans five poles. After the relative coordinates of all trees and poles were extracted from the point clouds, the total station was used to set up the observation station and obtain the coordinate positions of all trees. The coordinates of the observation station come from the point clouds of the poles.
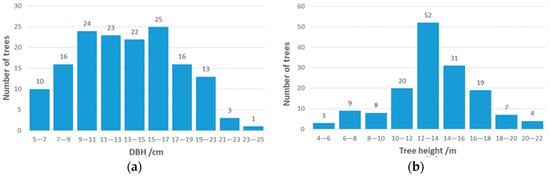
Figure 2.
Histogram of diameter at breast height (DBH) and tree height distribution. (a) DBH; (b) tree height.
2.2. Three-Dimensional Tree Model Reconstruction Based on AdTree
The geometry and topology of the reconstructed model reflect the actual shape of the tree. The higher the fidelity of the model, the more accurate the tree attributes derived from the model. Three-dimensional model reconstruction was the geometric basis for establishing a quantitative structure model of trees. To generate tree stem and branches with high-precision geometry and topological structure, this study used the AdTree method proposed by Shenglan Du et al. in 2019 [31]. In the reconstruction process, Adtree considers the geometric accuracy and topological fidelity of trees. On one hand, main-branch point centralization was used to assist the tree skeleton construction process, which helps to generate high-quality branch structures. On the other hand, a method based on optimization was used to reconstruct the geometric structure of tree branch accurately. The AdTree method was robust to trees of different species and sizes [31]. As long as the input point clouds had a clear branch structure, high-quality tree models can be generated.
The reconstructed stems and branches of Adtree were more realistic than other open-source tree cylinder fitting methods and the distance between input point and output model was less than 10 cm [17,27,28,31]. It can show powerful natural patterns in computational forestry. Therefore, the AdTree method provides a geometric basis for the automatic, detailed and accurate reconstruction of the 3D model of trees. In this study, the Adtree method was used to reconstruct the geometric and topological structure of trees. Figure 3, Figure 4 and Figure 5 show the complete process of tree 3D model reconstruction based on the TLS data.
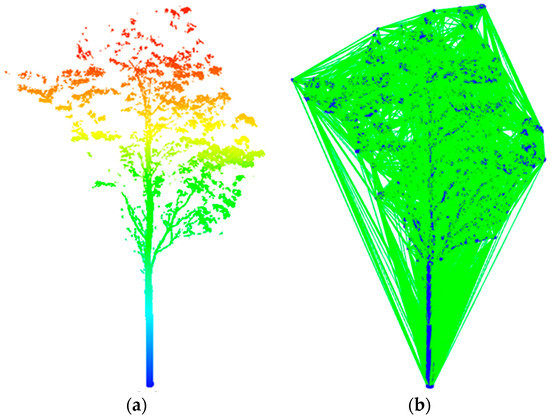
Figure 3.
Input for the original point clouds and obtain the Delaunay triangulation. (a) Point clouds after single-tree segmentation colored by height; (b) edges of the Delaunay triangulation of a tree’s input point clouds.
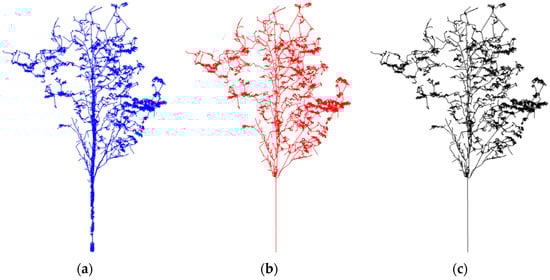
Figure 4.
Skeleton initialization and simplification. (a) Initial skeleton; (b) simplified the initial skeleton; (c) final skeleton.
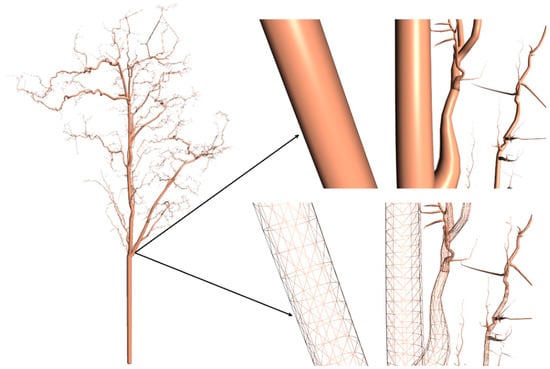
Figure 5.
Tree stem and branches were fitted to the constructed tree skeleton.
The Minimum Spanning Tree (MST) was extracted between the edges of the Delaunay triangulation of the point [31,45]. The Delaunay triangulation had laid a foundation for MST calculation. It helps complete missing areas or incomplete branches, and ensures robustness for input point clouds with poor data quality. After the triangulation graph was obtained, all the edges were weighted by the length of the edges defined in Euclidean space. The Dijkstra shortest path algorithm was used to calculate MST from triangulation [46,47,48,49]. The quality of the skeleton can be improved by pre-determining and concentrating the main-branch points. Assign weight values to vertices and edges and remove small noise components based on this value [50]. Finally, the lightweight tree skeleton was reconstructed by iteratively checking the proximity between adjacent vertices and merging adjacent vertices.
On the basis of the final tree skeleton, the geometric model of the tree was obtained by a cylinder-fitting approach. The exact branch geometry was obtained based on the optimization method [28,51,52]. Levenberg Marquardt algorithm was used to solve the nonlinear least-squares problem [53]. A kd-tree data structure was used for fast spatial neighbor searching. First, the adjacent points within the stem were segmented and identified. Then, according to the corresponding stem points, a cylinder was fitted to approximate the branch geometry. The radius of the stem was obtained by using the nonlinear least square method, and the radius of the subsequent branches was obtained from the stem geometry. On the right side of Figure 5 shows the reconstructed 3D tree model. Every cylinder that makes up tree stem or all branches can be thought of as being fitted by a closed convex hull polyhedron. The top and bottom surfaces of the polyhedron were convex polygons.
2.3. Model Refinement and Tree Attributes Derivation
To date, the AdTree method can only restore the stem or branch geometry and cannot measure the size of the tree components such as tree stem or branches. The model established by AdTree cannot carry out a quantitative analysis of trees; it was not a quantitative structural model in theory. AdTree originally represents trees as a set of generalized cylinders. First, trees were represented as a complete and closed polyhedron in this study. When rebuilding the geometry and topology of the tree, the ends of the stem and all branches were closed. Then a convex hull polyhedron algorithm was designed to extract the tree volume, DBH and tree height from the tree reconstruction model. Finally, a software tool was developed that can automatically reconstruct the tree model and extract the tree attributes.
2.3.1. Convex Hull Polyhedron Algorithm for Extracting DBH and Tree Height
The convex hull polyhedron was used to approximate the stem or branches. To further improve the usability of the model in this study and verify the model accuracy, an algorithm for extracting DBH and tree height based on the tree reconstruction model was designed. Arranged in order of large-to-small to obtain the coordinates of the tree model in the Z axis. By subtracting the minimum value of Z from the maximum value of Z, the tree height can be calculated. To obtain a more accurate tree height, calculate the average of the 5 largest coordinates in the Z-axis minus the corresponding 5 smallest coordinates. When calculating the DBH, find a cylinder that conforms to the polyhedron with a top surface Z value greater than 1.3 m and a bottom surface Z value less than 1.3 m. As shown in Figure 6, the polyhedron approximates a cross-sectional ring at 1.3 m and all coordinate points constituting the cross-section ring were obtained. The distance between two adjacent coordinate points was calculated in a clockwise direction and all the distance values were added to get the circumference of the whole ring. Calculate the DBH according to the circumference formula. If there were two cylinders at 1.3 m, the average value was calculated.
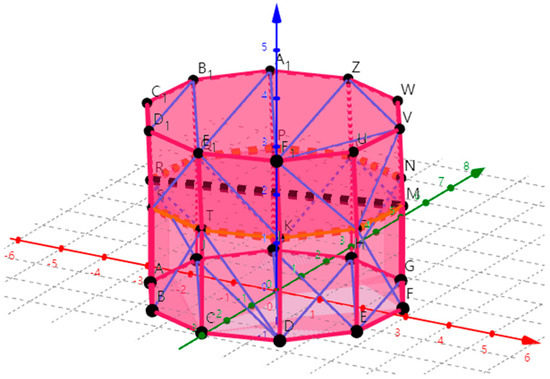
Figure 6.
Black dashed line represents the DBH and the orange circle represents the horizontal cross-section ring composed of multiple points at 1.3 m. Red line was the X axis, the green line was the Y axis and the dark blue was the Z axis and the black dots were the vertices of the polygon. Pink line represents the edge of the outermost triangulation network of the polyhedron and the light blue line was the edge of the inner triangulation network of the polyhedron. The color usage of other pictures in this section follows this principle.
Here, the following formulae 1 and 2 were defined, respectively to calculate DBH and tree height:
was DBH, represents the number of points of the fitted ring at 1.3 m from the stem to the ground, was the coordinate of the point on the ring, was for the number of rings. represents tree height, and respectively represent the maximum and minimum values of the coordinates of the tree model in the Z axis. After the Z values of the tree model coordinates were arranged in the order of maximum or minimum, the number of obtained coordinates was .
2.3.2. Convex Hull Polyhedron Algorithm for Extracting Tree Volume
Tree volume estimation based on tree reconstruction model was the most concerning problem in the QSM method. The 3D tree model reconstructed in this study can be regarded as a complete and closed convex polyhedra, and the polyhedron volume calculation needs to include the reconstructed stem and all higher-order branches. In this study, the volume calculation method of a convex polyhedron based on the 3D model was designed. The tree volume algorithm follows the following process.
(1) Construction of triangulation network based on the tree reconstruction model. The polyhedron was used to approximate tree stem or branch. The top and bottom surfaces of the polyhedron were convex polygons. The vertices of convex polygons were connected to each other. The number of vertices in this experiment was 10 (See Figure 7). The more vertices there were, the closer the convex polygon was to the circle. Therefore, each stem or branch can be regarded as a series of strictly convex polyhedrons and the outside (top, bottom and sides) and inside of each polyhedron were composed of a series of triangles.
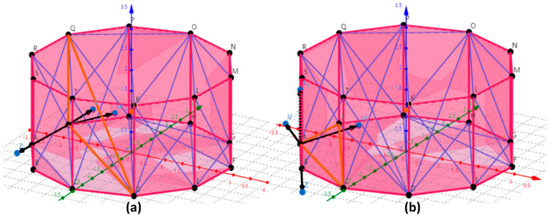
Figure 7.
Merge or retain the triangles that make up the polyhedron. (a) The orange triangle QJD was merged; (b) orange triangle ACJ was retained. Black directed line segment represents three vectors (V, W, Z) and the orange dot U represents the center of the polyhedron.
(2) Removal redundant triangles inside polyhedron. To calculate the volume of a convex polyhedron, the triangles that make up the polyhedron need to be merged or retained. Figure 7 indicates the merge and retain triangles, respectively. Make three vectors (V, W, Z) to the triangle composed of the vertices of the polygon. V was the normal vector of the plane where the triangle was located, W was the vector whose vertex points to the center U of the polyhedron and Z was the vector whose vertex points to any other vertex. Using the coordinate product formula of the vector, the cosine value of the angle between the normal vector V and the vector (W, Z) can be calculated, respectively, and calculate the product of two cosines to obtain α. Sequentially traverse the vector Z’ between this vertex and the other vertices of the polyhedron (excluding the other vertices of the triangle). If the number of polyhedron vertices was k, (k-3) α values will be obtained. If less than 0 occurs in all α values, the triangle needs to be merged, as shown in Figure 7a. If all α values were greater than 0, the triangle needs to be retained, as shown in Figure 7b. In this study, noise was used to solve the problem that the normal vector V perpendicular to the vector Z. The vertices were randomly moved to the outside (convex direction) along the direction of the polyhedron center U pointing to each vertex (the opposite direction of the vector W). As shown in Figure 7b, under ordinary circumstances, the normal vector V of the triangle ACJ should be in the same direction as the line segment AR, then the vector V will be perpendicular to the vector Z. In this study, the position of vertex A was randomly moved along the opposite direction of the vector W, and V was the normal vector of the new triangle formed after the vertex A was moved. The noise will make the polyhedron increase, so when the volume of the polyhedron was calculated, the increment of the volume needs to be subtracted. Noise can not only merge or retain triangles better, but also solve the problem of volume repeat calculation caused by multiple triangles.
(3) Used the triangular pyramid as the minimum unit to calculate the volume of the tree reconstruction model. After step (2), the retained triangle was used as the bottom surface and a triangular pyramid was formed with the center U of the polyhedron as the vertex (U-RQJ and U-RAJ in Figure 8b). Using the volume vector formula, the triangular pyramid volume can be calculated and the convex polyhedron volume can be obtained by adding the volumes of all triangular pyramids. The trees volume on the ground can be calculated by adding the volume of all convex polyhedrons that make up the tree reconstruction model. If the coordinates of the vertex U (the center point of the polyhedron) of the triangular pyramid U-RQJ were , the coordinates of R, Q and J were , and . Therefore, the coordinates of three vectors , and passing through the vertex U can be obtained.
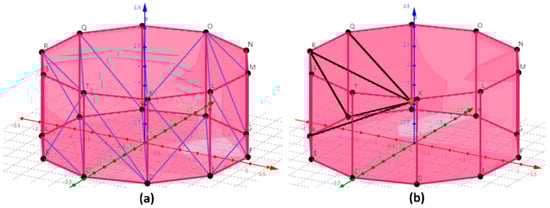
Figure 8.
Volume of the polyhedron was calculated with a triangular pyramid as the minimum unit. (a) final polyhedron; (b) minimum unit in the volume calculation process was a triangular pyramid. The black line represents the edges of the triangular pyramid.
Here, the volume calculation Formula (3) of the tree reconstruction model defined by the mixed product algorithm based on vector:
represents the total volume including the tree stem and branches, represents the number of all the convex polyhedron that make up the tree model and represents the number of all the triangular pyramids that make up the convex polyhedron. , and represent the three vectors that pass through the vertices of the triangular pyramid.
2.4. Implementation
The software in this study (Figure 9) was written in C++ in Visual Studio 2015 and the software relies on some third-party libraries. The AdTree library provides the functions of tree skeleton generation and cylinder fitting branches [54]. The Minpack library provides functions for solving nonlinear equations and nonlinear least-squares problems [55].
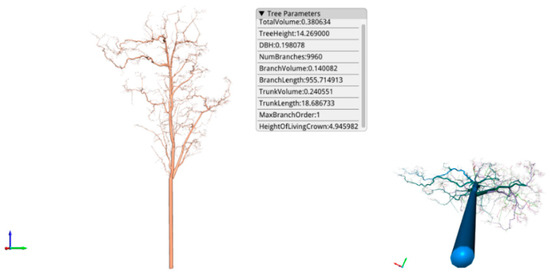
Figure 9.
User interface for tree attributes.
After the reconstruction of the tree 3D model, the software can calculate the tree attributes such as the wood (including stem and branches) volume, DBH, tree height, the height of the living crown and the crown volume, etc. Therefore, the user can further calculate the wood mass or AGB based on the wood density. Software such as 360LiDAR and CloudCompare can also extract the DBH and tree height from LiDAR point clouds. However, these programs do not had the QSM function to reconstruct the tree model or to estimate the volume of the stem or branches. Therefore, it was important to reconstruct the tree 3D model based on the QSM principle and estimate the tree volume directly.
2.5. Model Accuracy Evaluation
In this study, the accuracy of tree volume, DBH and tree height extracted from the tree reconstruction model were verified, respectively. The tree volume extracted based on TreeQSM was used as the reference value to extract the volume of this model. TreeQSM has proven to be a modeling method with better volume accuracy [3,56,57], which can model the TLS point clouds of a single tree and calculate the volume of branches and stem. Therefore, the tree volume estimated based on TreeQSM is also meaningful as the reference value of our model. The DBH was measured by DBH tape and used as the reference value of DBH extracted based on this model. The tree height measured by the total station was used as the reference value of the tree height extracted by this model. The bias, RMSE, rBias and rRMSE were used to verify the accuracy of tree volume, DBH and tree height.
3. Results
3.1. Volume Measurement
The reference value of volume ranged from 0.01612 m3 to 0.82730 m3, and the extraction value of volume ranged from 0.01045 m3 to 0.88468 m3. The average value and standard deviation calculated by TreeQSM were 0.21922 m3 and 0.15875 m3, and the average value and standard deviation calculated by our model were 0.20686 m3 and 0.15822 m3. Figure 10 shows that the linear fitting R2 of the volume dataset was 0.96, and its slope was 0.975. The volume extraction values were evenly distributed on both sides of the reference value. The volume estimation did not change significantly with the increase of volume, and the overall fitting effect was better.
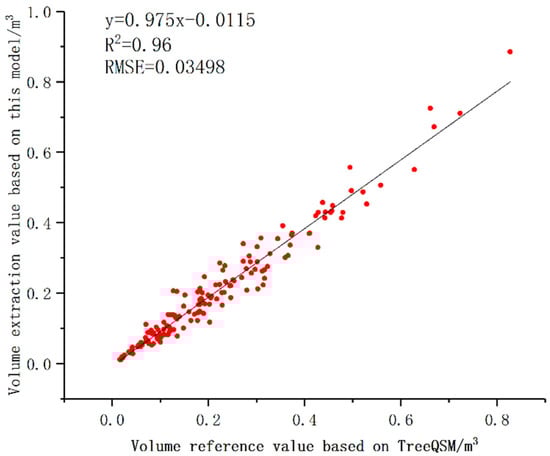
Figure 10.
Comparison of tree volume extraction value and reference value.
Figure 11 shows that most of the volume residuals were more evenly distributed on both sides of the y = 0 line, and most residuals ranged from −0.05 m3 to 0.05 m3. The residuals had no significant difference with the increase of the volume.
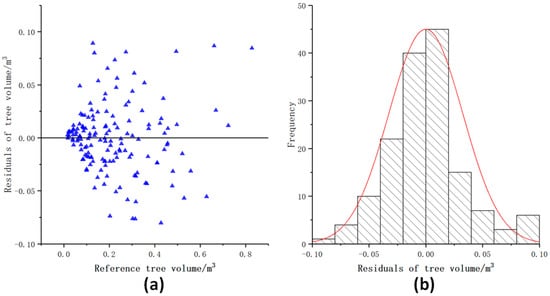
Figure 11.
Distribution of the volume residuals. (a) Scatter distribution of tree volume residuals; (b) Histogram of tree volume residuals distribution.
The volume estimation accuracy of TreeQSM was measured by destructive experiments and was demonstrated in several studies. Comparing the volume extraction value based on this model with the volume reference value based on TreeQSM, bias and RMSE were −0.01236 m3 and 0.03498 m3, respectively (See Table 1). Among the 153 trees with volume reference value ranging from 0.01612 m3 to 0.82730 m3, 82.4% of the trees had an absolute value of volume bias less than 0.05 m3.

Table 1.
Accuracy comparison of tree volume extracted by this model and TreeQSM.
3.2. DBH and Tree Height Measurement
The field measurement data were used as the reference value of the model to extract DBH and tree height. The extraction value of DBH ranged from 5.7 cm to 24.2 cm. The extraction value of tree height ranged from 3.15 m to 21.51 m. Figure 12a shows that R2 fitted linearly with the DBH dataset was 0.92 and its slope was 0.985. The estimation of DBH did not change significantly with the increase of DBH, and the extraction value of DBH was consistent with the reference value and distributed evenly on both sides of the 1:1 line. Figure 12b shows that R2 fitted linearly with the tree height dataset was 0.93 and its slope was 1.032. The estimation of tree height by the model in this study does not change significantly with the increase of tree height, and the extracted value of tree height was consistent with the reference value, which was evenly distributed on both sides of the 1:1 line.
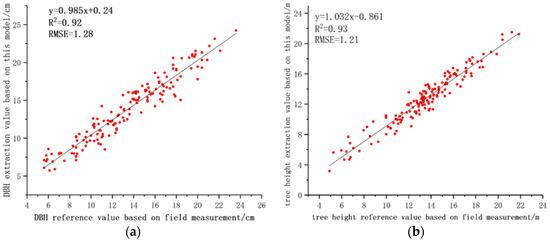
Figure 12.
Comparison of the extracted DBH and height values with their reference values. (a) DBH; (b) tree height.
Figure 13 shows the distribution of the DBH residuals. Most of the DBH residuals were between −2.0 cm and 2.0 cm. The residual value distribution range had no significant difference with the increase of the DBH and was evenly distributed on both sides of the y = 0 line. Figure 14 shows that most tree height residuals were evenly distributed on both sides of the y = 0 line, and most of the residuals were between −1.5 m and 1.5 m. The tree height extracted by this model was slightly underestimated compared with the tree height measured in the field. The residual value distribution range had no significant difference with the increase of tree height.
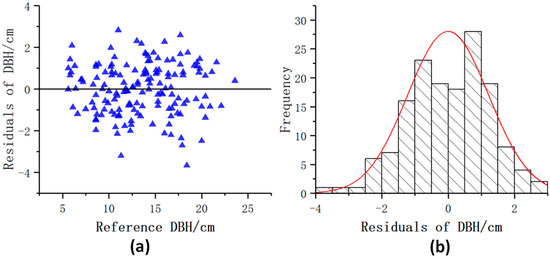
Figure 13.
Distribution of the DBH residuals. (a) Scatter distribution of DBH residuals; (b) Histogram of DBH residuals distribution.
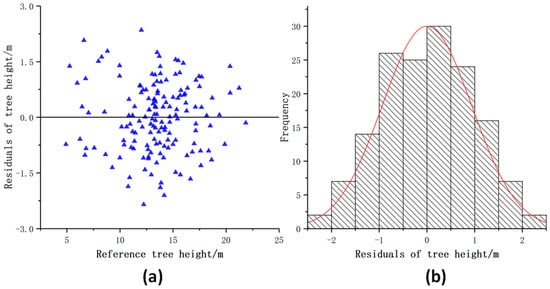
Figure 14.
Distribution of the tree height residuals. (a) Scatter distribution of tree height residuals; (b) Histogram of tree height residuals distribution.
As shown in Table 2, the accuracy of DBH and tree height extracted based on this model. Bias and RMSE of the DBH calculated by the least square method were 0.38 cm and 1.28 cm, respectively. Among the 153 trees with DBH reference value ranging from 5.6 cm to 23.6 cm, 89.5% of the trees had an absolute value of DBH bias less than 2 cm. The bias and RMSE of the tree height were −0.76 m and 1.21 m, respectively. Among the 153 trees with tree height reference value ranging from 4.91 m to 21.86 m, trees with an absolute value of tree height bias within 1.5 m accounted for 73.9% of the total.
Table 2.
Accuracy comparison of DBH and tree height obtained by using this model and field measurement.
To ensure the accuracy of DBH and tree height estimation by this model, it was necessary to obtain a complete tree point clouds as much as possible. The DBH and tree height extracted from this model had similar performance in 153 Chinese scholartrees, and the quality of the input point clouds can directly affect the estimation accuracy of DBH and tree height.
3.3. Comparison of Reconstruction Results of Branches
The branch attributes reflect the recovery ability of the model. Branch attributes (including the length and number of branches) need to be calculated and quantified, because tree parameters were most relevant to our current work. The number and length of branches can directly affect the measurement accuracy of volume. We used quantitative methods to calculate the branch attributes.
3.3.1. Visual Comparison
The AdTree method developed by Shenglan Du et al. provides a better geometric structure for the reconstruction of the tree model [31]. The geometric accuracy of the model was quantified by calculating the average distance between the input point and the generated model. The average distance of Adtree’s report was less than 10 cm, and the standard deviation was less than 8. Using the same point clouds of Chinese scholartree, the geometry of tree branch reconstruction based on this model was compared with that of TreeQSM.
It can be seen from Figure 15 and Figure 16 that although both TreeQSM and this model can restore the geometric structure of branches, the tree model reconstructed in this study had more realistic branch structure than the tree model reconstructed in TreeQSM and was more suitable for input point clouds. TreeQSM cannot ensure the consistent restoration of the branches.
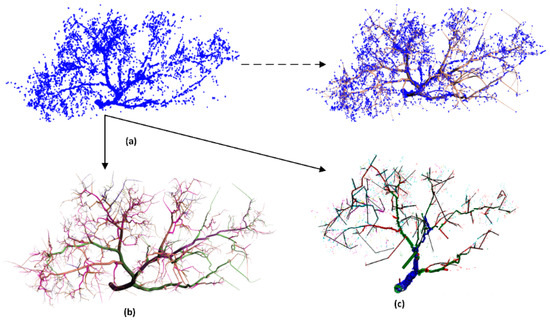
Figure 15.
Comparison of reconstruction results of a Chinese scholartree crown. (a) Input point cloud of a tree; (b) our model; (c) reconstruction of tree crown based on TreeQSM.
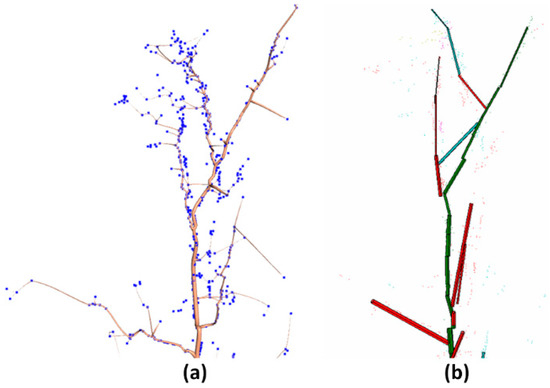
Figure 16.
Comparison of our branch model and TreeQSM. (a) Our model; (b) tree branch reconstruction based on TreeQSM.
3.3.2. Comparison of Branch Attributes
The length and number of reconstructed branches of each tree based on this model and TreeQSM were calculated, respectively, as shown in Figure 17. Among the 153 trees, the branches average length calculated by our model was 863.57 m, while the branches average length calculated by TreeQSM was 230.24 m. Therefore, the model developed in this study can reconstruct twigs or branches better than TreeQSM. The average number of branches each tree calculated by this model was 24.6 times that calculated by TreeQSM. The distribution of branch number was similar to that of branch length. The greater the number of branches, the greater the length of the branches.
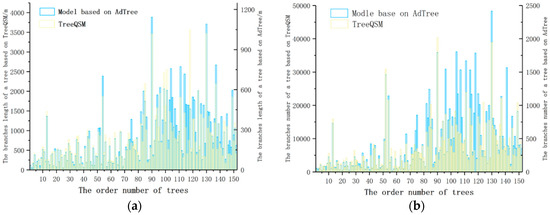
Figure 17.
Number and length distribution of branches of each tree. (a) Length of branches; (b) number of branches.
4. Discussion
It was very meaningful to build a tree quantitative structure model based on LiDAR point clouds [20,58]. The tree quantitative structure model provides a non-destructive estimation method of tree volume that does not depend on the allometric model [17]. Higher-order tree structure and topology were very important for estimating tree volume, AGB, canopy gap, crown shape and other more general ecological characteristics [59,60,61]. In this study, based on the existing research of Adtree method, it was further modified and expanded. After fitting a series of cylinders to approximate the geometry of the stem and branches, the ends of the stem and branches were closed. The tree model was changed from a set of generalized cylinders to a closed polyhedron. To effectively estimate tree attributes from the tree reconstruction model, this study defined a convex hull polyhedron algorithm based on the model to extract tree volume (including stem and branches), DBH and tree height. In this study, the model and algorithm were used for the first time to extract the tree volume, DBH and tree height and the accuracy was verified. The experimental results show that the volume extraction value of our model had better consistency with the reference value. The bias, RMSE and R2 of the tree volume were −0.01236 m3, 0.03498 m3 and 0.96, respectively. The DBH and tree height estimated based on our model were in better consistency with the reference values based on field measurements. The bias, RMSE and R2 of DBH were 0.38 cm, 1.28 cm and 0.92 and the bias, RMSE and R2 of tree height were −0.76 m, 1.21 m and 0.93, respectively. The overall fitting effect of DBH and tree height was better. Although the volume reference value in this study was not from the destructive experiment of trees, TreeQSM had the ability to serve as a reference value. The accuracy of TreeQSM was proved and used by some studies [19,31,32,33]. The tree volume extraction value of in Section 3.1 was slightly lower than the reference value, which was probably related to the more real geometric and topological structure of the reconstructed branches or twigs by this study. Although both TreeQSM and Adtree methods can restore the geometry of branches, TreeQSM cannot guarantee the consistent restore of tree branch [28,57]. Among the 153 trees, the branches average length calculated by this model was 863.57 m, while the branches average length calculated by TreeQSM was 230.24 m. The model developed in this study can reconstruct twigs or branches better than TreeQSM.
The main contribution of this study was to provide a new tree quantitative structural model and to develop algorithms to estimate tree volume, DBH and tree height. The original Adtree method cannot calculate tree attributes or other more general ecological characteristics, so the reconstructed tree 3D geometric model cannot be called a quantitative structural model. In this study, based on the existing research of Adtree method [31], it was further modified and expanded, and a quantitative analysis calculation method was given to the reconstructed tree model. Judging from the existing research reports, the quantitative structural model of trees based on LiDAR point clouds was still very few, such as PypeTree, TreeQSM and SimpleTree [17,26,27]. PypeTree only gives a rough description of the tree topology and does not intend to restore the branch geometry. TreeQSM cannot guarantee the consistent restoration of tree branch. SimpleTree’s process of rebuilding trees was very cumbersome because it requires users to enter key parameters, such as the radius of branches. In this study, the TLS data can be used for automatic, accurate and detailed modeling. The model in this study had a more real tree branch structure than TreeQSM, which makes the model as close as possible to the objective growth form of trees in nature. Our model considers the size and geometry of higher-order branches and provides a new method with reference values for non-destructive estimation of tree volume, AGB and carbon storage. The most important was that this study provides a complete modeling and calculation method for tree quantitative analysis and builds a new tree quantitative structure model for forestry LiDAR data.
This study still had some limitations. First, cutting down trees and measuring branches and stem was the most realistic method to verify the accuracy of the model to extract volume, but due to the limitations of current research conditions, this approach had not been implemented. TreeQSM, which was widely used and had reference significance, was used as the reference object to extract tree volume in this model [8,19]. In terms of volume estimation accuracy, the current research results cannot prove that the model had more obvious advantages than TreeQSM. However, this study still provides a valuable reference for the quantitative analysis of trees, and the branches reconstructed by this method had better geometric effects than TreeQSM. Second, the 3D reconstruction of trees based on LiDAR point clouds was an ill-posed problem, which depends on the quality of the input point clouds. The quality of the point clouds directly determines the accuracy of the tree volume, DBH and tree height extracted from the model in this study, so it was necessary to obtain a complete tree point clouds as much as possible. For the poor scan data with sparse points, this study can reconstruct the reasonable topology of the branches, but it cannot obtain sufficient geometric accuracy. To date, this study does not consider the natural growth rules of branches (such as branch split angle) [62]. The knowledge of tree growth will further restrict the topological accuracy of the reconstruction model and improve the accuracy of tree parameter estimation.
5. Conclusions
In this study, a quantitative structure model that automatically and accurately measures tree attributes was developed based on TLS data and used for the first time to detect real trees. After modifying and perfecting the AdTree method, the tree model was reconstructed and the convex hull polyhedron calculation method was defined for the tree reconstruction model to extract the tree volume, DBH and tree height. The statistical analysis of the extracted values and reference values verifies the accuracy of our model in extracting tree attributes. The tree model in this study can continuously monitor the growth, health, economic value and ecological benefits of trees. Our model can analyze more tree attributes, including the height of the living crown, crown width, crown volume and shape or other more general ecological characteristics. Our model can be combined with a specific wood density to provide a new detection method for non-destructive estimation of AGB or carbon storage. This study can provide potential possibilities for the development and calibration of the allometric models, especially for large or precious trees that cannot be harvested and measured. In addition, combining the synthesized leaves with our model can be directly applied to urban landscape design and entertainment applications to express the reality of the scene.
Under suitable conditions in the future, this study will conduct the tree destructive experiment to test more relevant attributes of this model. In addition, we hope to extend the current research results at the level of a single tree to the level of plot, which can directly restore the 3D model of the forest plots and provide related parameter calculation methods. Referring to the existing tree automatic segmentation method, this model will be extended to a wider application of fields.
Author Contributions
Conceptualization, G.F., L.N. and F.C.; data curation, G.F.; formal analysis, G.F.; funding acquisition, F.C.; investigation, G.F., Y.D., Z.W. and H.L.; methodology, G.F., L.N. and F.C.; project administration, G.F., H.L. and D.C.; resources, L.N. and F.C.; software, G.F., L.N., F.C., Y.D. and Z.W.; supervision, G.F. and F.C.; validation, G.F., Y.D., Z.W. and D.C.; visualization, G.F., Y.D., Z.W., H.L. and D.C.; writing—original draft, G.F. and Y.D.; writing—review & editing, G.F., L.N., F.C. and D.C. All authors have read and agree to the published version of the manuscript.
Funding
This research was jointly supported by the Fundamental Research Funds for the Central Universities (TD2014-02).
Acknowledgments
We gratefully acknowledge the reviewers for their insightful comments of the manuscript, thank other team members for help with the experiment.
Conflicts of Interest
The authors declare no conflict of interest.
References
- Yao, W.; Krzystek, P.; Heurich, M. Tree species classification and estimation of stem volume and DBH based on single tree extraction by exploiting airborne full-waveform LiDAR data. Remote. Sens. Environ. 2012, 123, 368–380. [Google Scholar] [CrossRef]
- Dassot, M.; Constant, T.; Fournier, M. The use of terrestrial LiDAR technology in forest science: Application fields, benefits and challenges. Ann. For. Sci. 2011, 68, 959–974. [Google Scholar] [CrossRef]
- De Tanago, J.G.; Lau, A.; Bartholomeus, H.; Herold, M.; Avitabile, V.; Raumonen, P.; Martius, C.; Goodman, R.C.; Disney, M.; Manuri, S.; et al. Estimation of above-ground biomass of large tropical trees with terrestrial LiDAR. Methods Ecol. Evol. 2018, 9, 223–234. [Google Scholar] [CrossRef]
- Zhang, W.; Wan, P.; Wang, T.; Cai, S.; Chen, Y.; Jin, X.; Yan, G. A Novel Approach for the Detection of Standing Tree Stems from Plot-Level Terrestrial Laser Scanning Data. Remote Sens. 2019, 11, 211. [Google Scholar] [CrossRef]
- Brandeis, T.J.; Delaney, M.; Parresol, B.R.; Royer, L. Development of equations for predicting Puerto Rican subtropical dry forest biomass and volume. For. Ecol. Manag. 2006, 233, 133–142. [Google Scholar] [CrossRef]
- Aguilar, F.J.; Nemmaoui, A.; Peñalver, A.; Rivas, J.R.; Aguilar, M.A. Developing Allometric Equations for Teak Plantations Located in the Coastal Region of Ecuador from Terrestrial Laser Scanning Data. Forests 2019, 10, 1050. [Google Scholar] [CrossRef]
- Chen, Q.; Vaglio Laurin, G.; Valentini, R. Uncertainty of remotely sensed aboveground biomass over an African tropical forest: Propagating errors from trees to plots to pixels. Remote Sens. Environ. 2015, 160, 134–143. [Google Scholar] [CrossRef]
- Takoudjou, S.M.; Ploton, P.; Sonké, B.; Hackenberg, J.; Griffon, S.; de Coligny, F.; Kamdem, N.G.; Libalah, M.; Mofack, G.I.; Moguédec, G.L.; et al. Using terrestrial laser scanning data to estimate large tropical trees biomass and calibrate allometric models: A comparison with traditional destructive approach. Methods Ecol. Evol. 2018, 9, 905–916. [Google Scholar] [CrossRef]
- Zeng, W.S. Establishment of compatible tree volume equation systems of Chinese fir. For. Res. 2014, 27, 6–10. [Google Scholar] [CrossRef]
- Lo, C.-S.; Lin, C. Growth-Competition-Based Stem Diameter and Volume Modeling for Tree-Level Forest Inventory Using Airborne LiDAR Data. IEEE Trans. Geosci. Remote Sens. 2013, 51, 2216–2226. [Google Scholar] [CrossRef]
- Hosoi, F.; Nakai, Y.; Omasa, K. 3-D voxel-based solid modeling of a broad-leaved tree for accurate volume estimation using portable scanning lidar. ISPRS J. Photogramm. Remote Sens. 2013, 82, 41–48. [Google Scholar] [CrossRef]
- Edson, C.; Wing, M.G. Airborne Light Detection and Ranging (LiDAR) for Individual Tree Stem Location, Height, and Biomass Measurements. Remote Sens. 2011, 3, 2494–2528. [Google Scholar] [CrossRef]
- Ferraz, A.; Saatchi, S.; Mallet, C.; Meyer, V. Lidar detection of individual tree size in tropical forests. Remote Sens. Environ. 2016, 183, 318–333. [Google Scholar] [CrossRef]
- Palace, M.W.; Sullivan, F.B.; Ducey, M.J.; Treuhaft, R.N.; Herrick, C.; Shimbo, J.Z.; Mota-E-Silva, J. Estimating forest structure in a tropical forest using field measurements, a synthetic model and discrete return lidar data. Remote Sens. Environ. 2015, 161, 1–11. [Google Scholar] [CrossRef]
- Kankare, V.; Holopainen, M.; Vastaranta, M.; Puttonen, E.; Yu, X.; Hyyppä, J.; Vaaja, M.; Hyyppä, H.; Alho, P. Individual tree biomass estimation using terrestrial laser scanning. ISPRS J. Photogramm. Remote Sens. 2013, 75, 64–75. [Google Scholar] [CrossRef]
- Kong, F.; Yan, W.; Zheng, G.; Yin, H.; Cavan, G.; Zhan, W.; Zhang, N.; Cheng, L. Retrieval of three-dimensional tree canopy and shade using terrestrial laser scanning (TLS) data to analyze the cooling effect of vegetation. Agric. Forest Meteorol. 2016, 217, 22–34. [Google Scholar] [CrossRef]
- Hackenberg, J.; Spiecker, H.; Calders, K.; Disney, M.; Raumonen, P. SimpleTree—An Efficient Open Source Tool to Build Tree Models from TLS Clouds. Forests 2015, 6, 4245–4294. [Google Scholar] [CrossRef]
- Vieilledent, G.; Vaudry, R.; Andriamanohisoa, S.F.D.; Rakotonarivo, O.S.; Randrianasolo, H.Z.; Razafindrabe, H.N.; Rakotoarivony, C.B.; Ebeling, J.; Rasamoelina, M. A universal approach to estimate biomass and carbon stock in tropical forests using generic allometric models. Ecol. Appl. 2012, 22, 572–583. [Google Scholar] [CrossRef]
- Hackenberg, J.; Wassenberg, M.; Spiecker, H.; Sun, D. Non Destructive Method for Biomass Prediction Combining TLS Derived Tree Volume and Wood Density. Forests 2015, 6, 1274–1300. [Google Scholar] [CrossRef]
- Lau, A.; Bentley, L.P.; Martius, C.; Shenkin, A.; Bartholomeus, H.; Raumonen, P.; Malhi, Y.; Jackson, T.; Herold, M. Quantifying branch architecture of tropical trees using terrestrial LiDAR and 3D modelling. Trees 2018, 32, 1219–1231. [Google Scholar] [CrossRef]
- Saarinen, N.; Kankare, V.; Vastaranta, M.; Luoma, V.; Pyörälä, J.; Tanhuanpää, T.; Liang, X.; Kaartinen, H.; Kukko, A.; Jaakkola, A.; et al. Feasibility of Terrestrial laser scanning for collecting stem volume information from single trees. ISPRS J. Photogramm. Remote Sens. 2017, 123, 140–158. [Google Scholar] [CrossRef]
- Chen, Q. Modeling aboveground tree woody biomass using national-scale allometric methods and airborne lidar. ISPRS J. Photogramm. Remote Sens. 2015, 106, 95–106. [Google Scholar] [CrossRef]
- Dassot, M.; Colin, A.; Santenoise, P.; Fournier, M.; Constant, T. Terrestrial laser scanning for measuring the solid wood volume, including branches, of adult standing trees in the forest environment. Comput. Electron. Agric. 2012, 89, 86–93. [Google Scholar] [CrossRef]
- Newnham, G.J.; Armston, J.D.; Calders, K.; Disney, M.I.; Lovell, J.L.; Schaaf, C.B.; Strahler, A.H.; Danson, F.M. Terrestrial Laser Scanning for Plot-Scale Forest Measurement. Curr. For. Rep. 2015, 1, 239–251. [Google Scholar] [CrossRef]
- Fang, R.; Strimbu, B.M. Comparison of Mature Douglas-Firs’ Crown Structures Developed with Two Quantitative Structural Models Using TLS Point Clouds for Neighboring Trees in a Natural Regime Stand. Remote Sens. 2019, 11, 1661. [Google Scholar] [CrossRef]
- Raumonen, P.; Kaasalainen, M.; Åkerblom, M.; Kaasalainen, S.; Kaartinen, H.; Vastaranta, M.; Holopainen, M.; Disney, M.; Lewis, P. Fast Automatic Precision Tree Models from Terrestrial Laser Scanner Data. Remote Sens. 2013, 5, 491–520. [Google Scholar] [CrossRef]
- Delagrange, S.; Jauvin, C.; Rochon, P. PypeTree: A Tool for Reconstructing Tree Perennial Tissues from Point Clouds. Sensors 2014, 14, 4271–4289. [Google Scholar] [CrossRef]
- Markku, Å.; Raumonen, P.; Kaasalainen, M.; Casella, E. Analysis of Geometric Primitives in Quantitative Structure Models of Tree Stems. Remote Sens. 2015, 7, 4581–4603. [Google Scholar] [CrossRef]
- Disney, M.I.; Boni Vicari, M.; Burt, A.; Calders, K.; Lewis, S.L.; Raumonen, P.; Wilkes, P. Weighing trees with lasers: Advances, challenges and opportunities. Interface Focus 2018, 8, 20170048. [Google Scholar] [CrossRef]
- Raumonen, P.; Kaasalainen, S.; Kaasalainen, M.; Kaartinen, H. Approximation of volume and branch size distribution of trees from laser scanner data. In Proceedings of the International Society for Photogrammetry and Remote Sensing 2011 Workshop (ISPRS 2011), Calgary, AB, Canada, 29–31 August 2011; Volume XXXVIII-5/W12. [Google Scholar]
- Du, S.; Lindenbergh, R.; Ledoux, H.; Stoter, J.; Nan, L. AdTree: Accurate, Detailed, and Automatic Modelling of Laser-Scanned Trees. Remote Sens. 2019, 11, 2074. [Google Scholar] [CrossRef]
- Romero Ramirez, F.J.; Navarro-Cerrillo, R.M.; Varo-Martínez, M.Á.; Quero, J.L.; Doerr, S.; Hernández-Clemente, R. Determination of forest fuels characteristics in mortality-affected Pinus forests using integrated hyperspectral and ALS data. Int. J. Appl. Earth Observ. Geoinf. 2018, 68, 157–167. [Google Scholar] [CrossRef]
- Kunz, M.; Hess, C.; Raumonen, P.; Bienert, A.; Hackenberg, J.; Maas, H.; Härdtle, W.; Fichtner, A.; von Oheimb, G. Comparison of wood volume estimates of young trees from terrestrial laser scan data. iFor. Biogeosci. For. 2017, 10, 451–458. [Google Scholar] [CrossRef]
- Lau, A.; Calders, K.; Bartholomeus, H.; Martius, C.; Raumonen, P.; Herold, M.; Vicari, M.; Sukhdeo, H.; Singh, J.; Goodman, R.C. Tree Biomass Equations from Terrestrial LiDAR: A Case Study in Guyana. Forests 2019, 10, 527. [Google Scholar] [CrossRef]
- Disney, M.; Burt, A.; Calders, K.; Schaaf, C.; Stovall, A. Innovations in Ground and Airborne Technologies as Reference and for Training and Validation: Terrestrial Laser Scanning (TLS). Surv. Geophys. 2019, 40, 937–958. [Google Scholar] [CrossRef]
- Mayamanikandan, T.; Suraj Reddy, R.; Jha, C.S. Non-Destructive Tree Volume Estimation using Terrestrial Lidar Data in Teak Dominated Central Indian Forests. In Proceedings of the 2019 IEEE Recent Advances in Geoscience and Remote Sensing: Technologies, Standards and Applications (TENGARSS), Kerala, India, 17–20 October 2019; pp. 100–103. [Google Scholar]
- Åkerblom, M.; Raumonen, P.; Mäkipää, R.; Kaasalainen, M. Automatic tree species recognition with quantitative structure models. Remote Sens. Environ. 2017, 191, 1–12. [Google Scholar] [CrossRef]
- Che, E.; Olsen, M.J. Multi-scan segmentation of terrestrial laser scanning data based on normal variation analysis. ISPRS J. Photogramm. Remote Sens. 2018, 143, 233–248. [Google Scholar] [CrossRef]
- Shao, J.; Zhang, W.; Mellado, N.; Wang, N.; Jin, S.; Cai, S.; Luo, L.; Lejemble, T.; Yan, G. SLAM-aided forest plot mapping combining terrestrial and mobile laser scanning. ISPRS J. Photogramm. Remote Sens. 2020, 163, 214–230. [Google Scholar] [CrossRef]
- Chen, S.; Feng, Z.; Chen, P.; Khan, T.U.; Lian, Y. Nondestructive Estimation of the Above-Ground Biomass of Multiple Tree Species in Boreal Forests of China Using Terrestrial Laser Scanning. Forests 2019, 10, 936. [Google Scholar] [CrossRef]
- Li, Y.; Guo, Q.; Su, Y.; Tao, S.; Zhao, K.; Xu, G. Retrieving the gap fraction, element clumping index, and leaf area index of individual trees using single-scan data from a terrestrial laser scanner. ISPRS J. Photogramm. Remote Sens. 2017, 130, 308–316. [Google Scholar] [CrossRef]
- Tao, S.; Wu, F.; Guo, Q.; Wang, Y.; Li, W.; Xue, B.; Hu, X.; Li, P.; Tian, D.; Li, C. Segmenting tree crowns from terrestrial and mobile LiDAR data by exploring ecological theories. ISPRS J. Photogramm. Remote Sens. 2015, 110, 66–76. [Google Scholar] [CrossRef]
- Lu, X.; Guo, Q.; Li, W.; Flanagan, J. A bottom-up approach to segment individual deciduous trees using leaf-off lidar point cloud data. ISPRS J. Photogramm. Remote Sens. 2014, 94, 1–12. [Google Scholar] [CrossRef]
- Li, W.; Guo, Q.; Jakubowski, M.K.; Kelly, M. A New Method for Segmenting Individual Trees from the Lidar Point Cloud. Photogramm. Eng. Remote Sens. 2012, 78, 75–84. [Google Scholar] [CrossRef]
- Zhou, H.; Shenoy, N.V.; Nicholls, W. Efficient minimum spanning tree construction without Delaunay triangulation. In Proceedings of the Asia and South Pacific Design Automation Conference 2001 (ASP-DAC 2001), Yokohama, Japan, 30 January–2 February 2001. [Google Scholar]
- Cheng, Y. Mean shift, mode seeking, and clustering. IEEE Trans. Pattern Anal. Mach. Intell. 1995, 7. [Google Scholar] [CrossRef]
- Guo, J.; Xu, S.; Yan, D.-M.; Cheng, Z.; Jaeger, M.; Zhang, X. Realistic Procedural Plant Modeling from Multiple View Images. IEEE Trans. Vis. Comput. Graph. 2018, 26, 1372–1384. [Google Scholar] [CrossRef]
- Livny, Y.; Yan, F.; Olson, M.; Chen, B.; Zhang, H.; El-Sana, J. Automatic reconstruction of tree skeletal structures from point clouds. ACM Trans. Graph. 2010, 29, 151. [Google Scholar] [CrossRef]
- Chi, Y.; Nijssen, S.; Muntz, R.R.; Kok, J.N. Frequent Subtree Mining—An Overview. Fundam. Inform. 2005, 66, 161–198. [Google Scholar] [CrossRef]
- Wu, S.T.; Marquez, M.R.G. A non-self-intersection Douglas-Peucker algorithm. In Proceedings of the 16th Brazilian Symposium on Computer Graphics and Image Processing (SIBGRAPI 2003), Sao Carlos, SP, Brazil, 12–15 October 2003. [Google Scholar] [CrossRef]
- Nurunnabi, A.; Sadahiro, Y.; Lindenbergh, R.; Belton, D. Robust cylinder fitting in laser scanning point cloud data. Measurement 2019, 138, 632–651. [Google Scholar] [CrossRef]
- Ram, M.P.M.; Kurfess, T.R.; Tucker, T.M. Least-squares fitting of analytic primitives on a GPU. J. Manuf. Syst. 2008, 27, 130–135. [Google Scholar] [CrossRef]
- Marquardt, D.W. An Algorithm for Least-Squares Estimation of Nonlinear Parameters. J. Soc. Ind. Appl. Math. 1963, 11, 431–441. [Google Scholar] [CrossRef]
- AdTree. Available online: https://github.com/tudelft3d/adtree (accessed on 20 December 2019).
- Minpack. Available online: https://github.com/devernay/cminpack (accessed on 10 March 2020).
- Brede, B.; Calders, K.; Lau, A.; Raumonen, P.; Bartholomeus, H.M.; Herold, M.; Kooistra, L. Non-destructive tree volume estimation through quantitative structure modelling: Comparing UAV laser scanning with terrestrial LIDAR. Remote Sens. Environ. 2019, 233, 111355. [Google Scholar] [CrossRef]
- Raumonen, P.; Casella, E.; Calders, K.; Murphy, S.; Åkerbloma, M.; Kaasalainen, M. Massive-Scale Tree Modelling from TLS Data. In Proceedings of the PIA15+HRIGI15—Joint ISPRS conference, Munich, Germany, 25–27 March 2015; Volume II-3/W4, pp. 189–196. [Google Scholar] [CrossRef]
- Disney, M. Terrestrial LiDAR: A three-dimensional revolution in how we look at trees. New Phytol. 2019, 222, 1736–1741. [Google Scholar] [CrossRef] [PubMed]
- Kaasalainen, S.; Krooks, A.; Liski, J.; Raumonen, P.; Kaartinen, H.; Kaasalainen, M.; Puttonen, E.; Anttila, K.; Mäkipää, R. Change Detection of Tree Biomass with Terrestrial Laser Scanning and Quantitative Structure Modelling. Remote Sens. 2014, 6, 3906–3922. [Google Scholar] [CrossRef]
- Ye, N.; van Leeuwen, L.; Nyktas, P. Analysing the potential of UAV point cloud as input in quantitative structure modelling for assessment of woody biomass of single trees. Int. J. Appl. Earth Obs. Geoinf. 2019, 81, 47–57. [Google Scholar] [CrossRef]
- Calders, K.; Newnham, G.; Burt, A.; Murphy, S.; Raumonen, P.; Herold, M.; Culvenor, D.; Avitabile, V.; Disney, M.; Armston, J. Nondestructive estimates of above-ground biomass using terrestrial laser scanning. Methods Ecol. Evol. 2015, 6. [Google Scholar] [CrossRef]
- Shigo, A.L. How tree branches are attached to trunks. Rev. Can. Bot. 1985, 63, 1391–1401. [Google Scholar] [CrossRef]
© 2020 by the authors. Licensee MDPI, Basel, Switzerland. This article is an open access article distributed under the terms and conditions of the Creative Commons Attribution (CC BY) license (http://creativecommons.org/licenses/by/4.0/).