Machine Learning-Based and 3D Kinematic Models for Rockfall Hazard Assessment Using LiDAR Data and GIS


Abstract
1. Introduction
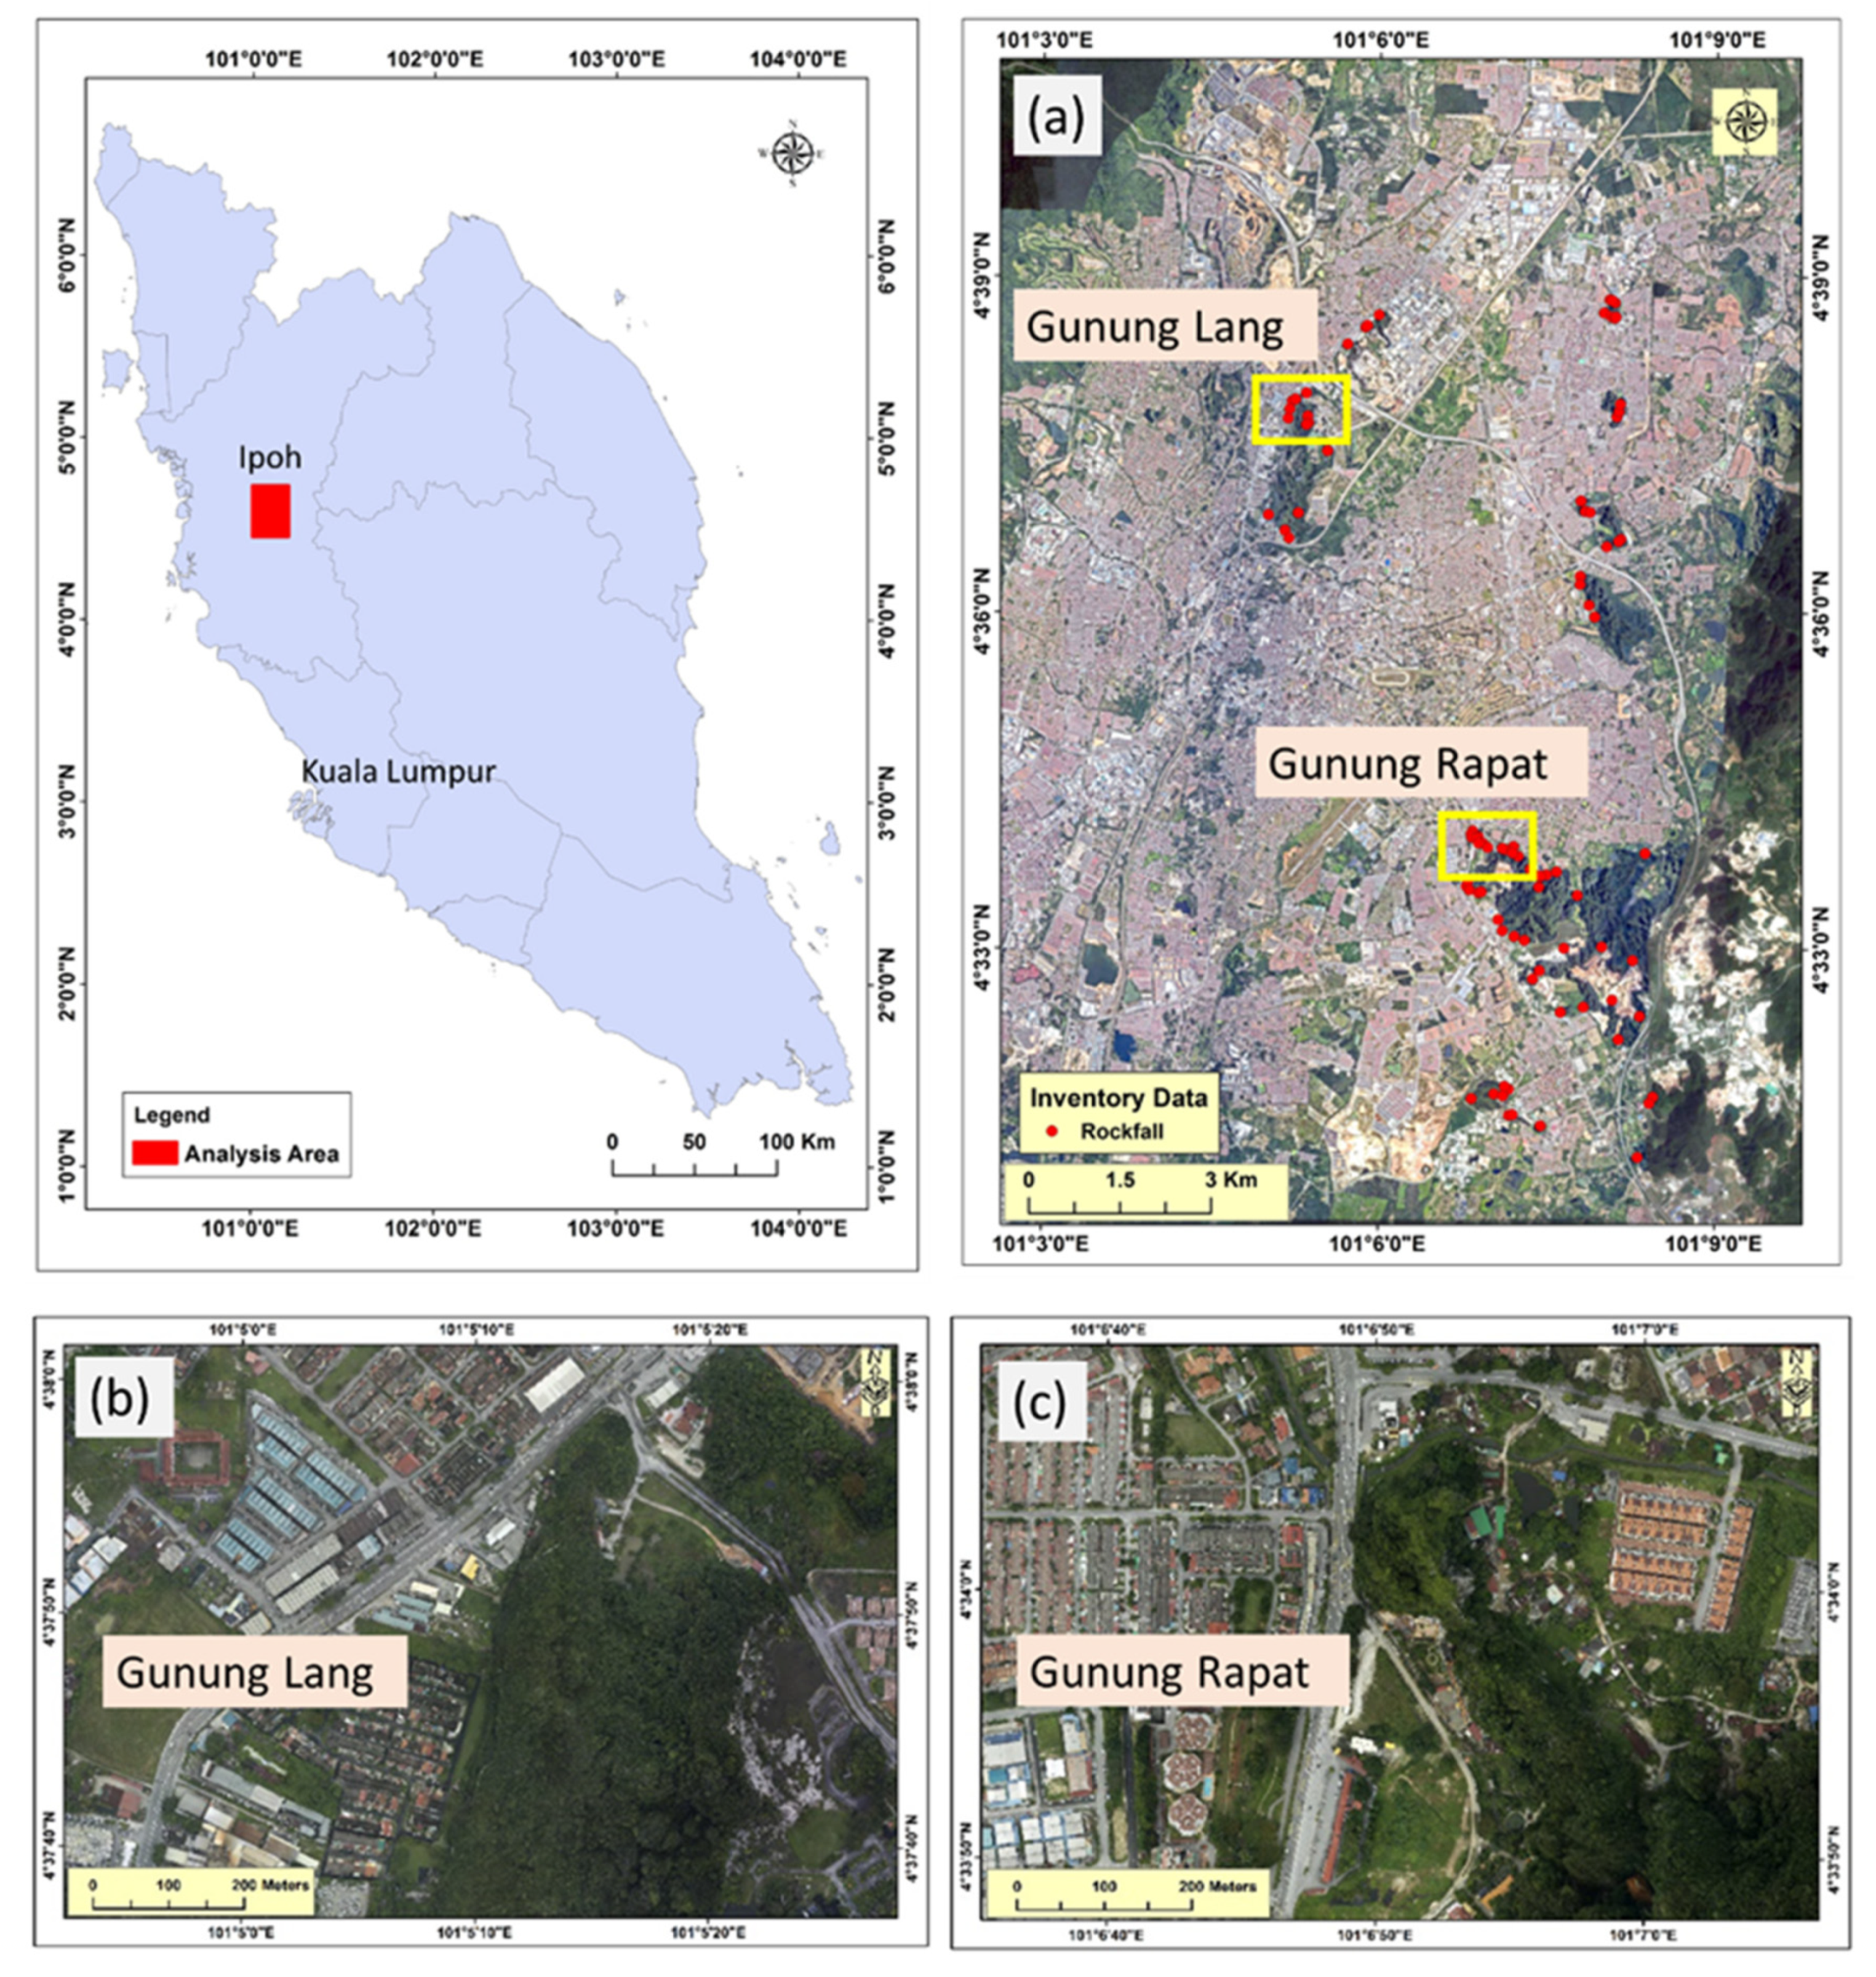
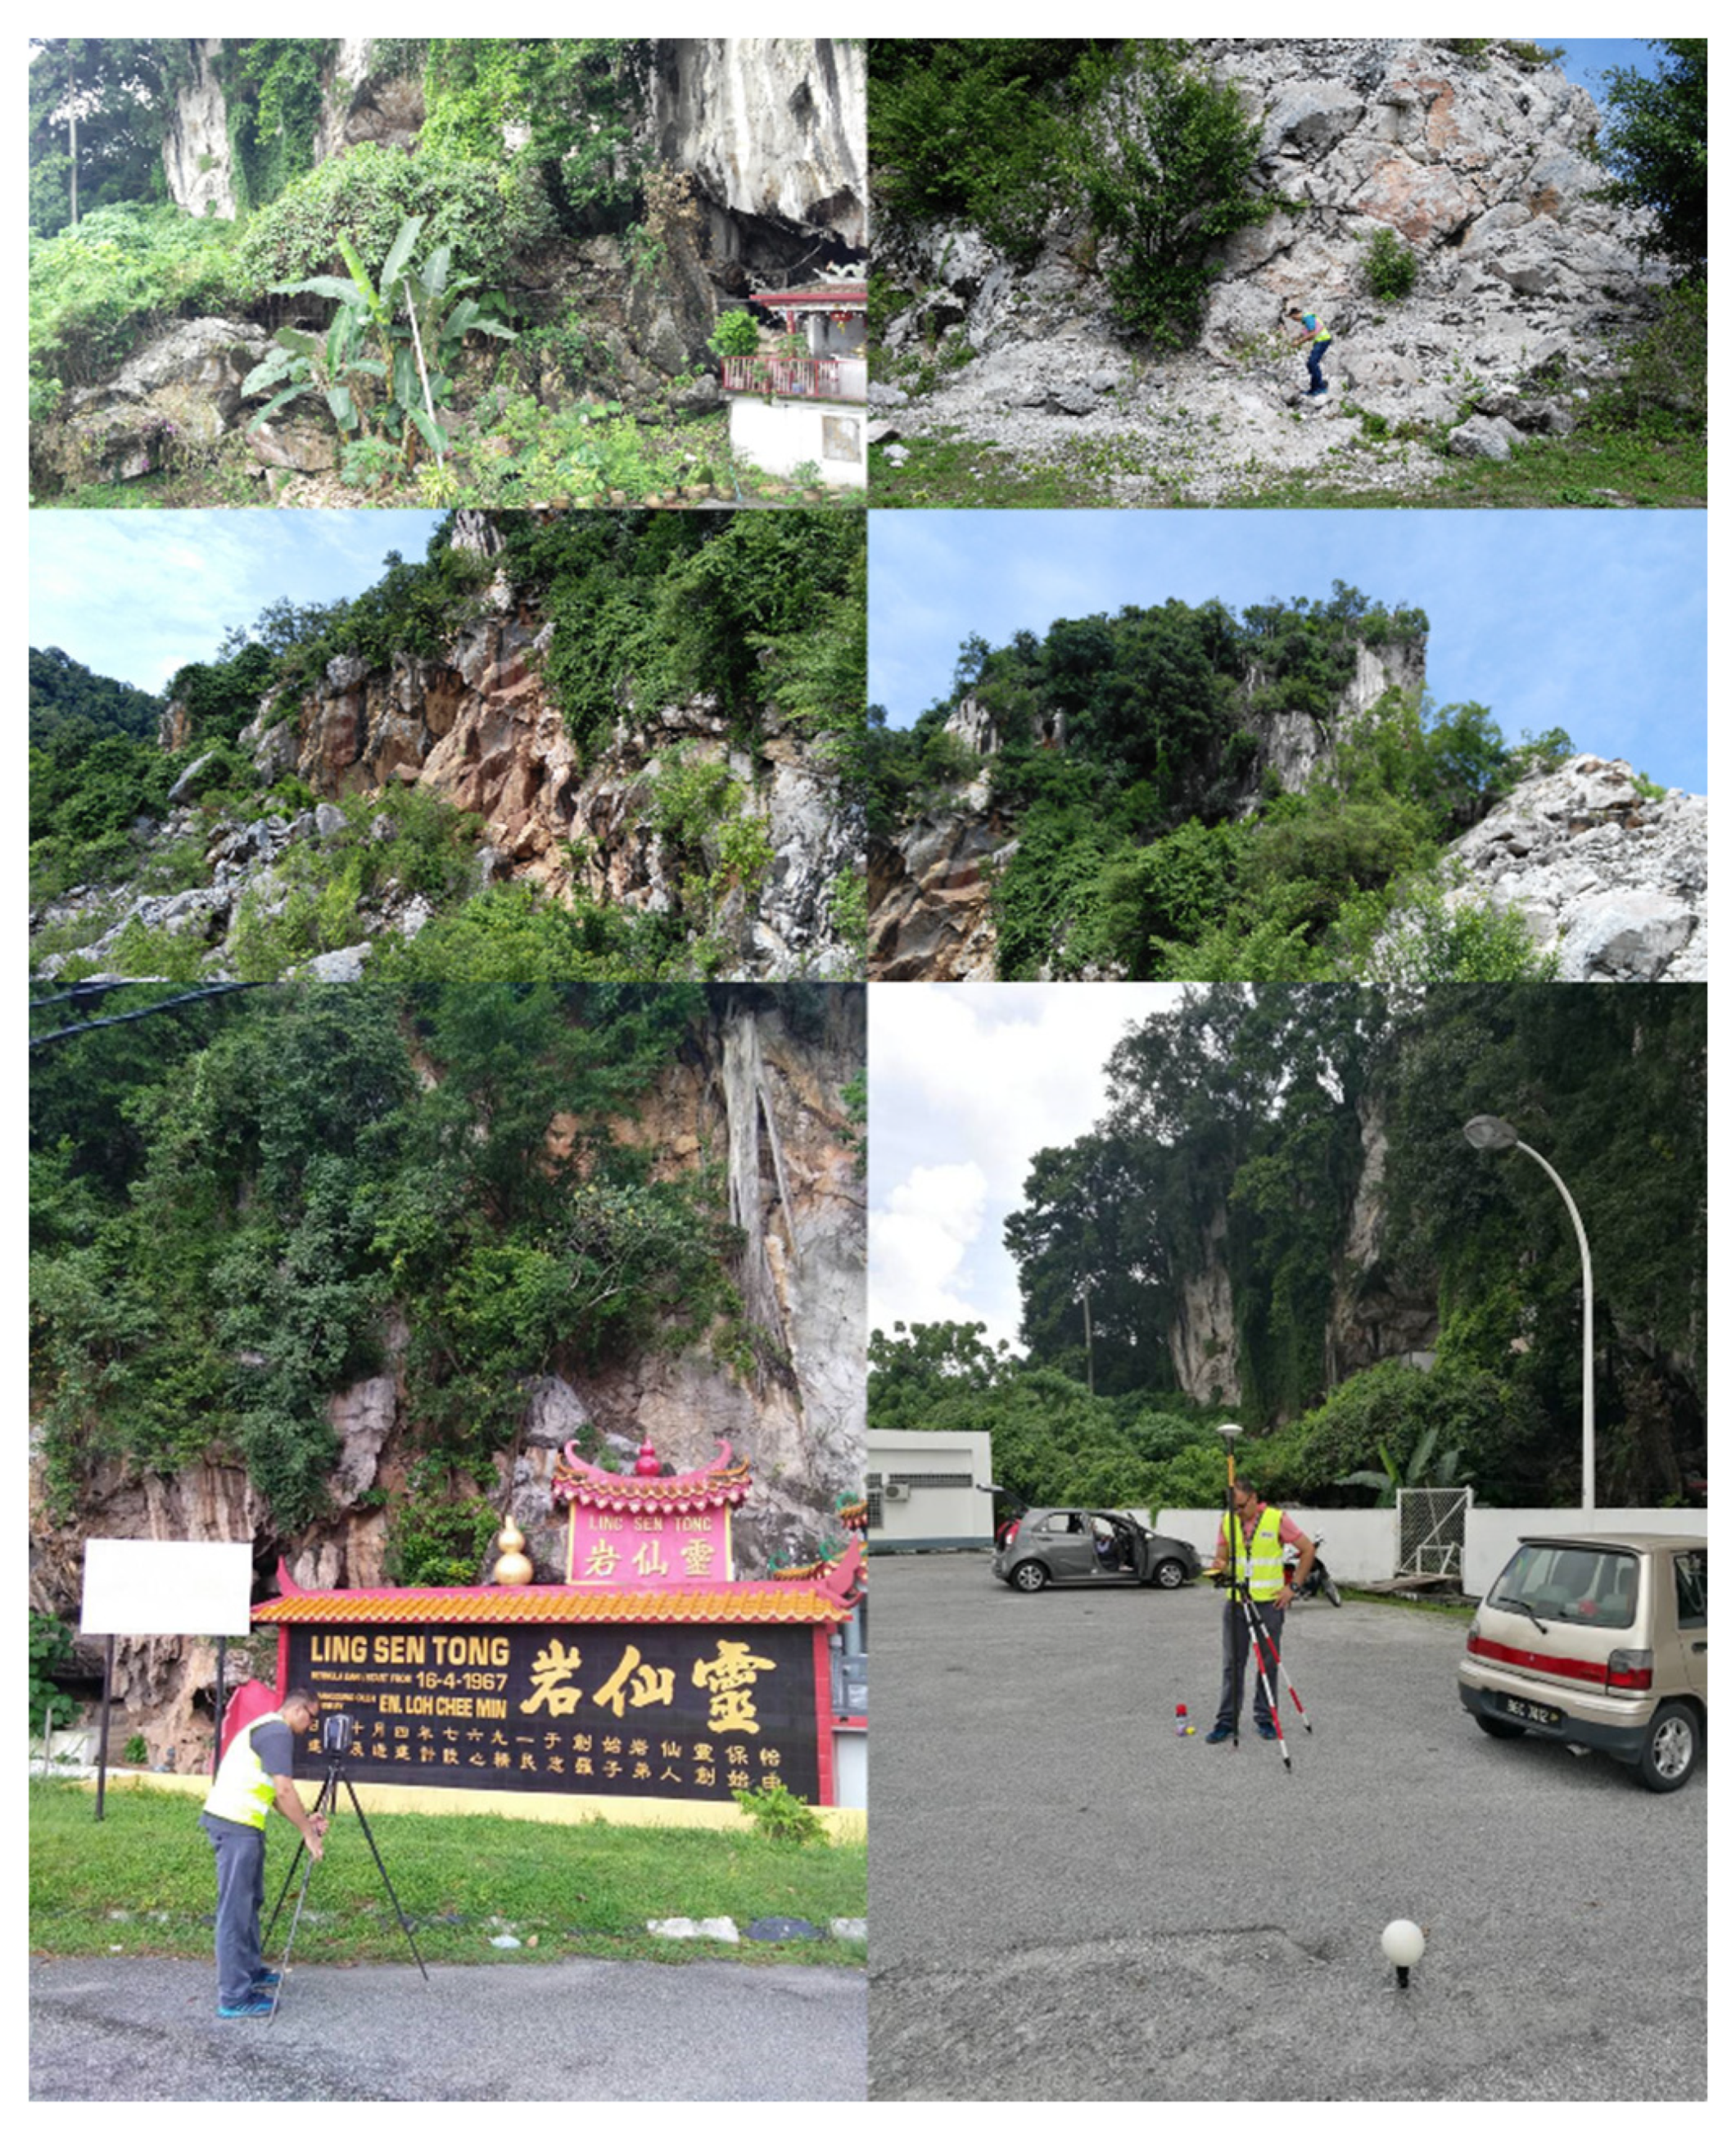
2. Study Area
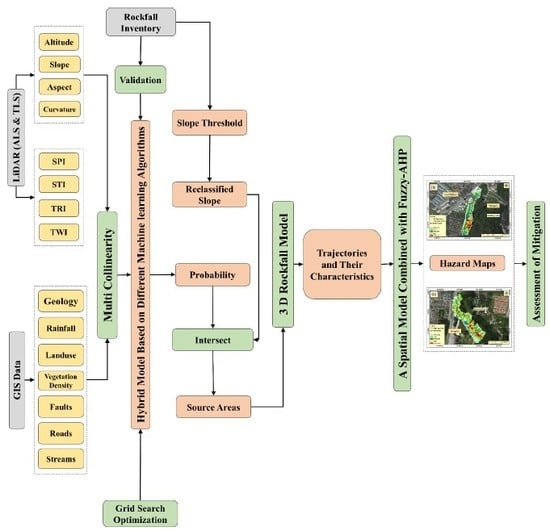
3. Materials and Methods
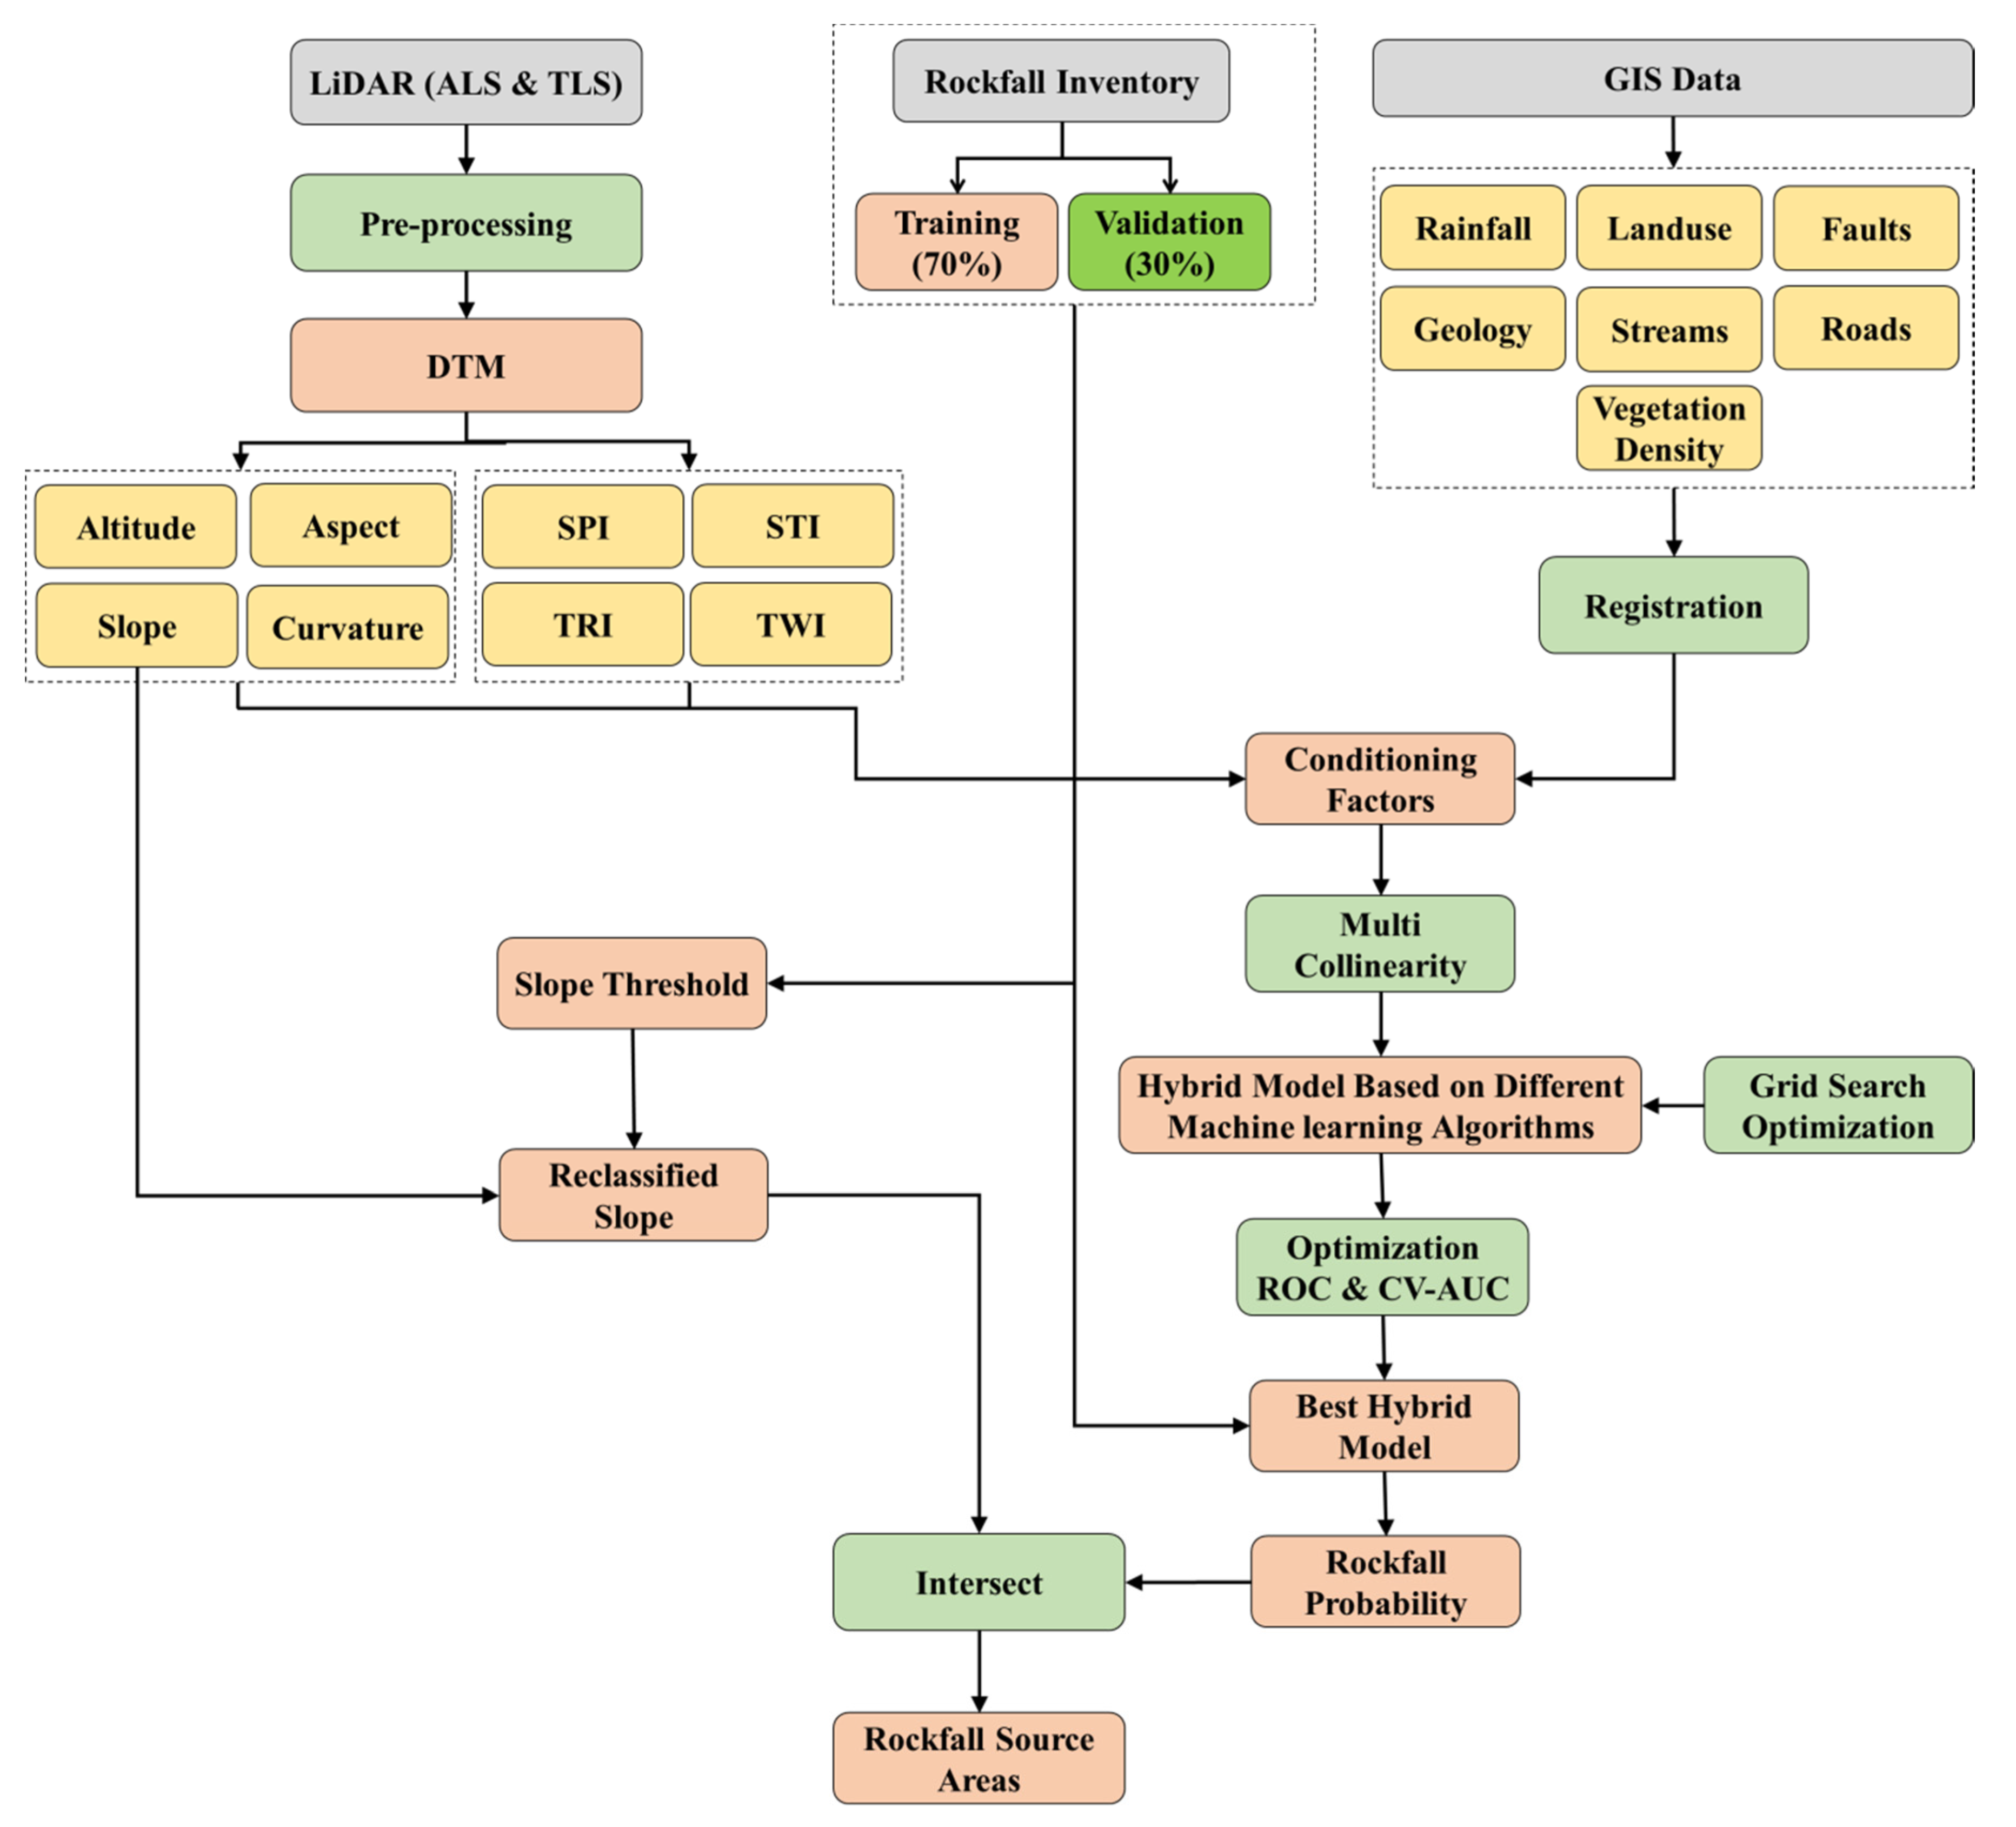
3.1. Data
3.2. Identification of Rockfall Source Areas
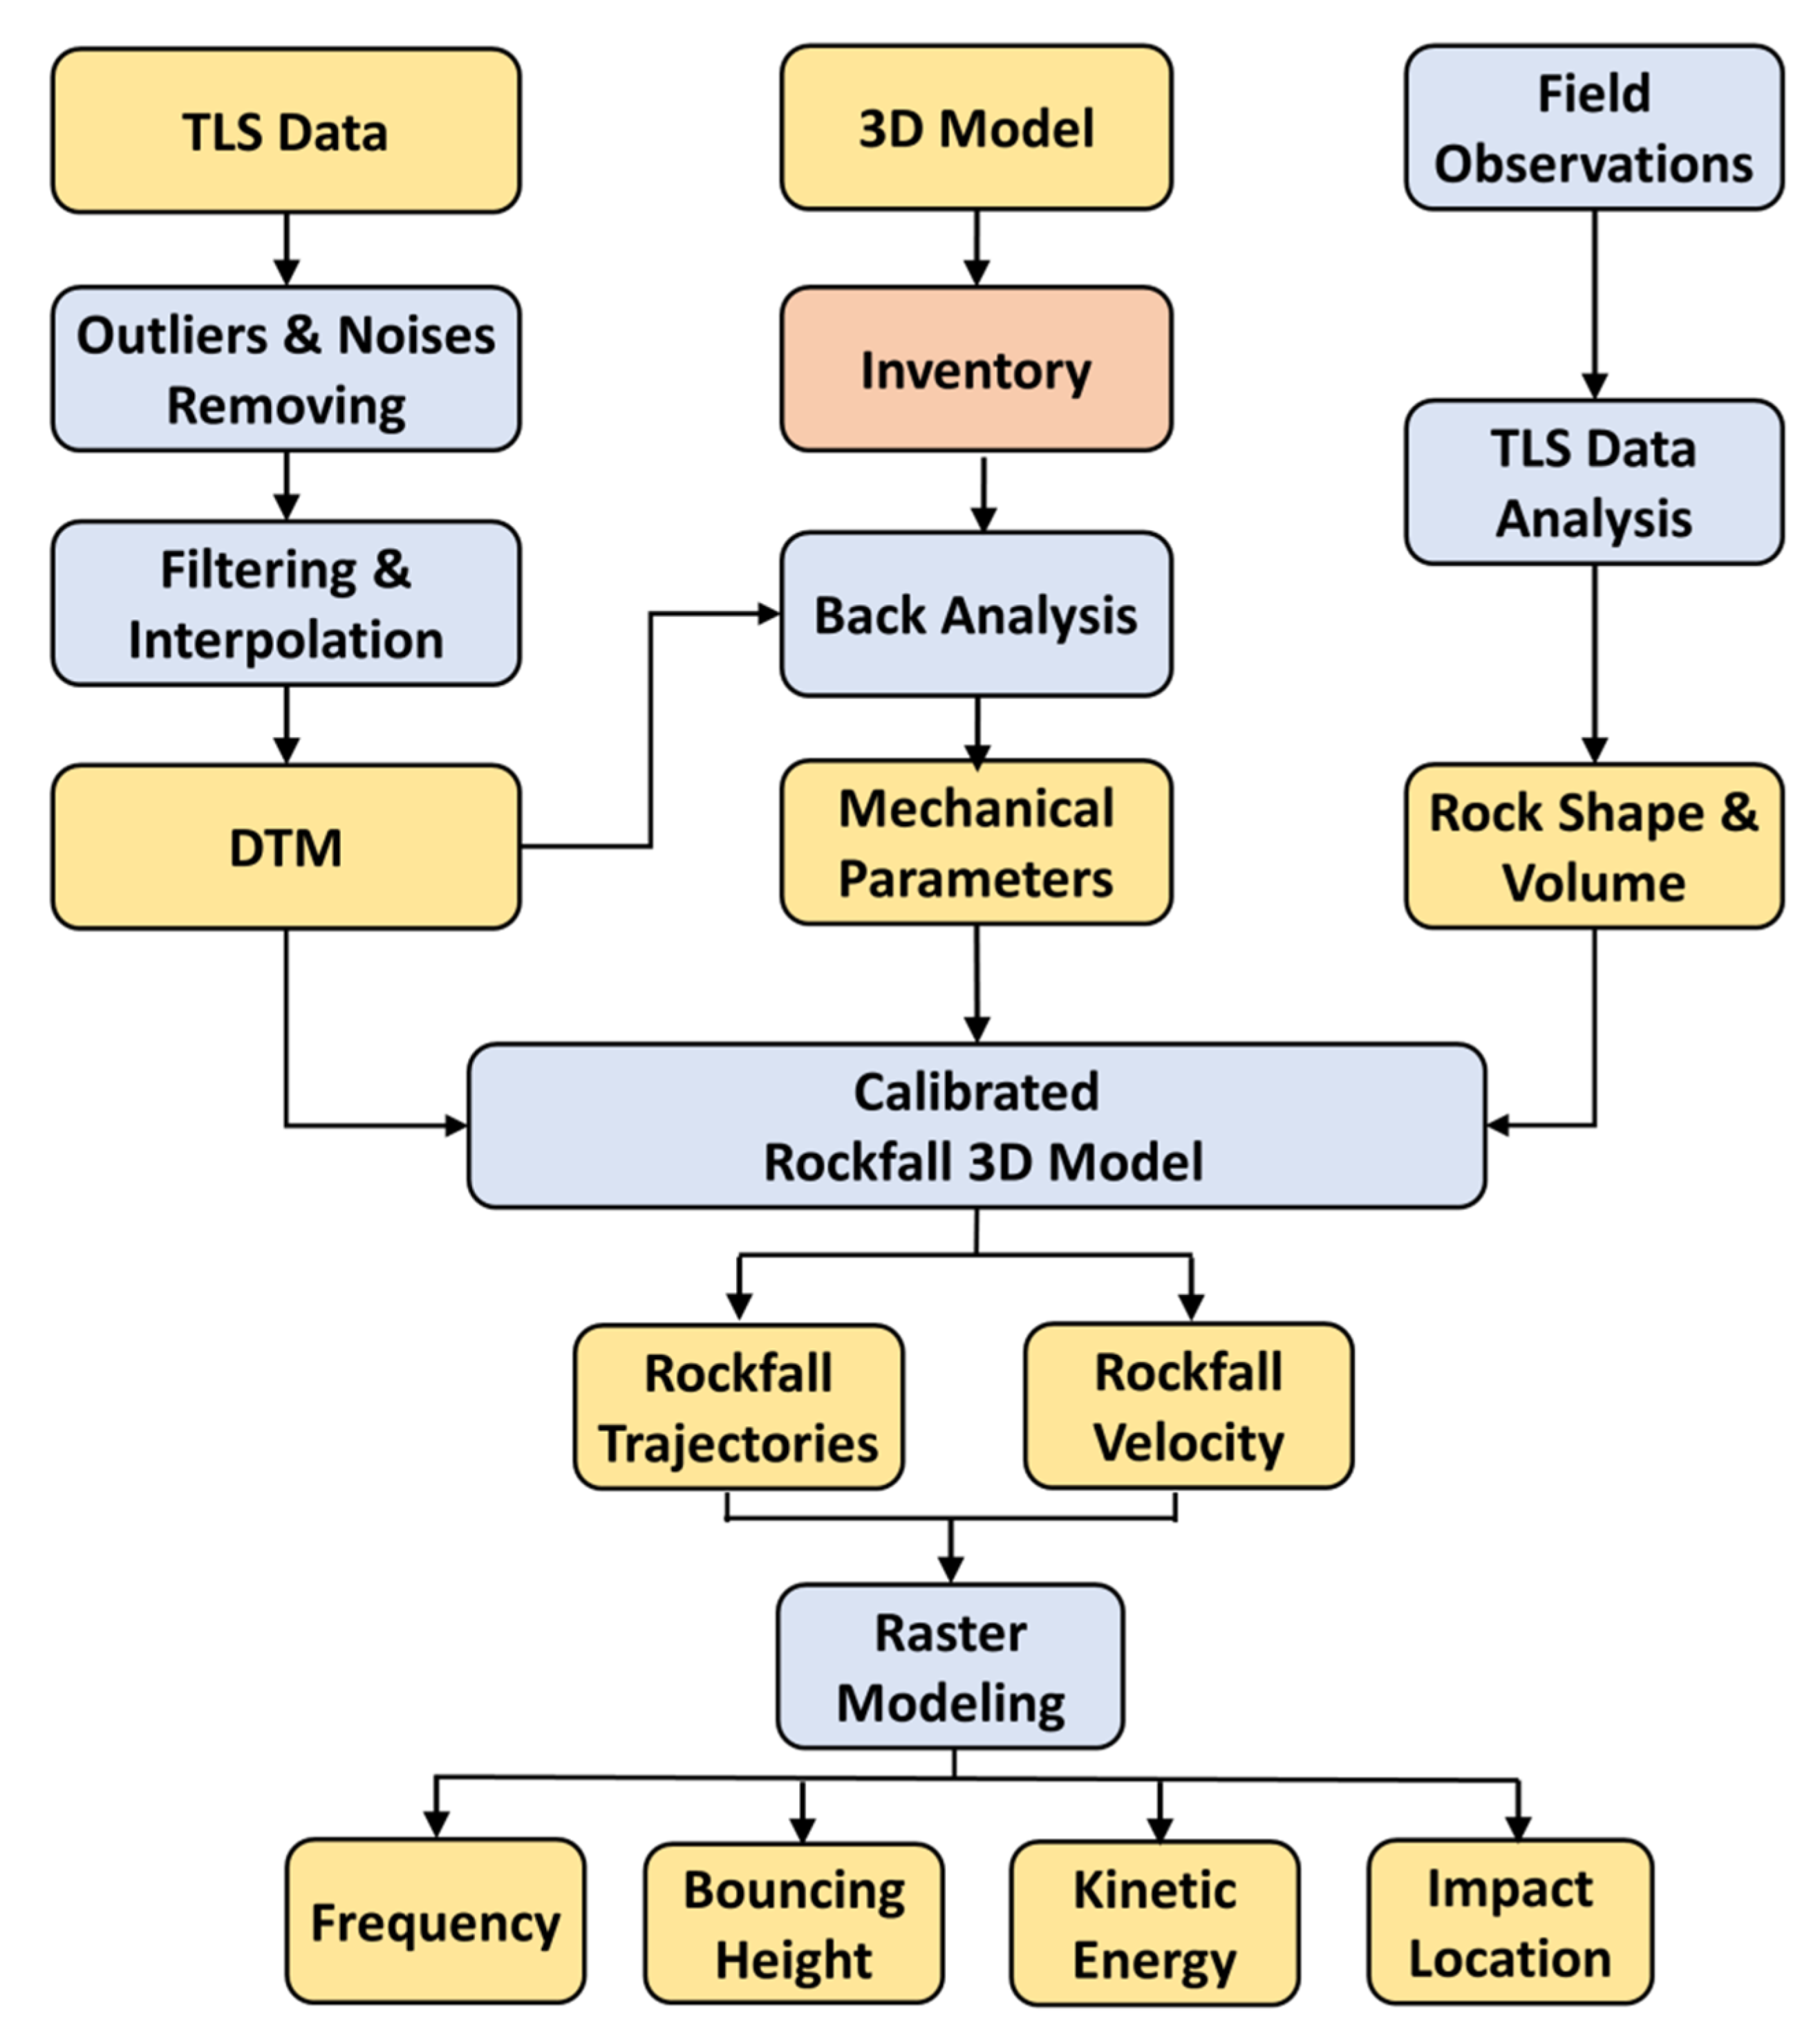
3.3. 3D Rockfall Kinematic Modeling
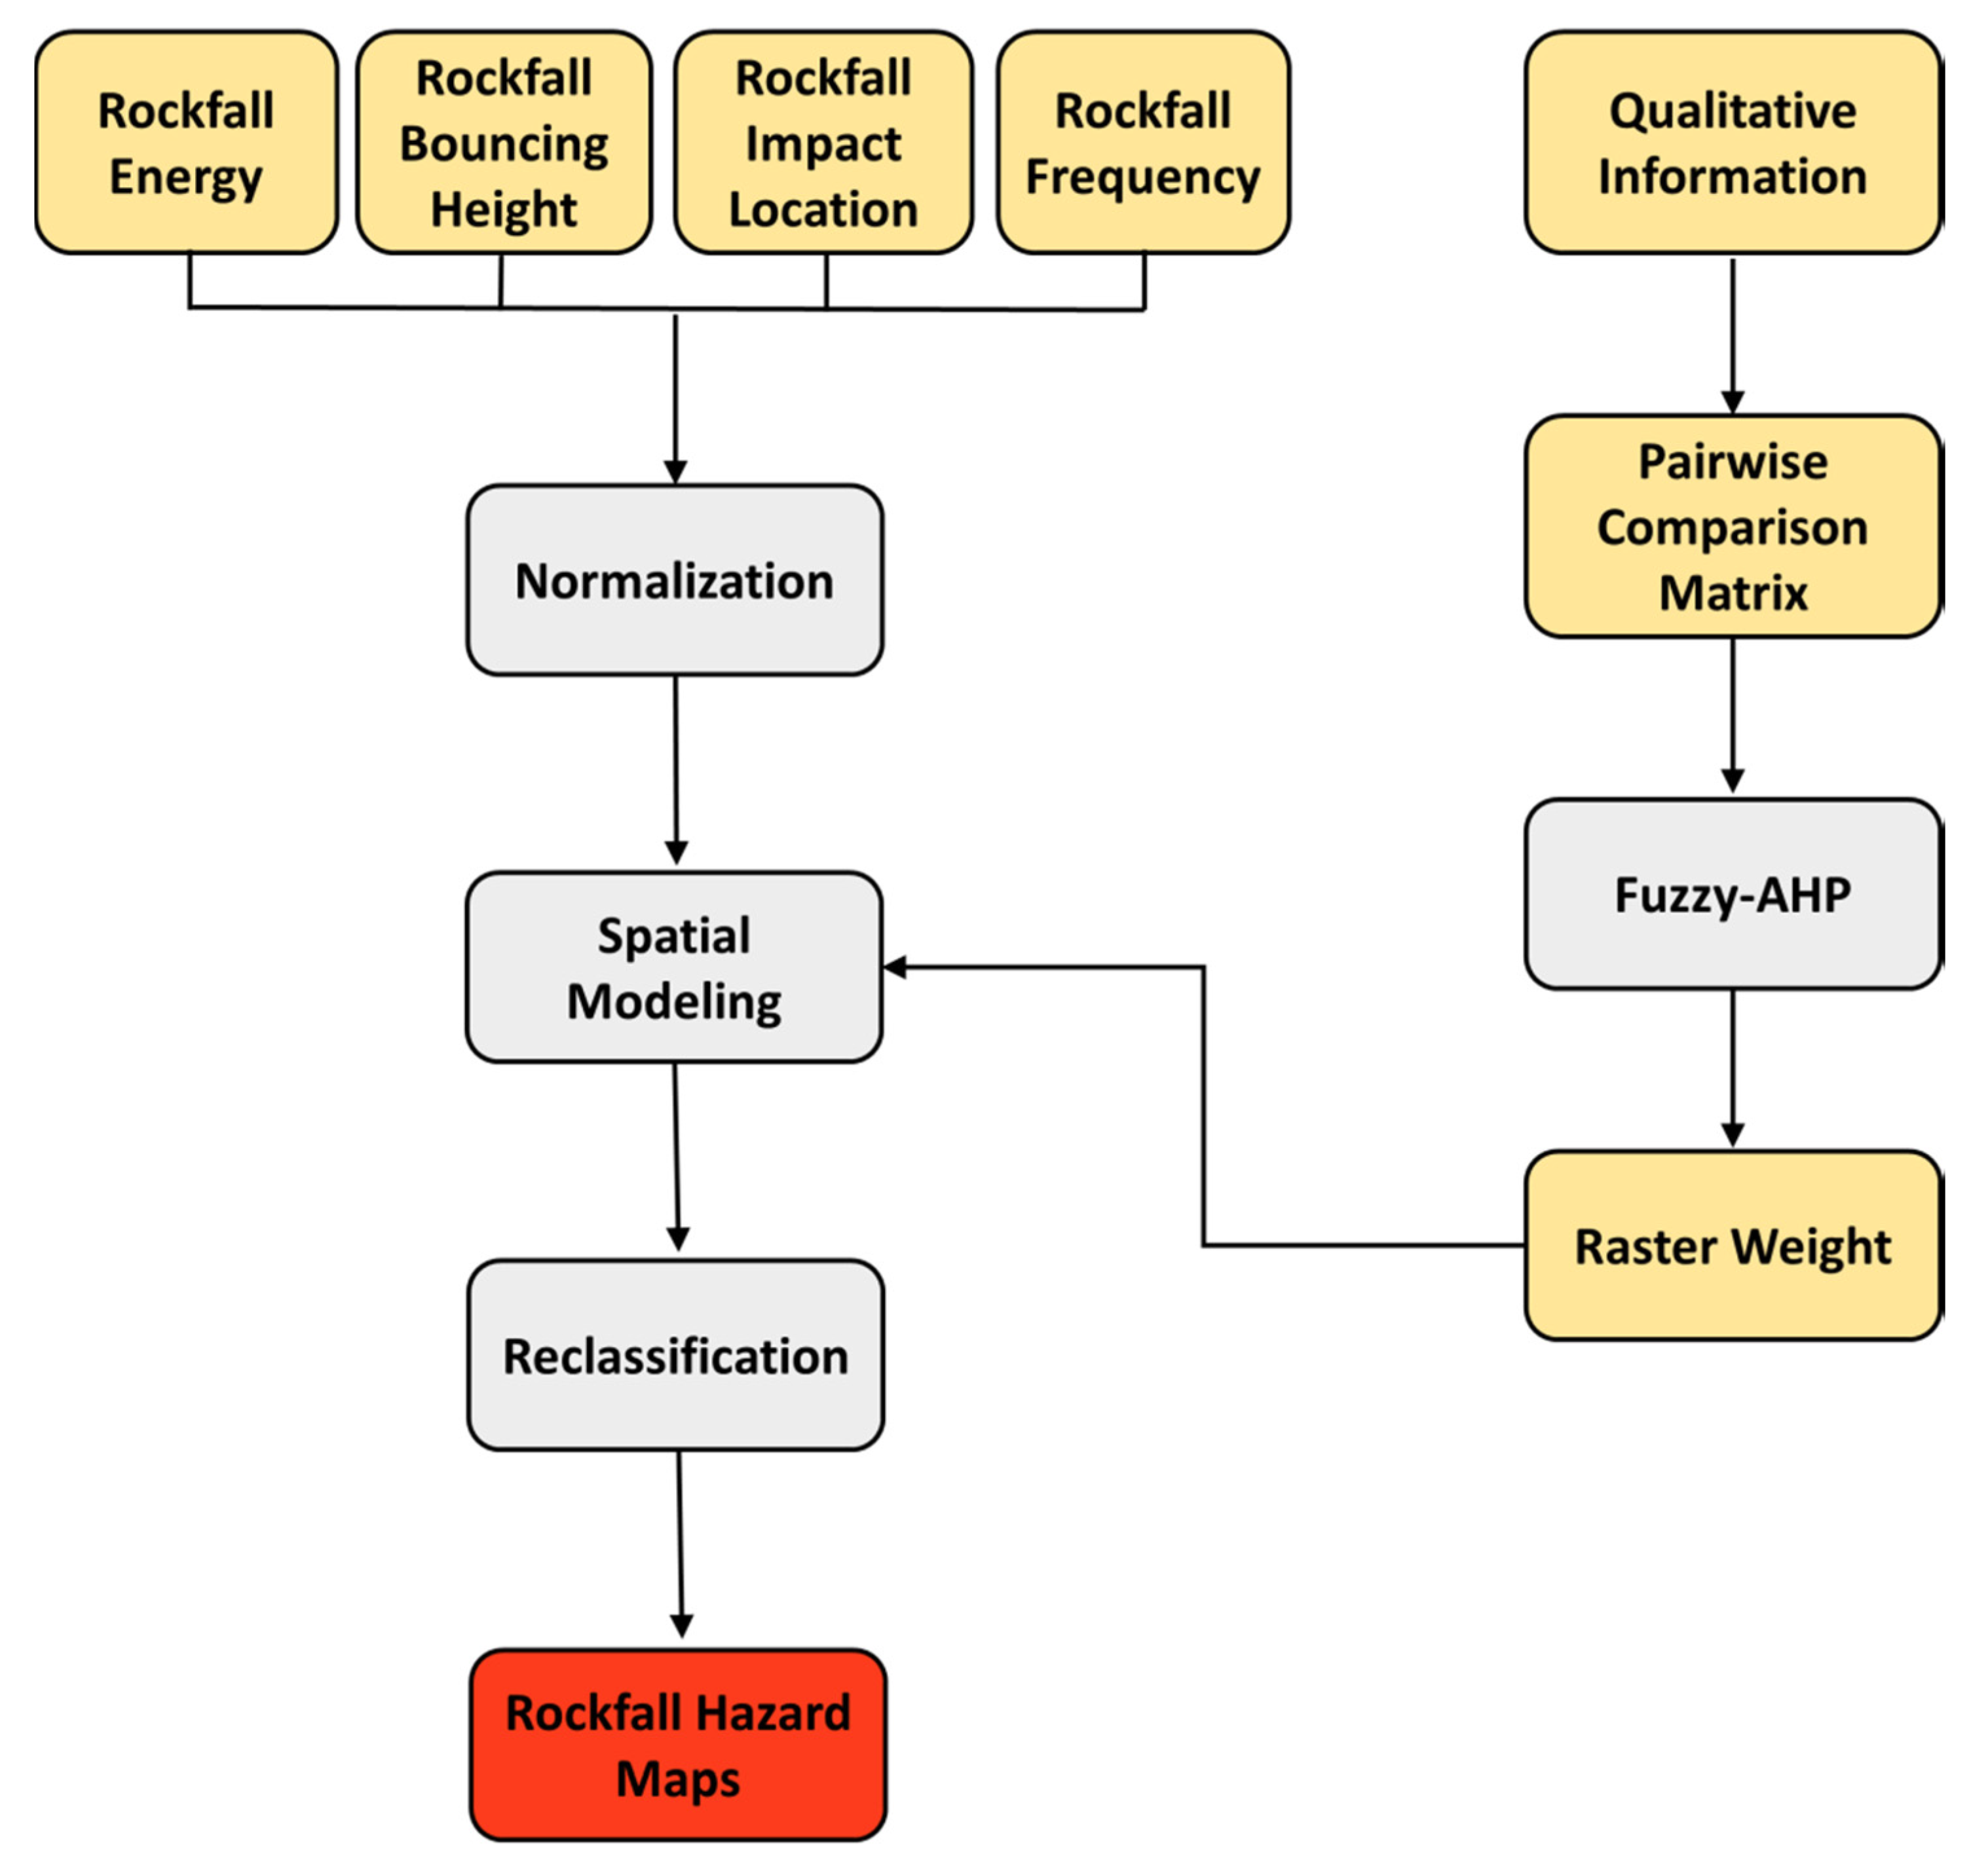
3.4. Rockfall Hazard Assessment
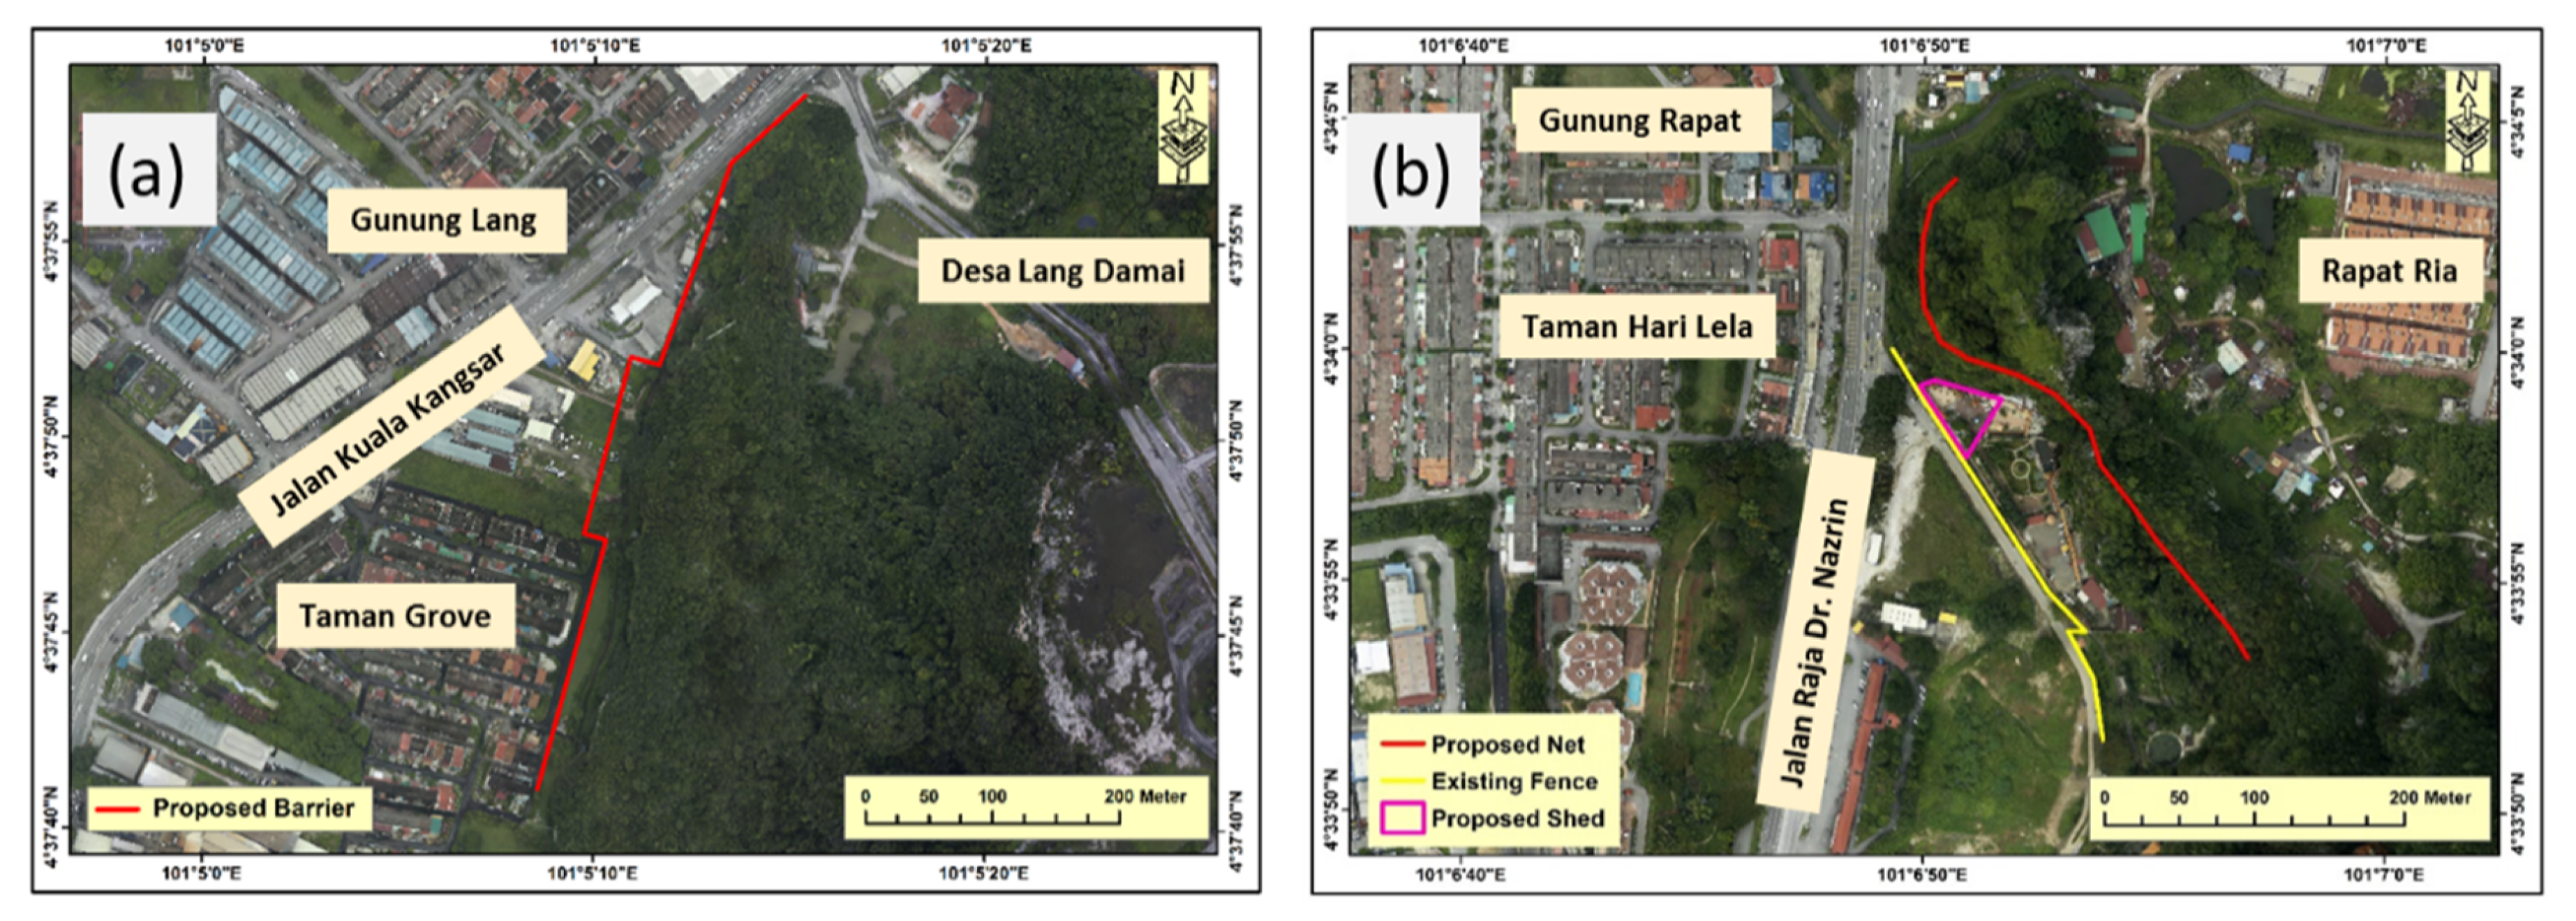
3.5. Mitigation Process Suggestions
4. Results
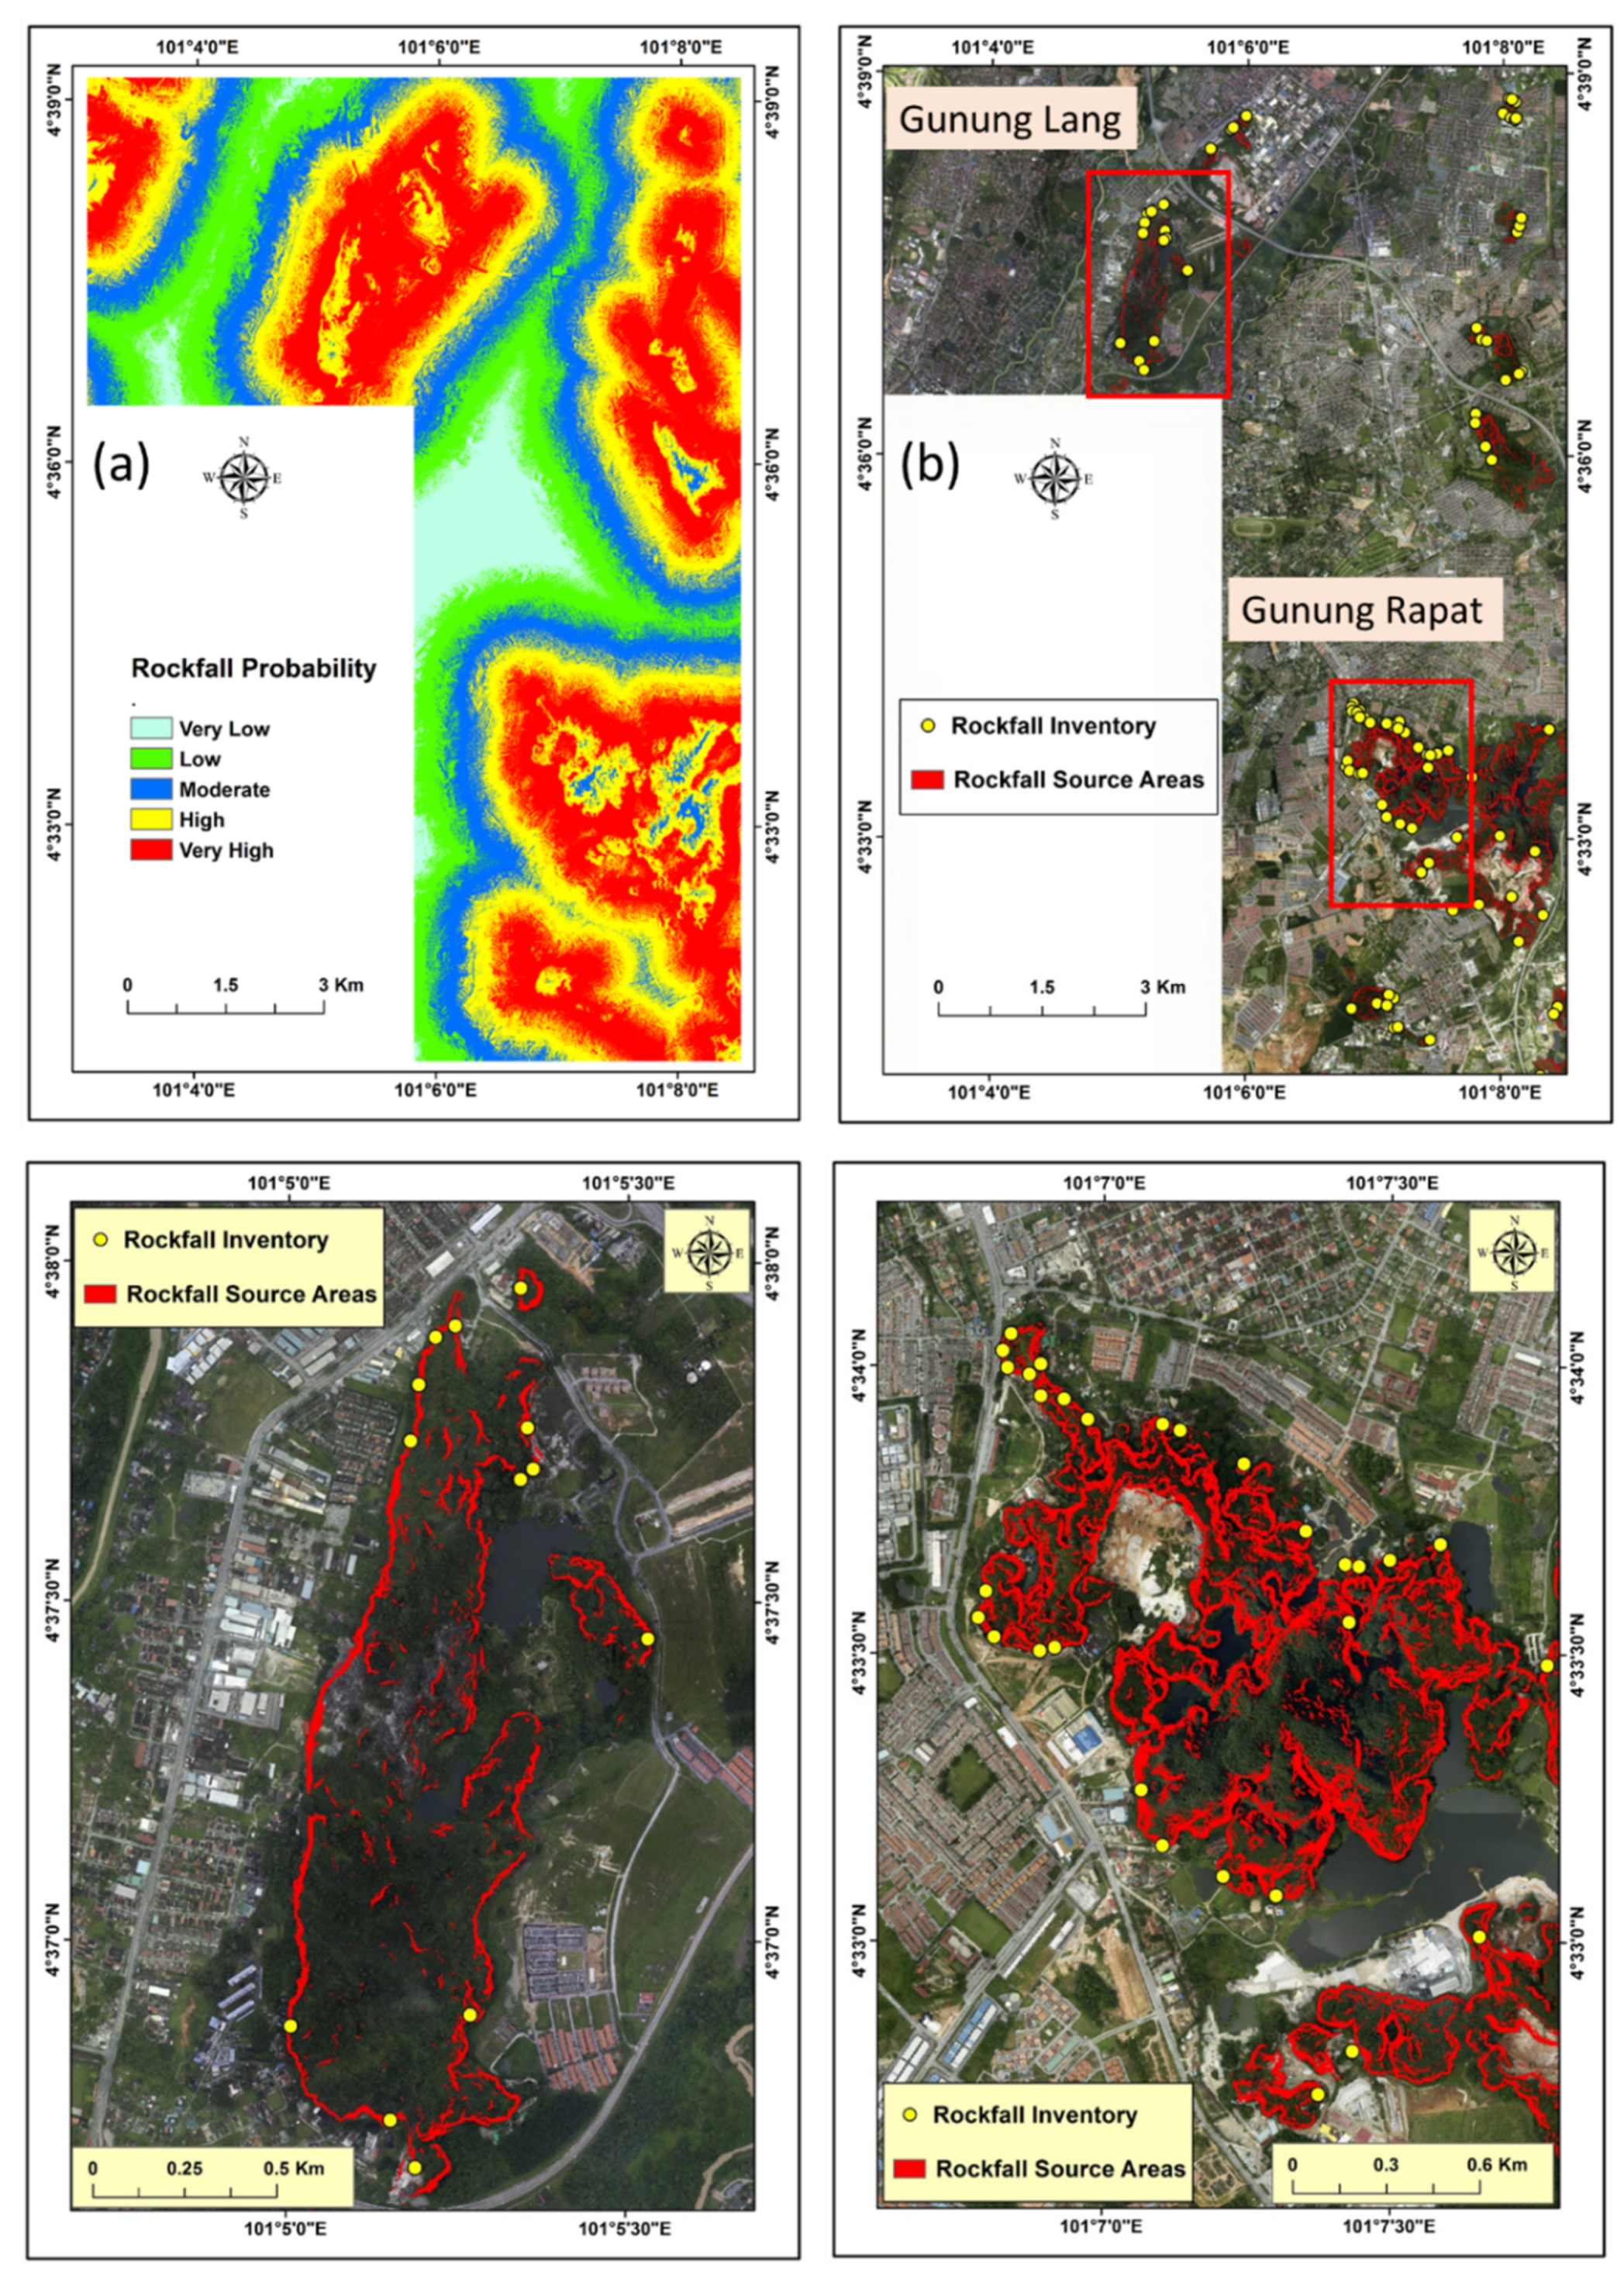
4.1. Rockfall Source Areas
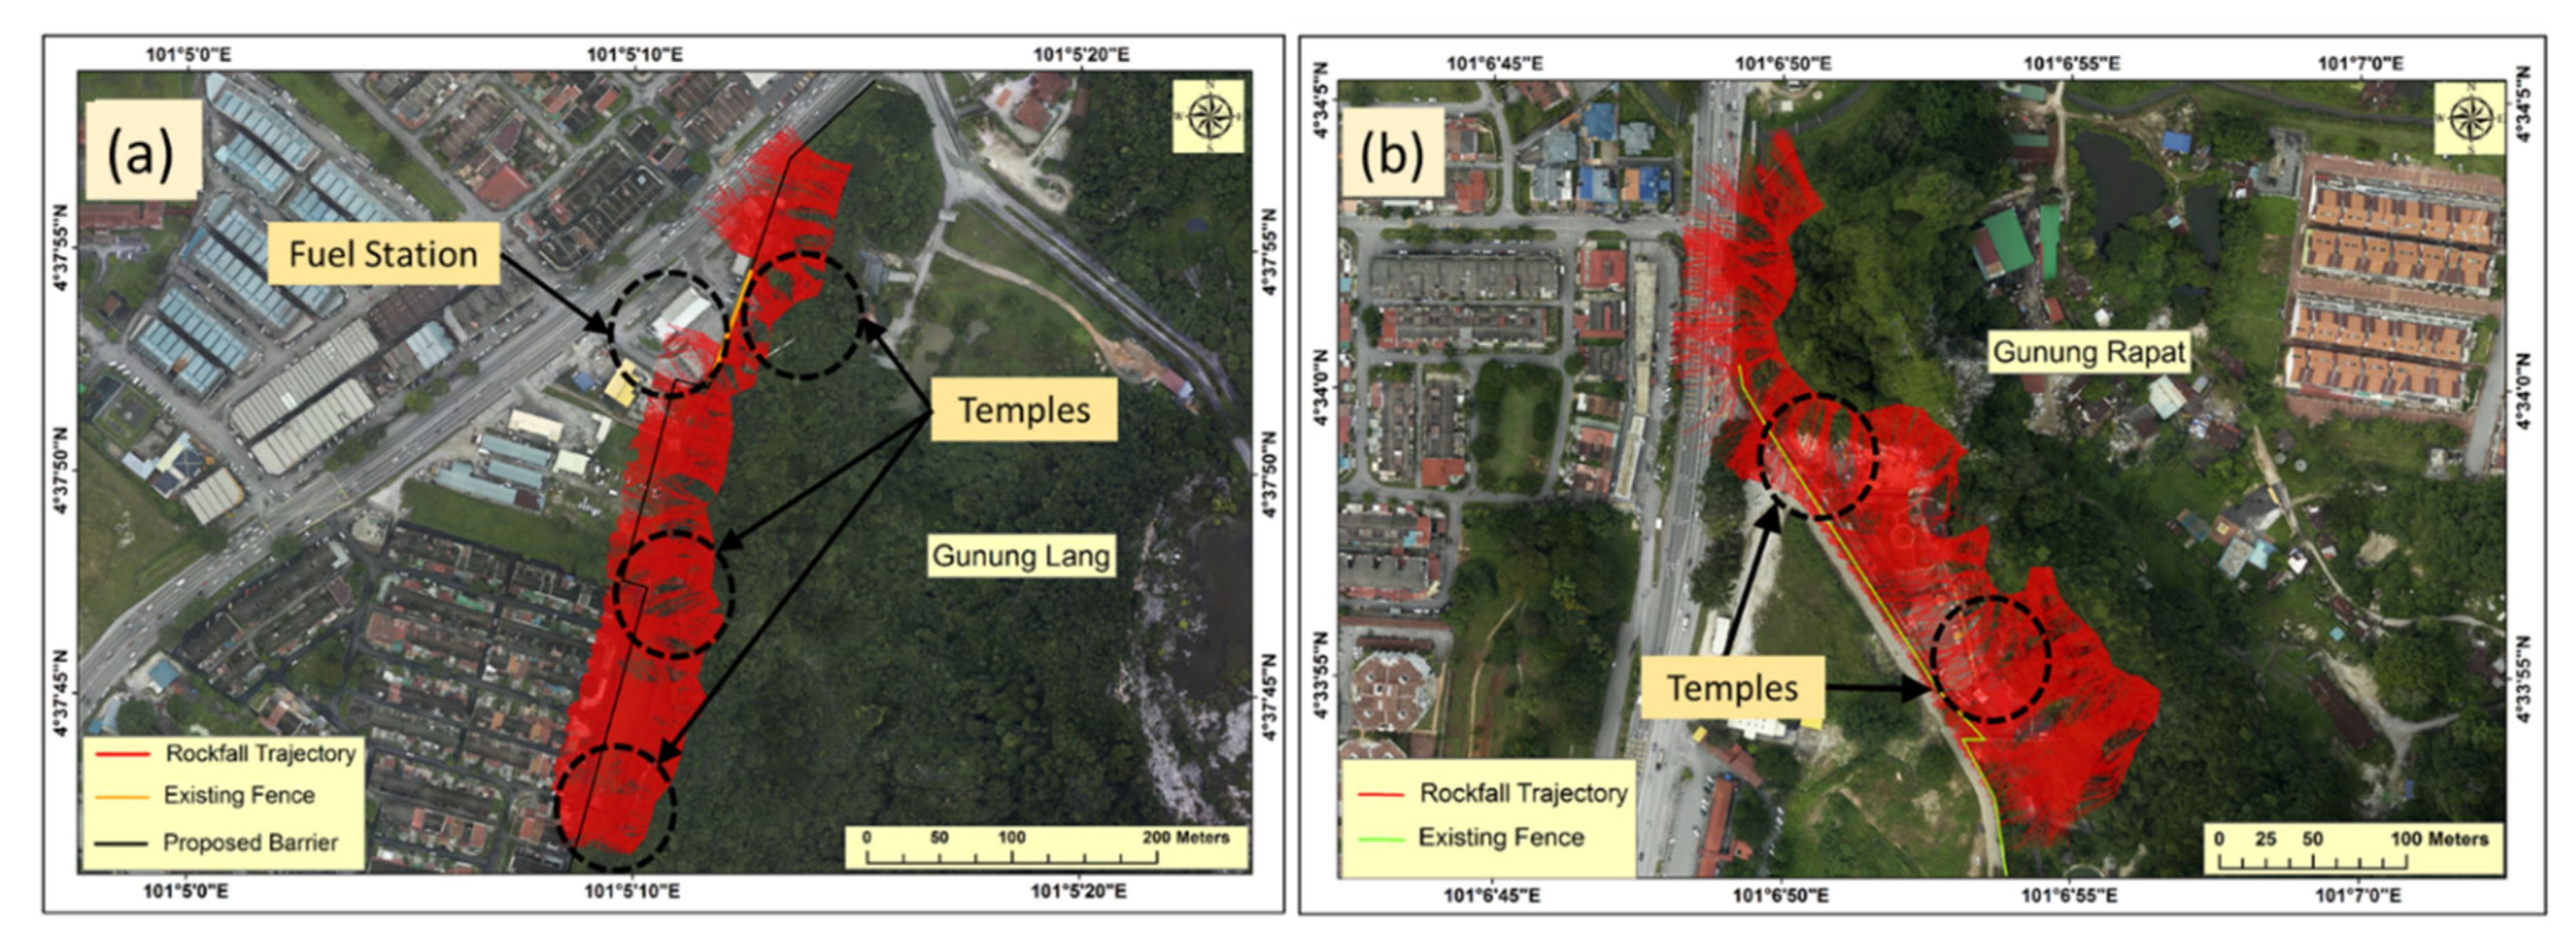
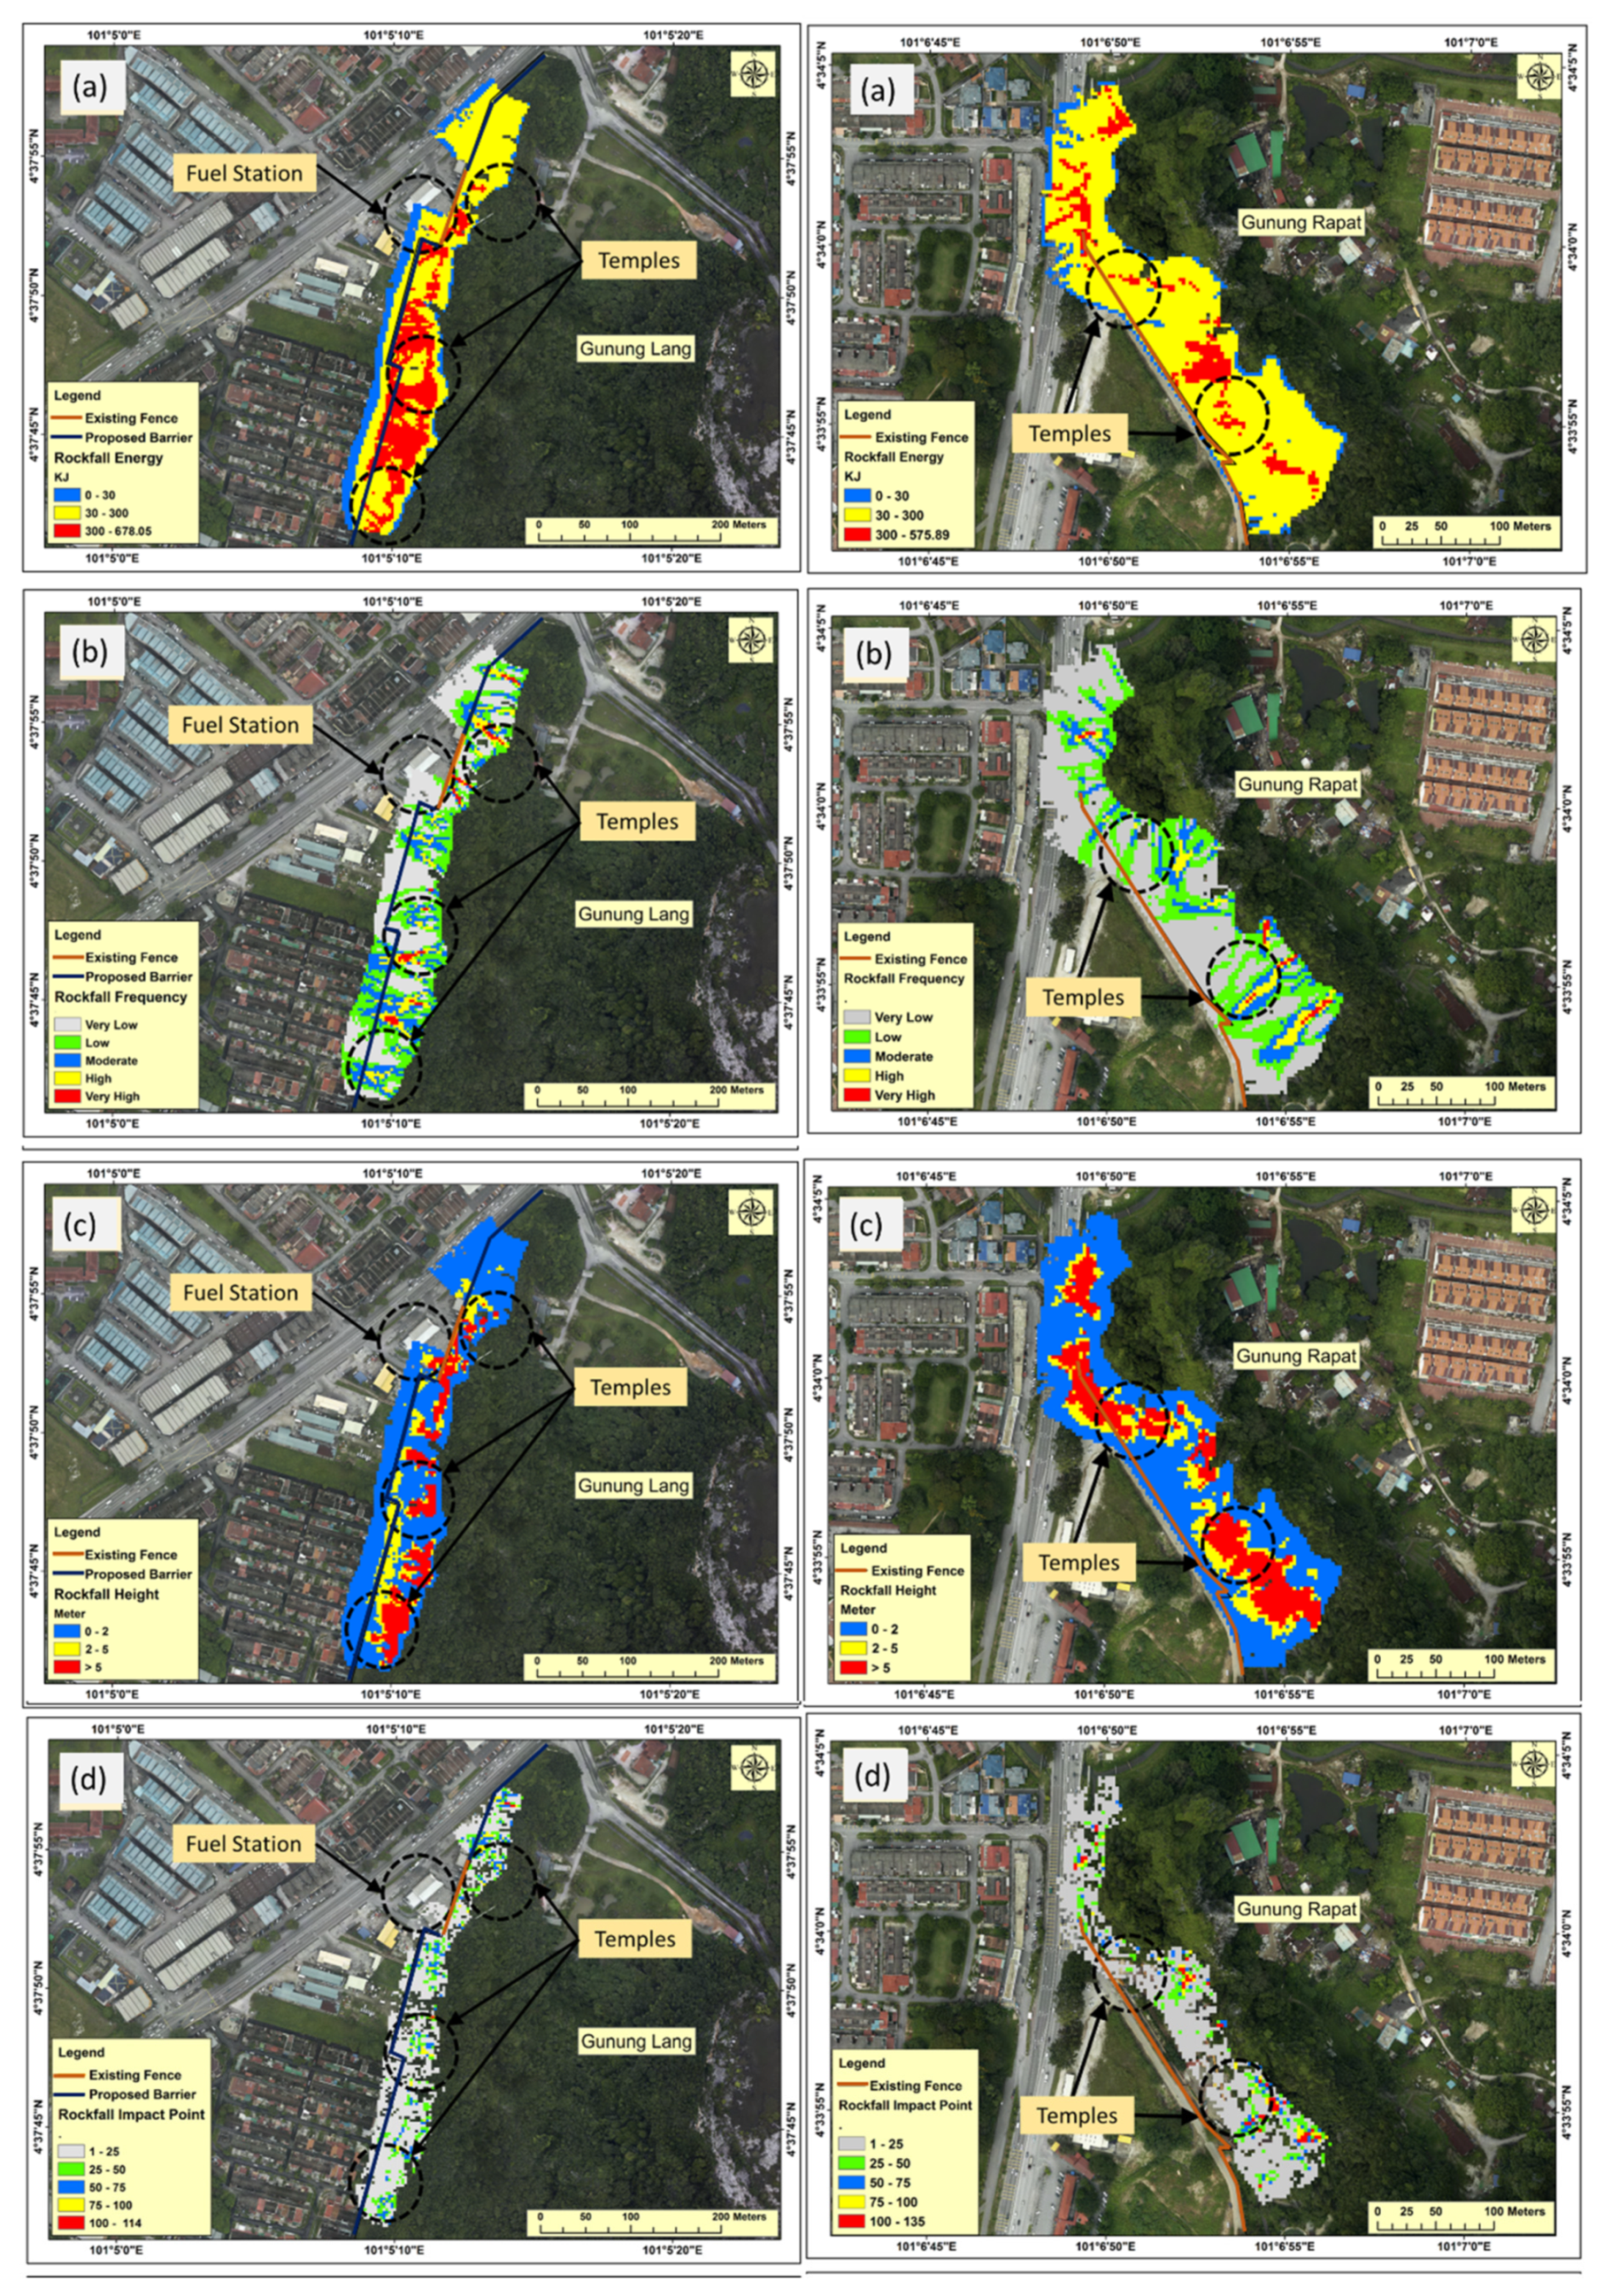
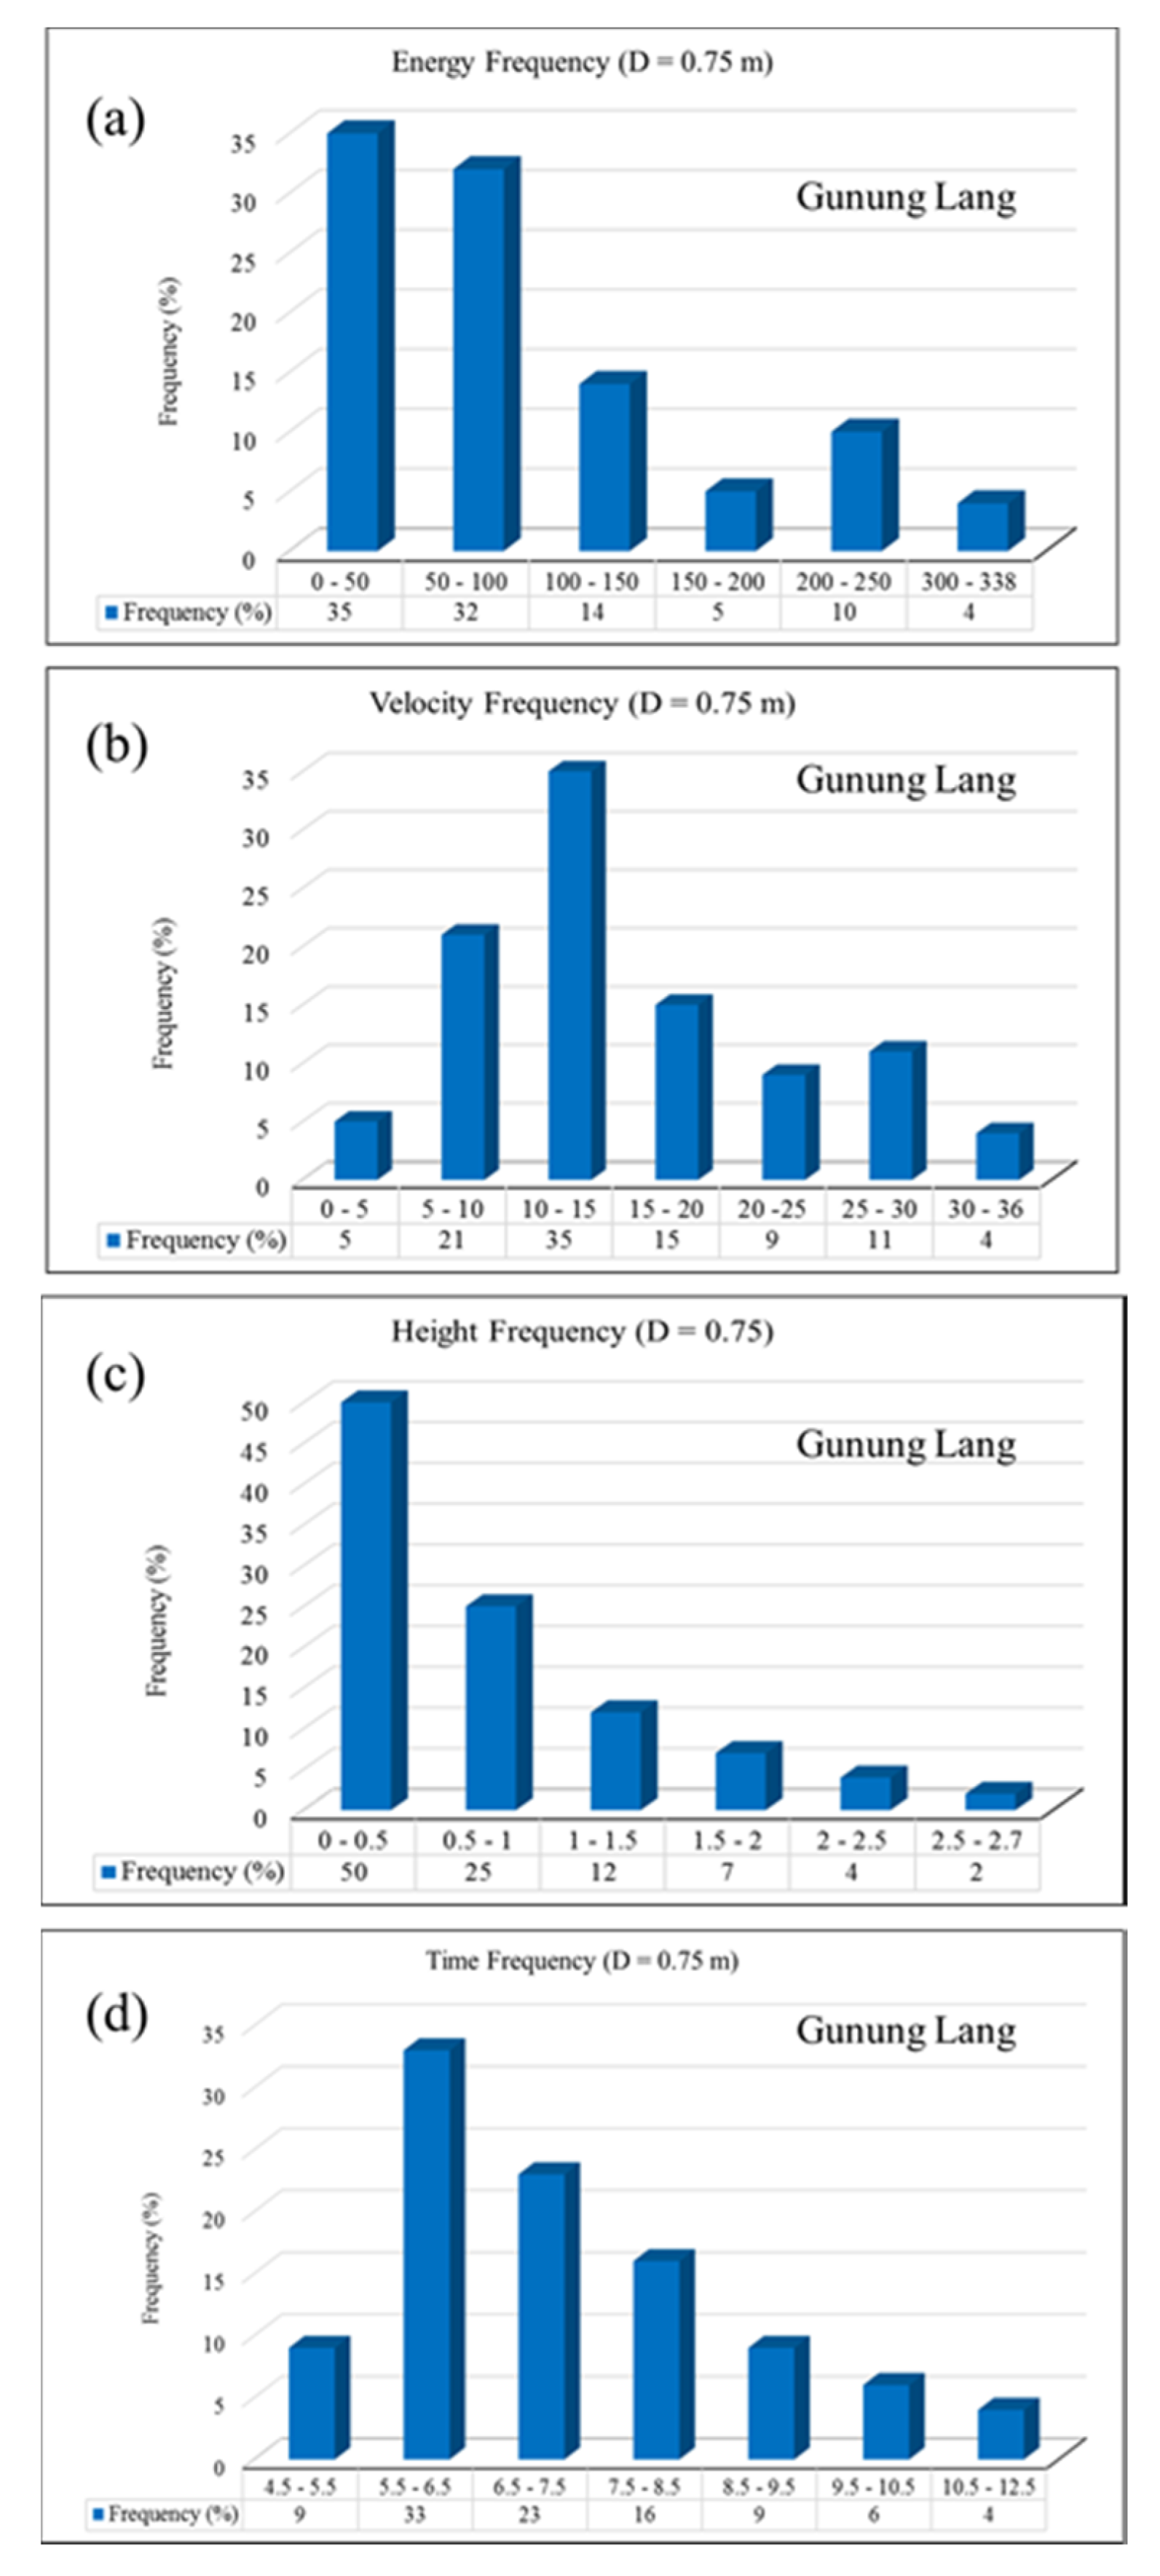
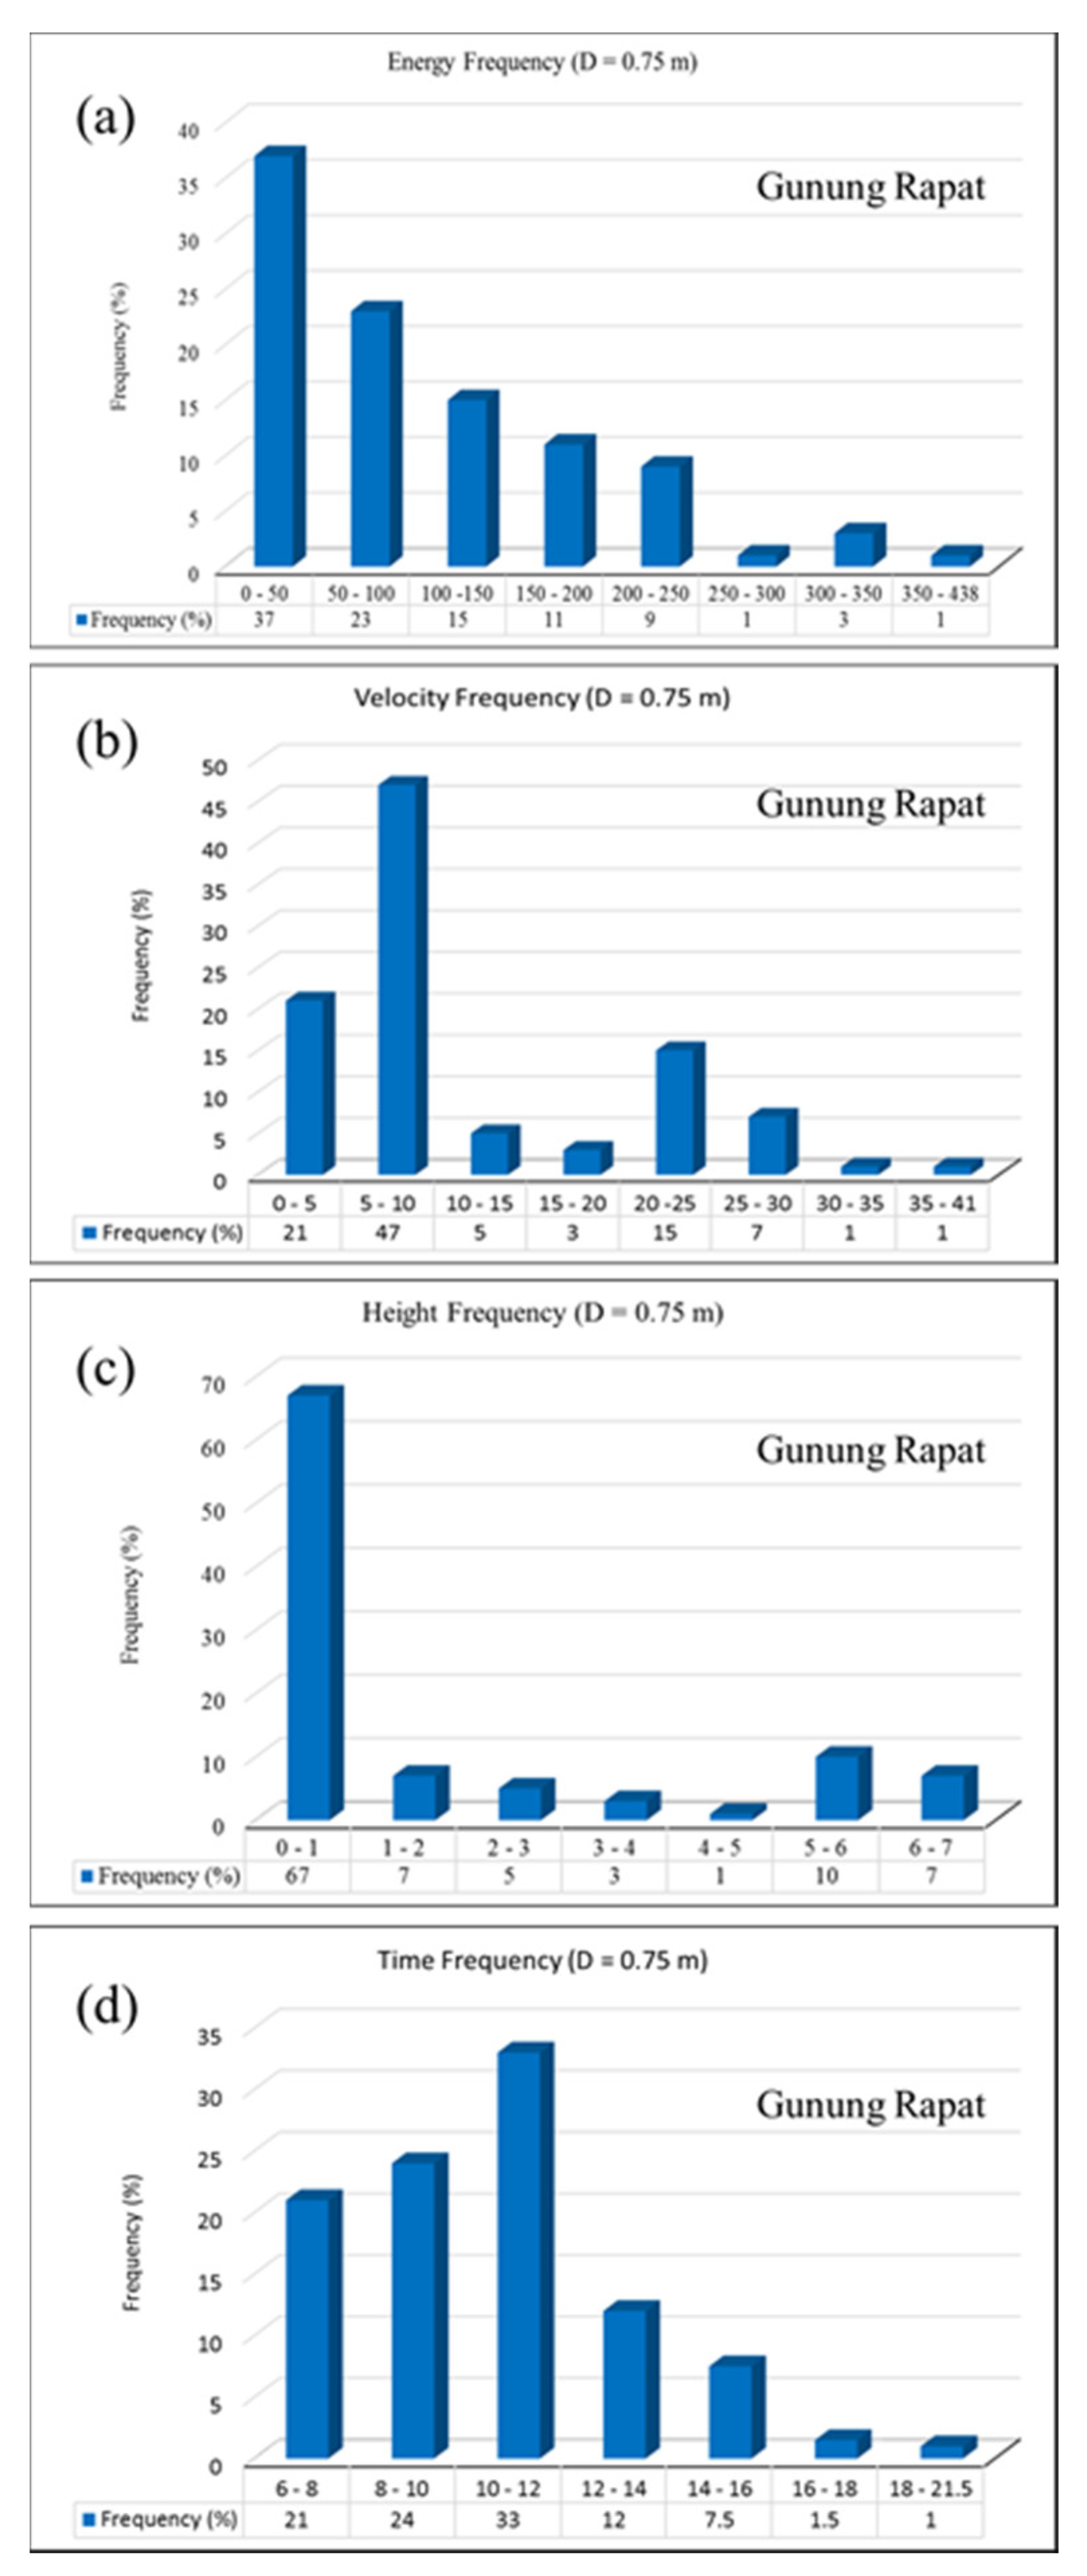
4.2. Rockfall Trajectories and Raster Modeling
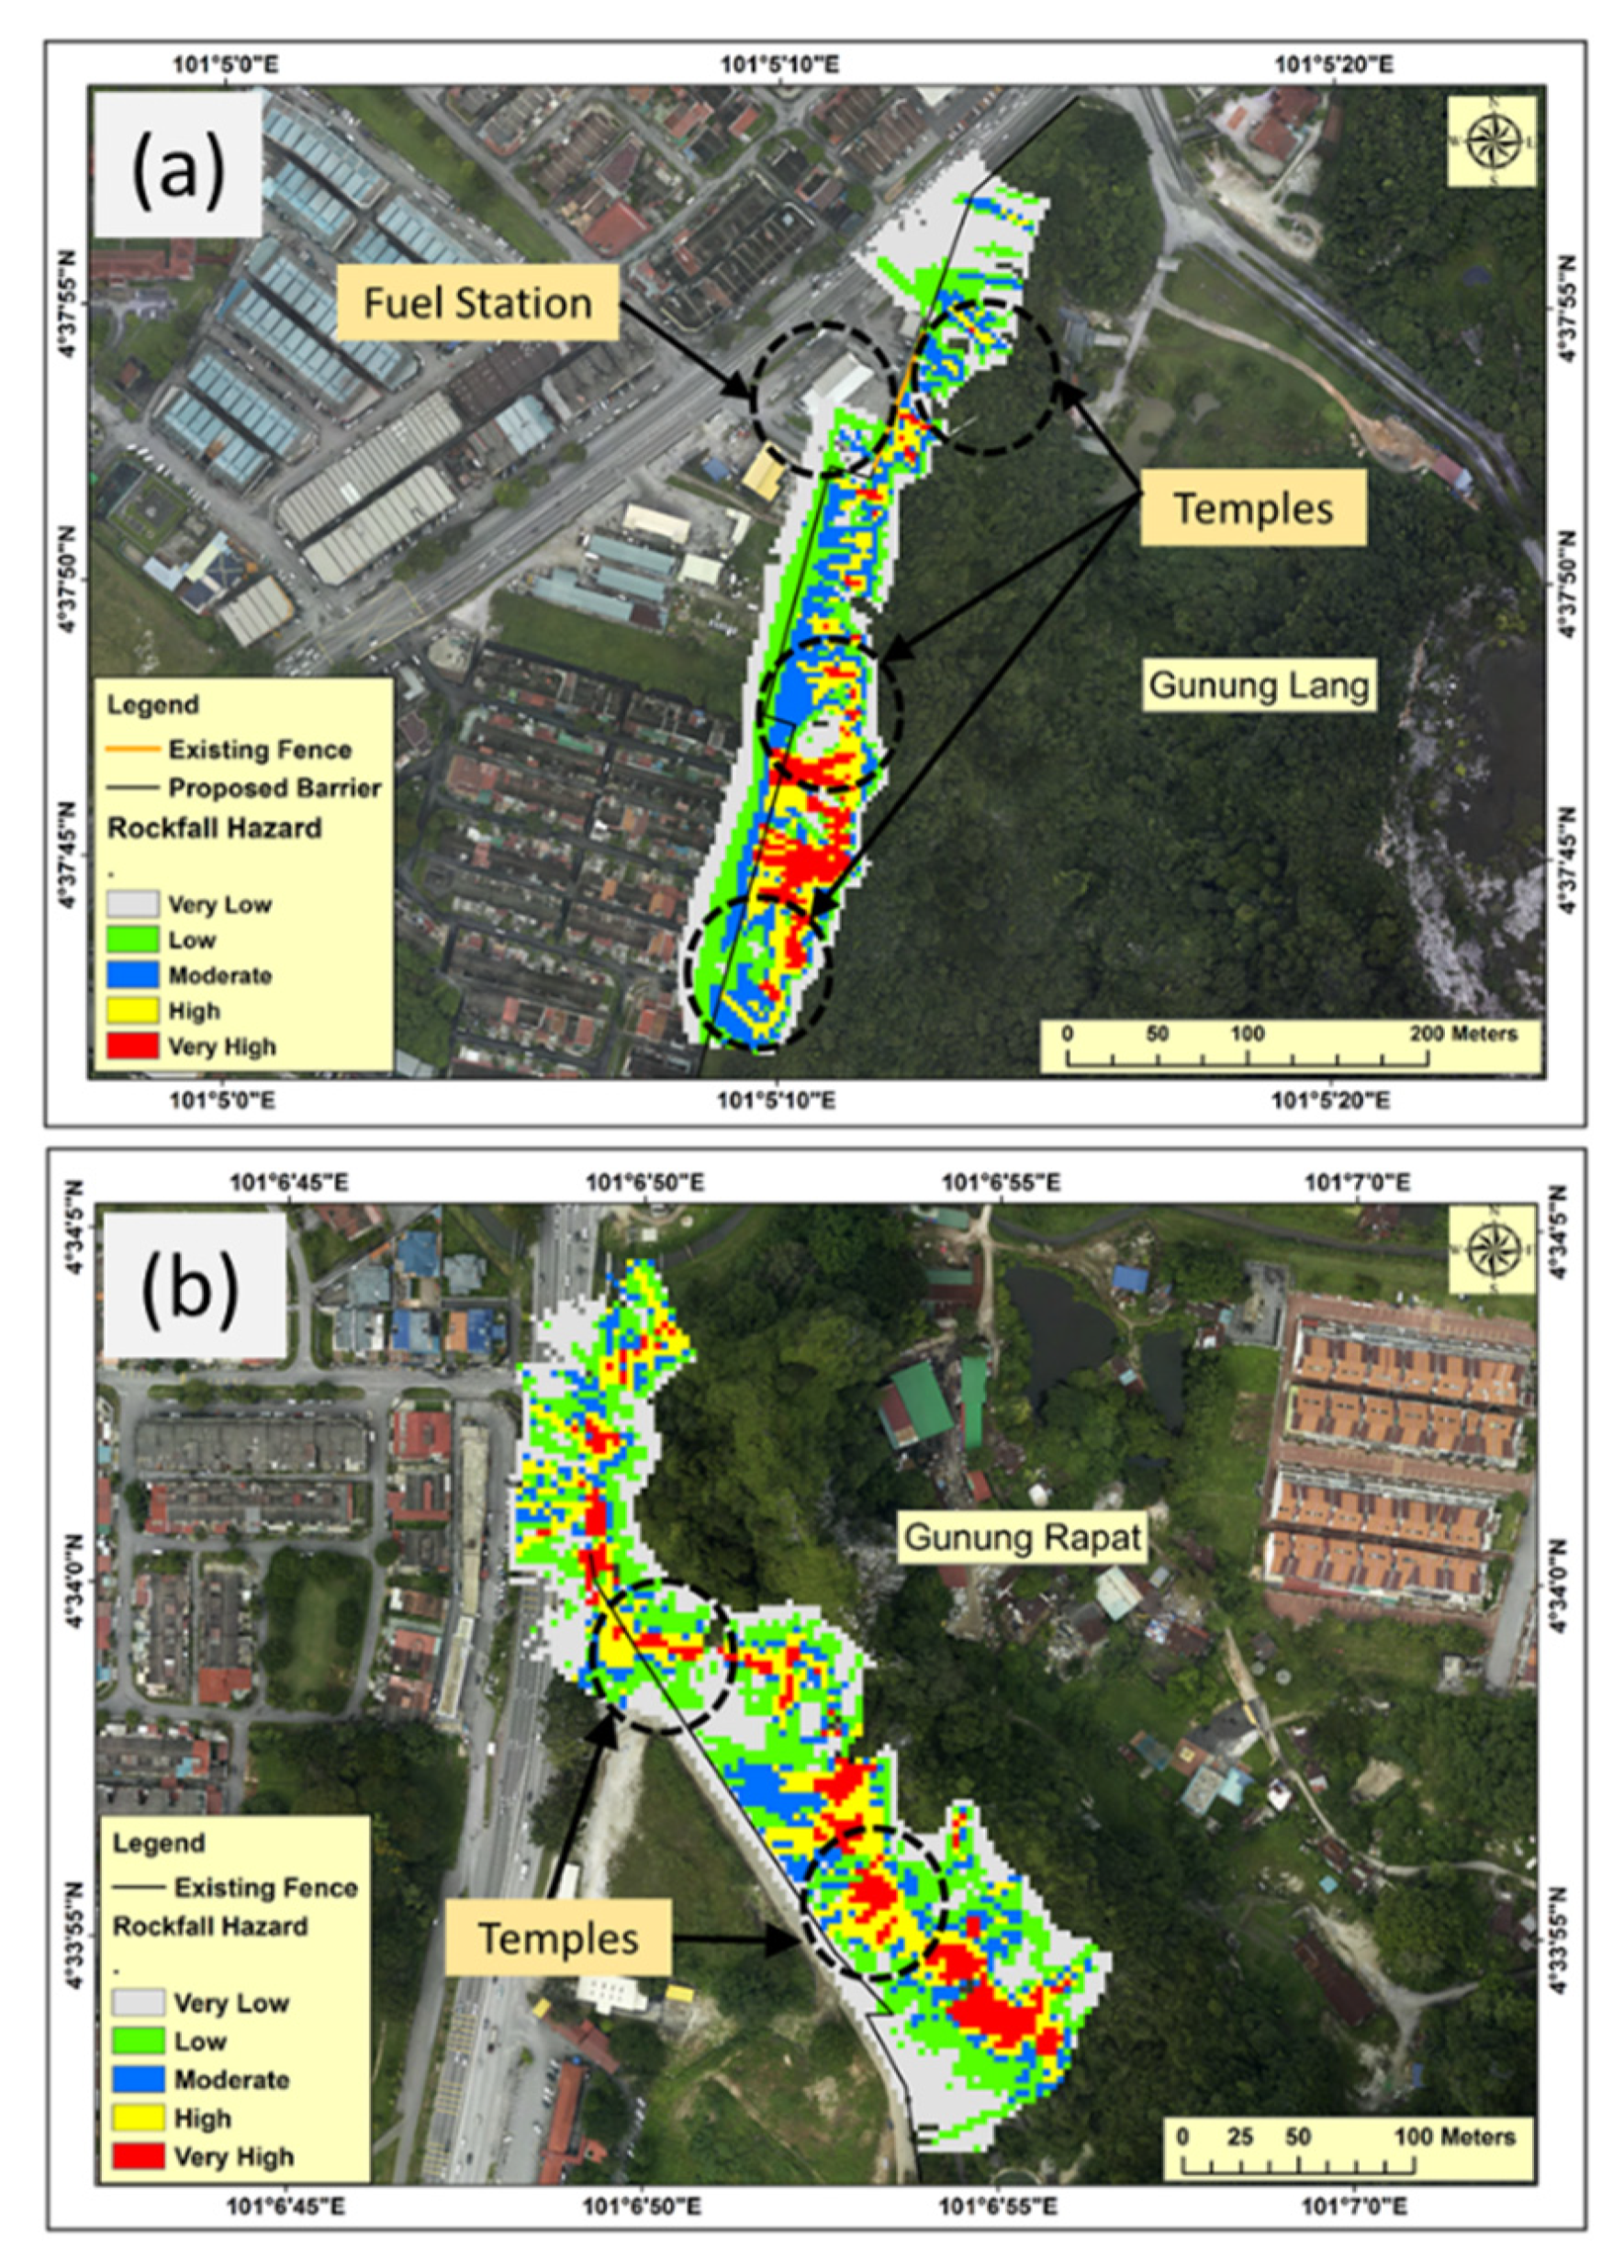
4.3. Rockfall Hazard Maps
4.4. The Assessment of the Suggested Mitigation Approaches
5. Discussion
5.1. Rockfall Sources Identification
5.2. Rockfall Trajectories and Their Characteristics
5.3. Rockfall Hazard Assessment
5.4. Suggested Mitigation Approaches
6. Conclusions
Author Contributions
Funding
Acknowledgments
Conflicts of Interest
References
- Dunham, L.; Wartman, J.; Olsen, M.J.; O’Banion, M.; Cunningham, K. Rockfall Activity Index (RAI): A lidar-derived, morphology-based method for hazard assessment. Eng. Geol. 2017, 221, 184–192. [Google Scholar] [CrossRef]
- Pradhan, B.; Fanos, A.M. Rockfall Hazard Assessment: An Overview. In Laser Scanning Applications in Landslide Assessment; Springer Science and Business Media LLC: Cham, Switzerland, 2017; Volume 119, pp. 299–322. [Google Scholar]
- Fanos, A.M.; Pradhan, B. Laser Scanning Systems and Techniques in Rockfall Source Identification and Risk Assessment: A Critical Review. Earth Syst. Environ. 2018, 2, 163–182. [Google Scholar] [CrossRef]
- Pradhan, B.; Fanos, A.M. Application of LiDAR in Rockfall Hazard Assessment in Tropical Region. In Laser Scanning Applications in Landslide Assessment; Springer Science and Business Media LLC: Cham, Switzerland, 2017; Volume 3, pp. 323–359. [Google Scholar]
- Lato, M.J.; Anderson, S.; Porter, M.J. Reducing Landslide Risk Using Airborne Lidar Scanning Data. J. Geotech. Geoenviron. Eng. 2019, 145, 06019004. [Google Scholar] [CrossRef]
- Fanos, A.M.; Pradhan, B. A Novel Hybrid Machine Learning-Based Model for Rockfall Source Identification in Presence of Other Landslide Types Using LiDAR and GIS. Earth Syst. Environ. 2019, 3, 491–506. [Google Scholar] [CrossRef]
- Farmakis, I.; Marinos, V.; Papathanassiou, G.; Karantanellis, E. Automated 3D Jointed Rock Mass Structural Analysis and Characterization Using LiDAR Terrestrial Laser Scanner for Rockfall Susceptibility Assessment: Perissa Area Case (Santorini). Geotech. Geol. Eng. 2020, 38, 3007–3024. [Google Scholar] [CrossRef]
- Agliardi, F.; Riva, F.; Galletti, L.; Zanchi, A.; Crosta, G.B. Rockfall source characterization at high rock walls in complex geological settings by photogrammetry structural analysis and DFN techniques. In EGU General Assembly Conference Abstracts 2016, Proceedings of the EGU General Assembly 2017, Vienna, Austria, 23–28 April 2017; The SAO/NASA Astrophysics Data System: Cambridge, MA, USA, 2016; Volume 18, p. 13071. [Google Scholar]
- Fanos, A.M.; Pradhan, B.; Mansor, S.; Yusoff, Z.M.; Bin Abdullah, A.F. A hybrid model using machine learning methods and GIS for potential rockfall source identification from airborne laser scanning data. Landslides 2018, 15, 1833–1850. [Google Scholar] [CrossRef]
- Fanos, A.M.; Pradhan, B.; Mansor, S.; Yusoff, Z.M.; Abdullah, A.F.; Jung, H.S. Rockfall Source Identification Using a Hybrid Gaussian Mixture-Ensemble Machine Learning Model and LiDAR Data. 대한원격탐사학회지 2019, 35, 93–115. [Google Scholar]
- Pellicani, R.; Spilotro, G.; Van Westen, C.J. Rockfall trajectory modeling combined with heuristic analysis for assessing the rockfall hazard along the Maratea SS18 coastal road (Basilicata, Southern Italy). Landslides 2015, 13, 985–1003. [Google Scholar] [CrossRef]
- Saroglou, C.; Asteriou, P.; Zekkos, D.; Tsiambaos, G.; Clark, M.; Manousakis, J. UAV-based mapping, back analysis and trajectory modeling of a coseismic rockfall in Lefkada island, Greece. Nat. Hazards Earth Syst. Sci. 2018, 18, 321–333. [Google Scholar] [CrossRef]
- Fanos, A.M.; Pradhan, B. A novel rockfall hazard assessment using laser scanning data and 3D modelling in GIS. Catena 2019, 172, 435–450. [Google Scholar] [CrossRef]
- Ferrari, F.; Giacomini, A.; Thoeni, K.; Lambert, C. Qualitative evolving rockfall hazard assessment for highwalls. Int. J. Rock Mech. Min. Sci. 2017, 98, 88–101. [Google Scholar] [CrossRef]
- Depountis, N.; Nikolakopoulos, K.; Kavoura, K.; Sabatakakis, N. Description of a GIS-based rockfall hazard assessment methodology and its application in mountainous sites. Bull. Int. Assoc. Eng. Geol. 2019, 79, 645–658. [Google Scholar] [CrossRef]
- Budetta, P.; De Luca, C.; Nappi, M. Quantitative rockfall risk assessment for an important road by means of the rockfall risk management (RO.MA.) method. Bull. Int. Assoc. Eng. Geol. 2015, 75, 1377–1397. [Google Scholar] [CrossRef]
- Li, X.-N.; Ling, S.-X.; Sun, C.-W.; Xu, J.-X.; Huang, T. Integrated rockfall hazard and risk assessment along highways: An example for Jiuzhaigou area after the 2017 Ms 7.0 Jiuzhaigou earthquake, China. J. Mt. Sci. 2019, 16, 1318–1335. [Google Scholar] [CrossRef]
- Mineo, S. Comparing rockfall hazard and risk assessment procedures along roads for different planning purposes. J. Mt. Sci. 2020, 17, 653–669. [Google Scholar] [CrossRef]
- Pham, B.T.; Pradhan, B.; Bui, D.T.; Prakash, I.; Dholakia, M. A comparative study of different machine learning methods for landslide susceptibility assessment: A case study of Uttarakhand area (India). Environ. Model. Softw. 2016, 84, 240–250. [Google Scholar] [CrossRef]
- Bui, D.T.; Tuan, T.A.; Klempe, H.; Pradhan, B.; Revhaug, I. Spatial prediction models for shallow landslide hazards: A comparative assessment of the efficacy of support vector machines, artificial neural networks, kernel logistic regression, and logistic model tree. Landslides 2015, 13, 361–378. [Google Scholar] [CrossRef]
- Lombardo, L.; MaiiD, P.M. Presenting logistic regression-based landslide susceptibility results. Eng. Geol. 2018, 244, 14–24. [Google Scholar] [CrossRef]
- Youssef, A.; Pourghasemi, H.R.; Pourtaghi, Z.S.; Al-Katheeri, M.M. Landslide susceptibility mapping using random forest, boosted regression tree, classification and regression tree, and general linear models and comparison of their performance at Wadi Tayyah Basin, Asir Region, Saudi Arabia. Landslides 2015, 13, 839–856. [Google Scholar] [CrossRef]
- Chen, W.; Xie, X.; Wang, J.; Pradhan, B.; Hong, H.; Bui, D.T.; Duan, Z.; Ma, J. A comparative study of logistic model tree, random forest, and classification and regression tree models for spatial prediction of landslide susceptibility. Catena 2017, 151, 147–160. [Google Scholar] [CrossRef]
- Soma, A.S.; Kubota, T.; Mizuno, H. Optimization of causative factors using logistic regression and artificial neural network models for landslide susceptibility assessment in Ujung Loe Watershed, South Sulawesi Indonesia. J. Mt. Sci. 2019, 16, 383–401. [Google Scholar] [CrossRef]
- Shahri, A.A.; Spross, J.; Johansson, F.; Larsson, S. Landslide susceptibility hazard map in southwest Sweden using artificial neural network. Catena 2019, 183, 104225. [Google Scholar] [CrossRef]
- Pham, B.T.; Prakash, I.; Chen, W.; Ly, H.B.; Ho, L.S.; Omidvar, E.; Tran, V.P.; Bui, D.T. A Novel Intelligence Approach of a Sequential Minimal Optimization-Based Support Vector Machine for Landslide Susceptibility Mapping. Sustainability 2019, 11, 6323. [Google Scholar] [CrossRef]
- Dou, J.; Yunus, A.P.; Bui, D.T.; Merghadi, A.; Sahana, M.; Zhu, Z.; Chen, C.W.; Han, Z.; Pham, B.T. Improved landslide assessment using support vector machine with bagging, boosting, and stacking ensemble machine learning framework in a mountainous watershed, Japan. Landslides 2019, 1–8. [Google Scholar] [CrossRef]
- Sameen, M.I.; Bui, D.T.; Bui, D.T.; Alamri, A.M. Systematic sample subdividing strategy for training landslide susceptibility models. Catena 2020, 187, 104358. [Google Scholar] [CrossRef]
- Lai, G.T.; Razib, A.M.; Mazlan, N.A.; Rafek, A.G.; Ailie, N.; Serasa, S.; Mohamed, T.R. Rock slope stability assessment using slope mass rating (SMR) method: Gunung Lang Ipoh Malaysia. SJET 2016, 4, 185–192. [Google Scholar]
- Pingel, T.J.; Clarke, K.; McBride, W.A. An improved simple morphological filter for the terrain classification of airborne LIDAR data. ISPRS J. Photogramm. Remote Sens. 2013, 77, 21–30. [Google Scholar] [CrossRef]
- Hong, H.; Pradhan, B.; Jebur, M.N.; Bui, D.T.; Xu, C.; Akgun, A. Spatial prediction of landslide hazard at the Luxi area (China) using support vector machines. Environ. Earth Sci. 2015, 75, 40. [Google Scholar] [CrossRef]
- Hong, H.; Pradhan, B.; Sameen, M.; Chen, W.; Xu, C. Spatial prediction of rotational landslide using geographically weighted regression, logistic regression, and support vector machine models in Xing Guo area (China). Geomat. Nat. Hazards Risk 2017, 8, 1997–2022. [Google Scholar] [CrossRef]
- RocPro3D. RocPro3D Software. 2014. Available online: http://www.rocpro3d.com/rocpro3d_en.php (accessed on 19 February 2020).
- Ritchie, A.M. Evaluation of rockfall and its control. Highw. Res. Rec. 1963, 17, 13–28. [Google Scholar]
- Volkwein, A.; Schellenberg, K.; Labiouse, V.; Agliardi, F.; Berger, F.; Bourrier, F.; Dorren, L.K.A.; Gerber, W.; Guerin, A. Rockfall characterisation and structural protection—A review. Nat. Hazards Earth Syst. Sci. 2011, 11, 2617–2651. [Google Scholar]


| Category | No. of Experts | Profession | Specialisation | Recruitment Process | Evaluation Process for Pair-Wise Comparison |
|---|---|---|---|---|---|
| Experts | 13 | Seismologist | Experts in the hazard and risk assessment, seismic study, monitoring, Multi-criteria decision making, mapping, Geographic Information system (GIS), Artificial intelligence |
|
|
| Researchers | 9 | Geologist, hydrologist, GIS analyst, soil physicist, geotechnical researcher | Researcher on natural hazards using GIS and remote sensing |
|
| Factors | Multiple R2 | VIF |
|---|---|---|
| Altitude | 0.663 | 2.967 |
| Slope | 0.678 | 3.106 |
| Aspect | 0.327 | 1.486 |
| Curvature | 0.203 | 1.255 |
| Topographic Roughness Index (TRI) | 0.428 | 1.748 |
| Stream Power Index (SPI) | 0.621 | 2.639 |
| Sediment Transport Index (STI) | 0.694 | 3.268 |
| Topographic Wetness Index (TWI) | 0.329 | 1.490 |
| Geology | 0.407 | 1.686 |
| Vegetation density | 0.465 | 1.869 |
| Rainfall | 0.261 | 1.353 |
| Land use | 0.481 | 1.927 |
| Distance to faults | 0.648 | 2.841 |
| Distance to road | 0.421 | 1.727 |
| Distance to stream | 0.329 | 1.490 |
| Model | Training Accuracy | Testing Accuracy | Training Area Under Curve (AUC) | Testing Area Under Curve (AUC) | Cross-Validation Area Under Curve (CV-AUC) |
|---|---|---|---|---|---|
| Logistic Regression (LR) | 0.613 | 0.597 | 0.624 | 0.614 | 0.618 |
| Random Forest (RF) | 0.797 | 0.814 | 0.847 | 0.824 | 0.817 |
| Artificial Neural Network (ANN) | 0.774 | 0.750 | 0.787 | 0.808 | 0.757 |
| Support Vector Machine (SVM) | 0.629 | 0.608 | 0.639 | 0.649 | 0.609 |
| K-nearest Neighbor (KNN) | 0.736 | 0.712 | 0.752 | 0.777 | 0.752 |
| LR-RF | 0.857 | 0.835 | 0.872 | 0.859 | 0.810 |
| LR-ANN | 0.795 | 0.752 | 0.751 | 0.772 | 0.721 |
| LR-SVM | 0.708 | 0.705 | 0.736 | 0.757 | 0.690 |
| LR-KNN | 0.725 | 0.753 | 0.754 | 0.774 | 0.735 |
| RF-ANN | 0.833 | 0.840 | 0.856 | 0.851 | 0.831 |
| RF-SVM | 0.802 | 0.811 | 0.850 | 0.830 | 0.820 |
| RF-KNN | 0.893 | 0.865 | 0.916 | 0.907 | 0.875 |
| ANN-SVM | 0.825 | 0.839 | 0.850 | 0.873 | 0.830 |
| ANN-KNN | 0.840 | 0.844 | 0.868 | 0.831 | 0.848 |
| SVM-KNN | 0.764 | 0.734 | 0.765 | 0.772 | 0.751 |
© 2020 by the authors. Licensee MDPI, Basel, Switzerland. This article is an open access article distributed under the terms and conditions of the Creative Commons Attribution (CC BY) license (http://creativecommons.org/licenses/by/4.0/).
Share and Cite
Fanos, A.M.; Pradhan, B.; Alamri, A.; Lee, C.-W. Machine Learning-Based and 3D Kinematic Models for Rockfall Hazard Assessment Using LiDAR Data and GIS. Remote Sens. 2020, 12, 1755. https://doi.org/10.3390/rs12111755
Fanos AM, Pradhan B, Alamri A, Lee C-W. Machine Learning-Based and 3D Kinematic Models for Rockfall Hazard Assessment Using LiDAR Data and GIS. Remote Sensing. 2020; 12(11):1755. https://doi.org/10.3390/rs12111755
Chicago/Turabian StyleFanos, Ali Mutar, Biswajeet Pradhan, Abdullah Alamri, and Chang-Wook Lee. 2020. "Machine Learning-Based and 3D Kinematic Models for Rockfall Hazard Assessment Using LiDAR Data and GIS" Remote Sensing 12, no. 11: 1755. https://doi.org/10.3390/rs12111755
APA StyleFanos, A. M., Pradhan, B., Alamri, A., & Lee, C.-W. (2020). Machine Learning-Based and 3D Kinematic Models for Rockfall Hazard Assessment Using LiDAR Data and GIS. Remote Sensing, 12(11), 1755. https://doi.org/10.3390/rs12111755