Article

Use of Fluorescence Sensing to Detect Nitrogen and Potassium Variability in Maize

1
Department of Soil and Crop Sciences, Colorado State University, Fort Collins, CO 80523-1170, USA
2
Agriculture and Agri-Food Canada, St-Jean-sur-Richelieu, QC J3B 3E6, Canada
*
Author to whom correspondence should be addressed.
Remote Sens. 2020, 12(11), 1752; https://doi.org/10.3390/rs12111752
Submission received: 4 May 2020 / Revised: 27 May 2020 / Accepted: 27 May 2020 / Published: 29 May 2020

Abstract

:
Real-time fluoro-sensing is a promising crop sensing technology to support variable-rate nutrient management for precision agricultural practices. The objective of this study was to evaluate the potential of fluoro-sensing to detect the variability of nitrogen (N) and potassium (K) in the crop canopy at the early growth stages of maize (before the V6 crop growth stage). This study was conducted under greenhouse conditions in pots filled with silica sand, and maize plants were supplied with modified Hoagland’s solution with different rates of N and K. Sensor readings were collected using a Multiplex®3 fluorescence sensor and analyzed using ANOVA (analysis of variance) to test differences in crop response to nutrient rates. Regression analysis was used to assess the ability of fluorescence sensor-based indices to estimate N and K in the crop canopy. The results of this study indicate that all fluorescence indices under consideration enabled the detection of N variability in the maize canopy prior to the V2 crop growth stage. The NBI_B (nitrogen balance index blue) index enabled N uptake detection (R2 = 0.99) as early as the V2 crop growth stage. However, the fluorescence indices failed to identify K deficiency, as the maize plants with K treatments showed little to no variability of this nutrient at early crop growth stages as measured by plant tissue analysis. The results present a tremendous opportunity to assess N uptake at early growth stages of maize for precision nitrogen application. We recommend using fluorescence sensor-based NBI_B or NBI_R (Nitrogen balance index red) for early detection of nitrogen uptake in maize for precision nitrogen management.

Graphical Abstract

1. Introduction

Precision farming and site-specific management assist growers in making precise management decisions for different cropping systems throughout the world [1]. One of the most essential tools used for precision crop management system is variable-rate technology, which consists of the application of specific inputs, such as nutrients, water, and pesticides, for specific soil and crop conditions [2]. Understanding the spatial and temporal variability that occurs within a field is a key factor when working with variable-rate application [3]. Although most commercial products of variable-rate applications are map-based and are derived from soil test, yield maps, and other spatial information, several real-time sensor systems for nitrogen management are also being marketed [4,5]. Using real-time crop sensing to accomplish variable-rate fertilizer applications has tremendous potential to reduce the fertilizer requirement and improve nutrient and cost efficiencies.
Not only is nitrogen a key input for any crop for maximizing yields and economic return, it is also the most limiting nutrient for crop production [6,7,8]. A mismatch between N supply and crop N requirement can potentially hamper crop growth or harm the environment when N is under or over applied, respectively [9]. Either situation may result in low N use efficiency (NUE), which may result in agronomic and economic loss. Too much N often leads to a greater risk of groundwater contamination as a result of NO3-N leaching [10,11,12]. Even though worldwide use of N is increasing, NUE is about 50 % for maize (Zea mays L.) and around 30% for agricultural crops in general [13,14,15,16,17].
Potassiumis another critical macronutrient in crop production. In North America, potassium has not been considered as a major maize yield-limiting nutrient (personal communication with Dr. Robert Miller). However, studies conducted by the International Plant Nutrition Institute (IPNI, [18]) reported a constant decrease of K in U.S. soils, especially in the Corn Belt where agriculture has been practiced intensively for decades. The IPNI [18] report also suggested that for the Corn Belt region and areas east of the Mississippi River, 50% or more of the sampled areas will likely require annual K application to prevent yield losses.
Biomass sampling is a destructive method that can provide accurate information about NUE and K uptake but it is time consuming and economically inefficient when large amounts of data are required to characterize the spatial variability of field crops [19]. In contrast, non-destructive sampling methods such as remote sensing techniques based on reflectance can generate large amounts of data at a relatively low cost. Since the optical properties of leaves are affected by leaf chlorophyll concentrations, reflectance measurements have been widely used to predict N variability and to a limited extent, K in plants. It has been documented that not only reflectance but also leaf transmittance and fluorescence are influenced by N and K deficiencies [20,21,22].
Reflectance for the purpose of crop sensing has been widely studied, and previous research has shown a good correlation of reflectance data with plant biomass and yield [23,24,25,26]. Most reflectance-based vegetation indices use a combination of wavebands. For example, the normalized difference vegetation index (NDVI) is a ratio based on near-infrared (NIR) and red [(NIR − red)/(NIR + red)] [27] wavebands. Commercially available reflectance sensors such as GreenSeeker TM (Trimble, Sunnyvale, USA) use an active light source to measure reflectance from crop canopies and an algorithm to determine N rates by comparing the reflectance to an N-rich strip within the field [4]. Both N and K are important nutrients that produce similar biotic stress symptoms in crop canopies. Early detection of the variability of these two important nutrients in crops and the ability to distinguish the different biotic stresses caused by the deficiency of the two nutrients could significantly benefit farmers and their crop production practices.
The timing of fertilizer application affects the final crop yield because crop production may decrease if crop conditions at early stages of growth are not satisfactory. Thus, farmers need to know the N status of the crop at early growth stages, which would allow them to apply appropriate N rates based on plant requirements and crop N deficiencies [28]. The NDVI has been reported to be one of the best indicators of N status in maize [24]. Commercial NDVI sensors such as GreenSeekerTM have been reported to provide reliable measurements between the V8 to V12 maize crop growth stages [29,30,31,32]. While such a finding is scientifically significant, most farmers complete their side-dress N application by or before the V6 crop growth stage to minimize tractor damage to plants and prior to plants starting to exhibit a nutrient deficiency. A new sensing device based on fluorescence has enabled the detection of N variability prior to the V5 crop growth stage [33].
Fluorescence sensors have been widely used for ecophysiological studies [34], but their application in precision agriculture is relatively new [11,22]. The Multiplex®3 (Force-A, Orsay, France) is a commercially available active sensor that acquires in situ fluorescence measurements of crop canopies. Active fluorescence measurements have been available for laboratory use, while mobile platforms are limited by both the power of the excitation energy source and the weakness of the fluorescence signal itself [35]. With the advent of more powerful light-emitting diodes (LED) and more sensitive optical sensors, fluorescence can be acquired in the field with more reliable outcomes. Similar to chlorophyll, leaf flavonoids are compounds related to the N content in plants [36] that can be detected in situ by a screening method called the ABC fluorescence method proposed and validated in laboratory spectroscopy studies [19,20,37,38,39]. This method uses epidermal flavonoids fluorescence that has an inverse relationship with the biomass N content. Cartelat et al. [40] reported that by combining epidermal flavonoid fluorescence with chlorophyll fluorescence (ChlF-Flav), it is possible to predict the N content in wheat. Different variations of this method led to the development of the nitrogen balance index (NBI), which has been reported to be a good predictor of N status in plants. Fluorescence sensing has been reported to be capable of detecting N deficiency among other stresses such as K deficiency [41,42,43,44] with varying degree of success in various crops. Thus, we believe that vegetation indices developed from fluorescence sensors could enable the detection of nitrogen and potassium uptake at early growth stages of maize to allow precision application of these nutrients.
The hypothesis of this study was that induced fluorescence acquired by the Multiplex® 3 fluorescence sensor (FORCE-A, Orsay, France) can be used to distinguish and predict N and K deficiencies in maize. The specific objectives were: (1) to investigate the relationship between induced fluorescence indices, plant growth, nitrogen content, nitrogen uptake, potassium content, and potassium uptake and (2) to verify if induced fluorescence may be used to accurately characterize N and K uptake in maize at early growth stages.

2. Materials and Methods

2.1. Study Site and Crop Management Scenario

This experiment was conducted in a greenhouse located in Fort Collins, Colorado, USA, (40°34′18.0″ N 105°04′52.3″ W) from the 26th October, 2012 to the 13th of December 2012. Plant pots with a volume of 11 liters (23 cm in diameter and 21 cm in height) were filled with 6 kg of silica sand. Ambient light was provided by 430 W high-intensity discharged lamps for 16 hours a day, and the temperature ranged from 25 °C to 20 °C (day/night) in the greenhouse. Prior to planting, 400 mL of water was applied per pot. After the sand was wet, each pot was planted with 5 seeds (variety Dekalb DKC45-79) in a cross pattern at 2 cm depth. Maize emergence was observed on the 2nd November 2012. Each pot had drainage holes, and as water drains easily in silica sand, a plastic saucer was placed beneath the pots to prevent any water drainage that could cause nutrient leaching. Pots were supplemented with daily irrigation of 80 mL, which did not result in leaching of nutrients as no water or leachates were observed during the course of this entire study.

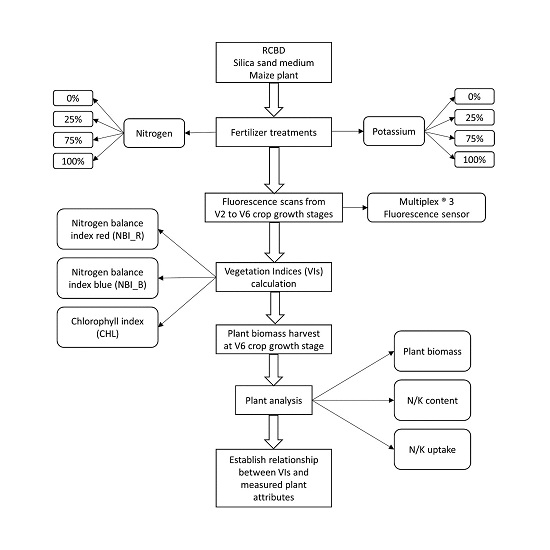
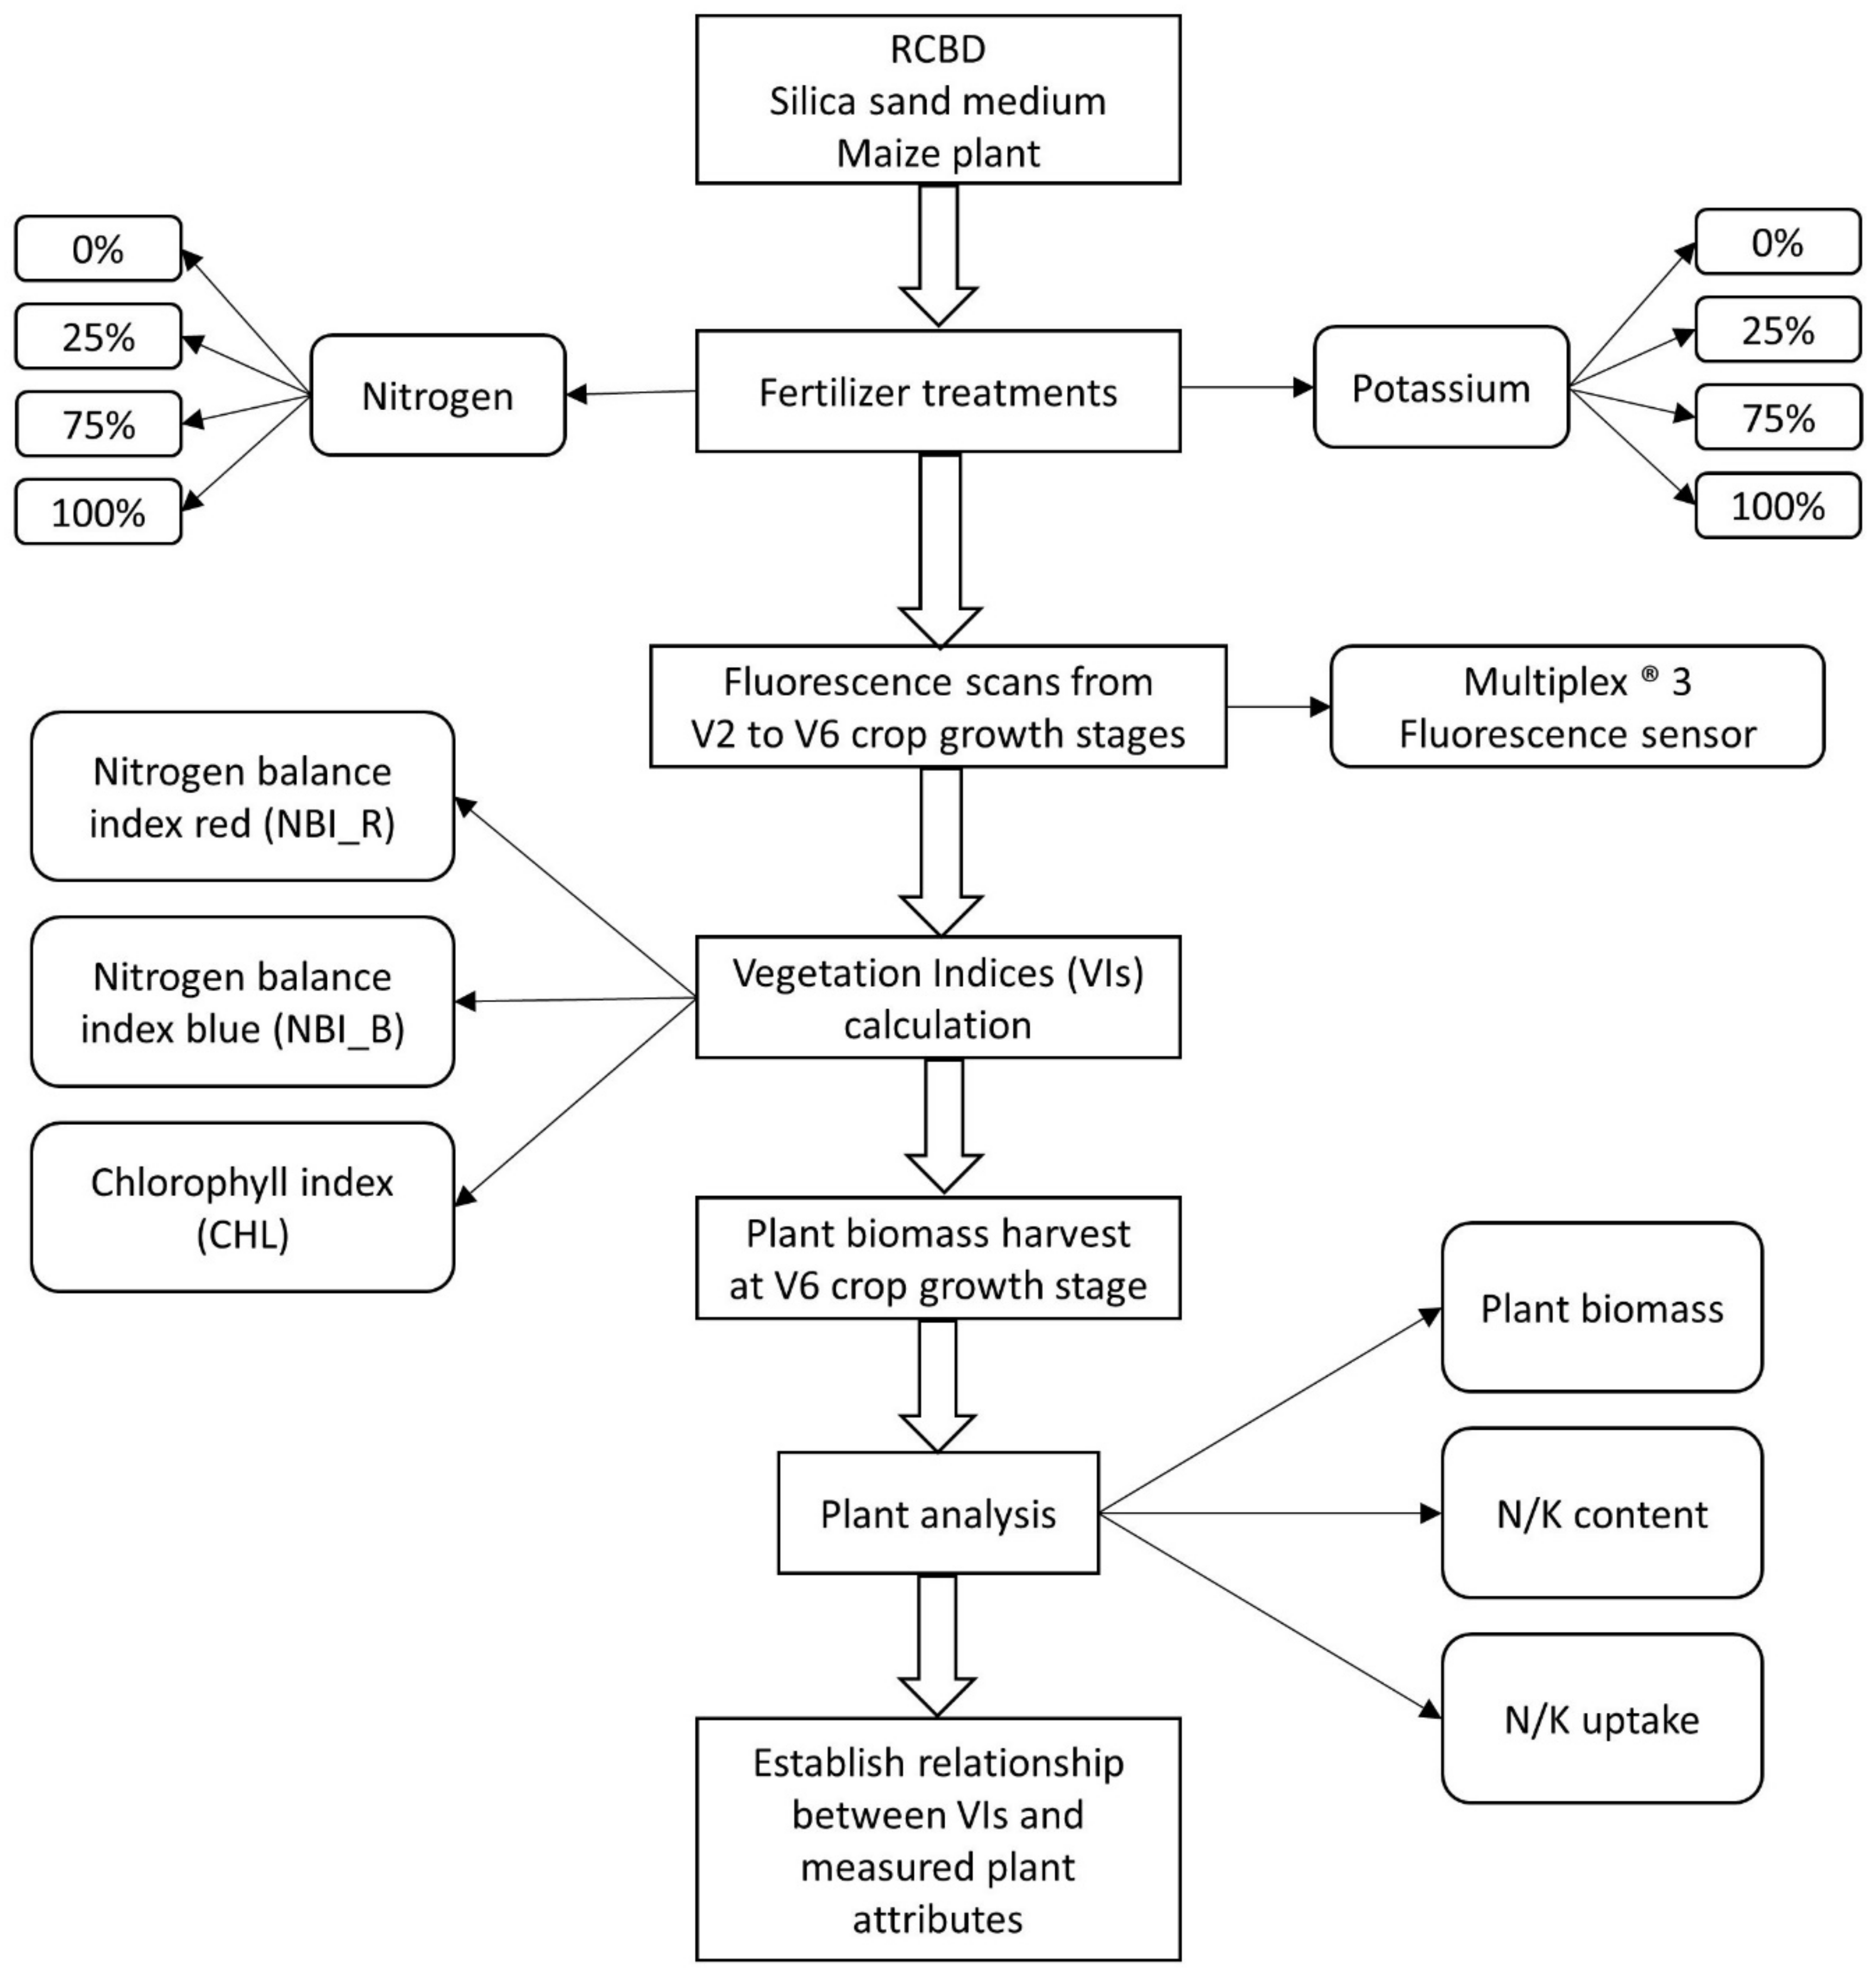
2.2. Experimental Setup

Two separate experiments were set up based on nutrient variability. The first experiment consisted of a randomized block design of four different N rates (0%, 25%, 50%, and 100% of recommended N in Hoagland’s solution) [45], with six replications. Hoagland’s solution was developed for hydroponic applications and it contains high concentrations of N and K. As our experiment was conducted in silica sand medium, proper nutrition for maize plants could be achieved using a complete nutrient solution such as Hoagland’s solution. Stock solutions for full-strength Hoagland’s solution were prepared as shown in the first column of Table 1. For example, 100% Hoagland’s solution was created by mixing 1 mL, 5 mL, 5 mL, 2 mL, 1 mL, and 1 mL of KH2PO4, KNO3, Ca(NO3)2, MgSO4, Minors, and Fe-EDTA stock solutions, respectively. The second experiment also consisted of a randomized block design of four different K rates (0%, 25%, 50%, and 100% of recommended K in Hoagland’s solution), also with six replications. The N and K treatment with 100% N and K rates was the same for the two experiments and corresponded to the original Hoagland’s solution. Other N and K treatments (0%, 25%, and 50%) were established by modifying Hoagland’s solution for each nutrient. Nutrient modifications for all the treatments and the original Hoagland solution are shown in Table 1.

2.3. Fluorescence Sensor and Indices

The Mutiplex®3 multi-parameter fluorescence sensor has four excitation channels: UV (around 375 nm), blue (around 470 nm), green (around 515 nm), and red (around 625 nm). Excitation light pulses (20 μs per flash) are delivered by high-power light emitting diode arrays located around the detectors pointing in the direction of the sensed area. The three detection channels (filters) are yellow (590 nm ± 40 nm; YF), red (678 nm ± 22 nm; RF), and far-red (750 nm ± 65 nm; FRF). The detectors consist of three silicon photodiodes (20 mm × 20 mm), each with an optical band pass filter allowing only yellow, red or far-red light to reach the photodiode. The flash induces emission of fluorescence, and the filters allow selection of the wavebands of interest. Firmware synchronizes the light pulses and the detectors in order to acquire each combination (12 in total) of excitation wavebands and detection channels for up to 476 readings of all parameters per second. The field-of-view is about 10 cm diameter (FORCE-A, Orsay, France). More details about the sensor hardware can be found in Cerovic et al. [46]. In this study, three indices were used based on ratios of band combinations. These indices were chosen based on previous studies conducted in a greenhouse [33] and on a spectroscopy study [39]. The equations for each index along with its description are as follows.
Nitrogen   balance   index   ( red )   N B I R = 1 n i = 1 n F R F u v i F R F r i
Nitrogen   balance   index   ( blue )   N B I B = 1 n i = 1 n F R F u v i R F b i
Chlorophyll   index   ( red )   C H L = 1 n i = 1 n F R F r i R F r i
where the induction waveband is shown as subscripts. UV = ultraviolet; G = green; R = red; B = blue.

2.4. Fluorescence Data Acquisition

The Multiplex®3 sensor acquires data at 70 Hz; i.e., 70 cycles per second of induction and detection (12 different readings from four light sources and three unique filters for each cycle). The plants were scanned at 10-cm height above the plant’s uppermost leaves. To ensure that the entire crop canopy was sensed and not just one specific leaf or plant, slow circular movements of the sensor were performed across the canopy in each pot during fluorescence data acquisition. More details on fluorescence data acquisition can be found in Longchamps and Khosla [33] and Cerovic et al [46]. Each data acquisition period lasted approximately four seconds, which resulted in approximately 250 fluorescence readings. Data were acquired three times per week, between 11:00 and 13:00 hrs. The first scans were collected on the 10th DAE (Day After Emergence) at V2 (2-leaf crop growth stage), and the last set of readings was acquired on the 36th DAE at V6 (6-leaf crop growth stage). The maize crop vegetative growth stages are designated by “V” followed by numbers starting from 1, where the numbers indicate the collar of leaf that is completely visible on the plant. For example, V2 indicates that the collar of the first true leaf is visible, and V4 indicates the collar of the fourth leaf is visible.

2.5. Biomass Sampling and Tissue Analysis

Biomass samples were collected on the 36th DAE, at V6 (6-leaf crop growth stage). Samples consisted of three plants from each pot, and two plants were left in the pots to continue sensing until the V8 crop growth stage. Biomass samples were air dried, weighed, and sent for tissue analysis to a commercial laboratory, Harris Laboratory, Lincoln, NE. The total N content (%) was analyzed by the Kjeldahl digestion method (wet digestion in H2SO4-H2O2) and total K content (%) by Nitric Acid/Hydrogen Peroxide digestion (Association of Official Analytical Chemists [47].

2.6. Statistical Analysis

The N uptake, expressed as the percentage of N in the plant tissue (N content) multiplied by the dried biomass, was used to indicate N variability for plants in the N experiment. K uptake was estimated in a similar manner. Analysis of variance (ANOVA) and Tukey’s HSD test (α = 0.05) were used to test significant differences among treatments in each experiment. For the N experiment, regression analysis between each of the three fluorescence indices (independent variables) and N uptake (dependent variable) was performed for the 12 days of data acquisition at five different crop growth stages (i.e., 2-leaf to 6-leaf crop growth stages), and the coefficient of determination (R2) was used to identify the best fluorescence index to detect the N status The errors from regression analysis were normally distributed. Similar analysis was conducted for K uptake. The statistical software R (R Core Team, Vienna, Austria) was used for all statistical analyses. The functions used for those tests were “aov”, “TukeyHSD”, and “lm” [48]. A flow chart of the methodology is illustrated in Figure 1.

3. Results

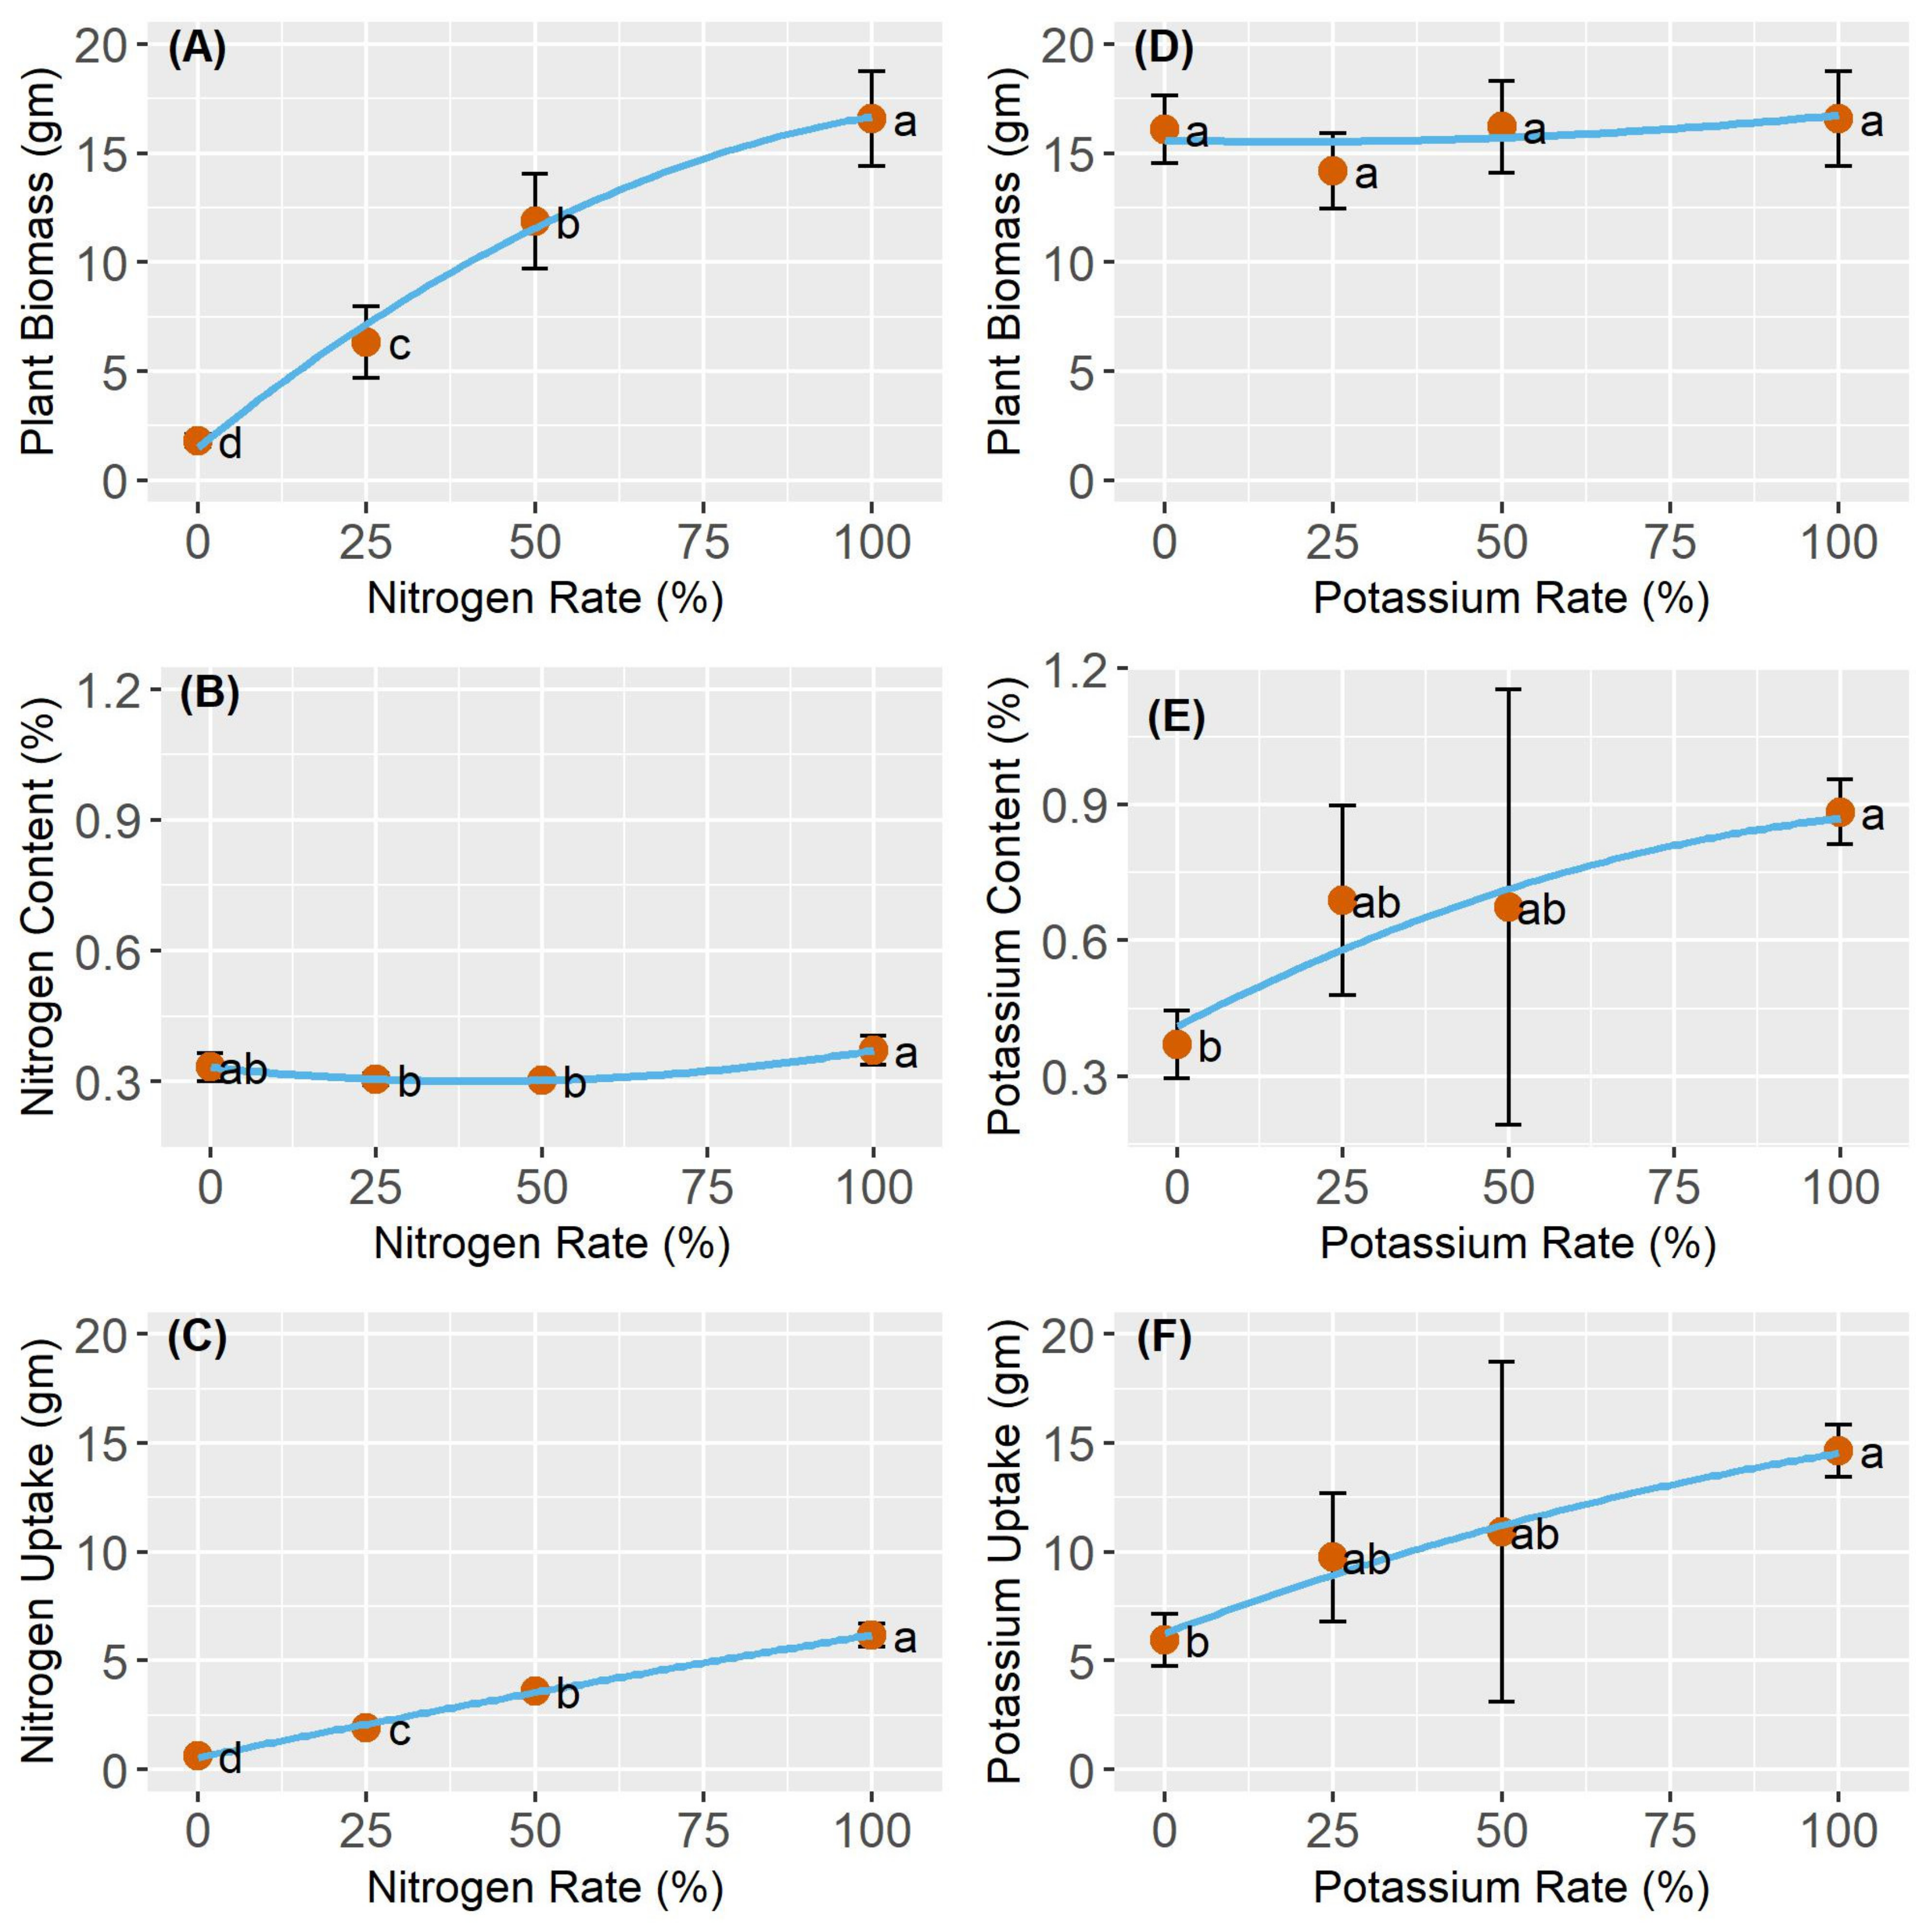
3.1. Biomass and Nitrogen Variability across Treatments in the Nitrogen Experiment

As anticipated, the N rate treatments generated variability in maize aboveground dry biomass, which ranged from an average of 3 grams per pot for 0% N to 16 grams per pot for 100% N. As expected, dried maize biomass weight was significantly different (α = 0.05) across all N treatments. At the V6 crop growth stage, there was a small variability in the N content, ranging from 0.22 to 0.40% of N in the dried plant tissue. Different N rates did not have a significant (α = 0.05) effect on the N content; however, they had a significant effect on nitrogen uptake. The relationships between N rates and N uptake, N content or dry biomass are illustrated in Figure 2.

3.2. Biomass and Potassium Variability across Treatments in the Potassium Experiment

At the V6 crop growth stage, the dried biomass values ranged from 14 to 16 grams per plot (Figure 2). Different rates of potassium at the V6 crop growth stage did not have a significant effect on dried biomass, resulting in weights similar to Hoagland’s solution (100% treatment). On the other hand, the K treatments generated variability in the K content, but only with the extreme treatments (i.e., 0% and 100% treatments). Confidence intervals for the 25% and 50% K treatments were wide, resulting in a low coefficient of determination (R2 = 0.28). Similar results were observed for K uptake, resulting in a significant difference for the 0%, 25%, and 100% K treatments and ranging from an average of 6 milligrams of K per pot for treatment 0% to 15 grams of K per pot for treatment 100%. Although K uptake significantly differed among three of the four treatments, coefficients of determination were low but slightly higher than those for the K content (R2 = 0.35). This can possibly be explained by the wide confidence interval of the 25% and 50% treatments (Figure 2).

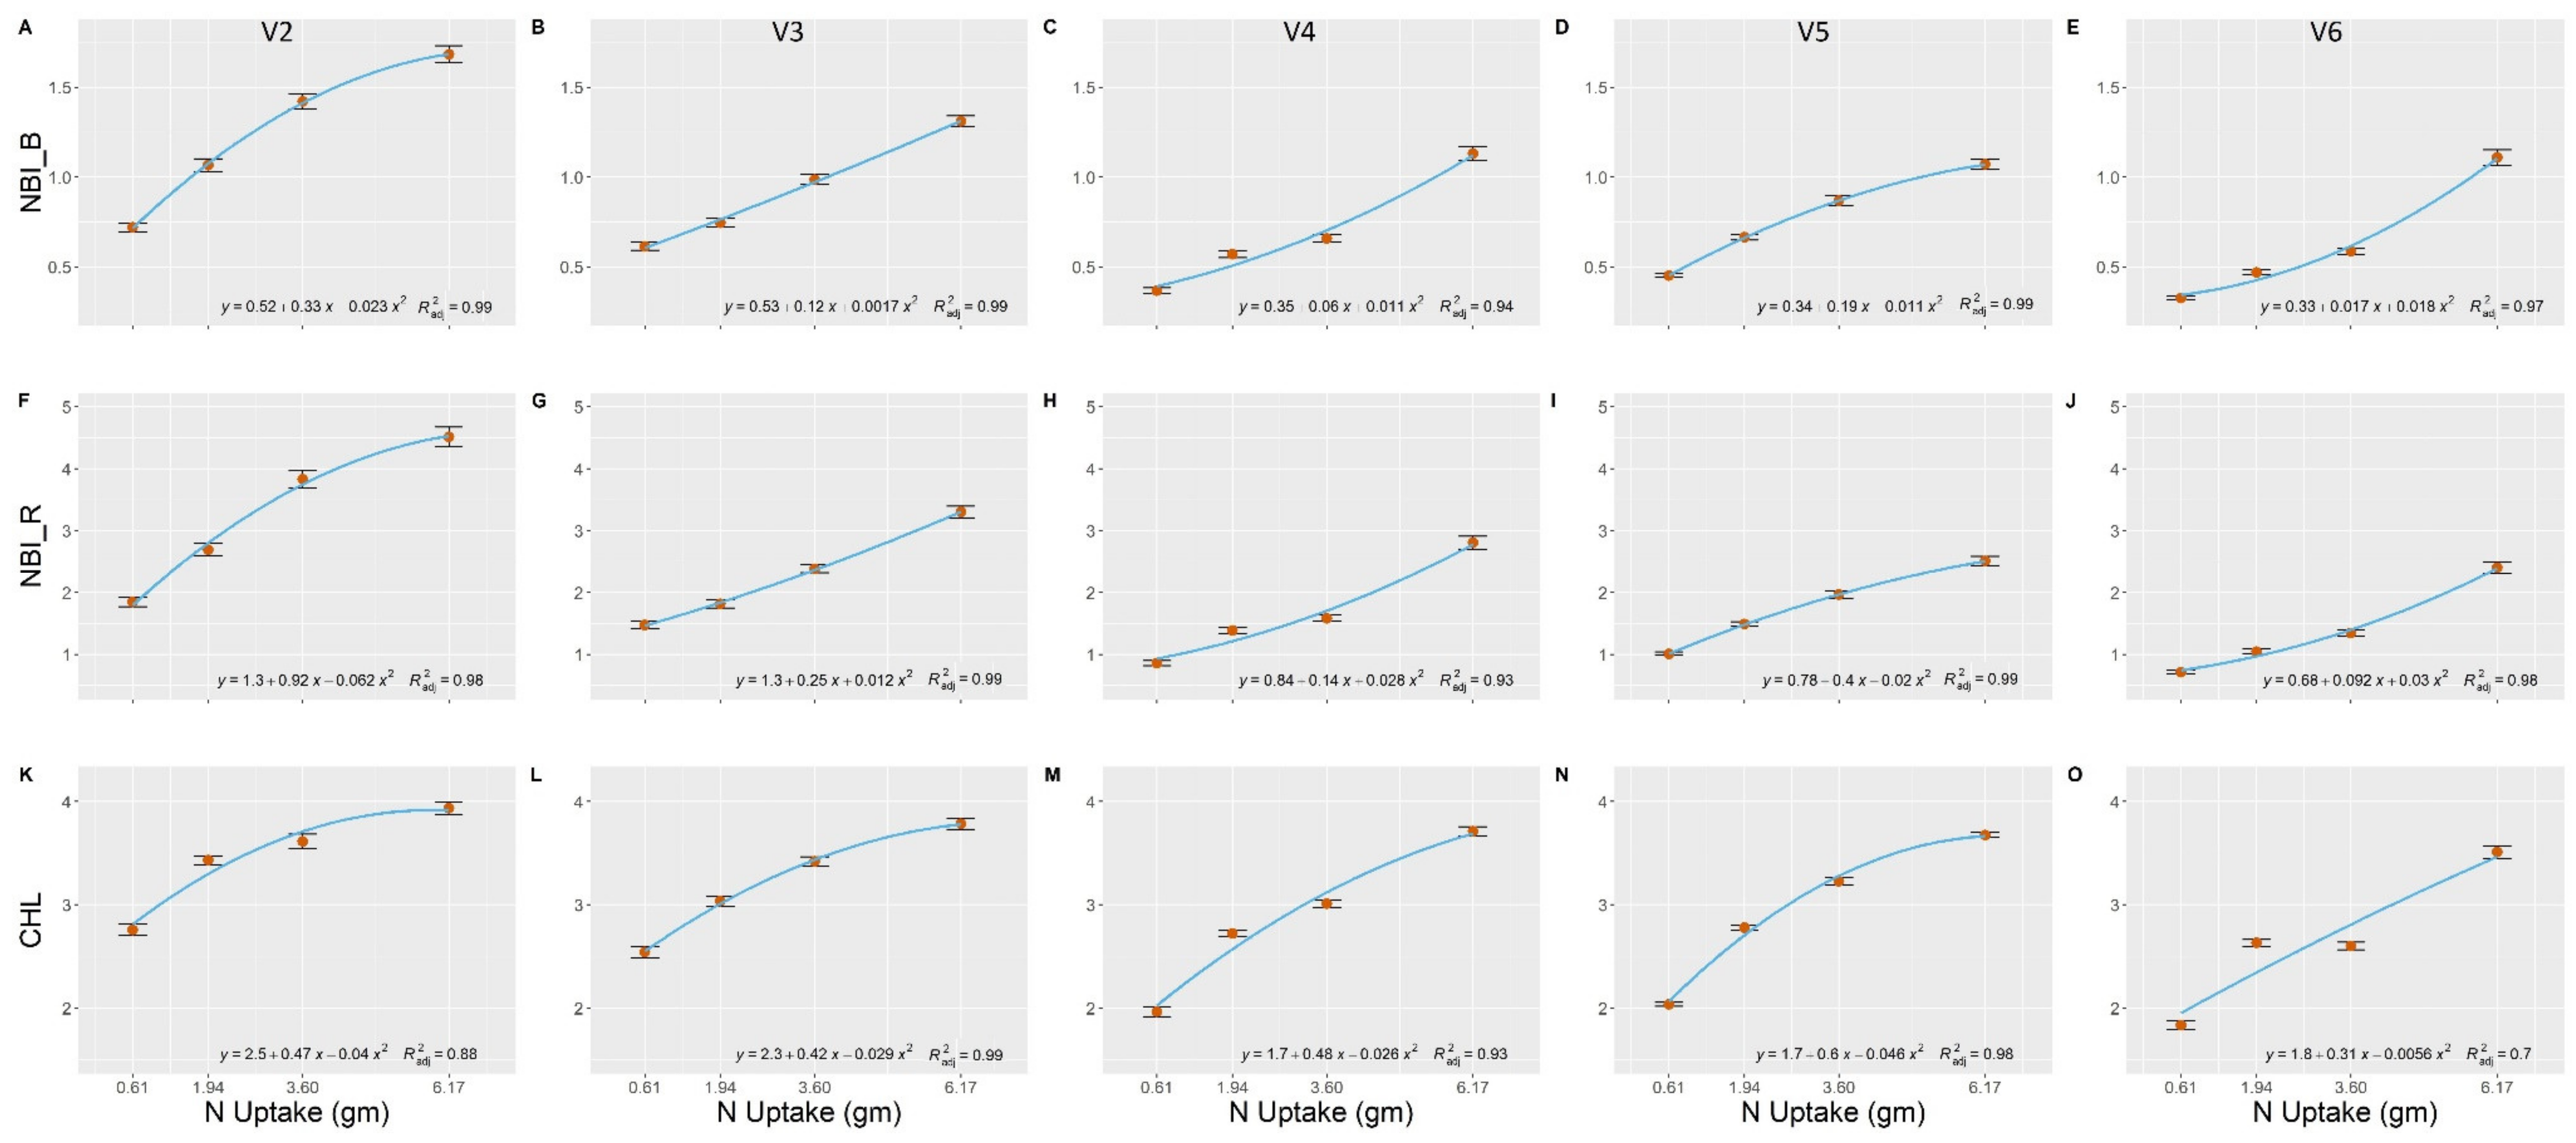
3.3. Characterizing Nitrogen Uptake using Fluoro-Sensing

The three fluorescence indices (Equation (1)–(3)) in this study successfully estimated N uptake at the V2 crop growth stage. All three indices (NBI_B, NBI_R, and CHL) consistently enabled detection of N variability in the maize canopy throughout the crop growth stages. Regression analysis was used to model the relationship between N uptake and the three indices for the four different crop growth stages (Figure 3).
The nitrogen balance index induced by red light (NBI_R) performed best throughout all the reading dates when compared to the six other indices. Among the V2 to V6 crop growth stages, the lowest coefficient of determination (R2) for the relationship between N uptake and NBI_R was 0.93, with an average value of 0.94 across all reading dates. The nitrogen balance index induced by blue light (NBI_B) provided similar detection ability for N uptake in maize at early crop growth stages. For all readings between the V2 and V6 crop growth stages, the average coefficient of determination (R2) for the relationship between the index and N uptake was 0.96, with the lowest score at the V4 stage (R2 = 0.94), indicating a tremendous potential of both indices to predict maize N uptake early in the crop growing season.
The Chlorophyll fluorescence index (CHL) also efficiently enabled the detection of N uptake for maize at early stages. The CHL index generated the lowest coefficient of determination (R2 = 0.7) at the V6 crop growth stage. With an exception of this reading date, all other readings had a strong relationship with N uptake. The R2 for the relationship between CHL and N uptake ranged from 0.88 to 0.99 for the other crop growth stages.

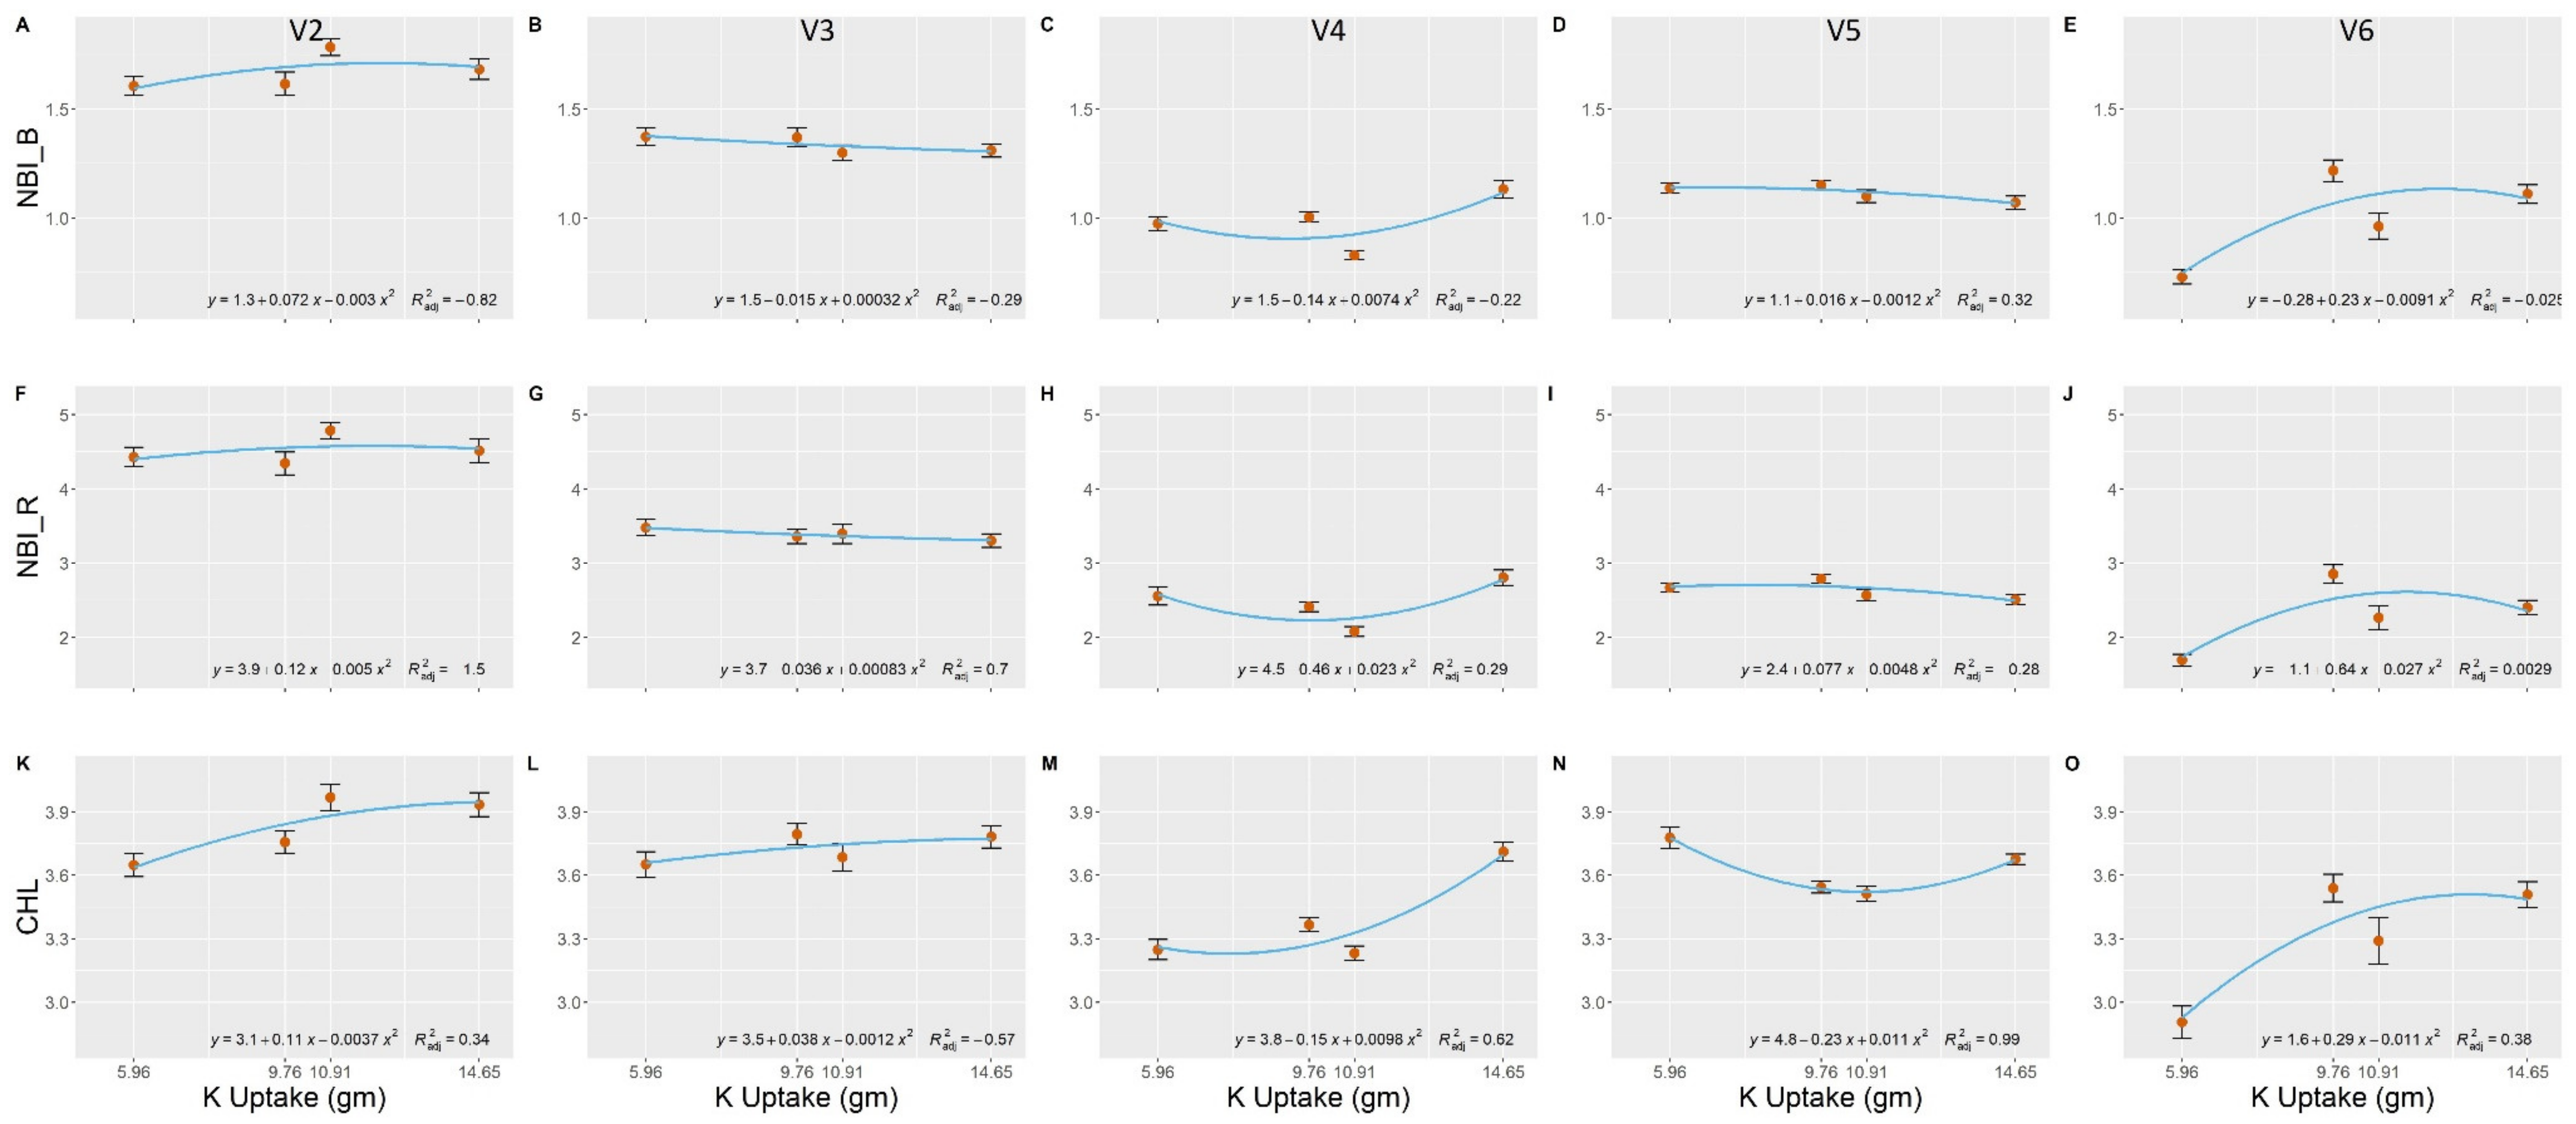
3.4. Characterizing Potassium Uptake using Fluoro-Sensing

In the K experiment, the variability of all three indices was low, which can be explained by the low variability induced by the K treatments. Even the 0% K treatment did not create considerably lower amounts of K uptake at 28 DAE. The NBI_B index ranged from 0.4 to 1.4 for the N uptake while for the K uptake it ranged from 1.2 to 1.4. The NBI_R index ranged from 0.7 to 3.2 for the N uptake while for the K uptake it ranged from 1.9 to 3.2. The CHL index ranged from 1.7 to 3.8 for the N uptake while for the K uptake it ranged from 3.5 to 4.0. A comparison of the variability in index values between the two experiments indicated that the N experiment generated higher variability in the fluorescence readings.
Estimation of K uptake by the nitrogen balance index induced by blue light (NBI_B) had low coefficients of determination (R2) for all reading dates. At 28 DAE (V4 crop growth stage), the relationship between NBI_B and K uptake had the highest R2 of 0.17 (Figure 4). This reading was just before the second fertilization and possibly when K uptake differences among the treatments were the most pronounced. The NBI_B readings ranged from 0.8 to 1.4, with small variation between treatments. Figure 3 shows that other treatment dates had notably higher NBI_B values than acquired at the V4 crop growth stage, which indicates that all treatments were sufficiently supplied with potassium. The NBI_B values acquired from plants treated with different levels of K were similar to NBI_B values acquired from plants treated with full Hoagland’s solution (100% treatment).
The NBI_R had a similar performance as NBI_B for K uptake prediction. The best coefficient of determination (R2 = 0.34) between NBI_R and K uptake was obtained on the 28th DAE (V4 crop growth stage; Figure 3). Variability in NBI_R readings was low, ranging from 2.0 to 3.5. Readings acquired at the V4 crop growth stage had the best results, but coefficients of determination were still low (R2 = 0.31) for detecting K variability at early crop growth stages.
The chlorophyll fluorescence index (CHL) values varied from 3.5 to 4.0. The relationship between CHL and K uptake was consistently weak or non-existent for all measurement dates except the V4 crop growth stage (R2 = 0.18).

4. Discussion

In the N experiment, at the V6 crop growth stage, different rates of N had a significant effect on aboveground biomass and N uptake, but there were no significant differences in the N content (Figure 2). Furthermore, N uptake was highly affected by N rates (Figure 2), demonstrating the efficiency of the treatments imposed on the plants to create N status variability and thus creating appropriate conditions for verifying fluorescence measurement-based indices’ response to N uptake and crop growth. The indifferent effect of different rates of N on the N content in plants also implies that prior to the V6 crop growth stage, the growth of maize had already been affected by N deficiency. However, in the K experiment, different rates of supplied K were not able to create substantial variability in terms of plant biomass, K content, and K uptake (Figure 2).
In our study, as expected, dried biomass values indicated that maize growth up to the V6 crop growth stage was more influenced by the N content than the K content. Variability caused by N treatments generated a wide range of aboveground biomasses, while K treatments and Hoagland’s solution (100% treatment) generated similar biomass values. The influence of macronutrients on the yield of maize and other crops is well studied, and nitrogen is the most influential nutrient. The effect of potassium on crop biomass is relatively small compared with nitrogen [49,50,51].
For the nutrient content measurements, the K experiment generated a higher variability, ranging from an average of 0.4 to 0.8 grams of K per pot, and treatments were significantly different from each other. The N content varied from 0.32 to 0.37 grams of N per pot (Figure 2). In the N experiment, the N uptake of all the treatments was significantly different (α = 0.05) from each other, while for the K experiment, only treatments 0%, 25%, and 100% were different. It appeared that at the V6 crop growth stage, different N rates had a greater effect on N uptake than the K rates affected the K uptake. It was observed that the N uptake variability resulted from biomass weight, showing plant growth deficiency, whereas K uptake variability resulted from the plant K content. Benders et al. [6] reported that by the V6 crop growth stage, N uptake accumulation represents around 20% of the total N requirement for the entire life-cycle of the maize plant and only 10% of the total K requirement.
Fluorescence-based indices (Equation (1)–(3)) were highly effective for characterizing nitrogen uptake at early growth stages. In general, NBI_B and NBI_R indices had similar performance with slightly higher R2 than that of the CHL index. These findings are consistent with Longchamps and Khosla [33], who also detected N variability prior to V4 between the zero and the full N rate treatments. They also observed that NBI_B could detect variability of all treatments prior to the V5 crop growth stage of maize. In this current study, a significant improvement was observed in distinguishing different N rates at earlier crop growth stages compared to the results reported by Longchamps and Khosla [33]. This might be attributed to (i) a higher level of control and the precision with which the current study was conducted, i.e., precision in the amounts of nutrients applied, and (ii) silica sand-based sterile systems for the growth of maize plants with no residual nutrients compared to field soil used in pots by Laongchamps and Khosla [33].
NBI indices performed better than the CHL index. Both NBI indices are induced by UV light, while CHL is only induced by red light. Past studies on grapevines have shown that plants grown under greenhouse conditions when transferred to the field had reduced chlorophyll fluorescence induced by UV-A and UV-B light over time, whereas chlorophyll fluorescence induced by blue-green light was not affected by the environmental change [52]. In the field, those plants created a protection against UV radiation that can also screen out the UV emission from the sensor [52]. Theoretically, this can be a concern for field trials when analyzing indices induced by UV light, such as NBI_R and NBI_B, but not as much as the CHL index that is induced by visible wavebands.
The K experiment generated fluorescence readings in the same range as readings acquired from plants treated with full Hoagland’s solution. As we could not create a condition with a low amount of K uptake at the early maize growth stage, we cannot conclude that those indices are good estimators to detect K uptake using the Multiplex fluorescence sensor. The indices studied in this research have been cited to show a good correlation with the chlorophyll content and other molecules that contain N [39], while for other nutrient deficiencies, there is no specific index. This could be the reason that the indices used in this study were not able to detect potassium variability among the treatments.

5. Conclusions

The chlorophyll fluorescence sensor enabled the detection of N uptake variability in maize under greenhouse conditions at the V2 crop growth stage. At the V2 crop growth stage, NBI_B and NBI_R produced R2 values of 0.99 and 0.98, respectively. This presents a tremendous opportunity to detect nitrogen uptake in early crop growth stages, allowing farmers to judiciously apply nitrogen to improve maize productivity. NBI_B and NBI_R were accurate in characterizing the different N uptake rates throughout the crop growth stages (from V2 to V6). Even though different rates of K generated K uptake variability, the indices used were not able to detect that variability in maize at any crop growth stage. Different indices that are more specific for potassium deficiency might be able to characterize K uptake in maize at early crop growth stages. Also, it is possible to conclude that K deficiency might not interfere with N uptake characterization by the indices at early crop growth stages, as the indices showed low variability across K treatments. The findings of this study are promising for field studies, as this sensor was able to detect N variability in maize at earlier crop growth stages than any other commercially available remote sensor reported in the literature. Testing the applicability of fluorescence sensors on-the-go, for mobile measurements in situ, can potentially make this sensor an excellent tool for maize precision N fertilization management. We recommend further studies (i) in a greenhouse setting with smaller differences in nitrogen rates to capture and characterize a complete picture of the relationship between fluorescence indices and N uptake in maize and (ii) in field settings to facilitate real-time precision nitrogen fertilization at early crop growth stages of maize.

Author Contributions

R.K., who was the first author´s advisor, designed the study, provided supervision for research, and input for the paper. L.L. was responsible for setting up the study, provided training, and outline the methodology, statistical analysis, and laboratory analyses. R.S. performed statistical analyses and wrote the paper. S.D. contributed by reviewing, editing, analysis reviewing, and additions to the text. All authors have read and agreed to the published version of the manuscript.

Funding

Funding for this research was provided by Colorado State University Agricultural Experiment Station; Cooperative Extension, Force-A, and multiple on-going research support funding.

Conflicts of Interest

The authors declare no conflict of interest. The funding sponsors had no role in the design of the study, in the collection, analyses, or interpretation of data, in the writing of the manuscript, and in the decision to publish the results.

References

  1. Koch, B.; Khosla, R.; Frasier, W.M.; Westfall, D.G.; Inman, D. Economic feasibility of variable-rate nitrogen application utilizing site-specific management zones. Agron. J. 2004, 96, 1572–1580. [Google Scholar] [CrossRef] [Green Version]
  2. Moran, M.S.; Inoue, Y.; Barnes, E.M. Opportunities and limitations for image-based remote sensing in precision crop management. Remote Sens. Environ. 1997, 61, 319–346. [Google Scholar] [CrossRef]
  3. Cordero, E.; Longchamps, L.; Khosla, R.; Sacco, D. Spatial management strategies for nitrogen in maize production based on soil and crop data. Sci. Total Environ. 2019, 697. [Google Scholar] [CrossRef] [PubMed]
  4. Lowenberg-DeBoer, J. The management time economics of on-the-go sensing for nitrogen application. SSMC Newsl. 2004, 5, 1–5. [Google Scholar]
  5. Yao, Y.; Miao, Y.; Cao, Q.; Wang, H.; Gnyp, M.L.; Bareth, G.; Khosla, R.; Yang, W.; Liu, F.; Liu, C. In-season estimation of rice nitrogen status with an active crop canopy sensor. IEEE J. Sel. Top. Appl. Earth Obs. Remote Sens. 2014, 7, 4403–4413. [Google Scholar]
  6. Bender, R.R.; Haegele, J.W.; Ruffo, M.L.; Below, F.E. Modern corn hybrids’ nutrient uptake patterns. Better Crop. 2013, 97, 7–10. [Google Scholar]
  7. Fageria, N.K.; Baligar, V.C. Enhancing nitrogen use efficiency in crop plants. Adv. Agron. 2005, 88, 97–185. [Google Scholar] [CrossRef]
  8. Khosla, R.; Fleming, K.; Delgado, J.A.; Shaver, T.M.; Westfall, D.G. Use of site-specific management zones to improve nitrogen management for precision agriculture. J. Soil Water Conserv. 2002, 57, 513–518. [Google Scholar]
  9. Khosla, R.; Shaver, T. Zoning in on nitrogen needs. Colo. State Univ. Agron. Newsl. 2001, 21, 24–26. [Google Scholar]
  10. Carpenter, S.R.; Caraco, N.F.; Correll, D.L.; Howarth, R.W.; Sharpley, A.N.; Smith, V.H. Nonpoint pollution of surface waters with phosphorus and nitrogen. Ecol. Appl. 1998, 8, 559–568. [Google Scholar] [CrossRef]
  11. Huang, J.; Xu, C.-C.; Ridoutt, B.G.; Wang, X.-C.; Ren, P.-A. Nitrogen and phosphorus losses and eutrophication potential associated with fertilizer application to cropland in China. J. Clean. Prod. 2017, 159, 171–179. [Google Scholar]
  12. Sun, M.; Huo, Z.; Zheng, Y.; Dai, X.; Feng, S.; Mao, X. Quantifying long-term responses of crop yield and nitrate leaching in an intensive farmland using agro-eco-environmental model. Sci. Total Environ. 2018, 613, 1003–1012. [Google Scholar] [CrossRef] [PubMed]
  13. Baligar, V.; Fageria, N.; He, Z. Nutrient use efficiency in plants. Commun. Soil Sci. Plan. 2001, 32, 921–950. [Google Scholar] [CrossRef]
  14. Carlson, K.M.; Gerber, J.S.; Mueller, N.D.; Herrero, M.; MacDonald, G.K.; Brauman, K.A.; Havlik, P.; O’Connell, C.S.; Johnson, J.A.; Saatchi, S. Greenhouse gas emissions intensity of global croplands. Nat. Clim. Chang. 2017, 7, 63–68. [Google Scholar]
  15. Cassman, K.G.; Dobermann, A.; Walters, D.T. Agroecosystems, nitrogen-use efficiency, and nitrogen management. AMBIO 2002, 31, 132–140. [Google Scholar] [CrossRef]
  16. Gupta, M.; Khosla, R. Precision nitrogen management and global nitrogen use efficiency. In Proceedings of the 11th International Conference on Precision Agriculture, Indianapolis, IN, USA, 15–18 July 2015. [Google Scholar]
  17. Hawkesford, M.J.; Griffiths, S. Exploiting genetic variation in nitrogen use efficiency for cereal crop improvement. Curr. Opin. Plant Biol. 2019, 49, 35–42. [Google Scholar] [CrossRef]
  18. Fixen, P.E.; Williams, R.; Rund, Q.B. NUGIS: A Nutrient Use Geographic Information System for the US; International Plant Nutrition Institute: Brookings, SD, USA, 2012. [Google Scholar]
  19. Agati, G.; Foschi, L.; Grossi, N.; Guglielminetti, L.; Cerovic, Z.G.; Volterrani, M. Fluorescence-based versus reflectance proximal sensing of nitrogen content in Paspalum vaginatum and Zoysia matrella turfgrasses. Eur. J. Agron. 2013, 45, 39–51. [Google Scholar] [CrossRef]
  20. Bilger, W.; Veit, M.; Schreiber, L.; Schreiber, U. Measurement of leaf epidermal transmittance of UV radiation by chlorophyll fluorescence. Physiol. Plant. 1997, 101, 754–763. [Google Scholar] [CrossRef]
  21. Blackmer, T.M.; Schepers, J.S.; Varvel, G.E.; Walter-Shea, E.A. Nitrogen deficiency detection using reflected shortwave radiation from irrigated corn canopies. Agron. J. 1996, 88, 1–5. [Google Scholar] [CrossRef] [Green Version]
  22. Tremblay, N.; Wang, Z.; Cerovic, Z.G. Sensing crop nitrogen status with fluorescence indicators. A review. Agron. Sustain. Dev. 2012, 32, 451–464. [Google Scholar]
  23. Herrmann, I.; Bdolach, E.; Montekyo, Y.; Rachmilevitch, S.; Townsend, P.A.; Karnieli, A. Assessment of maize yield and phenology by drone-mounted superspectral camera. Precis. Agric. 2020, 21, 51–76. [Google Scholar] [CrossRef]
  24. Ma, B.; Morrison, M.J.; Dwyer, L.M. Canopy light reflectance and field greenness to assess nitrogen fertilization and yield of maize. Agron. J. 1996, 88, 915–920. [Google Scholar] [CrossRef]
  25. Naser, M.A.; Khosla, R.; Longchamps, L.; Dahal, S. Using NDVI to Differentiate Wheat Genotypes Productivity Under Dryland and Irrigated Conditions. Remote Sens. 2020, 12, 824. [Google Scholar] [CrossRef] [Green Version]
  26. Solari, F.; Shanahan, J.; Ferguson, R.; Schepers, J.; Gitelson, A. Active sensor reflectance measurements of corn nitrogen status and yield potential. Agron. J. 2008, 100, 571–579. [Google Scholar] [CrossRef] [Green Version]
  27. Rouse, J.; Haas, R.; Schell, J.; Deering, D. Monitoring vegetation systems in the Great Plains with ERTS. NASA Spec. Publ. 1974, 351, 309. [Google Scholar]
  28. Haboudane, D.; Miller, J.; Tremblay, N.; Zarco-Tejada, P.; Dextraze, L.; Viau, A. Heterogeneity of CASI-estimated leaf chlorophyll in corn: Assessment and comparison with ground truth from L’Acadie GEOIDE experimental site. In Proceedings of the 23rd Canadian Symposium on Remote Sensing and 10th Congress of the Quebec Remote Sensing Association, Université Laval University Sainte-Foy, Quebec, QC, Canada, 21–24 August 2001. [Google Scholar]
  29. Martin-Neto, L.; Milori, D.; Da Silva, W.; Simões, M. EPR, FT-IR, Raman, UV–visible absorption, and fluorescence spectroscopies in studies of NOM. In Biophysico-Chemical Processes Involving Natural Nonliving Organic Matter in Environmental Systems Biophys; John Wiley & Sons: Hoboken, NJ, USA, 2009; pp. 651–727. [Google Scholar]
  30. Shaver, T.; Khosla, R.; Westfall, D. Evaluation of two ground-based active crop canopy sensors in maize: Growth stage, row spacing, and sensor movement speed. Soil Sci. Soc. Am. J. 2010, 74, 2101–2108. [Google Scholar] [CrossRef]
  31. Shaver, T.; Khosla, R.; Westfall, D. Evaluation of two crop canopy sensors for nitrogen variability determination in irrigated maize. Precis. Agric. 2011, 12, 892–904. [Google Scholar] [CrossRef]
  32. Shaver, T.; Khosla, R.; Westfall, D. Evaluation of two crop canopy sensors for nitrogen recommendations in irrigated maize. J. Plant Nutr. 2014, 37, 406–419. [Google Scholar] [CrossRef]
  33. Longchamps, L.; Khosla, R. Early detection of nitrogen variability in maize using fluorescence. Agron. J. 2014, 106, 511–518. [Google Scholar] [CrossRef]
  34. Maxwell, K.; Johnson, G.N. Chlorophyll fluorescence—A practical guide. J. Exp. Bot. 2000, 51, 659–668. [Google Scholar] [CrossRef]
  35. Barnes, E.M.; Sudduth, K.A.; Hummel, J.W.; Lesch, S.M.; Corwin, D.L.; Yang, C.; Daughtry, C.S.; Bausch, W.C. Remote-and ground-based sensor techniques to map soil properties. Photogramm. Eng. Remote Sens. 2003, 69, 619–630. [Google Scholar] [CrossRef] [Green Version]
  36. Nørbæk, R.; Aaboer, D.; Bleeg, I.; Christensen, B.T.; Kondo, T.; Brandt, K. Flavone C-glycoside, phenolic acid, and nitrogen contents in leaves of barley subject to organic fertilization treatments. J. Agric. Food Chem. 2003, 51, 809–813. [Google Scholar] [PubMed]
  37. Agati, G.; Cerovic, Z.G.; Pinelli, P.; Tattini, M. Light-induced accumulation of ortho-dihydroxylated flavonoids as non-destructively monitored by chlorophyll fluorescence excitation techniques. Environ. Exp. Bot. 2011, 73, 3–9. [Google Scholar] [CrossRef]
  38. Agati, G.; Meyer, S.; Matteini, P.; Cerovic, Z.G. Assessment of anthocyanins in grape (Vitis vinifera L.) berries using a noninvasive chlorophyll fluorescence method. J. Agric. Food Chem. 2007, 55, 1053–1061. [Google Scholar] [CrossRef]
  39. Cerovic, Z.; Ounis, A.; Cartelat, A.; Latouche, G.; Goulas, Y.; Meyer, S.; Moya, I. The use of chlorophyll fluorescence excitation spectra for the non-destructive in situ assessment of UV-absorbing compounds in leaves. Plant Cell Environ. 2002, 25, 1663–1676. [Google Scholar] [CrossRef]
  40. Cartelat, A.; Cerovic, Z.; Goulas, Y.; Meyer, S.; Lelarge, C.; Prioul, J.-L.; Barbottin, A.; Jeuffroy, M.-H.; Gate, P.; Agati, G. Optically assessed contents of leaf polyphenolics and chlorophyll as indicators of nitrogen deficiency in wheat (Triticum aestivum L.). Field Crop. Res. 2005, 91, 35–49. [Google Scholar] [CrossRef]
  41. Holland, J.E.; Cammarano, D.; Fitzgerald, G.J.; Perry, E.M.; Poile, G.; Conyers, M.K. Proximal fluorescence sensing of potassium responsive crops to develop improved predictions of biomass, yield and grain quality of wheat and barley. Precis. Agric. 2019, 20, 379–397. [Google Scholar] [CrossRef]
  42. Muñoz-Huerta, R.F.; Guevara-Gonzalez, R.G.; Contreras-Medina, L.M.; Torres-Pacheco, I.; Prado-Olivarez, J.; Ocampo-Velazquez, R.V. A review of methods for sensing the nitrogen status in plants: Advantages, disadvantages and recent advances. Sensors 2013, 13, 10823–10843. [Google Scholar] [CrossRef]
  43. Srinivasarao, C.; Shanker, A.K.; Kundu, S.; Reddy, S. Chlorophyll fluorescence induction kinetics and yield responses in rainfed crops with variable potassium nutrition in K deficient semi-arid alfisols. J. Photochem. Photobiol. B Biol. 2016, 160, 86–95. [Google Scholar] [CrossRef]
  44. Zhao, X.; Du, Q.; Zhao, Y.; Wang, H.; Li, Y.; Wang, X.; Yu, H. Effects of different potassium stress on leaf photosynthesis and chlorophyll fluorescence in maize (Zea mays L.) at seedling stage. Agric. Sci. 2016, 7, 44–53. [Google Scholar]
  45. Hoagland, D.R.; Arnon, D.I. The water-culture method for growing plants without soil. Circ. Calif. Agric. Exp. Stn. 1950, 347, 32. [Google Scholar]
  46. Cerovic, Z.G.; Goutouly, J.-P.; Hilbert, G.; Destrac-Irvine, A.; Martinon, V.; Moise, N. Mapping winegrape quality attributes using portable fluorescence-based sensors. Frutic 2009, 9, 301–310. [Google Scholar]
  47. Helvich, K. Official Methods of Analysis; Association of Official Analytical Chemists: Rockville, MD, USA, 1990. [Google Scholar]
  48. Team, R.C. R: A Language and Environment for Statistical Computing; Team, R.C.: Austrial, Vienna, 2013. [Google Scholar]
  49. Xiong, H.; Xiong, Y.; Zhang, G.; Peng, Z.; He, S.; Xu, D.; Liu, W. Effects of nitrogen, phosphorus and potassium on yield of sweet corn. In Proceedings of the International Conference on Material Science, Energy and Environmental Engineering (MSEEE 2017), Suzhou, China, 22–24 March 2017. [Google Scholar]
  50. Sayre, J. Mineral accumulation in corn. Plant Physiol. 1948, 23, 267. [Google Scholar] [CrossRef] [PubMed] [Green Version]
  51. Liu, K.; Ma, B.; Luan, L.; Li, C. Nitrogen, phosphorus, and potassium nutrient effects on grain filling and yield of high-yielding summer corn. J. Plant Nutr. 2011, 34, 1516–1531. [Google Scholar] [CrossRef]
  52. Kolb, C.A.; Käser, M.A.; Kopecký, J.; Zotz, G.; Riederer, M.; Pfündel, E.E. Effects of natural intensities of visible and ultraviolet radiation on epidermal ultraviolet screening and photosynthesis in grape leaves. Plant Physiol. 2001, 127, 863–875. [Google Scholar] [CrossRef]
Figure 1. Flow chart of the methodology. RCBD = Completely randomized block design, VI = Vegetation index.
Remotesensing 12 01752 g001
Figure 2. (Left panel) dried maize aboveground biomass (A), N content (B), and N uptake (C) as a function of different N rates and (right panel) dried maize biomass (D), K content (E), and K uptake (F) as a function of different K rates. Samples were collected 36 days after emergence (V6 crop growth stage). Error bars represent confidence intervals (α = 0.05), and fitted curves are quadratic polynomials. Coefficients of determination (R2) are indicated on each graph.
Remotesensing 12 01752 g002
Figure 3. Fluorescence indices as a function of N uptake generated by different nutrient solutions with N variability in maize at four different crop growth stages under greenhouse conditions. V2 refers to the 10th day after emergence (DAE), and V3, V4, V5, and V6 refer to the crop growth stages at the 18th, 26th, 35th, and 38th DAE, respectively. Bars represent confidence intervals (α = 0.05), and fitted curves are quadratic polynomials with their respective coefficients of determination (R2).
Remotesensing 12 01752 g003
Figure 4. Fluorescence indices as a function of K uptake generated by different nutrient solutions with K variability in maize at four different crop growth stages under greenhouse conditions. V2 refers to the 10th day after emergence (DAE) and V3, V4, V5, and V6 refer to the crop growth stages at the 18th, 26th, 35th, and 38th DAE, respectively. Bars represent the confidence intervals (α = 0.05), and fitted curves are quadratic polynomials with their respective coefficients of determination (R2).
Remotesensing 12 01752 g004
Table 1. Concentration of nutrients in different rates of Hoagland’s solution created for different treatments of N and K.
IngredientsStockHoaglandNitrogenPotassium
Solution100%50%25%0%50%25%0%
(g/L water)------------------------mL/L------------------------
KH2PO4 (pH to 6.0 with 3 M KOH)136.091111---
KNO3101.1152.51.25----
Ca(NO3)2 × 4H2O236.1652.51.25-555
MgSO4 × 7H2O247.472222222
KCl74.56-5552.51.250
CaCl2 × 2H2O147.02-555---
NH4H2PO4115.31----111
NH4NO380.04----222
NaH2PO4119.98----111
Minors:*1111111
Fe-EDTA:**1111111
Treatments consisted of different plant nutrient solutions based on Hoagland’s solution. * Minors: micronutrients. Stock solution was prepared by H3BO3 (2.86 g/L), MnCl2 × 4H2O (1.81 g/L), ZnCl2 × 7H2O (0.1 g/L), CuCl2 (0.04 g/L), and H2MoO4.H2O (0.02 g/L). ** Fe-EDTA: Ferric ethylenediaminetetra acetic acid. Stock solution was prepared by FeSO4 × 7H2O (24.9 g/L), EDTA-Na (33.2 g/L), and NaOH 1N (89 mL/L).

