Article

Improving Estimation of Soil Moisture Content Using a Modified Soil Thermal Inertia Model

1
College of Natural Resources and Environment, South China Agricultural University, Guangzhou 510642, China
2
Department of Geography and Environmental Resources, College of Liberal Arts, Southern Illinois University Carbondale (SIUC), Carbondale, IL 62901, USA
3
Guangdong Provincial Key Laboratory of Land Use and Consolidation, South China Agricultural University, Guangzhou 510642, China
4
Guangdong Province Engineering Research Center for Land Information Technology, South China Agricultural University, Guangzhou 510642, China
5
Key Laboratory of Construction Land Transformation, Ministry of Land and Resources, South China Agricultural University, Guangzhou 510642, China
6
College of Agriculture and Animal Husbandry, Qinghai University, Xining 810016, China
*
Author to whom correspondence should be addressed.
Remote Sens. 2020, 12(11), 1719; https://doi.org/10.3390/rs12111719
Submission received: 18 April 2020 / Revised: 18 May 2020 / Accepted: 25 May 2020 / Published: 27 May 2020
(This article belongs to the Special Issue Remote Sensing of Regional Soil Moisture)

Abstract

:
There has been substantial research for estimating and mapping soil moisture content (SMC) of large areas using remotely sensed images by developing models of soil thermal inertia (STI). However, it is still a great challenge to accurately estimate SMC because of the impact of vegetation canopies and vegetation-induced shadows in mixed pixels on the estimates. In this study, a new method was developed to increase the estimation accuracy of SMC for an irrigated area located in YingKe of Heihe, China, using ASTER data. In the method, an original model of estimating bare STI was modified by decomposing a mixed pixel into three components, bare soil, vegetated soil, and shaded soil, as well as extracting their fractions using a spectral unmixing analysis and then deriving their fluxes. Moreover, the 90 m spatial resolution thermal images were scaled down to the 15 m spatial resolution by data fusion of a discrete wavelet transform (DWT) and re-sampling using the nearest neighbor method (NNM). The modified model was compared with the original model based on the mean absolute error (MAE) and relative root mean square error (RRMSE) between the SMC estimates and observations from 30 validation soil samples. The results indicated that compared to the original model based on the parallel dual layer, the modified STI model based on the serial dual layer statistically significantly decreased the MAE and RRMSE of the SMC estimates by 63.0–63.2% and 63.0–63.5%, respectively. The 15 m spatial resolution thermal bands obtained by the DWT data fusion provided more detailed information of SMC but did not significantly improve its estimation accuracy than the 15 m spatial resolution thermal bands by re-sampling using NNM. This implied that the novel method offered insights on how to increase the accuracy of retrieving SMC estimates in vegetated areas.

1. Introduction

Variation of soil moisture content (SMC) affects energy balance of land surfaces, soil erosion, and vegetation growth [1]. Thus, it is very important to retrieve the information of SMC. Traditionally, however, the information is often obtained using soil samples from sampled locations, which is time-consuming and costly. The traditional method also ignores the spatial distributions and patterns of SMC. On the other hand, remotely sensed images with spatiotemporal coverages of a study area provide the possibility for rapidly and cost-efficiently mapping SMC and monitoring its dynamics at a regional, national, and global scale [2,3]. For this purpose, substantial research has been conducted, and the used remote sensing data include optical and thermal infrared images and microwave observations to estimate spatial distributions of SMC over large areas [4,5,6].
Because the dielectric property of soils is closely related to SMC, various methods have been developed for estimating SMC using microwave images [7,8]. Microwave remote sensing is suitable for estimating large-scale SMC due to its capability of penetrating surface soil and being less disturbed by clouds and sparse vegetation cover [9,10]. However, microwave images are easily affected by ground roughness and dense vegetation canopy [11,12].
Moreover, optical and thermal image-based methods for mapping SMC became popular because the methods can provide maps of SMC with a wide range of spatial resolutions and a long-term history. Previous studies have shown that SMC has a linear or non-linear relationship with spectral reflectance of surfaces [13,14]. Thus, spectral-vegetation-index-based models are developed to estimate SMC. Gao et al. [13] used red-near infrared reflectance of soil to estimate SMC over a vegetated area. However, surface reflectance has a weak relationship with SMC when there is a dense vegetation cover. The methods are also limited by weather conditions such as clouds and night time.
There are also the methods that combine optical and thermal infrared (TIR) images to estimate SMC [15,16,17,18]. Thermal inertia is affected by the characteristics of surface layers, including thermal conductivity and capacity of heat storage. The heat energy from the surface layers is propagated to and stored in sub-surfaces during days and then returned to the surfaces during nights. Thus, the capacity of the sub-surfaces is characterized by thermal inertia. The surface heat capacity and thermal conductivity vary depending on SMC. The TIR methods are developed based on the sensitivity of land surface temperature (LST) to surface SMC [2]. These kinds of methods consist of (1) estimating LST using TIR images; (2) deriving soil latent and sensible fluxes using LST; (3) estimating soil thermal inertia (STI) using soil latent and sensible fluxes; and (4) developing an empirical model that accounts for the relationship of SMC with STI.
Based on soil thermal characteristics and infrared images, Watson et al. [19] proposed the first thermal inertia model. Based on a generalized theory in the study of Price [20], thermal inertia can be calculated using remote sensing data at a regional and global scale. The thermal properties of soils can also be estimated using the model proposed by Pratt [21] and the results are dependent on the changes in composition, porosity, and moisture content of the soils. However, this model is determined by many physical variables, and among the variables, the estimation of wind speed and humidity using remote sensing data is limited. Therefore, the model of Pratt [21] is hard to use. Moreover, by making an assumption that the coefficients of variation in energy fluxes into the atmosphere and the ground are constant, Price [22] proposed an Apparent Thermal Inertia model that can be only applied to bare soil dominant areas [23]. Based on the phase angle of diurnal temperature change, in addition, Xue and Cracknell [24] advanced the estimation of thermal inertia by presenting a real-time model.
The air–soil interface energy exchange implies a method of improving the estimation of surface STI using satellite data [25]. The estimation accuracy of thermal inertia and SMC can be further increased using the model of Zhang et al. [26] in which surface sensibility and latent fluxes with differential thermal inertia are taken into account. However, the model neglects the impact of vegetation and soil. In the model of Cai et al. [6], the maximum or minimum temperature is used to estimate thermal inertia, which makes it possible that the estimation is not dependent on the time for a satellite overpassing the study area. A relatively new thermal inertia model proposed by Liu et al. [27] introduced surface sensibility, latent fluxes and a parallel two-layer model into a thermal conductivity equation. Minacapilli et al. [28] conducted a laboratory experiment to evaluate the thermal inertia model for estimating surface SMC and found that this model offered great potential for mapping SMC and monitoring its dynamics using visible–near-infrared and TIR data. Although a great deal of research has been conducted and several thermal inertial models have been available for retrieving SMC [15,16,17,18], the models are only applicable in bare soil areas and lack the ability of accurately mapping SMC in the vegetated areas due to mixed pixels and vegetation-induced shadows.
The TIR-based methods have advantages of various spatial resolution satellite images available and relate SMC to thermal inertia. However, the weak relationship of TIR images with SMC in the densely vegetated areas impedes the applications of the TIR methods. So far, there have been no reports that deal with how to mitigate the impact of vegetation-induced shadows on estimation of SMC and improving the mapping of SMC in vegetated areas.
This study aimed to develop a novel method to generate the spatial distribution of surface SMC in both bare soil and vegetated areas by modifying the STI model presented by Liu et al. [27] and reducing the effect of vegetation-induced shadows on estimation of SMC. The proposed method was developed by decomposing mixed pixels into three components, bare soil, vegetated soil, and shaded soil, and taking into account the effects of vegetation and corresponding shadows on the estimation of SMC. The improved model was verified by comparing the measured and estimated values of SMC obtained using Advanced Spaceborne Thermal Emission and Reflection Radiometer (ASTER) data in a selected study area.

2. Materials and Methods

In this study, we proposed a modified STI model to improve the estimation of SMC. The flow chart of the method is shown in Figure 1. The methodological framework consists of data collection, data pre-processing, derivation of models, modification of the STI model based on decomposition of mixed pixels and derivation of components at a finer spatial resolution, estimation of soil sensible flux and soil latent flux, and estimation and validation of SMC using the modified model. In addition, a comparison of the modified model with the original model was carried out.

2.1. Study Site and Data

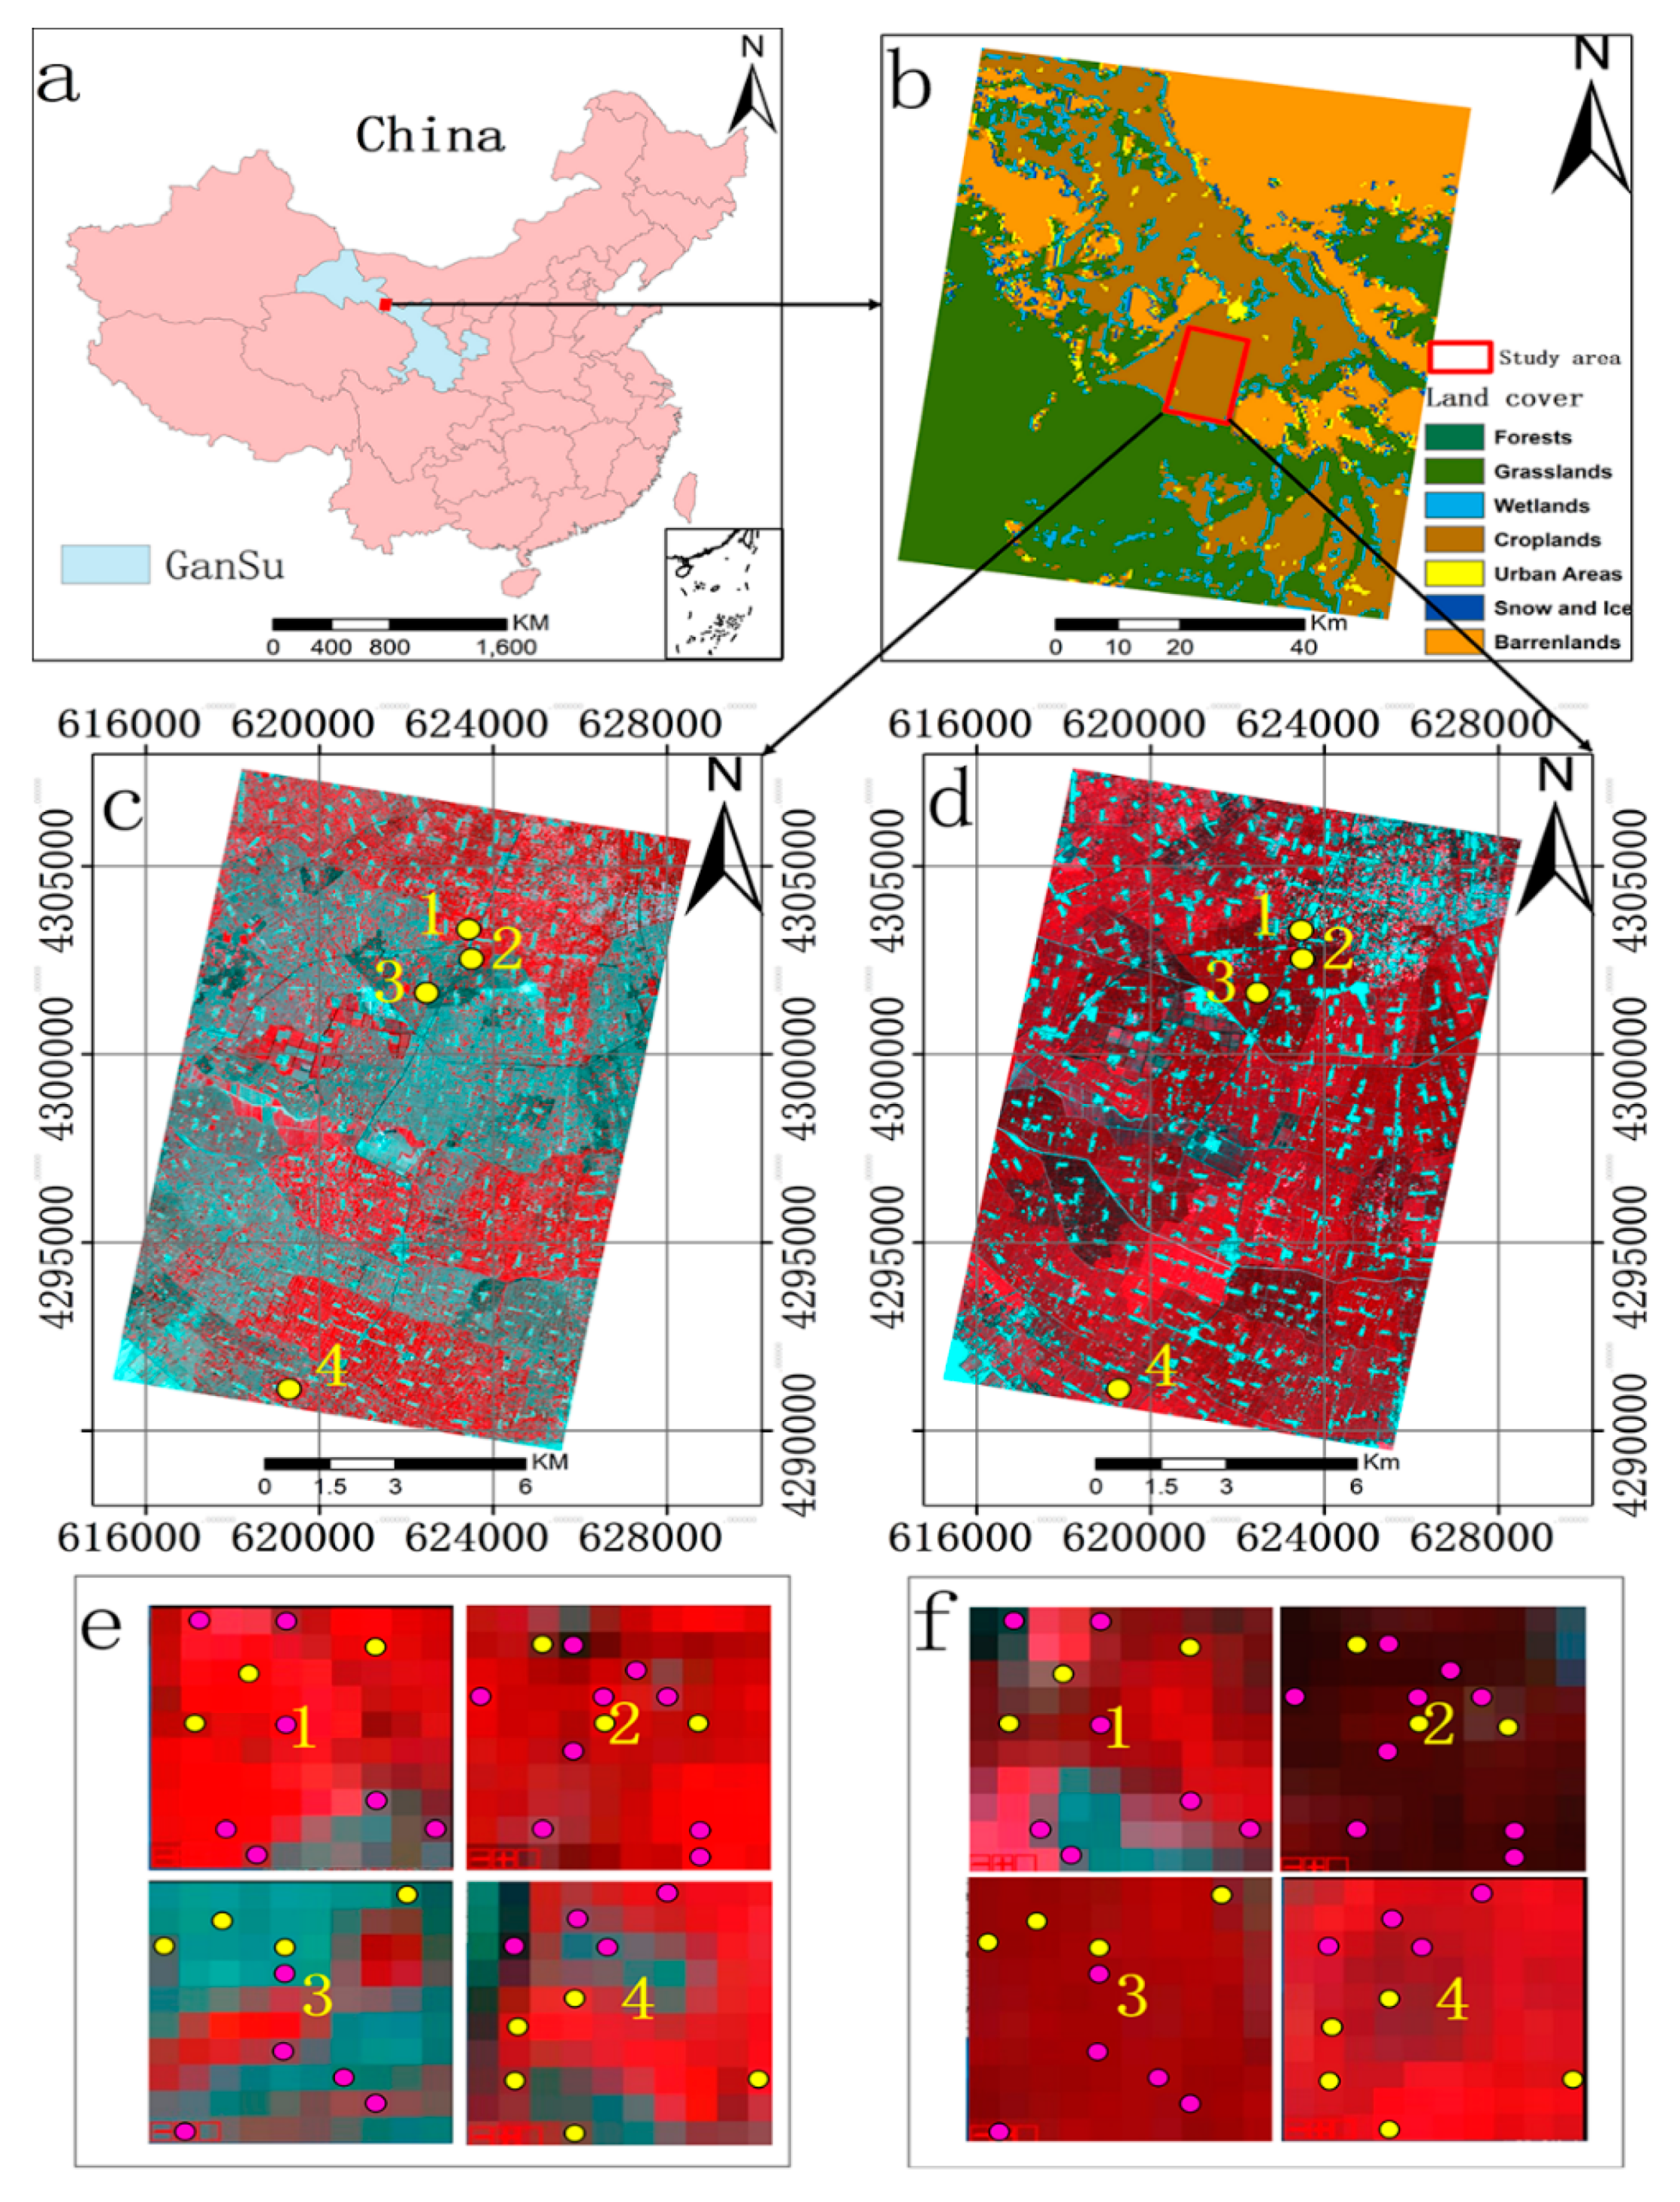
This study was conducted in an irrigated area located in Yingke of Heihe River Basin, Northwestern China (Figure 2a). This study area falls in the temperate zone characterized by a semi-arid climate, where summers are hot, and winters are cold and dry. The high elevation and aridity lead to great variation of diurnal temperature with the mean annual temperature varying from 7.0 to 10.0 °C and the maximum temperature of 40 °C. The annual precipitation is 140 mm, concentrating in May to October. Due to dry winters, snowing rarely occurs. This area was dominated by wheat, corn, and other crops (Figure 2b).
In Figure 2c,d, the study area is shown using the ASTER images acquired on June 4th and July 10th of 2008, respectively. In this experiment, a total of 40 sample plots (Figure 2e,f) were selected from 4 sampled blocks of 180 m × 180 m (marked with 1, 2, 3, and 4 in Figure 1c,d). Soil samples were collected on June 4th and July 10th of 2008, respectively, which led to a total of 80 soil samples. The samples fell in in three types of land cover, including wheat, corn, and wheat/corn fields. The sample plots of 15 m × 15 m spatial resolution matched the pixels of the ASTER fusion data mentioned next in size. The locations of the plots were obtained using a global positioning system receiver. Within each of the sample plots, SMC was measured at 5 points in the field with one point at the plot center and other 4 at the middle locations of two diagonal lines from the plot center to four corners and the mean value of the SMC measurements from the 5 points was used as the SMC value of the sample plot. Based on previous experiments [29], a 20 cm depth of soil layer led to the stable measurements of SMC. At each point, SMC at a depth of 20 cm was thus measured in the field with time-domain reflectometry. The time-domain reflectometry sensor for collecting the measurements of SMC was calibrated according to the results of the study by Wu et al. [1]. There were 50 soil samples (purple plots in Figure 2e,f) chosen based on land cover types and used to compare and select the models that were used to account for the relationship between thermal inertia and SMC using a leave-one cross validation. The left 30 soil samples were used for validation.
Moreover, within each of the sample plots, an Analytical Spectral Device with a spectroradiometer of 15° and 25° field of views was used to measure hyperspectral reflectance values of the wavelength range from 300 nm to 2500 nm for different cover types. A thermo-radiometer working in the interval of 800 nm to 1400 nm and with a field of view of larger than 5° was used to measure the temperatures of various cover types. At the same time, the data for atmospheric, meteorological, and micrometeorological variables including wind speed, air temperature, and net radiation were collected in the field.
In this study, ASTER images dated on June 4th of 2008 and July 10th of 2008 were acquired with a total of 14 bands covering visible through TIR wavelength regions. Five 90 m × 90 m TIR bands and three 15 m × 15 m visible bands were used to estimate land surface temperature. The radiance calibration of each ASTER-TIR band q was carried out based on the equation   L q ( i , j ) = Gain q × ( DN q ( i , j ) 1 ) , where i and j were the ith row and the jth column of the location in the image, Gain 10 = 0.006882 , Gain 11 = 0.006780 , Gain 12 = 0.006590 , Gain 13 = 0.005693 , and Gain 14 = 0.0055 , and DNq(i,j) is the digital number value of the pixel (i,j) [30]. The atmospheric correction of the ASTER images including VNIR and thermal bands was conducted using MODTRAN4.0. The corrected ASTER-TIR bands at the spatial resolution of 90 m × 90 m were re-sampled using a nearest neighbor method (NNM) to create ASTER-TIR images at a spatial resolution of 15 m × 15 m, which kept the original ASTER-TIR values at the 90 m resolution.

2.2. Methods

2.2.1. Multiscale Soil Thermal Inertia Model

As a physical variable, STI characterizes the impedance to the variation of temperature. If a heat transfer is given, usually, the higher the STI values, the smaller the changes of temperature and vice versa. The STI is calculated as follows:
P = kc ρ
where P, k, c, and ρ are the STI ( J · m 2 · s 1 / 2 · K 1 ), the thermal conductivity ( J · m 1 · s 1 · K 1 ), the specific heat of the material ( J · kg 1 · K 1 ), and the density ( kg · m 3 ), respectively. Though STI in Equation (1) can be obtained from in situ measurements, it is difficult to be acquired for a large region. Remote sensing can provide the potential of obtaining large-scale STI values based on a conductive heat transfer equation.
The existing thermal models are based on the assumption of one-dimensional periodic heating of a uniform half-space. A diffusion equation (Equation (2)) with boundary conditions is utilized to estimate the soil temperature [19]:
{ T sur ( x , t ) t = D H 2 T s 1 ( x , t ) x 2 k T sur ( x , t ) x | x = 0 = ( 1 A ) S O C τ cos θ [ A c + BT s ( 0 , t ) ]
where T sur ( x , t ) and T sur ( 0 , t ) are the soil temperatures at the depth x and 0 below the surface and time t . The   D H ( = k c ρ ) represents the thermal diffusivity of the half-space. The A , S O , C τ , and θ indicate the surface albedo, the solar constant, the atmospherically optical transmission, and the solar zenith, respectively. The A c   and B are dependent on the conditions of the atmosphere and surface with a linear relationship with the surface soil temperature: A c + BT sur ( 0 , t ) . In Equation (2), an assumption of a flat Lambertian surface underneath a horizontally homogeneous atmosphere is made.
Carslow et al. [31] provided a solution of the thermal conduction Equation (2) for the temperature of the ground surface. Based on the ground surface temperature equation, Liu and Zhao [27] proposed a new STI model expressed as
P = [ ( A 1 ( 1 A ) S O C τ T sur ( 0 , t ) + ( LE + H ) / B ) 2 B 2 2 B 2 ] / w  
where   LE , H , and w are, respectively, the bare soil latent, sensible fluxes, and the rate of the earth’s rotation. T sur ( 0 , t ) is the surface bare soil temperature.
Liu and Zhao [27] considered that each pixel consisted of the bare soil area and vegetated area. A parallel dual-source model was utilized to estimate the soil latent and sensible fluxes in bare soil areas, which neglects the shaded soil flux in the vegetated area. Thus, to improve the STI model so as to apply it to the vegetated areas, in this study, each pixel was decomposed into bare, vegetated, and shaded soil areas. A serial dual-source model was employed to reduce the effects of vegetation and obtain the estimates of the shaded soil latent and sensible fluxes in the vegetated areas. At the same time, to improve the estimation accuracy of the STI model for SMC, a discrete wavelet transform (DWT) was used to obtain a finer spatial resolution thermal inertia image. The STI could be written as
P = [ ( A 1 ( 1 A s ) S O C τ T s ( 0 , t ) + ( LE s + H s ) / B ) 2 B 2 2 B 2 ] / w  
where   LE s   and H s are, respectively, the soil latent and sensible fluxes in the soil and vegetated area, A s   is the surface soil albedo in the soil and vegetated area, and T s ( 0 , t ) is the surface soil temperature.

2.2.2. Estimation of Finer Spatial Resolution Soil Temperature

Wavelet Transform of ASTER Thermal Data

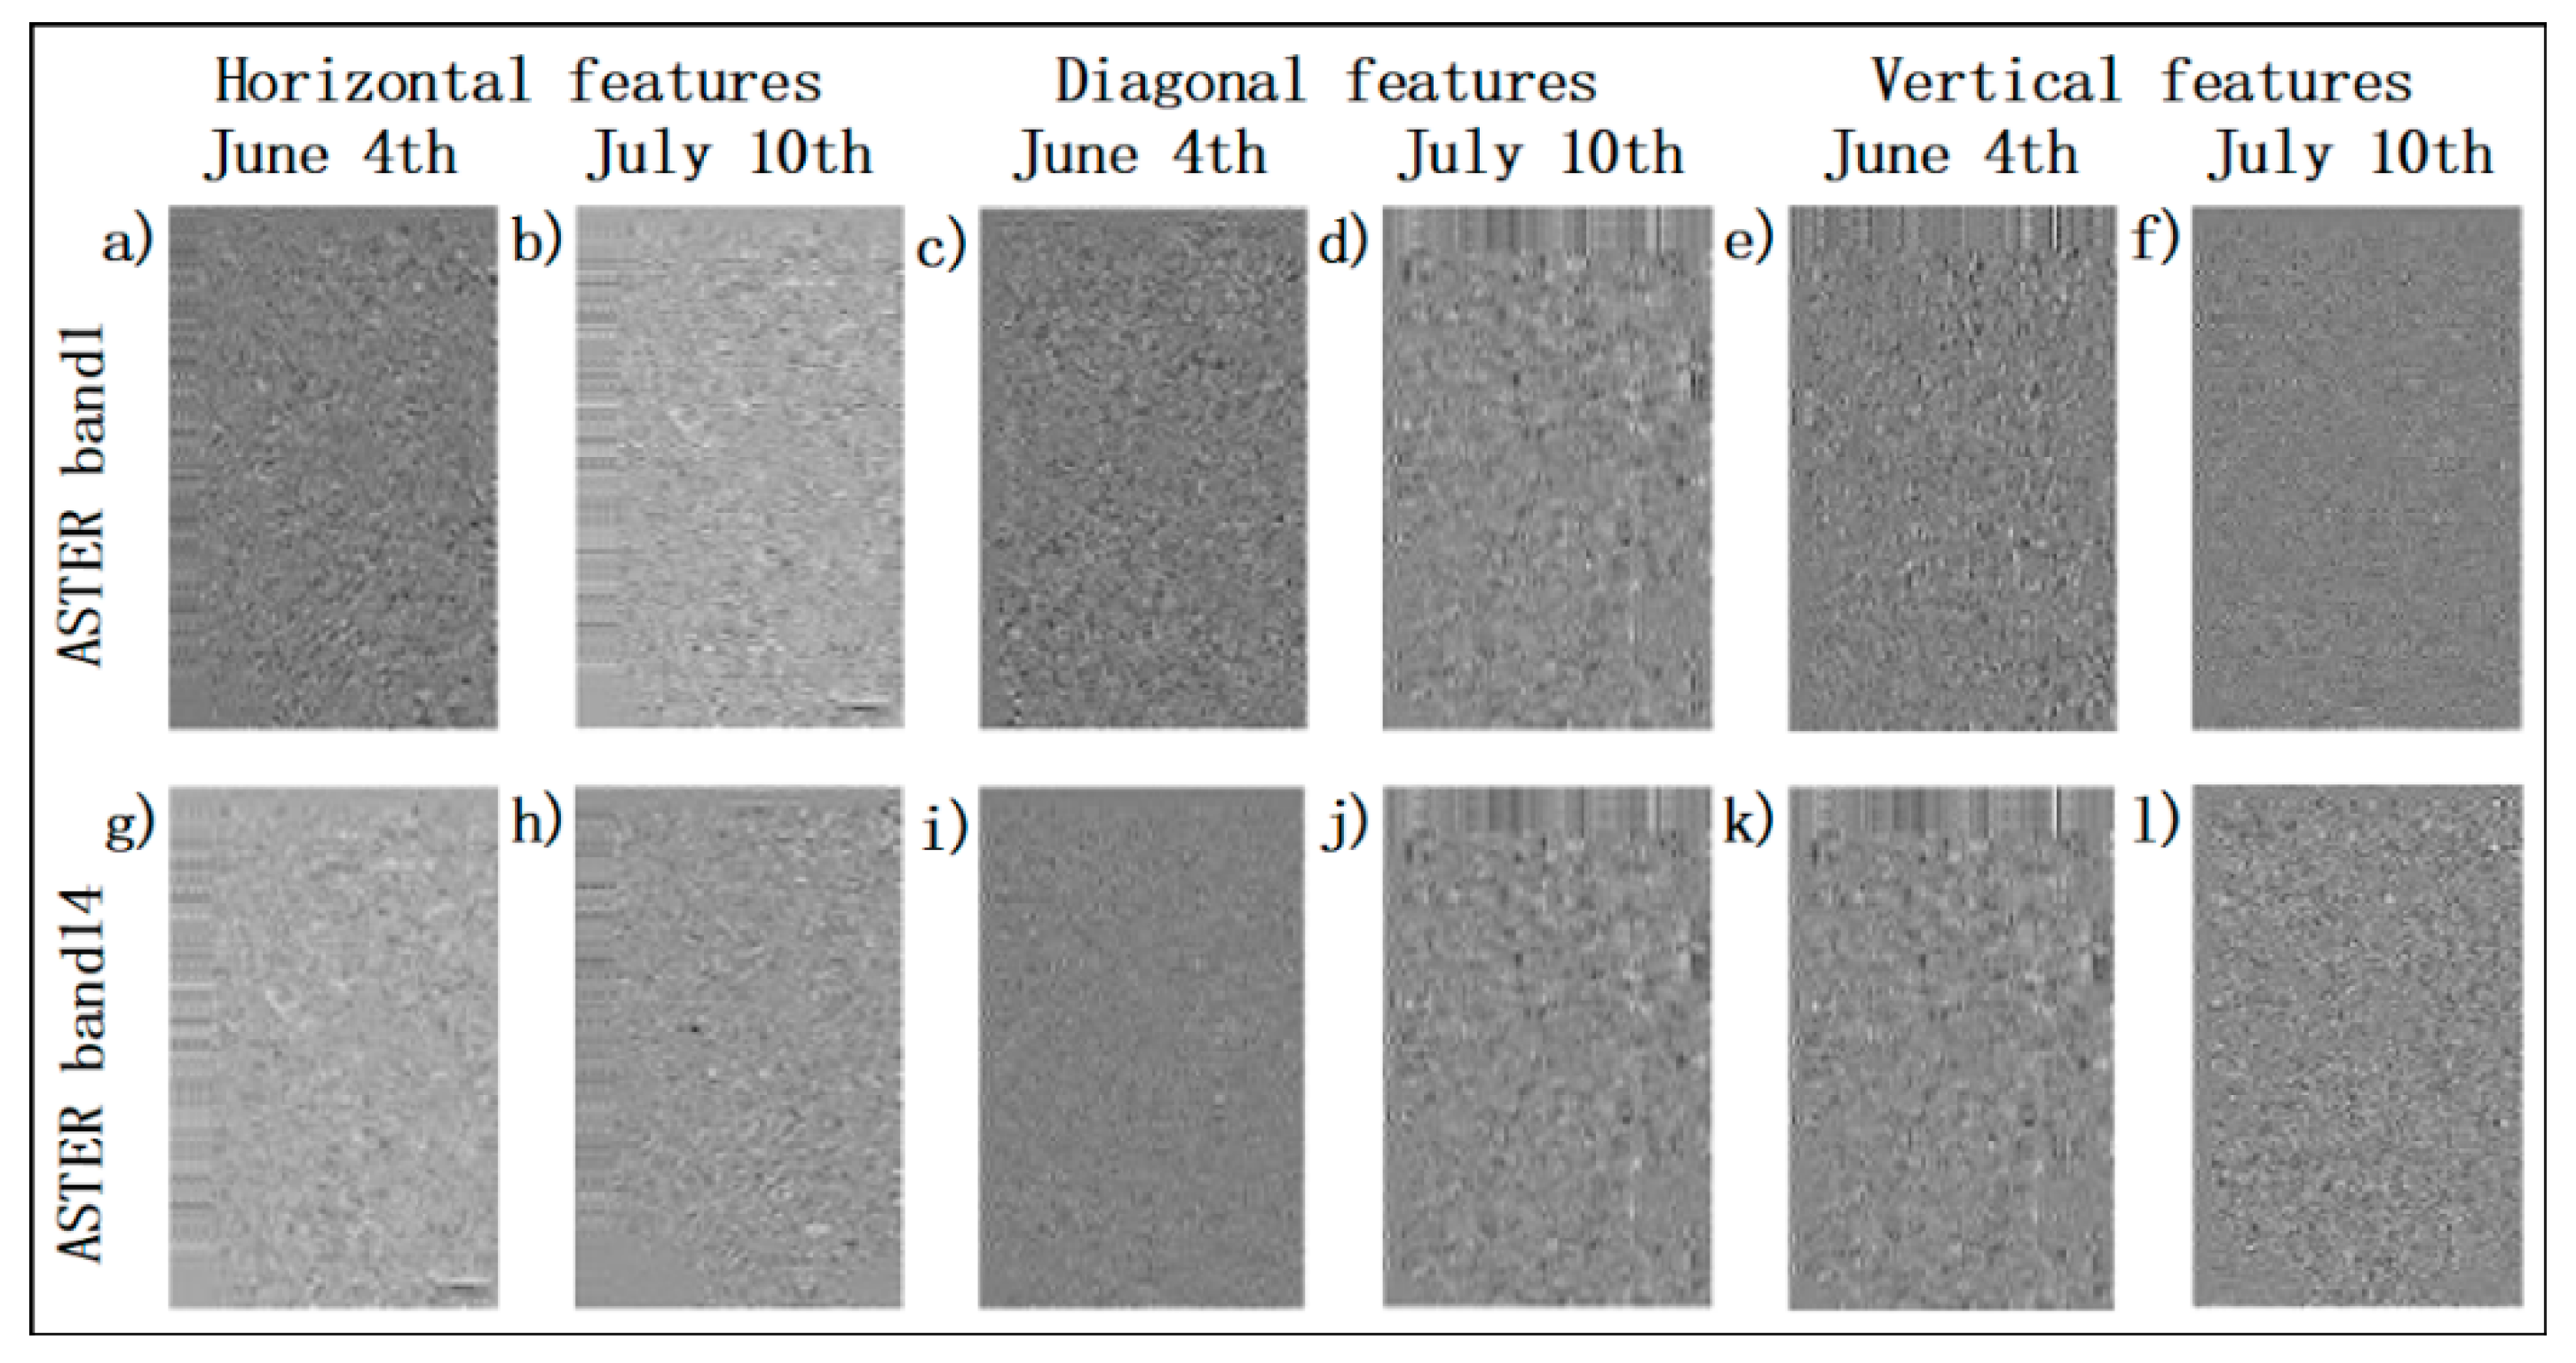
The LST is a key physical parameter. To increase the estimation accuracy of the surface component temperatures, the DWT of ASTER TIR images was conducted, which led to finer spatial resolution TIR data. The DWT included the wavelet decomposition of the images and an inverse wavelet transform that resulted in a new image. The wavelet decomposition of an image means that the image is first divided into four components, including the localized high-frequency point features, the localized vertical features, the localized horizontal details, and the lower frequency features. The lower frequency features are then further split at higher levels of the decomposition. For the detail of DWT, readers can be referred to Chang et al. [32].
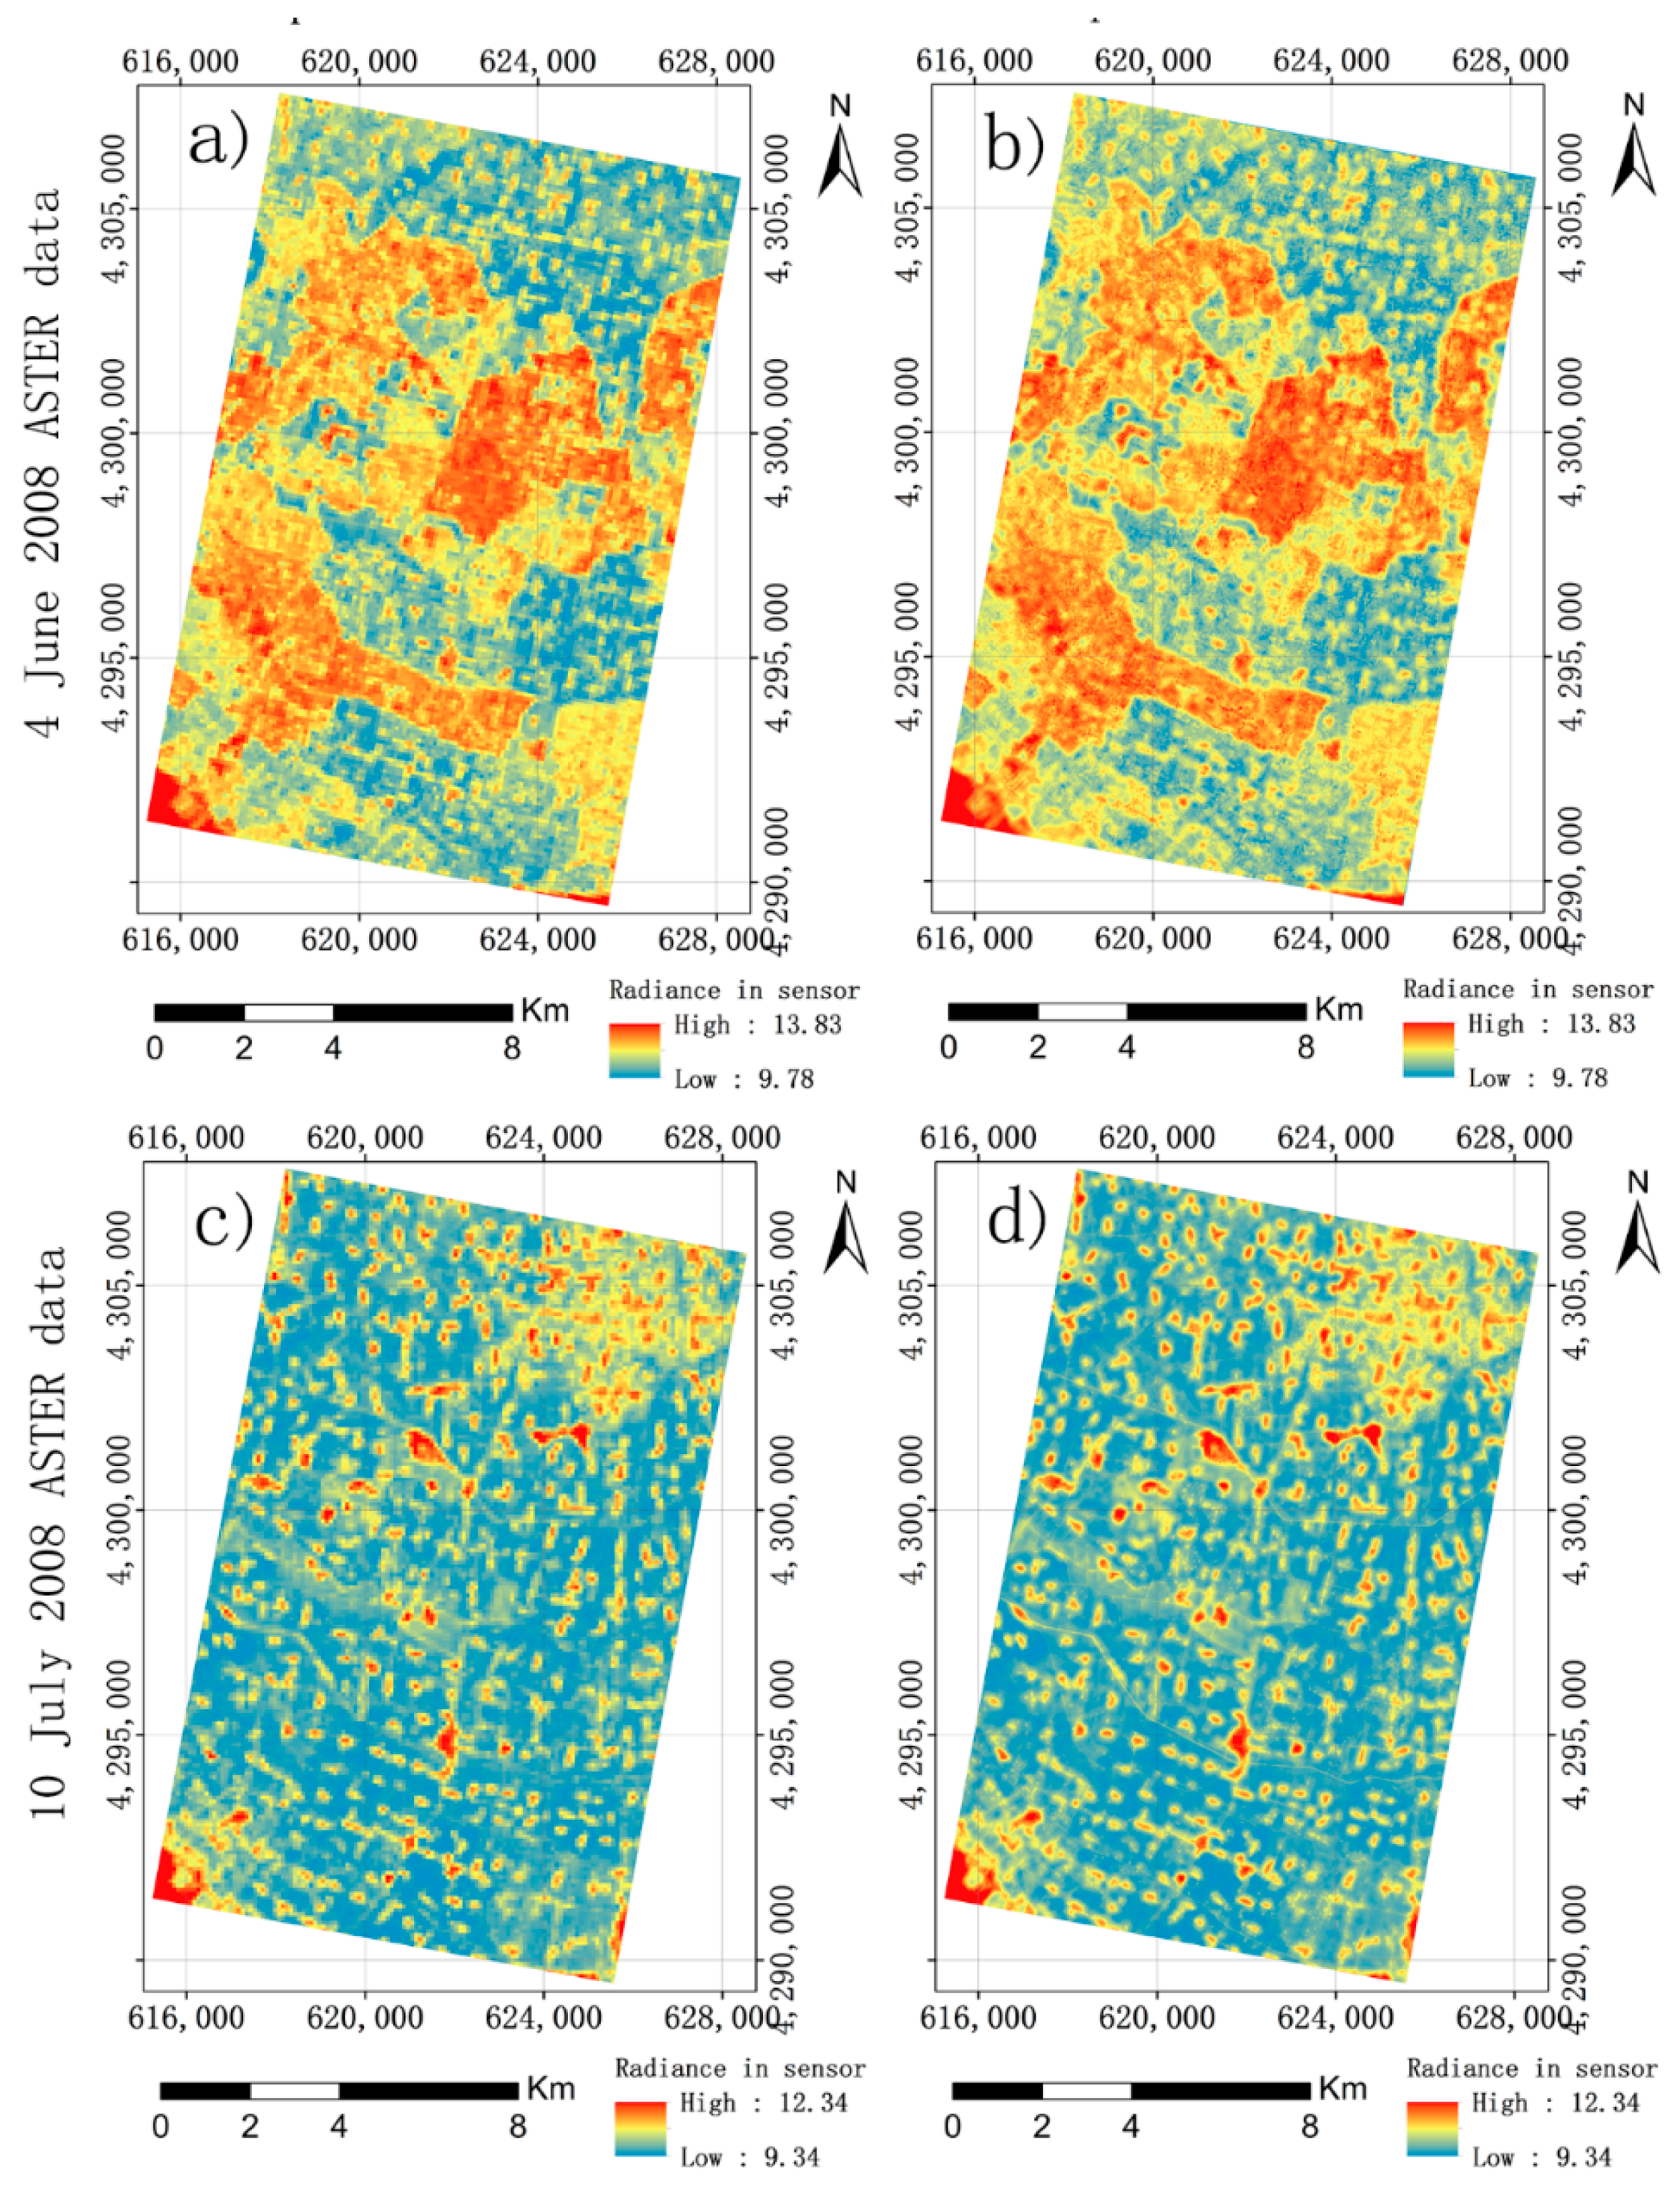
In this research, as examples three high-frequency components of the ASTER TIR band 14 and green band 1 are shown in Figure 3. Figure 3a,b for green band 1 and Figure 3g,h for TIR band 14 represent the localized high-frequency point features of the June 4th and July 10th images, respectively. Figure 3c,d and Figure 3i,j show the localized vertical features of the June 4th and July 10th images, respectively. Figure 3e,f and Figure 3k,l provide the localized horizontal features of the June 4th and July 10th images, respectively. The ratios of three high-frequency components between the visible green band 1 and TIR band 14 were, respectively, close to the constants of −0.178147, −1.302275, and −0.611796, implying that the high-frequency information of the ASTER TIR data was very similar to that of the ASTER green band data. In fact, the high-frequency components transformed from the 15 m ASTER green band were the same as those from the 90 m ASTER TIR band because the high-frequency components represent the detailed surface features in the whole study area. The 15 m spatial resolution ASTER-TIR products were obtained by fusing the three high-frequency data of the 15 m ASTER green band and the low frequency data of the 90 m ASTER-TIR image (Figure 4). Compared with the original ASTER data, the fusion image showed more details of the surface features.

Retrieval of Land Surface Component Temperatures

Mixed pixels often contain multiple land cover types, which impedes the improvement of estimation accuracy of SMC. Although the ASTER-TIR images were scaled down from a 90 m spatial resolution to a 15 m spatial resolution, the impact of mixed pixels in the images on mapping SMC cannot be ignored. The temperatures of land cover types within a mixed pixel i would be integrated and determine the average temperature of the mixed pixel. The integration could be linear or non-linear. For simplification, in this study it was assumed that the fluxes of the vegetated area ( L vi ), bare soil ( L bi ) and shaded soil ( L di ) in each mixed pixel had linear contributions to the heat flux ( L i ) of the mixed pixel. The area fractions of vegetation, bare soil, and shadow were derived using a linear spectral unmixing analysis. The LST was then obtained from the following equation [33]:
L i = f vi σ ε vi T vi 4 + f bi σ ε bi T bi 4 + ( 1 f vi f bi ) σ ε di T di 4
where   ε vi , ε bi ,   and ε di ,   respectively, represent vegetation, bare soil, and shaded soil emissivity at each mixed pixel. The T vi ,   T bi , and T di are the temperatures of pure vegetation, bare soil, and shaded soil within the mixed pixel, respectively. σ   is the Boerziman constant ( σ = 5.67 × 10 8 Wm 2 K 4 ). f vi and   f bi are the fractions of the vegetated and bare soil areas within the mixed pixel. In this study, estimating the land surface component values of temperature and emissivity was conducted using a genetic algorithm (GA) as a nonlinear multi-parameter optimization problem. For the detail of GA, readers can be referred to Liu et al. [34].

2.2.3. Estimation of Soil Sensible Flux

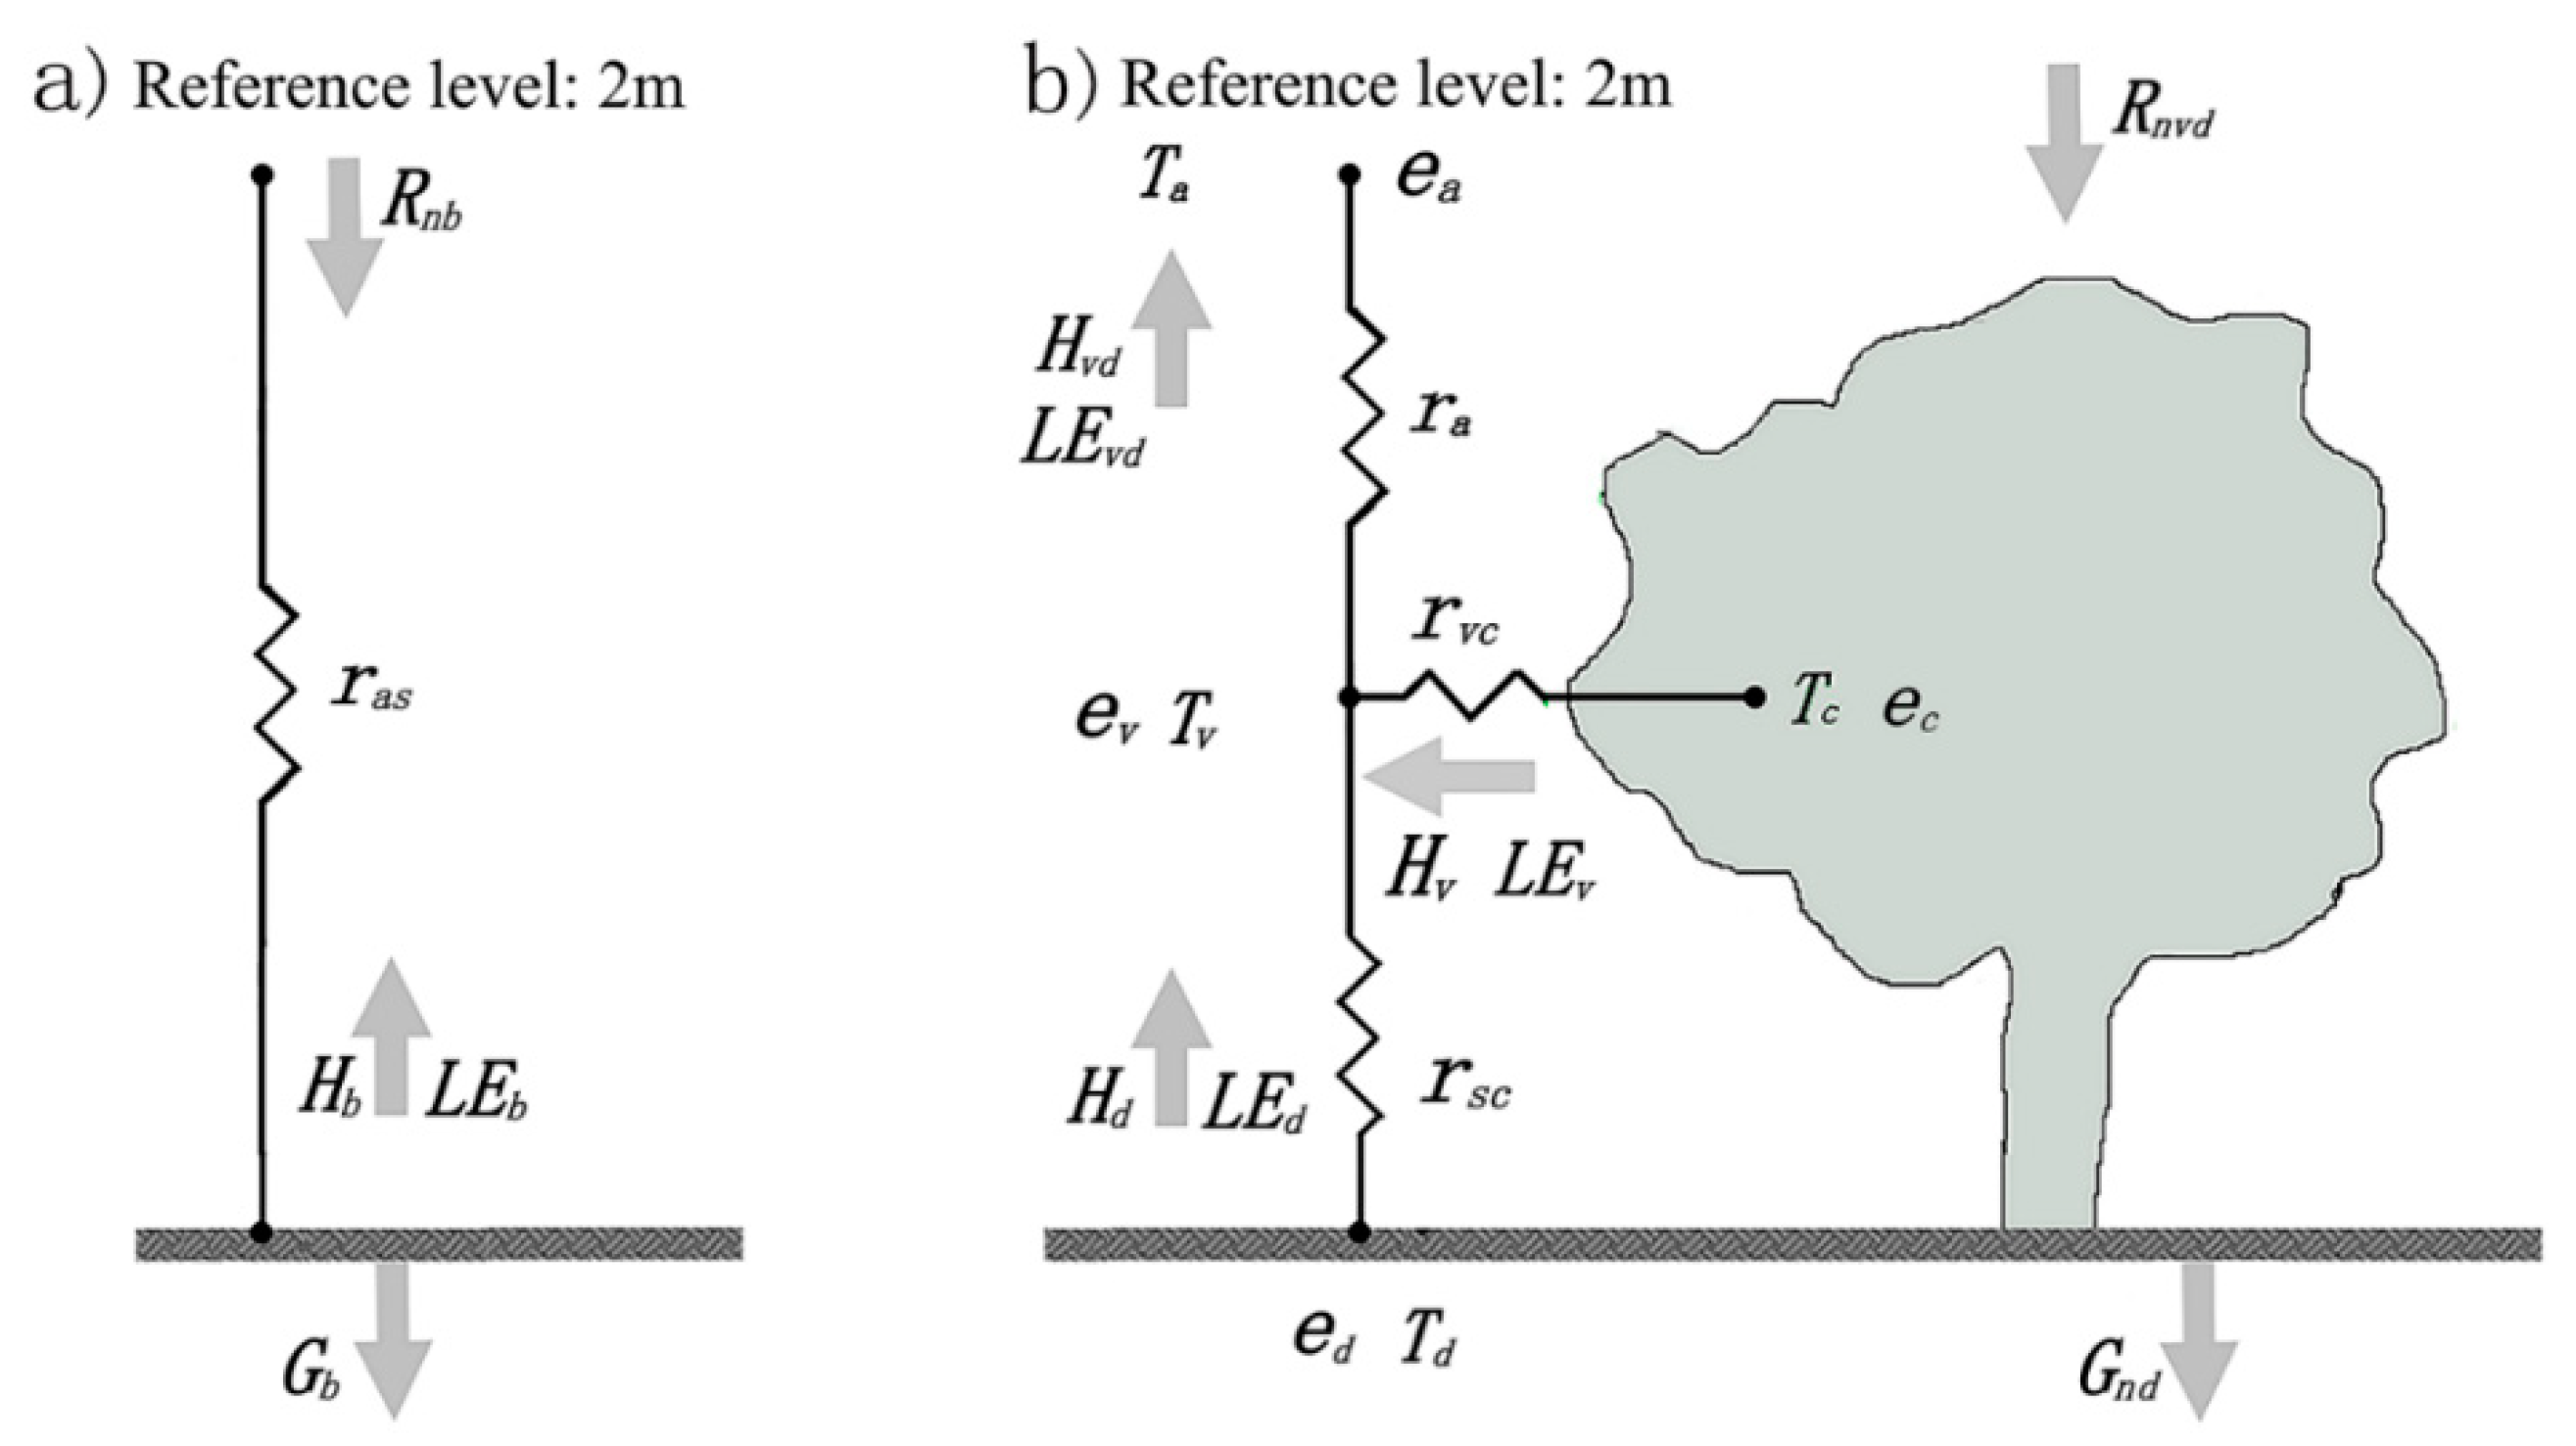
In the vegetated area, a series dual-source energy balance model was driven to estimate soil latent and sensible fluxes. In this model, we considered water vapor and heat as two sources and supposed that the bottom water and heat only come through the top layer [35]. The water and heat were then superimposed on each other. Moreover, the surface net radiance flux, the surface sensible heat flux and the surface latent flux in the reference level were respectively obtained by summing the corresponding components at each layer (Figure 5).
In the bare soil area (Figure 5a), the soil sensible heat flux ( H b ) was written as [36]
H b = ρ a · C p · ( T b T a ) / r as
where   T b is the bare soil temperature, T a is the atmospheric temperature at the reference level,   ρ α and C p are, respectively, the air density (1.2 kg · m 3 ) and the air heat capacity (1003.2 J · kg 1 ), and r as is the aerodynamic resistance obtained using the empirical model of Sauer et al. [37].
In the series dual-source energy balance model, H   is obtained by adding the soil sensible flux   ( H b ) and canopy sensible flux   ( H v ) . Based on the resistance network shown in Figure 5, the soil sensible flux under vegetation cover ( H vd ) is [38]
H vd = H v + H d
H v = ρ α · C p · ( T v T c ) / r vc
H d = ρ α · C p · ( T d T c ) / r sc
where ρ α and C p are, respectively, the air density (1.2 kg · m 3 ) and the air heat capacity (1003.2 J · kg 1 ). H d and H v present, respectively, the canopy-covered soil sensible flux and the vegetation sensible flux. T c , T d , and T v are, respectively, the air aerodynamic temperature in the canopy height, the canopy-covered soil, and vegetation aerodynamic temperatures. r vc and r sc represent, respectively, the resistance of the whole canopy boundary-layer and the aerodynamic resistance between canopy source and soil surface. Finally, the soil sensible flux ( H s ) was acquired by the following equation: H s = H b + H d .

2.2.4. Estimation of Soil Latent Flux

The soil latent heat flux LE S ( = LE b + LE d ) was derived using the energy residual method, Equation (10) (Figure 5) [35].
LE S = R ns H S G
where the soil net radiance flux R ns ( = R nb + R nd ) was estimated by
  R ns = R n ( 1 f v ) = ( 1 f v ) ( ( 1 A ) S O C τ cos θ + R ld ε s σ T S 4 )
where R n and A are the surface net radiance flux and the surface albedo. S 0   and C τ   are, respectively, a solar constant (1367 Wm 2 ) and the atmospheric optical transmission (0.562). The θ   is the solar zenith (20°); R ld is the incident longwave radiation ( Wm 2 ) and is calculated according to the biomass equation ( R ld = aT a 6 ) [39], where a = 5.3 × 10 13 Wm 2 K 6 , and T a   is the atmospheric temperature (= 29°). ε s   ( = ε b + ε d   ) is the surface emissivity .   ε b and ε d are, respectively, the emissivity of bare soil and shaded soil. T s (= T b + T d ) is the surface soil temperature. The surface flux exchange G   ( =   G b + G nd ) can be calculated with the model [40]   G = β × R ns , and β = 0.2   [41] in this study.

2.2.5. Estimation and Evaluation of Soil Moisture

In this study, the STI model (Equation (3)) was modified to accurately derive the spatial distribution of SMC in both bare soil and vegetated areas, which led to the modified model (Equation (4)). The modification was conducted by taking into account the effect of vegetation-induced shadows on the estimation of surface SMC. The original model and the modified model were, respectively, used to generate the estimates of STI. On the other hand, the change of STI caused the change of SMC. Thus, the relationship of SMC with STI derived from ASTER images can be developed and used to create the estimates of SMC. In this study, four models, including a linear, logarithm, power, and exponential model [42], were compared and selected using a leave-one cross validation method [43] based on the field measurements of 50 sample plots in the study area. The derivation of STI and its relationships with SMC was conducted using the ASTER TIR images at the spatial resolution of 15 m × 15 m by the NNM re-sample method and the DWT data fusion, respectively.
The accuracies of SMC estimates obtained from the original and modified models with two images at the 15 m spatial resolution obtained using NNM and DWT, respectively, were evaluated. Integrating the original and modified models with two images led to four combinations, including (1) the original-model-based bare STI using the 15 m resolution TIR bands from NNM (OBSTI_NNM); (2) the modified-model-based STI using the 15 m resolution TIR bands from the NNM (MSTI_ NNM); (3) the original-model-based bare STI using the 15 m resolution TIR bands from the DWT (OBSTI_DWT); and (4) the modified-model-based STI using the 15 m resolution TIR bands from the DWT (MSTI_ DWT). The evaluations and comparisons were conducted using the coefficient of determination (R2), RMSE, relative RMSE (RRMSE), and mean absolute error (MAE) between the estimated and observed values of SMC. In addition, the mean value of SMC predictions was also utilized. The mean absolute error was defined as the mean value of the absolute differences of the estimates from the observations. The RMSE was defined as the square root of the average squared differences between the estimated and observed values. The RRMSE indicated the per-unit RMSE in percentage.

3. Results

3.1. Surface Albedo

The broadband albedo of land surface is an important variable in this study. At present, the conversion models from narrowband to broadband albedos [44] are not available. There are two alternatives to derive the total shortwave albedo, that is, using an empirical relationship of the surface total shortwave albedo with the spectral variables from remotely sensed images and utilizing the radiative transfer simulation with a number of surface reflectance spectra. In this study, the surface albedo was defined as the ratio of irradiance fluxes based on an assumption that narrowband albedos are linearly correlated with broadband ones. The surface narrowband albedos were first derived using the MODTRAN4.0 model and then converted to broadband albedos by taking the spectral distribution solar irradiance at the surface as a weighted function [33]. The obtained broadband albedo, α, was expressed as follows:
α = 0.468594 α 1 + 0.303217 α 2 + 0.228189 α 3
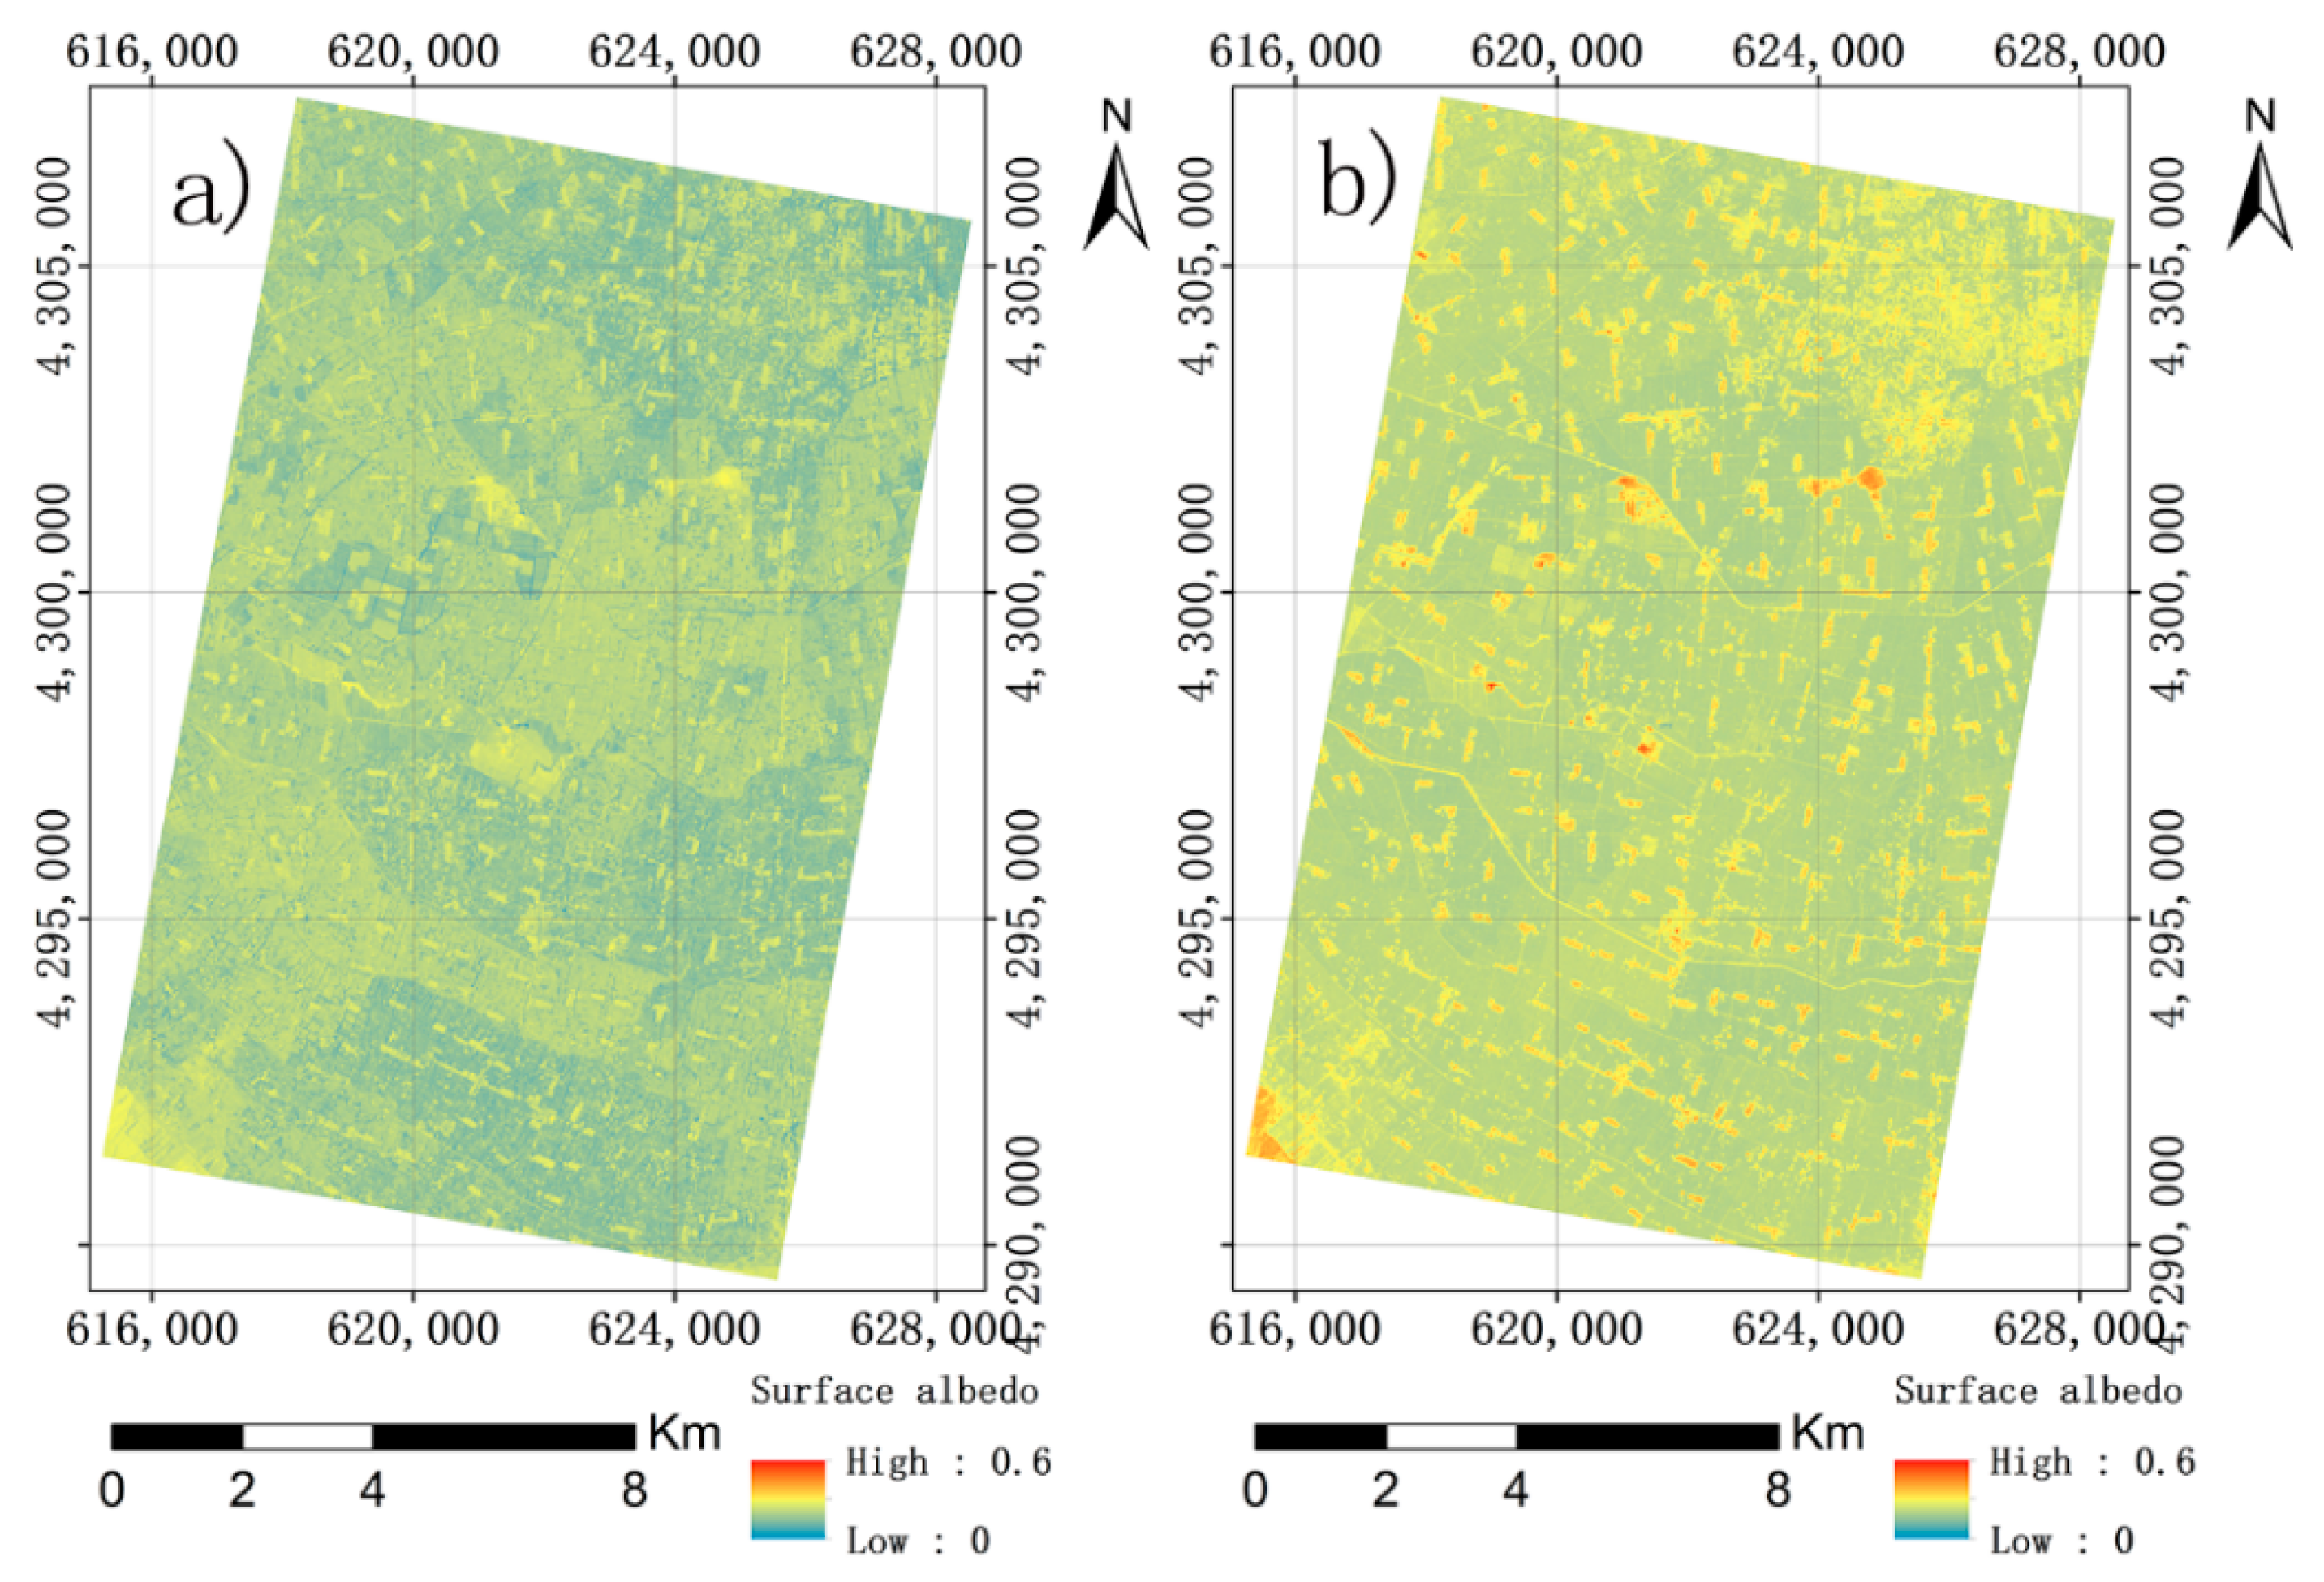
where α 1 , α 2 , and α 3 are, respectively, the narrowband albedos for ASTER band 1, band 2, and band 3. The albedo results are shown in Figure 6.

3.2. Soil Temperature

In Equation (5), the vegetation canopy fraction was estimated using ASTER band 1, band 2, and band 3 as follows [34]:
ρ i = f v · ρ vi + f b · ρ bi + ( 1 f v f b ) · ρ di
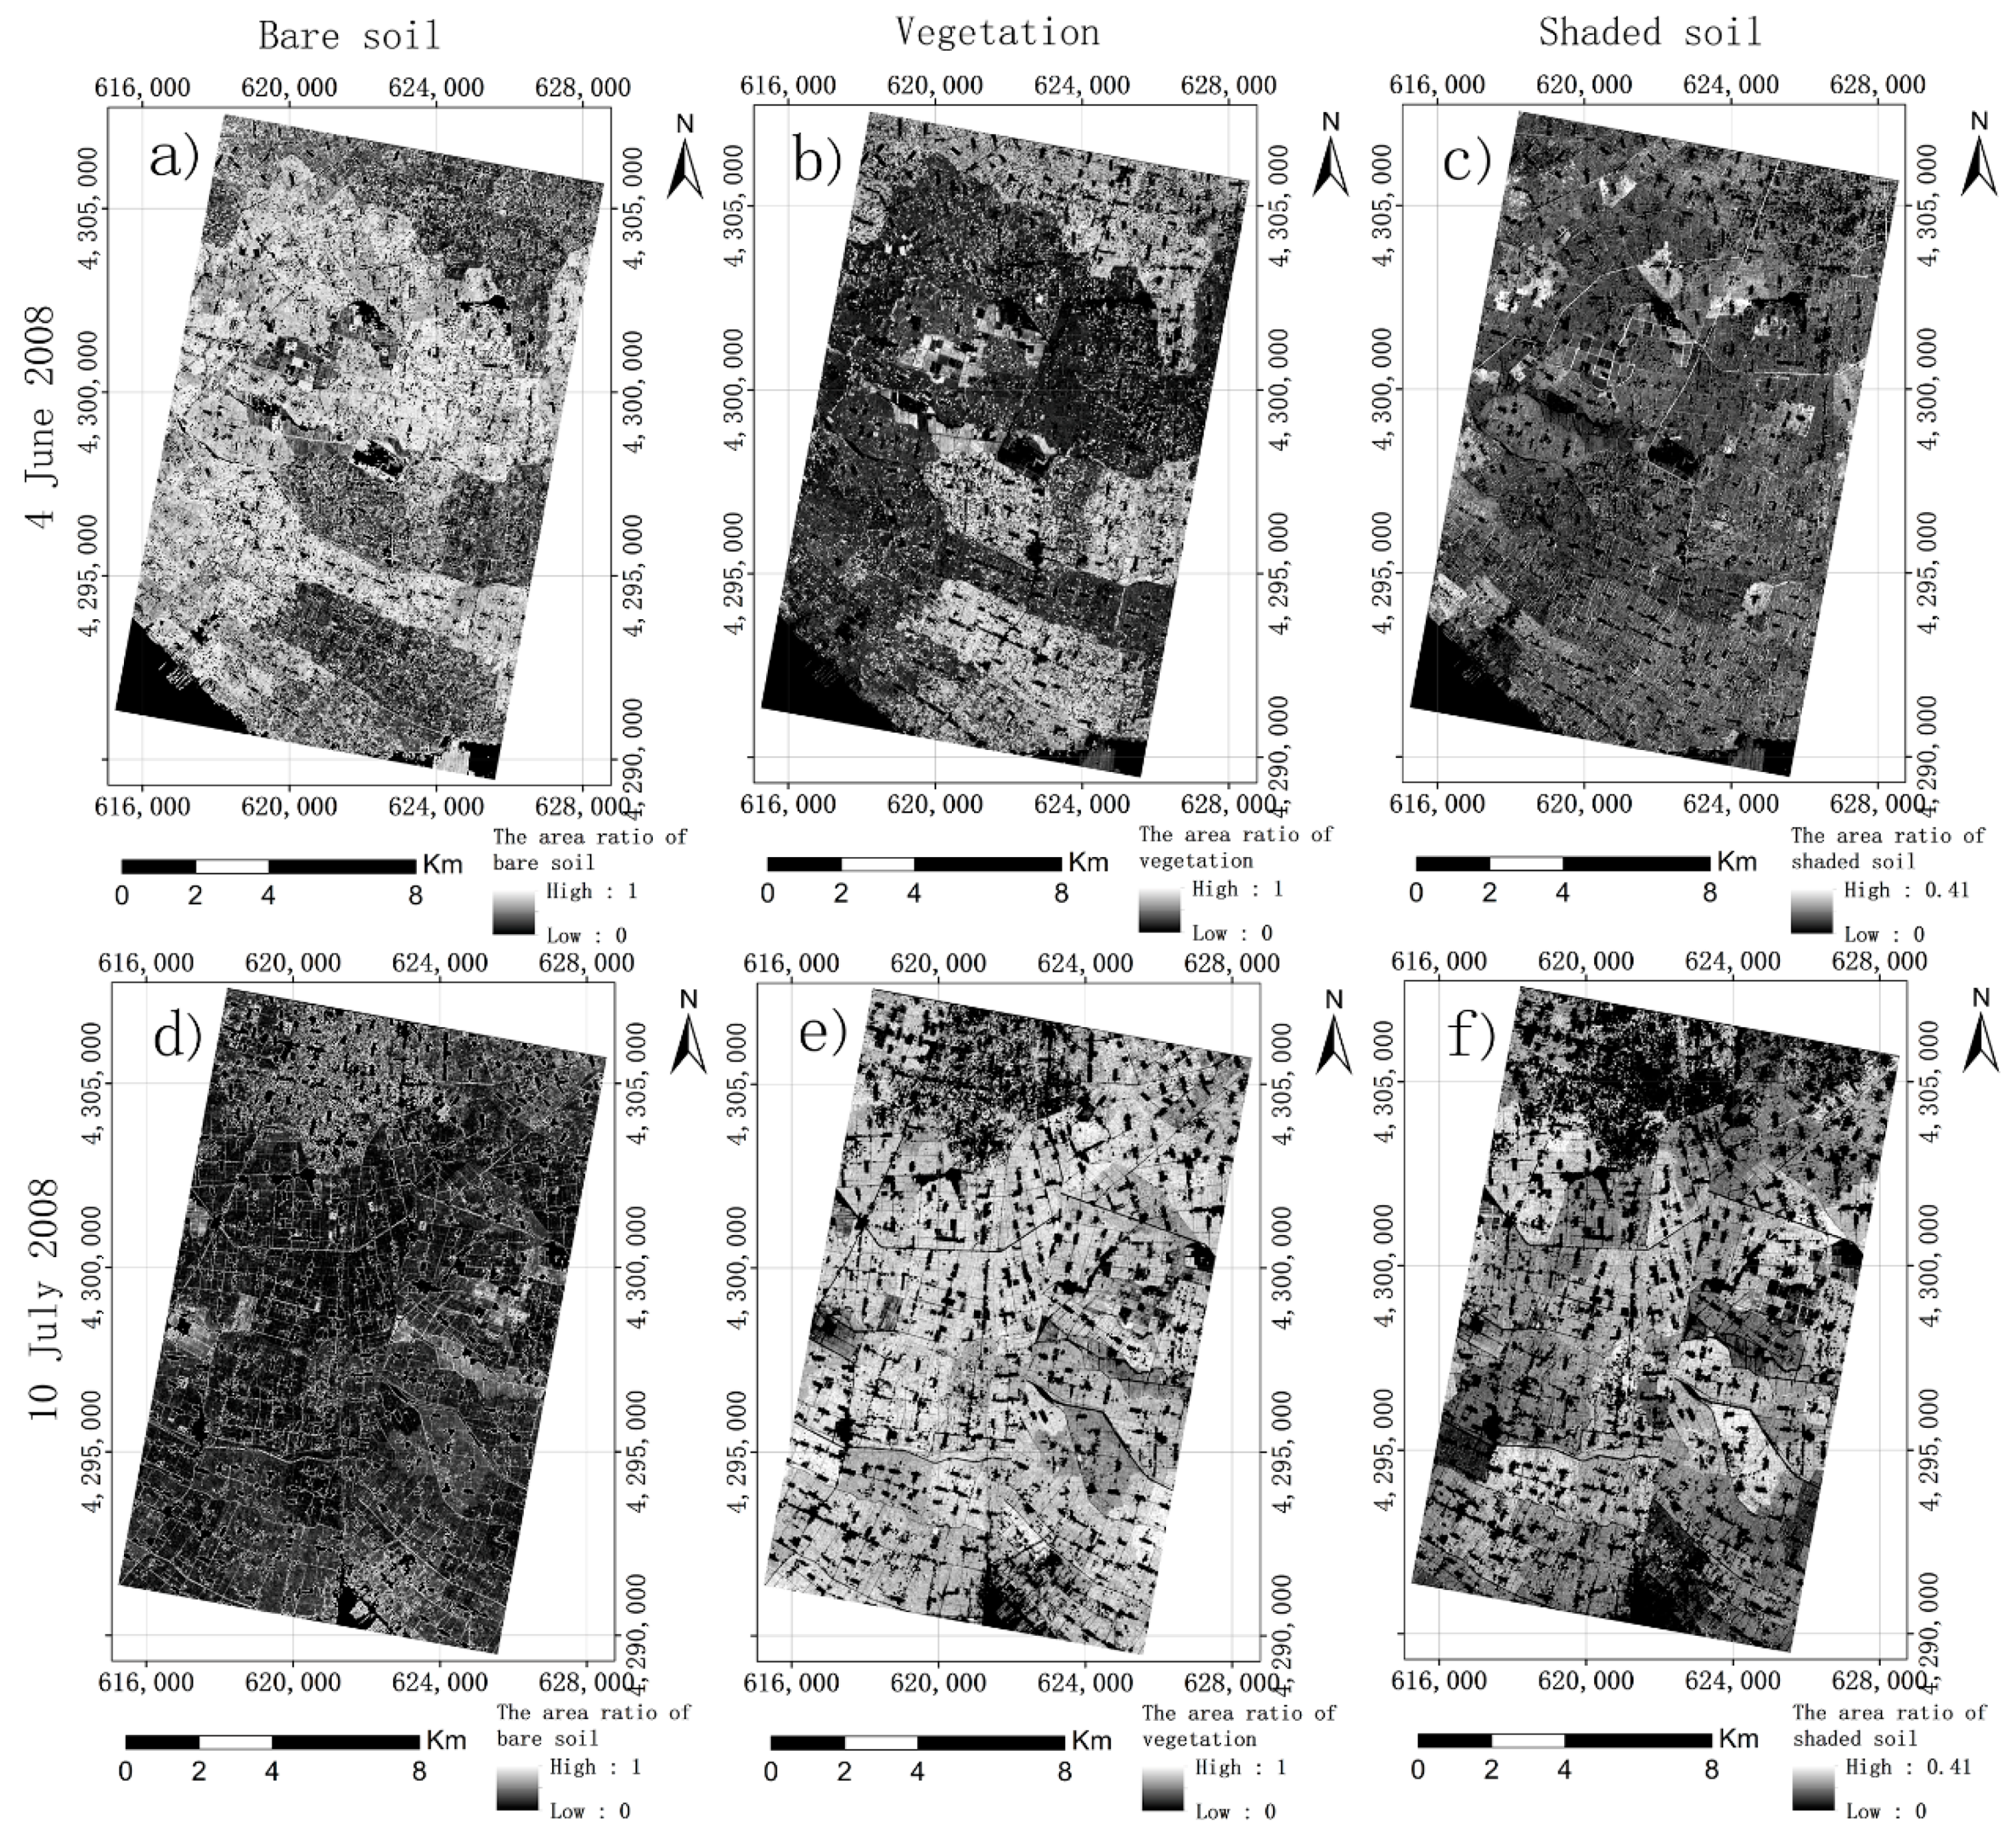
where   ρ i   is the spectral reflectance of a mixed pixel in the   i th band, and ρ vi , ρ bi , and   ρ di are, respectively, the spectral reflectance values of vegetation, bare soil, and shaded soil under vegetation canopy for the   i th band. In order to obtain more accurate spectral reflectance values, atmospheric corrections for the ASTER band 1, band 2, and band 3 were carried out by the Modtran model. Then, a linear spectral unmixing analysis was applied to derive the area fractions ( f v ,   f b , and f d ) of vegetation canopy, soil, and shaded soil (Figure 7). Due to the lack of field measurements of three area fractions, a total of 32 sample areas was randomly selected. The spectral reflectance values of the mixed pixels were estimated based on the linear combination of the area fractions with the spectral values of the pure pixels as the training samples for three endmembers. The obtained estimates were compared with the actual values of the mixed pixels, and the determination coefficients were used as an indirect validation of the area fractions. It was found that the mean coefficients of determination varied from 0.78 to 0.85 for the ASTER band 1, band 2, and band 3 dated on June 4th and July 10th of 2008. This indicated that the area fractions obtained using the linear spectral unmixing analysis were potentially reliable.
In order to obtain the unknown parameters ( T vi ,   T bi ,   T di ,   ε vi , ε bi , and   ε di ) in Equation (5), the GA that solves nonlinear optimization problems was driven. The convergence property and speed of GA depended mainly on the given parameters, including the population size, mutation probability, crossover, etc. Because the input parameters of GA are not biophysically and mathematically meaningful, a random trial was utilized to search for the most accurate parameters [34]. In this study, the initial parameters of GA were set as follows:   ε bi ∈ [0.85, 0.92], ε di ∈ [0.80, 0.95], ε vi ∈ [0.95, 1.00], T bi ∈ [273, 326], T di ∈ [273, 306], and T vi ∈ [273, 310]. The number of the maximum runs and the input parameters for the population size, crossover probability, and mutation probability were 250, 128, 0.9, and 0.02, respectively. The resulting temperatures are demonstrated in Figure 8.

3.3. Soil Latent and Sensible Fluxes

The soil thermal transfer equation was driven to obtain the surface soil inertia, which needed the soil sensible flux, soil latent flux, and net radiant flux. In the bare soil, the soil sensible flux was obtained from Equation (6). Here, r as was estimated from an experimental model [37]:
r as = 4.27 ln 2 ( h z 0 m ) ( 1 + 0.54 u )
where h is the height for measuring air temperature and wind speed u above the canopy height of 2 m. As the roughness length for momentum transfer, z 0 m   equals to 0.01 m. The measured wind speed above the canopy height is 3.92 m/s. The bare soil sensible flux is shown in Figure 9a.
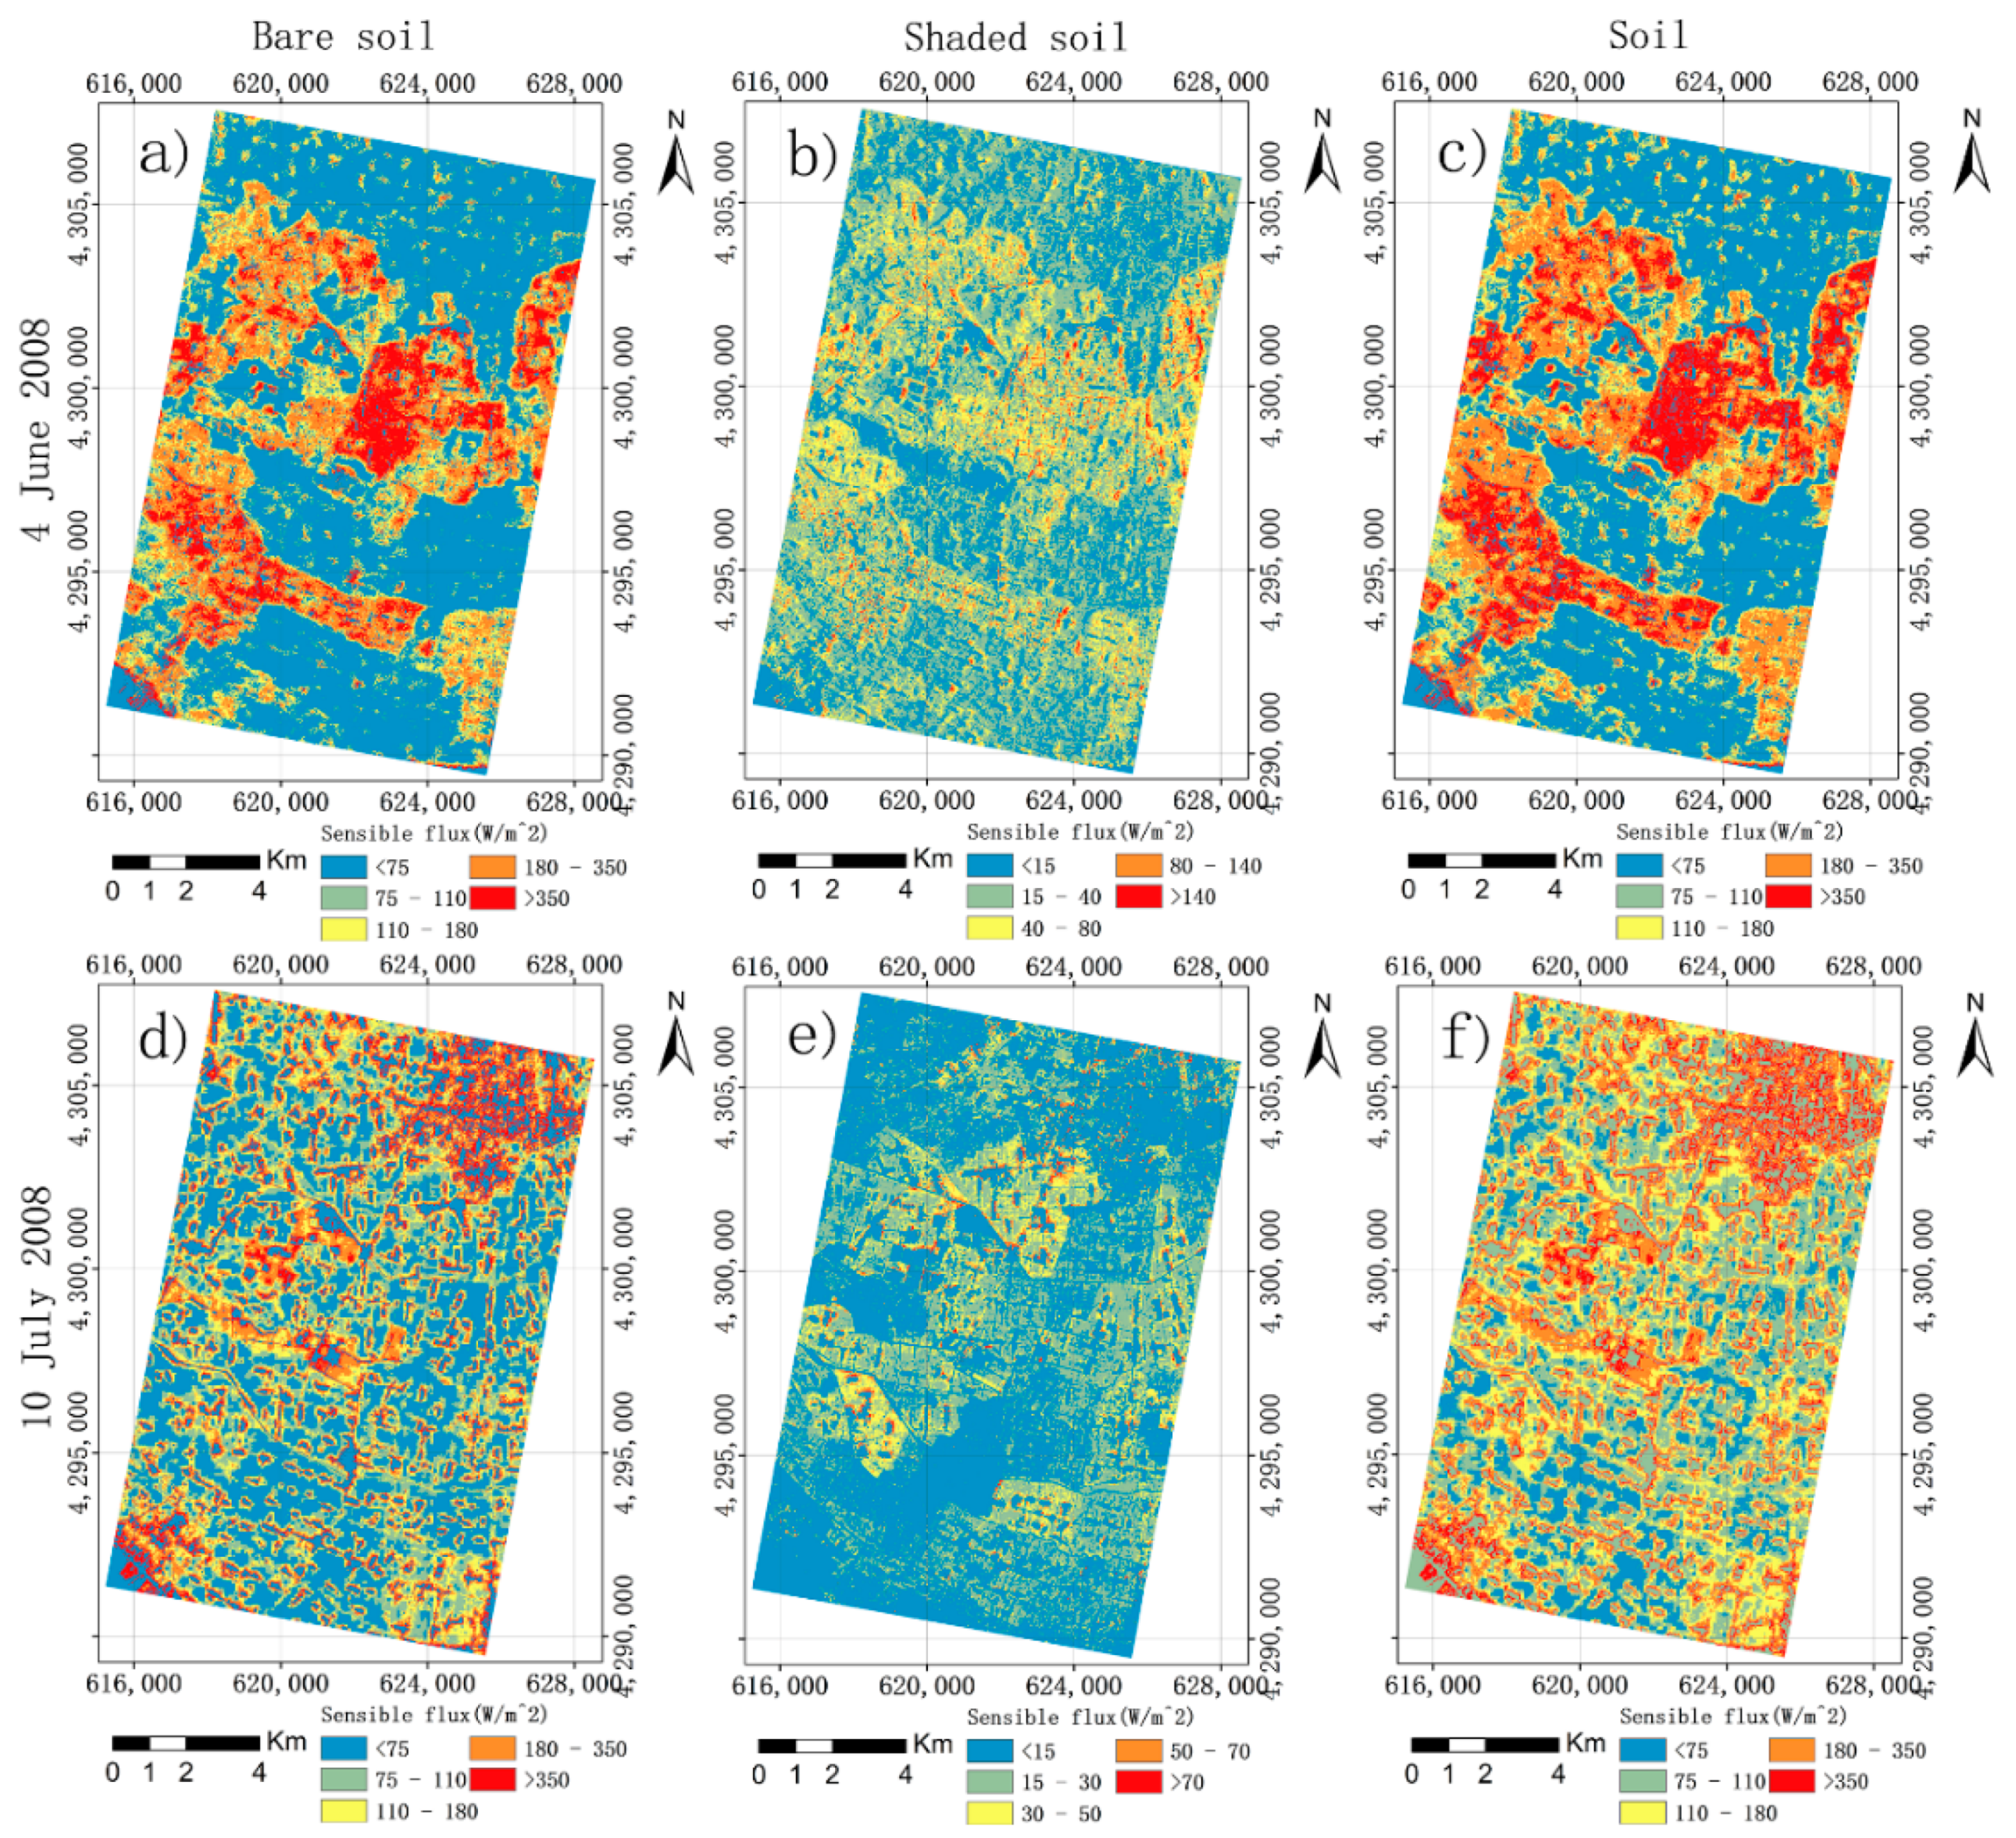
In the vegetated area, the shaded soil sensible flux was obtained from Equation (9) based on the TSEB described by Cammalleri et al. [35]. The r sc in Equation (9) was estimated using the model in the studies of Kustas and Norman and Kondo and Ishida [40,45]:
r sc = 1 c ( T s T c ) 1 / 3 + b u s
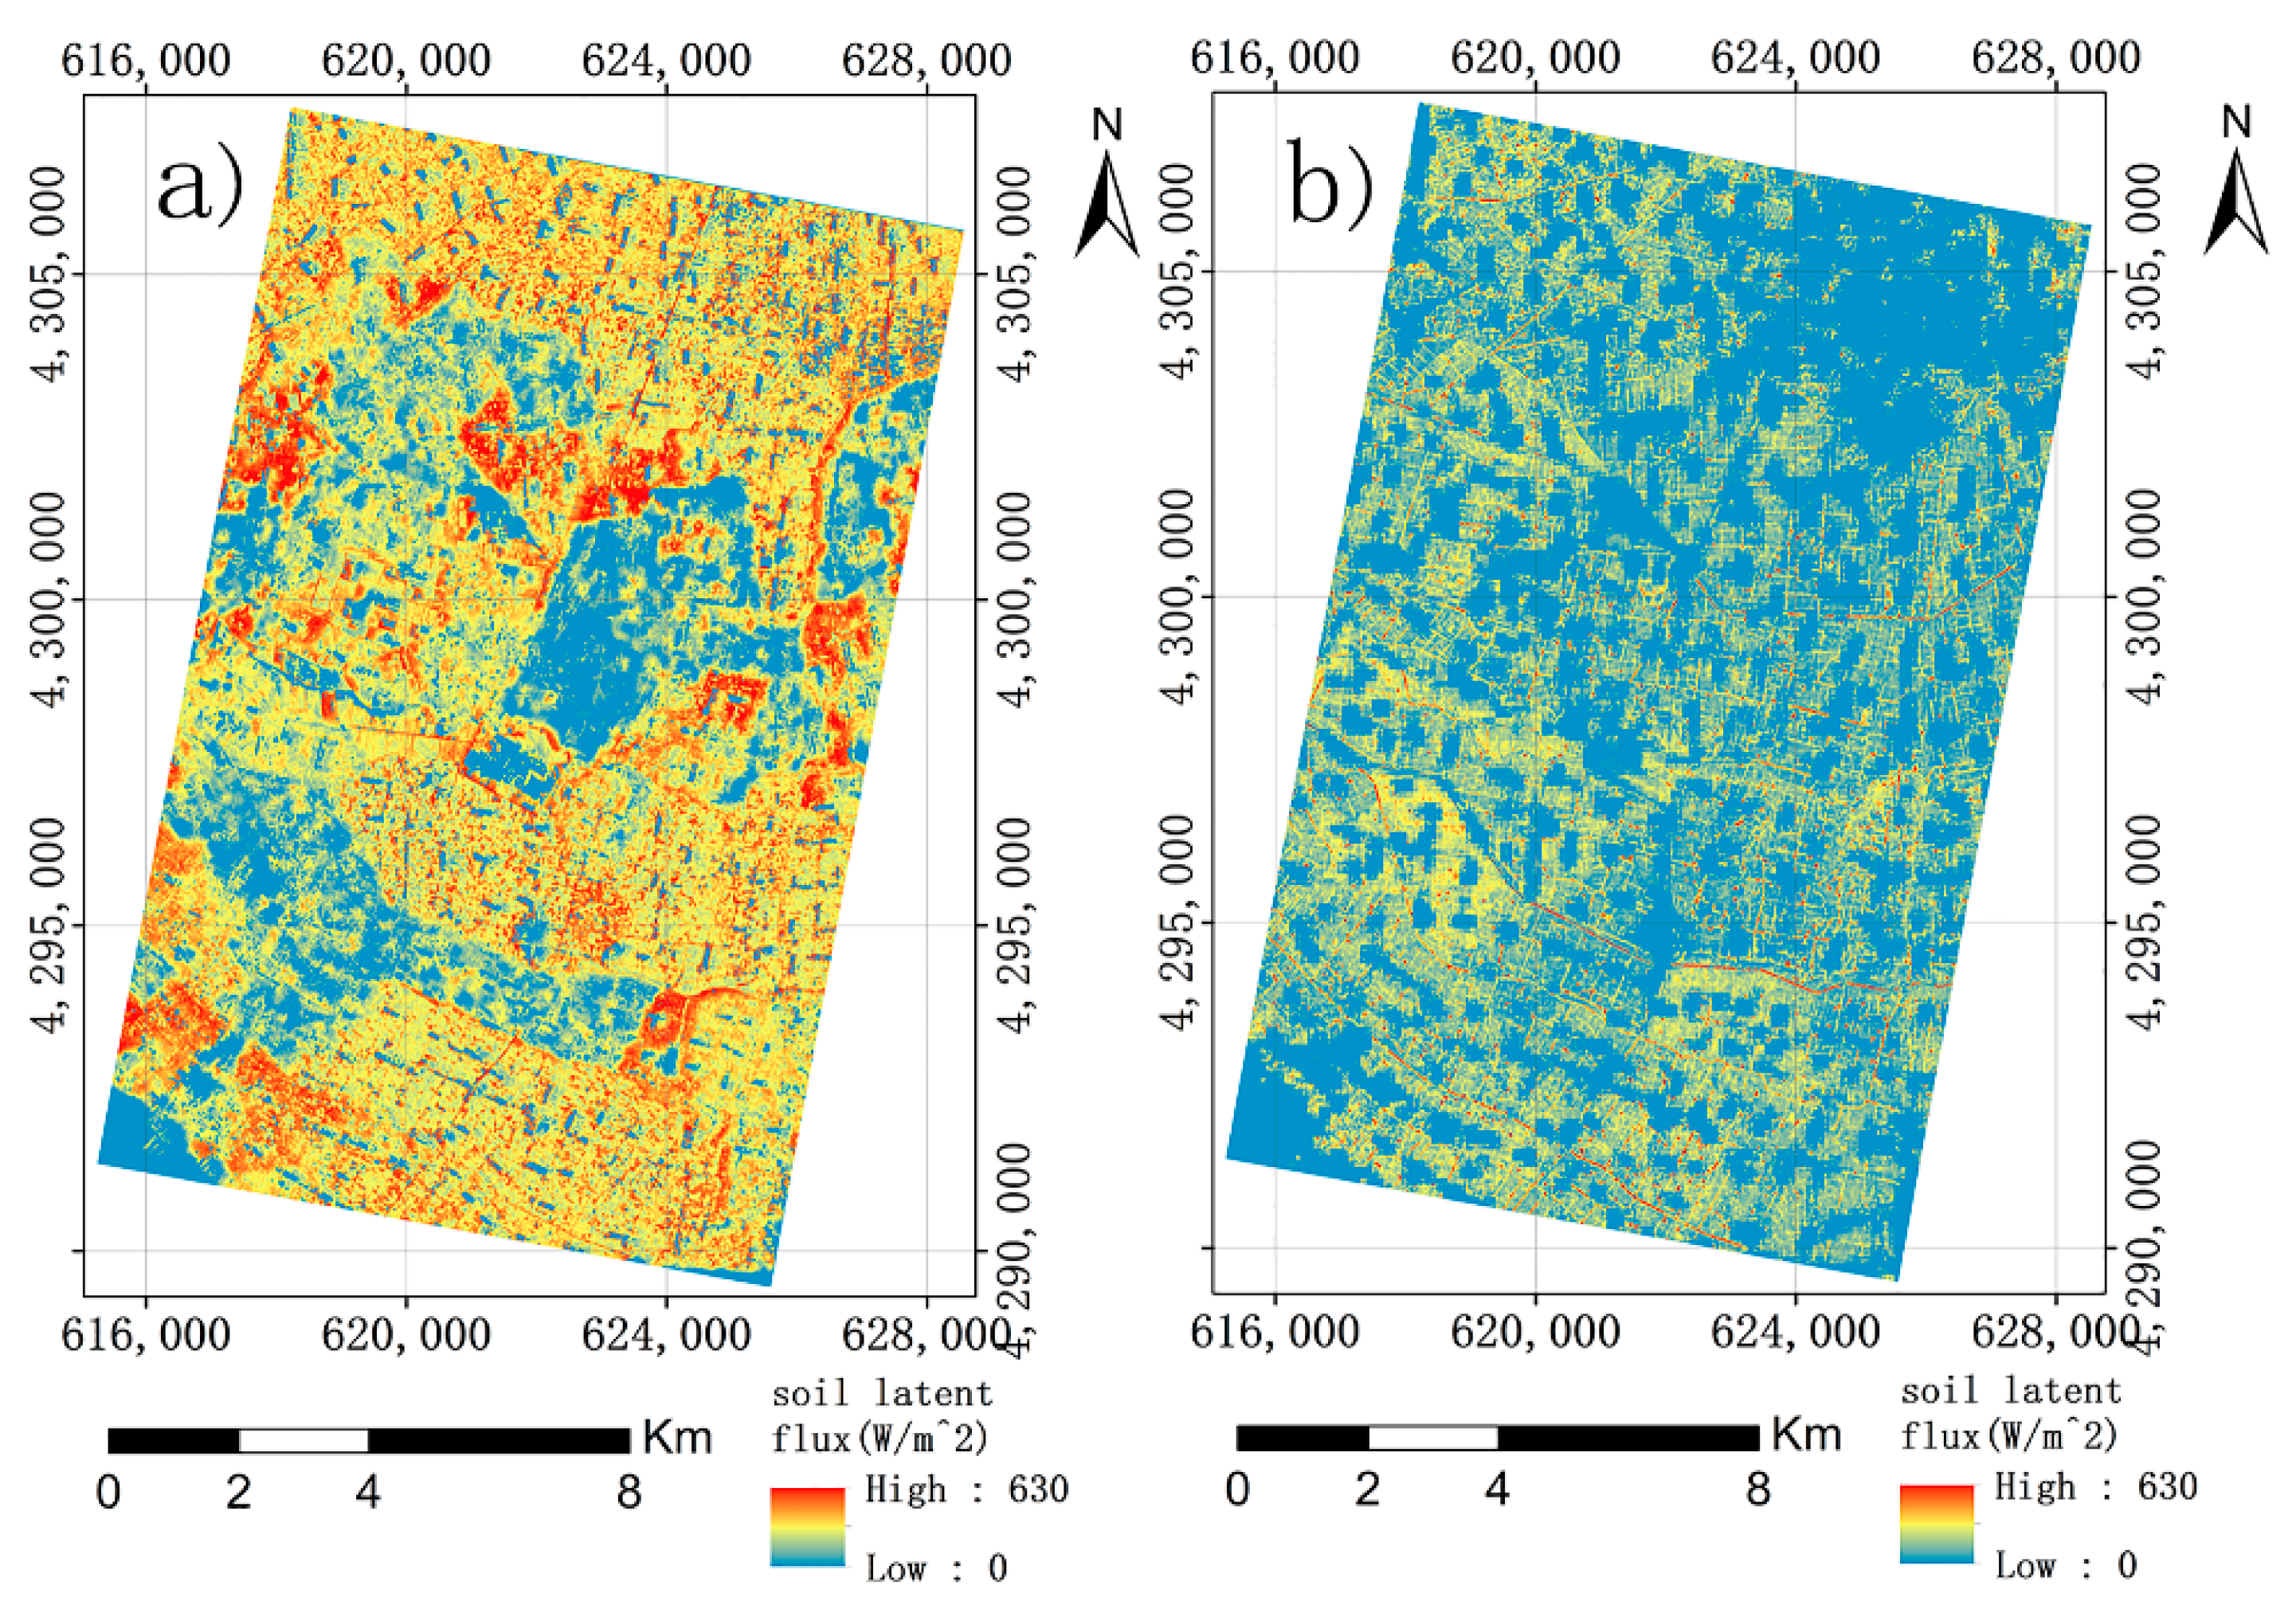
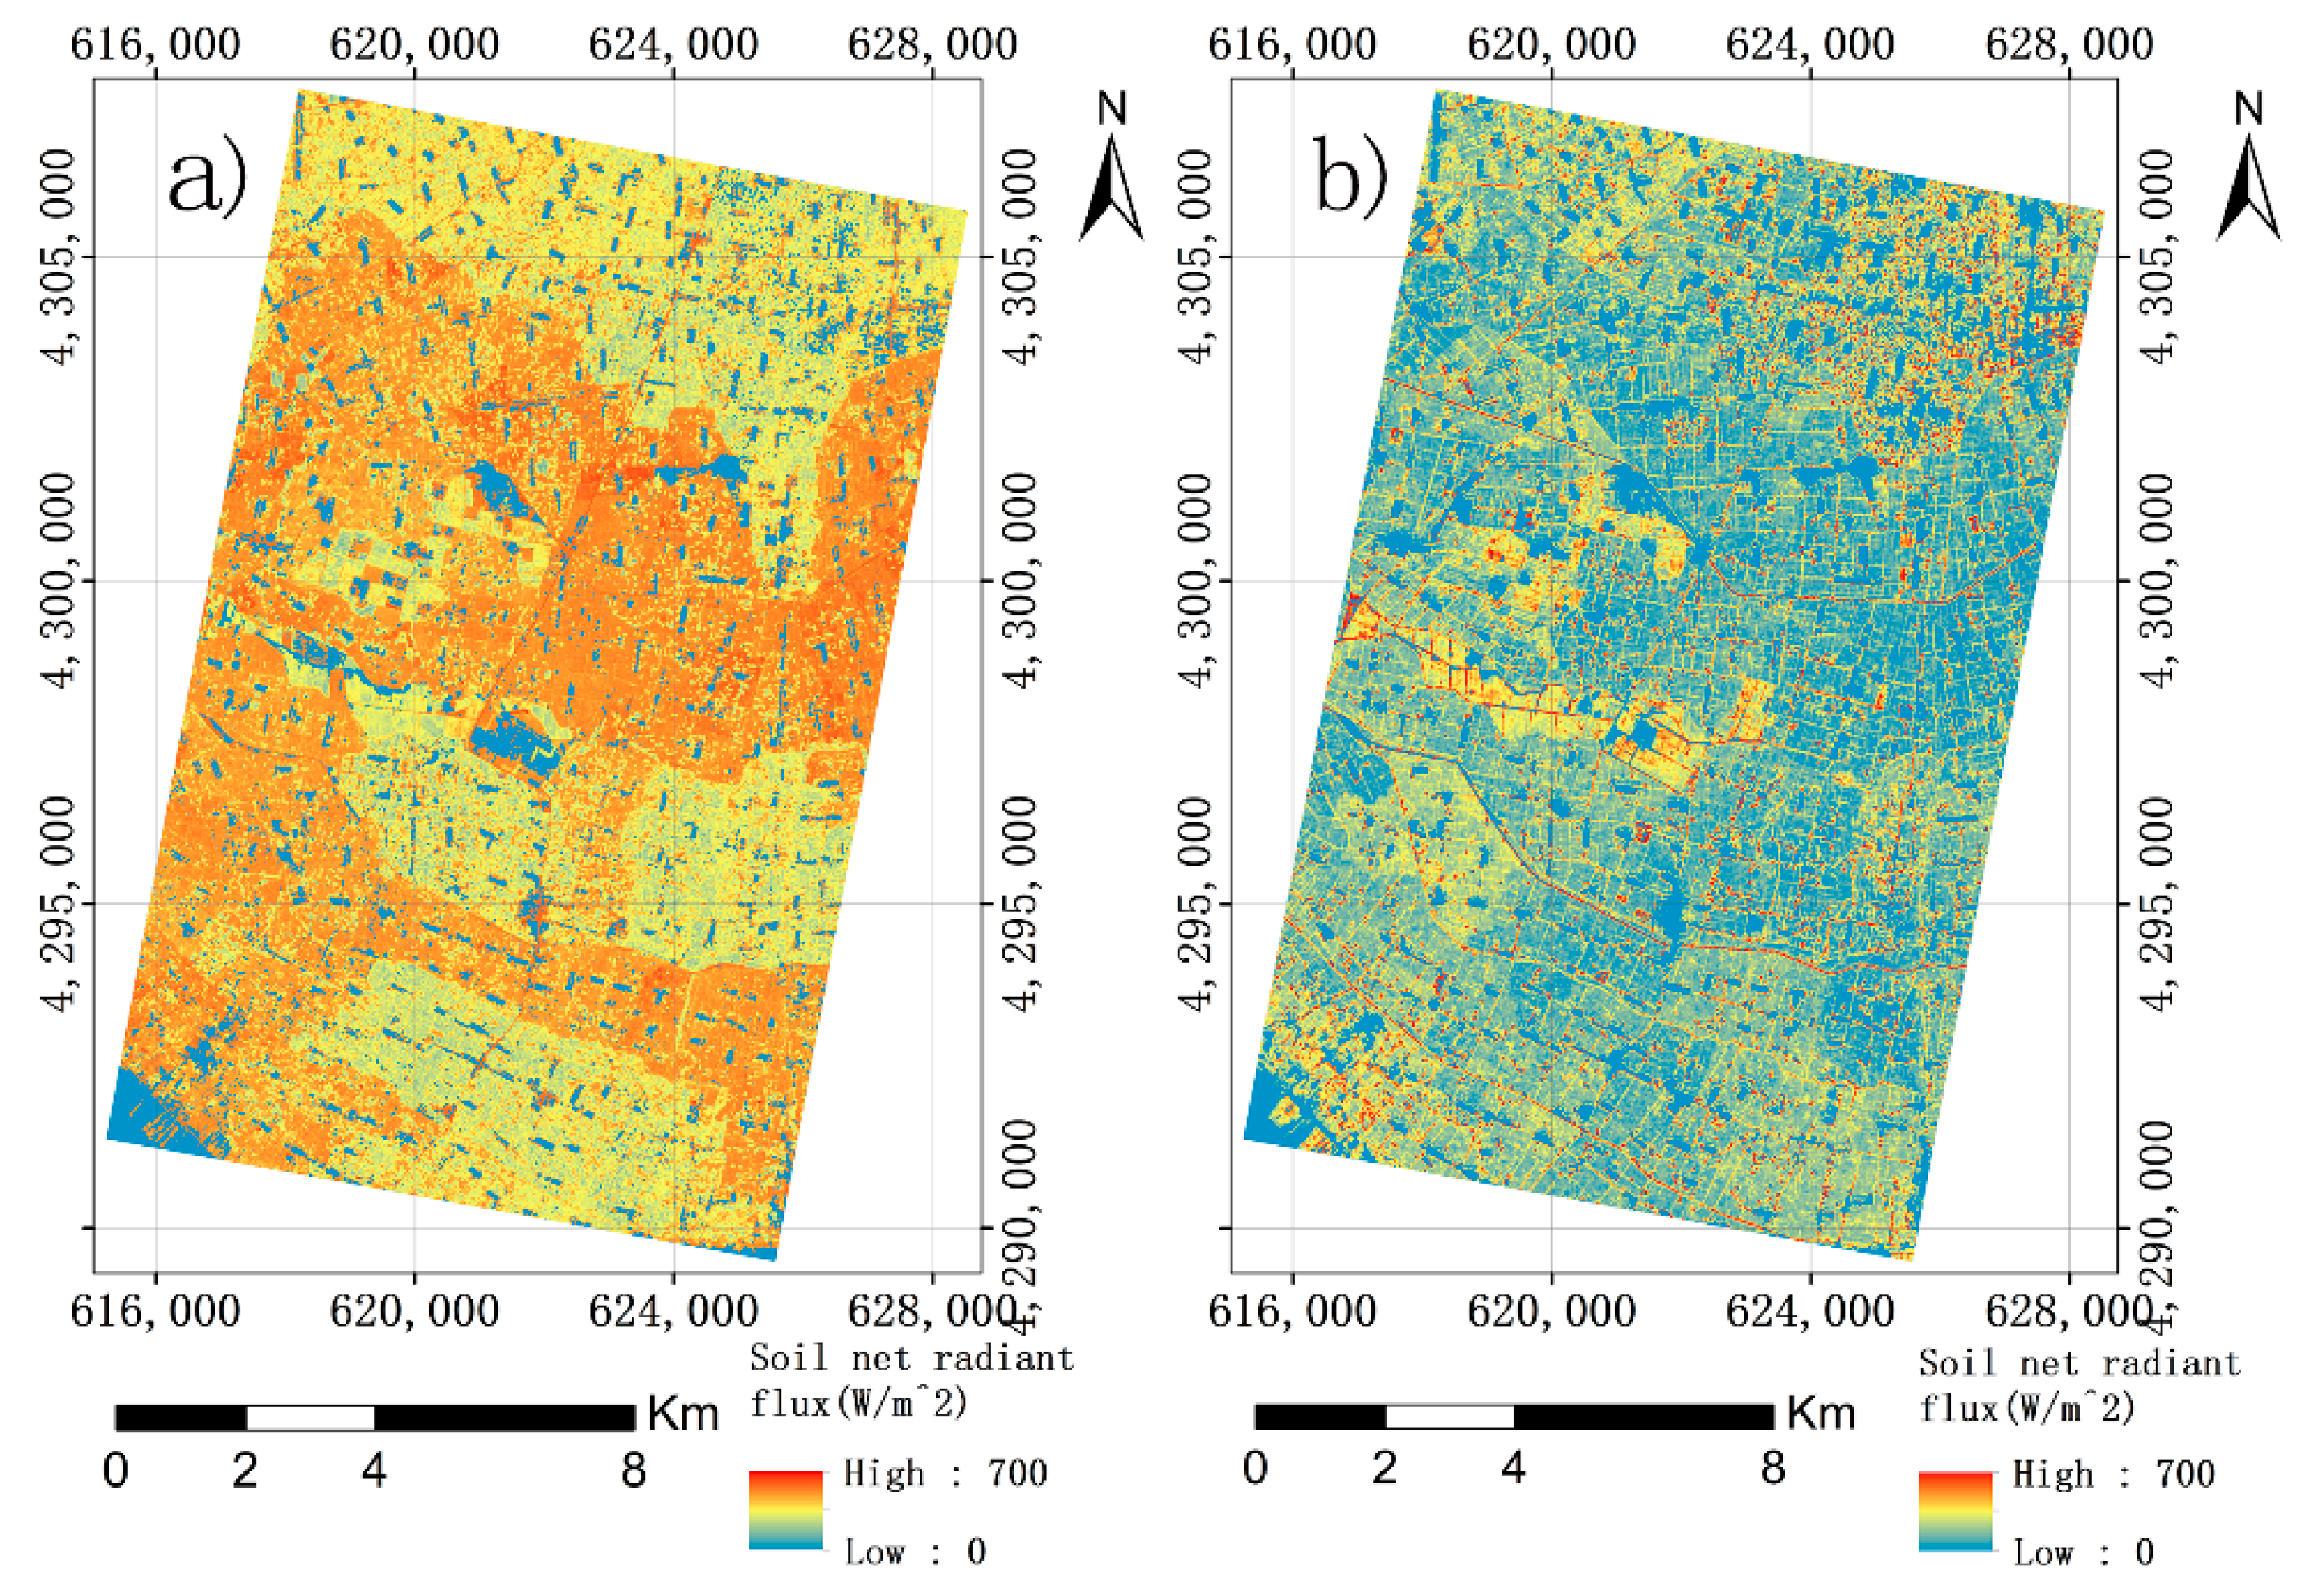
where b was set up to be 0.012 for natural surfaces, c is the coefficient and equal to 0.0025   m · s 1 · K 1 / 3   [46,47], and the measured surface wind speed ( u s ) is 1.2 m/s in the experiment field. The shaded soil sensible flux is shown in Figure 9b. Thus, the total soil flux of the sensible heat for the whole surface was estimated as the sum of the shaded soil sensible flux and the bare soil sensible flux in Figure 9c. Moreover, Equations (10) and (11) were respectively used to derive the values of soil latent flux and the soil net radiant flux that are shown in Figure 10 and Figure 11.

3.4. The Estimation of Surface Soil Moisture Content

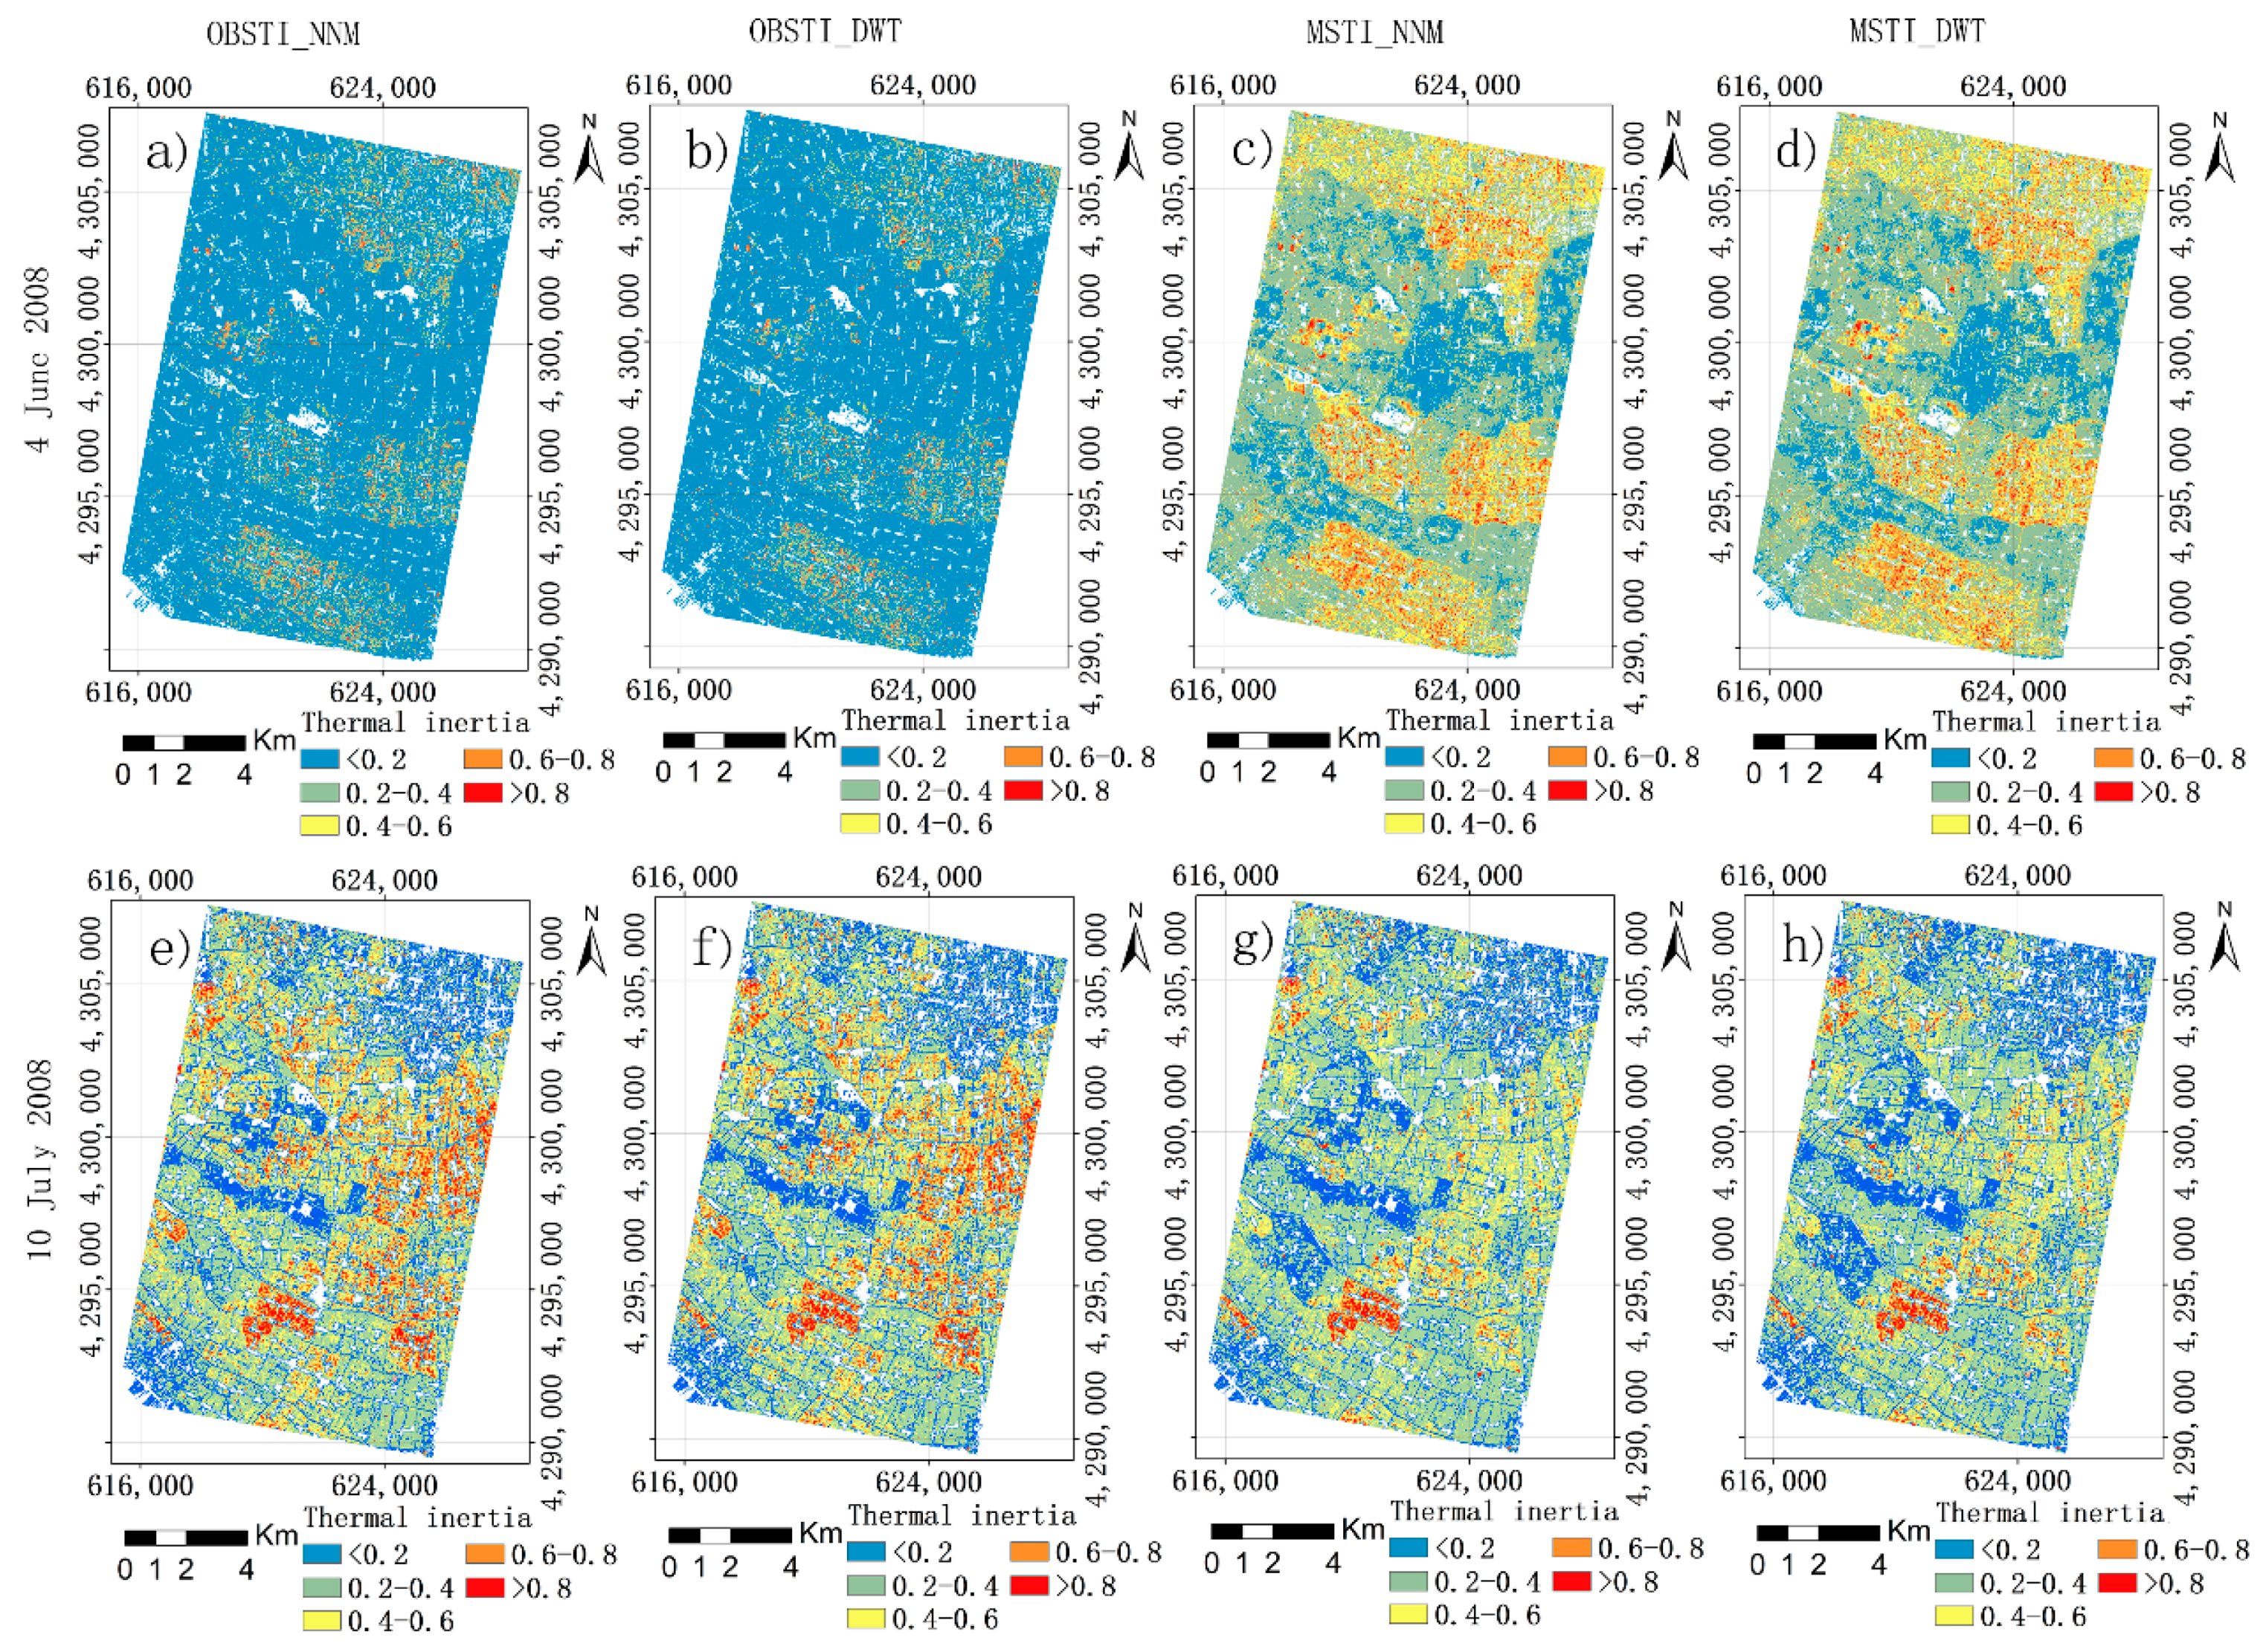
Based on the obtained spectral albedo, sensible flux, latent flux, and temperatures, Equation (7) for soil sensible flux under vegetation cover and Equation (8) for canopy sensible flux were used to estimate the STI and the bare STI using two 15 m spatial resolution TIR images by NNM and DWT. In this study, the thermal inertia varied from 0 to 1. The spatial distributions of the normalized STI for four combinations formed by the original and modified STI models and two 15 spatial resolution images are shown in Figure 12.
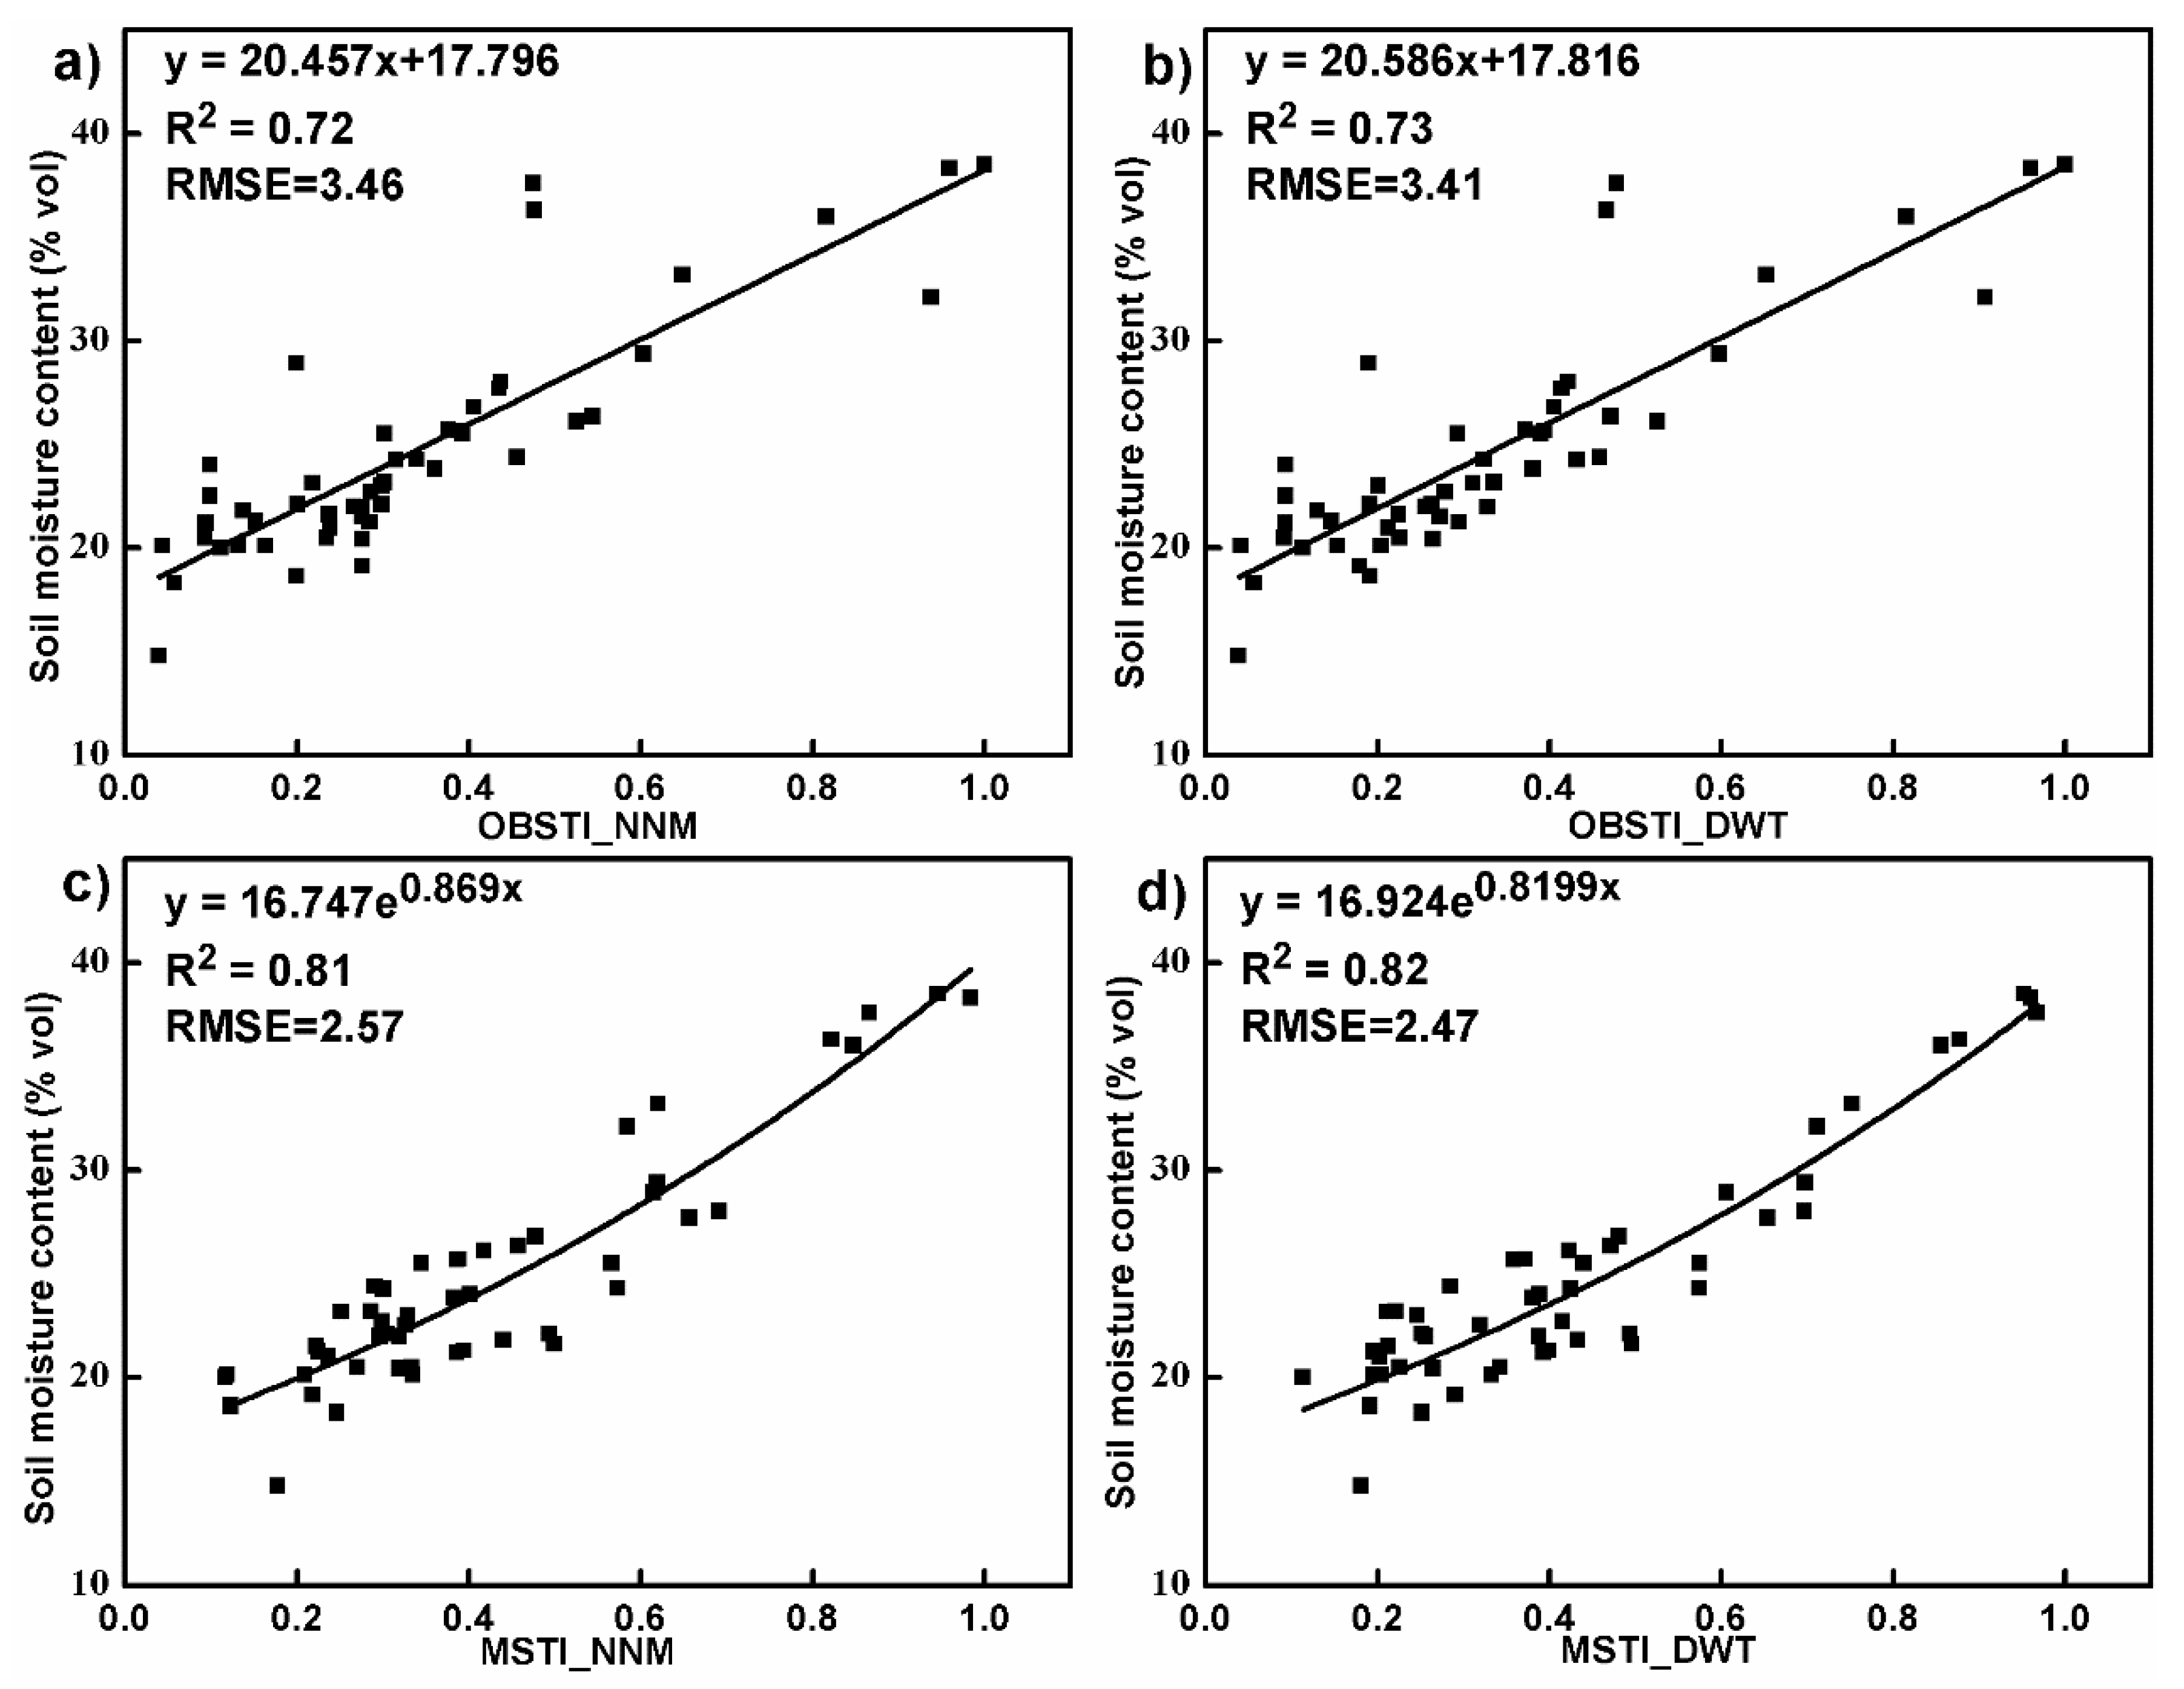
After STI was obtained using the downscaled images, the regional-scale SMC was generated using the obtained relationship of STI with SMC. In this study, the relationship was modeled and optimized by comparing a linear model, a logarithm model, a power model, and an exponential model in Table 1. A leave-one cross validation method was utilized to select the most accurate model.
For OBSTI_NNM and OBSTI_DWT, there were no statistically significant differences of RMSE among the four models, and the linear model led to slightly smaller RMSE value (Table 1). On the other hand, the exponential model resulted in the most accurate estimates of SMC for both MSTI_NNM and MSTI_DWT, and their RMSE values were statistically significantly smaller than those using the logarithm and power models but not than that using the linear model. Thus, the exponential mode most accurately accounted for the relationship of SMC with the modified-model-based STI, while the linear model most accurately explained the relationship of SMC with the original-model-based bare STI. The results of the models are shown in Figure 13. Given the same model, the image obtained by DWT only slightly reduced the RMSE values compared with that by NNM.
The spatial distributions of SMC estimates derived using the original and modified models with 15 m resampling and fusion spatial resolution TIR bands were compared in Figure 14. Given the original model, the SMC estimates from the image dated on July 10th (Figure 14e,f) are overall greater than those from the image dated on June 4th (Figure 14a,b), while for the modified model, the SMC estimates from the image dated on July 10th (Figure 14g,h) are slightly smaller than those from the image dated on June 4th (Figure 14c,d). In June and July, the study area was dominated by wheat and corn, respectively. The SMC varied very much depending on the canopy density of the crops. Generally, the crop-dominated areas had greater SMC values. In addition, precipitation also affected the SMC values. Given the same model (the original or modified model) and the same image date (June 4th or July 10th), the spatial patterns of the SMC predictions looked similar (Figure 14a vs. Figure 14b, Figure 14c vs. Figure 14d, Figure 14e vs. Figure 14f, Figure 14g vs. Figure 14h,). However, the 15 m fusion image by DWT resulted in slightly more detailed information of SMC prediction.
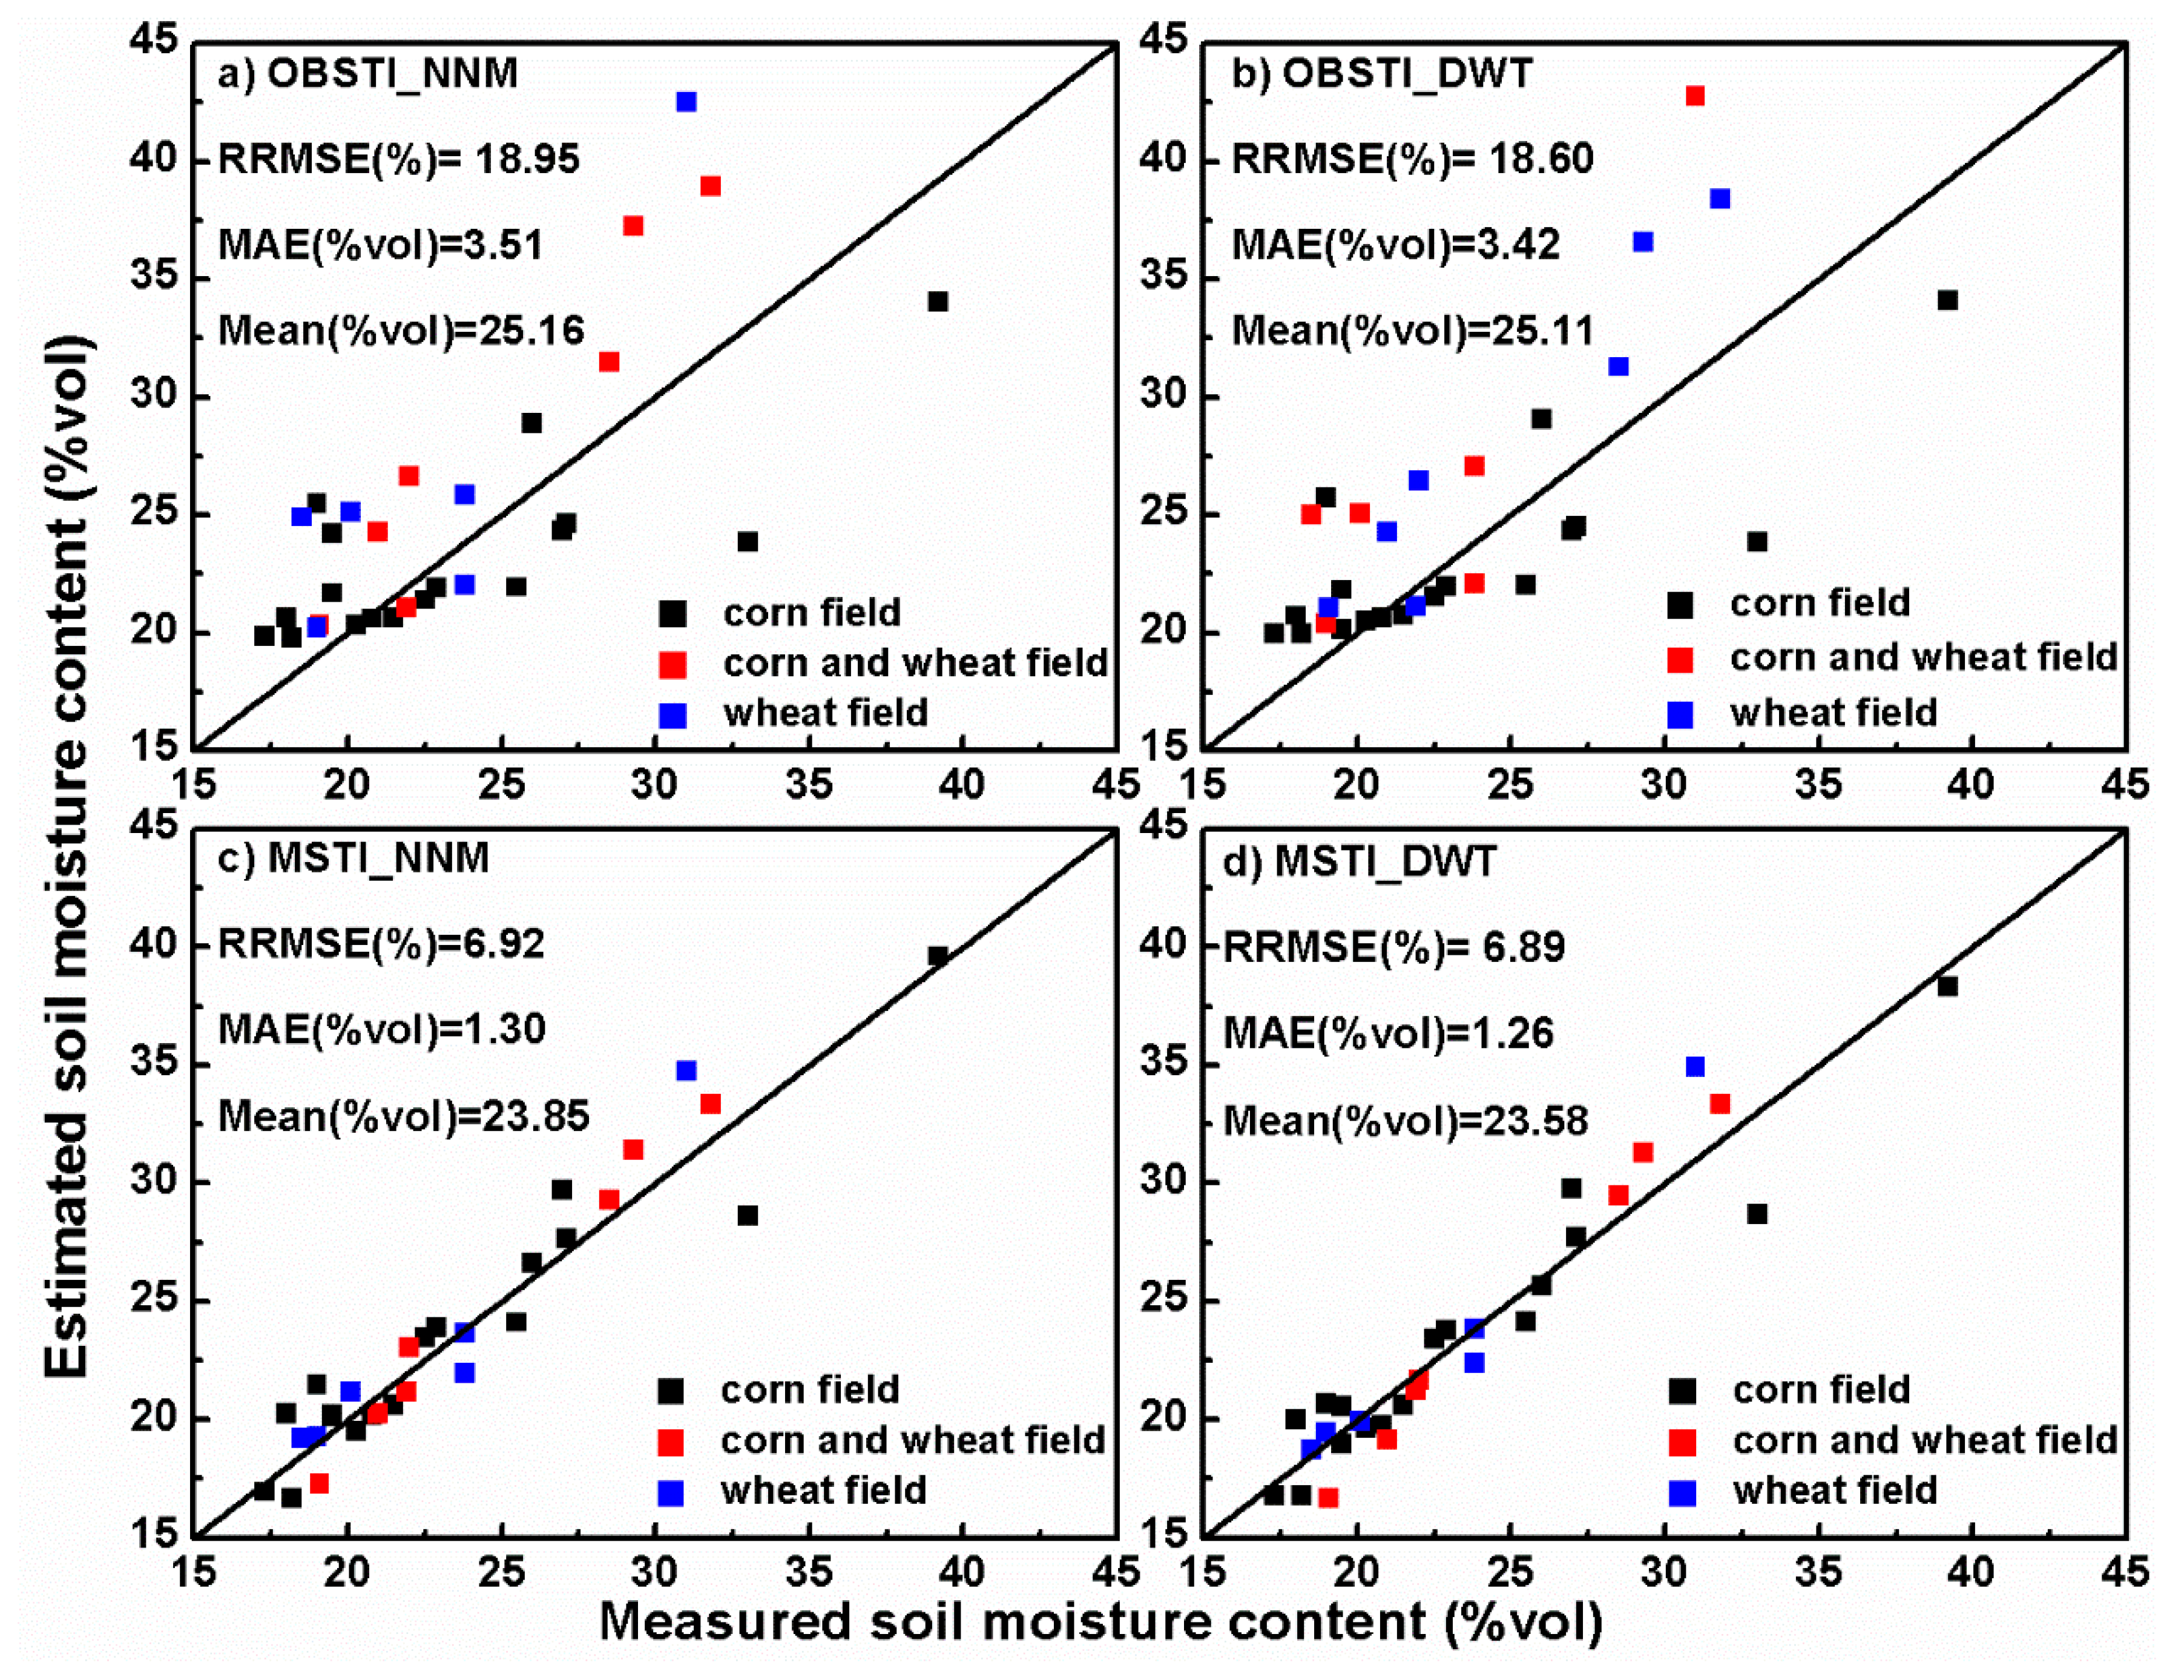
A total of 30 test soil samples was utilized to evaluate the SMC estimates from the ASTER data by calculating MAE and RRMSE between the observations and estimates in Figure 15. The sample mean of SMC was 23.57% with a standard deviation of 5.80% and a confidence interval of 21.56–25.58% at the significance level of 0.05. All the mean estimates of SMC statistically did not significantly differ from the sample mean, but the mean estimates of 23.85% and 23.58% from the modified model with the 15 m spatial resolution images by NNM and DWT, respectively, were closer to the sample mean than those from the original model. Moreover, the original model without the consideration of the effect of vegetation-induced shadows on estimation of SMC led to an MAE of 3.51% and 3.42% and RRMSE values of 18.95% and 18.60% for the images by NNM and DWT, respectively, while the modified model resulted in a corresponding MAE of 1.30% and 1.26% and RRMSE values of 6.92% and 6.89%. The MAE and RRMSE values from the original model were statistically significantly larger than those from the modified model at a significant level of 0.05. This implied that the modified model significantly increased the estimation accuracy of SMC compared with the original model. Given the same model (the original or the modified model), however, the estimation accuracies of SMC by the images from NNM and DWT were statistically similar to each other.

4. Discussion

The widely used Apparent Thermal Inertia model was developed to estimate SMC using remotely sensed images in bare soil or scarcely vegetated regions [18,23]. Due to its ignorance of the effect from vegetation canopy-induced shadows, it cannot be applied to accurately estimate SMC in the densely vegetated areas. The STI model proposed in this study significantly contributed to the effort being made to improve the applications of the Apparent Thermal Inertia model from bare soil and sparsely vegetated areas to densely vegetated areas by introducing a vegetation-induced shadow component into the modified model using a spectral unmixing analysis. Some other models (e.g., real thermal model) were also devised to acquire the estimates of SMC in vegetated areas [24,26,27]. However, the models did not consider the serial dual-layer effectiveness for vegetated areas, and thus, the estimation accuracy of SMC retrieved by the models for vegetated areas was limited. The new approach provides a promising solution because it does not only take into account the effect of vegetation canopy-induced shadows, but also considers the serial dual-layer effectiveness for vegetated areas and used more detailed soil temperature information derived from the downscaled thermal images.
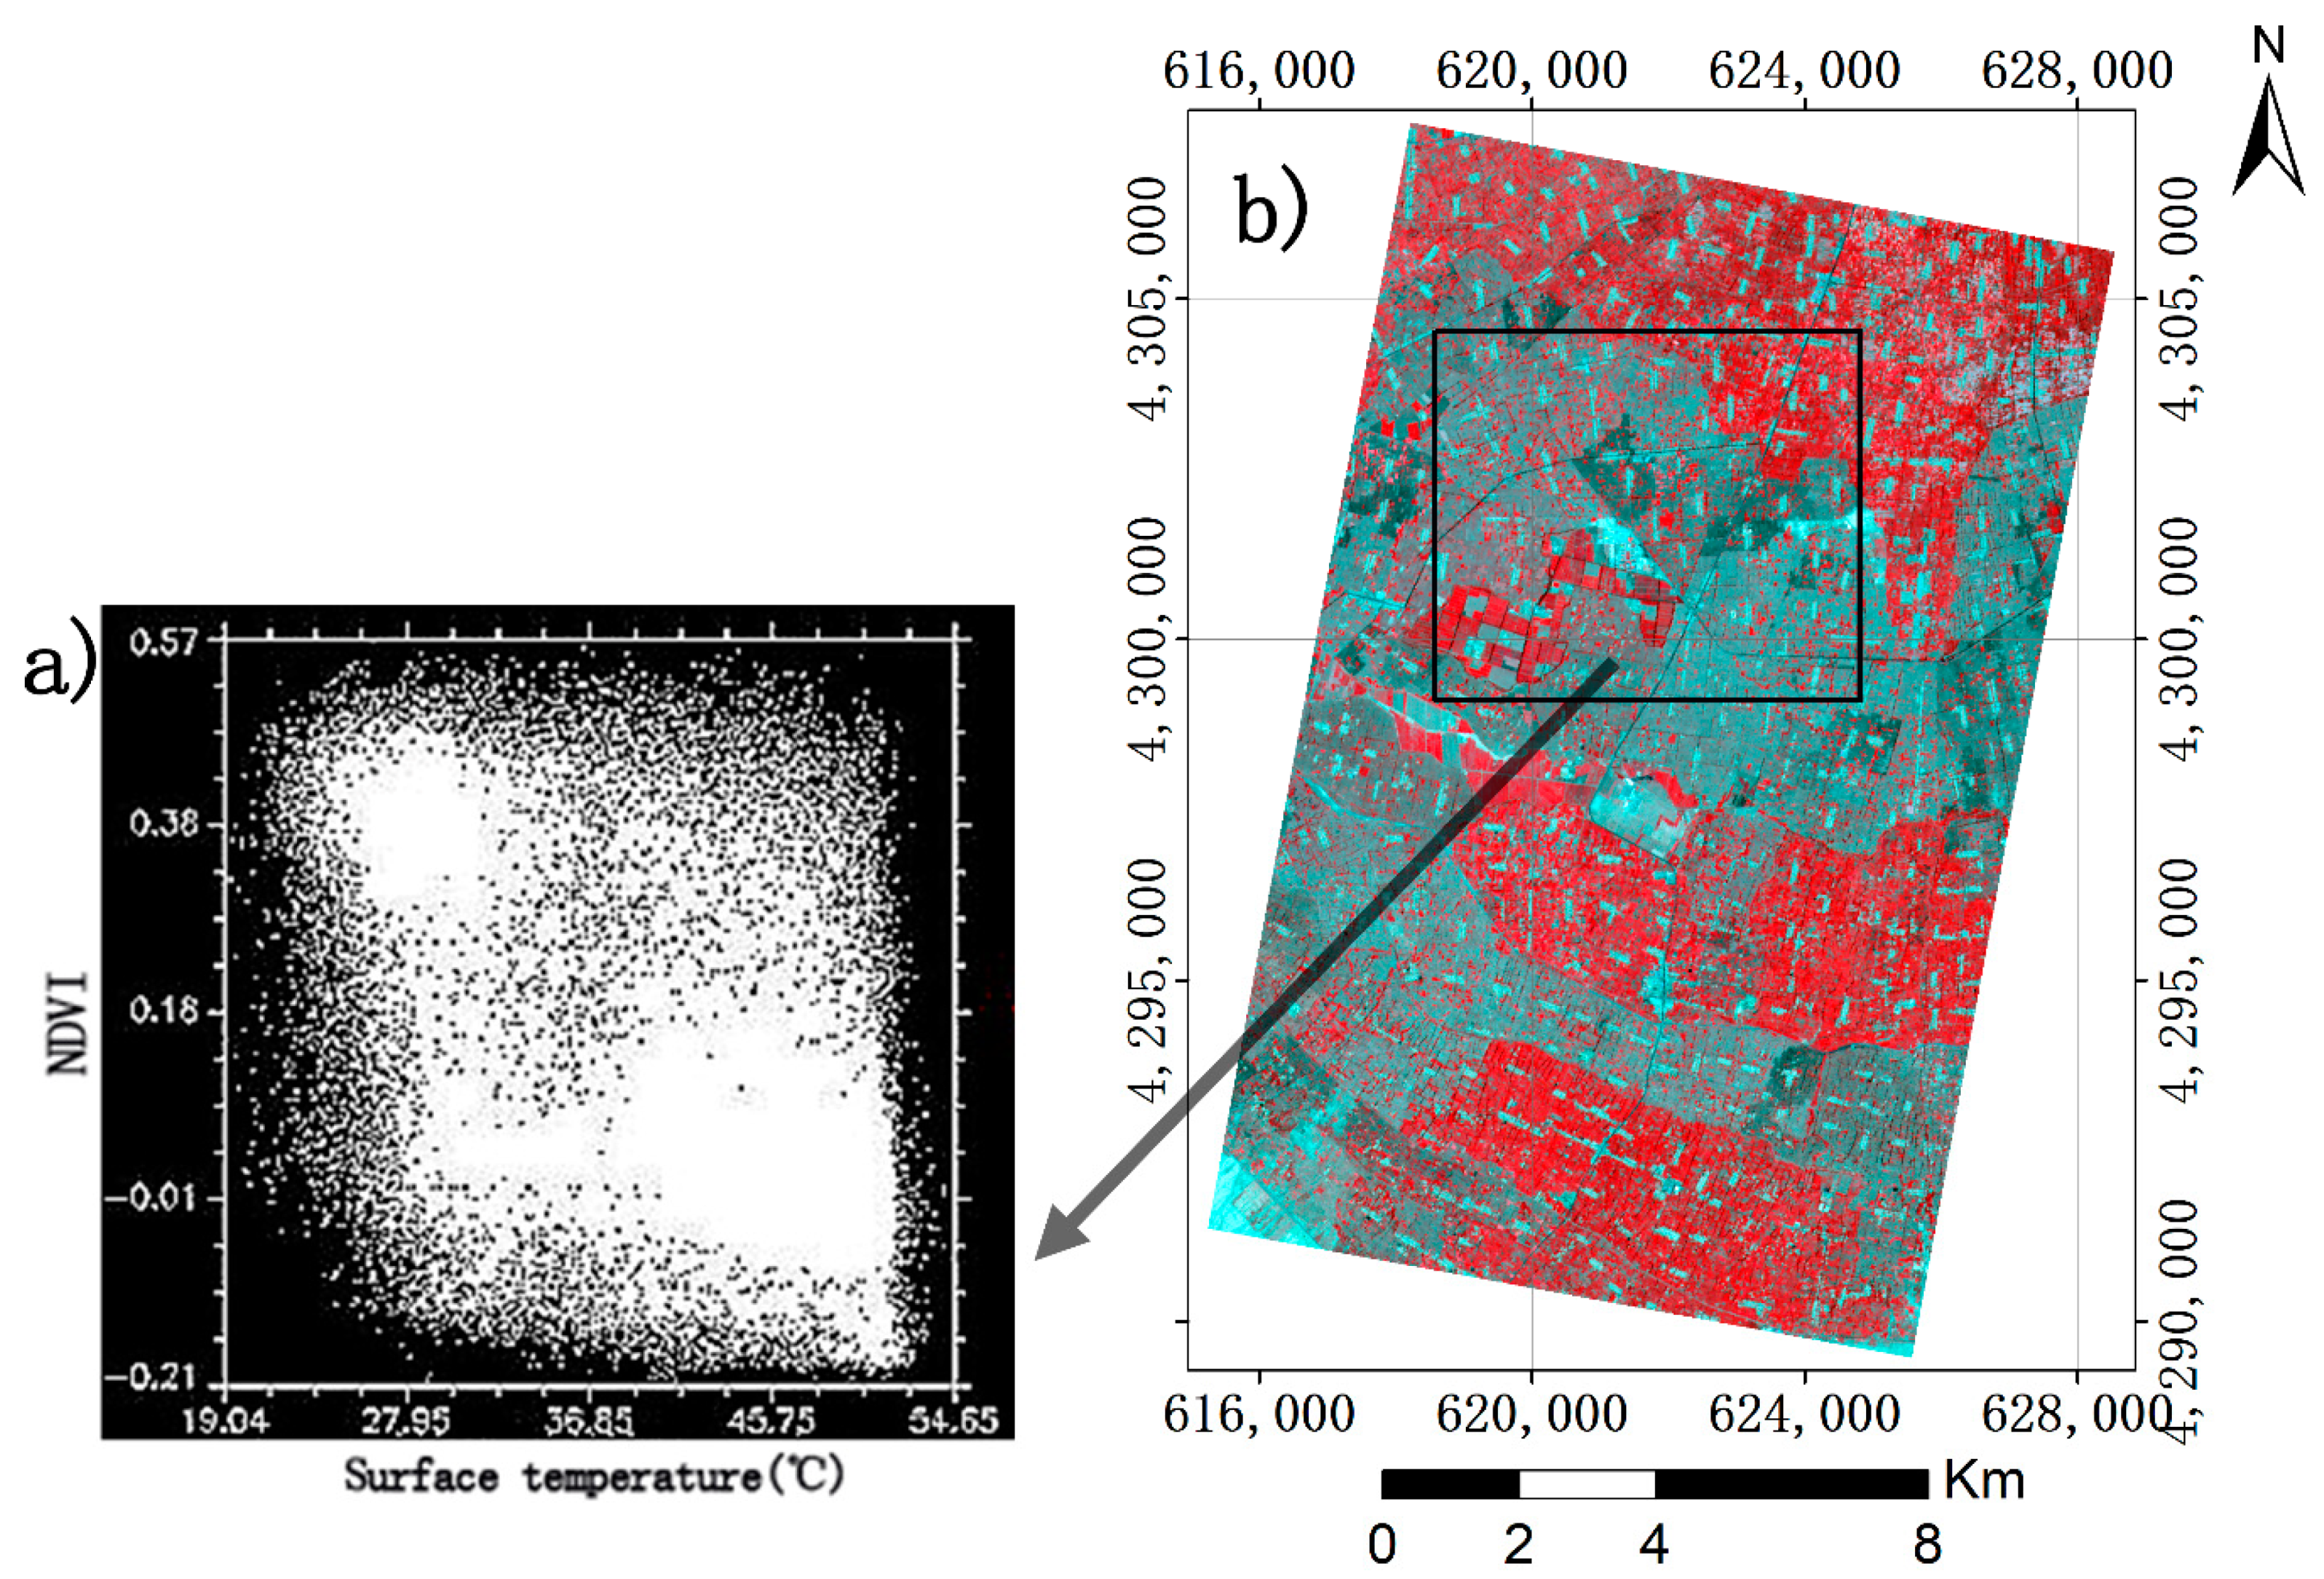
Moreover, Zhang et al. [4] used the information of red and near-infrared bands to develop a normalized difference vegetation index (NDVI)-albedo model and to retrieve the estimates of SMC, and the results were highly consistent with the field measurements at 5 cm soil depth. However, the limited penetration ability of the spectral reflectance might degrade the quality of SMC estimates. Because the estimates of SMC from the NDVI-albedo model were related to NDVI change, it was difficult to accurately estimate SMC in the irrigated areas using the NDVI-albedo model according to the widely spread triangular scatter distribution of the albedo values against the NDVI values (Figure 16). The approach proposed in this study improved the estimation of SMC in the irrigated soil areas because of using the thermal images and the consideration of the shadows under the vegetation canopies.
There were also some simple methods for the estimation of SMC using the relationships of thermal image-derived LST with NDVI and other vegetation indices [4,48]. However, the LST-NDVI-based methods require a large number of SMC values that well characterize various land cover types, and the scatter plot of the LST against NDVI often has a wide spread (i.e., Figure 17) that cannot be utilized to accurately obtain the estimates of SMC. The proposed approach in this study modeled the relationship of SMC with STI and the values of STI were derived using the modified model in which the shadows of vegetation canopies were extracted by the shade fraction from the spectral unmixing analysis. That is, the improved inertial model (Equation (4)) theoretically takes into account bare soil, vegetated soil, and shaded soil to obtain the estimates of shaded soil latent and sensible fluxes in the vegetated areas. Thus, it has no limitations of empirical model data and can be applied to other areas with any kind of vegetation types and canopy densities.
In this study, the values of SMC obtained by four inertial methods in bare soil regions varied relatively little. However, in the vegetated area, there was a great variation, and the values of SMC from the modified models MSTI_NNM and MSTI_DWT were closer to the field measurements than those from the original models OBSTI_NNM and OBSTI_DWT, which attributes to the consideration of shaded soil effects. This further indicated that the modified model was more reliable to retrieve SMC. Moreover, although the 15 m spatial resolution thermal bands from DWT showed more detailed information than those from NNM, given the modified or original model, the former only slightly decreased the values of MAE and RRMSE compared with those from the latter (Figure 15). That is, the 15 m spatial resolution thermal bands obtained by DWT did not significantly improve the estimation accuracy of SMC compared to the 15 m spatial resolution thermal bands by NNM. The main reason might be due to the flat study area with relatively simple and uniform topographic and crop canopy features, in which most of the wheat and corn areas had sizes of larger than 90 m × 90 m, and thus, the DWT made the spatial information more available but did not significantly change the values of the thermal band pixels compared with those from NNM.
It had to be pointed out that in the modified model of this study, the relationship of soil moisture with the modified model derived STI was most accurately fit by an exponential model. The exponential model showed a statistically significant relationship of using STI to estimate SMC, but lacked a clearly biophysical mechanism, which might have limited the capacity of its predictions in the case of no field measurements available. On the other hand, when the modified model is applied to other regions, its calibration based on some field measurements is needed. Moreover, the application of the proposed method was limited to wheat, corn, and wheat/corn fields, and the application of a future study should be expanded to other land cover types. In addition, to ensure the reliability of the data collected, the collection of data (such as spectroscopy and temperature measurements) was performed within a half hour before and after the satellite’s pass. Thus, in the experiment we only measured a total of 30 sample points used for validation within the limited time. In the future, more field measurements should be collected to further validate this method.

5. Conclusions

In this study, the modified STI model was developed to improve the estimation of SMC in the vegetated and irrigated region located in the basin of Heihe River, Northwestern China. The modified model reduced the impact of vegetation on the estimation of SMC by extracting the fraction of shadows due to vegetation canopies using a spectral unmixing analysis, which overcame the gap that currently exists in the original STI model. The results showed that compared to those from the original STI model, the modified STI model significantly decreased the MAE and RRMSE values of SMC by 63.0–63.2% for MAE and 63.0–63.5% for RRMSE (Figure 15). The 15 m spatial resolution thermal bands obtained by DWT data fusion provided more detailed information of SMC but did not significantly improve the estimation of SMC compared to the 15 m spatial resolution thermal bands re-sampled by NNM. This study implied that the new approach can offer the great potential to increase the accuracy of retrieving SMC estimates in the vegetated areas.

Author Contributions

Z.L.: conceptualization, methodology, performance of experiments and writing; G.W.: supervision, review, and revision; L.Z.: performance of experiments and methodology; Y.P.: performance of experiments and validation; Y.H.: project administration. All authors have read and agreed to the published version of the manuscript.

Funding

This research was funded by the National Natural Science Foundation of China (U1901601); Guangdong Province Agricultural Science and Technology Innovation and Promotion Project (No. 2019KJ102); Guangdong Provincial Science and Technology Project of China (2017B030314155); and Qinghai Provincial Science and Technology Project of China (2019-HZ-801).

Acknowledgments

We gratefully acknowledge the experimental assistance of Ting Wang and Ziqing Xia.

Conflicts of Interest

The authors declare no conflict of interest.

References

  1. Wu, G.L.; Zhang, Z.N.; Wang, D.; Shi, Z.H.; Zhu, Y.J. Interactions of soil water content heterogeneity and species diversity patterns in semi-arid steppes on the Loess Plateau of China. J. Hydrol. 2014, 519, 1362–1367. [Google Scholar] [CrossRef]
  2. Zhao, W.; Li, Z.L. Sensitivity study of soil moisture on the temporal evolution of surface temperature over bare surfaces. Int. J. Remote Sens. 2013, 34, 3314–3331. [Google Scholar] [CrossRef]
  3. Li-Ge, B. Research on the Drought during the Vegetation Growth Period of Inner Mongolia Based on TVDI. J. Anhui Agric. Sci. 2011, 39, 5945–5948. [Google Scholar]
  4. Zhang, D.; Tang, R.; Tang, B.; Wu, H.; Li, Z. A Simple Method for Soil Moisture Determination From LST–VI Feature Space Using Nonlinear Interpolation Based on Thermal Infrared Remotely Sensed Data. IEEE J. Sel. Top. Appl. Earth Obs. Remote Sens. 2015, 8. [Google Scholar] [CrossRef]
  5. Escorihuela, M.J.; Chanzy, A.; Wigneron, J.P.; Kerr, Y.H. Effective soil moisture sampling depth of L-band radiometry: A case study. Remote Sens. Environ. 2010, 114, 995–1001. [Google Scholar] [CrossRef] [Green Version]
  6. Cai, G.; Xue, Y.; Hu, Y.; Wang, Y.; Guo, J.; Luo, Y.; Wu, C.; Zhong, S.; Qi, S. Soil moisture retrieval from MODIS data in Northern China Plain using thermal inertia model. Int. J. Remote Sens. 2007, 28, 3567–3581. [Google Scholar] [CrossRef]
  7. Peischl, S.; Walker, J.P.; Ye, N.; Ryu, D.; Kerr, Y. Sensitivity of multi-parameter soil moisture retrievals to incidence angle configuration. Remote Sens. Environ. 2014, 143, 64–72. [Google Scholar] [CrossRef]
  8. Li, B.; Rodell, M. Spatial variability and its scale dependency of observed and modeled soil moisture over different climate regions. Hydrol. Earth Syst. Sci. Discuss. 2012, 9, 10245–10276. [Google Scholar] [CrossRef]
  9. Lu, Y.; Horton, R.; Zhang, X.; Ren, T. Accounting for soil porosity improves a thermal inertia model for estimating surface soil water content. Remote Sens. Environ. 2018, 212, 79–89. [Google Scholar] [CrossRef]
  10. Doninck, J.V.; Peters, J.; Baets, B.D.; Clercq, E.M.D.; Ducheyne, E.; Verhoest, N.E.C. The potential of multitemporal Aqua and Terra MODIS apparent thermal inertia as a soil moisture indicator. Int. J. Appl. Earth Obs. Geoinf. 2011, 13, 941. [Google Scholar] [CrossRef]
  11. Zeng, J.; Chen, K.; Cui, C.; Bai, X. A Physically Based Soil Moisture Index from Passive Microwave Brightness Temperatures for Soil Moisture Variation Monitoring. IEEE Trans. Geosci. Remote Sens. 2020, 58, 2782–2795. [Google Scholar] [CrossRef]
  12. Kim, S.B.; Moghaddam, M.; Tsang, L.; Burgin, M.; Xu, X.L.; Njoku, E.G. Models of L-Band Radar Backscattering Coefficients Over Global Terrain for Soil Moisture Retrieval. IEEE Trans. Geosci. Remote Sens. 2014, 52, 1381–1396. [Google Scholar] [CrossRef]
  13. Gao, Z.; Xu, X.; Wang, J.; Yang, H.; Huang, W.; Feng, H. A method of estimating soil moisture based on the linear decomposition of mixture pixels. Math. Comput. Model. 2013, 58, 606–613. [Google Scholar] [CrossRef]
  14. Nocita, M.; Stevens, A.; Noon, C.; Wesemael, B.V. Prediction of soil organic carbon for different level of soil moisture using Vis-NIR spectroscopy. Geoderma 2012, 199. [Google Scholar] [CrossRef]
  15. Kang, J.; Jin, R.; Li, X.; Ma, C.; Qin, J.; Zhang, Y. High spatio-temporal resolution mapping of soil moisture by integrating wireless sensor network observations and MODIS apparent thermal inertia in the Babao River Basin, China. Remote Sens. Environ. 2017, 191, 232–245. [Google Scholar] [CrossRef] [Green Version]
  16. Taktikou, E.; Bourazanis, G.; Papaioannou, G.; Kerkides, P. Prediction of Soil Moisture from Remote Sensing Data. Procedia Eng. 2016, 162, 309–316. [Google Scholar] [CrossRef] [Green Version]
  17. Verstraeten, W.W.; Veroustraete, F.; van der Sande, C.; Grootaers, I.; Feyen, J. Soil moisture retrieval using thermal inertia, determined with visible and thermal spaceborne data, validated for European forests. Remote Sens. Environ. 2006, 101, 299–314. [Google Scholar] [CrossRef]
  18. Palombo, A.; Pascucci, S.; Loperte, A.; Lettino, A.; Castaldi, F.; Muolo, M.R.; Santini, F. Soil Moisture Retrieval by Integrating TASI-600 Airborne Thermal Data, WorldView 2 Satellite Data and Field Measurements: Petacciato Case Study. Sensors 2019, 19, 1515. [Google Scholar] [CrossRef] [Green Version]
  19. Watson, K. Application of thermal modeling in the geologic interpretation of IR images. Proc. Seventh Int. Symp. Remote Sens. Environ. 1971, 3, 2017–2041. [Google Scholar]
  20. Price, J.C. Thermal inertia mapping: A new view of the Earth. J. Geophys. Res. 1977, 18, 2582–2590. [Google Scholar] [CrossRef]
  21. Pratt, D.A.; Ellyett, C.D. The thermal inertia approach to mapping of soil moisture and geology. Remote Sens. Environ. 1979, 8, 151–168. [Google Scholar] [CrossRef]
  22. Price, J.C. On the analysis of thermal infrared imagery: The limited utility of apparent thermal inertia. Remote Sens. Environ. 1985, 18, 59–73. [Google Scholar] [CrossRef]
  23. Scheidt, S.; Lancaster, N.; Ramsey, M. Eolian dynamics and sediment mixing in the Gran Desierto, Mexico, determined from thermal infrared spectroscopy and remote-sensing data. Geol. Soc. Am. Bull. 2011, 123, 1628–1644. [Google Scholar] [CrossRef] [Green Version]
  24. Xue, Y.; Cracknell, A.P. Advanced thermal inertia modeling. Int. J. Remote Sens. 1995, 16, 431–446. [Google Scholar] [CrossRef]
  25. Tao, Y. The Application of Thermal Inertia Method the Monitoring of Soil Moisture of North China Plain Based on NOAA-AVHRR Data. J. Remote Sens. 1997, 1, 24–31. [Google Scholar]
  26. Zhang, R.; Sun, X.; Zhu, Z.; Su, H.; Tang, X. A remote sensing model for monitoring soil evaporation based on differential thermal inertia and its validation. Sci. China Ser. D Earth Sci. 2003, 46, 342–355. [Google Scholar]
  27. Liu, Z.-h.; Zhao, Y.-s. Research on the method for retrieving soil moisture using thermal inertia model. Sci. China Ser. D 2006, 49, 539–545. [Google Scholar] [CrossRef]
  28. Minacapilli, M.; Cammalleri, C.; Ciraolo, G.; D’Asaro, F.; Lovino, M.; Maltese, A. Thermal Inertia Modeling for Soil Surface Water Content Estimation: A Laboratory Experiment. Soil Sci. Soc. Am. J. 2012, 76, 92. [Google Scholar] [CrossRef]
  29. Chen, H.L.; Feng, D.Y.; Zou, C.H. The study of method on monitoring soil moisture in wheat field by NOAA/AVHRR data. Remote Sens. Technol. Appl. 1998, 13, 27–35. [Google Scholar]
  30. Liu, J.Y.; Zhang, G.; Li, D.R. Detection of anomaly temperature based on ASTER and ETM+ thermal infrared image. Infrared Laser Eng. 2008, 37, 677–680. [Google Scholar]
  31. Carslow, H.S.; Jaeger, J.C.; Morral, J.E. Conduction of Heat in Solids, Second Edition. J. Eng. Mater. Technol. 1986, 108, 378. [Google Scholar] [CrossRef]
  32. Chang, S.G.; Yu, B. Adaptive wavelet thresholding for image denoising and compression. IEEE Trans. Image Process. 2000, 9, 1532–1546. [Google Scholar] [CrossRef] [PubMed] [Green Version]
  33. Liu, Z.-H.; Zhao, Y.-S.; Song, X.-N. A Simplified Surface Albedo Inverse Model with MODIS Data. Remote Sens. Technol. Appl. 2004, 7, 508–511. [Google Scholar] [CrossRef]
  34. Liu, Z.-H.; Zhao, Y.-S. Retrieval of plant and soil component temperature under different light conditions based on genetic algorithm. Trans. Chin. Soc. Agric. Eng. 2012, 28, 161–166. [Google Scholar]
  35. Cammalleri, C.; Anderson, M.; Ciraolo, G.; D’Urso, G.; Kustas, W.P.; La Loggia, G.; Minacapilli, M. The impact of in-canopy wind profile formulations on heat flux estimation in an open orchard using the remote sensing-based two-source model. Hydrol. Earth Syst. Sci. 2010. [Google Scholar] [CrossRef] [Green Version]
  36. Chehbouni, A.; Nouvellon, Y.; Lhomme, J.P.; Watts, C.; Boulet, G.; Kerr, Y.H.; Moran, M.S.; Goodrich, D.C. Estimation of surface sensible heat flux using dual angle observations of radiative surface temperature. Agric. For. Meteorol. 2001, 108, 65. [Google Scholar] [CrossRef]
  37. Sauer, T.J.; Hatfield, J.L.; Prueger, J.H. Aerodynamic Characteristics of Standing Corn Stubble. Agron. J. 1996, 5, 733–739. [Google Scholar] [CrossRef]
  38. Shuttleworth, W.J.; Wallace, J.S. Evaporation from sparse crops-an energy combination theory. Q. J. Royal Meteorol. Soc. 1985, 111, 839–855. [Google Scholar] [CrossRef]
  39. Swinbank, W.C. Long-wave radiation from clear skies. Q. J. Royal Meteorol. Soc. 2010, 89, 339–348. [Google Scholar] [CrossRef]
  40. Kustas, W.P.; Norman, J.M. Evaluation of soil and vegetation heat flux predictions using a simple two-source model with radiometric temperatures for partial canopy cover. Agric. For. Meteorol. 1999, 94, 29. [Google Scholar] [CrossRef]
  41. Choudhury, B.J.; Idso, S.B.; Reginato, R.J. Analysis of an empirical model for soil heat flux under a growing wheat crop for estimating evaporation by infrared-temperature based energy balance equation. Agric. For. Meteorol. 1987, 39, 283–297. [Google Scholar] [CrossRef]
  42. Claps, P.; Laguardia, G. Assessing spatial variability of soil water content through thermal inertia and NDVI. Int. Soc. Opt. Eng. 2004, 5232, 378–387. [Google Scholar]
  43. Wong, T.-T. Performance evaluation of classification algorithms by k-fold and leave-one-out cross validation. Pattern Recognit. 2015, 48, 2839–2846. [Google Scholar] [CrossRef]
  44. Riihelä, A.; Manninen, T.; Laine, V.; Andersson, K.; Kaspar, F. CLARA-SAL: A global 28 yr timeseries of Earth’s black-sky surface albedo. Atmos. Chem. Phys. 2013, 13, 3743–3762. [Google Scholar] [CrossRef] [Green Version]
  45. Kondo, J.; Ishida, S. Sensible Heat Flux from the Earth’s Surface under Natural Convective Conditions. J. Atmos. Sci. 1997, 54, 498–509. [Google Scholar] [CrossRef]
  46. Sauer, T.J.; Norman, J.M. Simulated canopy microclimate using estimated below-canopy soil surface transfer coefficients. Agric. For. Meteorol. 1995, 75, 135–160. [Google Scholar] [CrossRef]
  47. Sauer, T.J. Sensible and Latent Heat Exchange at the Soil Surface Beneath a Maize Canopy; ProQuest Dissertations Publishing: Madison, WI, USA, 1993. [Google Scholar]
  48. Wan, Z.; Wang, P.; Li, X. Using MODIS Land Surface Temperature and Normalized Difference Vegetation Index products for monitoring drought in the southern Great Plains, USA. Int. J. Remote Sens. 2004, 25, 61–72. [Google Scholar] [CrossRef]
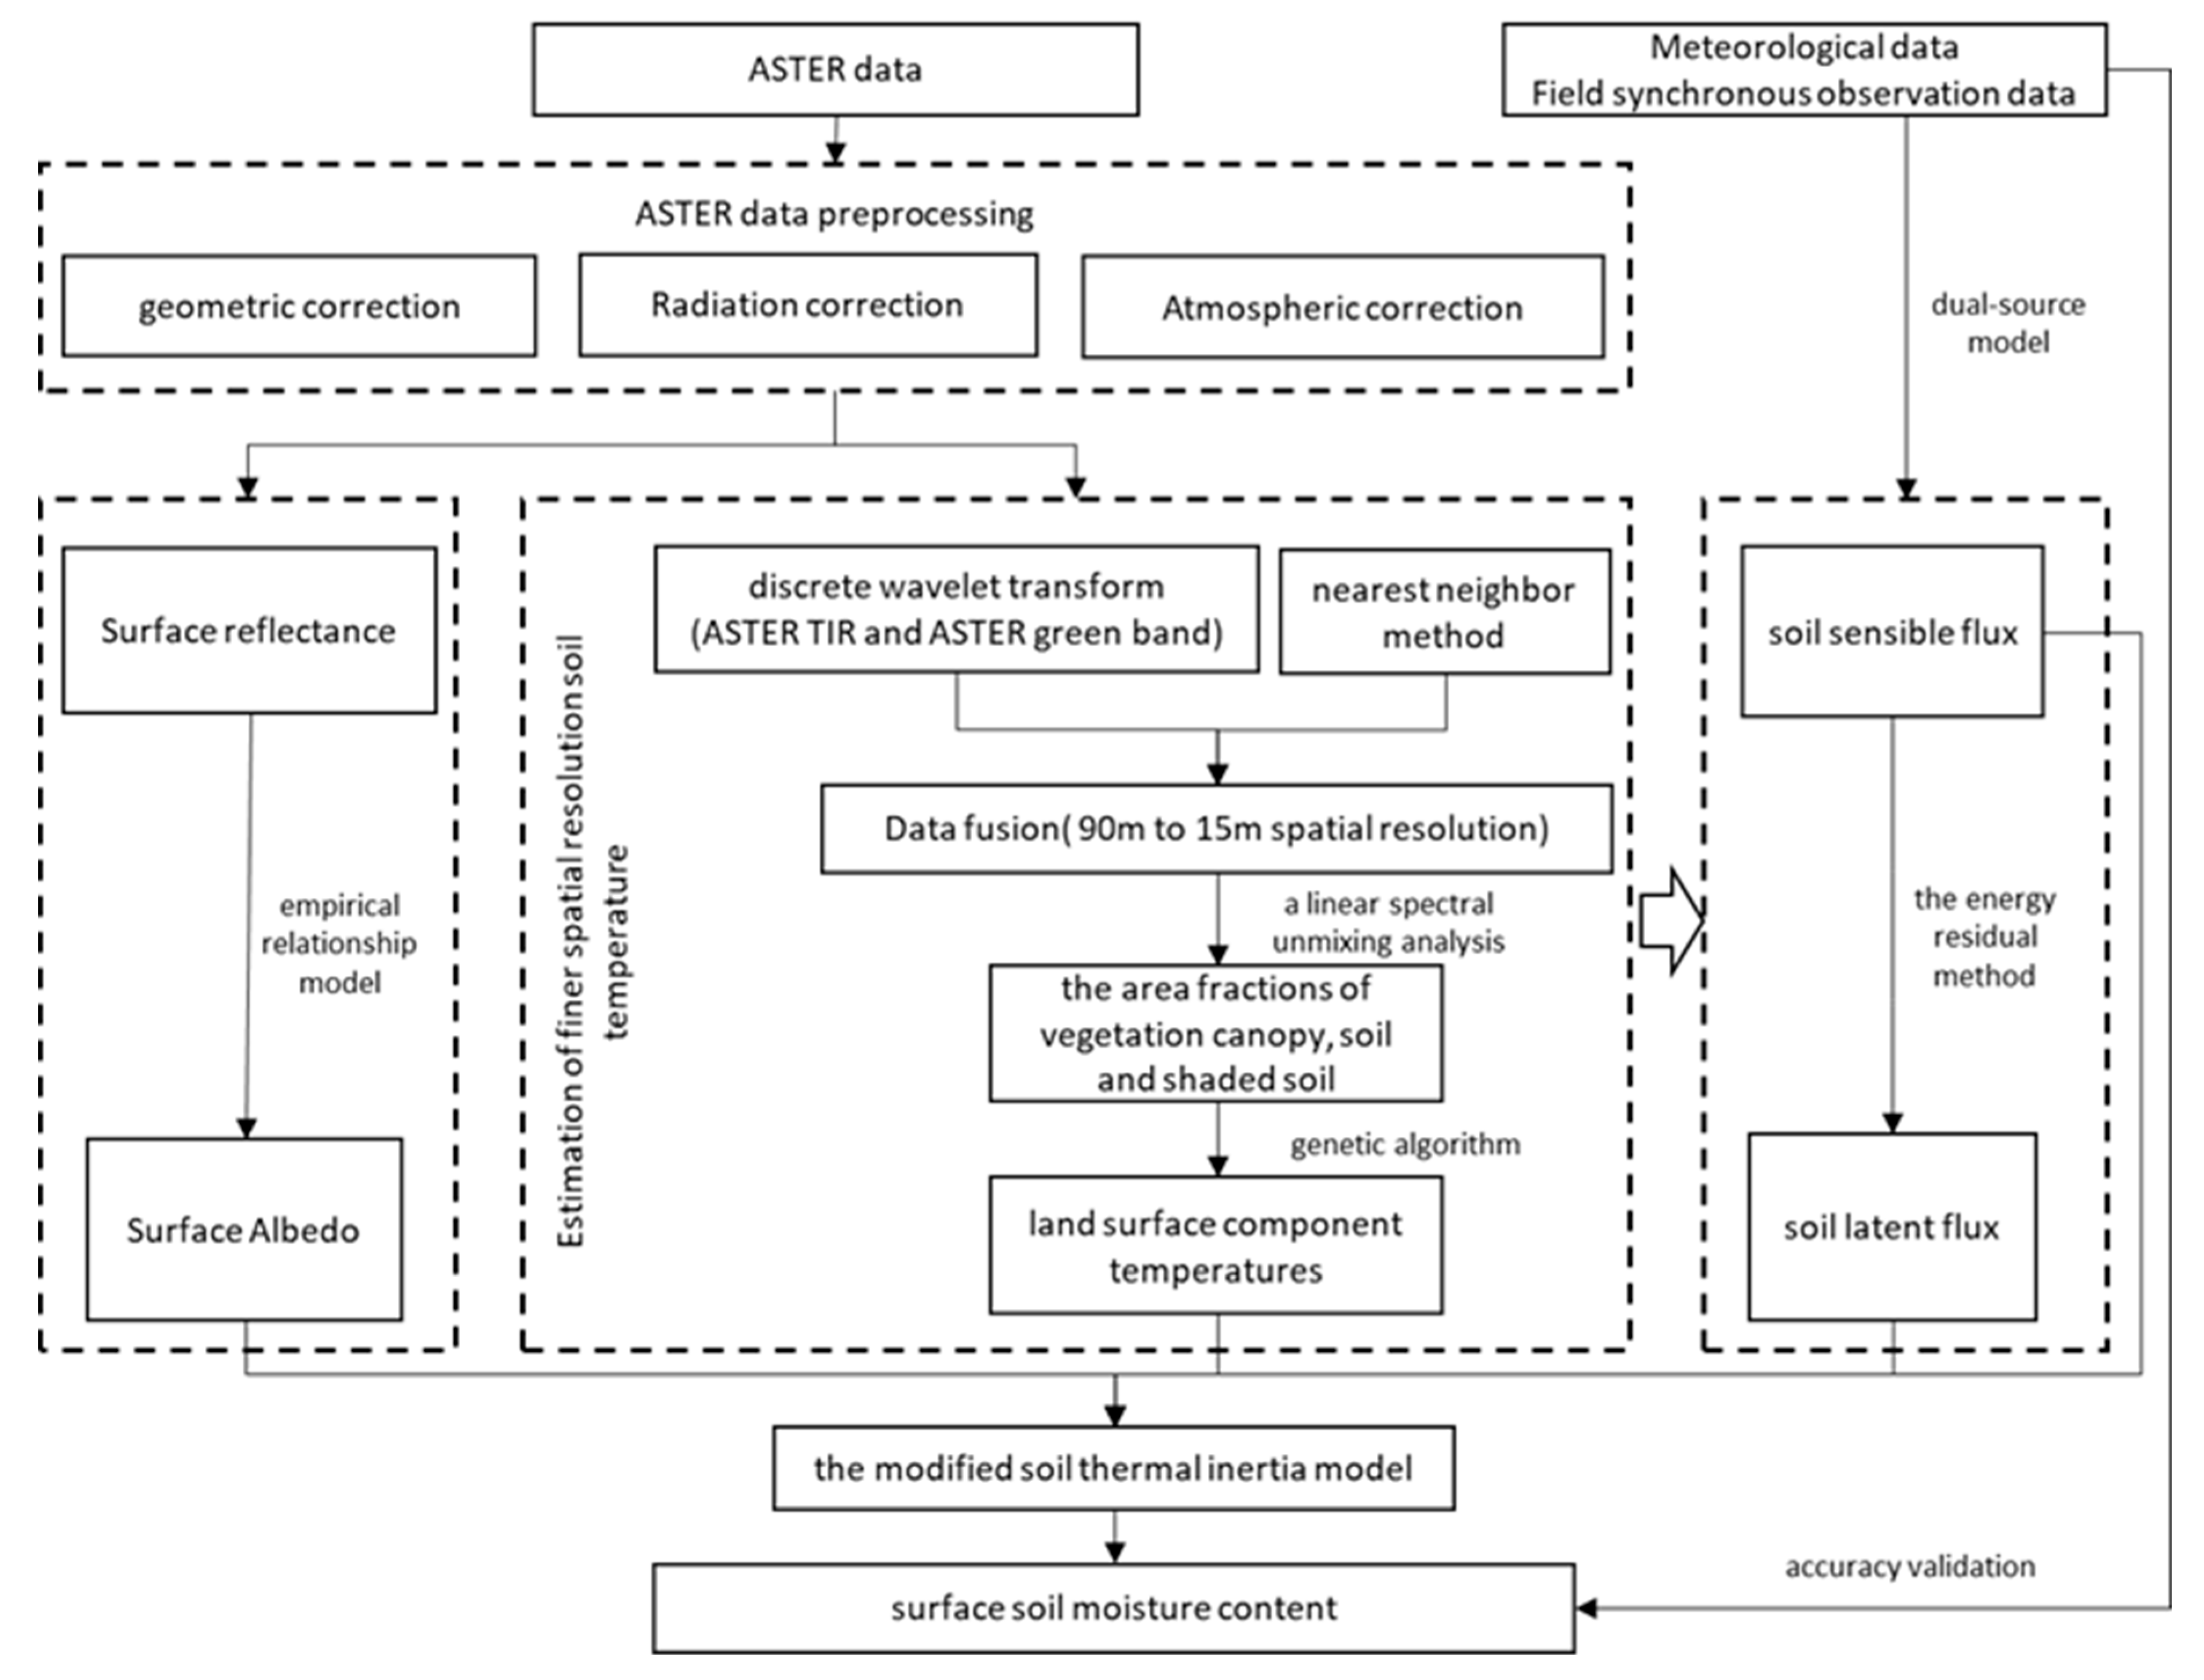
Figure 1. The flow chart of obtaining soil moisture content (SMC) from the modified soil thermal inertia (STI) model.
Remotesensing 12 01719 g001
Figure 2. The study area and spatial distribution of sample plots: (a) The location of the study area in China; (b) a land cover map generated using 500 m spatial resolution MODIS MCD12 product with the study area highlighted. (c,d) The study area shown using a standard false color composite image from ASTER data dated on June 4th and July 10th of 2008, respectively, and the locations of 4 180 m × 180 m sample blocks. (e,f) Spatial distributions of the 40 15 m × 15 m sample plots within the sample blocks shown in ASTER images dated on June 4th and July 10th of 2008, respectively (50 purple plots used for developing and selecting the models and 30 yellow plots for validating the accuracy of the models).
Remotesensing 12 01719 g002
Figure 3. The wavelet decomposition results of ASTER band 1 and band 14 images from 4 June and 10 July 2008 at three directions by the discrete wavelet transform (DWT): (a,b,g,h) horizontal features; (c,d,i,j) diagonal features; and (e,f,k,l) vertical features.
Remotesensing 12 01719 g003
Figure 4. (a,c) the 15 m spatial resolution ASTER-TIR images from 4 June and 10 July 2008 after the data resampled using the nearest neighbor method (NNM); (b,d) the 15 m spatial resolution ASTER-TIR images from 4 June and 10 July 2008 after the data fusion using the discrete wavelet transform (DWT).
Remotesensing 12 01719 g004
Figure 5. The demonstration of resistance network and important energy balance variables used in (a) bare soil and (b) the two-source energy balance (TSEB) model (Note: Rnb and Rnvd (Rnd + Rnv) represent, respectively, surface net radiance flux under bare soil and vegetation cover; Rnd and Rnv are the surface net radiance flux of the shaded soil and vegetation. Hb, Hd, and Hv represent, respectively, the surface sensible heat flux of bare soil, shaded soil, and vegetation. Hvd is the sum of Hv and Hd. LEb, LEd, and LEv represent, respectively, the surface latent heat flux of bare soil, shaded soil, and vegetation. LEvd is the sum of LEv and LEd. Gb and Gd represent, respectively, the surface flux exchange of bare soil and shaded soil. Ta, Td, and Tc are the atmospheric temperature at the reference level, the surface soil temperature, and the vegetation aerodynamic temperatures, respectively. The ras, rvc, and rsc represent, respectively, the aerodynamic resistance, the resistance of the whole canopy boundary layer, and the aerodynamic resistance between canopy source and soil surface. ea, ec, and ed represent, respectively, the water vapor pressure at the reference level, canopy height, and soil surface).
Remotesensing 12 01719 g005
Figure 6. Surface albedo of the study area for (a) the June 4th image and (b) the July 10th image of 2008.
Remotesensing 12 01719 g006
Figure 7. The area fraction maps of three components derived from ASTER data using a spectral unmixing analysis for the study area: (a,d) bare soil; (b,e) vegetation; and (c,f) shaded soil for the June 4th and July 10th images of 2008, respectively.
Remotesensing 12 01719 g007
Figure 8. The spatial distributions of temperatures obtained based on three component fraction maps derived from ASTER data using a spectral unmixing analysis for the study area: (a,d) bare soil; (b,e) vegetation; and, (c,f) shaded area for the June 4th and July 10th images of 2008, respectively.
Remotesensing 12 01719 g008
Figure 9. Spatial distributions of the bare soil, shaded soil, and total soil sensible fluxes for the study area: (a,d) bare soil; (b,e) shaded soil; and (c,f) total soil sensible flux using the June 4th image and July 10th image of 2008, respectively.
Remotesensing 12 01719 g009
Figure 10. Spatial distribution of the soil latent flux using: (a) the June 4th image and (b) the July 10th image 2008, respectively.
Remotesensing 12 01719 g010
Figure 11. Spatial distribution of the soil net radiant flux using: (a) the June 4th image and (b) the July 10th image 2008, respectively.
Remotesensing 12 01719 g011
Figure 12. Spatial distributions of four combinations with images dated on June 4th and July 10th 2008: OBSTI_NNM—the original-model-based bare STI using the 15 m resolution thermal infrared bands by re-sampling using the nearest neighbor method; OBSTI_DWT—the original-model-based bare STI using the 15 m resolution fusion thermal infrared bands; MSTI_NNM—the modified-model-based STI using the 15 m resolution thermal infrared bands by re-sampling using the nearest neighbor method; and MSTI_DWT—the modified-model-based STI using the 15 m resolution fusion thermal infrared bands. Spatial distributions of thermal inertia derived using (a,e) OBSTI_NNM; (b,f) OBSTI_DWT; (c,g) MSTI_NNM; and, (d,h) MSTI_DWT on June 4th and July 10th 2008, respectively.
Remotesensing 12 01719 g012
Figure 13. The selected models for accounting for the relationship of soil moisture content (SMC) with soil and bare soil thermal inertia (STI): (a) The linear model of SMC with the original-model-derived bare STI at the 15 m resampling spatial resolution (OBSTI_NNM); (b) The linear model of SMC with the original-model-derived bare STI at the 15 m fusion spatial resolution (OBSTI_DWT); (c) The exponential model of SMC with the modified-model-derived STI at the 15 m resampling spatial resolution (MSTI_NNM); and (d) The exponential model of SMC with the modified-model-derived STI at the 15 m fusion spatial resolution (MSTI_DWT). The R2 and RMSE ( J · m 2 · s 1 / 2 · K 1 ) are the coefficient of determination and root mean square error between the estimates and observations of SMC.
Remotesensing 12 01719 g013
Figure 14. Comparison of spatial distributions of predicted soil moisture contents derived using (a,e) the original-model-derived bare STI at the 15 m resampling spatial resolution (OBSTI_NNM); (b,f) the modified-model-derived STI at the 15 m resampling spatial resolution (MSTI_NNM); (c,g) the original-model-derived bare STI at the 15 m fusion spatial resolution (OBSTI_DWT); and, (d,h) the modified-model-derived STI at the 15 m fusion spatial resolution (MSTI_DWT) on June 4th and July 10th 2008, respectively.
Remotesensing 12 01719 g014
Figure 15. The field measurements of soil moisture content (SMC) versus the estimates: (a) OBSTI_NNM: the original-model-based bare STI using 15 m resolution thermal infrared bands by re-sampling using the nearest neighbor method; (b) OBSTI_DWT: the original-model-based bare STI using 15 m resolution fusion thermal infrared bands; (c) MSTI_NNM: the modified-model-based STI using 15 m resolution thermal infrared bands by re-sampling using the nearest neighbor method; (d) MSTI_DWT: the modified model based thermal inertia using 15 m resolution fusion thermal infrared bands.
Remotesensing 12 01719 g015
Figure 16. (a) The normalized difference vegetation index (NDVI)-albedo scatter plot of a small square extracted from (b) an enlarged and bare soil dominated area of (c) the study area.
Remotesensing 12 01719 g016
Figure 17. (a) The scatter plot of the normalized difference vegetation index (NDVI) values against the land surface temperature (LST) values of a square area extracted from (b) the study area shown with an infrared color composite image.
Remotesensing 12 01719 g017
Table 1. The comparison of four models to estimate soil moisture content (SMC) using the 50 soil samples and leave-one cross validation for four combinations: OBSTI_NNM—the original-model-based bare STI using the 15 m resolution thermal infrared bands by re-sampling using the nearest neighbor method; OBSTI_DWT—the original-model-based bare STI using the 15 m resolution fusion thermal infrared bands; MSTI_NNM—the modified-model-based STI using the 15 m resolution thermal infrared bands by re-sampling using the nearest neighbor method; and MSTI_DWT—the modified-model-based STI using the 15 m resolution fusion thermal infrared bands. R2 and RMSE ( J · m 2 · s 1 / 2 · K 1 ): coefficient of determination and root mean square error between the estimates and observations of SMC.
ModelLinear ModelExponential ModeLogarithm ModelPower Model
Thermal inertiaR2RMSER2RMSER2RMSER2RMSE
OBSTI_NNM0.723.460.713.750.593.670.633.49
OBSTI_DWT0.733.410.723.750.583.660.633.47
MSTI_NNM0.832.730.812.570.703.760.723.34
MSTI_DWT0.852.670.822.470.713.780.723.37