City Grade Classification Based on Connectivity Analysis by Luojia I Night-Time Light Images in Henan Province, China


Abstract
1. Introduction
2. Study Area and Data
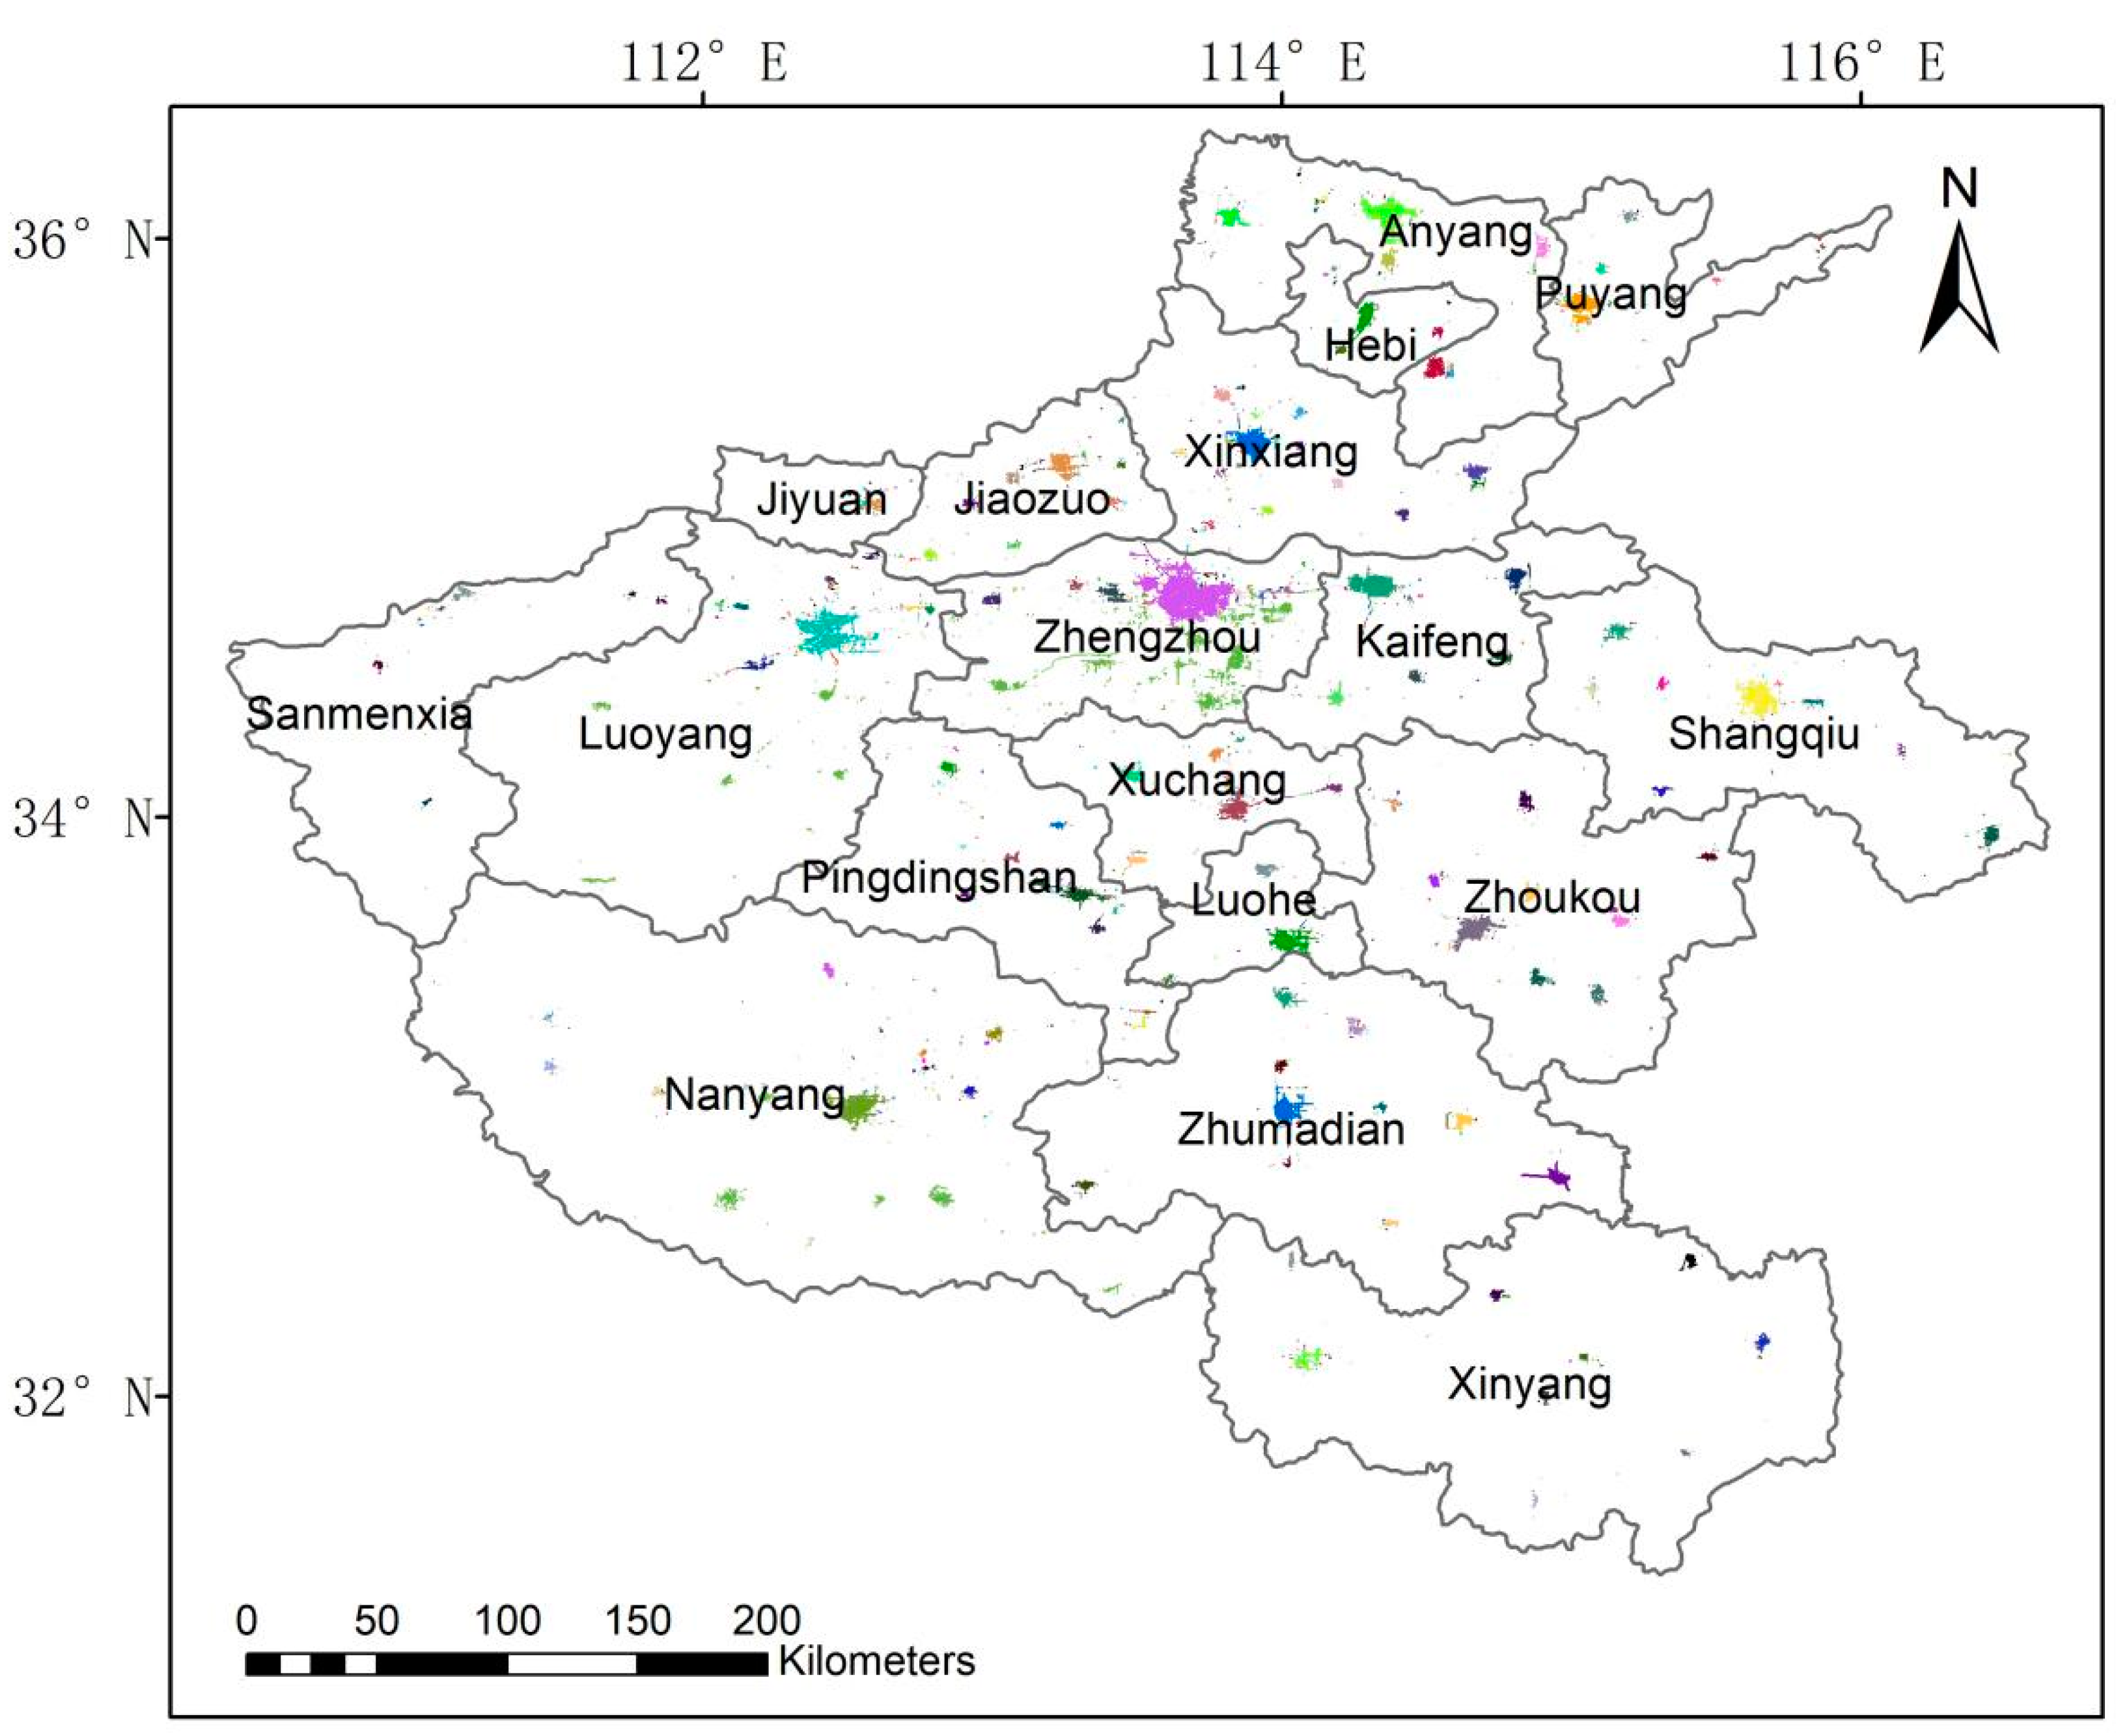
2.1. Study Area
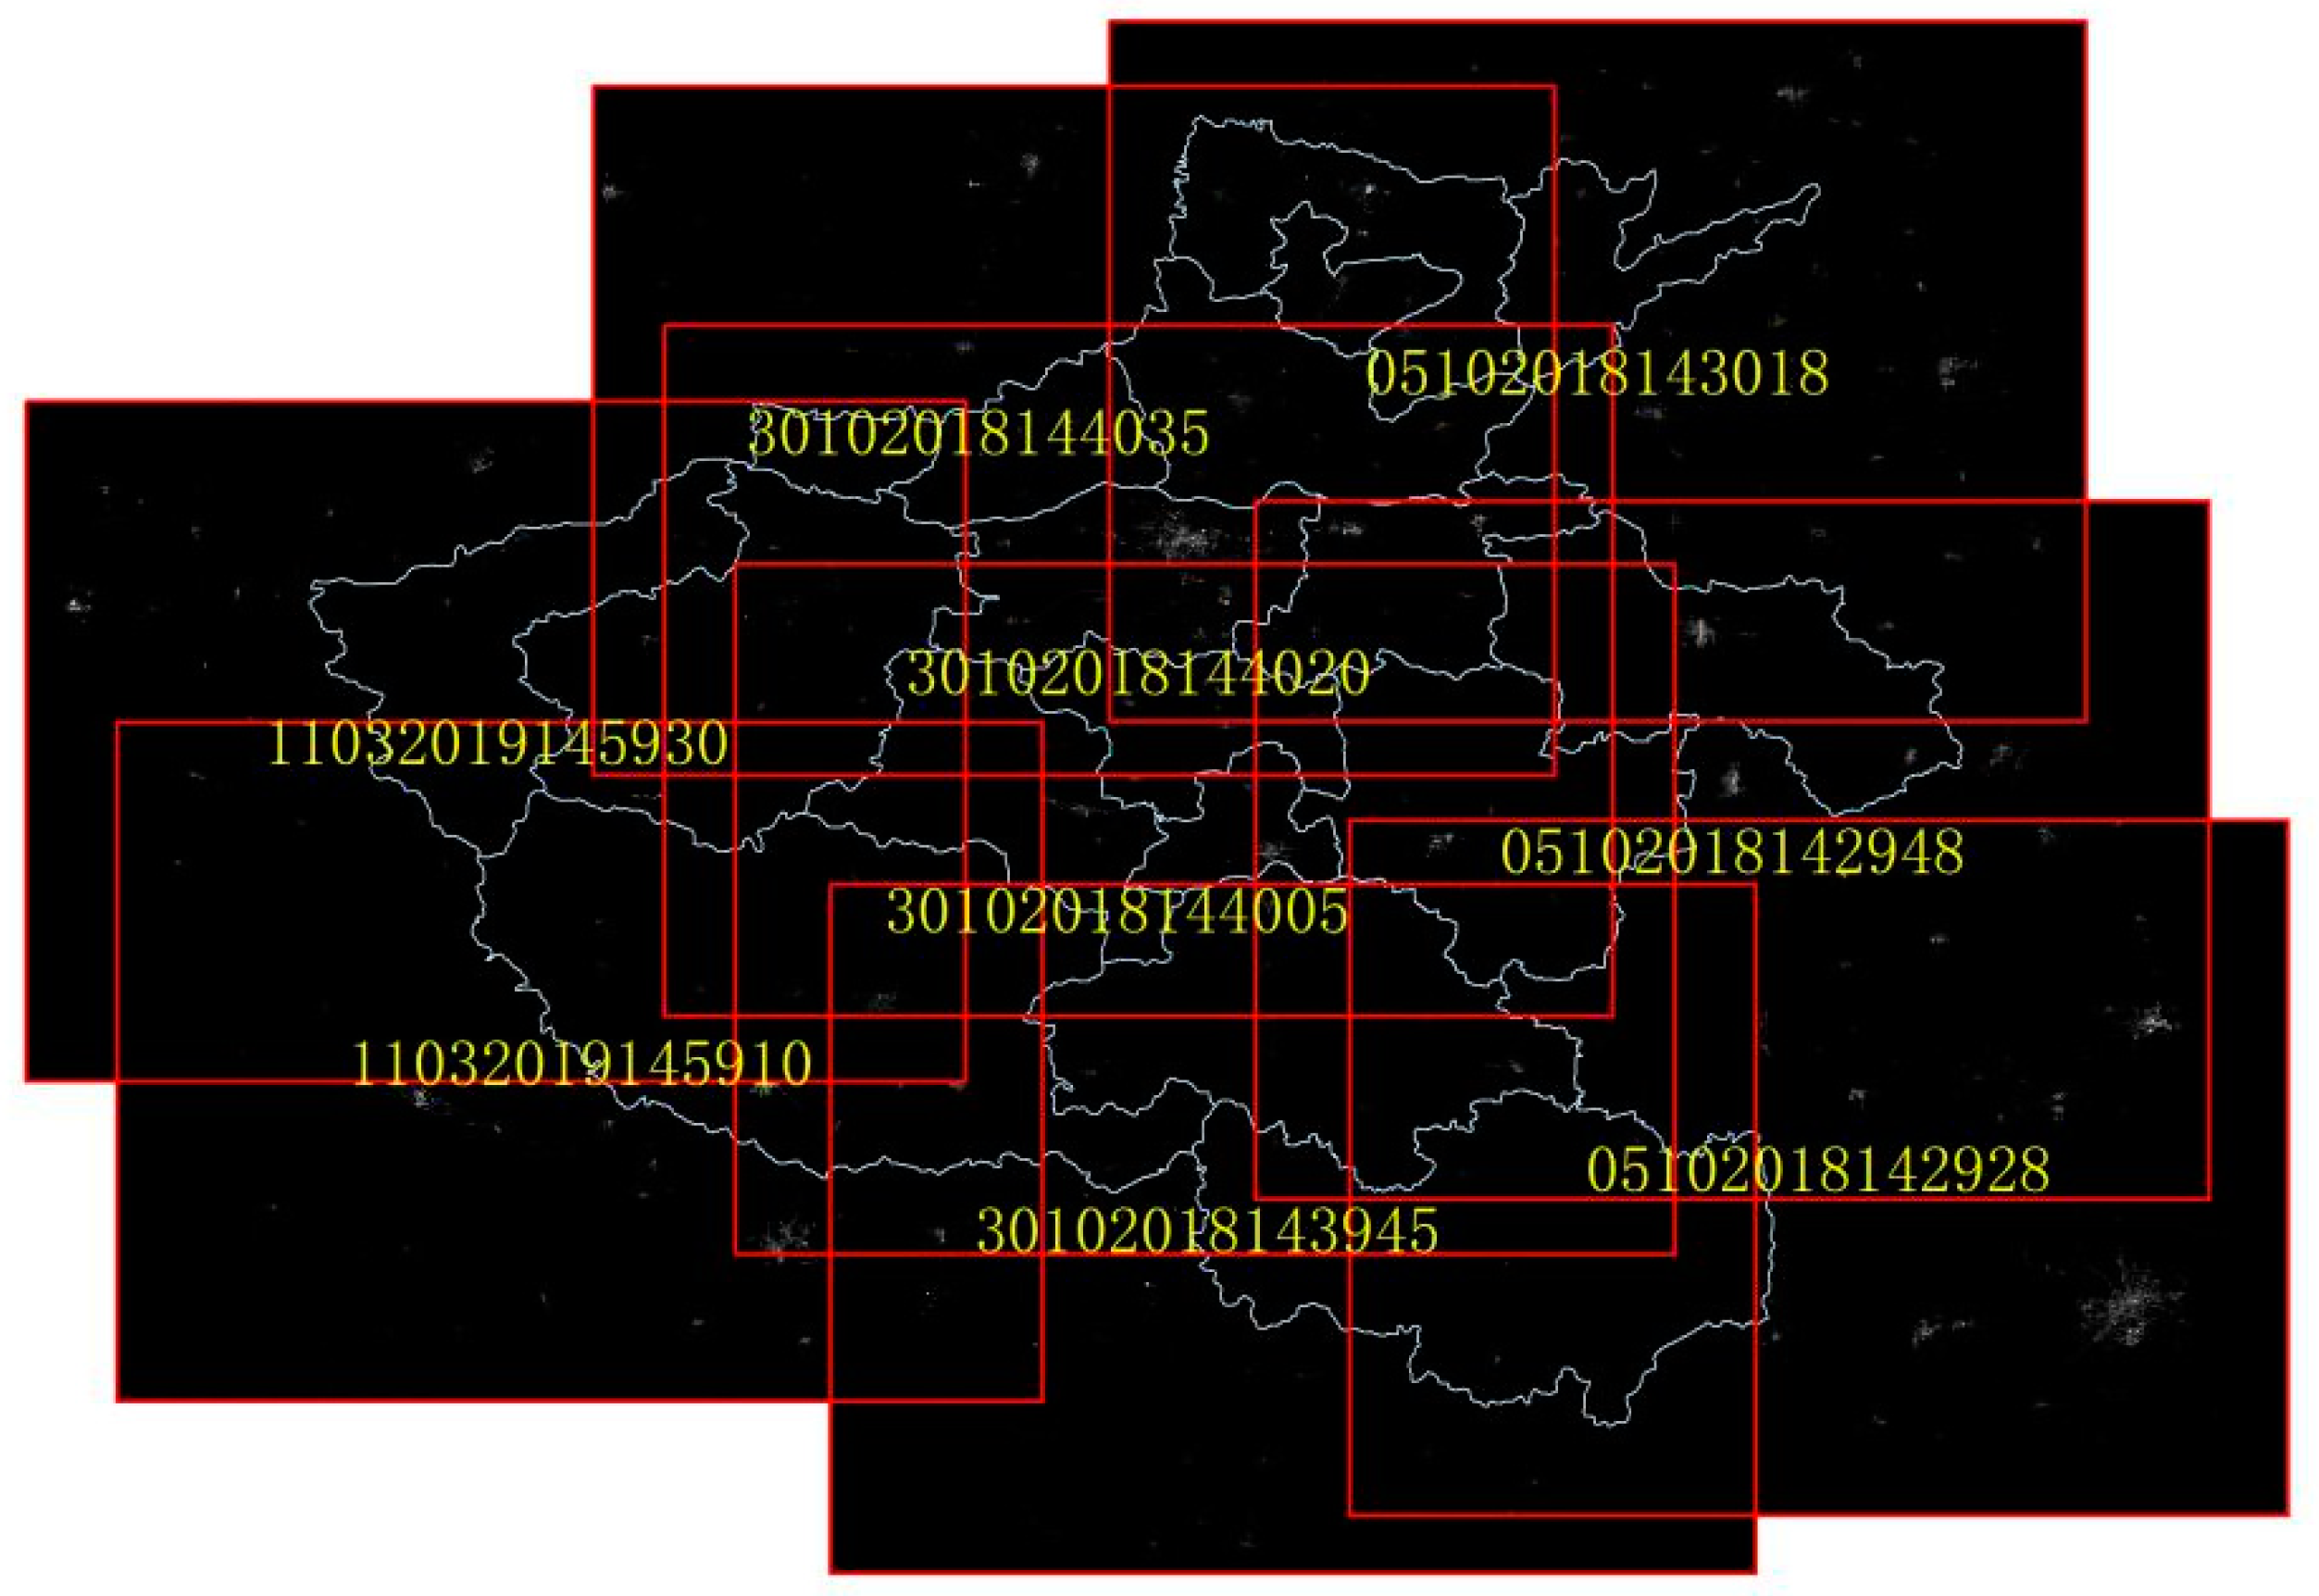
2.2. Data
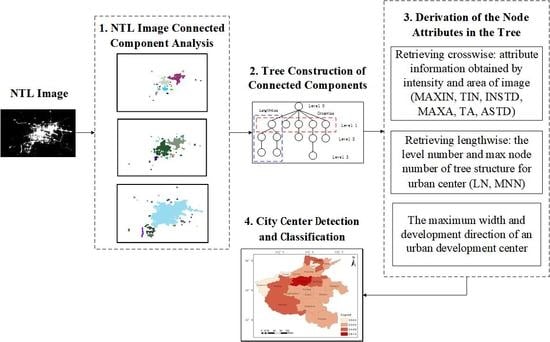
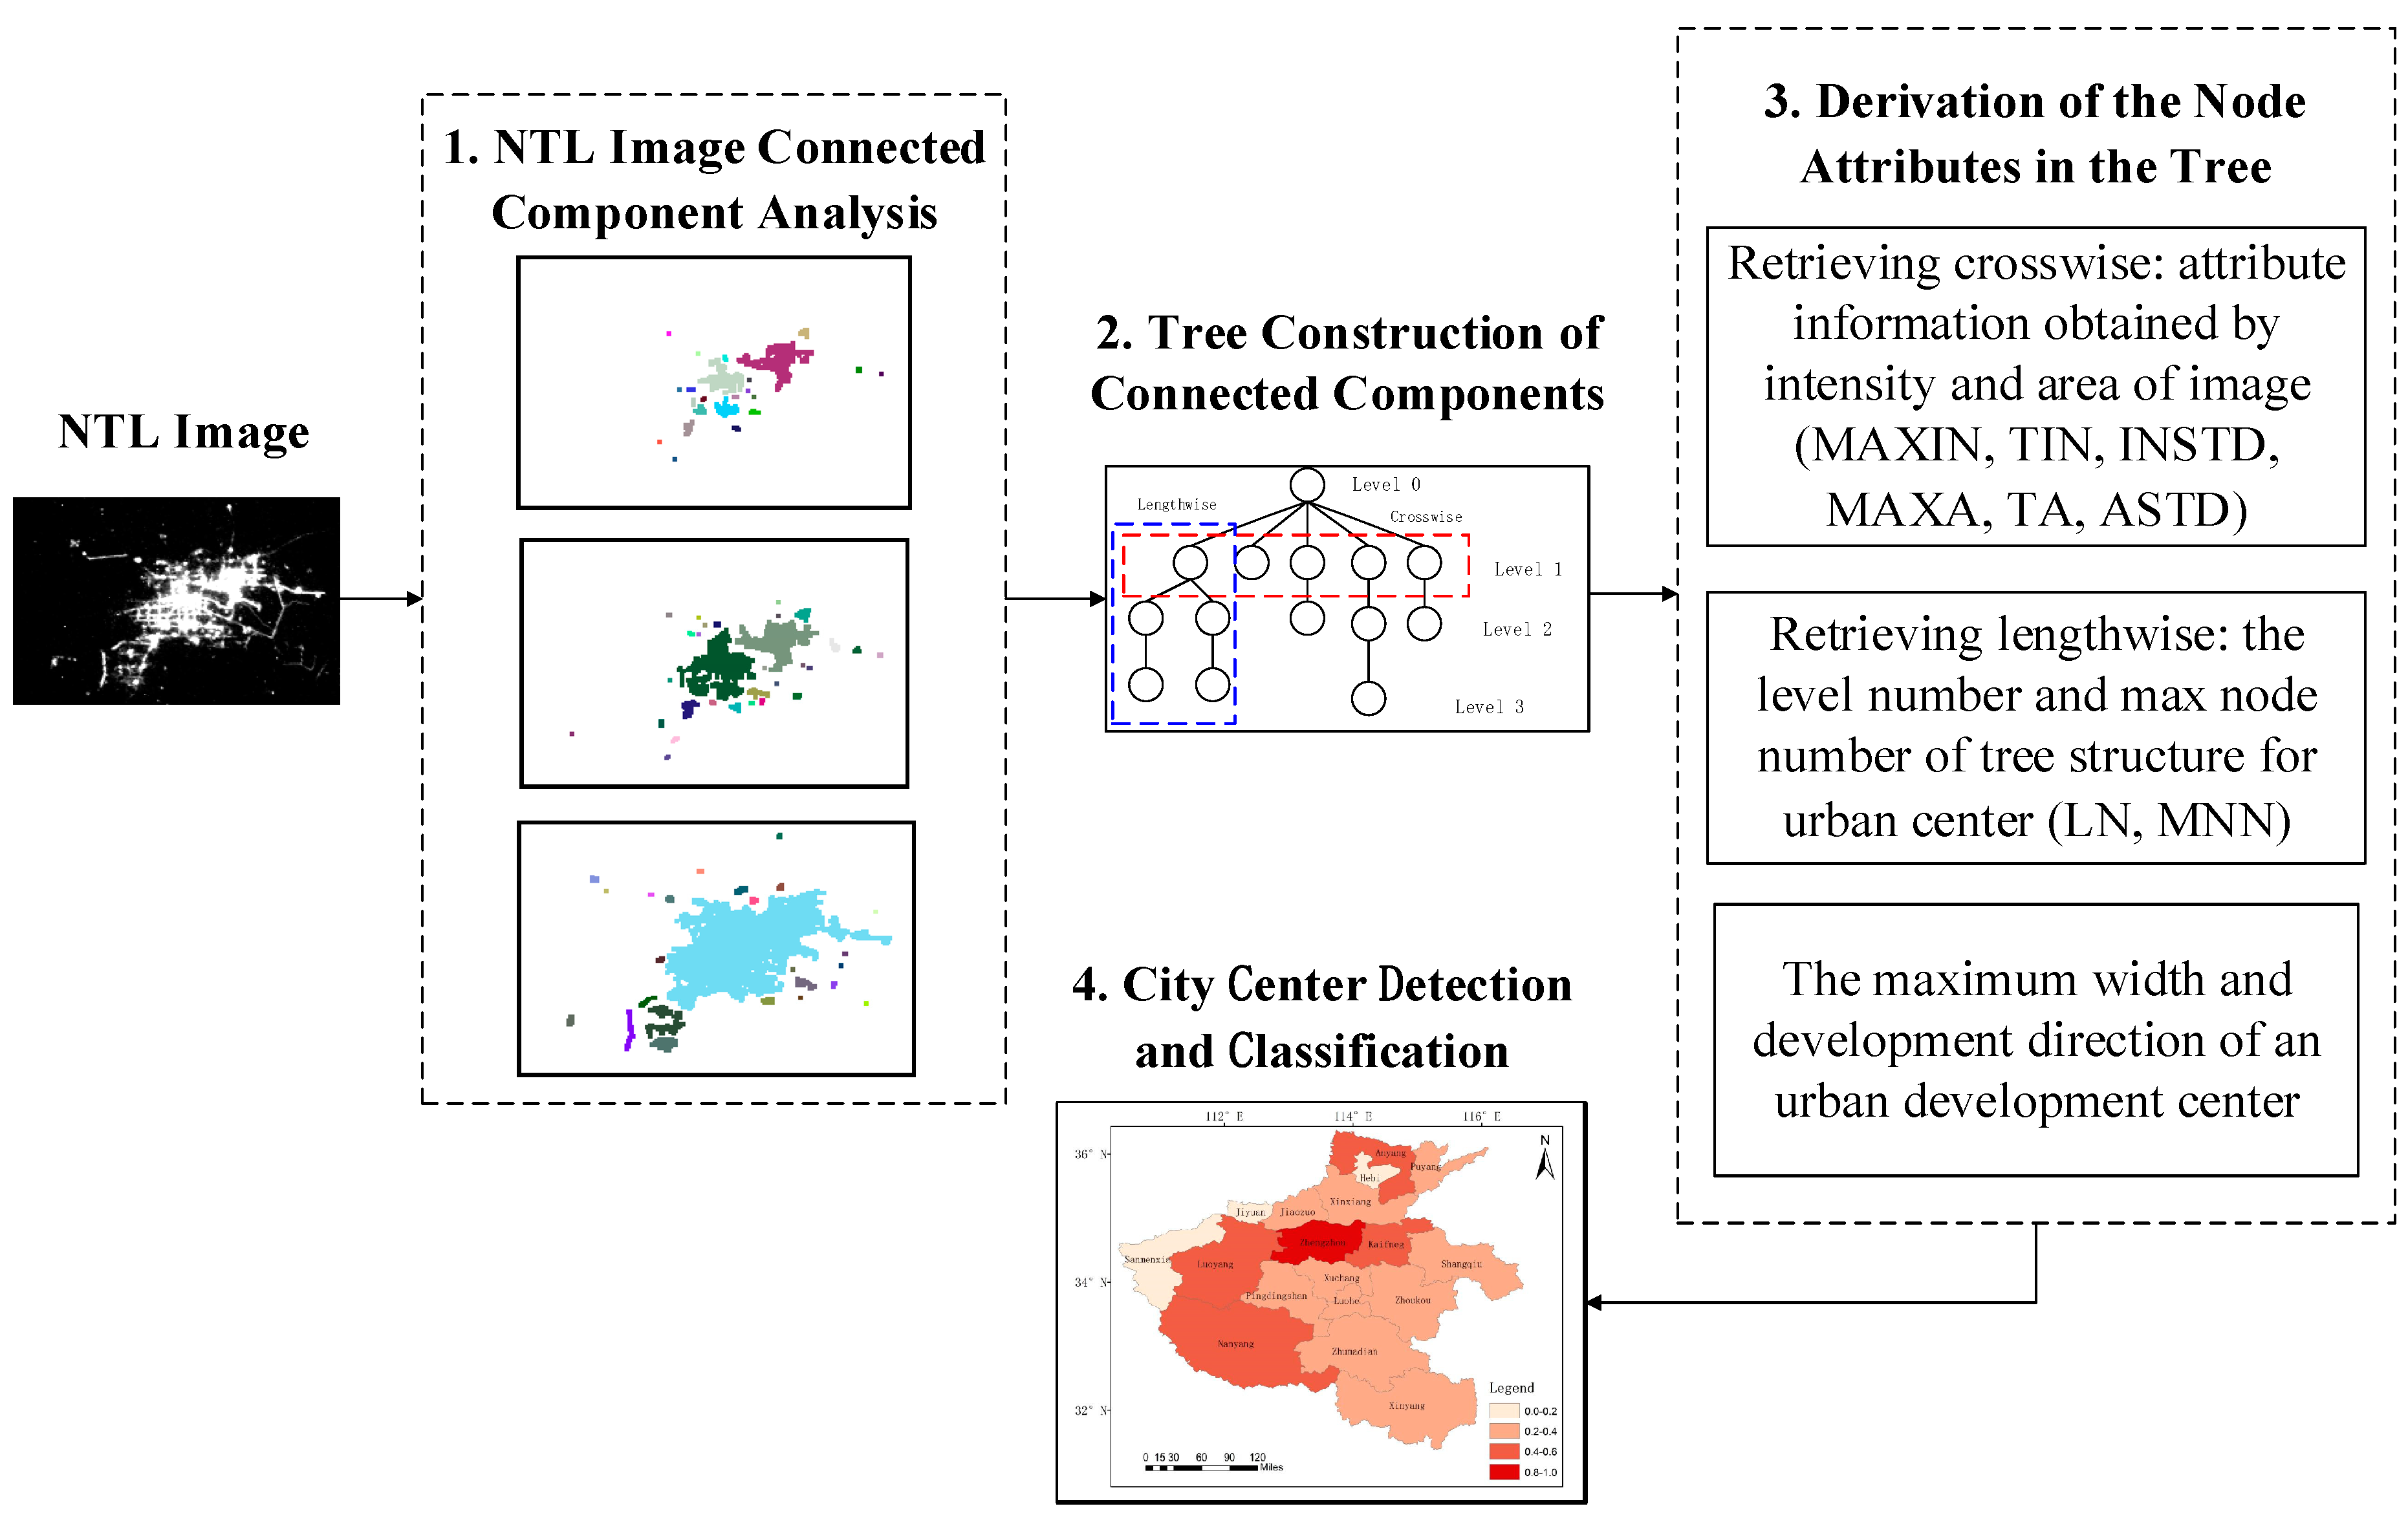
3. Methodology
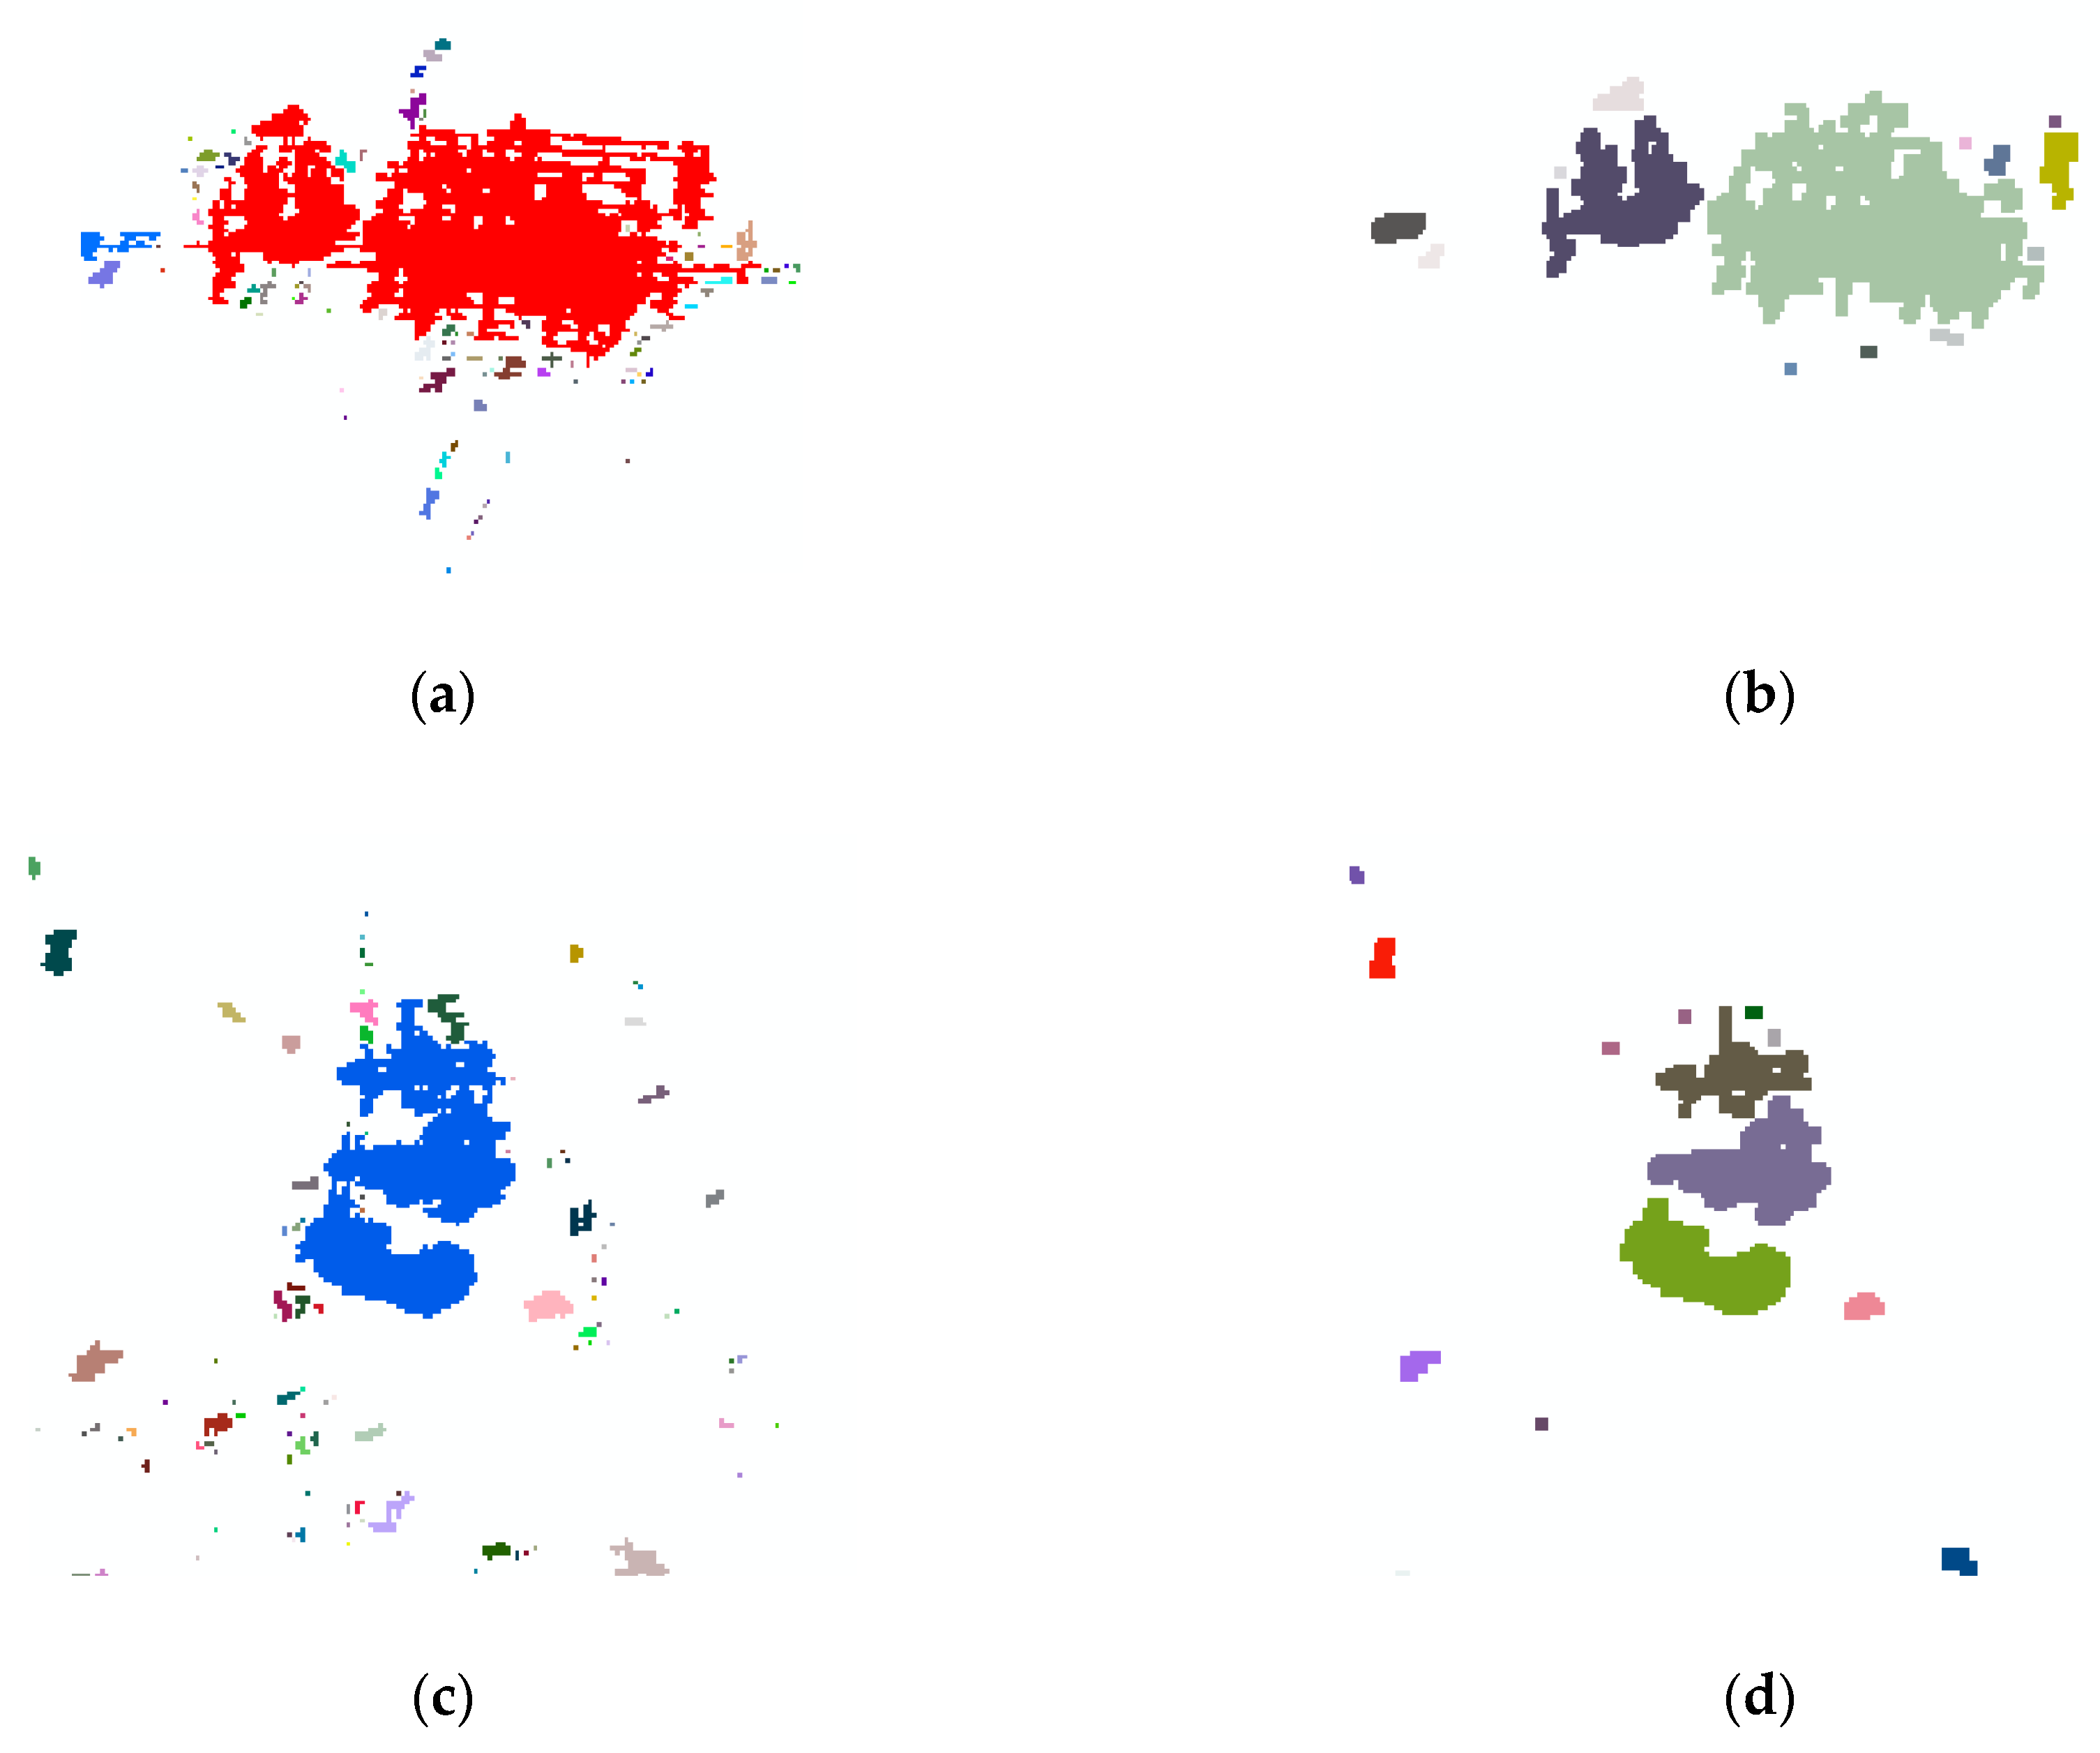
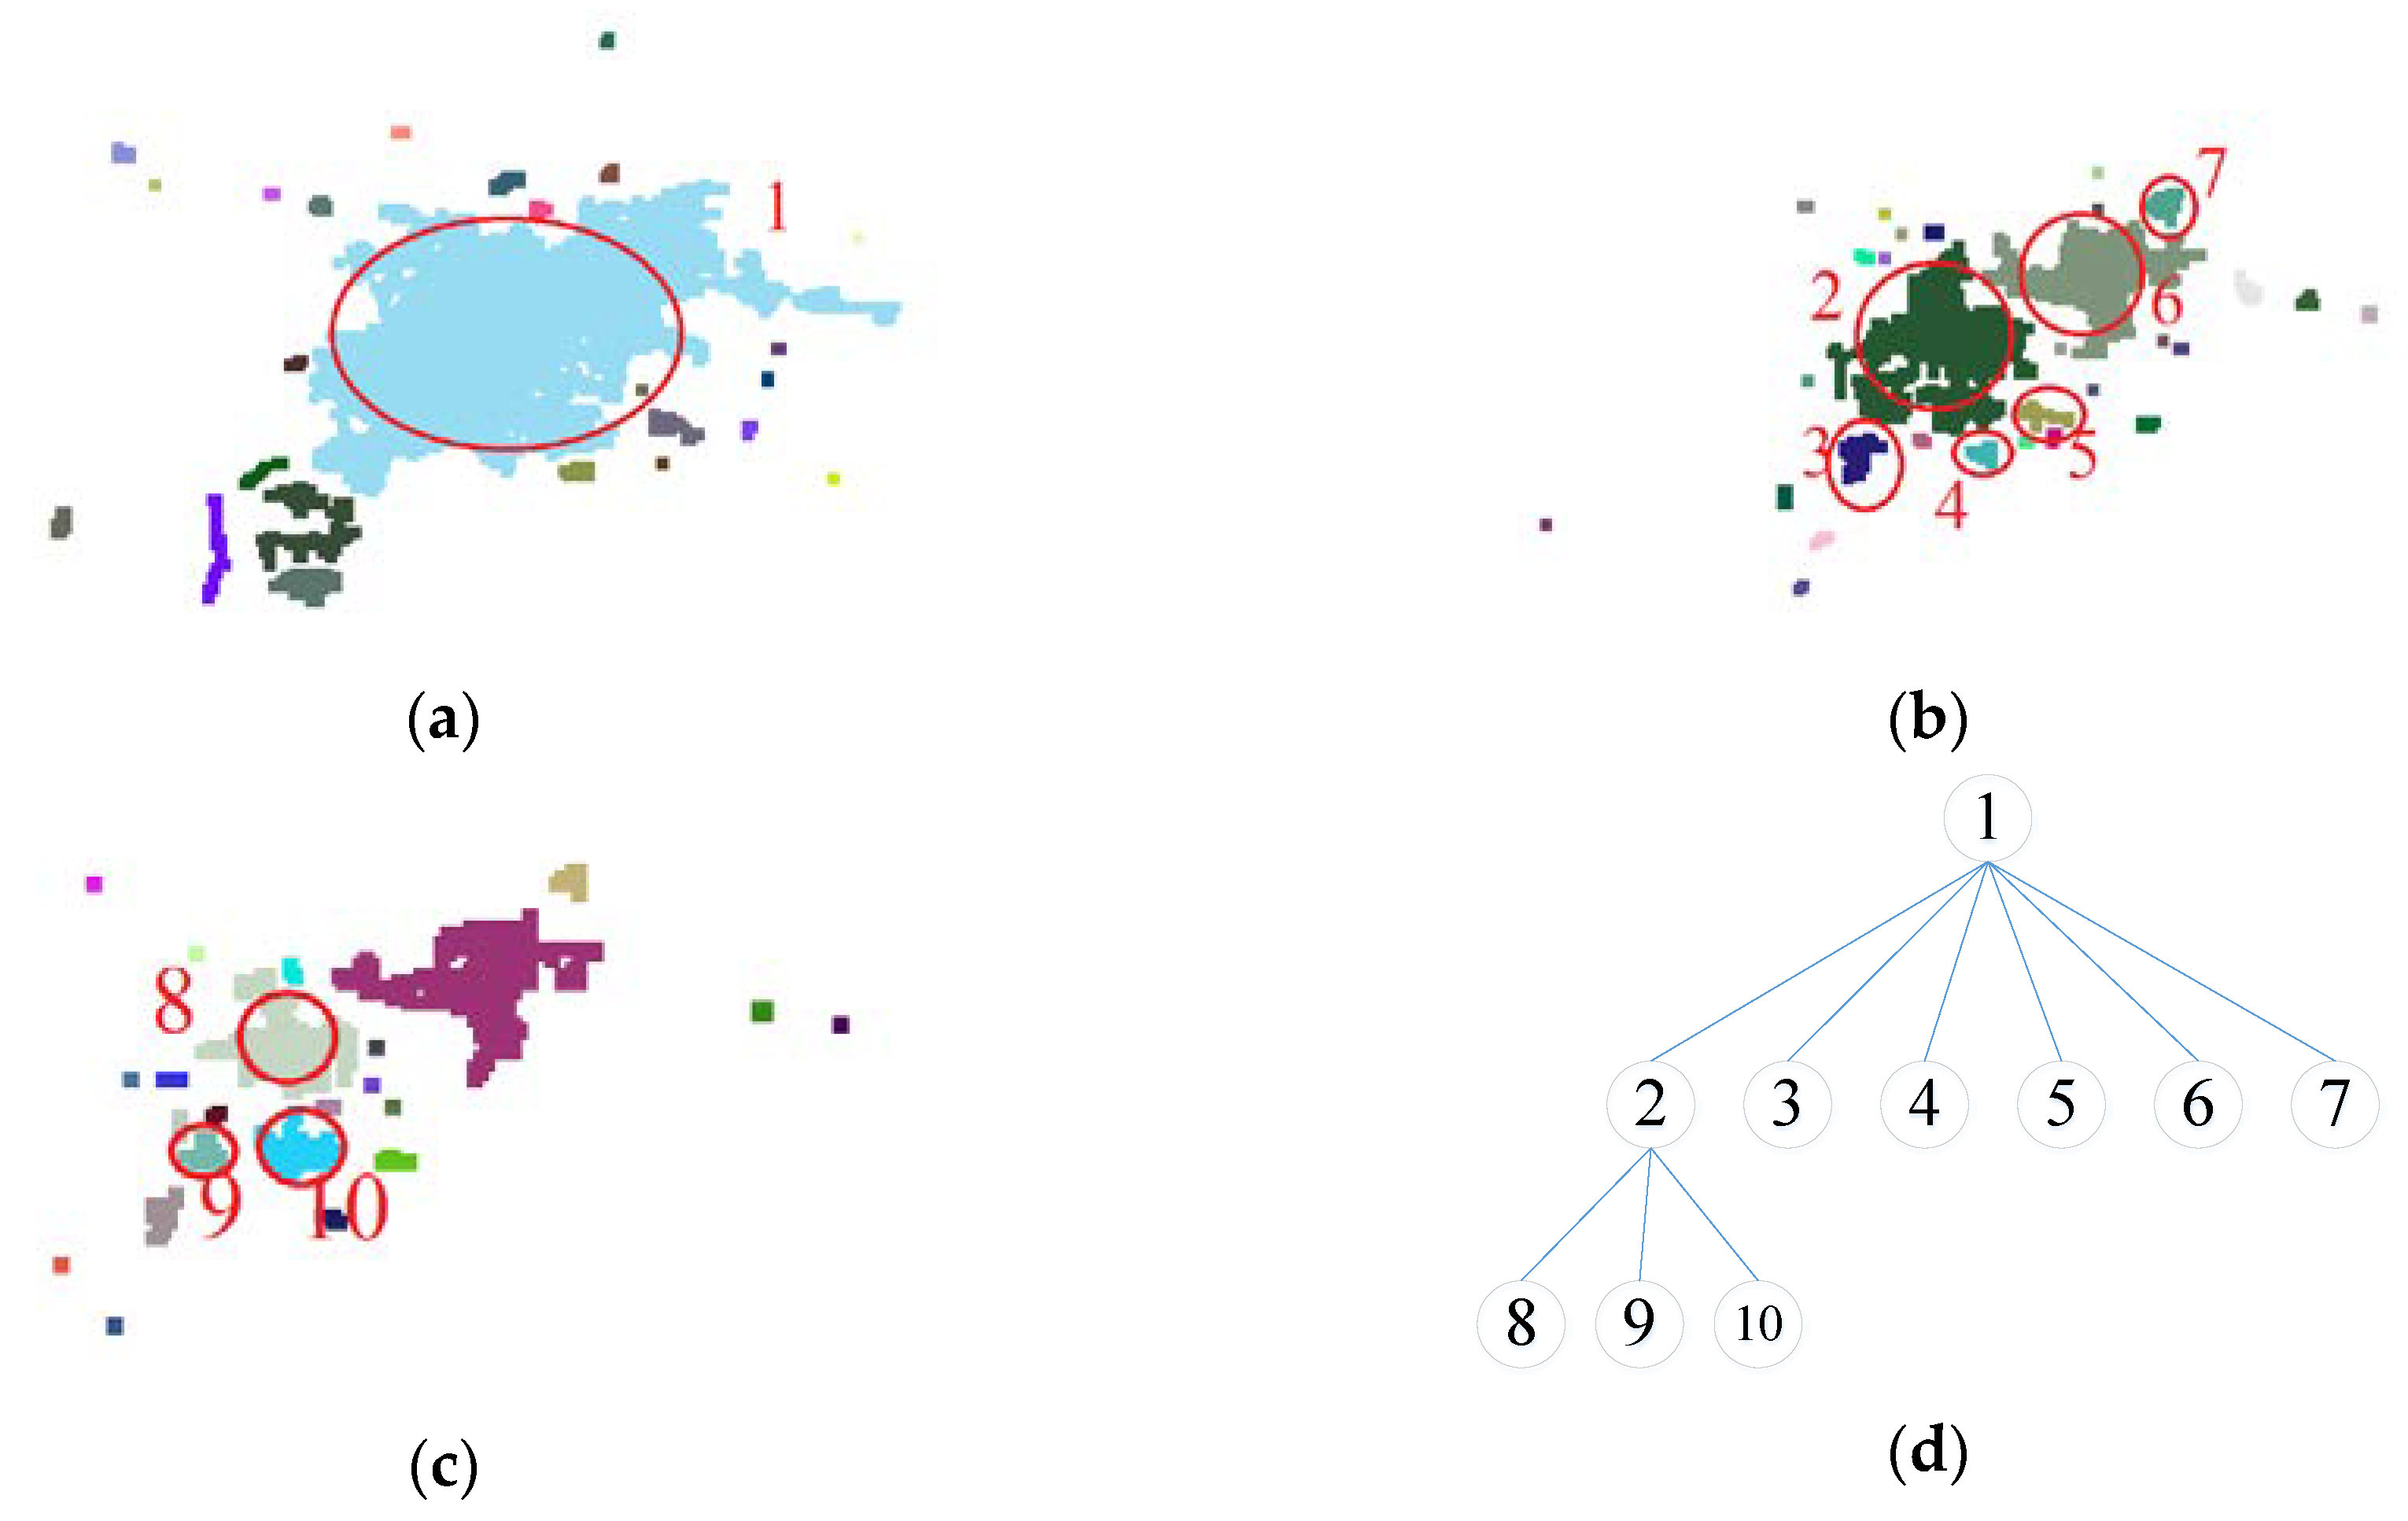
3.1. Luojia 1 NTL Image Connected Component Analysis
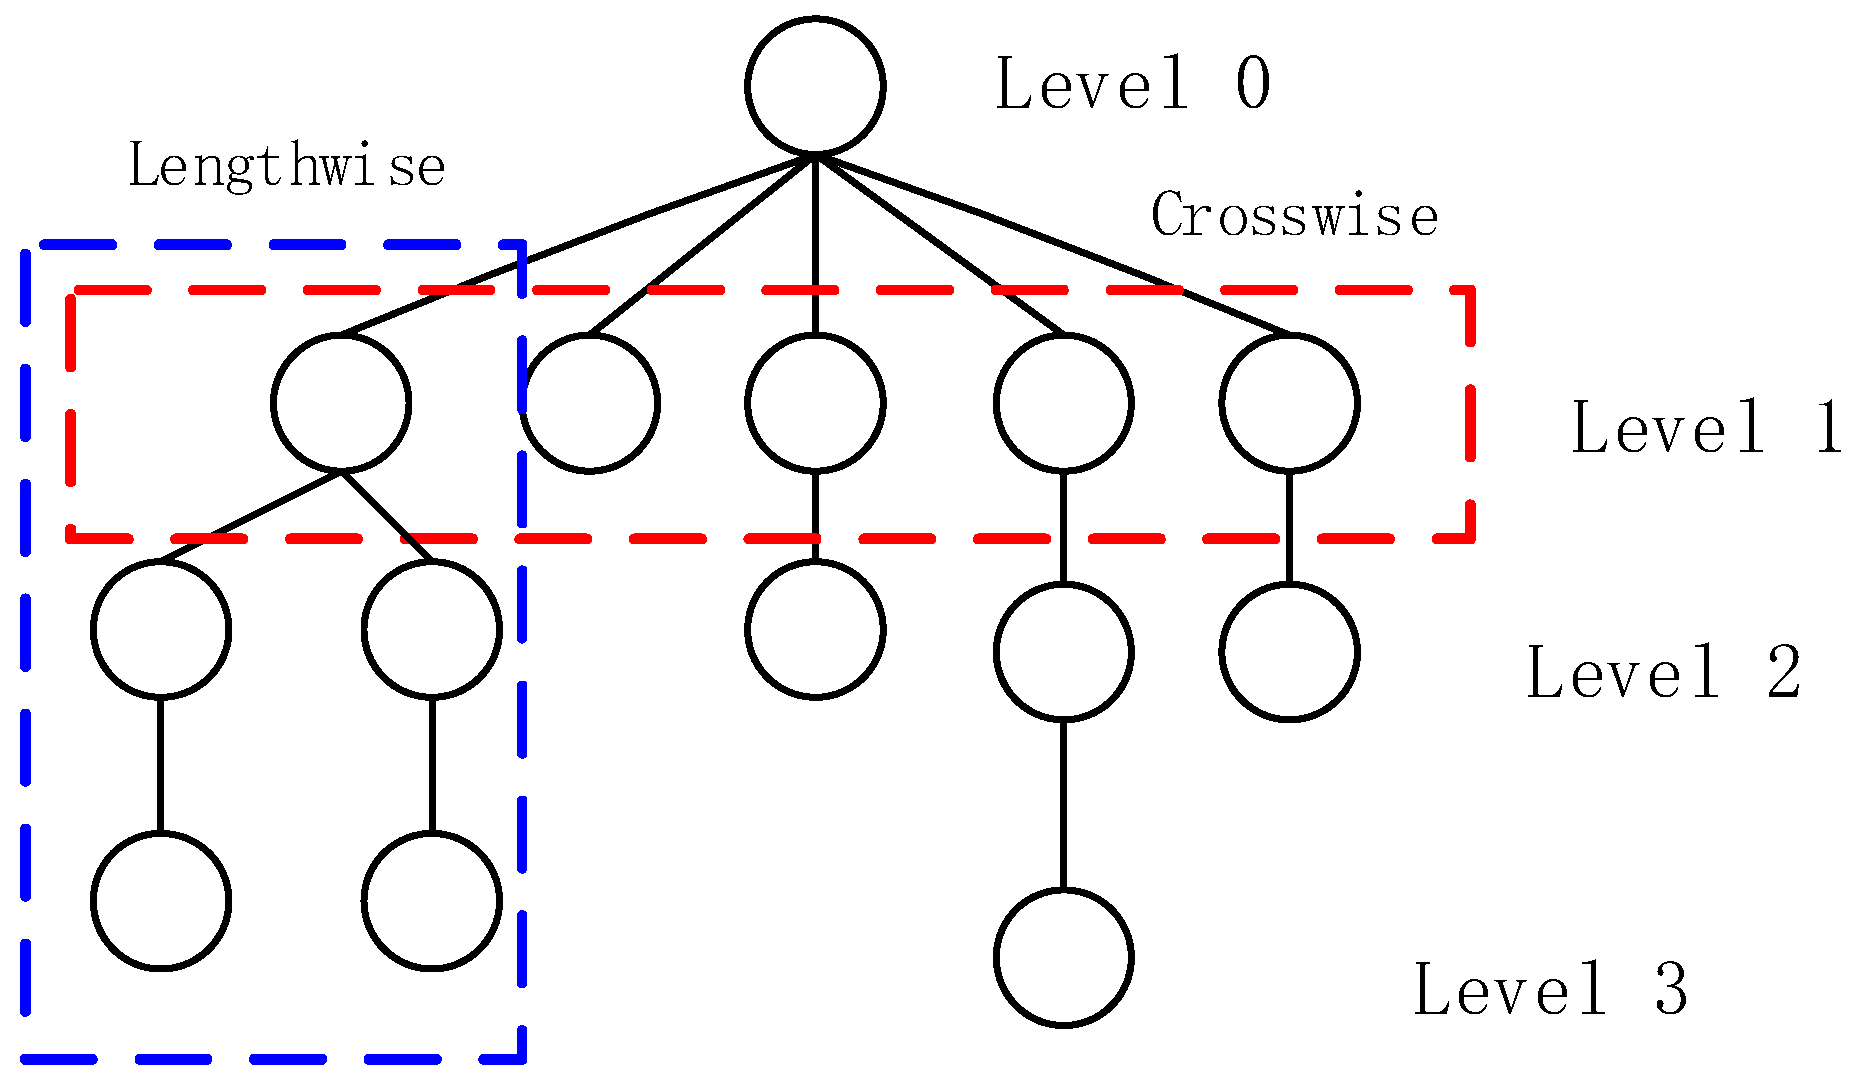
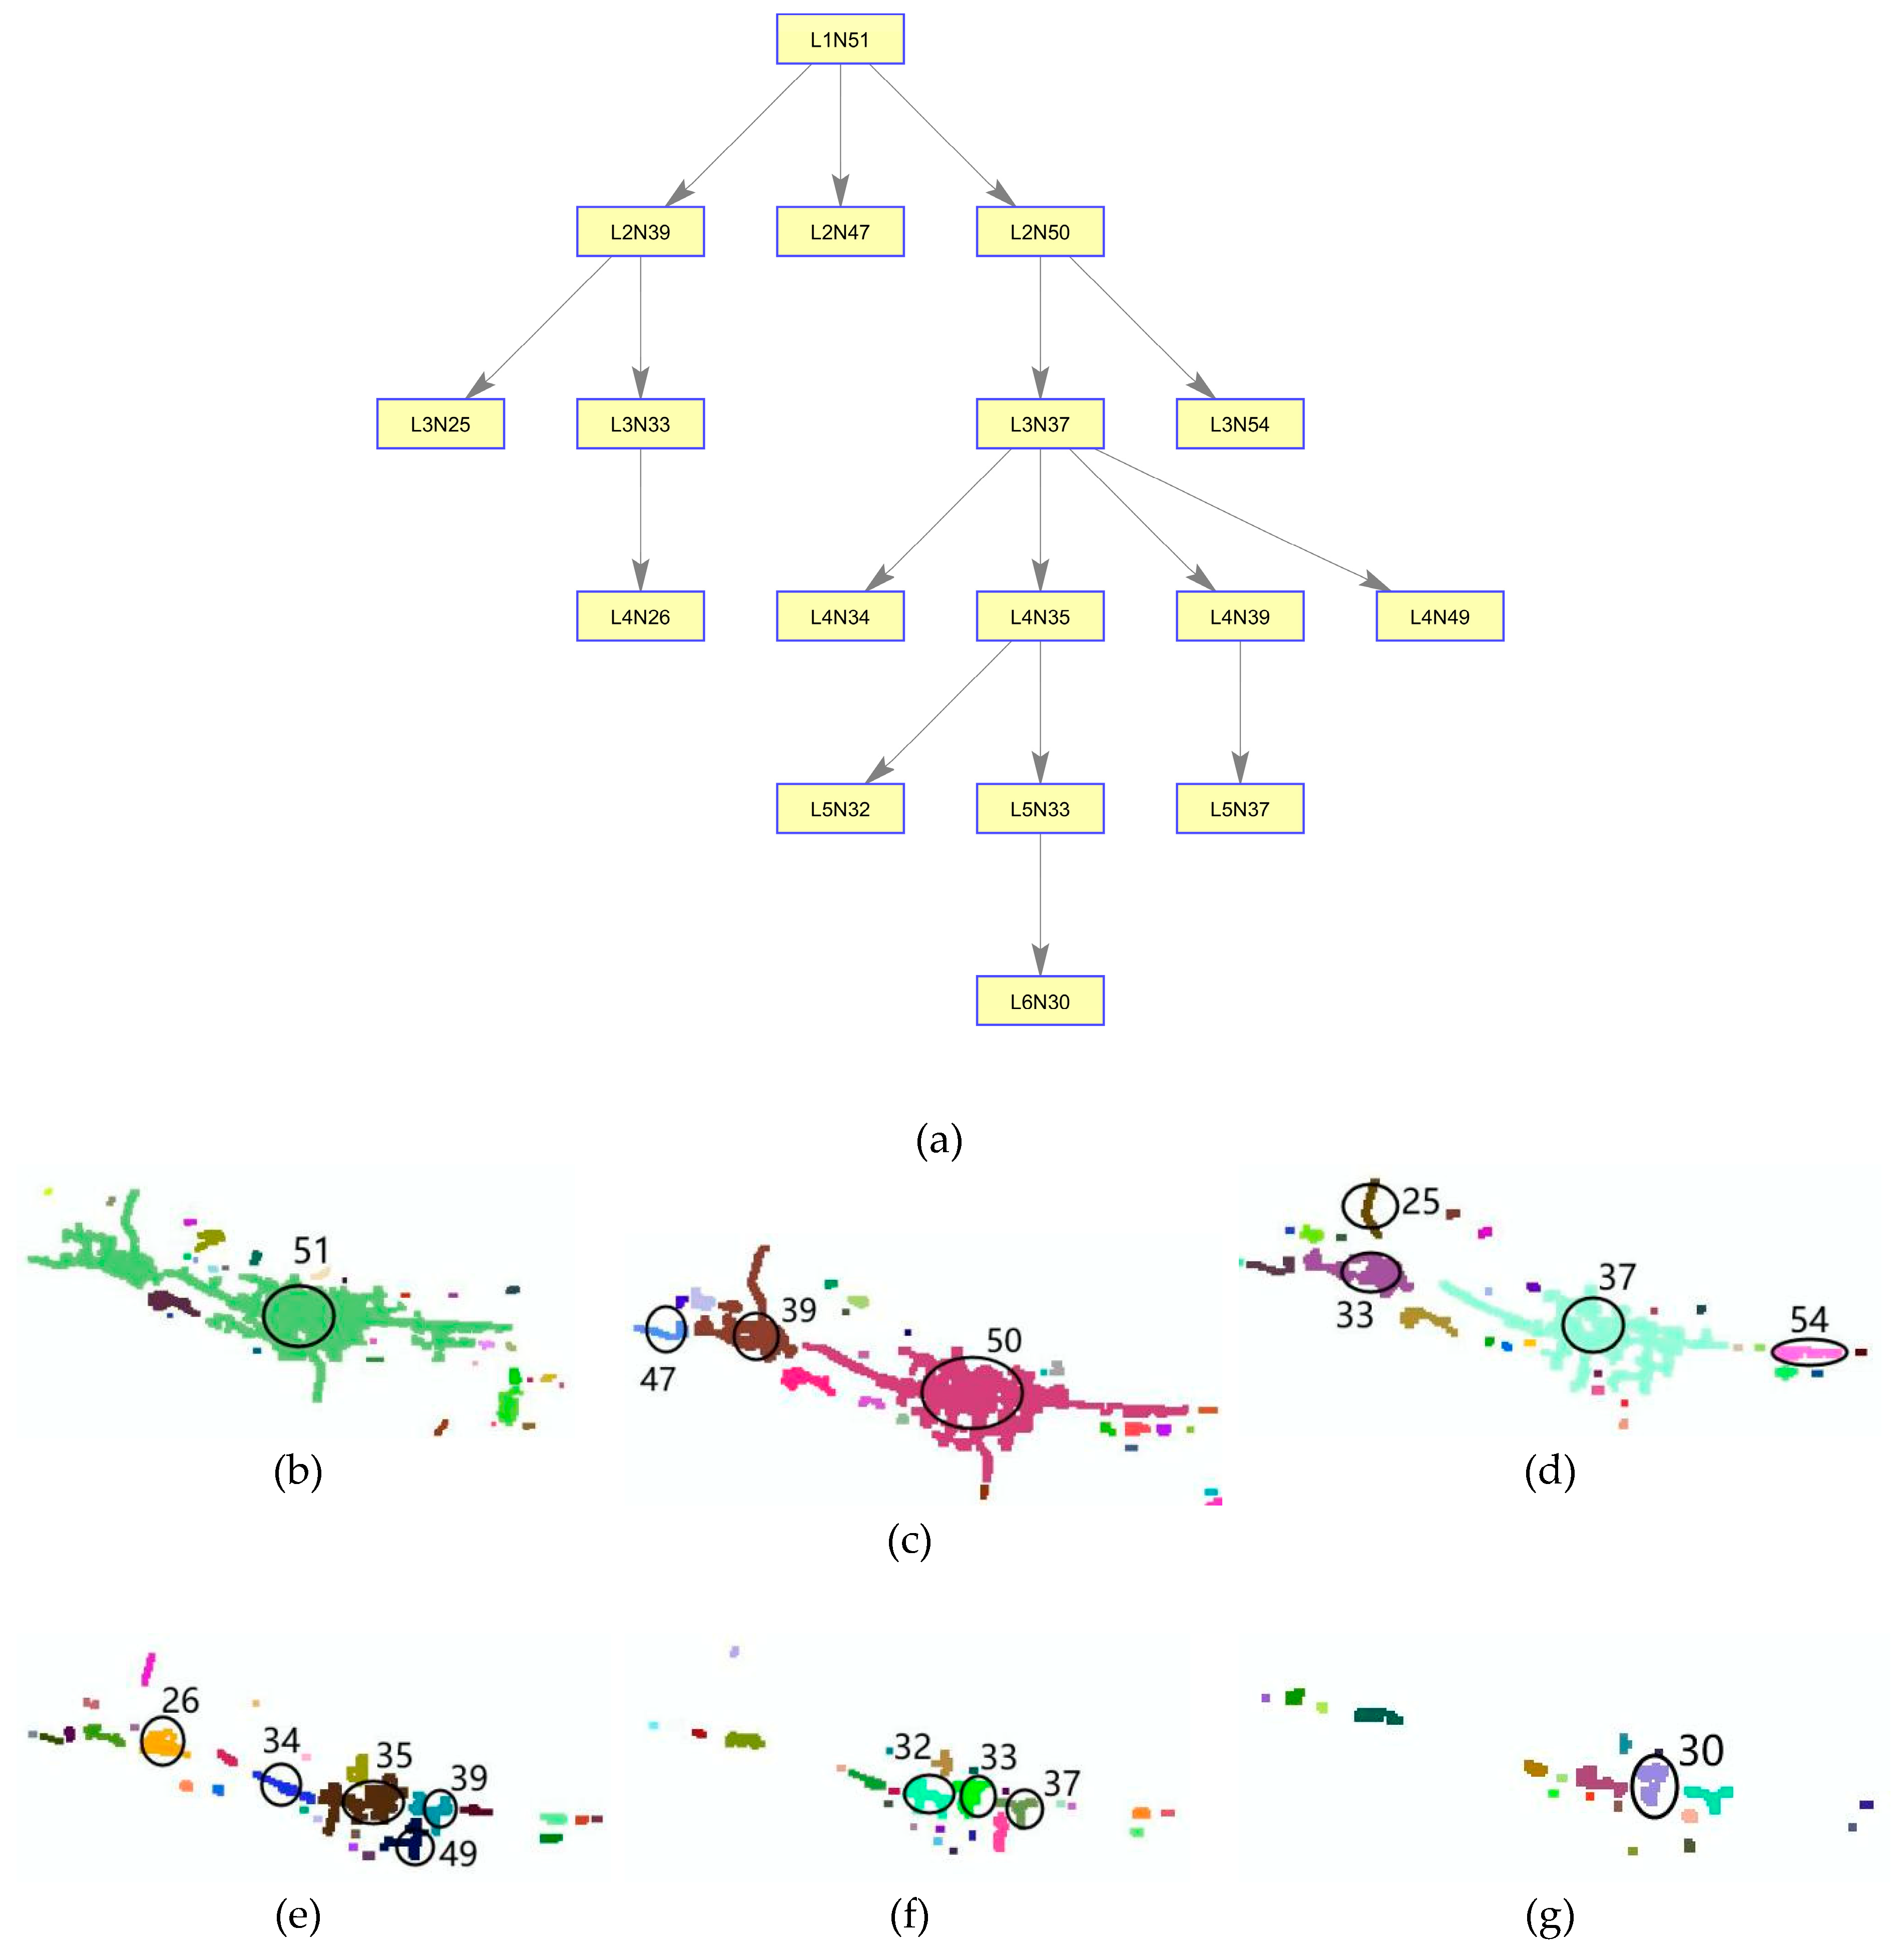
3.2. The Tree Construction of Connected Components
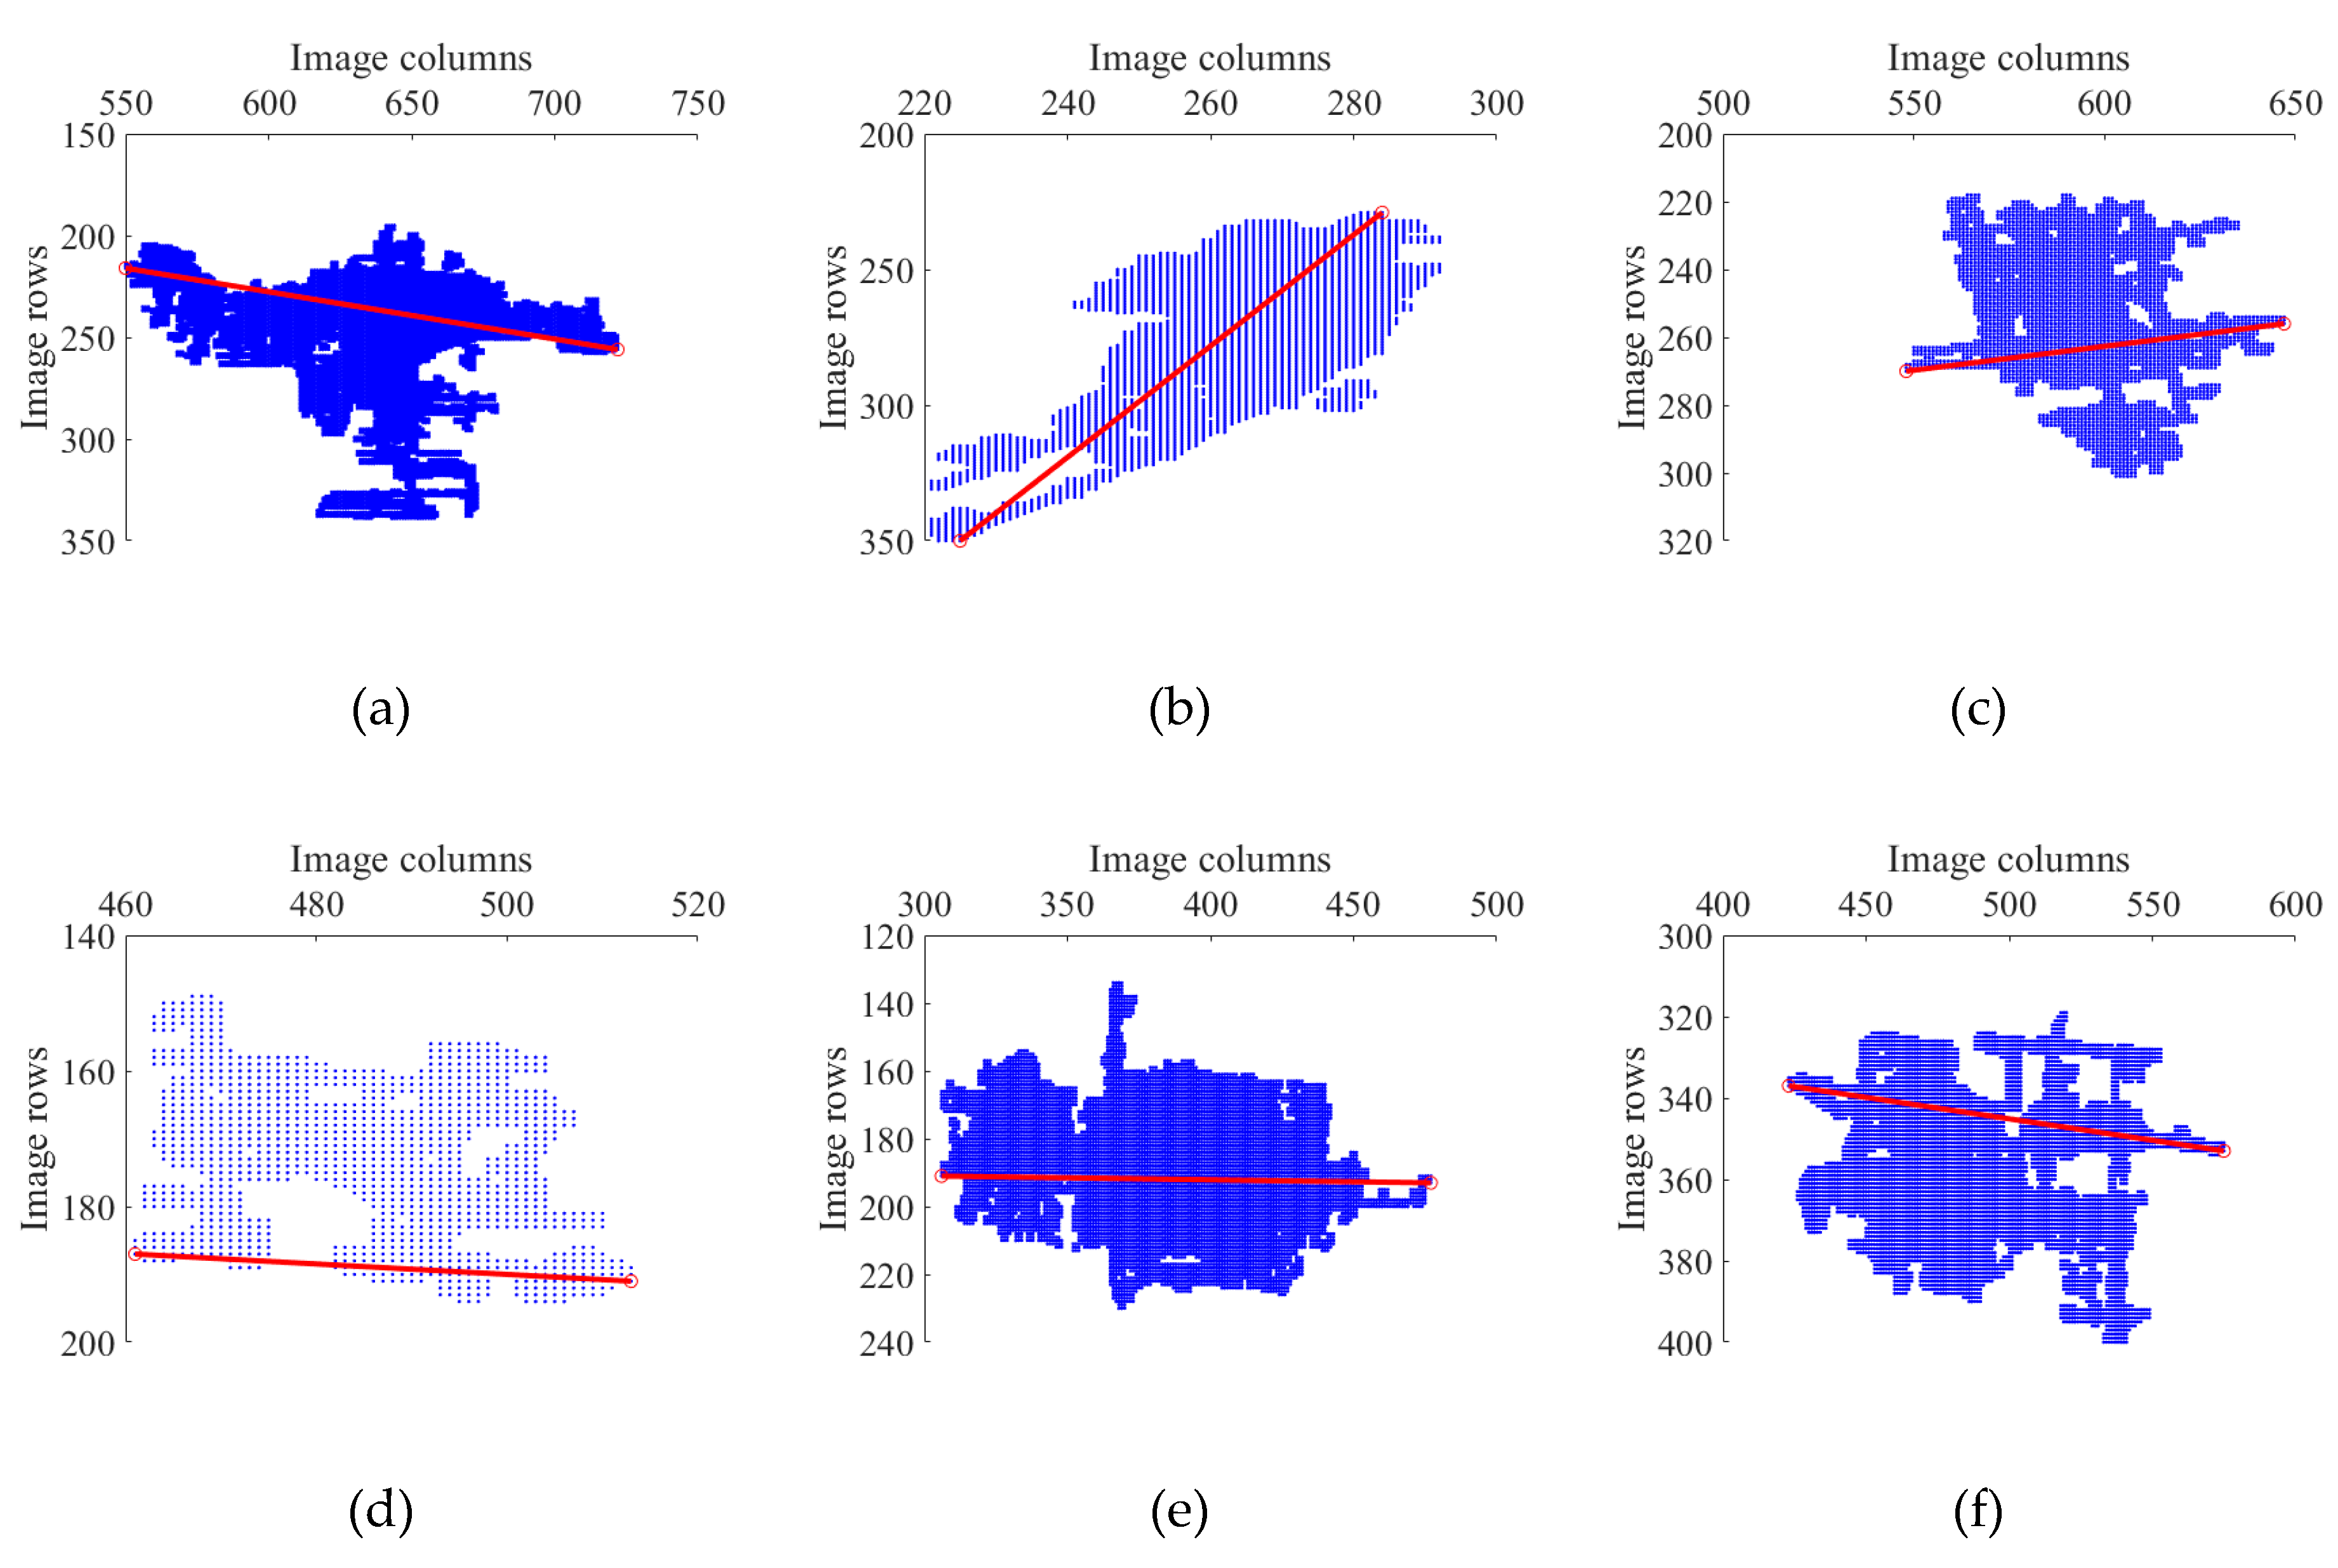
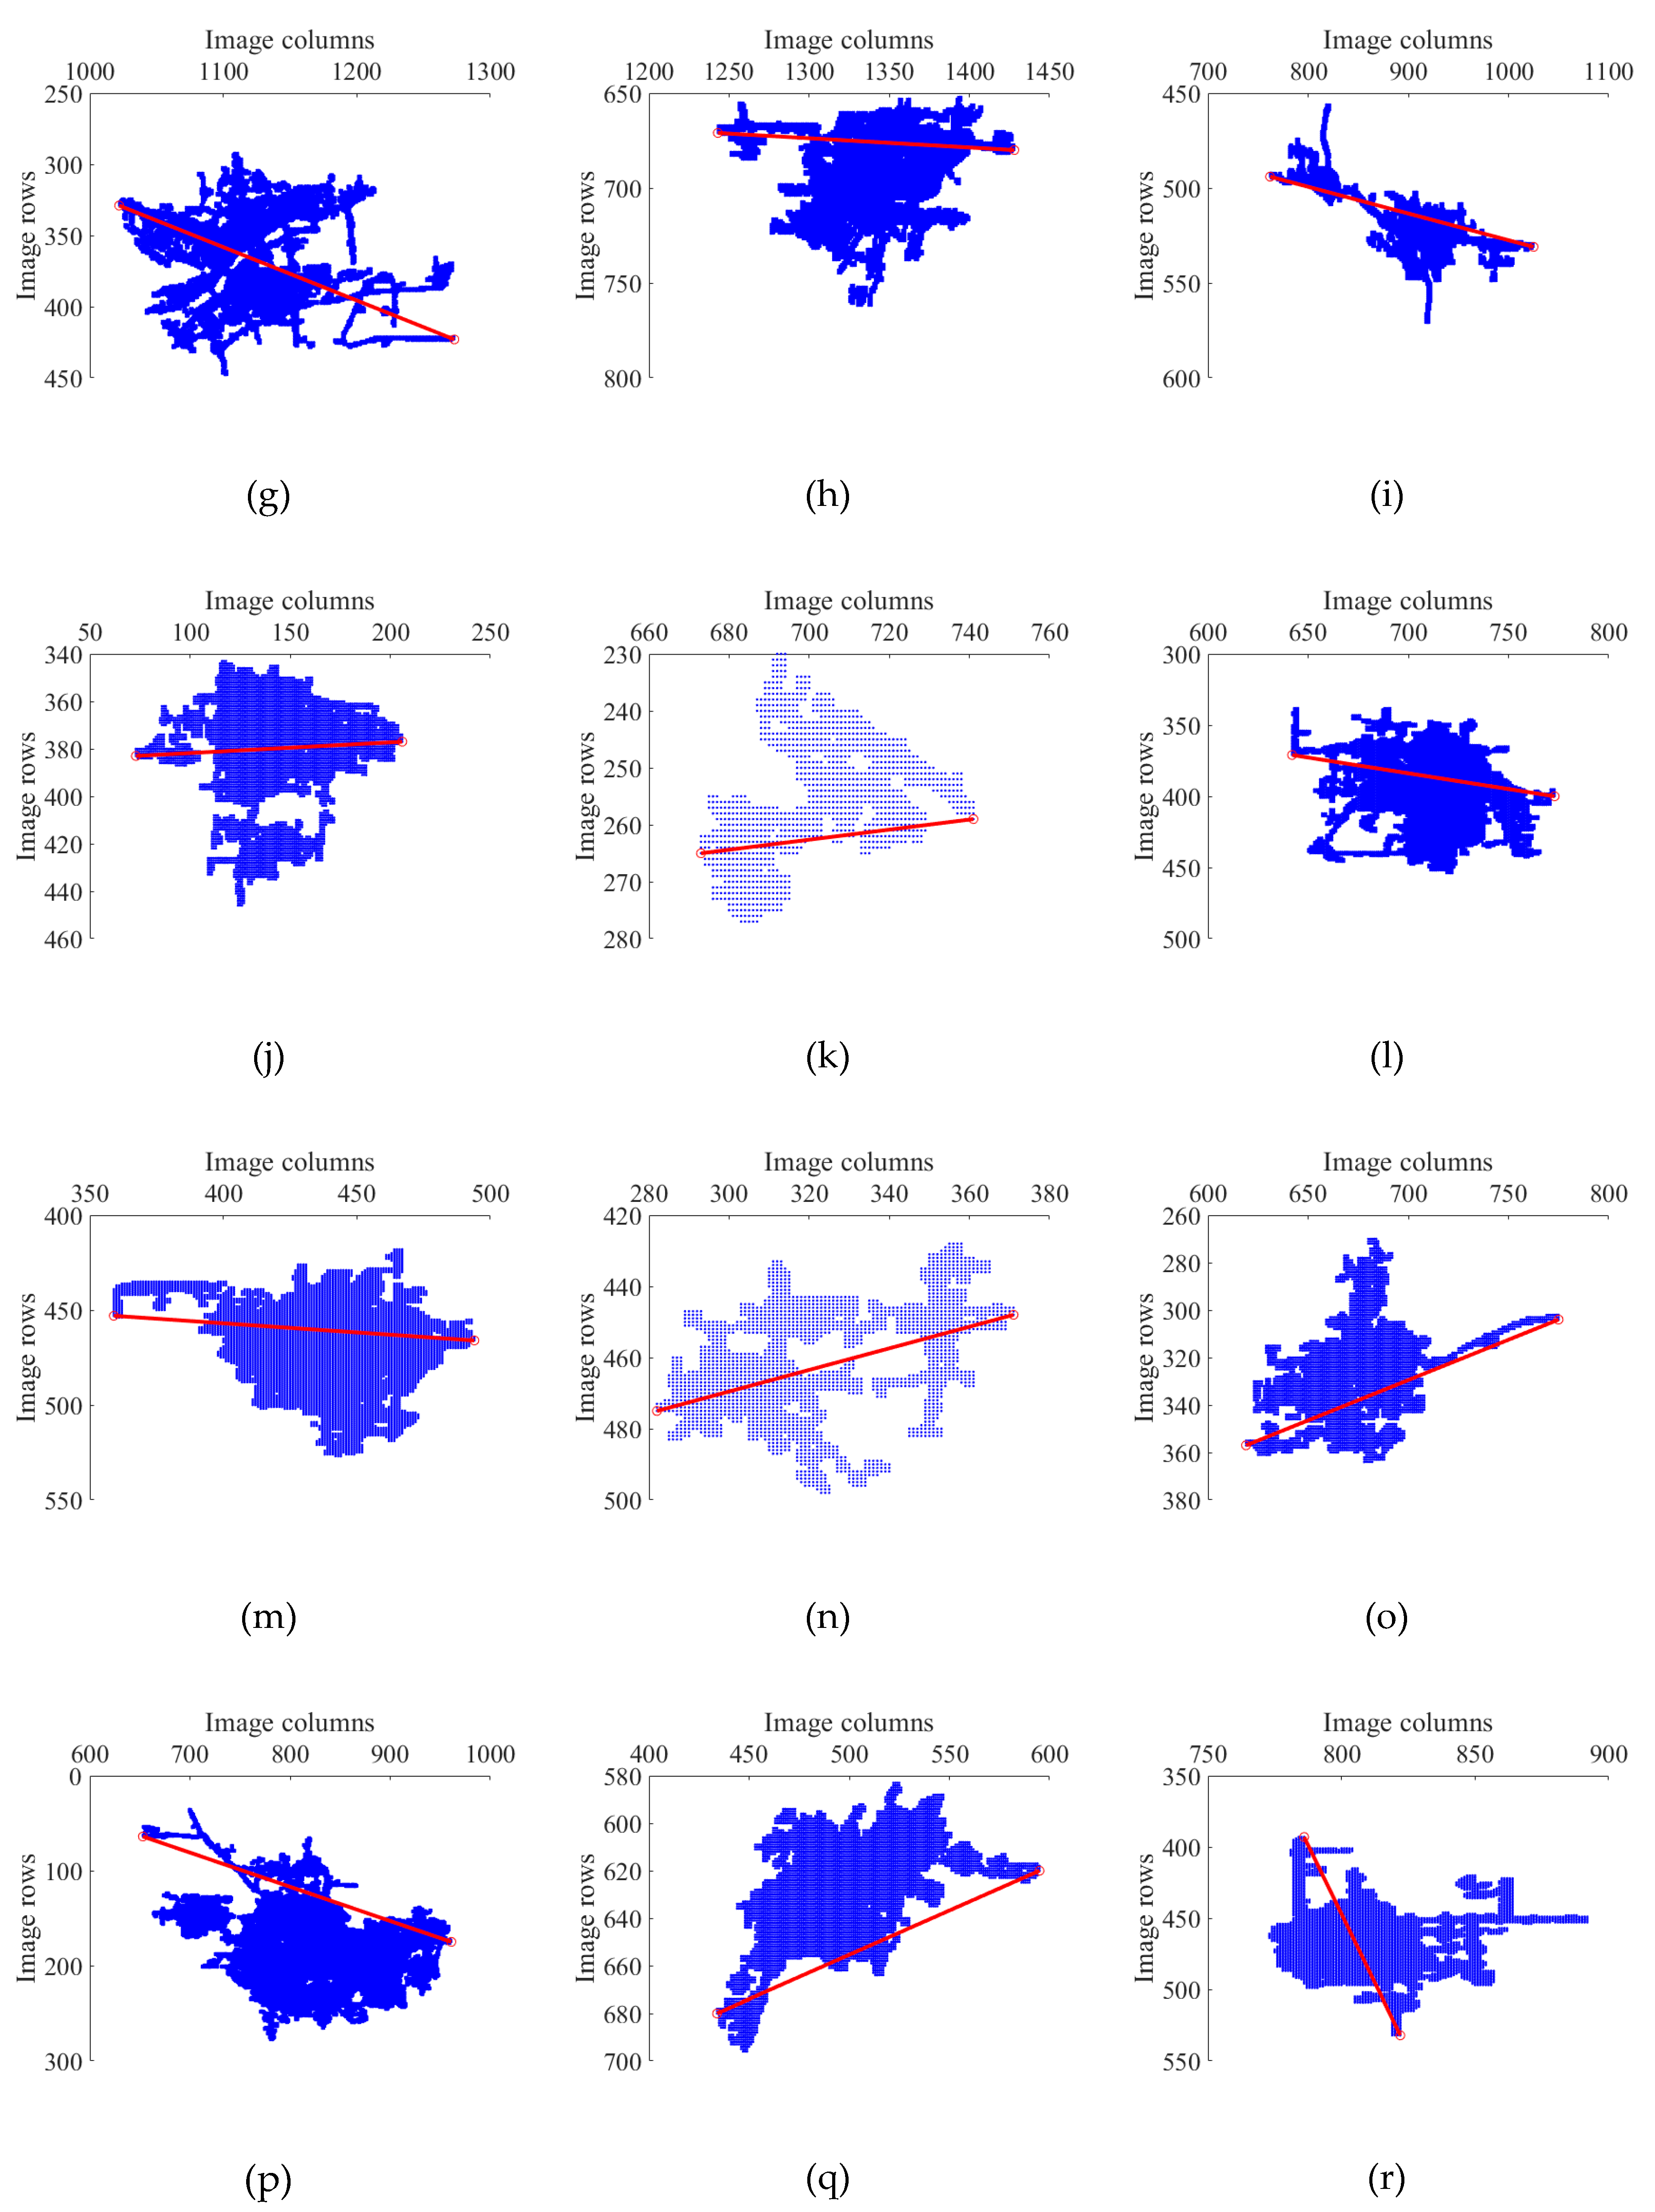
3.3. Derivation of the Node Attributes in the Tree
3.4. City Center Detection and Classification
4. Results
4.1. City Center Detection and Classification
4.2. City Classification of Henan Province
5. Discussion
6. Conclusions
Author Contributions
Funding
Conflicts of Interest
References
- He, Y.; Zhou, G.; Tang, C.; Fan, S.; Guo, X. The spatial organization pattern of urban-rural integration in urban agglomerations in China: An agglomeration-diffusion analysis of the population and firms. Habitat Int. 2019, 87, 54–65. [Google Scholar] [CrossRef]
- Sun, B.; Tu, T.; Shi, W.; Guo, Y. Test on the performance of polycentric spatial structure as a measure of congestion reduction in megacities: The case study of Shanghai. Urban Plan. Forum. 2013, 2, 63–69. [Google Scholar]
- Zhang, L.; Peng, J.; Liu, Y.; Wu, J. Coupling ecosystem services supply and human ecological demand to identify landscape ecological security pattern: A case study in Beijing–Tianjin–Hebei region, China. Urban Ecosyst. 2017, 20, 701–714. [Google Scholar] [CrossRef]
- Berry, B.J.; Baskin, C.W.; Christaller, W. Central places in Southern Germany. Econ. Geogr. 1967, 43, 275. [Google Scholar] [CrossRef]
- Mulligan, G.F. Agglomeration and Central Place Theory: A Review of the Literature. Int. Reg. Sci. Rev. 1984, 9, 1–42. [Google Scholar] [CrossRef]
- King, L.J. Central Place Theory, The Web Book of Regional Science; West Virginia University: Morgantown, WV, USA, 2020. [Google Scholar]
- Fang, J. Exploration of Domestic Urban Hierarchy Basic Indicators. Territ. Nat. Resour. Study 2015, 5, 3. [Google Scholar]
- Anas, A.; Arnott, R.; Small, K.A. Urban spatial structure. J. Econ. Lit. 1998, 36, 1426–1464. [Google Scholar]
- Li, W.; Sun, B.; Zhao, J.; Zhang, T. Economic performance of spatial structure in Chinese prefecture regions: Evidence from night-time satellite imagery. Habitat Int. 2018, 76, 29–39. [Google Scholar] [CrossRef]
- Chen, T.; Hui, E.C.M.; Wu, J.; Lang, W.; Li, X. Identifying urban spatial structure and urban vibrancy in highly dense cities using georeferenced social media data. Habitat Int. 2019, 89, 102005. [Google Scholar] [CrossRef]
- Burgess, E.W. The growth of the city: An introduction to a research project. In Urban Ecology; Springer: Boston, MA, USA, 2008; pp. 71–78. [Google Scholar]
- Krehl, A. Urban spatial structure: An interaction between employment and built-up volumes. Reg. Stud. Reg. Sci. 2015, 2, 290–308. [Google Scholar] [CrossRef]
- Roth, C.; Kang, S.M.; Batty, M.; Barthelemy, M. Structure of urban movements: Polycentric activity and entangled hierarchical flows. PLoS ONE 2011, 6, e15923. [Google Scholar] [CrossRef] [PubMed]
- Lee, B. “Edge” or “edgeless” cities? Urban spatial structure in US metropolitan areas, 1980 to 2000. J. Reg. Sci. 2007, 47, 479–515. [Google Scholar] [CrossRef]
- Vasanen, A. Functional polycentricity: Examining metropolitan spatial structure through the connectivity of urban sub-centres. Urban Stud. 2012, 49, 3627–3644. [Google Scholar] [CrossRef]
- Levy, A. Urban morphology and the problem of the modern urban fabric: Some questions for research. Urban Morphol. 1999, 3, 79–85. [Google Scholar]
- Krehl, A.; Siedentop, S.; Taubenböck, H.; Wurm, M. A comprehensive view on urban spatial structure: Urban density patterns of German city regions. ISPRS Int. J. Geo-Inf. 2016, 5, 76. [Google Scholar] [CrossRef]
- Wachowicz, M.; Arteaga, M.D.; Cha, S.; Bourgeois, Y. Developing a streaming data processing workflow for querying space–time activities from geotagged tweets. Comput. Environ. Urban. 2016, 59, 256–268. [Google Scholar] [CrossRef]
- Chen, J.; Shaw, S.L.; Yu, H.; Lu, F.; Chai, Y.; Jia, Q. Exploratory data analysis of activity diary data: A space–time GIS approach. J. Transp. Geogr. 2011, 19, 394–404. [Google Scholar] [CrossRef]
- McMillen, D.P. Identifying sub-centres using contiguity matrices. Urban Stud. 2003, 40, 57–69. [Google Scholar] [CrossRef]
- Chen, Z.; Yu, B.; Song, W.; Liu, H.; Wu, Q.; Shi, K.; Wu, J. A new approach for detecting urban centers and their spatial structure with nighttime light remote sensing. IEEE Trans. Geosci. Remote 2017, 55, 6305–6319. [Google Scholar] [CrossRef]
- Small, K.A.; Song, S. Population and employment densities: Structure and change. J. Urban Econ. 1994, 36, 292–313. [Google Scholar] [CrossRef]
- Song, S. Modelling worker residence distribution in the Los Angeles region. Urban Stud. 1994, 31, 1533–1544. [Google Scholar] [CrossRef]
- Shearmur, R.; Coffey, W.J. A tale of four cities: Intrametropolitan employment distribution in Toronto, Montreal, Vancouver, and Ottawa–Hull, 1981–1996. Environ. Plan. A 2002, 34, 575–598. [Google Scholar] [CrossRef]
- McDonald, J.F. The identification of urban employment subcenters. J. Urban Econ. 1987, 21, 242–258. [Google Scholar] [CrossRef]
- McDonald, J.F.; McMillen, D.P. Employment subcenters and land values in a polycentric urban area: The case of Chicago. Environ. Plan. A 1990, 22, 1561–1574. [Google Scholar] [CrossRef]
- McMillen, D.P. Nonparametric employment subcenter identification. J. Urban Econ. 2001, 50, 448–473. [Google Scholar] [CrossRef]
- McDonald, J.F.; Prather, P.J. Suburban employment centres: The case of Chicago. Urban Stud. 1994, 31, 201–218. [Google Scholar] [CrossRef]
- Cladera, J.R.; Duarte, C.R.M.; Moix, M. Urban structure and polycentrism: Towards a redefinition of the sub-centre concept. Urban Stud. 2009, 46, 2841–2868. [Google Scholar] [CrossRef]
- Wei, Y.; Liu, H.; Song, W.; Yu, B.; Xiu, C. Normalization of time series DMSP-OLS nighttime light images for urban growth analysis with Pseudo Invariant Features. Landsc. Urban Plan. 2014, 128, 1–13. [Google Scholar] [CrossRef]
- Liu, Z.; He, C.; Zhang, Q.; Huang, Q.; Yang, Y. Extracting the dynamics of urban expansion in China using DMSP-OLS nighttime light data from 1992 to 2008. Landsc. Urban Plan. 2012, 106, 62–72. [Google Scholar] [CrossRef]
- Zhang, Q.; Seto, K.C. Mapping urbanization dynamics at regional and global scales using multi-temporal DMSP/OLS nighttime light data. Remote Sens. Environ. 2011, 115, 2320–2329. [Google Scholar] [CrossRef]
- Ma, T.; Zhou, Y.; Zhou, C.; Haynie, S.; Pei, T.; Xu, T. Night-time light derived estimation of spatio-temporal characteristics of urbanization dynamics using DMSP/OLS satellite data. Remote Sens. Environ. 2015, 158, 453–464. [Google Scholar] [CrossRef]
- Small, C.; Pozzi, F.; Elvidge, C.D. Spatial analysis of global urban extent from DMSP-OLS night lights. Remote Sens. Environ. 2005, 96, 277–291. [Google Scholar] [CrossRef]
- Yu, B.; Shu, S.; Liu, H.; Song, W.; Wu, J.; Wang, L.; Chen, Z. Object-based spatial cluster analysis of urban landscape pattern using nighttime light satellite images: A case study of China. Int. J. Geogr. Inf. Sci. 2014, 28, 2328–2355. [Google Scholar] [CrossRef]
- Xu, H.; Yang, H.; Li, X.; Jin, H.; Li, D. Multi-scale measurement of regional inequality in Mainland China during 2005–2010 using DMSP/OLS night light imagery and population density grid data. Sustainability 2015, 7, 13469–13499. [Google Scholar] [CrossRef]
- Shi, K.; Chen, Y.; Yu, B.; Xu, T.; Li, L.; Huang, C.; Liu, R.; Chen, Z.; Wu, J. Urban expansion and agricultural land loss in China: A multiscale perspective. Sustainability 2016, 8, 790. [Google Scholar] [CrossRef]
- Bennett, M.M.; Smith, L.C. Advances in using multitemporal night-time lights satellite imagery to detect, estimate, and monitor socioeconomic dynamics. Remote Sens. Environ. 2017, 192, 176–197. [Google Scholar] [CrossRef]
- Shi, K.; Chen, Y.; Yu, B.; Xu, T.; Chen, Z.; Liu, R.; Li, L.; Wu, J. Modeling spatiotemporal CO2 (carbon dioxide) emission dynamics in China from DMSP-OLS nighttime stable light data using panel data analysis. Appl. Energy 2016, 168, 523–533. [Google Scholar] [CrossRef]
- Li, X.; Xu, H.; Chen, X.; Li, C. Potential of NPP-VIIRS nighttime light imagery for modeling the regional economy of China. Remote Sens. 2013, 5, 3057–3081. [Google Scholar] [CrossRef]
- Shi, K.; Huang, C.; Yu, B.; Huang, Y.; Wu, J. Evaluation of NPP-VIIRS night-time light composite data for extracting built-up urban areas. Remote Sens. Lett. 2014, 5, 358–366. [Google Scholar] [CrossRef]
- Yu, B.; Shi, K.; Hu, Y.; Huang, C.; Chen, Z.; Wu, J. Poverty evaluation using NPP-VIIRS nighttime light composite data at the county level in China. IEEE J-STARS 2015, 8, 1217–1229. [Google Scholar] [CrossRef]
- Chen, Z.; Yu, B.; Hu, Y.; Huang, C.; Shi, K.; Wu, J. Estimating house vacancy rate in metropolitan areas using NPP-VIIRS nighttime light composite data. IEEE J-STARS 2015, 8, 2188–2197. [Google Scholar] [CrossRef]
- Li, D.R.; Zhang, G.; Shen, X.; Zhong, X.; Jiang, Y.; Wang, T.; Tu, J.; Li, Z. Design and processing night light remote sensing of LJ-1 01 satellite. J. Remote Sens. 2019, 23, 1011–1022. [Google Scholar]
- Zhong, L.; Liu, X. Application of LJ1-01 remote sensing data in marine vessel detection. Remote Sens. Inf. 2019, 34, 126–131. [Google Scholar]
- Li, X.; Zhao, L.; Li, D.; Xu, H. Mapping Urban Extent Using Luojia 1-01 Nighttime Light Imagery. Sensors 2018, 18, 3665. [Google Scholar] [CrossRef]
- Li, X.; Zhu, J.; Yin, X.D.; Yao, J.; Huang, J.; Li, M. Mapping construction land of Guangzhou based on Luojia No.1 nightlight data. J. Geo-Inf. Sci. 2019, 21, 1802–1810. [Google Scholar]
- Ou, J.; Liu, X.; Liu, P.; Liu, X. Evaluation of Luojia 1-01 nighttime light imagery for impervious surface detection: A comparison with NPP-VIIRS nighttime light data. Int. J. Appl. Earth Obs. 2019, 81, 1–12. [Google Scholar] [CrossRef]
- Wang, L.; Fan, H.; Wang, Y. Improving population mapping using Luojia 1-01 nighttime light image and location-based social media data. Sci. Total Environ. 2020, 730, 139148. [Google Scholar] [CrossRef]
- Jiang, W.; He, G.; Long, T.; Guo, H.; Yin, R.; Leng, W.; Liu, H.; Wang, G. Potentiality of Using Luojia 1-01 Nighttime Light Imagery to Investigate Artificial Light Pollution. Sensors 2018, 18, 2900. [Google Scholar] [CrossRef]
- Li, S.; Zhao, C. Study on population spatialization of Henan province based on land use and DMSP/OLS data. J. Nat. Sci. Hunan. Norm. Univ. 2019, 42, 9–15. [Google Scholar]
- Zhang, Y.; Wang, P. Regional economic spatial autocorrelation analysis based on multiple spatial weight matrices: A case study of Henan province. Geomat. Spat. Inf. Tech. 2020, 43, 45–49. [Google Scholar]
- Statistical communique of henan province on national economic and social development in 2018. Available online: http://www.ha.stats.gov.cn/sitesources/hntj/page_pc/zfxxgk/tzgg/articlecfa803b024634e0b9a3a3bcb445cee74.html (accessed on 10 May 2020).
- Braga-Neto, U.; Goutsias, J. Connectivity on Complete Lattices: New Results. Comput. Vis. Image Underst. 2002, 85, 22–53. [Google Scholar] [CrossRef]
- Ouzounis, G.K.; Wilkinson, M.H.F. Mask-Based Second-Generation Connectivity and Attribute Filters. IEEE Trans. Pattern Anal. Mach. Intell. 2007, 29, 990–1004. [Google Scholar] [CrossRef] [PubMed]
- Salembier, P.; Oliveras, A.; Garrido, L. Anti-extensive connected operators for image and sequence processing. IEEE Trans. Image Process. 1998, 7, 555–570. [Google Scholar] [CrossRef] [PubMed]
- Monasse, P.; Guichard, F. Fast computation of a contrast invariant image representation. IEEE Trans. Image Process. 2000, 9, 860–872. [Google Scholar] [CrossRef] [PubMed]
- Salembier, P.; Garrido, L. Binary partition tree as an efficient representation for image processing, segmentation and information retrieval. IEEE Trans. Image Process. 2000, 9, 561–576. [Google Scholar] [CrossRef] [PubMed]
- Population Development Report of Henan in 2018. Available online: http://www.ha.stats.gov.cn/sitesources/hntj/page_pc/tjfw/zxfb/article23b7b91dd3ee4b32b76187a648b17ba2.html (accessed on 10 May 2020).


| Number | Date | Orbital Number | Resolution (m) |
|---|---|---|---|
| 1 | 05102018 | 142,928 | 130 |
| 2 | 05102018 | 142,948 | 130 |
| 3 | 05102018 | 143,018 | 130 |
| 4 | 30102018 | 143,945 | 130 |
| 5 | 30102018 | 144,005 | 130 |
| 6 | 30102018 | 144,020 | 130 |
| 7 | 30102018 | 144,035 | 130 |
| 8 | 11032019 | 145,910 | 130 |
| 9 | 11032019 | 145,930 | 130 |
| Attribute | Definition |
|---|---|
| Maximum Intensity (MAXIN) | N is the number of nodes at level 1 for an urban area, and ri is the average night-time light intensity value of the ith node. |
| Total Intensity (TIN) | |
| Intensity Standard Deviation (INSTD) | |
| Maximum Area (MAXA) | ai is the average area of the ith node. |
| Total Area (TA) | |
| Area Standard Deviation (ASTD) | |
| Width | The maximum width of an urban development center. |
| Angle | The development direction of the urban development center. |
| Level Number (LN) | LN is the level number of a tree structure for urban center. |
| Max Node Number (MNN) | MNN is the max node number of a tree for urban center. |
| City | MAXIN | TIN | INSTD | MAXA (km2) | TA (km2) | ASTD | Width (km) | Angle | LN | MNN |
|---|---|---|---|---|---|---|---|---|---|---|
| Anyang | 0.34 | 1.70 | 0.05 | 158.88 | 327.45 | 959.05 | 22.88 | 0.23 | 16 | 7 |
| Hebi | 0.10 | 0.40 | 0.03 | 58.10 | 89.86 | 603.28 | 17.42 | −1.12 | 5 | 3 |
| Jiaozuo | 0.18 | 1.03 | 0.03 | 67.38 | 153.72 | 400.80 | 12.87 | −0.14 | 5 | 3 |
| Jiyuan | 0.17 | 0.31 | 0.03 | 21.68 | 27.14 | 219.96 | 6.76 | 0.08 | 2 | 2 |
| Kaifeng | 0.25 | 1.13 | 0.04 | 132.26 | 262.95 | 864.91 | 22.23 | 0.01 | 15 | 3 |
| Luohe | 0.17 | 0.31 | 0.03 | 101.38 | 138.66 | 1019.44 | 19.76 | 0.11 | 7 | 4 |
| Luoyang | 0.20 | 1.76 | 0.03 | 235.64 | 394.87 | 1042.34 | 34.84 | 0.36 | 7 | 8 |
| Nanyang | 0.95 | 4.45 | 0.11 | 138.60 | 325.66 | 623.66 | 24.05 | 0.05 | 7 | 4 |
| Pingdingshan | 0.15 | 1.14 | 0.03 | 85.90 | 182.57 | 509.41 | 34.45 | 0.14 | 6 | 5 |
| Puyang | 0.12 | 0.53 | 0.02 | 95.40 | 128.73 | 667.98 | 17.29 | −0.05 | 7 | 4 |
| Sanmenxia | 0.12 | 0.57 | 0.03 | 21.04 | 48.69 | 192.61 | 8.84 | −0.09 | 2 | 3 |
| Shangqiu | 0.14 | 0.78 | 0.02 | 132.43 | 261.81 | 809.25 | 17.42 | 0.22 | 15 | 2 |
| Xinxiang | 0.16 | 1.59 | 0.03 | 107.08 | 276.70 | 605.76 | 17.55 | 0.10 | 5 | 4 |
| Xinyang | 0.14 | 0.86 | 0.03 | 39.41 | 141.96 | 351.44 | 12.09 | −0.30 | 3 | 3 |
| Xuchang | 0.44 | 1.51 | 0.05 | 75.85 | 189.21 | 516.12 | 21.32 | −0.33 | 6 | 4 |
| Zhengzhou | 0.18 | 4.14 | 0.03 | 461.12 | 907.06 | 1433.26 | 42.51 | 0.35 | 19 | 10 |
| Zhoukou | 0.40 | 1.44 | 0.04 | 108.75 | 287.86 | 669.91 | 22.23 | −0.36 | 14 | 2 |
| Zhumadian | 0.17 | 1.06 | 0.03 | 91.19 | 301.50 | 706.60 | 18.59 | 1.32 | 7 | 3 |
| City | Index | Ranking | GDP Ranking | Difference | Proportion |
|---|---|---|---|---|---|
| Anyang | 0.37 | 4 | 7 | 3 | 0.18 |
| Hebi | 0.09 | 16 | 17 | 1 | 0.06 |
| Jiaozuo | 0.20 | 12 | 10 | 2 | 0.12 |
| Jiyuan | 0.05 | 18 | 18 | 0 | 0.00 |
| Kaifeng | 0.27 | 9 | 13 | 4 | 0.24 |
| Luohe | 0.11 | 15 | 16 | 1 | 0.06 |
| Luoyang | 0.42 | 3 | 2 | 1 | 0.06 |
| Nanyang | 0.68 | 2 | 3 | 1 | 0.06 |
| Pingdingshan | 0.23 | 11 | 12 | 1 | 0.06 |
| Puyang | 0.13 | 14 | 14 | 0 | 0.00 |
| Sanmenxia | 0.09 | 17 | 15 | 2 | 0.12 |
| Shangqiu | 0.23 | 10 | 8 | 2 | 0.12 |
| Xinxiang | 0.33 | 5 | 8 | 3 | 0.18 |
| Xinyang | 0.17 | 13 | 9 | 4 | 0.24 |
| Xuchang | 0.27 | 8 | 4 | 4 | 0.24 |
| Zhengzhou | 0.96 | 1 | 1 | 0 | 0.00 |
| Zhoukou | 0.32 | 6 | 5 | 1 | 0.06 |
| Zhumadian | 0.29 | 7 | 11 | 4 | 0.24 |
| City | 2017 | 2018 | Q | Grade |
|---|---|---|---|---|
| Zhengzhou | 1 | 1 | 0.98 | 1 |
| Anyang | 4 | 4 | 0.57 | 3 |
| Nanyang | 3 | 3 | 0.53 | 3 |
| Luoyang | 3 | 3 | 0.50 | 3 |
| Kaifeng | 4 | 4 | 0.41 | 3 |
| Zhoukou | 4 | 4 | 0.39 | 4 |
| Shangqiu | 4 | 3 | 0.36 | 4 |
| Xinxiang | 4 | 3 | 0.33 | 4 |
| Pingdingshan | 4 | 4 | 0.32 | 4 |
| Xuchang | 4 | 3 | 0.32 | 4 |
| Zhumadian | 4 | 3 | 0.31 | 4 |
| Puyang | 5 | 4 | 0.26 | 4 |
| Luohe | 5 | 4 | 0.25 | 4 |
| Jiaozuo | 4 | 4 | 0.24 | 4 |
| Xinyang | 4 | 3 | 0.20 | 4 |
| Hebi | 5 | 5 | 0.19 | 5 |
| Sanmenxia | 5 | 5 | 0.15 | 5 |
| Jiyuan | 5 | 5 | 0.10 | 5 |
© 2020 by the authors. Licensee MDPI, Basel, Switzerland. This article is an open access article distributed under the terms and conditions of the Creative Commons Attribution (CC BY) license (http://creativecommons.org/licenses/by/4.0/).
Share and Cite
Zhao, Z.; Cheng, G.; Wang, C.; Wang, S.; Wang, H. City Grade Classification Based on Connectivity Analysis by Luojia I Night-Time Light Images in Henan Province, China. Remote Sens. 2020, 12, 1705. https://doi.org/10.3390/rs12111705
Zhao Z, Cheng G, Wang C, Wang S, Wang H. City Grade Classification Based on Connectivity Analysis by Luojia I Night-Time Light Images in Henan Province, China. Remote Sensing. 2020; 12(11):1705. https://doi.org/10.3390/rs12111705
Chicago/Turabian StyleZhao, Zongze, Gang Cheng, Cheng Wang, Shuangting Wang, and Hongtao Wang. 2020. "City Grade Classification Based on Connectivity Analysis by Luojia I Night-Time Light Images in Henan Province, China" Remote Sensing 12, no. 11: 1705. https://doi.org/10.3390/rs12111705
APA StyleZhao, Z., Cheng, G., Wang, C., Wang, S., & Wang, H. (2020). City Grade Classification Based on Connectivity Analysis by Luojia I Night-Time Light Images in Henan Province, China. Remote Sensing, 12(11), 1705. https://doi.org/10.3390/rs12111705