Article

In-Flight Radiometric Calibration of Compact Infrared Camera (CIRC) Instruments Onboard ALOS-2 Satellite and International Space Station

1
Department of Computer and Information Sciences, Ibaraki University, Hitachi, Ibaraki 3168511, Japan
2
Japan Aerospace Exploration Agency (JAXA), Tsukuba, Ibaraki 3058505, Japan
*
Author to whom correspondence should be addressed.
Remote Sens. 2020, 12(1), 58; https://doi.org/10.3390/rs12010058
Submission received: 27 November 2019 / Revised: 18 December 2019 / Accepted: 19 December 2019 / Published: 22 December 2019
(This article belongs to the Special Issue Cross-Calibration and Interoperability of Remote Sensing Instruments)

Abstract

:
The Compact Infrared Camera (CIRC) instruments onboard the Advanced Land Observing Satellite-2 (ALOS-2) and the Calorimetric Electron Telescope (CALET) attached to the International Space Station are satellite-borne 2D-array thermal infrared cameras for technical demonstrations in fields such as forest fire monitoring, volcano monitoring, and heat island analysis. Since they have the characteristics of low cost and low power consumption and have no onboard calibrator such as a blackbody or shutter, in-flight calibration should be performed by vicarious calibration (VC) and cross-calibration (CC). In this study, we determined the recalibration coefficients for both of the CIRC instruments as a function of time based on VC experiments in Lake Kasumigaura (Japan) and Railroad Valley Playa (USA), VC with telemetry data from three lakes in Japan and the USA, and CC with imagers onboard two geostationary satellites (MTSAT-2 and Himawari-8). As a result, the derived recalibration coefficients improved the accuracy of the ground-testing-based radiance remarkably in both of the CIRC instruments, suggesting that the recalibrated radiance can satisfy the target accuracy of CIRC, given as 2 K at 300 K. These coefficients, as a function of time, will be applied to all CIRC images by reprocessing planned in the near future.

Graphical Abstract

1. Introduction

The Compact Infrared Camera (CIRC) of the Japan Aerospace Exploration Agency (JAXA) is a satellite-borne 2D-array thermal-infrared (TIR) camera for technical demonstrations [1]. The instrument has advantages in its low cost and low power consumption and is expected to be used in fields such as forest fire monitoring, volcano monitoring, and heat island analysis. At present, two CIRCs have been developed. One is onboard JAXA’s Advanced Land Observing Satellite-2 (ALOS-2), launched in May 2014 [2], and is in operation as of November 2019. The other is onboard the Calorimetric Electron Telescope (CALET) [3] which was mounted on the Japanese Experiment Module (JEM) of the International Space Station (ISS) in August 2015, and was operated until the end of March 2019. The two CIRCs (referred to as ALOS-2/CIRC and CALET/CIRC) have the same basic specifications, except for the ground resolution and the ground coverage area, which are dependent on altitude: the ground resolution is 200 m and 130 m, and the ground coverage area is 128 × 96 km2 and 85 × 64 km2, for ALOS-2/CIRC (at an altitude of 600 km) and CALET/CIRC (at an altitude of 400 km), respectively. All the images acquired by these CIRC instruments have been released to the public through the Internet [4]. The volcano monitoring system preliminarily operated by JAXA also provides CIRC images acquired over volcanos in parts of Asia [5].
The designed radiometric accuracy of the CIRC instruments is specified by the minimum success accuracy (or the standard accuracy) of 4 K at 300 K and the full success accuracy (or the target accuracy) of 2 K at 300 K [1]. These accuracies are worse than the typical accuracy of satellite-borne TIR sensors, such as the Advanced Spaceborne Thermal Emission and Reflection Radiometer (ASTER) [6] and the Moderate Resolution Imaging Spectroradiometer (MODIS) [7], because the CIRC instruments have no onboard calibrator such as a blackbody or shutter, and also have no capability of deep space viewing under the design concept. Therefore, vicarious calibration (VC) and/or cross-calibration (CC) are necessary for the in-flight calibration of the CIRC instruments. Under such a background, the present paper describes the recent results of the in-flight calibration of ALOS-2/CIRC and CALET/CIRC using VC and CC data acquired in or before September 2019.
The in-flight calibration of the CIRC instruments has been performed using three approaches: (1) experiment-based VC (referred to as Exp-VC); (2) telemetry-based VC (referred to as Tel-VC); and (3) CC using geostationary satellite (GS) sensors. In Section 2, the CIRC instruments are overviewed, and the methodologies of Exp-VC, Tel-VC, CC, and the determination of the recalibration coefficients are described. In Section 3, some error sources in VC and CC are investigated, and the recalibration coefficients for each of ALOS-2/CIRC and CALET/CIRC are determined using the VC and CC results. The accuracies of the original radiance and the recalibrated radiance are also evaluated. Section 4 gives a summary and the conclusions.

2. Materials and Methods

2.1. Compact Infrared Camera (CIRC)

2.1.1. Overview of the CIRC Instrument

The CIRC instrument was designed based on a TIR camera for customer use, and can be developed with low cost in a short time frame [1]. Its detector is a silicon on insulator (SOI) diode microbolometer, which has the most pixels (640 by 480) of any uncooled detector for Earth observation, as far as we know. The optics have been athermally designed by combining two kinds of infrared glass materials (germanium and chalcogenide glass) for eliminating the need for temperature control. In addition, the CIRC instrument has no optical driving device such as a shutter. Thus, the CIRC instrument has achieved the characteristics of a small size (110 mm × 180 mm × 230 mm) and low power consumption (<20 W). Table 1 gives the specifications of ALOS-2/CIRC and CALET/CIRC [1].
In ground testing, each CIRC instrument was stored in a shroud and evaluated for radiometric performance and a modulation transfer function (MTF) under vacuum conditions [1]. In the radiometric performance test, the noise equivalent delta temperature (NEdT), the fixed pattern noise (FPN), and the radiometric accuracy were evaluated through measurements of a plane blackbody placed in front of the detector, where the blackbody temperature was changed from −10 to 50 °C and the shroud temperature was changed from −15 to 50 °C. The testing results demonstrated that the two CIRC instruments satisfied the specifications of NEdT, FPN, and the radiometric accuracy given by Table 1.

2.1.2. Radiometric Processing for CIRC Images

The radiometric processing for CIRC images is as follows [1]. First, the bad pixel correction, which involves the interpolation of abnormal values with the surrounding normal values, is applied to each observed image. Next, the dummy correction is applied to the image. This correction, widely used in sensors such as complementary metal-oxide-semiconductors (CMOS) and charge coupled devices (CCD), is to subtract electrical noises from the pixel values using dummy pixels (i.e., optical background pixels) which record electrical noises due to no sensitivity to incident light [8]. The CIRC instrument has twenty dummy pixels per line at the left edge of the detector plane, and a part of them is used in the dummy correction. Then, the stray light correction is applied to the image. Since the CIRC instrument cannot take a dark image due to no shutter, the stray light amount at each pixel is estimated by a function of the lens temperature and the package temperature, and is subtracted from the dummy-corrected value of each pixel, where the coefficients of the function were determined based on the ground testing. Then, the FPN, which was estimated in each month with ocean images acquired after the launch, is subtracted from the stray-light corrected image.
After these procedures, radiometric calibration is performed using the radiometric calibration coefficients (RCCs). In this processing, the top-of-the atmosphere (TOA) radiance based on the RCCs from the ground testing, R0, is first calculated. In ALOS-2/CIRC, this R0 value is then recalibrated using the gain (A) and the offset (B) based on the VC and CC results, and the recalibrated radiance, Rx, is derived, as expressed by
R x = A × R 0 + B .
As for CALET/CIRC, the early results of VC and CC show that the original stray-light correction with the package temperature produced an error changing with the sun beta angle (about 60-day cycle). Thus, this type of error is subtracted from R0 before recalibration, and the obtained radiance, R1, is then recalibrated in the same way as with ALOS-2/CIRC. The recalibrated radiance, Rx, is expressed by
R x = A × ( R 0 0.1146 T + 3.009 ) + B = A × R 1 + B ,
where T is the package temperature (°C). When the mean value of T between 11 September 2015 and 6 October 2016 (= 26.25 °C) is given, R1 becomes equal to R0.
The recalibration coefficients, A and B, are determined by the method described in Section 2.5, combined with the results of VC and CC mentioned in Section 2.2, Section 2.3, Section 2.4.

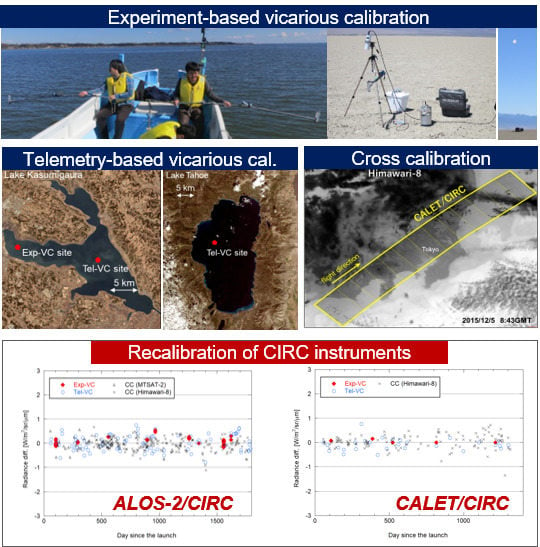
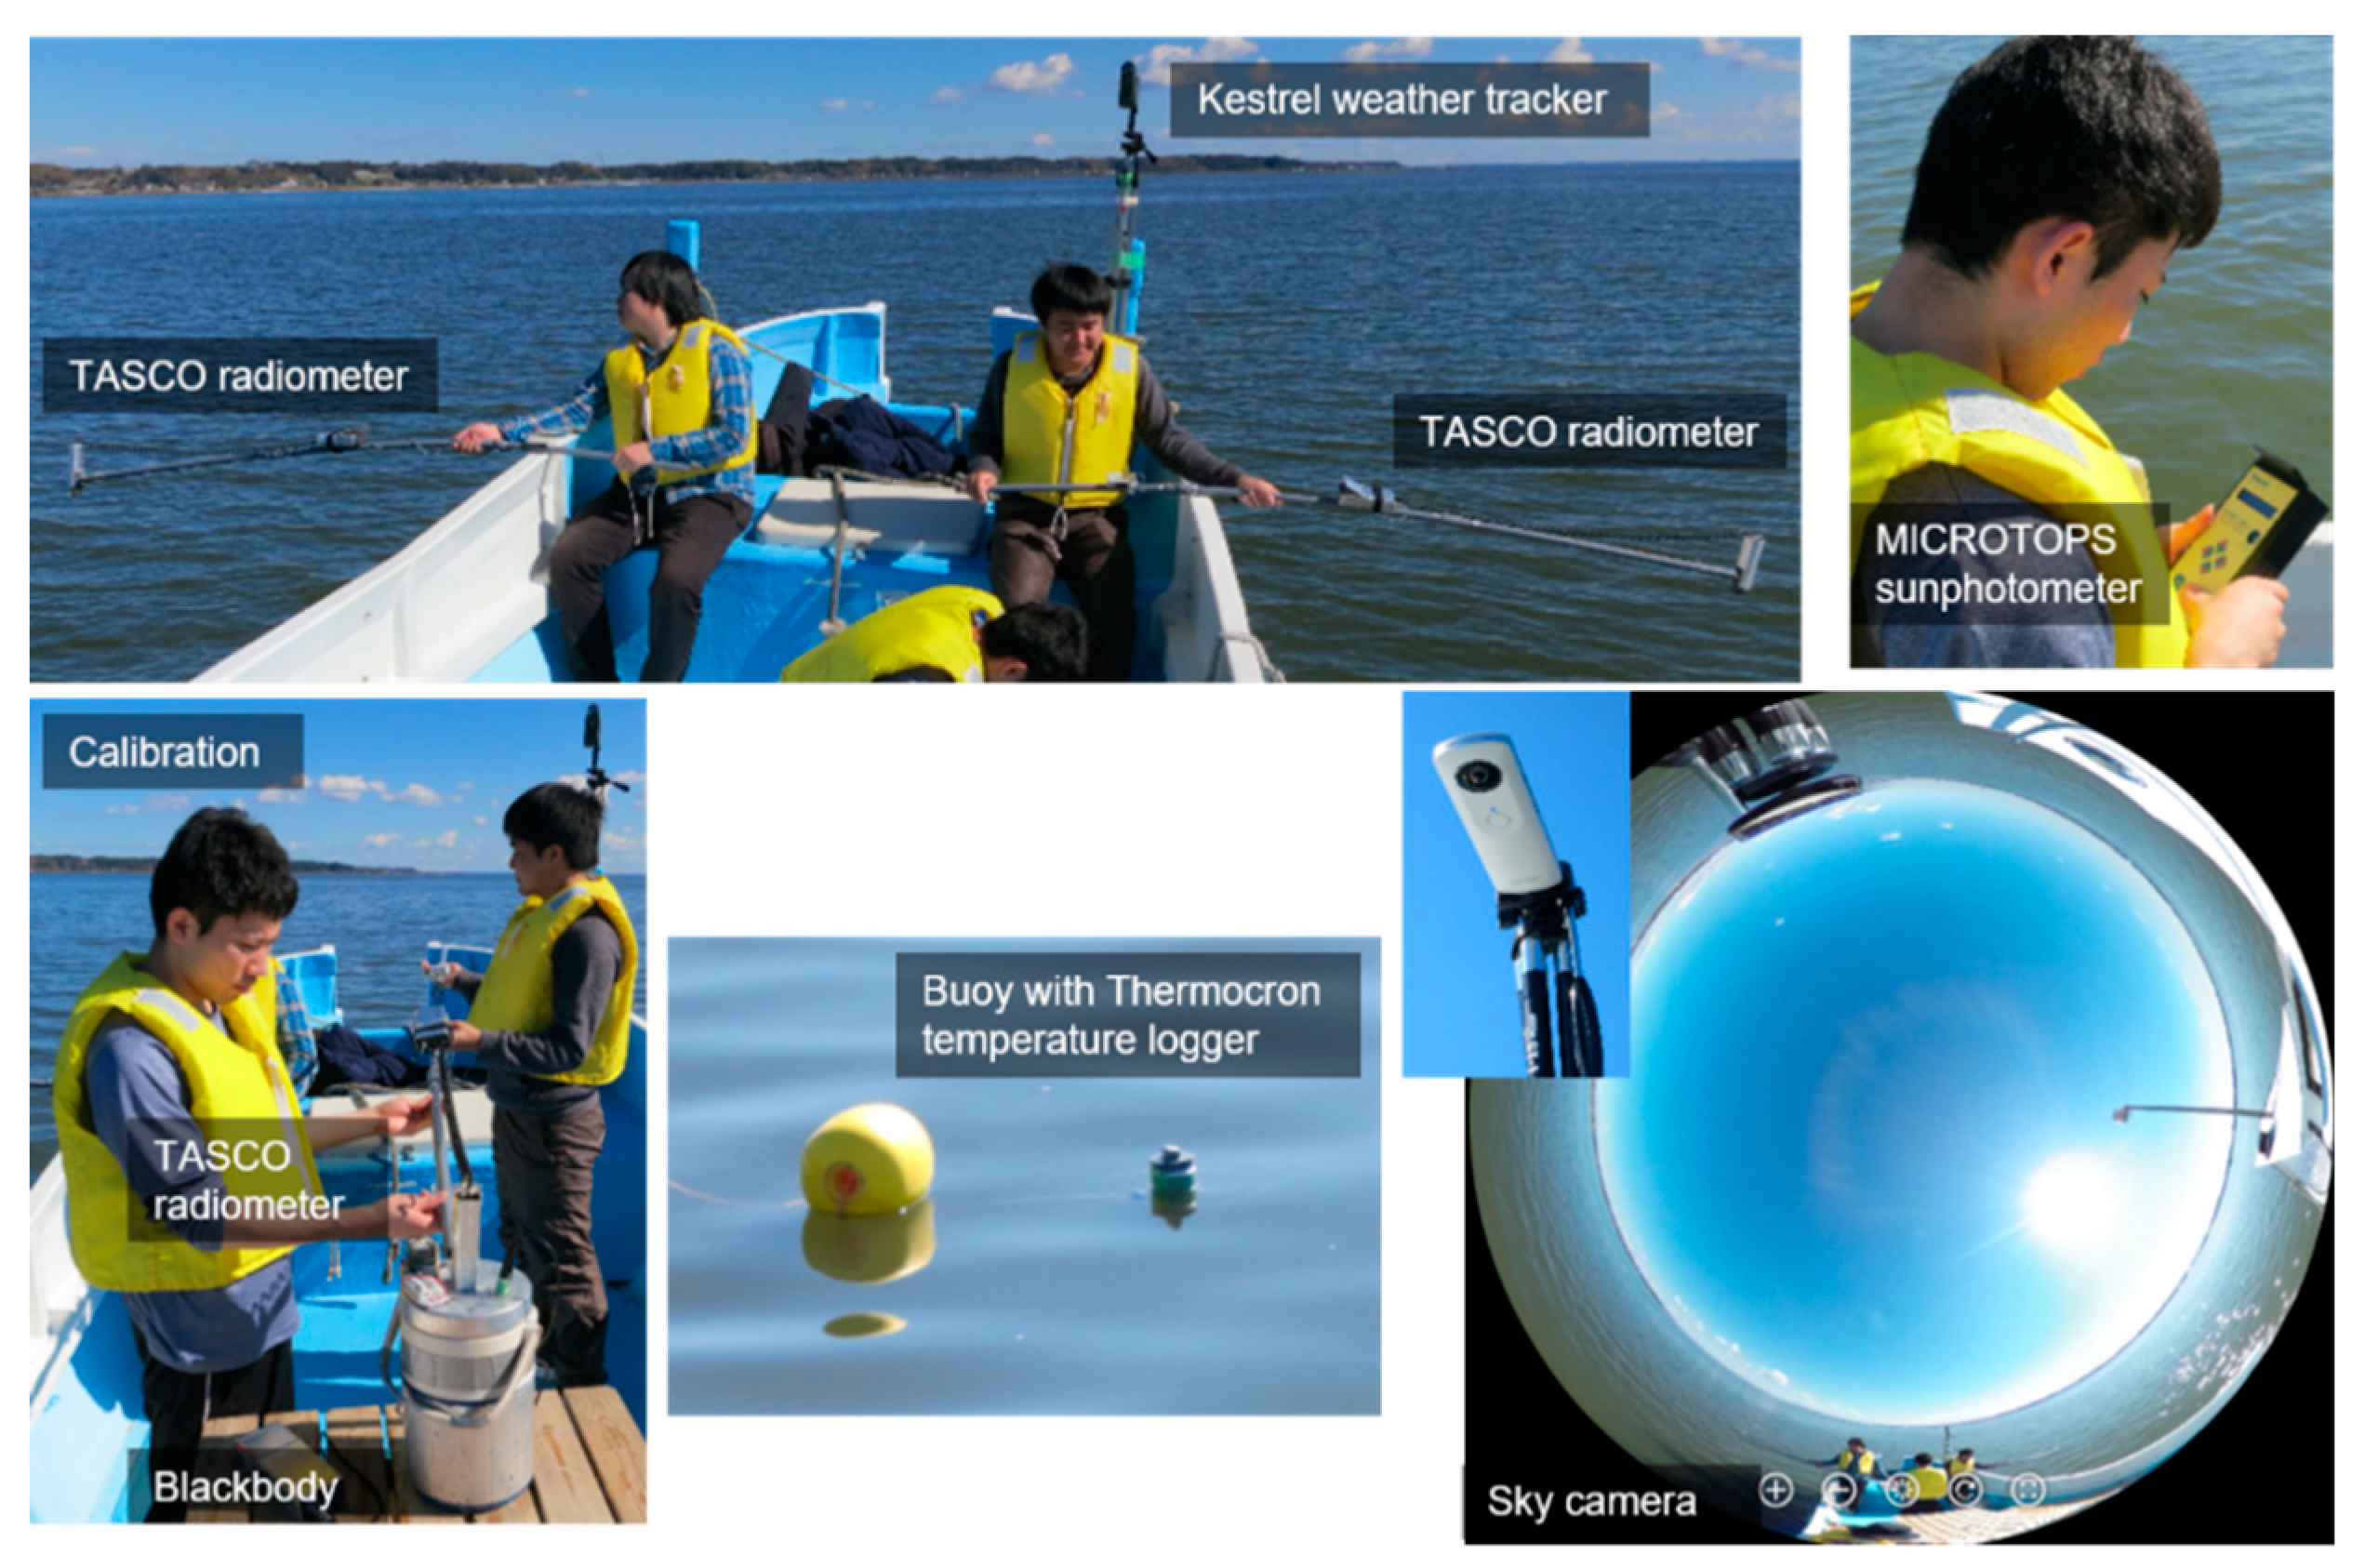
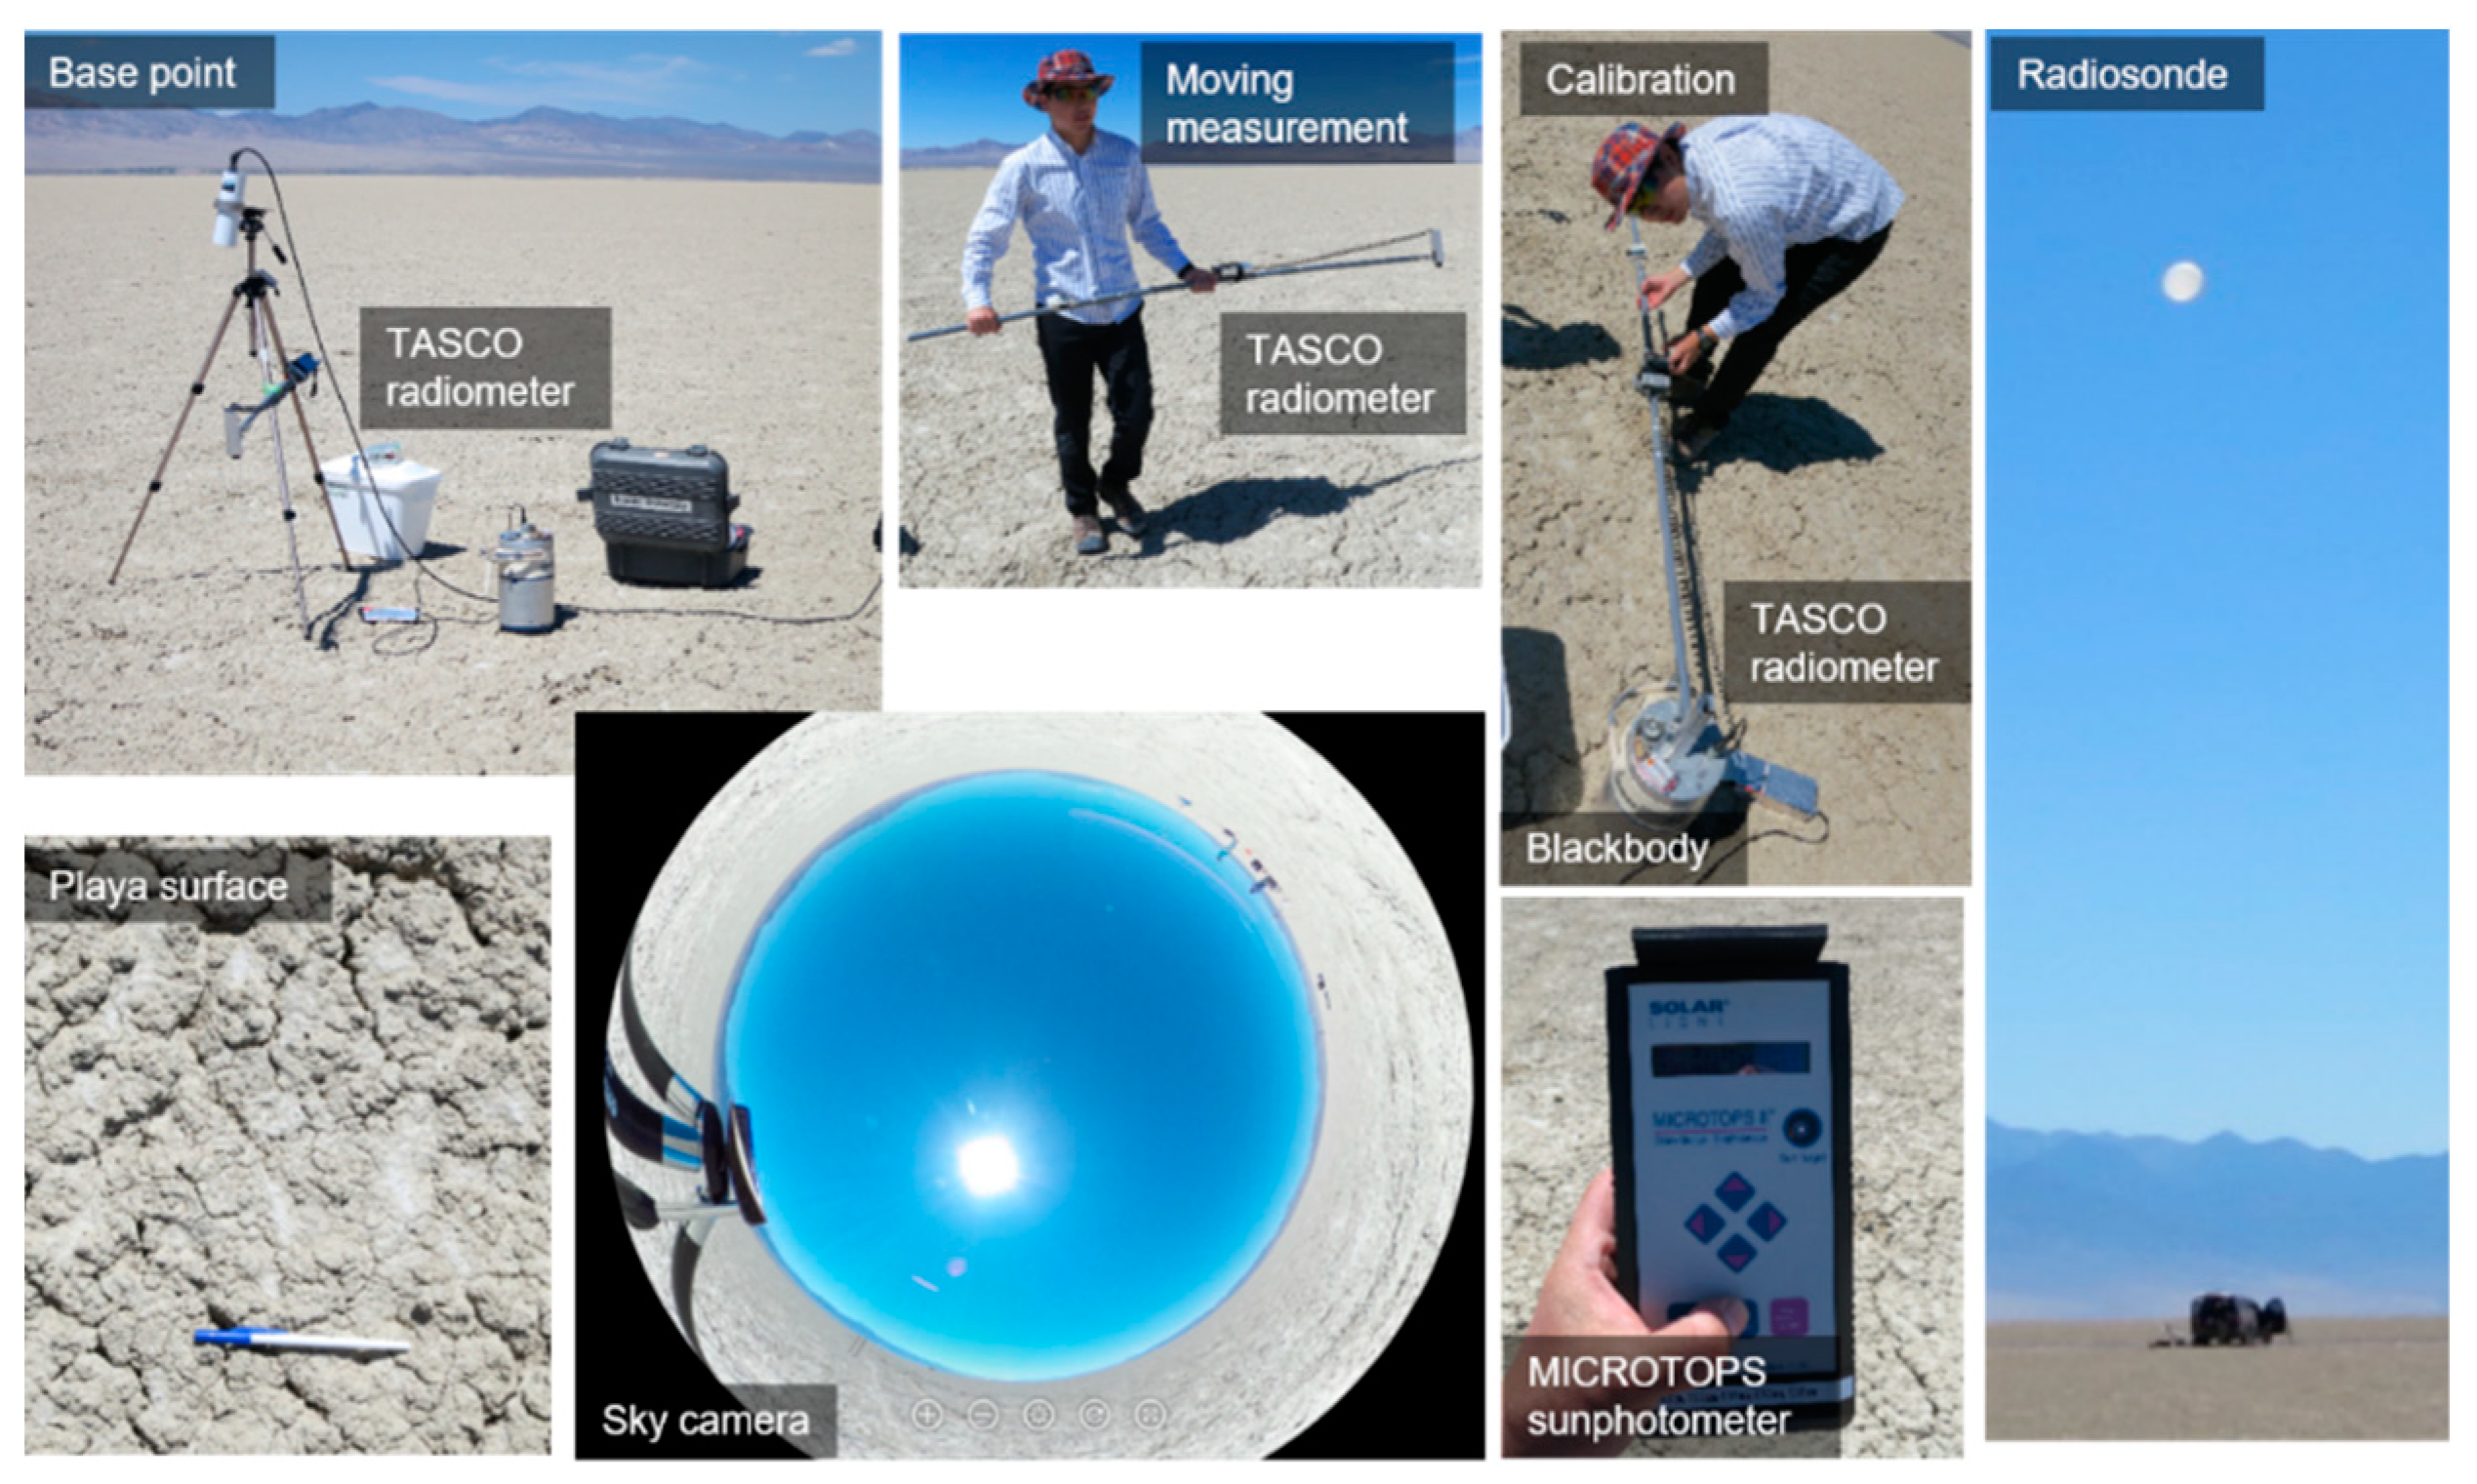
2.2. Experiment-Based Vicarious Calibration

2.2.1. Theoretical Basis
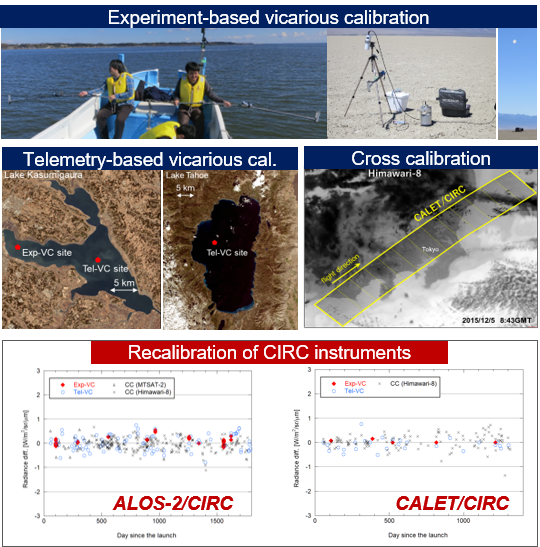
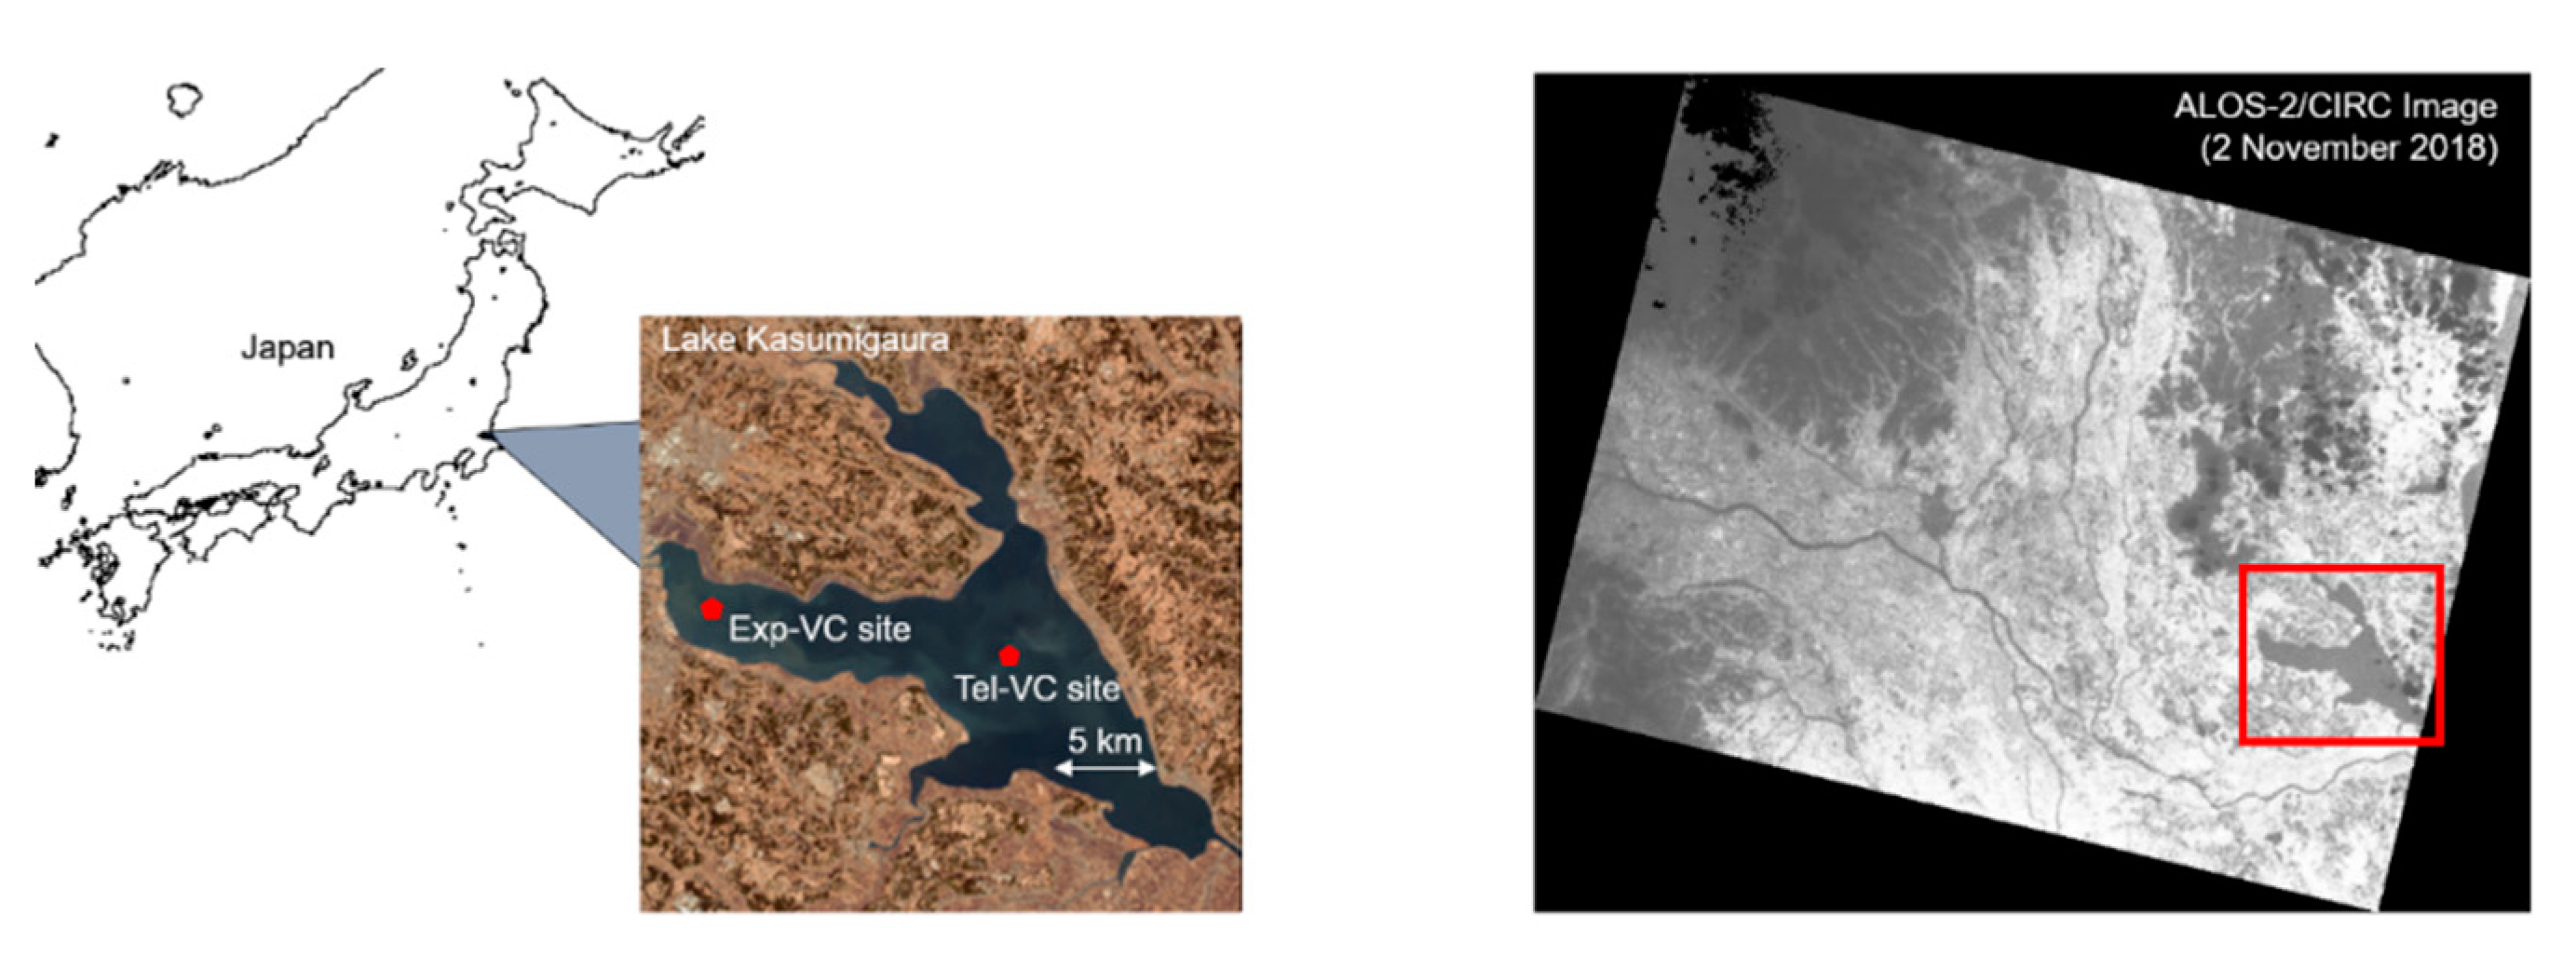
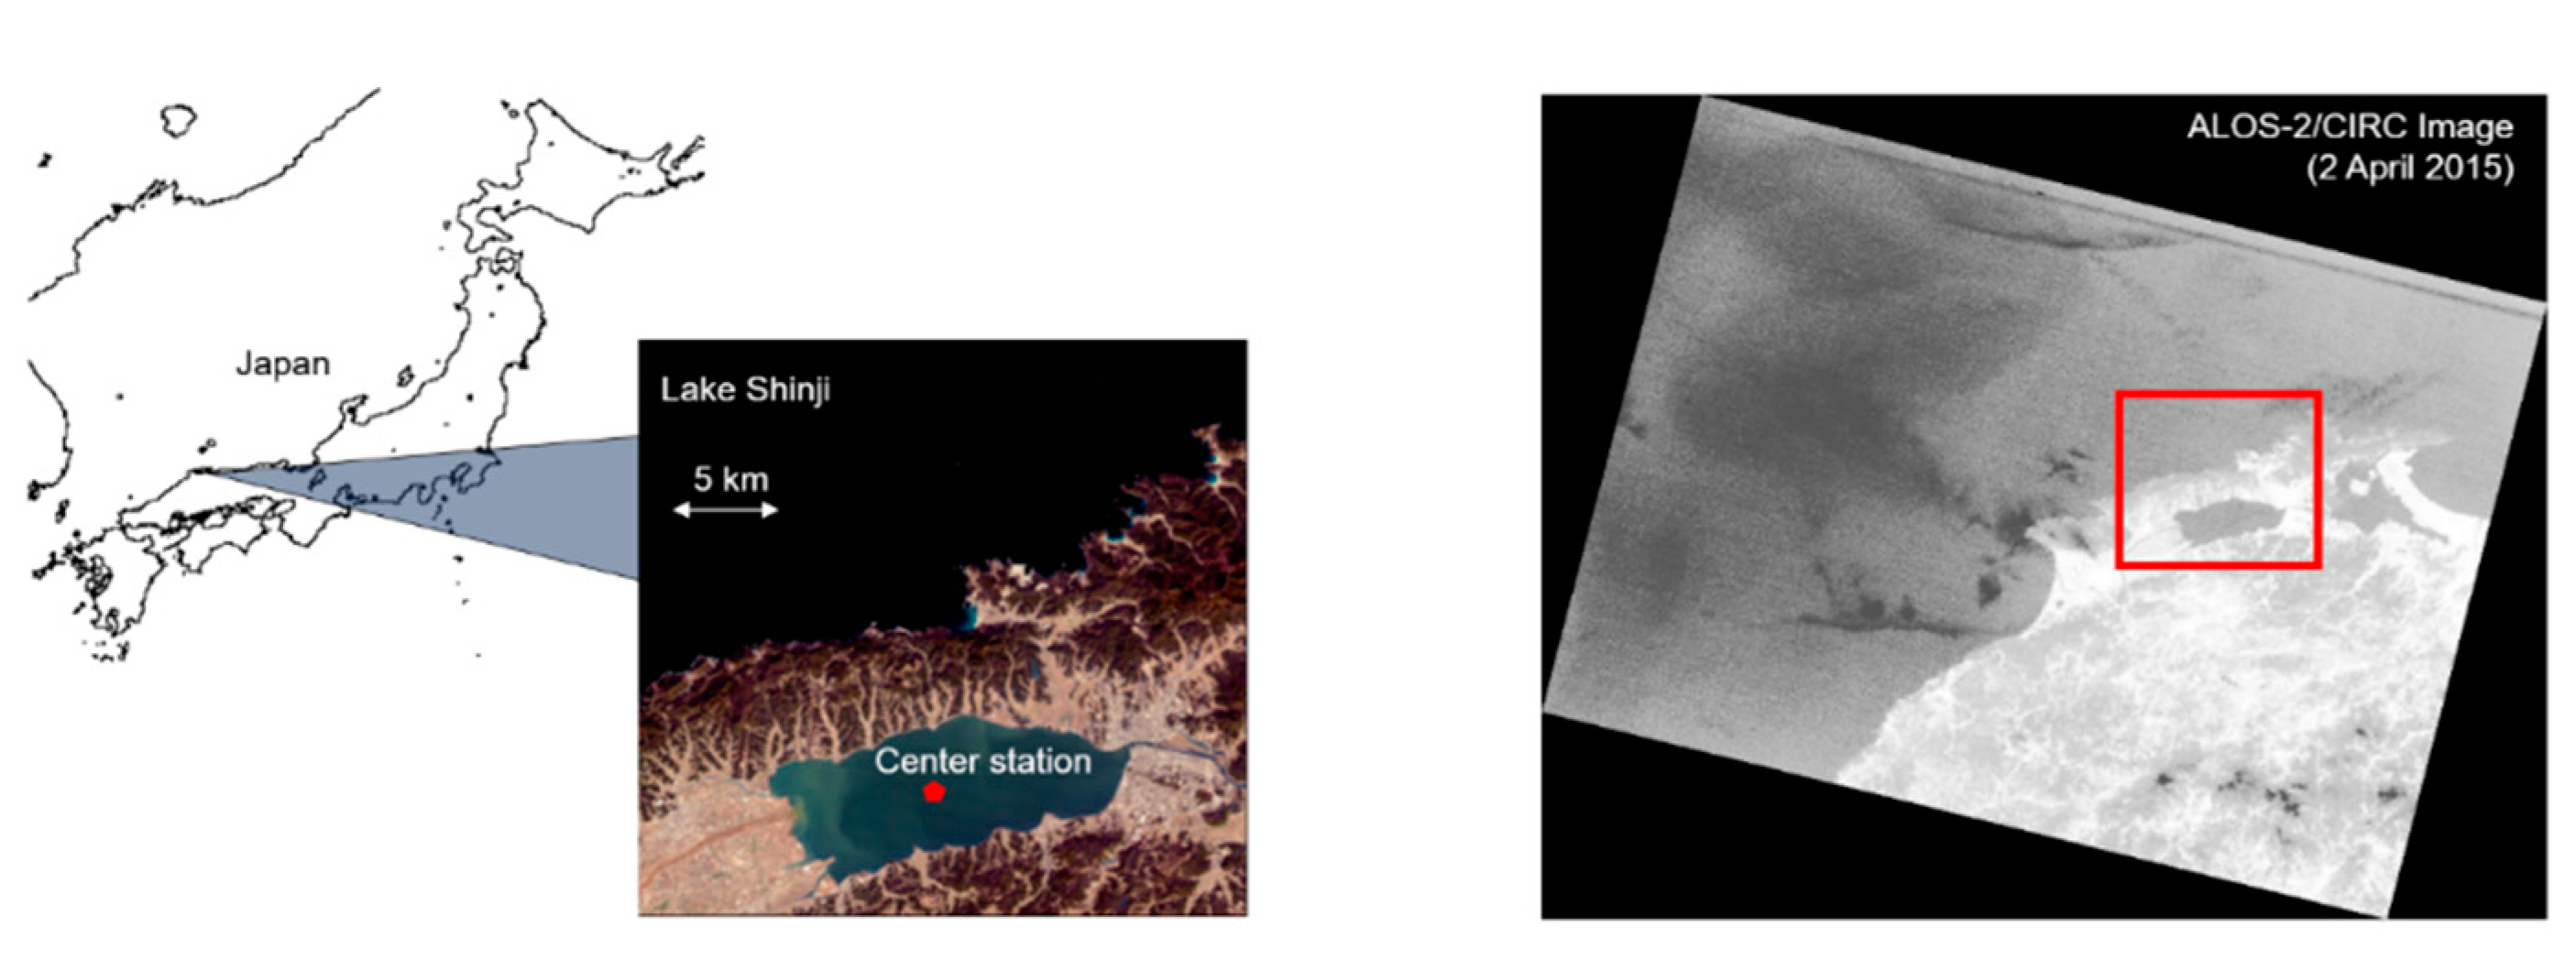
In the TIR spectral range, the TOA radiance from a Lambertian surface is expressed by [9,10]
I ( λ , θ ) = τ ( λ , θ ) I s ( λ ) + I ( λ , θ ) ,
where Is: surface radiance, λ: wavelength, θ: zenith angle, τ: transmittance, and I: path radiance. The surface radiance Is can be rewritten by
I s ( λ ) = ε ( λ ) B ( λ , T ) + ( 1 ε ( λ ) ) F ( λ ) / π ,
where ε: surface emissivity, T: surface kinetic temperature, F: downwelling atmospheric irradiance, and B(): Planck function. Using the relative spectral response (RSR) function of spectral band k, the observed radiance of band k is given by
I k ( θ ) = 0 φ k ( λ ) [ τ ( λ , θ ) I s ( λ ) + I ( λ , θ ) ] d λ / 0 φ k ( λ ) d λ ,
where ϕk(): RSR function of band k. If the band width of band k is narrow enough, Equation (5) can be approximately given by
I k ( θ ) τ k ( θ ) I s , k + I k ( θ ) τ k ( θ ) [ ε k B k ( T ) + ( 1 ε k ) F k / π ] + I k ( θ ) , w h e r e   x k = 0 φ k ( λ ) x ( λ ) d λ / 0 φ k ( λ ) d λ   ( x = τ , I s ,   I ,   ε ,   B   or   F ) .
In Exp-VC, the TOA radiance is predicted by Equations (5) or (6), based on a ground experiment coincident with satellite observation. There are two methods for Exp-VC: the temperature-based method, in which the surface kinetic temperature (T) and surface emissivity (ε) are measured, and the radiance-based method, in which the surface radiance (Is) is directly measured using a radiometer with a similar spectral band to the target satellite sensor [9,10].

2.2.2. Test Sites

In the CIRC project, two test sites were used for Exp-VC: one is Lake Kasumigaura (Japan), and the other is Railroad Valley Playa (NV, USA). The both sites are the main VC sites for ASTER TIR [9].
Lake Kasumigaura in Japan is suitable for VC from October to March, because the lake is typically under dry conditions in these months [9]. We, therefore, conducted Exp-VC of CIRC from October to March. In the lake, the target site used for Exp-VC was the same as the ASTER TIR site; a square of 300 m by 300 m at latitude 36.058°N, longitude 140.250°E. Figure 1 displays the location of the Exp-VC site in Lake Kasumigaura, and the ALOS-2/CIRC image acquired over the lake on 2 November 2018 as an example.
Railroad Valley Playa in Nevada, USA, is a dry lake with an overall size approximately 15 km by 15 km. The playa has been frequently used for the calibration and validation of various satellite sensors as one of the Committee on Earth Observation Satellites (CEOS) Cal Val test sites [11]. Since this playa is located in a semi-arid region at an altitude of over 1400 m, Exp-VC of TIR sensors in summer can be performed under a high surface temperature condition. The target site used in Exp-VC of the CIRC instruments is a square of 200 m by 200 m at latitude 38.462°N, longitude 115.688°W, including the ASTER TIR VC site. Figure 2 displays the location of the Exp-VC site in Railroad Valley Playa, and the ALOS-2/CIRC image acquired over the lake on 31 August 2018 as an example.

2.2.3. VC Experiments for Each CIRC Instrument

In or before September 2019, the number of VC experiments successfully conducted for ALOS-2/CIRC was 7 in Lake Kasumigaura (daytime: 13 March 2015, 4 December 2015, 4 November 2016, 13 January 2017, 3 November 2017, 26 January 2018, and 2 November 2018) and 2 in Railroad Valley Playa (daytime: 5 September 2014, and 31 August 2018), and that for CALET/CIRC is 4 in Lake Kasumigaura (daytime: 5 December 2015, 12 November 2017, and 15 December 2018; nighttime: 24 January 2017) and 1 in Railroad Valley Playa (daytime: 10 September 2016). The results were used for the determination of the recalibration coefficients for each CIRC instrument, described in Section 2.5.
In Lake Kasumigaura, we measured the surface brightness temperature every two seconds using two single-band radiometers (TASCO THI-500) at the center of the target square. These radiometers were calibrated at intervals of five to ten minutes using a portable blackbody with a platinum resistance thermometer (PRT) sensor, where the blackbody was filled by water drawn from the lake and stirred automatically. The temperature of this blackbody was corrected based on a comparison result with the blackbody of the Jet Propulsion Laboratory (JPL) calibrated at the National Institute of Standards and Technology (NIST). The surface brightness temperatures calibrated by the blackbody were then corrected for a spatial bias determined from the bulk water temperatures measured by contact thermometers (Thermochron SL-type temperature logger), where the bulk water temperatures were measured every ten seconds at a depth of several centimeters at the center and at the four corners of the target square. As for the surface spectral emissivity, we used the spectral data of distilled water in the ASTER spectral library [12]. The atmospheric vertical profiles (pressure, temperature, and humidity) were obtained by a radiosonde near the target square, or spatiotemporally interpolated from the product of the Global Data Assimilation System (GDAS) operated by the National Centers for Environmental Prediction (NCEP) [13]. In the daytime experiments, the precipitable water vapor (PWV) was measured by a sunphotometer (Solar Light Model 540 Microtops II) and used for correction of the humidity vertical profile. The total ozone amount was provided by the Aura Ozone Monitoring Instrument (OMI) product [14] observed at or near each VC day. Figure 3 shows photos from the VC experiment conducted in Lake Kasumigaura on 2 November 2018.
In Railroad Valley Playa, we measured the surface brightness temperature every two seconds using one single-band radiometer (TASCO THI-500) at one corner of the target square (referred to as the basepoint). Since the spatial variance of the surface temperature is much larger than that in Lake Kasumigaura, another single-band radiometer was used in moving the measurement of the surface brightness temperature at intervals of two seconds along the side of the target square. A spatial bias in the surface brightness temperature at the basepoint was then estimated from the mean difference in the surface brightness temperature between the two radiometers. As for the surface spectral emissivity, we used the spectral data of cray samples collected on site, which were measured by JPL with an indoor Fourier-transform infrared spectrometer (FTIR) after each experiment. Atmospheric vertical profiles were obtained by JPL with a radiosonde near the target square, or spatiotemporally interpolated from the GDAS product. The humidity profile was corrected by sunphotometer measurement, and the total ozone amount was provided from the Aura OMI product. Figure 4 shows photos from the VC experiment conducted in Railroad Valley Playa on 31 August 2018.

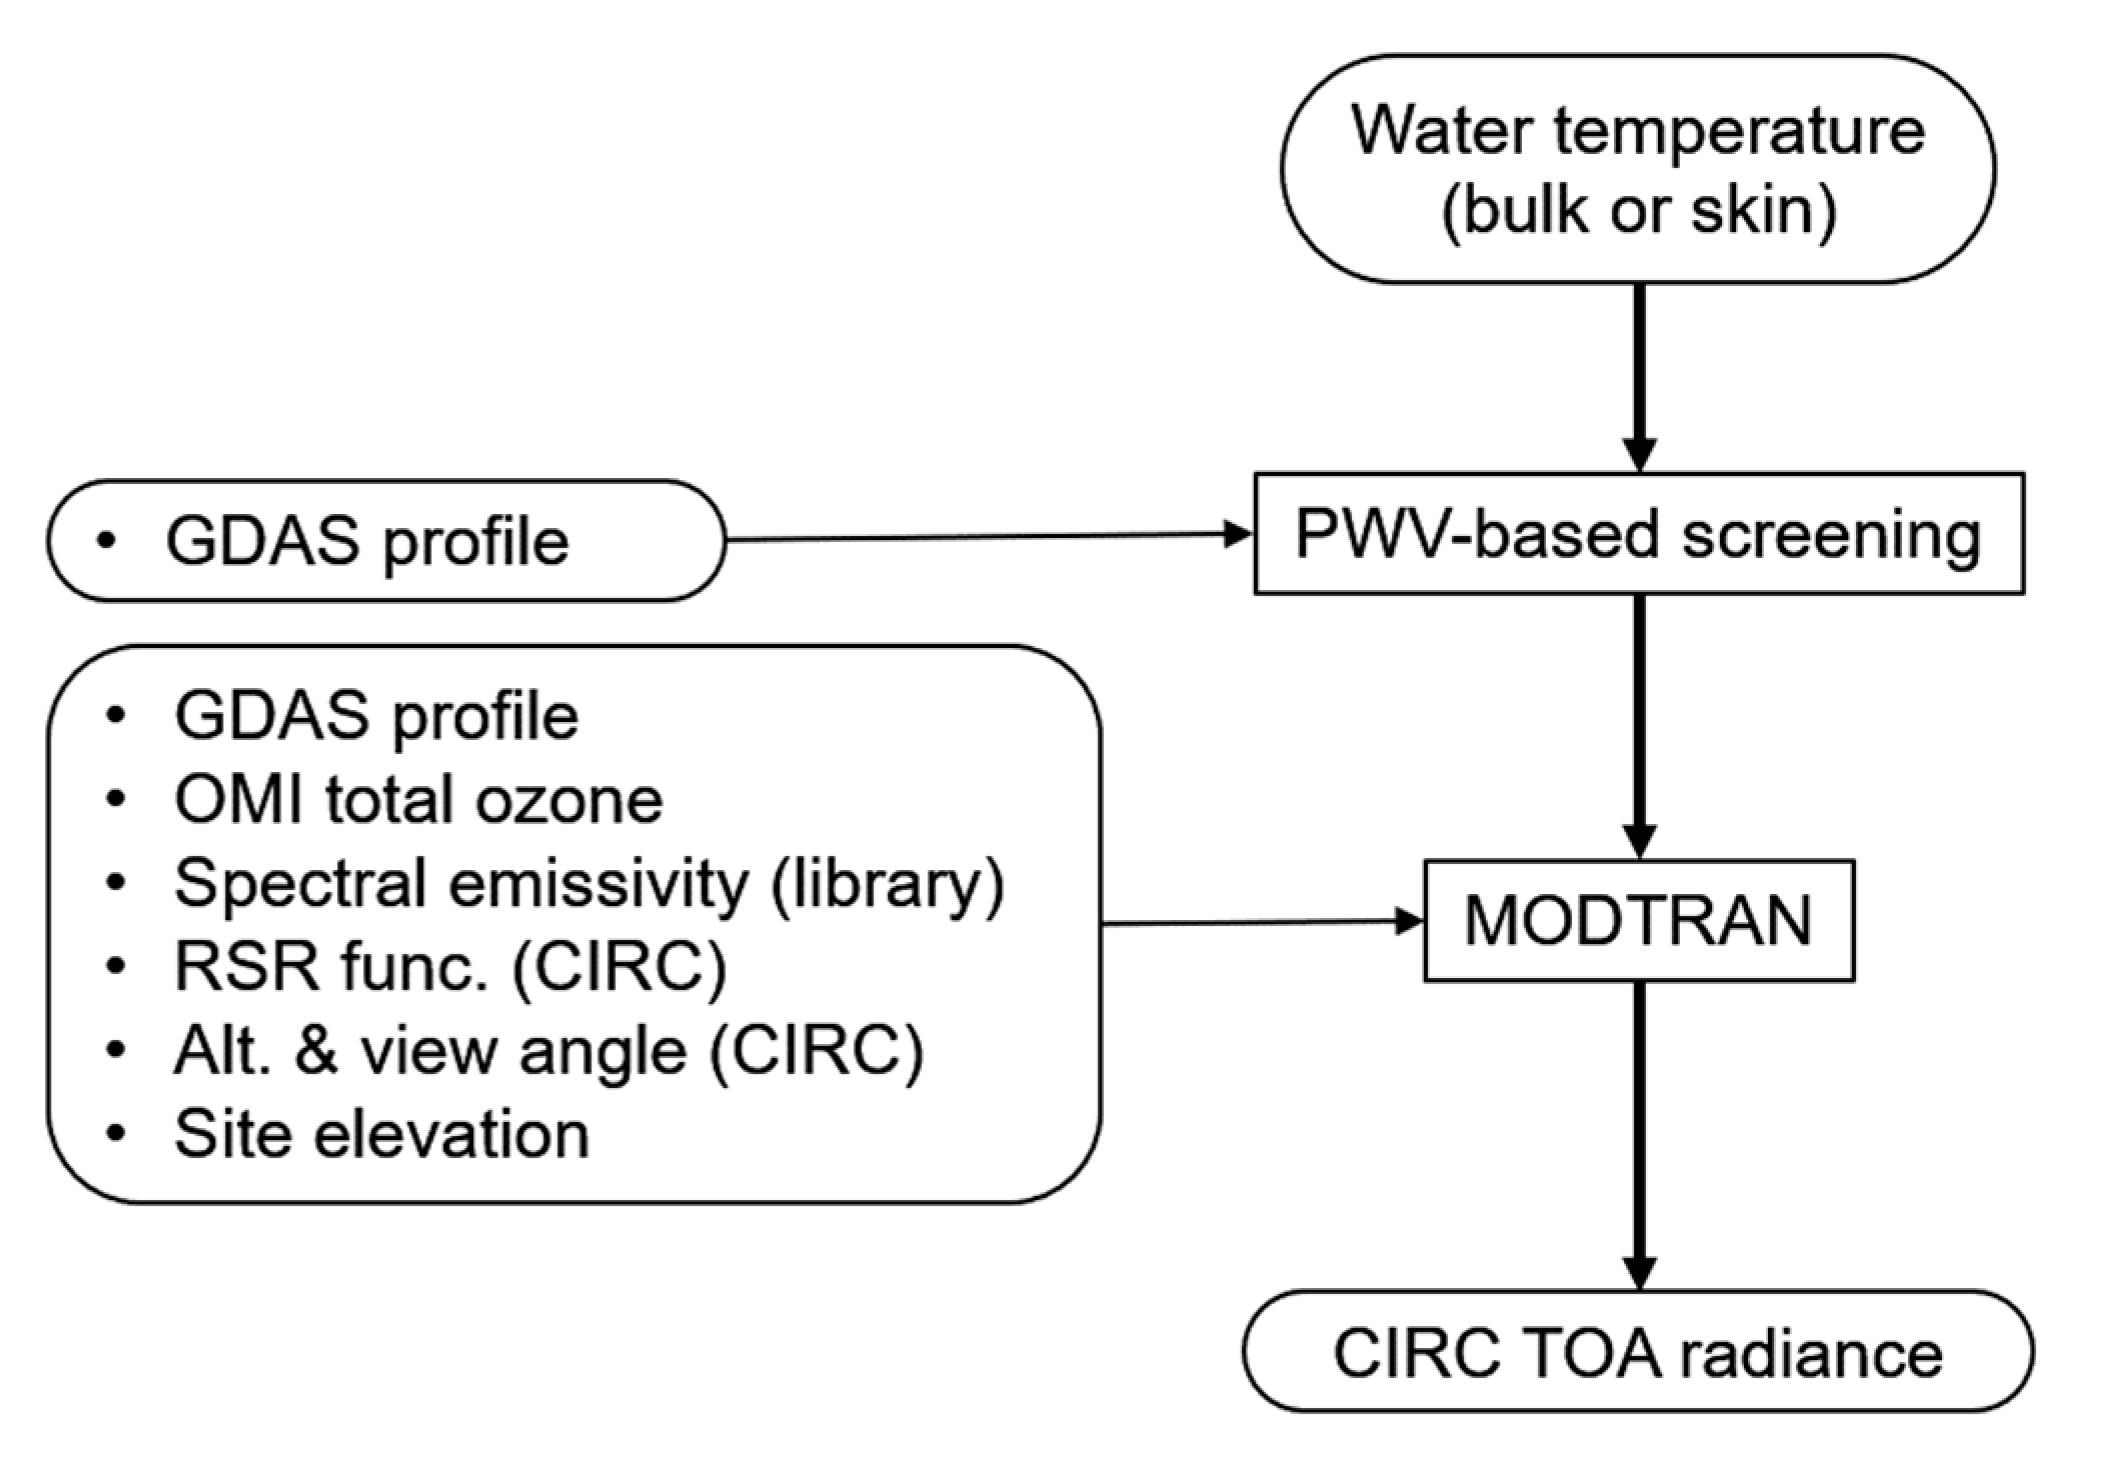
2.2.4. Estimation of TOA Radiance

After each experiment in Lake Kasumigaura or Railroad Valley Playa, the TOA radiance of the targeted CIRC instrument was predicted by the radiative transfer code MODTRAN 5.2 [15] combined with the surface and atmospheric parameters which were measured on site or acquired from the products, where we used the 1976 US Standard Atmosphere model as default, and the Rural (23 km visibility) model as the aerosol model [16]. In this calculation, Equation (6) was not suitable for the CIRC instruments, which had a wide spectral range of 8 to 12 μm, particularly in Railroad Valley Playa where the surface contained many silicate minerals with a large spectral change [17]. Thus we did not use Equation (6), but instead used Equation (5) for the prediction of the TOA radiance. In the actual calculation, the RSR function of the CIRC instrument was also inputted into MODTRAN, and the TOA radiance was directly output by MODTRAN.
On the other hand, the surface kinetic temperature should be input to MODTRAN, but the surface parameter measured on site by the single-band radiometers was the surface brightness temperature. We therefore developed the following procedure to predict the TOA radiance of the CIRC instrument:
  • By inputting the spectral emissivity, the atmospheric data, the RSR function of the single-band radiometer, and the geometric condition of the single-band radiometer measurement (nadir viewing at an altitude of 2 m) into MODTRAN, the observed radiance of the single-band radiometer was iteratively calculated under a provisional value of the surface kinetic temperature. The surface kinetic temperature which represented the best match between the calculated radiance and the actual radiance measured by the single-band radiometer was selected as the true surface kinetic temperature.
  • By inputting the obtained surface kinetic temperature, the spectral emissivity, the atmospheric data, the RSR function of the CIRC instrument, and the geometric condition of the CIRC measurement to MODTRAN, the observed radiance of the targeted CIRC instrument was calculated.
Figure 5 shows the processing flow of the TOA radiance estimation in Exp-VC, where the first “MODTRAN (iteration)” corresponds with Step 1, and the second “MODTRAN” corresponds with Step 2.
In Exp-VC, ALOS-2/CIRC was often scheduled to observe the test site overlappingly. If the site was overlappingly observed by ALOS-2/CIRC, all images including the site were used for Exp-VC. Actually, one to four images were used in Lake Kasumigaura, and ten or eleven images were used in Railroad Valley Playa. As for CALET/CIRC, such overlapping observation was not scheduled.

2.3. Telemetry-Based Vicarious Calibration

2.3.1. Overview

Though Exp-VC allowed us to predict a more reliable TOA radiance, we could not perform enough of experiments to track the radiometric trend of the CIRC instruments under limitations in time, budget, and human resources. Tel-VC is, therefore, useful for compensating a lack of Exp-VC. In Tel-VC of the CIRC instruments, water temperature data from telemetry stations deployed in Lake Kasumigaura, Lake Shinji (Japan), and Lake Tahoe (CA/NV, USA) were used.
In Lake Kasumigaura and Lake Shinji, the Ministry of Land, Infrastructure, Transport and Tourism (MLIT) of Japan has deployed telemetry stations for water management, and water temperature and quality-related values measured by these stations are released to Internet [18], though telemetry data in Lake Shinji are available only for before 22 March 2016. In Tel-VC of the CIRC instruments, water temperatures which were measured every hour at a depth of about 50 cm by these stations were used as the surface kinetic temperature. In this case, the difference from the skin temperature (i.e., skin effect) gives an error which is typically within 1 K. The temporal difference from the satellite overpass time also produces an error, although water temperature change in an hour is typically small in these lakes. In addition, these lakes are typically under humid conditions in summer, causing an error in radiative transfer calculation [9]. The location of the main Tel-VC site in Lake Kasumigaura is provided in Figure 1. As for Lake Shinji, Figure 6 displays the location of the Tel-VC site and the ALOS-2/CIRC image acquired over the lake on 2 April 2015 as an example.
In Lake Tahoe, JPL deployed four automated validation sites for satellite TIR sensors such as ASTER and MODIS [19]. At each of the four sites (TB1, TB2, TB3, and TB4), bulk and skin temperatures and weather data are measured every two minutes, and released to the public [20]. In Tel-VC of the CIRC instruments, we used the skin temperature at one site (mostly, TB3) as the surface kinetic temperature. It is expected that an error caused by the skin effect and the temporal difference is small in this lake in comparison with Lake Kasumigaura and Lake Shinji. In addition, since this lake is located at an elevation of 1897 m, an error caused from the radiative transfer calculation will be small [19]. Figure 7 displays the location of the main Tel-VC site (TB3) and the CALET/CIRC image acquired over the lake on 27 June 2016 as an example.

2.3.2. Tel-VC Analyses for Each CIRC Instrument

In or before September 2019, the number of Tel-VC analyses for ALOS-2/CIRC was 36 in Lake Kasumigaura (daytime: 27; nighttime: 9), 8 in Lake Shinji (daytime: 4; nighttime: 4), 36 in Lake Tahoe (daytime: 12; nighttime: 24), and 80 in total (daytime: 43; nighttime: 37), and that for CALET/CIRC was 15 in Lake Kasumigaura (daytime: 6; nighttime: 9), one in Lake Shinji (nighttime: 1), 12 in Lake Tahoe (daytime: 7; nighttime: 5), and 28 in total (daytime: 13; nighttime: 15). These data were used for the determination of the recalibration coefficients for each CIRC instrument. In each Tel-VC analysis, a single CIRC image was used, while two CIRC images overlappingly observed were used in eight analyses for ALOS-2/CIRC. The results were used for the determination of the recalibration coefficients for each CIRC instrument, described in Section 2.5.
In Tel-VC in the three lakes, the atmospheric vertical profiles were spatiotemporally interpolated from the NCEP/GDAS product, the total ozone amount was derived from the OMI product, and the surface spectral emissivity was given by the spectral data of distilled water in the ASTER spectral library. Since the water temperature measured by each telemetry station was directly used as the surface kinetic temperature, the iterative determination of the surface kinetic temperature in Exp-VC was not applied to Tel-VC, and the TOA radiance of the CIRC instrument was simply calculated by MODTRAN based on Equation (5). Since this calculation becomes less accurate under a humid condition, we did not use CIRC images for Tel-VC if the PWV calculated from the NCEP/GDAS product was larger than 2.5 cm. Figure 8 shows the processing flow of the TOA radiance estimation in Tel-VC.

2.4. Cross-Calibration Using Geostationary Satellite Sensors

2.4.1. Overview

In CC of the CIRC instruments, we used two geostationary satellite (GS) sensors: the MTSAT-2 Imager [21] for ALOS-2/CIRC images observed before 7 July 2015, and the Advanced Himawari Imager (AHI) onboard the Himawari-8 satellite [22] for other ALOS-2/CIRC images and all CALET/CIRC images. The radiometric accuracies of the MTSAT-2 Imager and Himawari-8/AHI have been validated using high spectral resolution sounders such as the Atmospheric Infrared Sounder (AIRS) onboard the Aqua satellite [23] or the Infrared Atmospheric Sounder Interferometer (IASI) onboard the MetOp satellite [24] through the Global Space-based Inter-Calibration System (GSICS) [25]. As for the MTSAT-2 Imager, Hewison et al. showed that the IR channels (IR1 at 10.8 μm, and IR2 at 12 μm) had stable biases with the averages of +0.08 K for IR1 and +0.10 K for IR2 for two years from June 2010 [25], while Okuyama et al. mentioned that the biases of some IR channels (e.g., IR2) tended to increase to 1.5 K at nighttime around the eclipse season, whereas those seen during the daytime were a tenth of these values [26]. As for Himawari-8/AHI, Okuyama et al. showed that the IR bands (bands 7 to 16) were calibrated within 0.2 K with no significant diurnal variation [26].
Since Himawari-8/AHI observes Japan and the surrounding area at intervals of 2.5 min, all CIRC images acquired around Japan can be used for CC under a temporal difference within 1.25 min. On the other hand, MTSAT-2 Imager has no such high-frequency observation mode. Thus, in order to get ALOS-2/CIRC images observed in coincidence with the MTSAT-2 Imager, we analyzed the orbit of the ALOS-2 satellite, and searched CIRC images which had pixels observed within 40 s from the full-disk observation times of MTSAT-2 Imager (once per hour).
All of the GS sensor images used for CC were first corrected for the difference in viewing angles between the targeted CIRC instrument and the GS sensor used (MTSAT-2 Imager or Himawari-8/AHI). Next, the TOA radiance image of the CIRC instrument was generated by regression analysis with two TIR bands (IR1 and IR2) for MTSAT-2 Imager, or with five TIR bands (bands 11 to 15) for Himawari-8/AHI (the generated image is referred to as a GS-based CIRC image). Then, the actual image of the targeted CIRC instrument and the GS-based CIRC image were co-registered with a spatial resolution of the actual CIRC image by nearest neighbor interpolation, and corrected for the parallax effect caused by the difference in viewing angles. Then, the overlapping area between the actual CIRC image and the GS-based CIRC image was divided into blocks, and only blocks with a small variance in the both images were selected through statistical screening. Finally, the block mean radiances of all selected blocks were calculated for each image, and used for CC. Figure 9 shows the processing flow of the TOA radiance estimation in CC.
In or before September 2019, the number of the GS sensor images used in CC of ALOS-2/CIRC was 19 for MTSAT-2 Imager (daytime: 10; nighttime: 9), 245 for Himawari-8/AHI (daytime: 156; nighttime: 89), and 264 in total (daytime: 166; nighttime: 98). That for CALET/CIRC was 123 for Himawari-8/AHI (daytime: 47; nighttime: 76). The results were used for determination of the recalibration coefficients for each CIRC instrument, described in Section 2.5.
In Section 2.4.2, Section 2.4.3, Section 2.4.4, Section 2.4.5, we explain the details on the viewing angle correction, the generation of a GS-based CIRC image, the co-registration with parallax correction, and the statistical screening.

2.4.2. Viewing Angle Correction

A representative method for CC is the ray-matching (RM) method, which simply uses coincident, co-angled, and co-located measurements to transfer the radiances of a well-calibrated reference instrument to those of a monitored instrument in a similar channel [10,27]. The viewing direction of ALOS/CIRC is affected by the operation of the Phased Array L-band Synthetic Aperture Radar-2 (PALSAR-2) which is the primary sensor onboard the ALOS-2 satellite―the viewing direction of ALOS-2/CIRC is the nadir if PALSAR-2 is active, and 30 degrees left if PALSAR-2 is inactive. The viewing direction of CALET/CIRC is only the nadir. However, the viewing direction of Himawari-8/AHI is about 30 to 50 degrees from the nadir around Japan, so that co-angled measurement with the CIRC instruments is impossible in Himawari-8/AHI, while it is dependent on the latitude of a target area in MTSAT-2 Imager. Under the assumptions of the parallel plane atmosphere and the Lambertian surface, we, therefore, corrected the discrepancy in viewing angles on a pixel-by-pixel basis for each GS-based CIRC image by the following equation:
I k ( θ c i r c ) = { I k ( θ g s ) I k ( θ g s ) } τ k ( θ c i r c ) / τ k ( θ g s ) + I k ( θ c i r c ) ,
where θcirc and θgs are the viewing zenith angles of the targeted CIRC instrument and the GS sensor used, respectively, and τk and Ik are calculated by MODTRAN combined with the NCEP/GDAS product, the OMI product, and the GTOPO-30 digital elevation model [28].
In CC of the CIRC instruments, we included cloud-covered pixels for evaluation in a low temperature range, but Equation (7) made an overcorrection if a cloud-covered pixel was dealt with as a surface pixel. We, therefore, omitted this correction for pixels which had a lower temperature than the air temperature at 700 hPa (about 3 km above sea level) given by the NCEP/GDAS product. Since most of pixels around Japan are located at an elevation below 3 km, and also the PWV at a high elevation area is typically low, the omission of the viewing angle correction will not produce a significant error for clear pixels with a lower temperature than the air temperature at about 3 km. On the other hand, the viewing angle correction may cause an overcorrection for pixels covered by clouds at an altitude below 3 km.

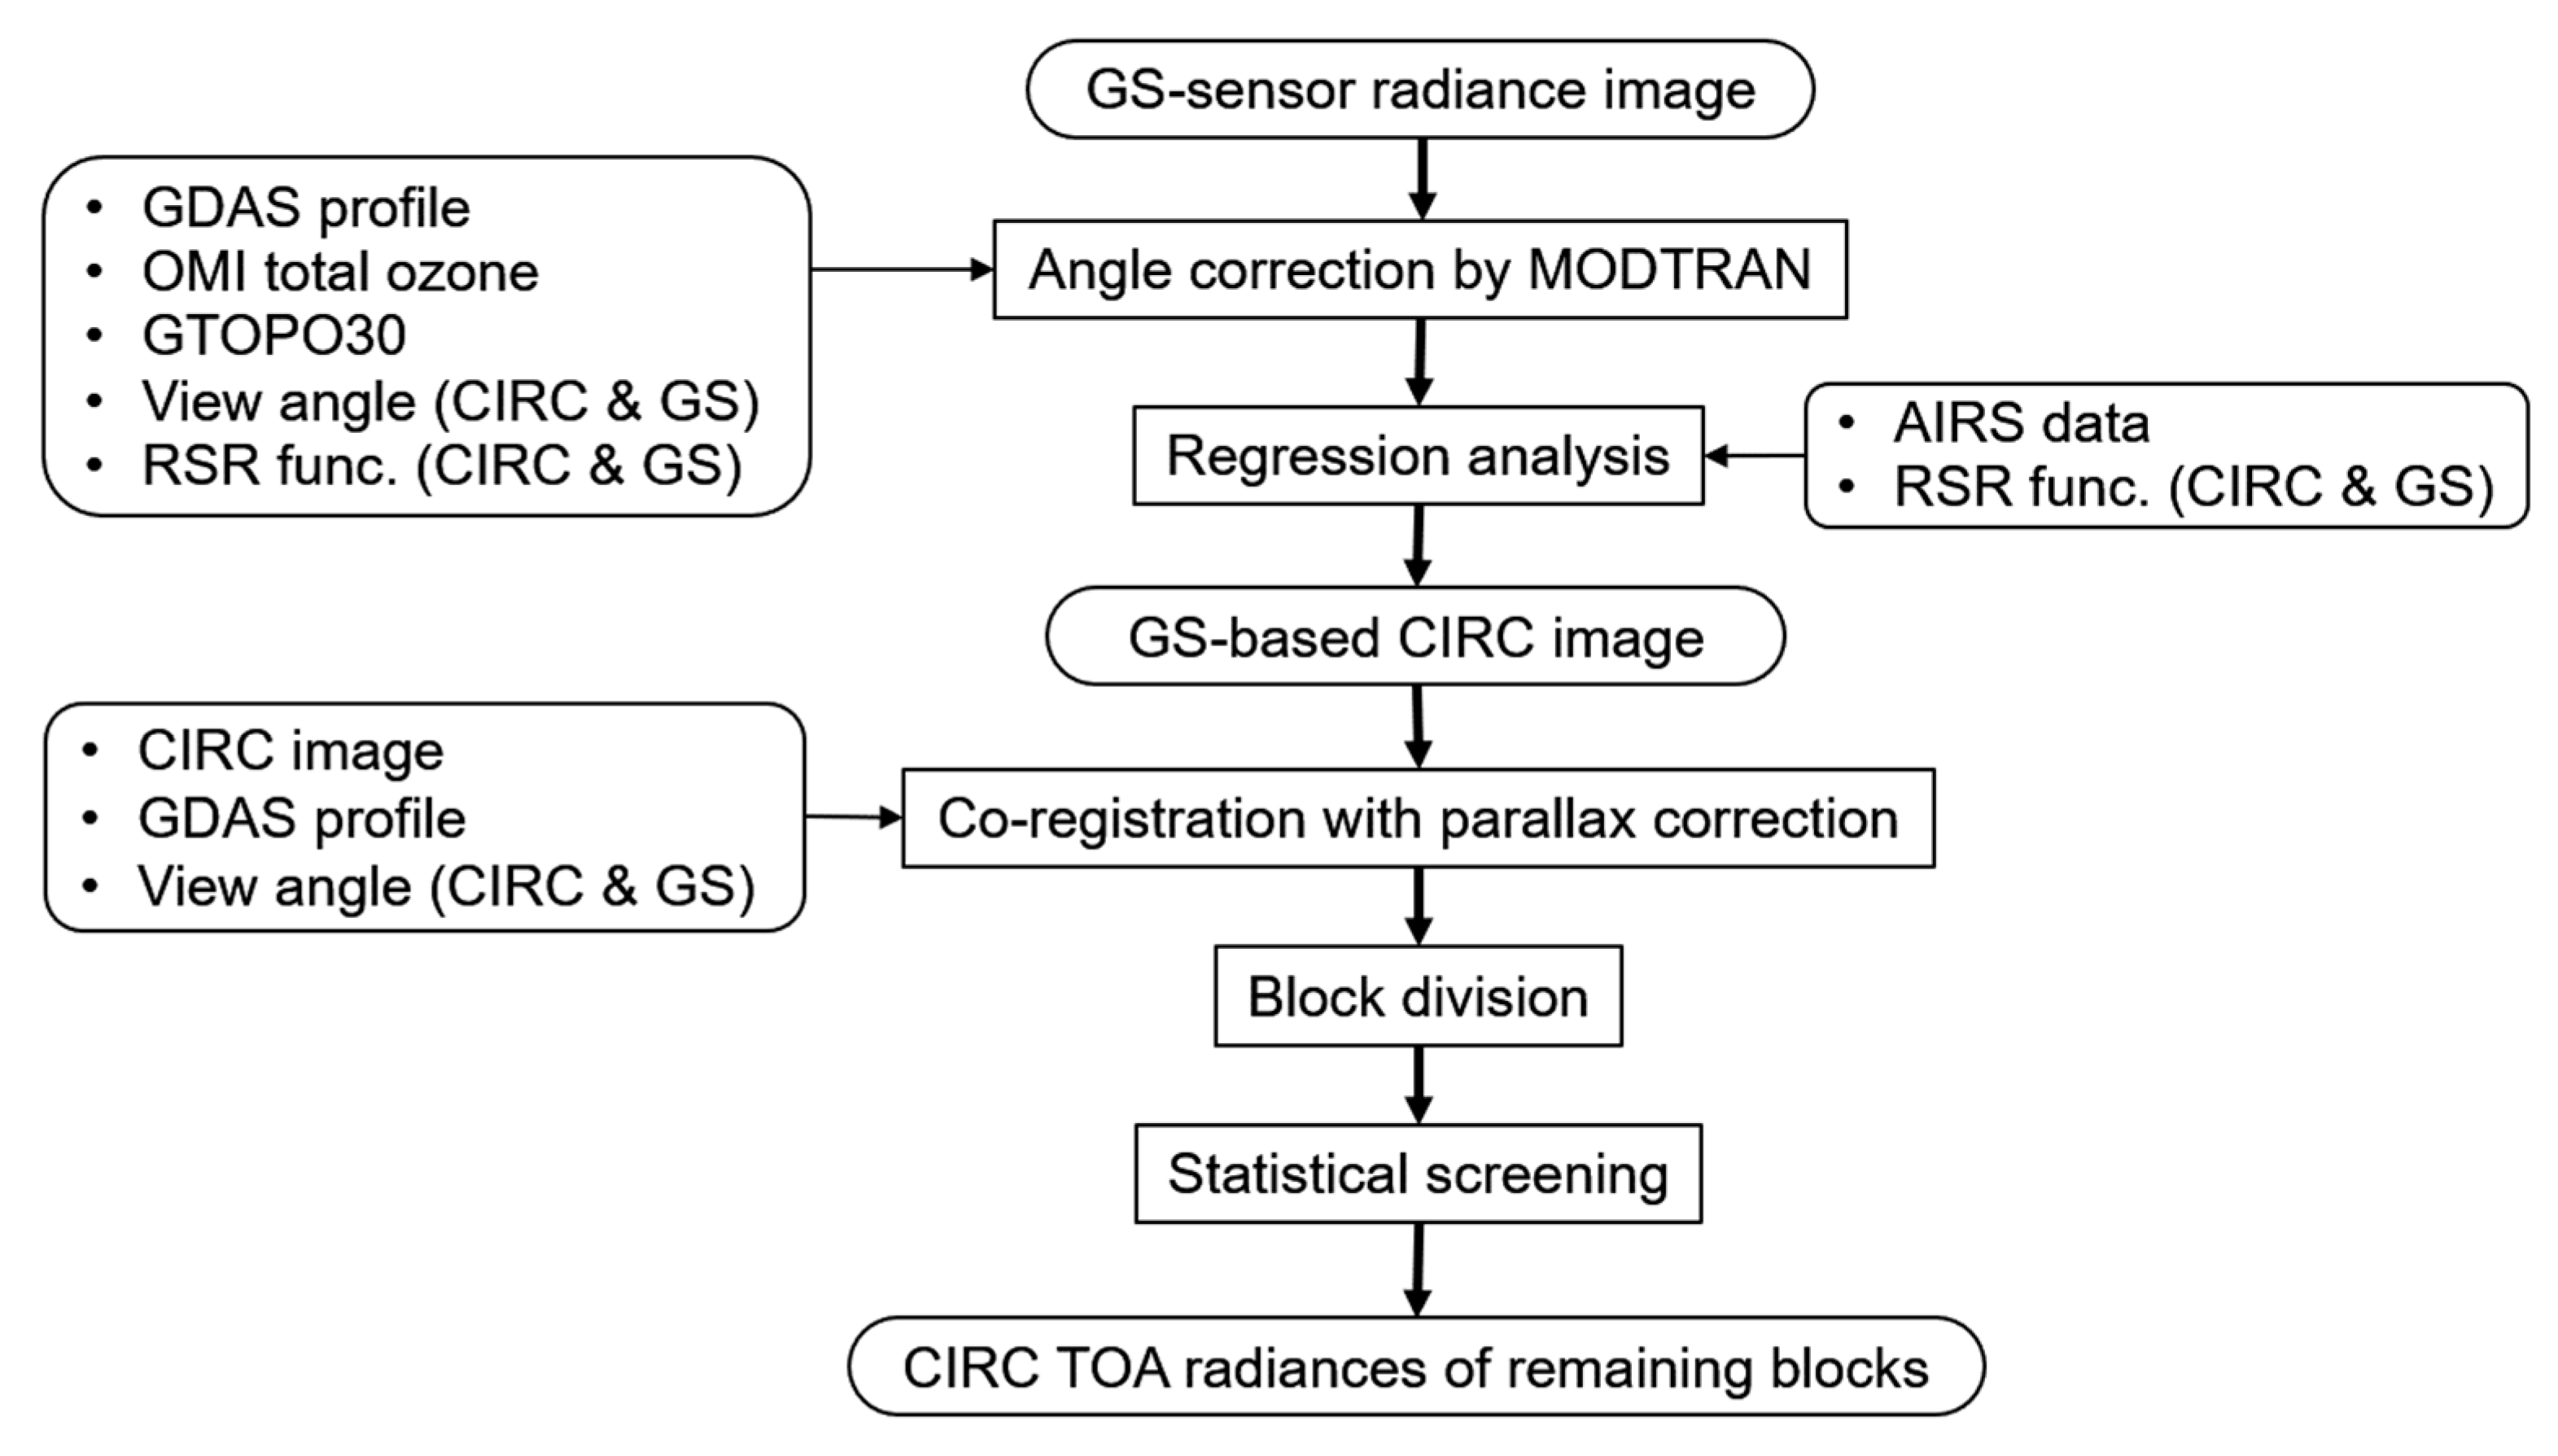
2.4.3. Generation of GS-Based CIRC Image

If a high spectral resolution sounder such as AIRS and IASI can be used as a reference sensor in CC, the TOA radiance of a target sensor can be estimated by convolution of the sounder radiances of the sounder used [10], but this approach is difficult to be applied to the CIRC instruments, because there is no sounder which allows coincident observations with the CIRC instruments. If MTSAT-2 Imager or Himawari-8/AHI is used as a reference sensor, the difference in spectral range, as shown by Figure 10, should be considered. Thus in the present paper, the GS-based CIRC radiance was regressively estimated from the spectral bands of the GS sensor used (IR1 and IR2 for MTSAT-2 Imager, and bands 11 to 15 for Himawari-8/AHI). This regression equation was determined for each CIRC image as follows:
  • An AIRS image acquired over the CIRC-covered area within one day from the CIRC observation date was searched and downloaded.
  • All AIRS pixels (including clouds) with a scan angle within 15 degrees from the CIRC viewing angle were selected.
  • For each AIRS pixel selected, the missing wavelength range of AIRS (8.22 to 8.8 μm; see Figure 10) [23] was linearly interpolated.
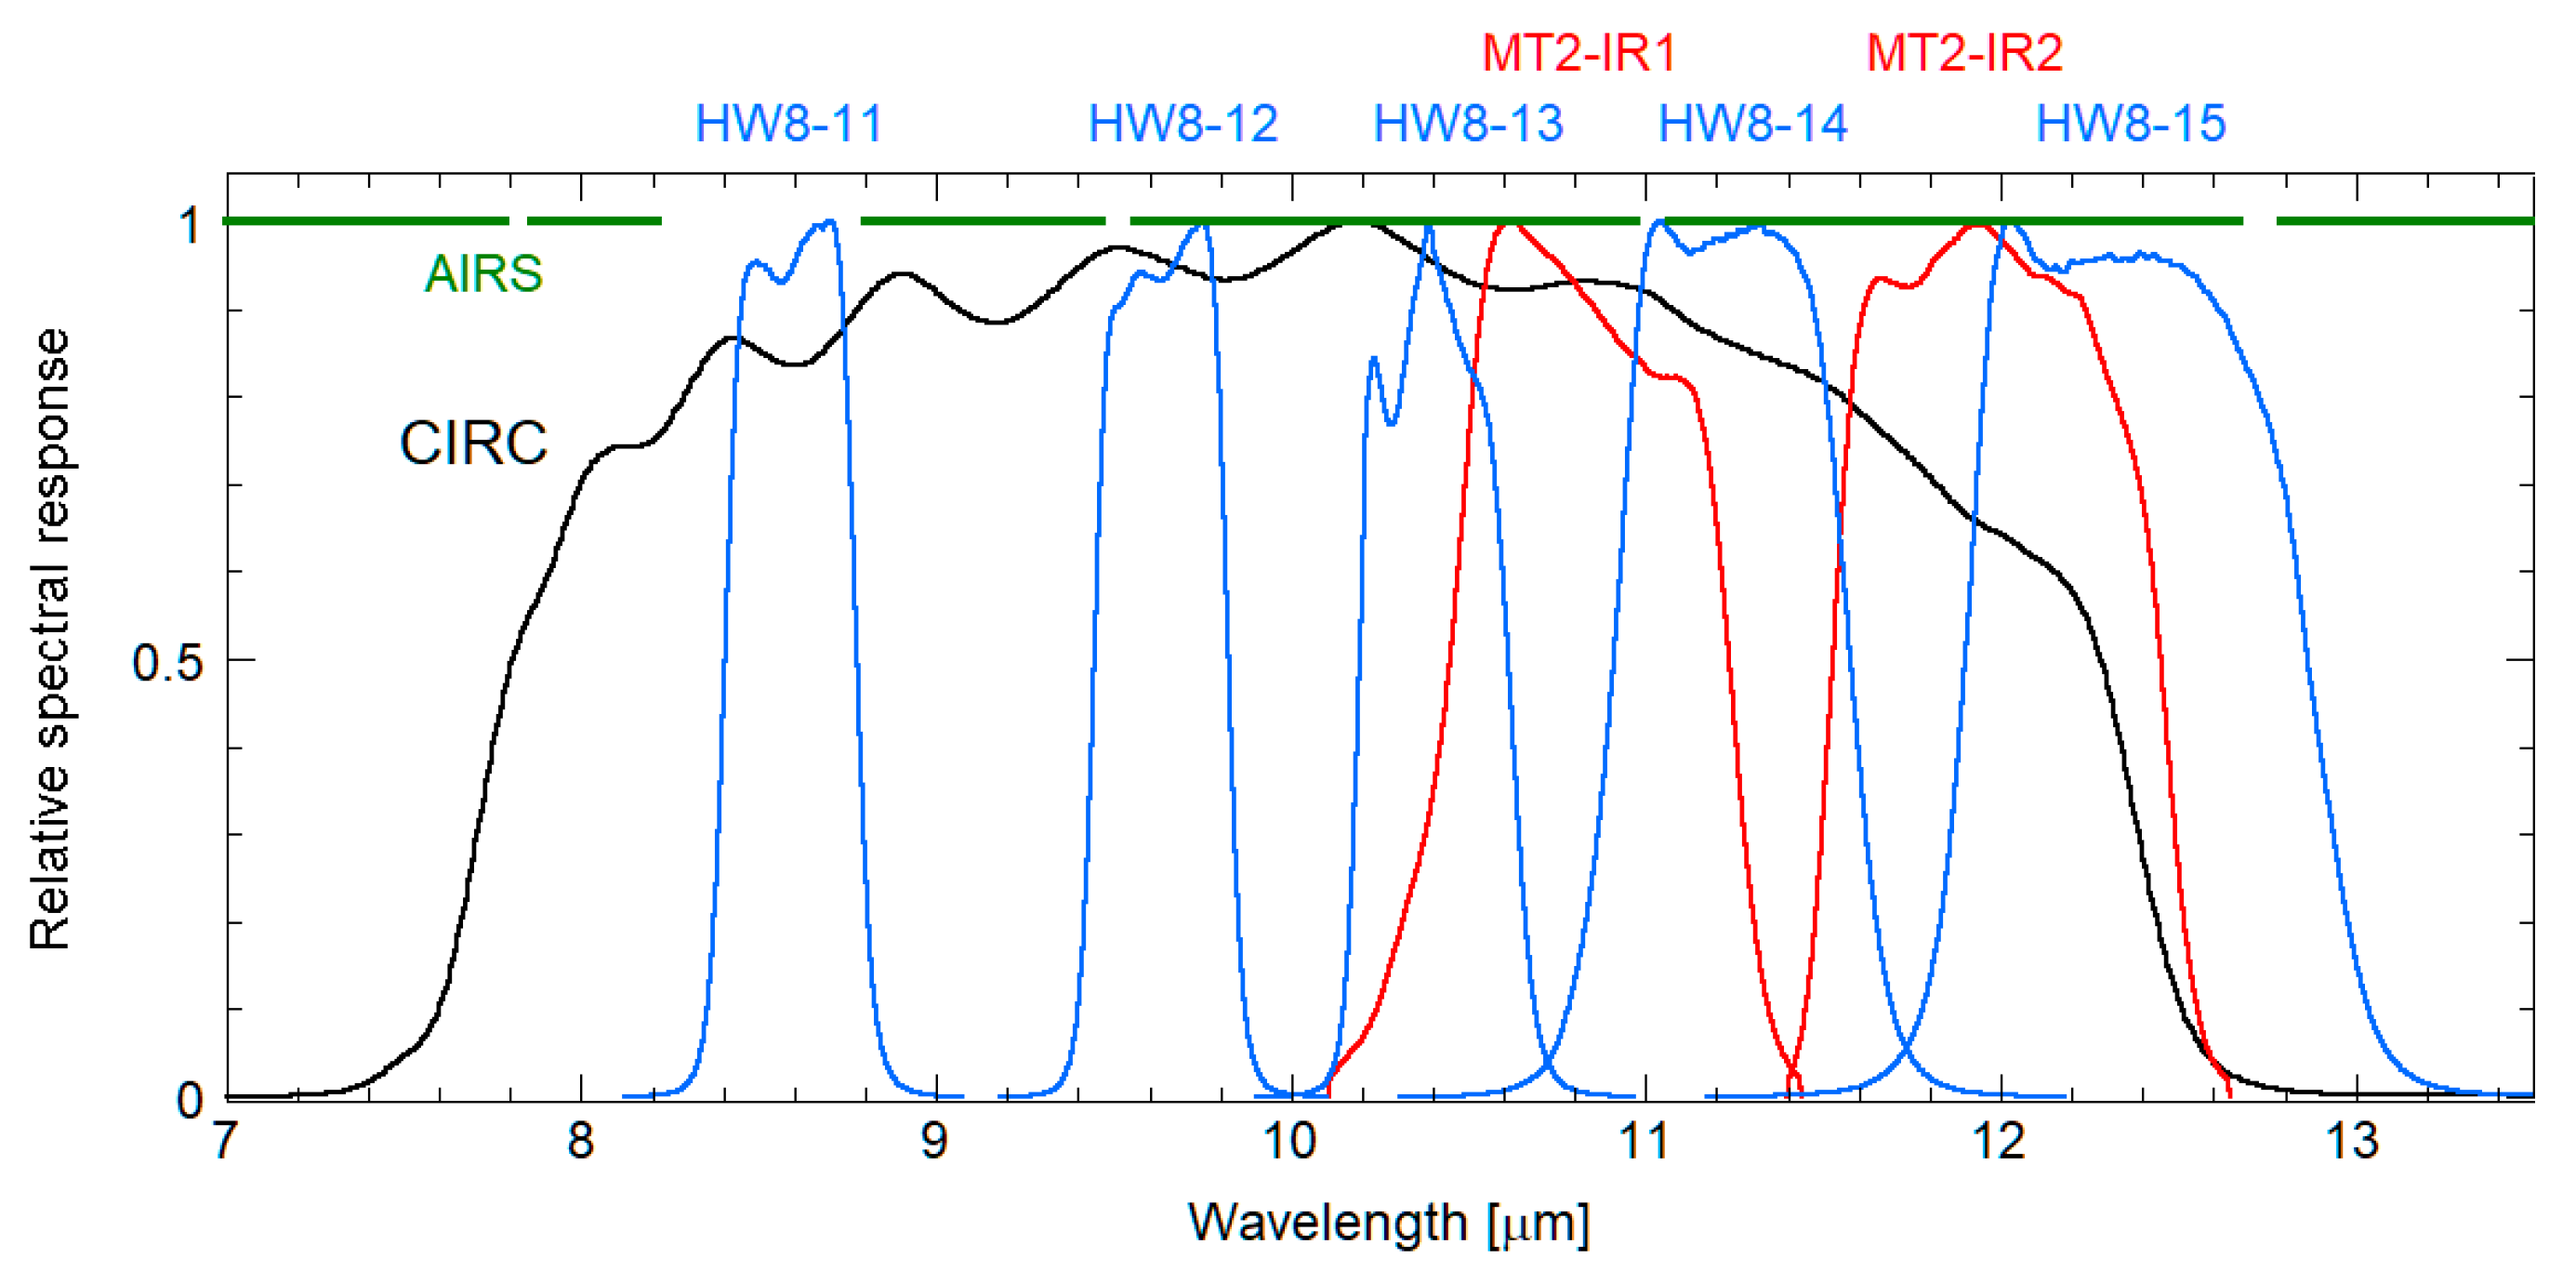
  • For each AIRS pixel selected, each radiance of the CIRC instrument and the GS sensor bands was calculated by convolution with each RSR function.
  • The linear regression equation for estimating the CIRC radiance from the radiances of the GS sensor bands was calculated using all radiance data obtained in Step 4.
The linear regression equation obtained in Step 5 can be expressed by
I c i r c = k K a k · I k ( θ c i r c ) + b ,
where k: GS sensor band, K: the set of the GS sensor bands, Icirc: GS-based CIRC radiance, Ik: the radiance of band k, θcirc: the viewing angle of the CIRC image, and ax, b: regression coefficients.
The reason why the regression equation was determined on an image-by-image basis was to adjust each equation to the surface, atmospheric, and geometric conditions of the CIRC image used. The regression coefficients and the root mean square (RMS) errors of the equations actually obtained are demonstrated in Section 3.2.

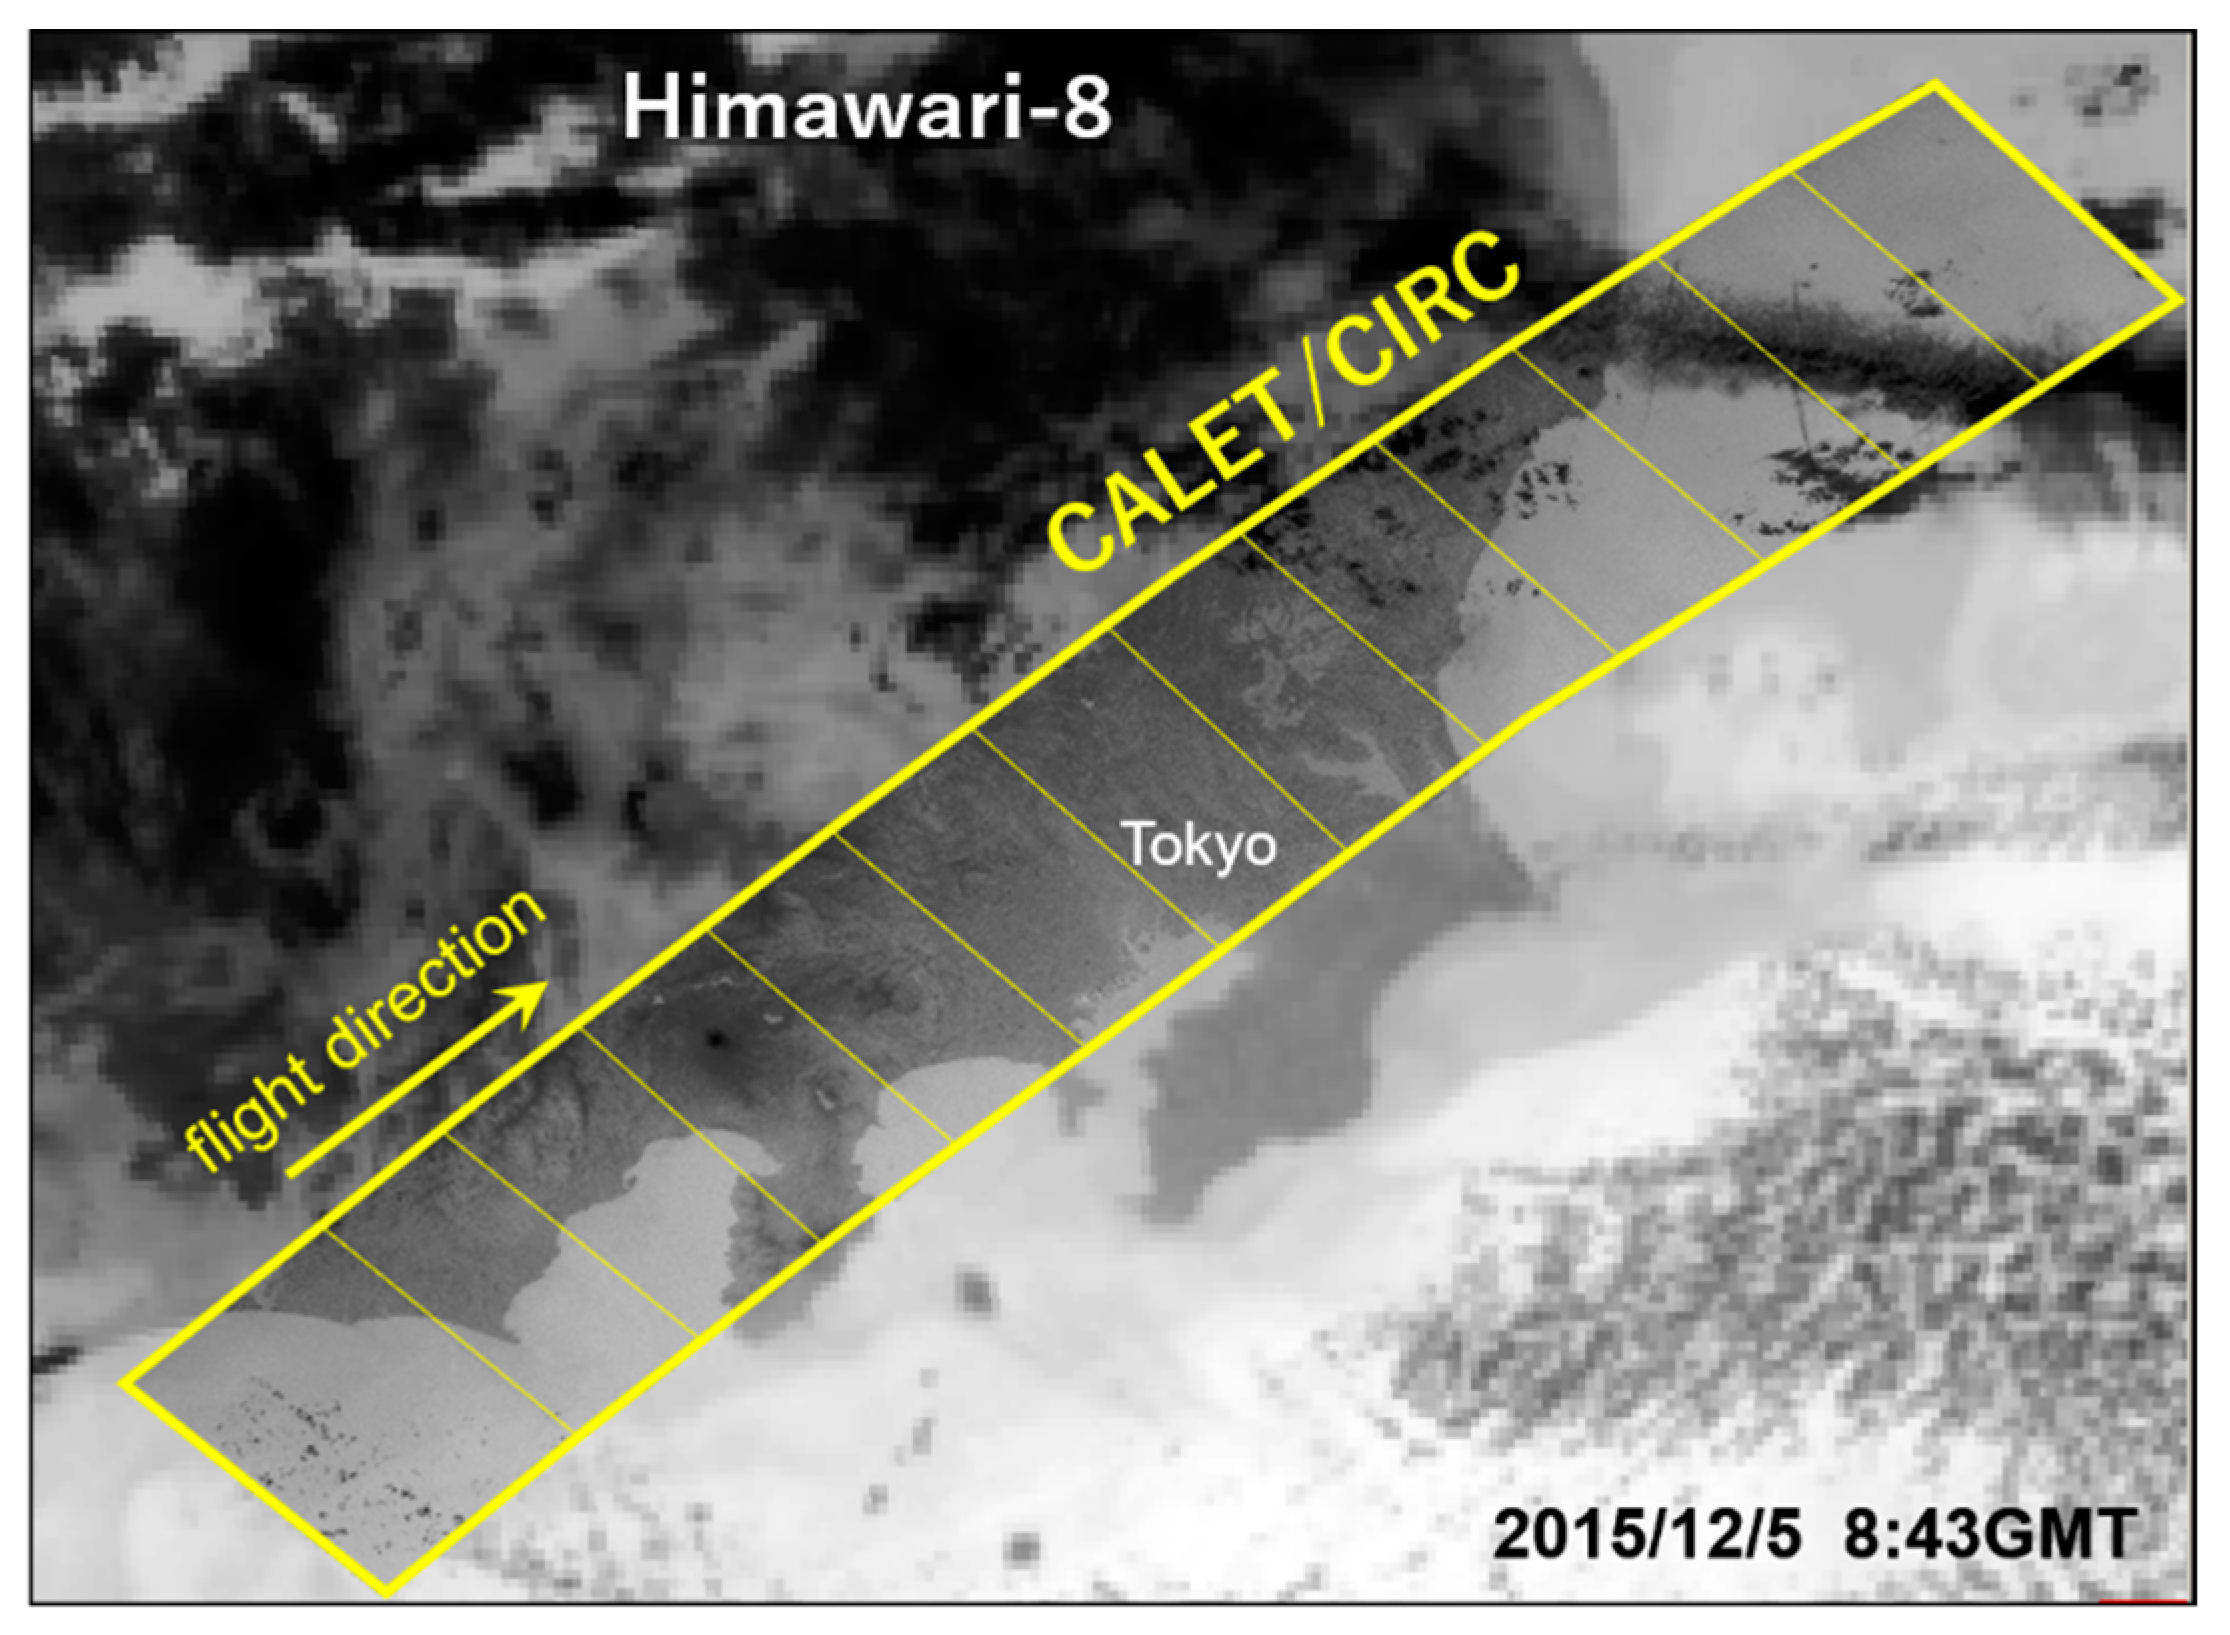
2.4.4. Co-Registration with Parallax Correction

The CIRC instruments can observe the Earth in up to 16 images per observation sequence. In CC of the CIRC instruments, all CIRC images obtained in one sequence were concatenated with each other, and the GS-based CIRC image generated in Section 2.4.3 was co-registered and interpolated to the concatenated (actual) CIRC image by the nearest neighbor method. Figure 11 demonstrates the concatenated CALET/CIRC image overlaid on the GS-based CIRC image acquired by Himawari-8/AHI around Tokyo on 5 December 2015.
In this procedure, it should be considered that the difference in viewing angles between the actual CIRC image and the GS-based CIRC image causes a parallax effect dependent on elevation or cloud height. Particularly, such parallax effect would be significant around the cloud edges or the tops of mountains, which have a large spatial change in height. Thus, we applied a simple parallax correction to the GS-based CIRC image in the co-registration processing. First, we selected pixels with a lower temperature than the air temperature at 700 hPa in the GDAS product, because pixels which should be corrected for parallax effect usually have a lower temperature. Then, we predicted the height of each selected pixel using the GDAS air-temperature profile, and moved the position of that pixel based on the predicted height and the difference in viewing angles. Thus, the co-registered image pair of the actual CIRC image and the GS-based CIRC images was obtained in each dataset of CC.

2.4.5. Statistical Screening

The next step was to extract radiance pairs used in CC from each image pair of the actual CIRC image and the GS-based CIRC image. First, each image in the image pair was divided into blocks with a size of about 3 by 3 pixels in the ground resolution of the GS sensor for reduction of the effects of a position gap or the MTF. Next, the mean and the standard deviation of the radiance were calculated for each block in the both images. Then, the blocks which had many dummy pixels or a standard deviation greater than the threshold were excluded, and the image pair with nine or fewer remaining blocks was excluded due to a lack of the radiance pair. As a result, the mean-radiance pairs of all the remaining blocks in the remaining image pairs were used in CC of the targeted CIRC instrument.

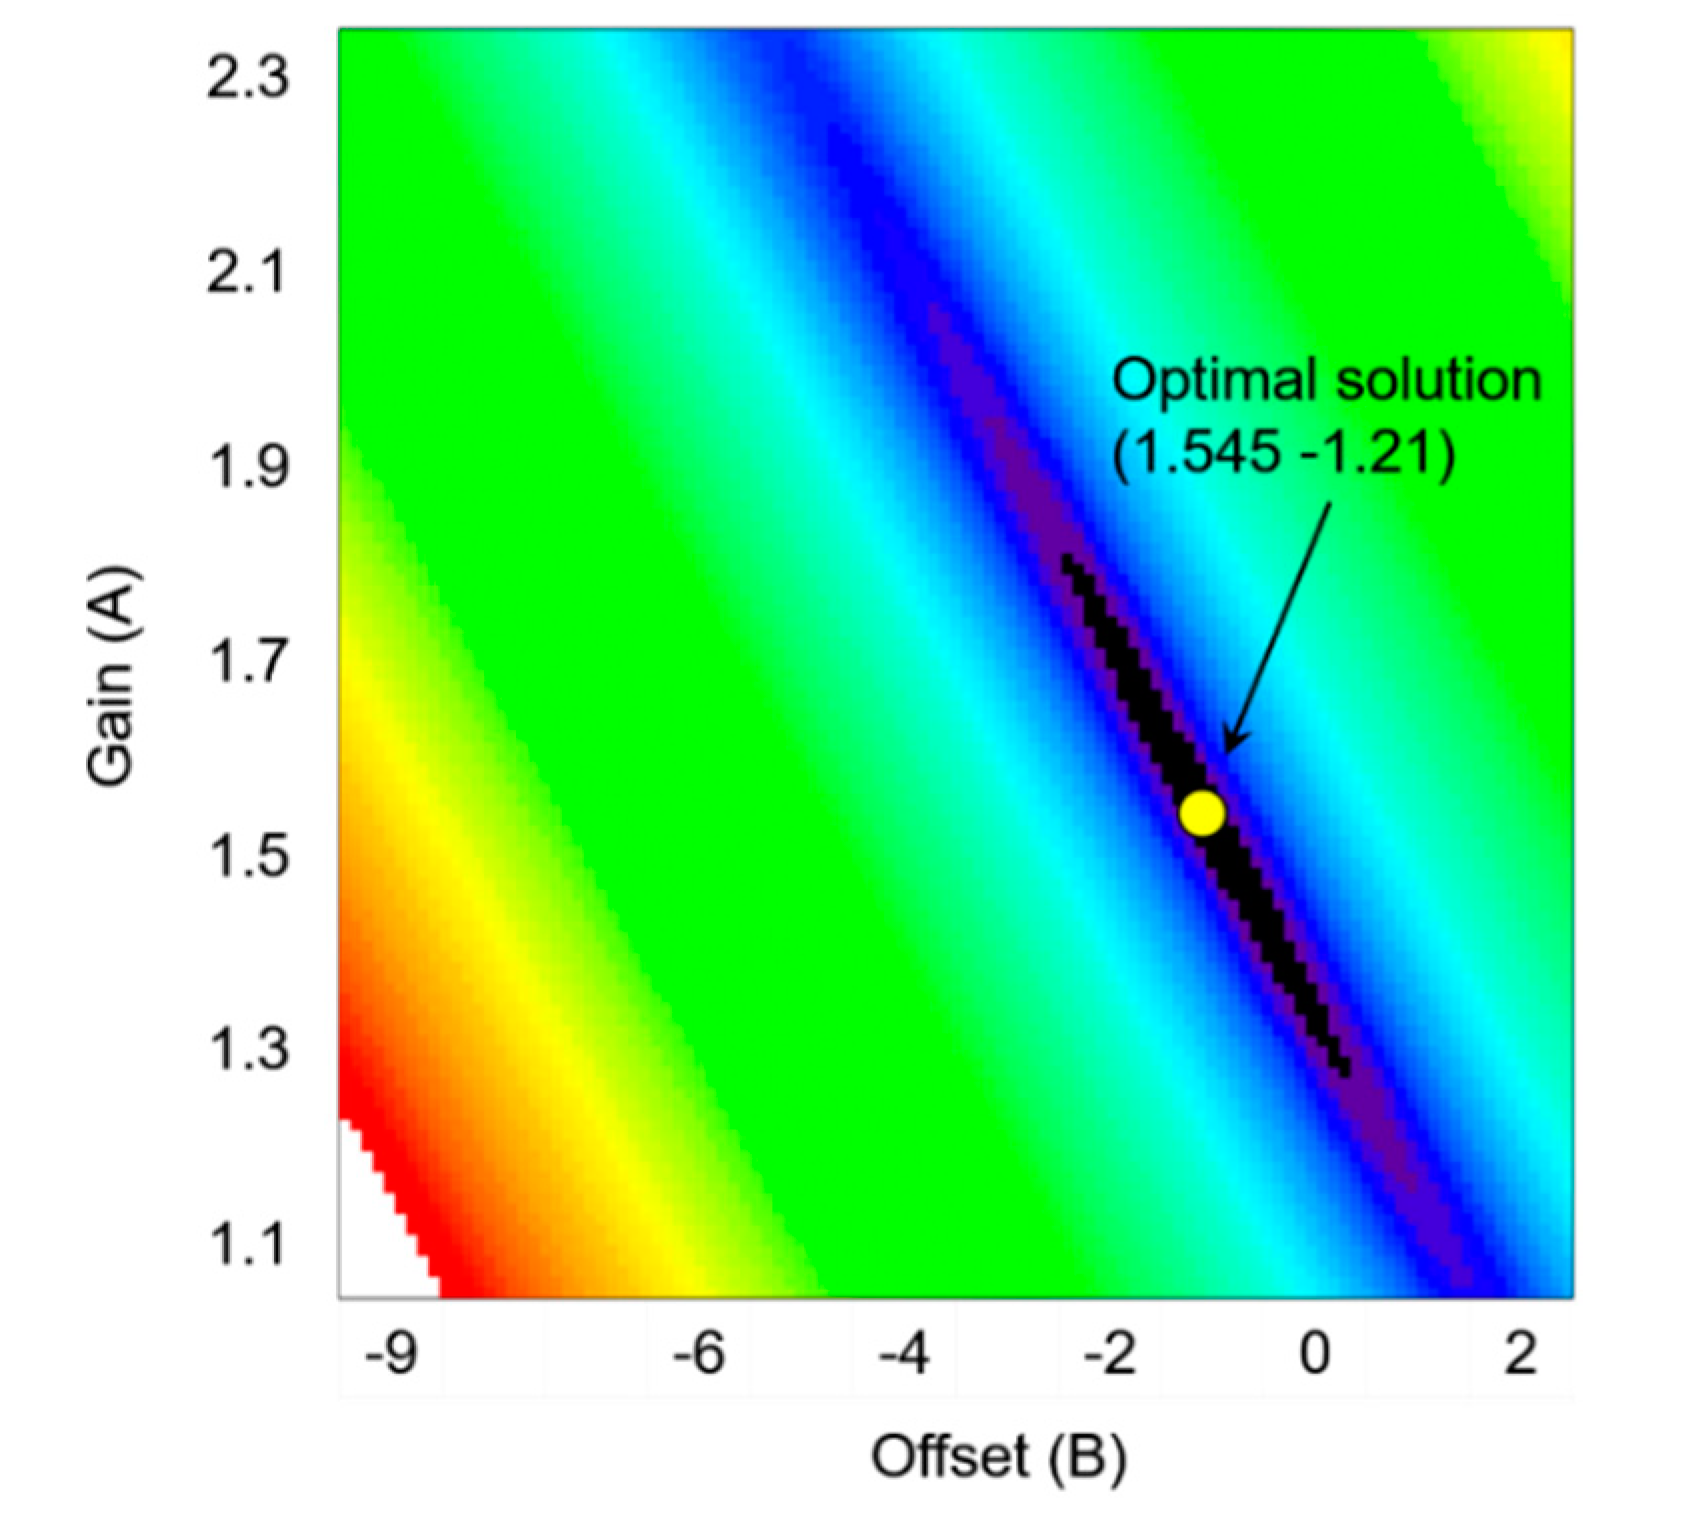
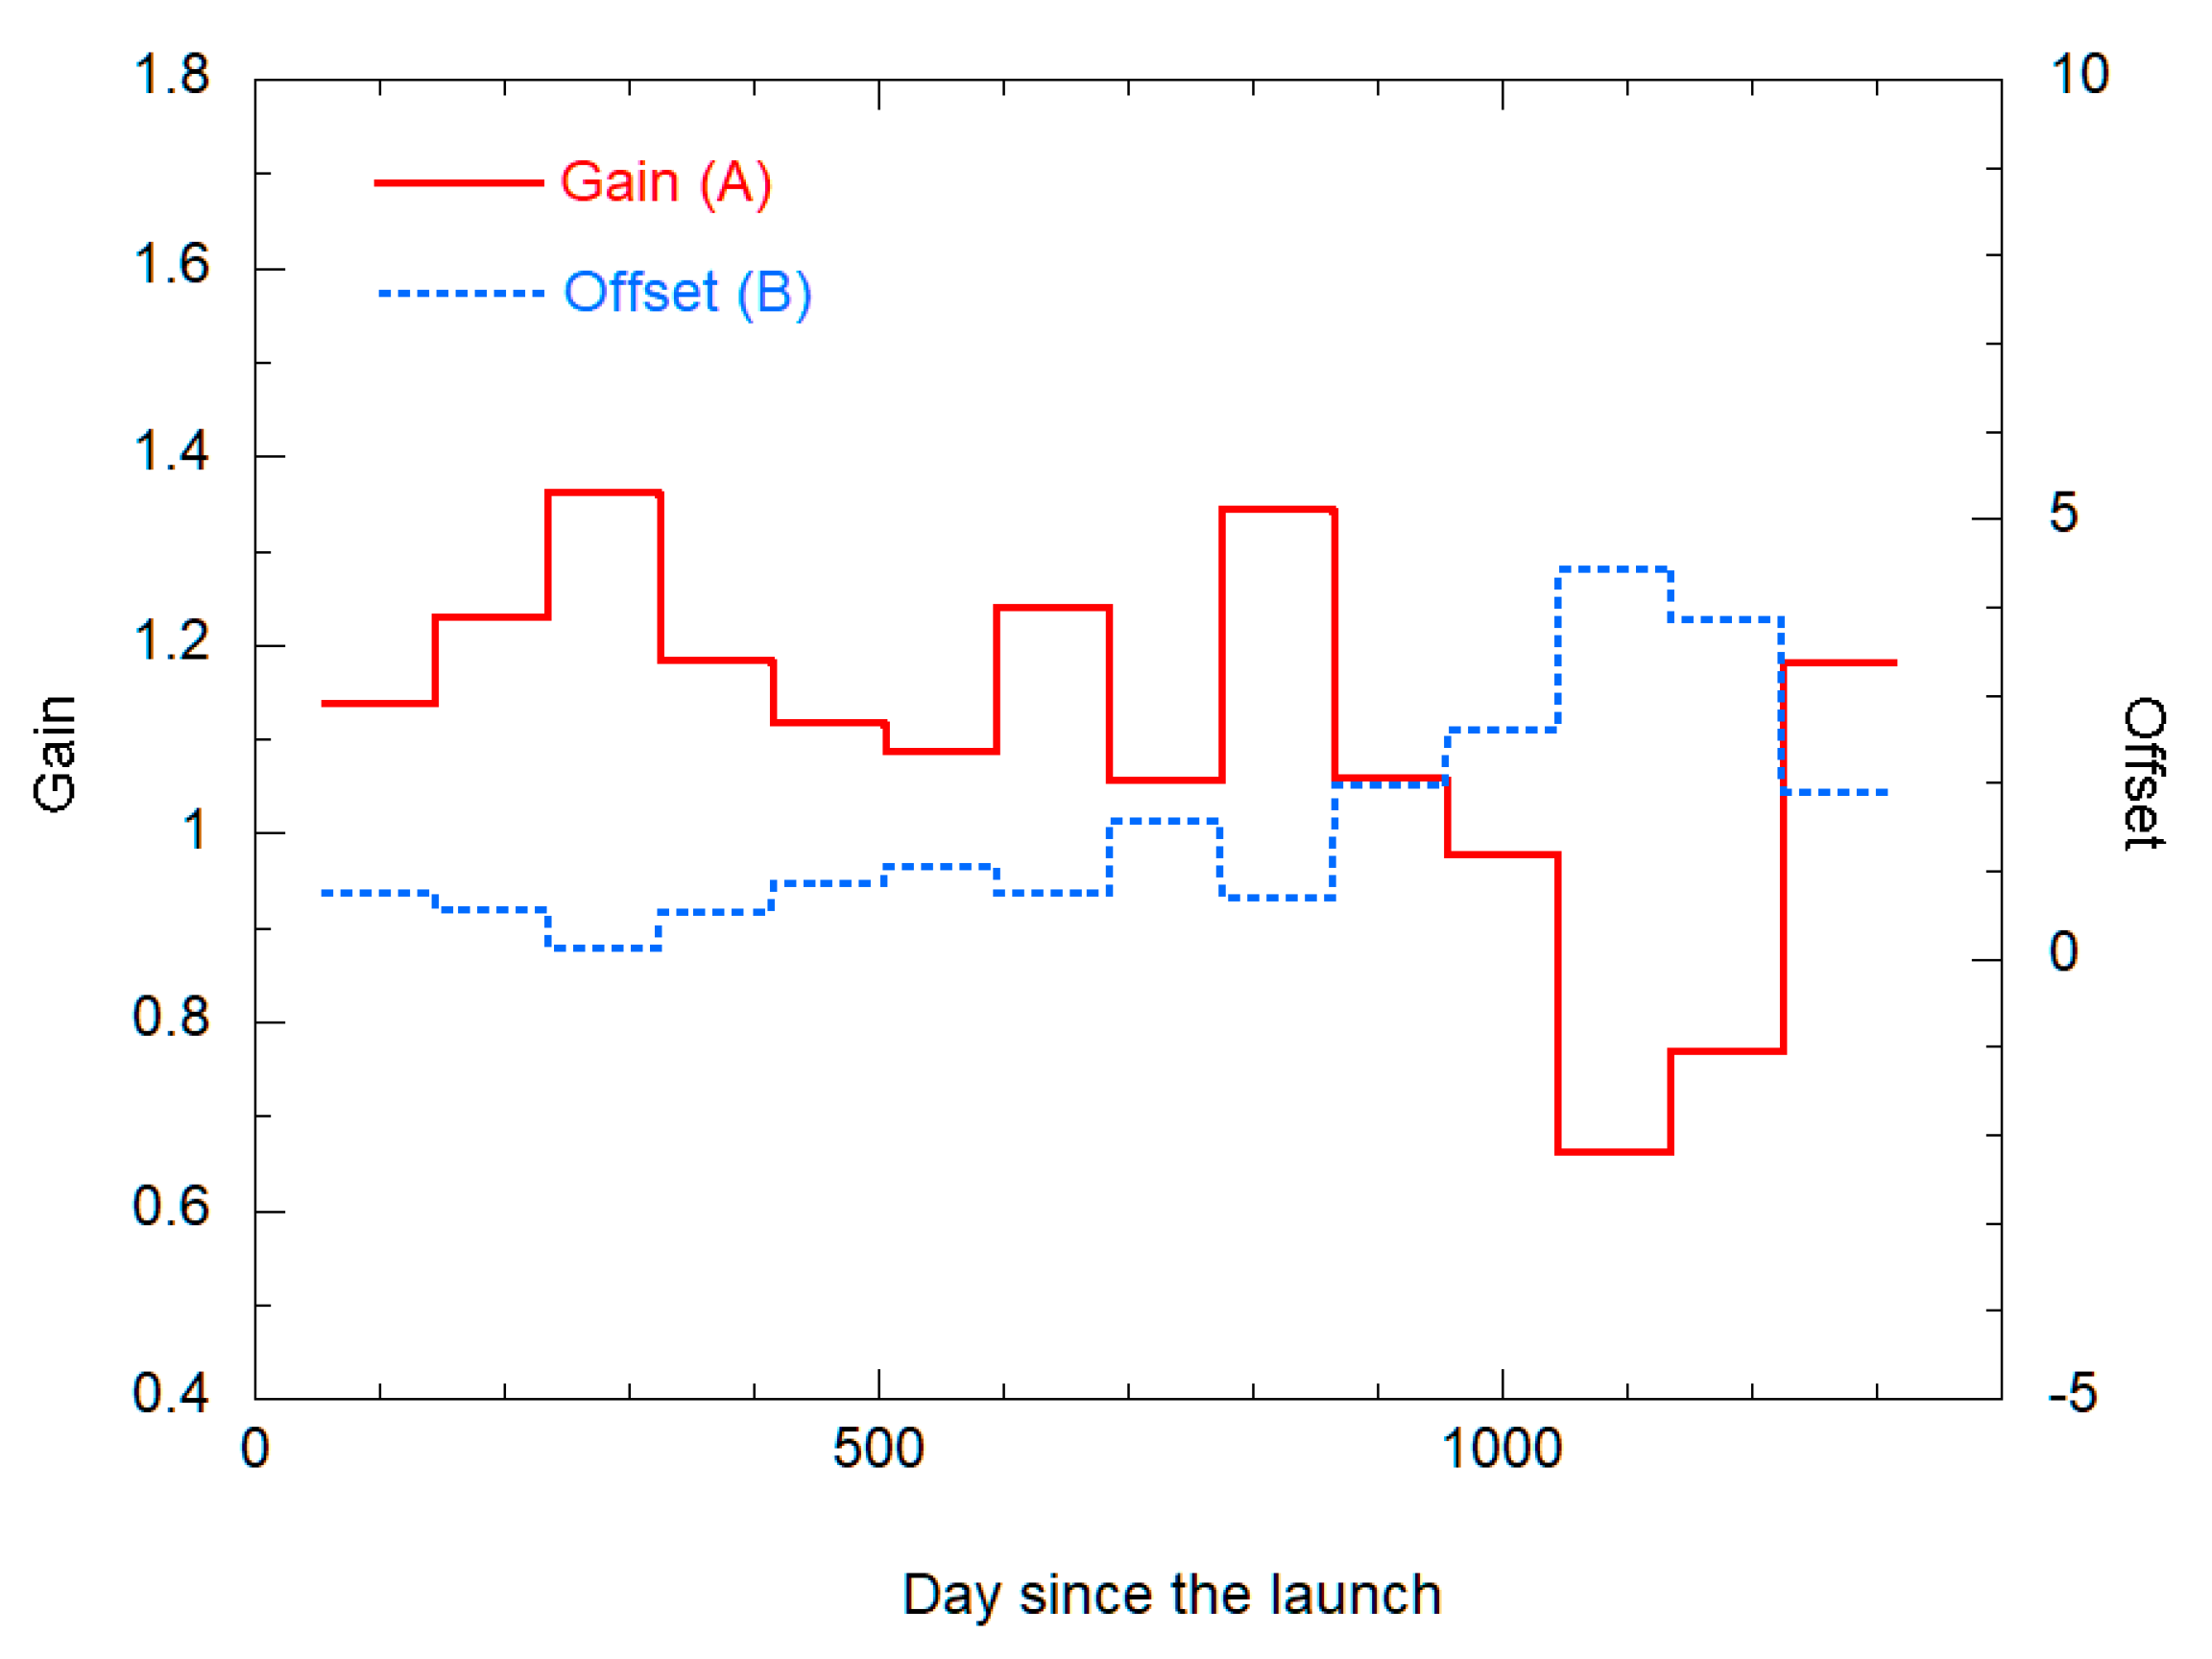
2.5. Determination of Recalibration Coefficients for the CIRC Instruments

The datasets used for the determination of recalibration coefficients (A and B) for ALOS-2/CIRC were 9 datasets from Exp-VC, 80 datasets from Tel-VC, and 264 datasets from CC, and those for CALET/CIRC were 5 datasets from Exp-VC, 28 datasets from Tel-VC, and 123 datasets from CC. The details of them are given in Section 2.2.3, Section 2.3.2 and Section 2.4.1.
In the present paper, the recalibration coefficients A and B given in Equations (1) or (2) were given as constants to each period at intervals of 90 days from D = 55, which was 18 July 2014 for ALOS-2/CIRC, and 13 October 2015 for CALET/CIRC, where D is the day since the launch. The main reason why such step functions were used was to suppress fluctuations in A and B.
Using all results from Exp-VC, Tel-VC, and CC, we searched the optimum solutions of A and B from the possible ranges of A and B. The possible ranges were determined based on a preliminary investigation; the possible ranges given for ALOS-2/CIRC were 1.1 to 2.3 for A, and −9.0 to 2.0 for B, and those for CALET/CIRC were 0.6 to 1.4 for A, and −0.5 to 5.0 for B. The calculation steps were 0.001 and 0.01 for A and B, respectively, for each CIRC instrument.
In the optimum solution search, the evaluation value, Q, for temporal values of A and B was given by weight-averaging the RMS of the radiance difference of each dataset of Exp-VC, Tel-VC, and CC in each period. That is, the value of Q was expressed by
Q = n = 1 N w n δ n / n = 1 N w n ,
where n: the dataset number of each Exp-VC, Tel-VC, and CC included in that period, N: the total number of datasets used for that period, wn: weight given to the dataset n, and δn: the RMS of the radiance differences over all CIRC images (for Exp-VC or Tel-VC) or blocks (for CC) in the dataset n, where the radiance difference is a difference between the recalibrated radiance with the temporal values of A and B and the predicted radiance. As for the values of wn, 3 was given to each dataset of Exp-VC, and 1 was given to each dataset of Tel-VC or CC. That is, the results of Exp-VC datasets were three times weighted compared with those of the other datasets in determining the recalibration coefficients A and B. This is because Exp-VC provides a more reliable prediction, but the available datasets of Exp-VC are limited.

3. Results and Discussion

3.1. Sensitivity Analysis Results for Exp-VC and Tel-VC

Table 2 shows the average and the standard deviation (in parentheses) of the TOA brightness temperature change (K) induced by surface temperature changes of ±1 K or atmospheric vertical profile changes (absolute shift of ±1 K in air temperature profile, and relative scaling of 10% in relative humidity profile) in Exp-VC and Tel-VC of each CIRC instrument. In this sensitivity analysis, GDAS profiles were used, while radiosonde data were used for the recalibration analysis in Exp-VC if they were available, and also only one CIRC image was used for each dataset of Exp-VC and Tel-VC, even if two or more CIRC images were overlappingly acquired. The results indicate that the surface temperature changes are comparable to the TOA brightness temperature changes, meaning that Exp-VC will be more reliable than Tel-VC, because surface temperature is more accurate in Exp-VC. The impacts of atmospheric profile changes to TOA brightness temperatures are not large under the given conditions, but it should be noted that they will increase significantly if atmospheric profile errors are much larger than the changes given in this analysis.

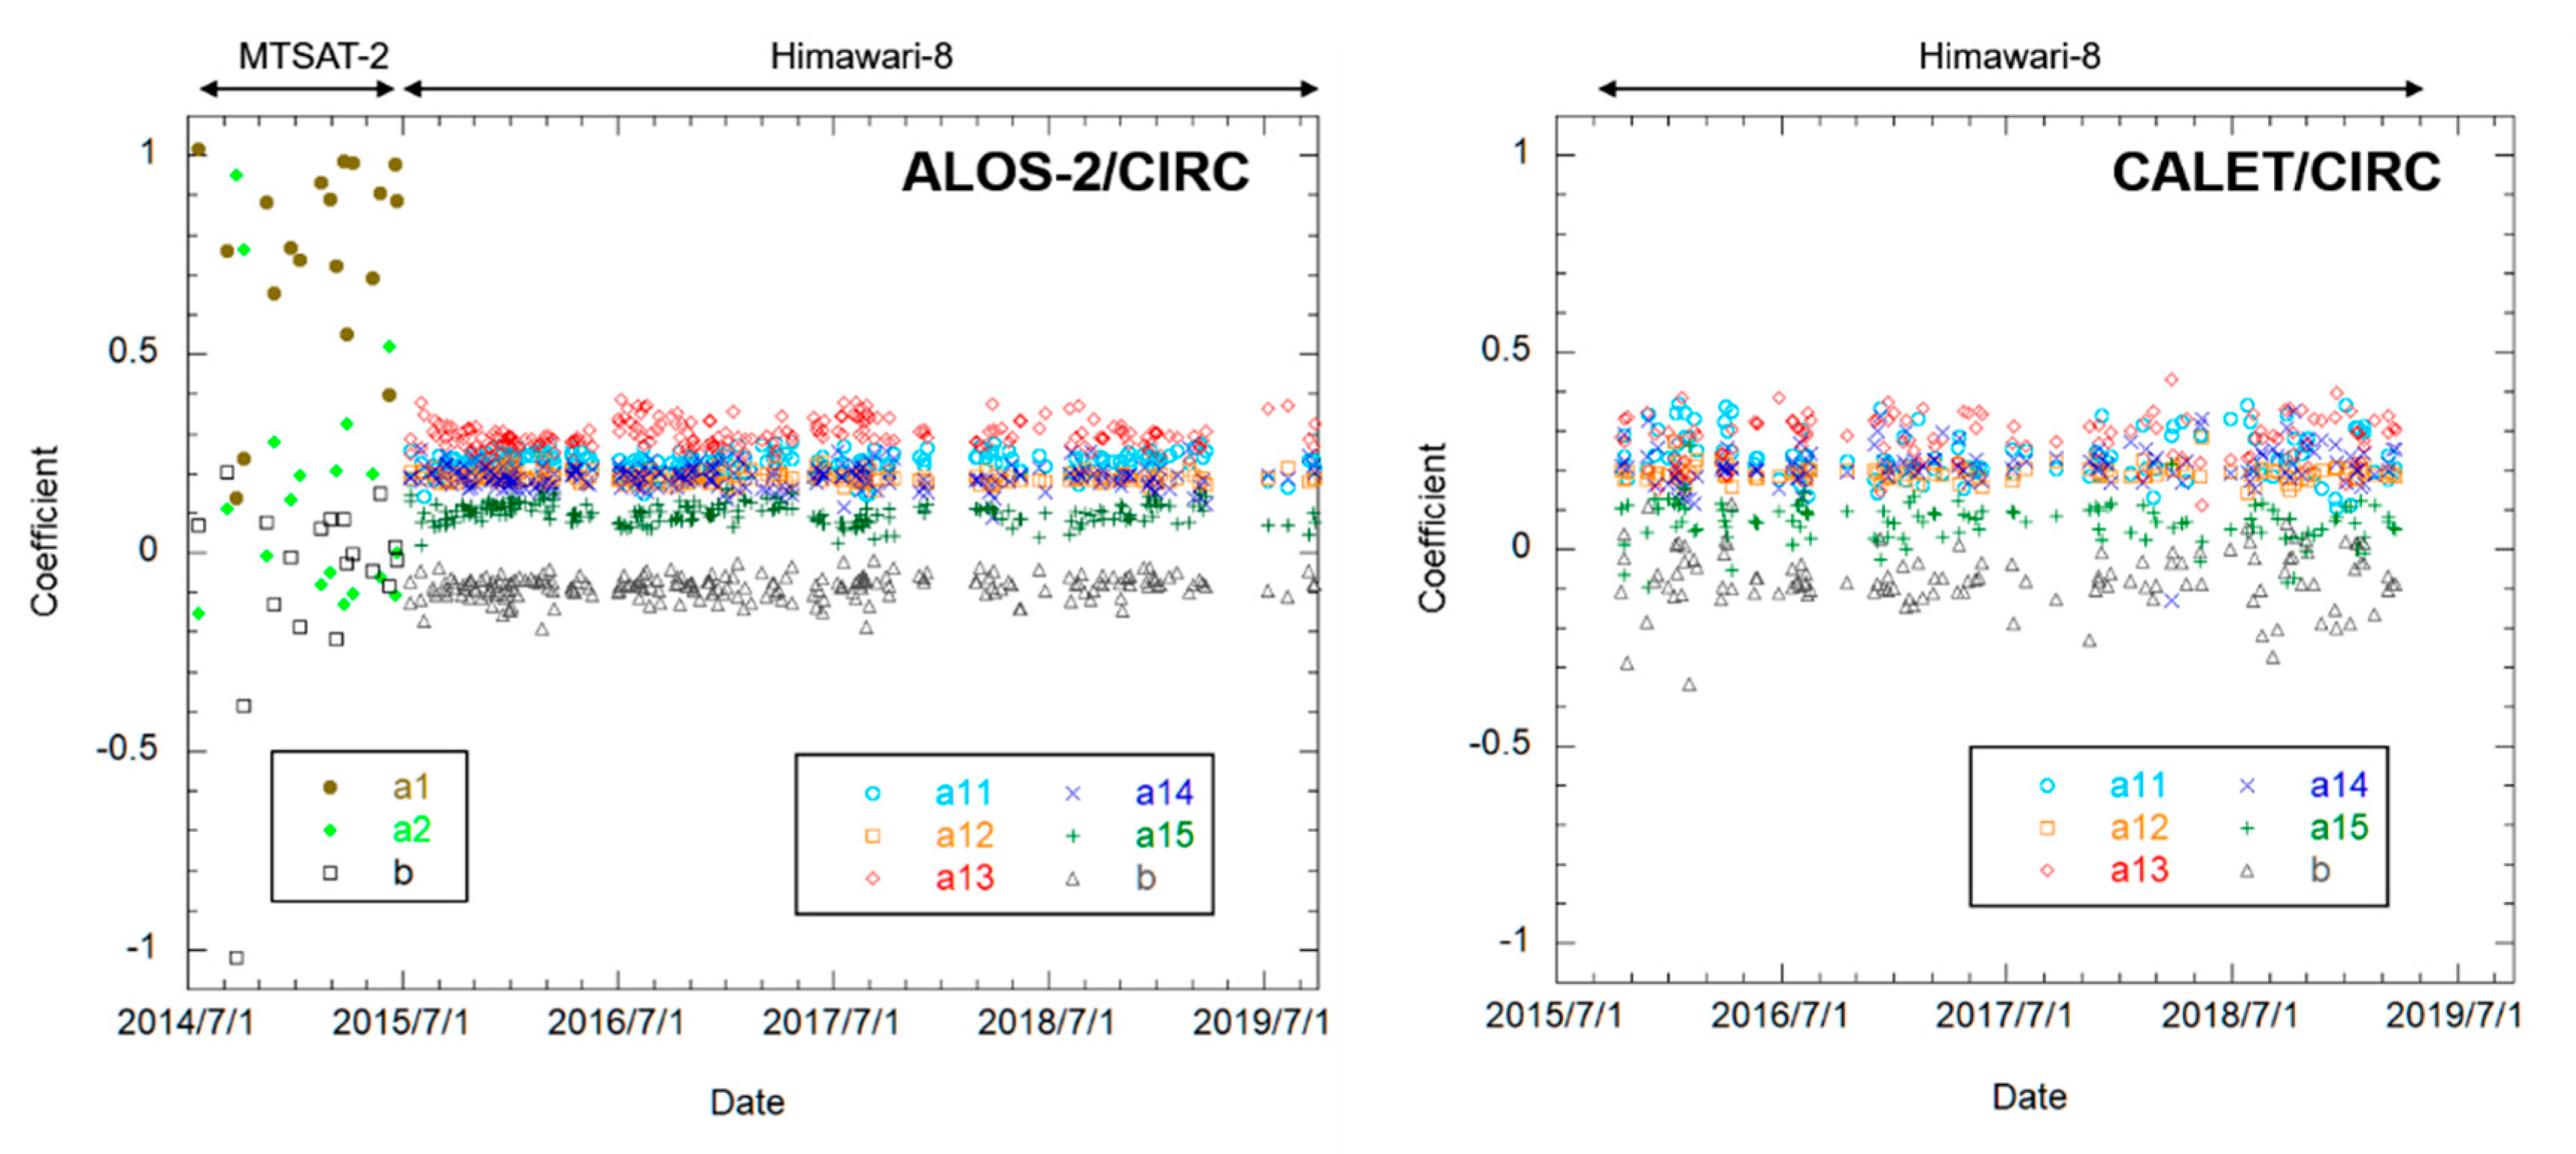
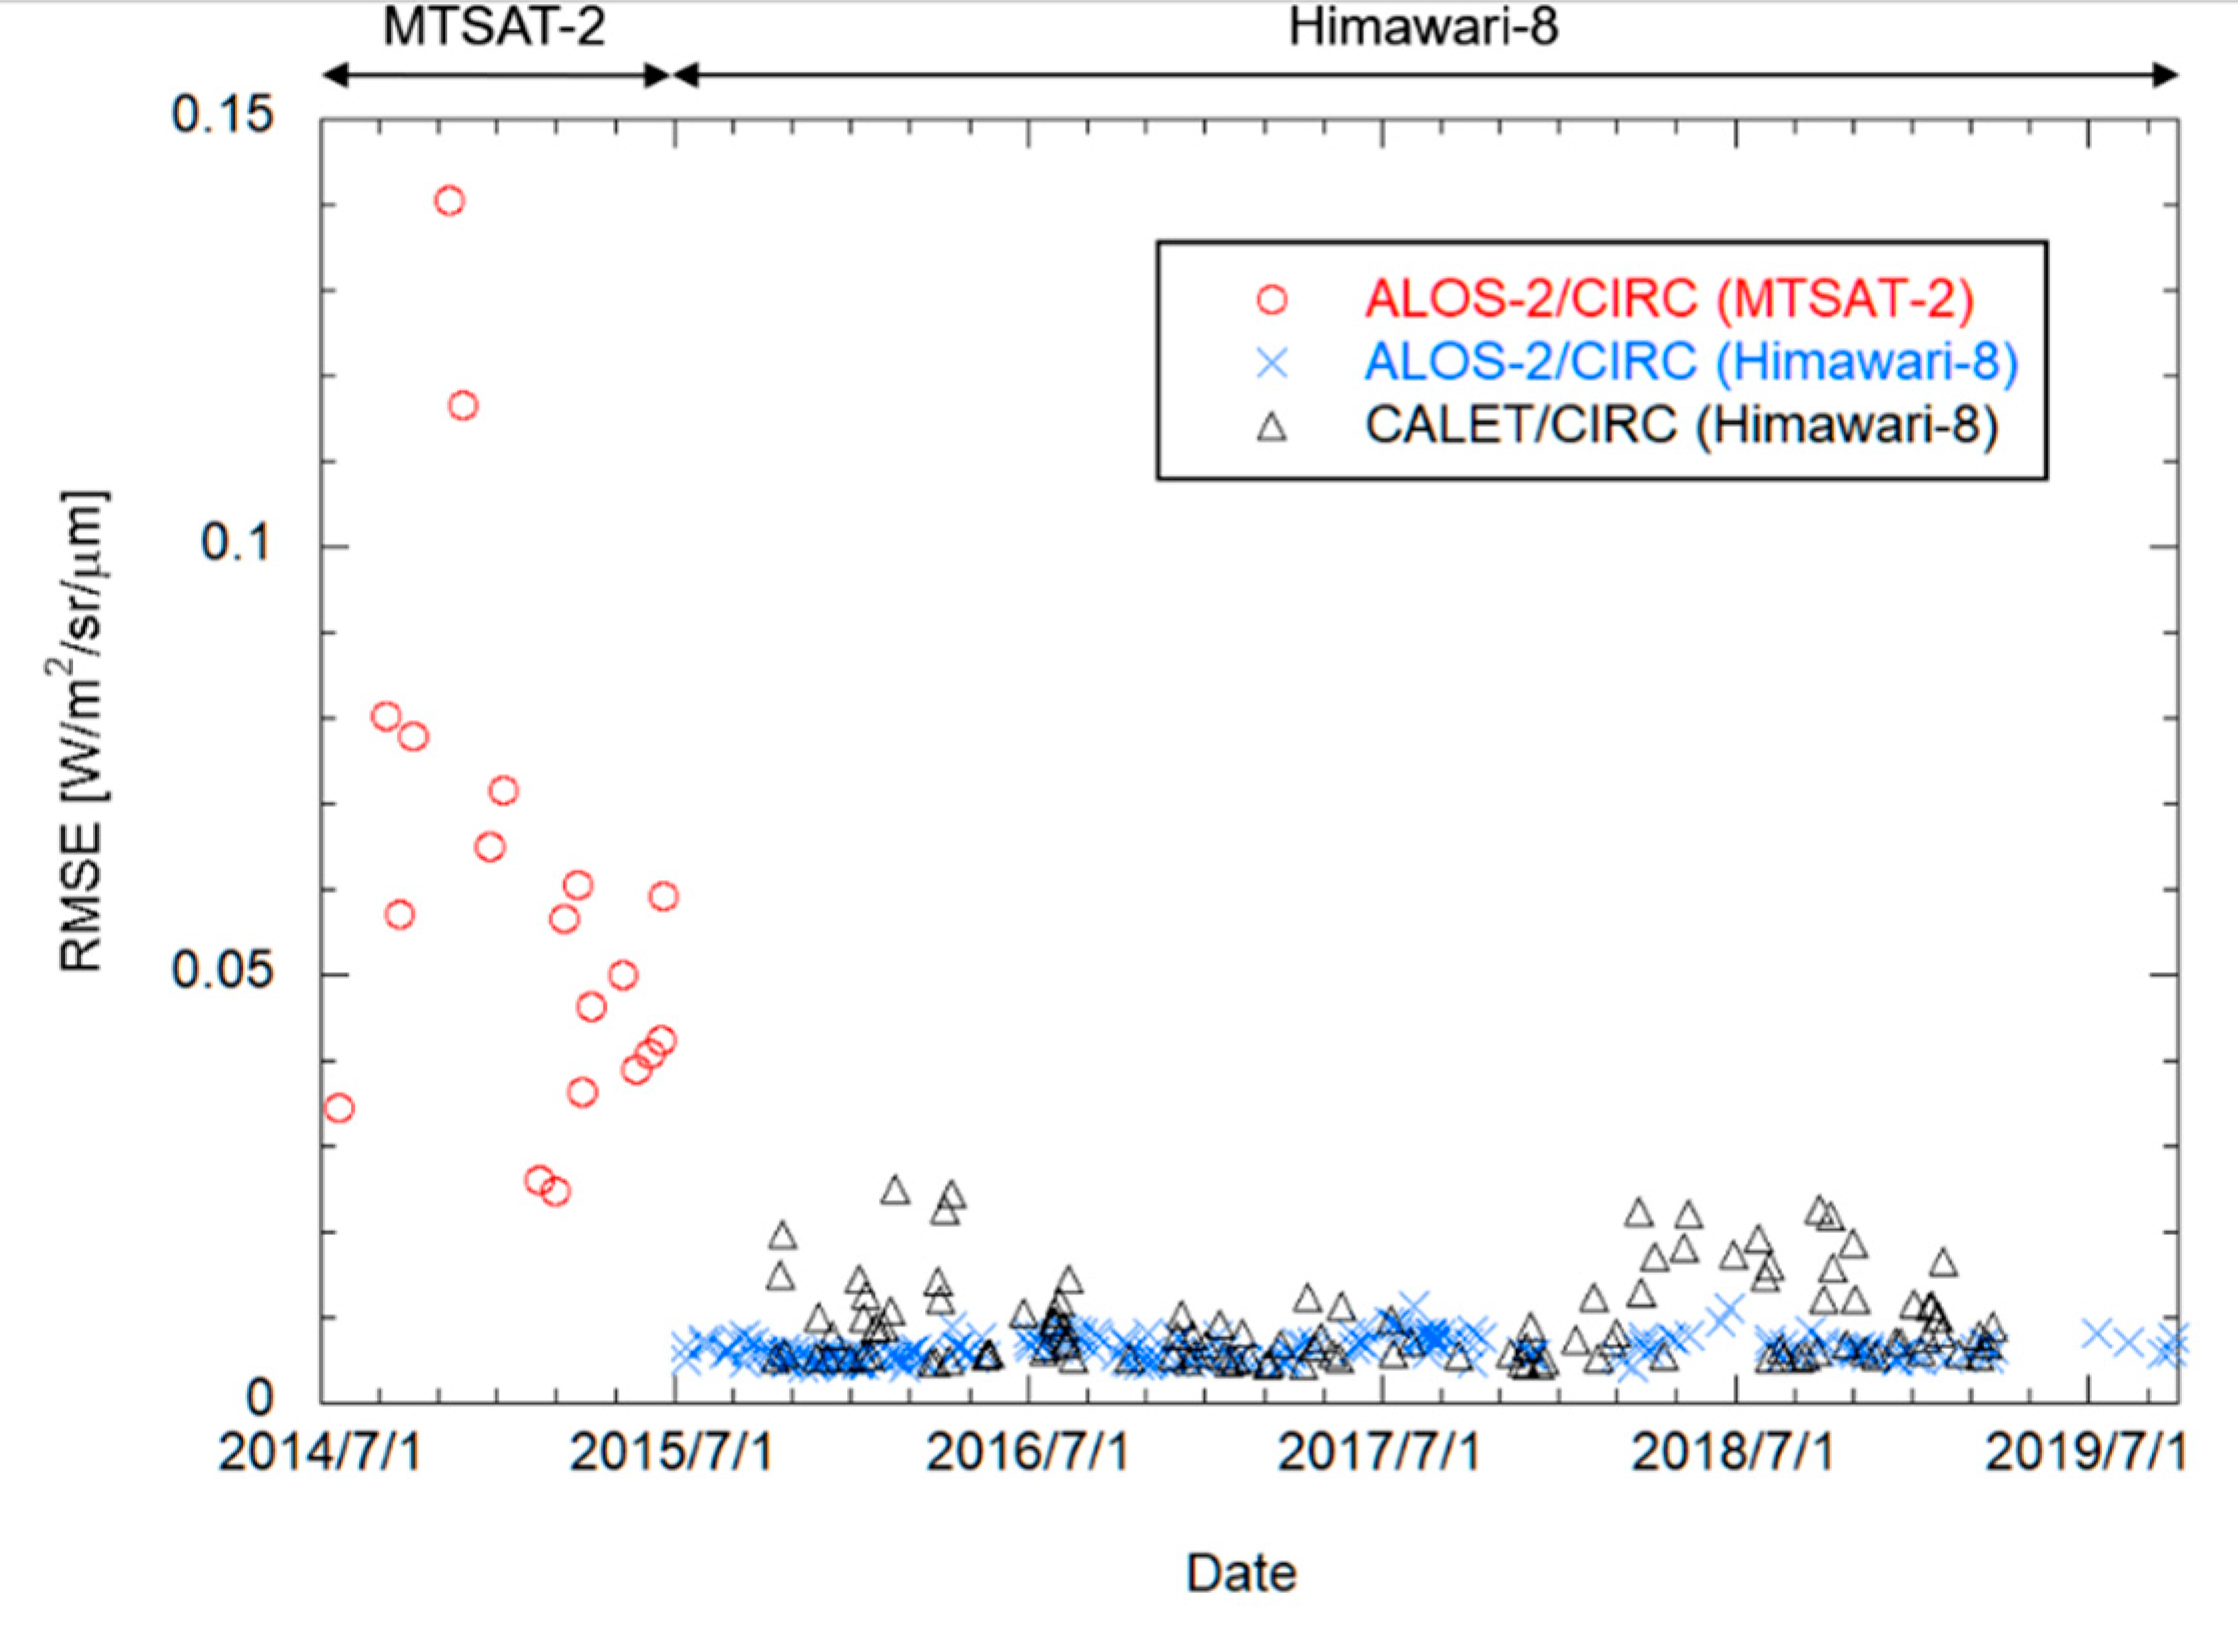
3.2. Coefficients and RMS Errors of AIRS-Based Regression Equations Used in CC

Figure 12 shows the coefficients of the AIRS-based regression equations (Equation (8)) obtained for the ALOS-2/CIRC images (left) and the CALET/CIRC images (right) as a function of date, where MTSAT-2 Imager was used as a reference sensor for the ALOS-2/CIRC images observed before 7 July 2015, and Hiwamari-8/AHI was used for all other images. The RMS errors are shown as a function of date in Figure 13.
As for MTSAT-2 Imager, Figure 12 shows a large variance in the regression coefficients, and Figure 13 shows large RMS errors, because only two spectral bands were used, no ozone band around 9.6 μm was available, and also the targeted CIRC images were acquired in various areas from Japan to Australia. However, the RMS errors are smaller than 0.15 W/m2/sr/μm (equivalent to about 1.0 K at 300 K), and if two images acquired around Australia are excluded, the errors are smaller than 0.08 W/m2/sr/μm (equivalent to about 0.6 K at 300 K). Since these values are smaller than the target accuracy of the CIRC instruments (2 K at 300 K), these AIRS-based regression equations can be used for the in-flight calibration of the CIRC instruments.
As for Himawari-8/AHI, Figure 12 shows a much smaller variance in the regression coefficients, and Figure 13 shows much smaller RMS errors, in comparison to the MTSAT-2 Imager. This is because five spectral bands including the ozone absorption band (band 12) were used, and the targeted CIRC images were acquired in a limited area around Japan. The RMS errors are mostly smaller than 0.02 W/m2/sr/μm, which is equivalent to about 0.2 K at 300 K, meaning that the AIRS-based regression equations are accurate enough for CC.

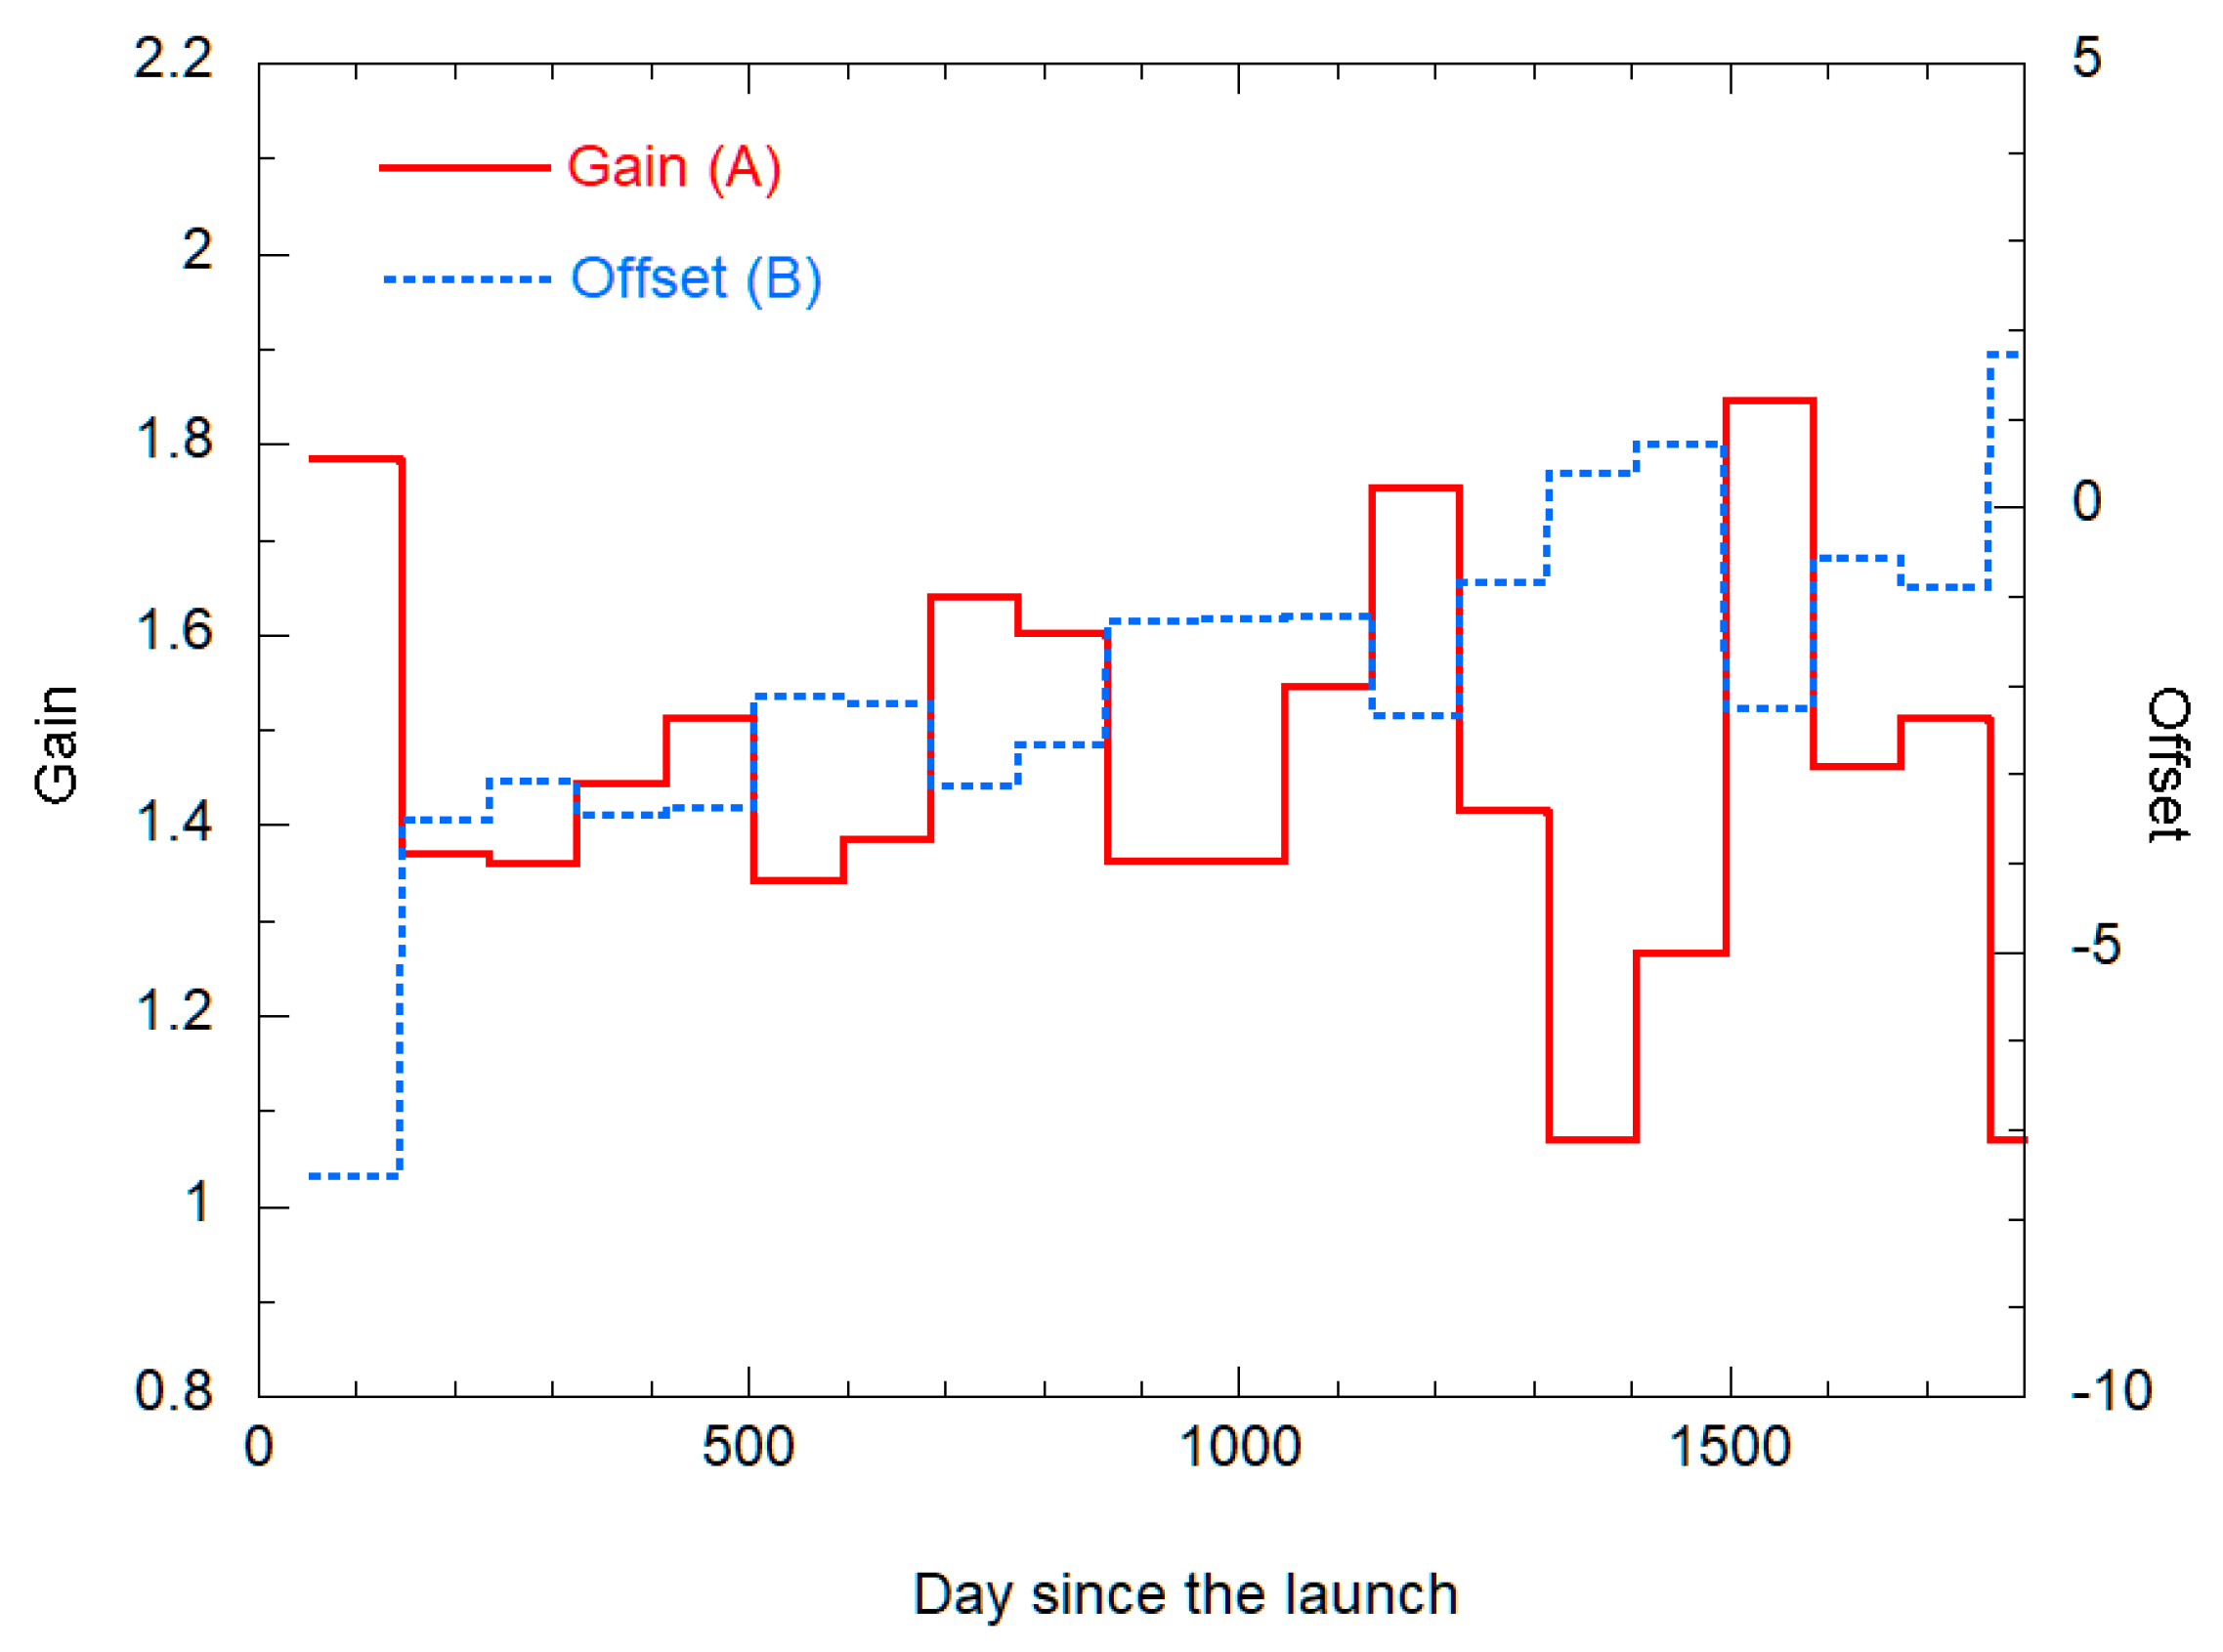
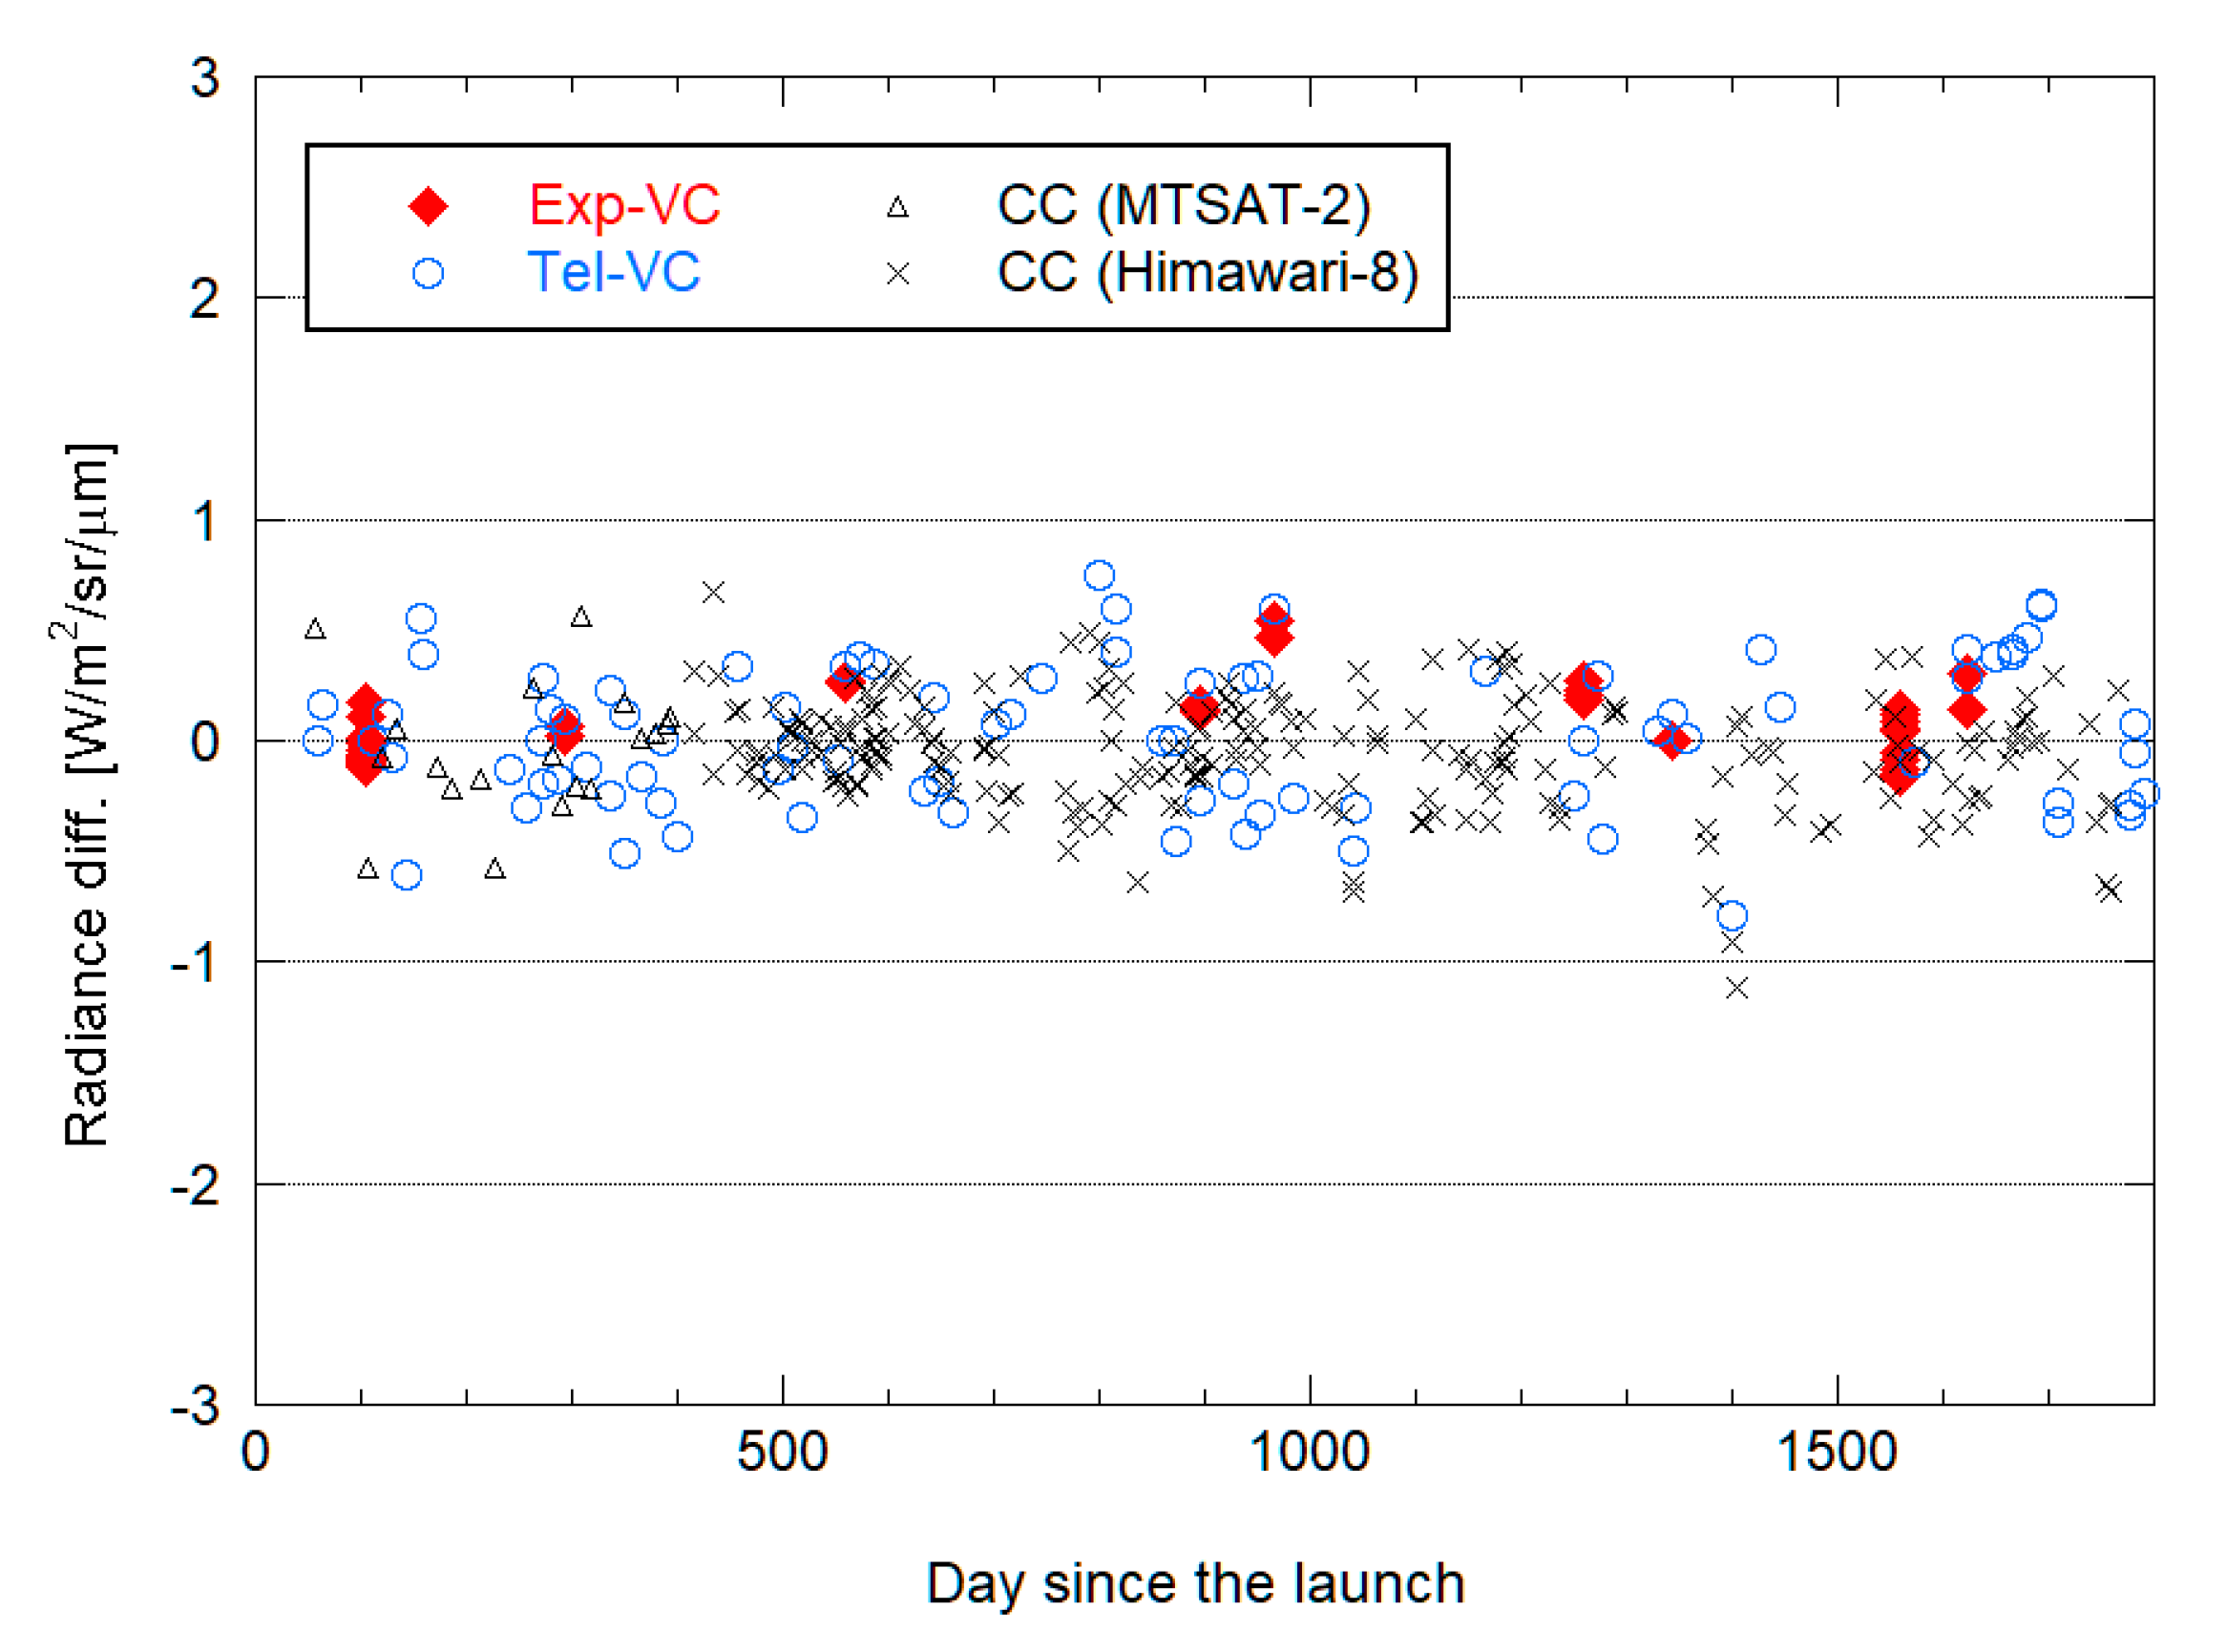
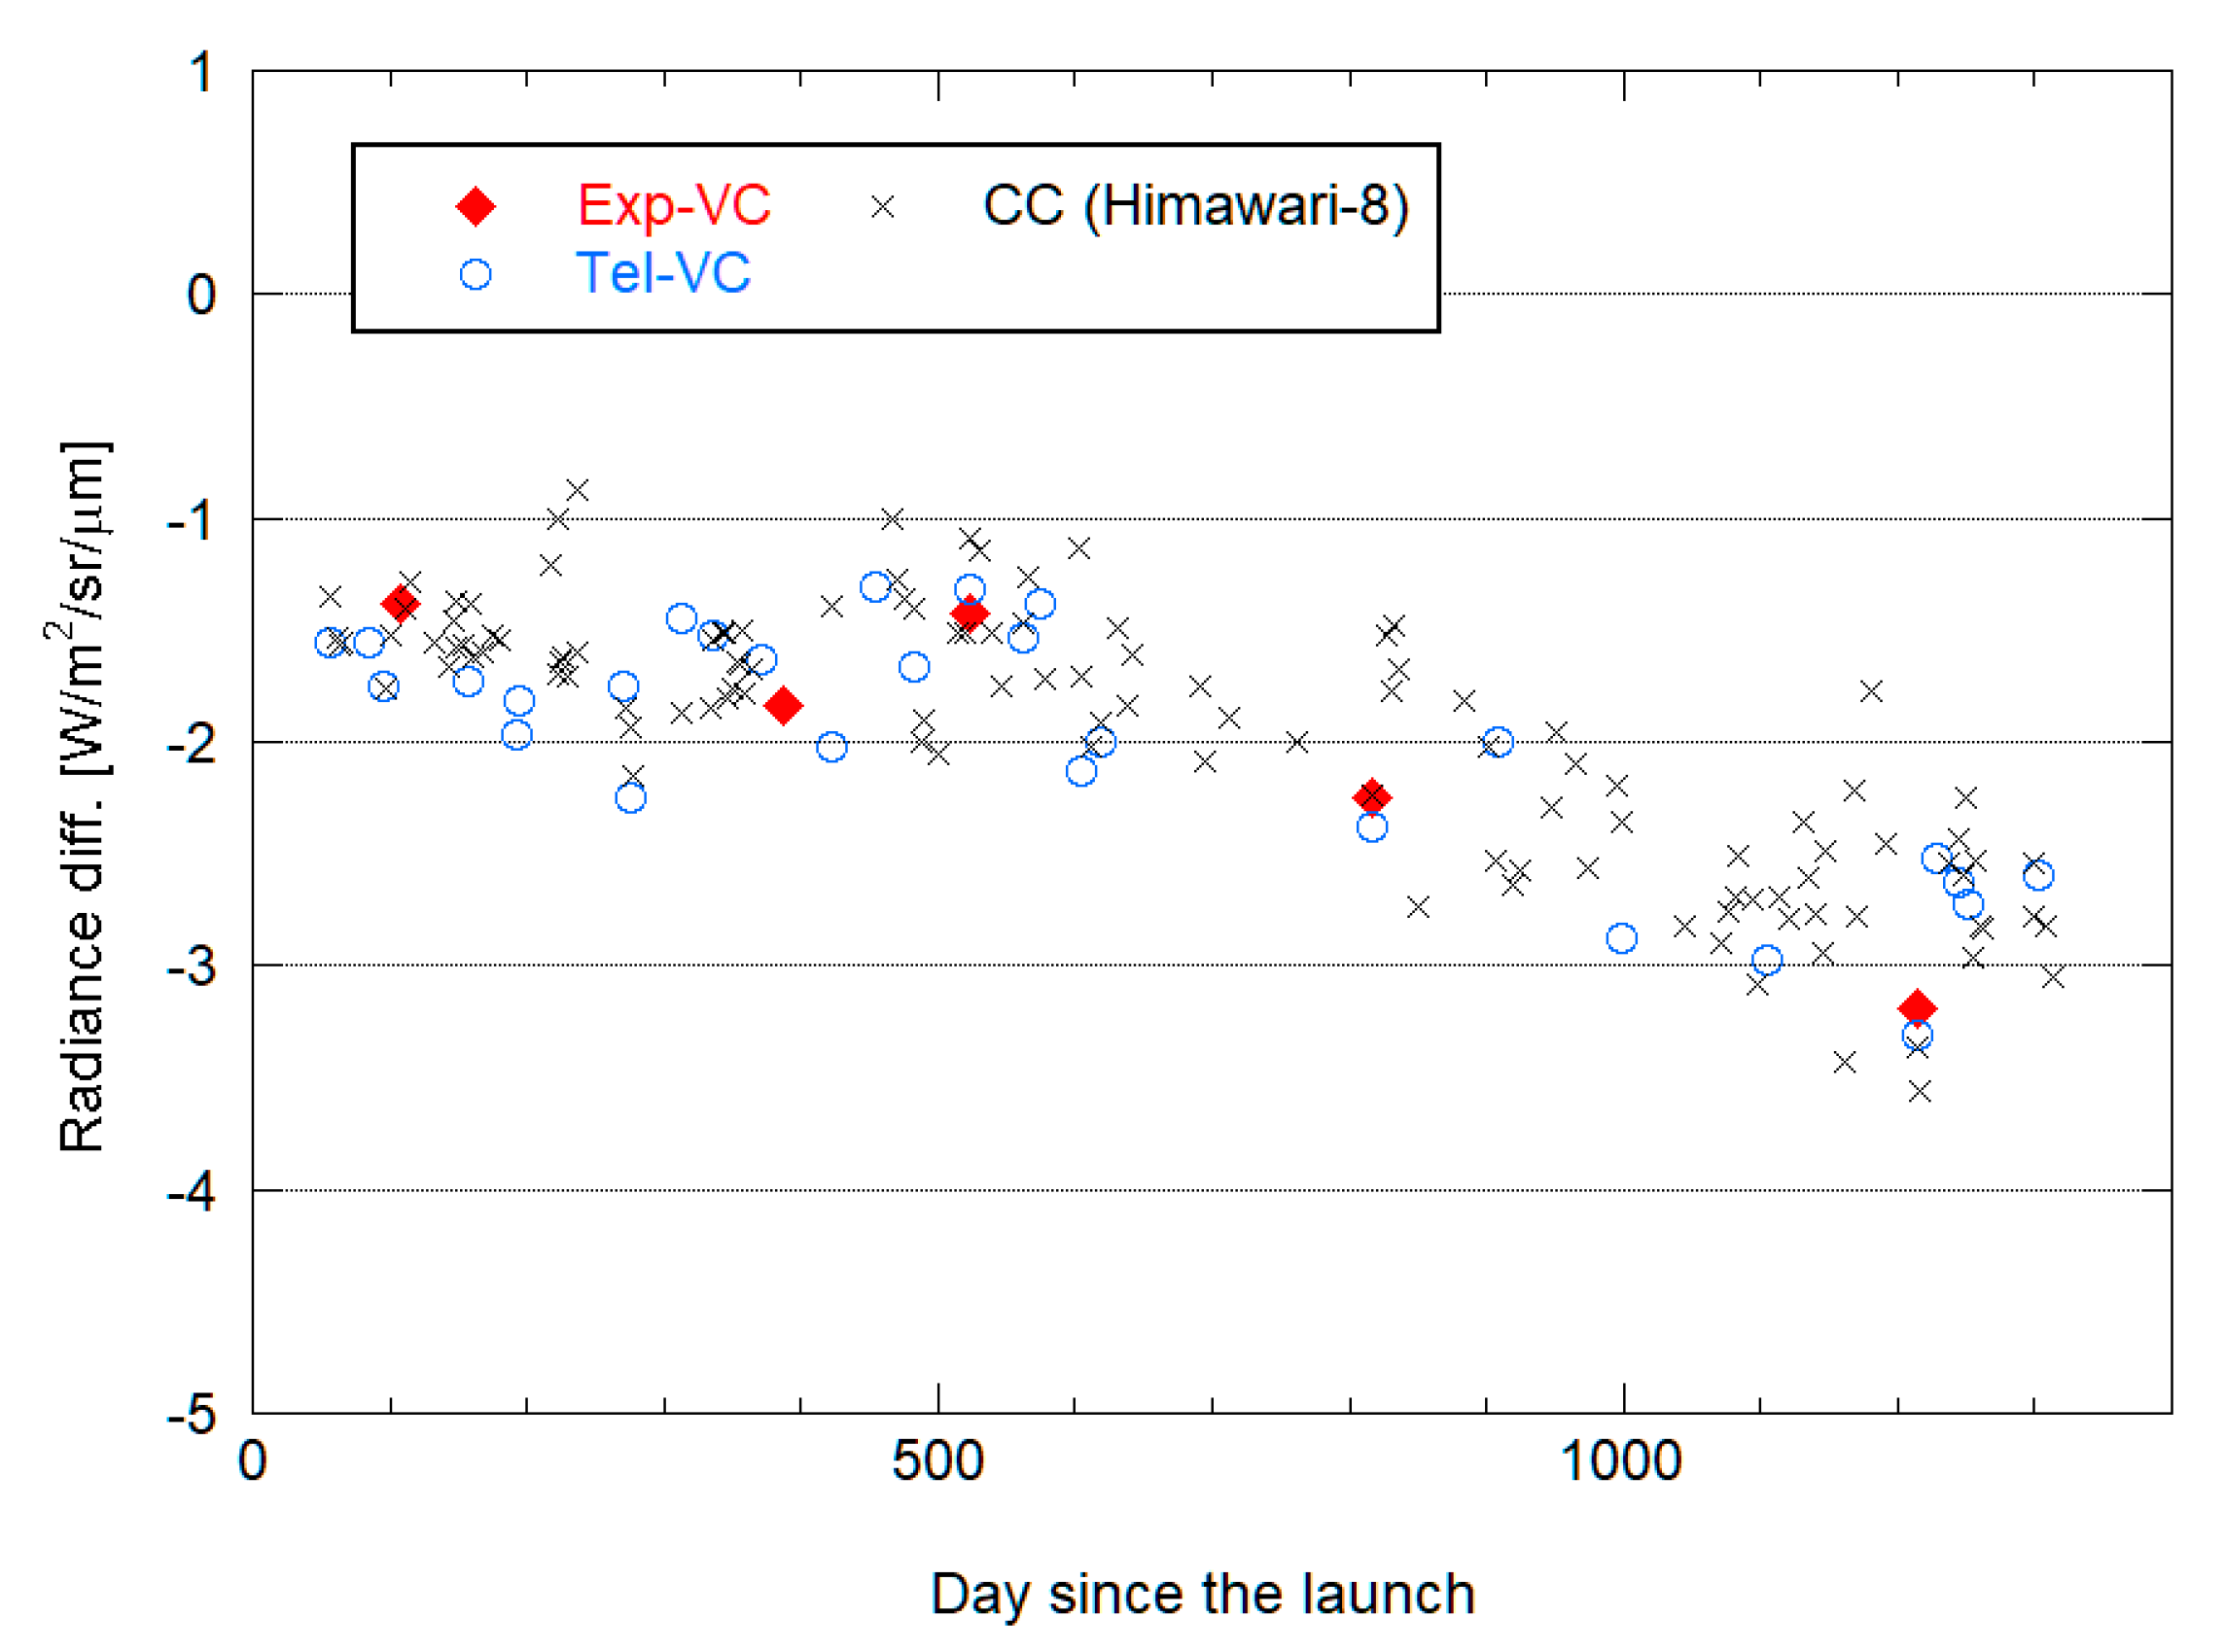
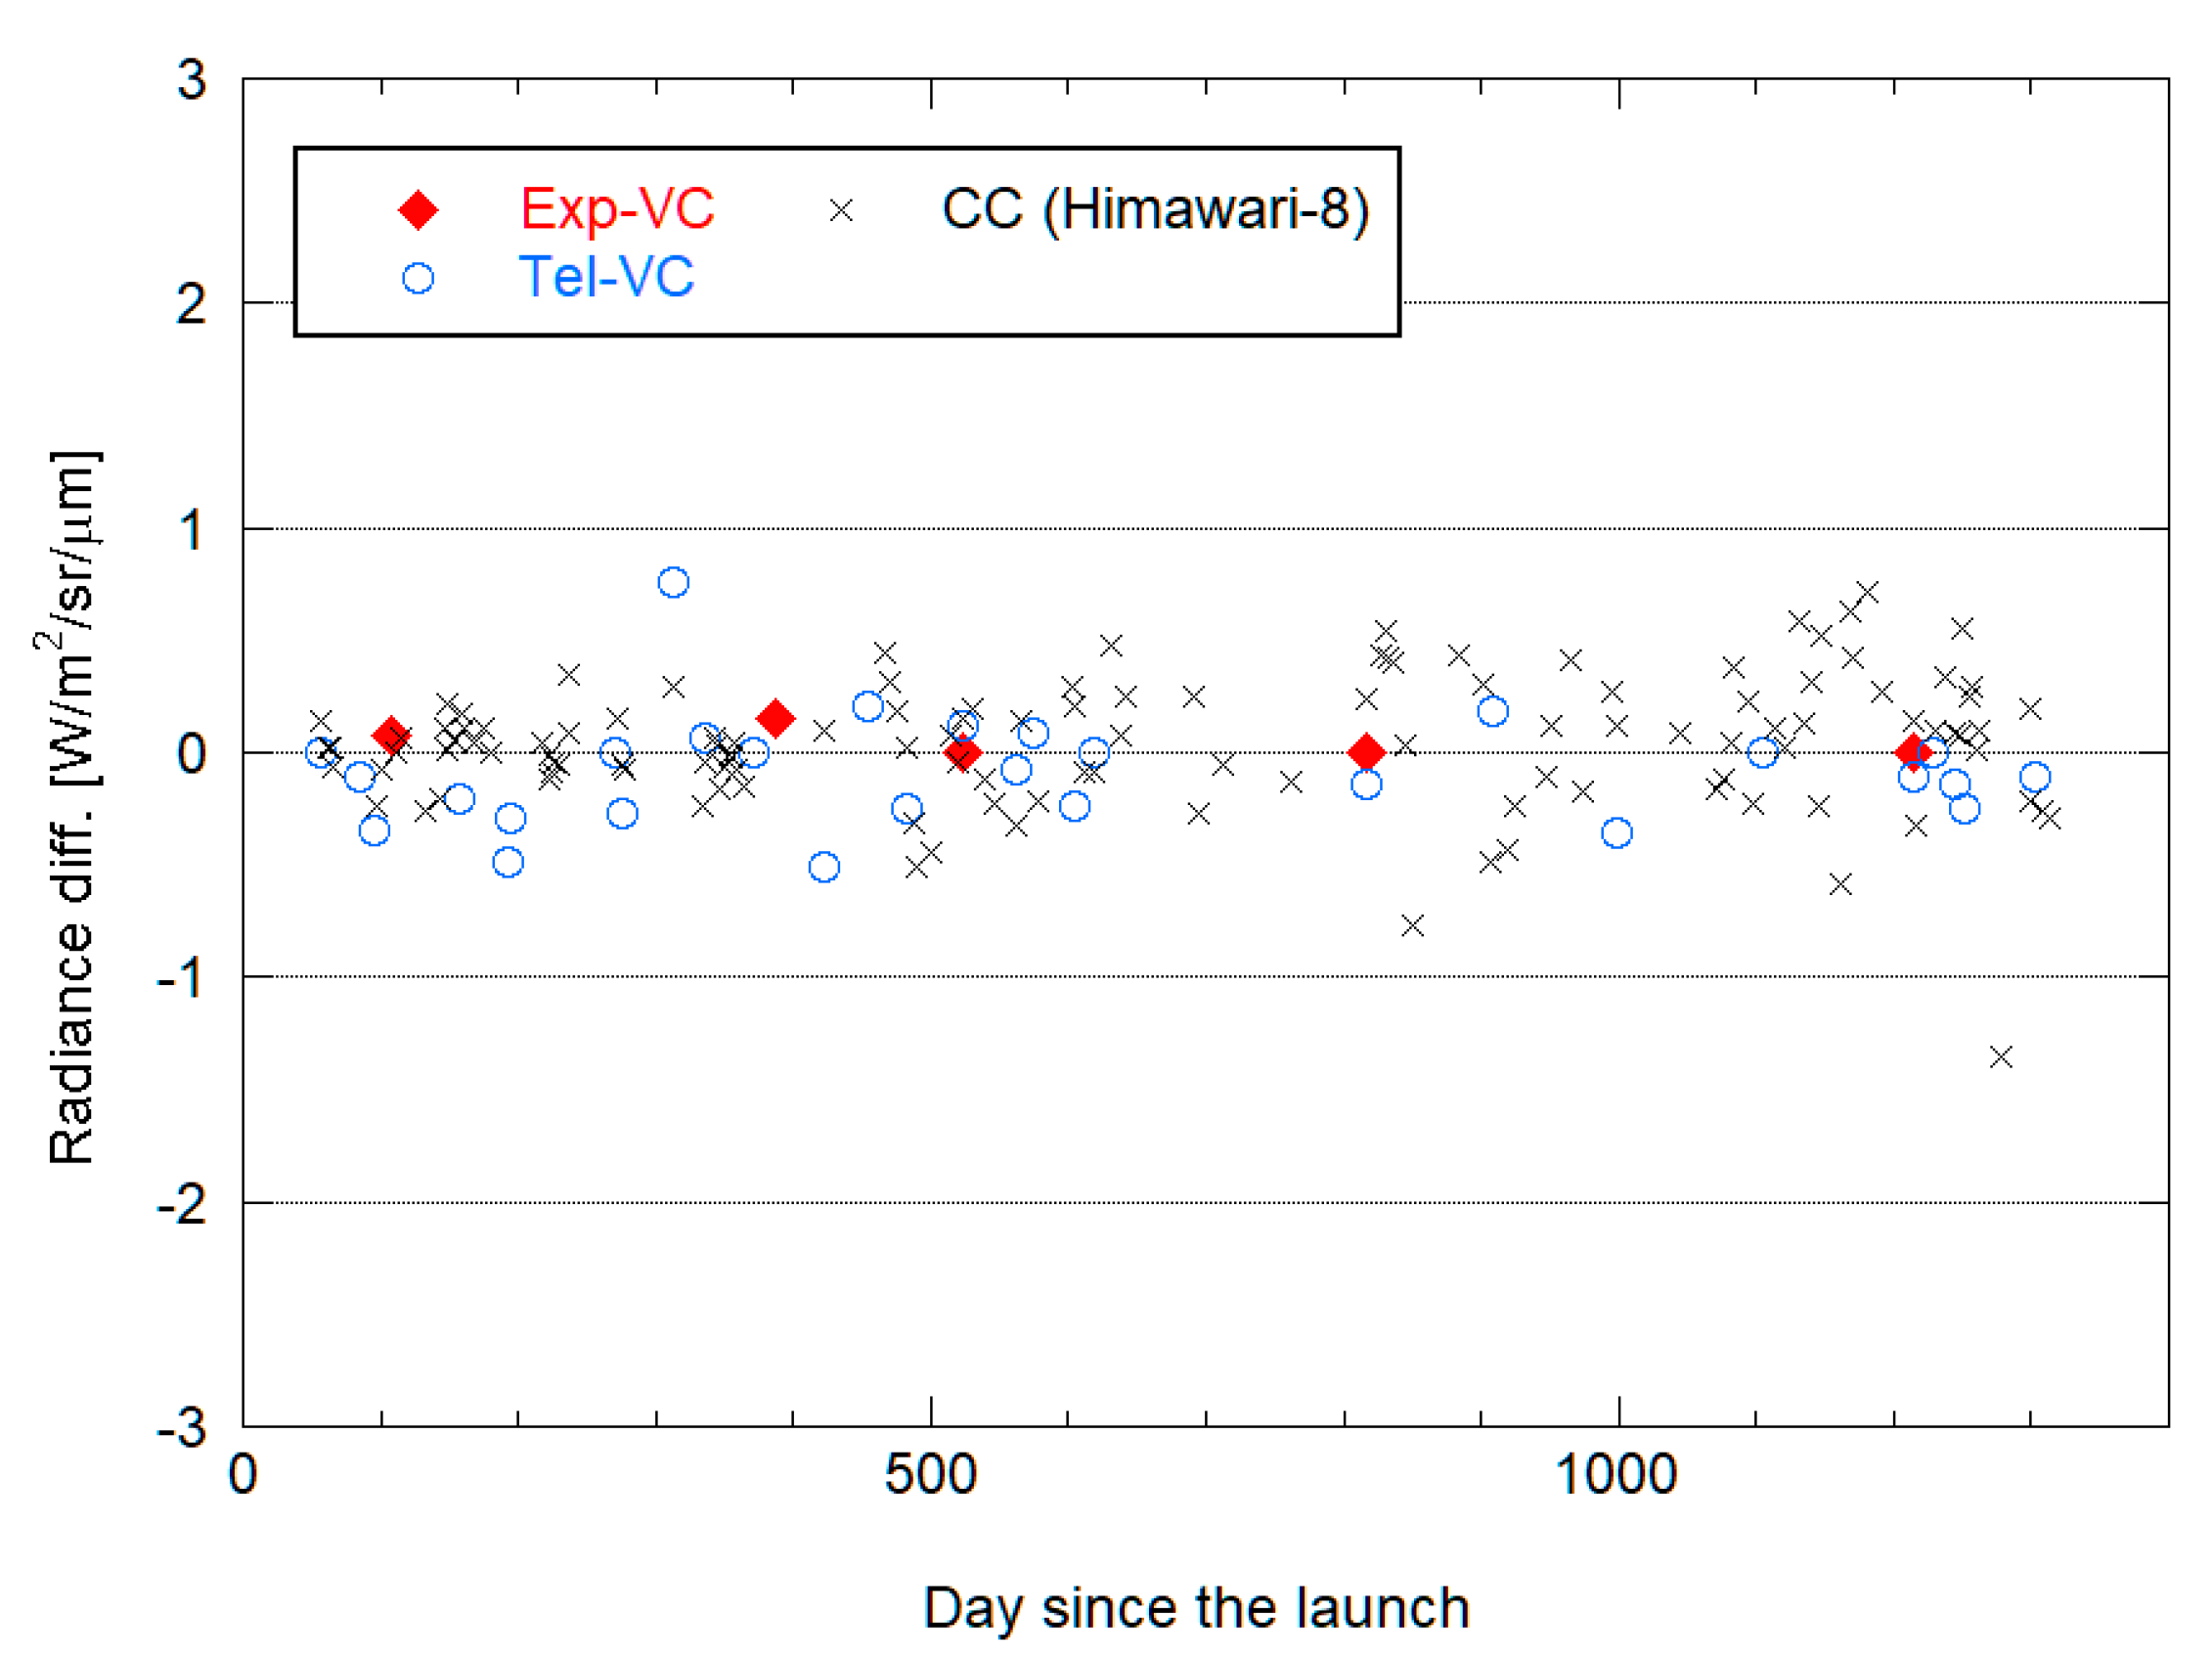
3.3. Results for ALOS-2/CIRC

Figure 14 shows the differences between the actual ALOS-2/CIRC radiance based on the ground testing (R0 in Equation (1)) and the radiance predicted by VC or CC as a function of D, where the radiance difference in CC is the bias, which is the mean of the radiance difference among the blocks used. Since a radiance difference of 1 W/m2/sr/μm corresponds with a temperature difference of about 6.4 K at 300 K, the radiance differences shown by Figure 14 are much larger than the target accuracy of the CIRC instruments (2 K at 300 K). The figure also shows that the radiance differences have a trend and seasonal change, and exceed 2 W/m2/sr/μm after D = 1000. These results indicate the necessity of recalibration based on VC and CC of ALOS-2/CIRC.
Figure 15 displays the distribution of the evaluation value (Equation (9)) in searching for the optimum solutions of A and B in the period of D = 1045 to 1134 for ALOS-2/CIRC. The optimal solution obtained is also shown in the figure.
Figure 16 shows the obtained values of A and B for ALOS-2/CIRC, as a function of D. The results indicate that these values change seasonally so as to suppress the seasonal changes displayed in Figure 14; A is larger and B is smaller in summer, while they have opposite tendencies in winter. The results also indicate that the magnitude of the seasonal change in A increases with time, and a rising trend can be found in B.
Figure 17 shows the differences between the recalibrated ALOS-2/CIRC radiance (Rx) and the radiance predicted by VC or CC as a function of D. Compared with Figure 14, the radiance differences are distributed around zero throughout the whole period. Table 3 gives the RMS errors for each of Exp-VC, Tel-VC, and CC. Since the RMS errors are smaller than 2 K at 300 K in all cases, it can be concluded that the ALOS-2/CIRC radiances will satisfy the target accuracy of the CIRC instruments (2 K at 300 K) by recalibration with the obtained coefficients of A and B.

3.4. Results for CALET/CIRC

Figure 18 shows the differences between the actual CALET/CIRC radiance based on the ground testing (R1 in Equation (2)) and the radiance predicted by VC and CC as a function of D, showing a large calibration error of 2 to 3 W/m2/sr/μm. Thus, the recalibration by Equation (2) based on VC and CC is necessary. The figure demonstrates that the error is significantly increasing from around D = 800. Although this change is still under investigation, it is likely to be caused by the deterioration of the CIRC instrument, because the package and lens temperatures in the telemetry data have been stable since the launch. As for a seasonal change, it is not very significant, unlike the case of ALOS-2/CIRC as shown by Figure 14, probably because the CALET/CIRC instrument contained in the exposed payload of the CALET instrument is less affected by external factors such as sun radiation, while the ALOS-2/CIRC instrument exposed to space is more easily affected by them. Though the additional stray light correction with the package temperature has been applied to the CALET/CIRC radiance as mentioned in Section 2.1.2, the component reduced by this correction has an approximately 60-day cycle, which is different from the seasonal change seen in Figure 14.
Figure 19 shows the obtained values of A and B for CALET/CIRC, as a function of D. The results show that temporal changes in A and B become bigger from around D = 800, corresponding to an increasing error in R1 (see Figure 18).
Figure 20 shows the differences between the recalibrated CALET/CIRC radiance (Rx) and the radiance predicted by VC or CC as a function of D. Compared with Figure 18, the radiance differences are distributed around zero throughout the whole period. Table 4 gives the RMS errors for each of Exp-VC, Tel-VC, and CC. Since the RMS errors are smaller than 2 K at 300 K in all cases, it can be concluded that CALET/CIRC radiances will satisfy the target accuracy of the CIRC instruments (2 K at 300 K) by recalibration with the obtained coefficients of A and B.

4. Summary and Conclusions

JAXA’s CIRC instruments onboard ALOS-2 and ISS/CALET are satellite-borne TIR cameras with the characteristics of low cost and low power consumption. The ALOS-2/CIRC instrument, launched in May 2014, is in operation as of November 2019, while the CALET/CIRC instrument launched in August 2015 and was operated until March 2019. Because the CIRC instruments have no capability regarding onboard radiometric calibration with a blackbody and/or shutter, in-flight calibration has been performed using Exp-VC, Tel-VC, and CC. In the present paper, the recalibration coefficients applied to the ground-testing-based radiance were derived and the accuracy was evaluated for each of ALOS-2/CIRC and CALET/CIRC, using VC and CC datasets acquired until September 2019.
In Exp-VC, Lake Kasumigaura and Railroad Valley Playa were used as the target sites. The VC experiments were conducted nine times for ALOS-2/CIRC and five times for CALET/CIRC in total. In Tel-VC, Lake Kasumigaura, Lake Shinji, and Lake Tahoe were used as the target sites. The number of Tel-VC datasets was 80 for ALOS-2/CIRC, and 28 for CALET/CIRC. In CC of ALOS-2/CIRC, 19 MTSAT-2 images acquired in areas from Japan to Australia and 245 Himawari-8/AHI images acquired around Japan were used. In CC of CALET/CIRC, 123 Himawari-8/AHI images acquired around Japan were used. For each dataset of Exp-VC and Tel-VC, the TOA radiance of the targeted CIRC instrument was predicted and compared with the actual observed radiance. For each dataset of CC, MTSAT-2 or Himawari-8/AHI images were corrected for a viewing angle difference, a spectral band difference, and parallax, and co-registered to each CIRC image. Then, statistical screening was applied to each block, and the mean radiance of the remaining blocks was used for the analyses of CC.
The sensitivity analysis showed that a large part of the surface temperature error would be propagated to TOA brightness temperature as an error, meaning that Exp-VC, in which surface temperature is more accurately measured, will be more reliable than Tel-VC. Though atmospheric profiles are not major error factors under an air temperature profile error within ±1 K and a relative humidity profile error within 10% (relative error), they may become one of the major error factors under worse conditions.
The AIRS-based regression estimation of the CIRC radiance from MTSAT-2 Imager or Himawari-8/AHI radiances in which the regression equation was determined for each dataset of CC showed enough accuracy for CC, although the regression errors were much larger in MTSAT-2 Imager than in Himawari-8/AHI, due to a lack of spectral bands including the ozone absorption band.
For each of ALOS-2/CIRC and CALET/CIRC, the recalibration coefficients (the gain A, and the offset B) given to the ground-testing based radiance (R0 for ALOS-2/CIRC, and R1 for CALET/CIRC) were determined by the optimum solution search for each period at intervals of 90 days from D = 55, using VC and CC datasets in that period. The results demonstrated that the calibration error with a trend and seasonal change was remarkably reduced by recalibration with the obtained coefficients in both CIRC instruments; the RMS error of the recalibrated radiance was 1.4 K in Exp-VC, 2.0 K in Tel-VC, and 1.6 K in CC for ALOS-2/CIRC, and 0.5 K in Exp-VC, 1.7 K in Tel-VC, and 1.9 K in CC for CALET/CIRC, in temperature at 300 K. Since the target accuracy of CIRC is given as 2 K at 300 K, it can be concluded that the recalibrated radiances will satisfy the target accuracy in both CIRC instruments.
The recalibration coefficients obtained in the present paper will be applied to all CIRC images in new versions 110 and 030 for ALOS-2/CIRC and CALET/CIRC, respectively, by reprocessing scheduled for February 2020. Furthermore, the results from the present paper will give useful information for in-flight radiometric calibration of other satellite TIR cameras with no onboard calibrator like the CIRC instruments.

Author Contributions

Conceptualization, H.T.; methodology, H.T.; software, H.T.; validation, H.T.; formal analysis, H.T.; investigation, H.T., M.S., A.K. and K.N.; resources, H.T., M.S., A.K. and K.N.; data curation, H.T.; writing—original draft preparation, H.T.; writing—review and editing, H.T., M.S., A.K. and K.N.; visualization, H.T.; project administration, M.S., A.K. and K.N.; funding acquisition, M.S., A.K. and K.N. All authors have read and agreed to the published version of the manuscript.

Funding

This research was funded by Japan Aerospace Exploration Agency (JAXA).

Acknowledgments

The authors would like to thank Eri Kato (Japan Aerospace Exploration Agency, JAXA), Haruyoshi Katayama (JAXA), and the Sensor System Research Group of JAXA for giving useful information on the CIRC instruments. Additional thanks to Elsa Abbott (Jet Propulsion Laboratory, JPL), Howard Tan (JPL), Soushi Kato (Remote Sensing Technology Center, Japan), and Satoru Yamamoto (Japan Space Systems) for supporting experiments conducted in Railroad Valley. The authors would also like to thank Moena Asaki, Atsushi Kato, and other students/ex-students at Ibaraki University, Japan, for supporting the experiments in Lake Kasumigaura or Railroad Valley.

Conflicts of Interest

The authors declare no conflict of interest.

References

  1. Kato, E.; Katayama, H.; Naitoh, M.; Harada, M.; Nakamura, R.; Nakau, K.; Sato, R. Compact infrared camera (CIRC) for earth observation adapting athermal optics. Proc. SPIE 2013, 8860, 88600C. [Google Scholar]
  2. Suzuki, S.; Osawa, Y.; Hatooka, Y.; Kankaku, Y.; Watanabe, T. Overview of Japan’s Advanced Land Observing Satellite-2 Mission. Proc. SPIE 2009, 7474, 74740Q-1. [Google Scholar]
  3. Marrocchesi, P.S.; CALET Collaboration. CALET on the ISS: a high energy astroparticle physics experiment. J. Phys. Conf. Ser. 2016, 718, 052023. [Google Scholar] [CrossRef] [Green Version]
  4. CIRC Observation Data Search. Available online: http://circgs.tksc.jaxa.jp/data/ (accessed on 20 November 2019).
  5. Volcano Monitoring System (under Research). Available online: https://kazan.jaxa.jp/ (accessed on 20 November 2019).
  6. Yamaguchi, Y.; Kahle, A.B.; Tsu, H.; Kawakami, T.; Pniel, M. Overview of the Advanced Spaceborne Thermal Emission and Reflectance Radiometer (ASTER). IEEE Trans. Geosci. Remote Sens. 1998, 36, 1062–1071. [Google Scholar] [CrossRef] [Green Version]
  7. Guenther, B.; Barnes, W.; Knight, E.; Barder, J.; Harnden, J.; Weber, R.; Roberto, M.; Godden, G.; Montgomery, H.; Abel, P. MODIS calibration: A brief review of the strategy for the at-launch calibration approach. J. Atmos. Ocean. Technol. 1996, 13, 274–285. [Google Scholar] [CrossRef] [Green Version]
  8. Kato, E.; Katayama, H.; Naitoh, M.; Harada, M.; Nakamura, R.; Sakai, M.; Nakajima, Y.; Nakau, K.; Tange, Y.; Sato, R. Radiometric calibration of Compact Infrared Camera (CIRC) for earth observation. Sens. Mater. 2014, 26, 199–214. [Google Scholar]
  9. Tonooka, H.; Palluconi, F.D.; Hook, S.J.; Matsunaga, T. Vicarious calibration of ASTER thermal infrared bands. IEEE Trans. Geosci. Remote Sens. 2005, 43, 2733–2746. [Google Scholar] [CrossRef]
  10. Tang, H.; Li, Z.L. (Eds.) Quantitative Remote Sensing in Thermal Infrared: Theory and Applications. In Springer Remote Sensing/Photogrammetry; Springer: Berlin, Germany, 2014. [Google Scholar]
  11. CEOS LandNet Sites—CalValPortal. Available online: http://calvalportal.ceos.org/ceos-landnet-sites (accessed on 20 November 2019).
  12. Baldridge, A.M.; Hook, S.J.; Grove, C.I.; Rivera, G. The ASTER spectral library version 2.0. Remote Sens. Environ. 2009, 113, 711–715. [Google Scholar] [CrossRef]
  13. EMC: Data Assimilation Team. Available online: https://www.emc.ncep.noaa.gov/gmb/gdas/ (accessed on 20 November 2019).
  14. Levelt, P.F.; Oord, G.H.J.; van den Dobber, M.R.; Mälkki, A.; Visser, H.J.; de Vries, J.; Stammes, P.; Lundell, J.O.V.; Saari, H. The ozone monitoring instrument. IEEE Trans. Geosci. Remote Sens. 2006, 44, 1093–1101. [Google Scholar] [CrossRef]
  15. Berk, A.; Anderson, G.P.; Acharya, P.K.; Bernstein, L.S.; Muratov, L.; Lee, J.; Fox, M.; Adler-Golden, S.M.; Chetwynd, J.H.; Hoke, M.L.; et al. MODTRAN 5: A reformulated atmospheric band model with auxiliary species and practical multiple scattering options: Update. Proc. SPIE 2005, 5806. [Google Scholar] [CrossRef]
  16. Berk, A.; Anderson, G.; Acharya, P.; Shettle, E. MODTRAN 5.2.0.0 User’s Manual; Spectral Sciences, Inc.: Burlington, MA, USA; Air Force Res. Lab.: Montgomery, OH, USA; Hanscom AFB: Middlesex, MA, USA, 2008. [Google Scholar]
  17. Kato, S.; Matsunaga, T.; Tonooka, H. Statistical and in-situ validations of the ASTER spectral emissivity product at Railroad Valley, Nevada, USA. Remote Sens. Environ. 2014, 145, 81–92. [Google Scholar] [CrossRef]
  18. Water Information System. Available online: http://www1.river.go.jp/ (accessed on 20 November 2019).
  19. Hook, S.; Vaughan, R.; Tonooka, H.; Schladow, S. Absolute radiometric in-flight validation of mid infrared and thermal infrared data from ASTER and MODIS on the Terra spacecraft using the Lake Tahoe, CA/NV, USA, automated validation site. IEEE Trans. Geosci. Remote Sens. 2007, 45, 1798–1807. [Google Scholar] [CrossRef]
  20. Lake Tahoe Validation. Available online: https://laketahoe.jpl.nasa.gov/ (accessed on 20 November 2019).
  21. Uesawa, D. Status of Japanese meteorological satellites and recent activities of MSC. In Proceedings of the 2006 Eumesat Meteorological Satellite Conference, Helsinki, Finland, 12–16 June 2006. [Google Scholar]
  22. Bessho, K.; Date, K.; Hayashi, M.; Ikeda, A.; Imai, T.; Inoue, H.; Kumagai, Y.; Miyakawa, T.; Murata, H.; Ohno, T.; et al. An Introduction to Himawari-8/9―Japan’s New-Generation Geostationary Meteorological Satellites. J. Meteorol. Soc. Jpn. 2016, 94, 151–183. [Google Scholar] [CrossRef] [Green Version]
  23. Aumann, H.H.; Chahine, M.T.; Gautier, C.; Goldberg, M.D.; Kalnay, E.; McMillin, L.M.; Revercomb, H.; Rosenkranz, P.W.; Smith, W.L.; Staelin, D.H.; et al. AIRS/AMSU/HSB on the Aqua mission: Design, science objectives, data products, and processing systems. IEEE Trans. Geosci. Remote Sens. 2003, 41, 253–264. [Google Scholar] [CrossRef] [Green Version]
  24. Clerbaux, C.; Boynard, A.; Clarisse, L.; George, M.; Hadji-Lazaro, J.; Herbin, H.; Hurtmans, D.; Pommier, M.; Razavi, A.; Turquety, S.; et al. Monitoring of atmospheric composition using the thermal infrared IASI/MetOp sounder. Atmos. Chem. Phys. 2009, 9, 6041–6054. [Google Scholar] [CrossRef] [Green Version]
  25. Hewison, T.J.; Wu, X.; Yu, F.; Tahara, Y.; Hu, X.; Kim, D.; Koenig, M. GSICS inter-calibration of infrared channels of geostationary imagers using Metop/IASI. IEEE Trans. Geosci. Remote Sens. 2013, 51, 1056–1080. [Google Scholar] [CrossRef]
  26. Okuyama, A.; Takahashi, M.; Date, K.; Hosaka, K.; Murata, H.; Tabata, T.; Yoshino, R. Validation of Himawari-8/AHI radiometric calibration based on two years of in-orbit data. J. Meteor. Soc. Jpn. 2018, 96B, 91–109. [Google Scholar] [CrossRef] [Green Version]
  27. Jiang, G.M.; Li, Z.L. Cross-calibration of MSG1-SEVIRI infrared channels with Terra-MODIS channels. Int. J. Remote Sens. 2009, 30, 753–769. [Google Scholar] [CrossRef]
  28. USGS EROS Archive—Digital Elevation—Global 30 Arc-Second Elevation (GTOPO30). Available online: https://doi.org/10.5066/F7DF6PQS (accessed on 20 November 2019).
Figure 1. Locations of the experiment-based vicarious calibration (Exp-VC) and the telemetry-based vicarious calibration (Tel-VC) sites in Lake Kasumigaura (left) and the ALOS-2/CIRC image acquired over the lake on 2 November 2018 (right).
Remotesensing 12 00058 g001
Figure 2. Location of the Exp-VC site in Railroad Valley Playa (left) and the ALOS-2/CIRC image acquired over the playa on 31 August 2018 (right).
Remotesensing 12 00058 g002
Figure 3. Photos from the vicarious calibration (VC) experiment conducted in Lake Kasumigaura on 2 November 2018.
Remotesensing 12 00058 g003
Figure 4. Photos from the VC experiment conducted in Railroad Valley Playa on 31 August 2018.
Remotesensing 12 00058 g004
Figure 5. Processing flow of the top-of-the atmosphere (TOA) radiance estimation in Exp-VC.
Remotesensing 12 00058 g005
Figure 6. Location of the Tel-VC site in Lake Shinji (left) and the ALOS-2/CIRC image acquired over the lake on 2 April 2015 (right).
Remotesensing 12 00058 g006
Figure 7. Location of the Tel-VC site in Lake Tahoe (left) and the CALET/CIRC image acquired over the lake on 27 June 2016 (right).
Remotesensing 12 00058 g007
Figure 8. Processing flow of the TOA radiance estimation in Tel-VC.
Remotesensing 12 00058 g008
Figure 9. Processing flow of the TOA radiance estimation in cross-calibration (CC).
Remotesensing 12 00058 g009
Figure 10. Relative spectral response functions of the CIRC instrument, Himawari-8/AHI (HW8), and MTSAT-2 Imager (MT2). The spectral sensitivity range of the Atmospheric Infrared Sounder (AIRS) is also shown by green line.
Remotesensing 12 00058 g010
Figure 11. Concatenated CALET/CIRC image overlaid on the geostationary satellite (GS)-based CIRC image acquired by Himawari-8/AHI around Tokyo on 5 December 2015.
Remotesensing 12 00058 g011
Figure 12. Coefficients of the AIRS-based regression equations for ALOS-2/CIRC (left) and CALET/CIRC (right) as a function of date.
Remotesensing 12 00058 g012
Figure 13. Root mean square (RMS) errors of the AIRS-based regression equations for ALOS-2/CIRC (MTSAT-2 and Himawari-8) and CALET/CIRC (Himawari-8) as a function of date.
Remotesensing 12 00058 g013
Figure 14. Difference between the ground testing-based radiance (R0) and the predicted radiance for ALOS-2/CIRC as a function of the day since the launch (D).
Remotesensing 12 00058 g014
Figure 15. Distribution of the evaluation value in searching the optimum solutions of the gain (A) and the offset (B) for the period of D = 1045 to 1134 for ALOS-2/CIRC. The optimal solution obtained is also shown.
Remotesensing 12 00058 g015
Figure 16. Gain and offset for recalibrating the ground testing-based radiance (R0) for ALOS-2/CIRC as a function of the day since the launch (D).
Remotesensing 12 00058 g016
Figure 17. Difference between the recalibrated radiance (Rx) and the predicted radiance for ALOS-2/CIRC as a function of the day since the launch (D).
Remotesensing 12 00058 g017
Figure 18. Difference between the ground testing-based radiance (R1) and the predicted radiance for CALET/CIRC as a function of the day since the launch (D).
Remotesensing 12 00058 g018
Figure 19. Gain and offset for recalibrating the ground testing-based radiance (R1) for CALET/CIRC as a function of the day since the launch (D).
Remotesensing 12 00058 g019
Figure 20. Difference between the recalibrated radiance (Rx) and the predicted radiance for CALET/CIRC as a function of the day since the launch (D).
Remotesensing 12 00058 g020
Table 1. Specifications of the Compact Infrared Cameras (CIRC) on board the Advanced Land Observing Satellite-2 (ALOS-2/CIRC) and the Calorimetric Electron Telescope (CALET/CIRC) [1].
ItemSpecifications
Size110 mm × 180 mm × 230 mm
Weight3 kg
DetectorUncooled infrared detector
Wavelength8 to 12 µm
Number of pixels640 × 480
Ground resolution<200 m @ 600 km (ALOS-2)
<130 m @ 400 km (CALET)
Field of view12° × 9°
Exposed time33 ms
Dynamic range180 to 400 K
NEdT0.2 K @ 300 K
FPN0.3 K @ 300 K
Power consumption<20 W
Temperature accuracy4 K (goal: 2 K @ 300 K)
Table 2. The average and the standard deviation (in parentheses) of TOA brightness temperature change (in °C) induced by surface temperature changes (±1 K) or atmospheric profile changes (absolute shift of ±1 K in air temperature (AT) profile, and relative scaling of 10% in relative humidity (RH) profile) in Exp-VC and Tel-VC of each CIRC instrument.
Parameter ChangeALOS-2/CIRCCALET/CIRC
Exp-VCTel-VCExp-VCTel-VC
Surface temp.−1 K−0.80 (0.05)−0.76 (0.12)−0.83 (0.02)−0.80 (0.08)
+1 K0.81 (0.04)0.76 (0.12)0.83 (0.03)0.81 (0.08)
Atmos. profileAT: −1 K, RH: ×1.1−0.20 (0.08)−0.26 (0.19)−0.16 (0.04)−0.19 (0.13)
AT: +1 K, RH: ×0.90.21 (0.08)0.27 (0.19)0.17 (0.03)0.20 (0.12)
Table 3. Number of data used, RMS difference in radiance, and that in temperature at 300 K for the ALOS-2/CIRC recalibrated radiance in each of Exp-VC, Tel-VC, and CC (MTSAT-2, Himawari-8, and both).
MethodNum of DataRMSD in Radiance (W/m2/sr/µm)RMSD in Temp at 300 K (K)
Exp-VC90.2241.4
Tel-VC800.3182.0
CC (MTSAT-2)190.2921.9
CC (Himawari-8)2450.2461.6
CC (both)2640.2581.6
Table 4. Number of data used, RMS difference in radiance, and that in temperature at 300 K for the CALET/CIRC recalibrated radiance in each of Exp-VC, Tel-VC, and CC (Himawari-8).
MethodNum of DataRMSD in Radiance (W/m2/sr/µm)RMSD in Temp at 300 K (K)
Exp-VC50.0780.5
Tel-VC280.2591.7
CC (Himawari-8)1230.2921.9

