External Groundwater Alleviates the Degradation of Closed Lakes in Semi-Arid Regions of China


Abstract
1. Introduction
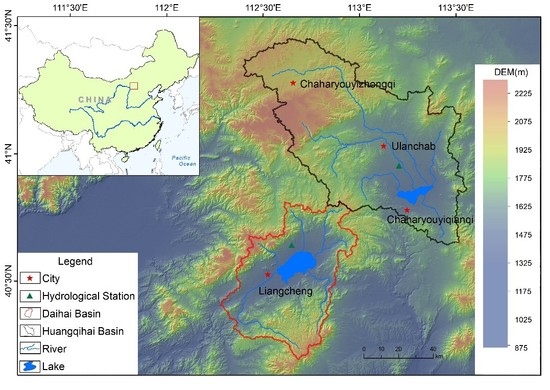
2. Study Region
3. Materials and Methods
3.1. Flowchart and Datasets
3.2. Calculation of the Lakes Area
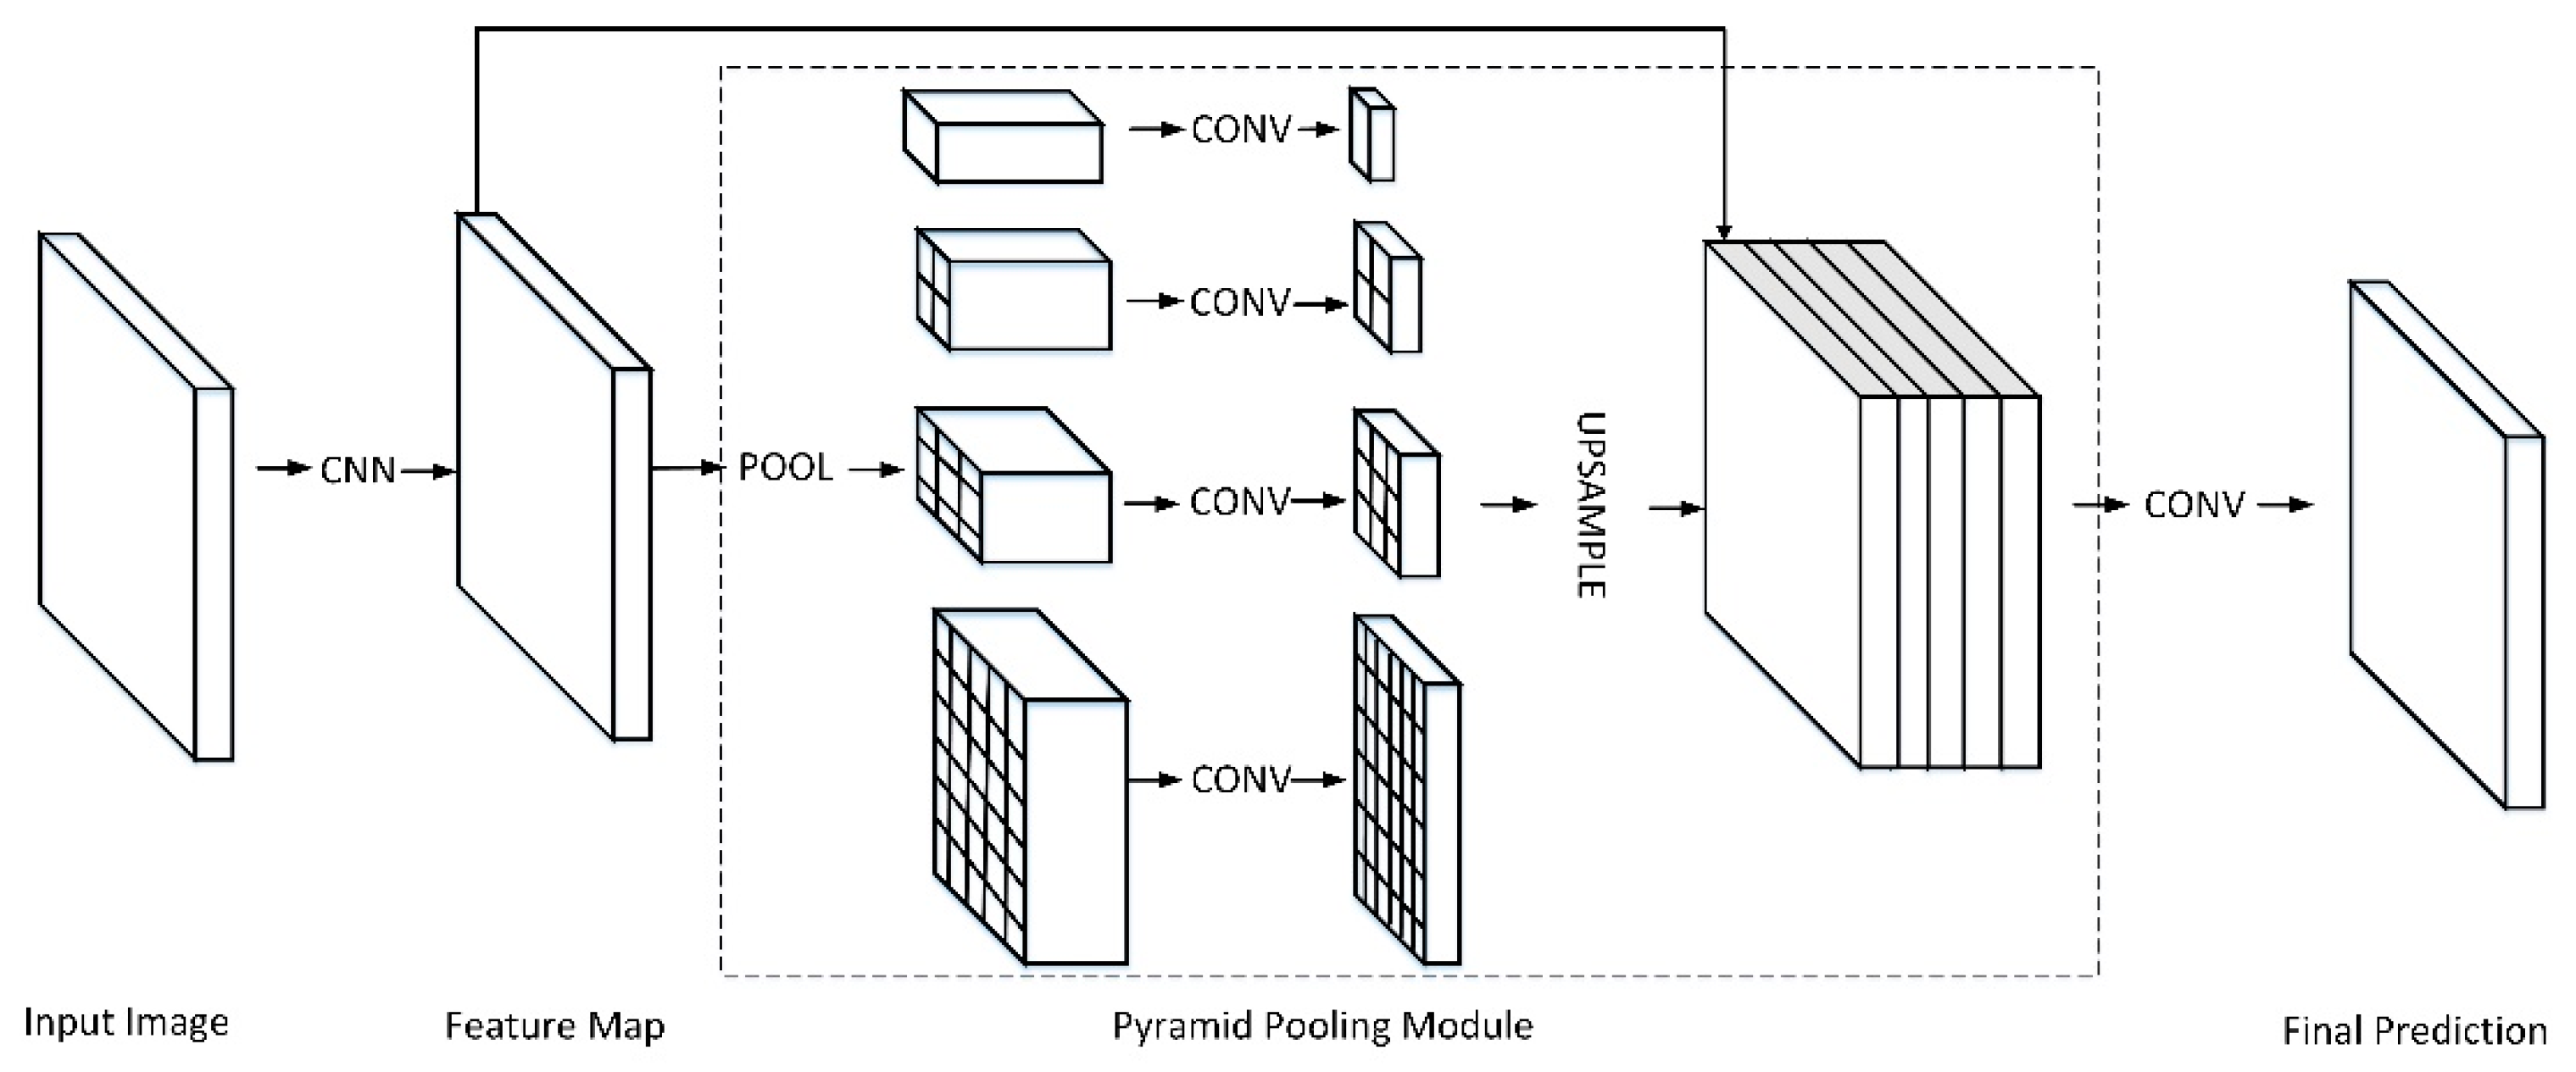
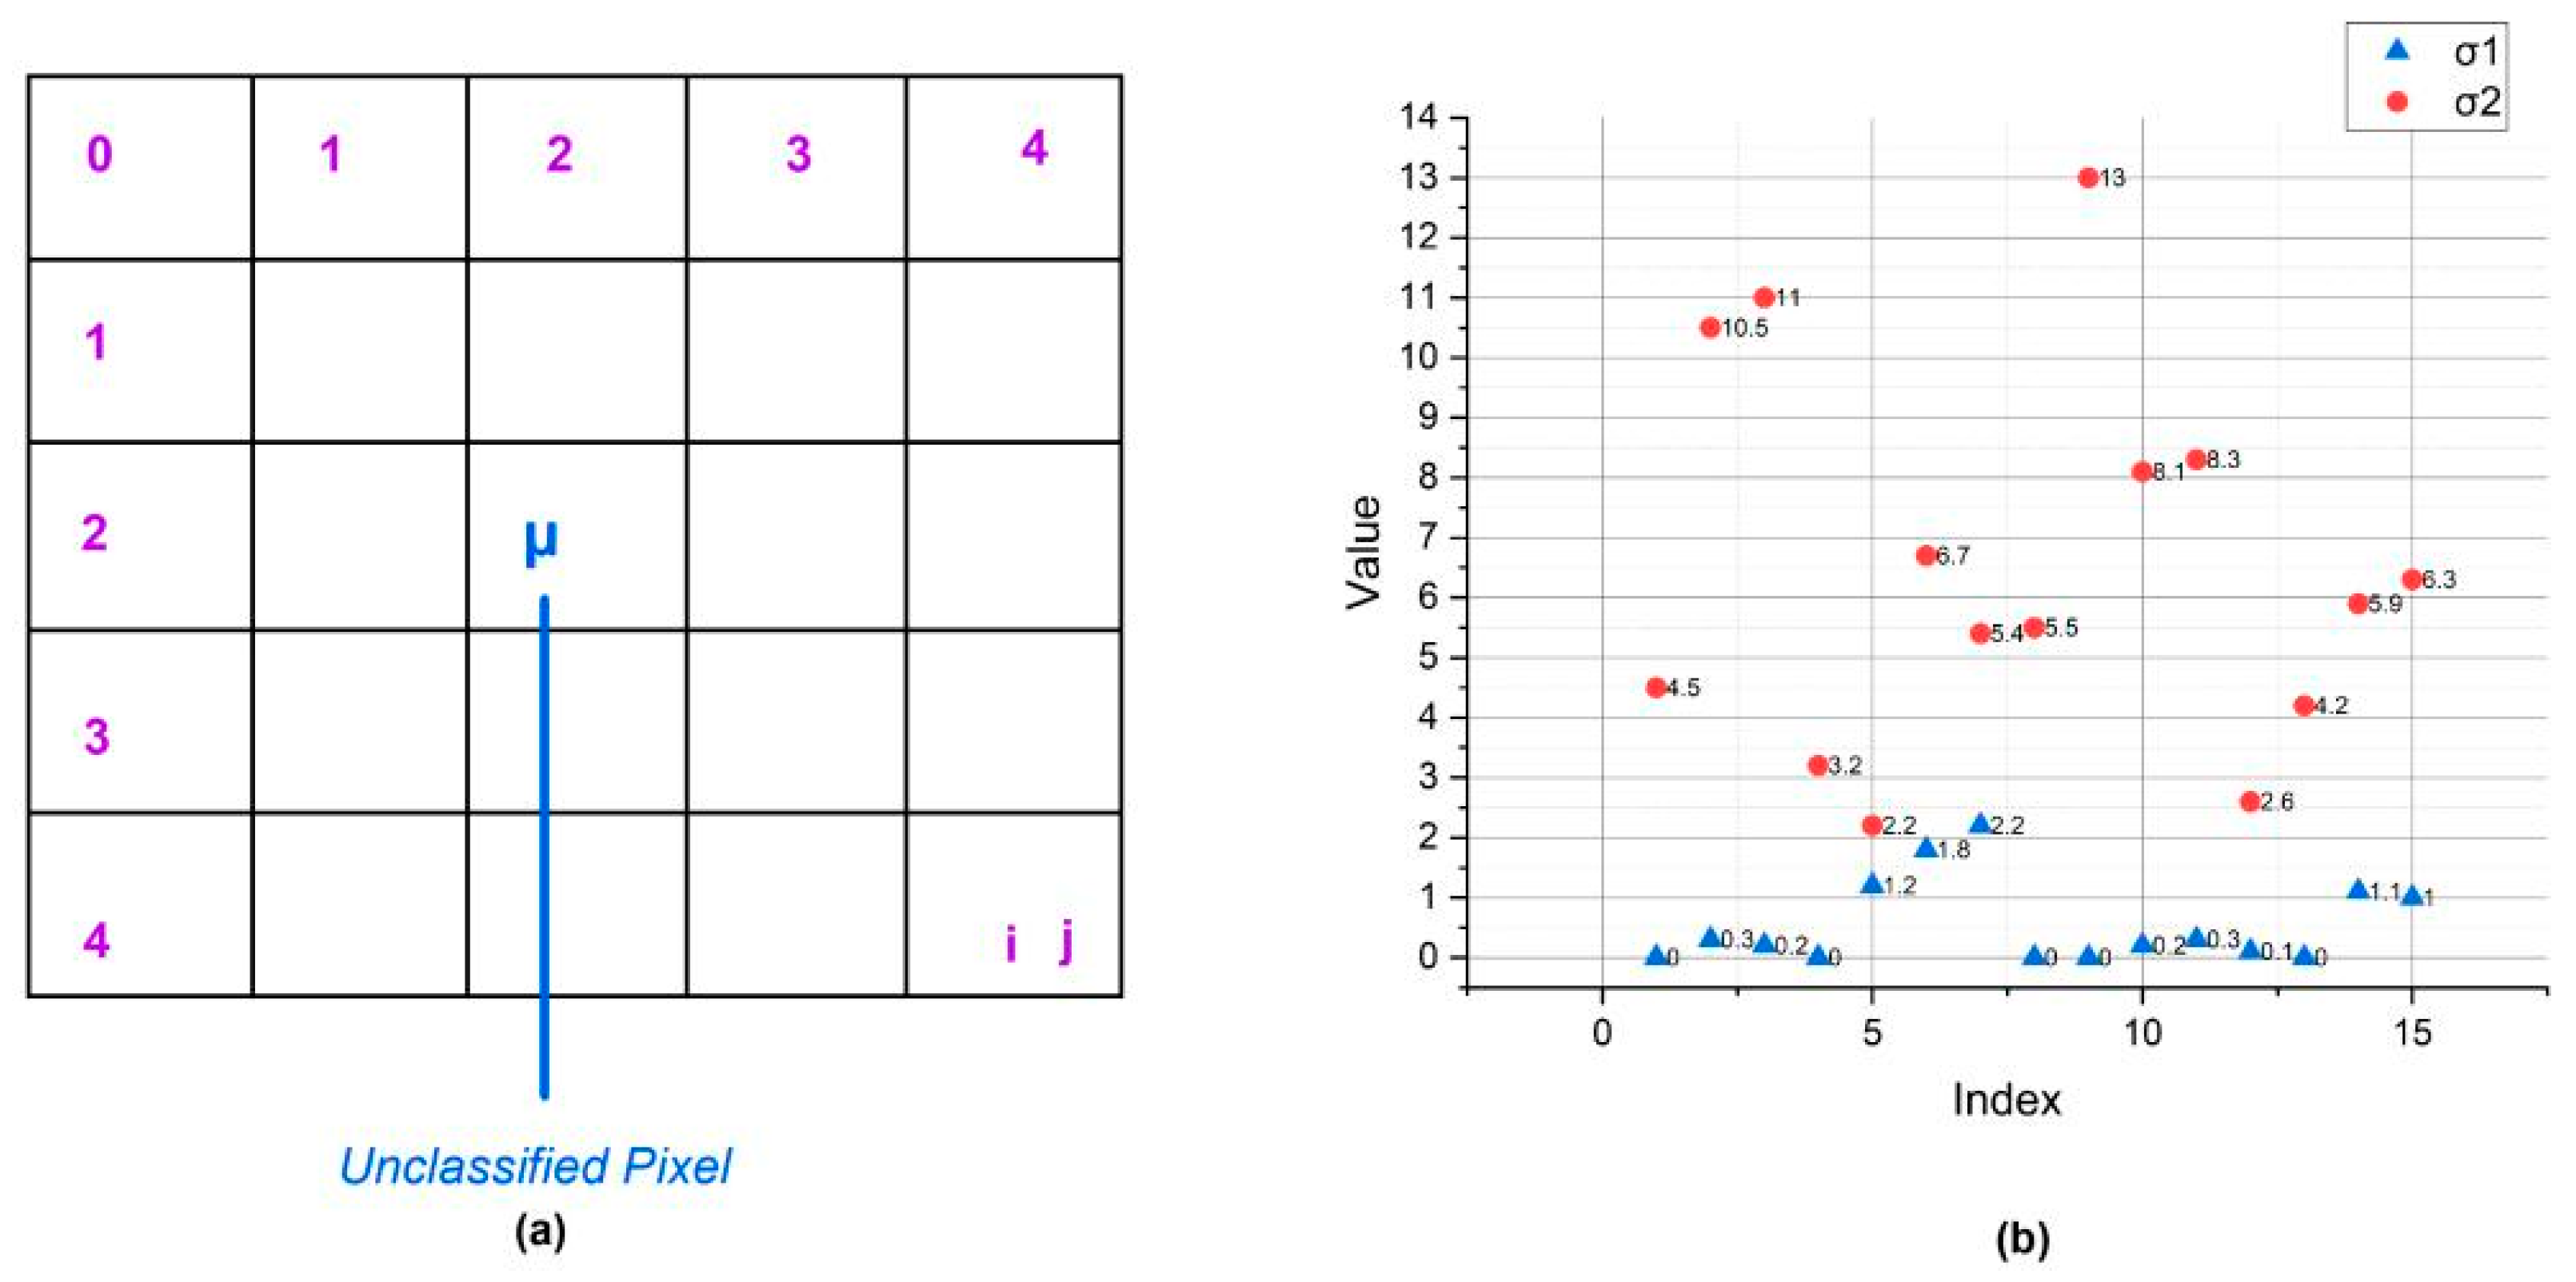
3.3. Land Surface Classification
4. Results
4.1. Variation for Lake Area
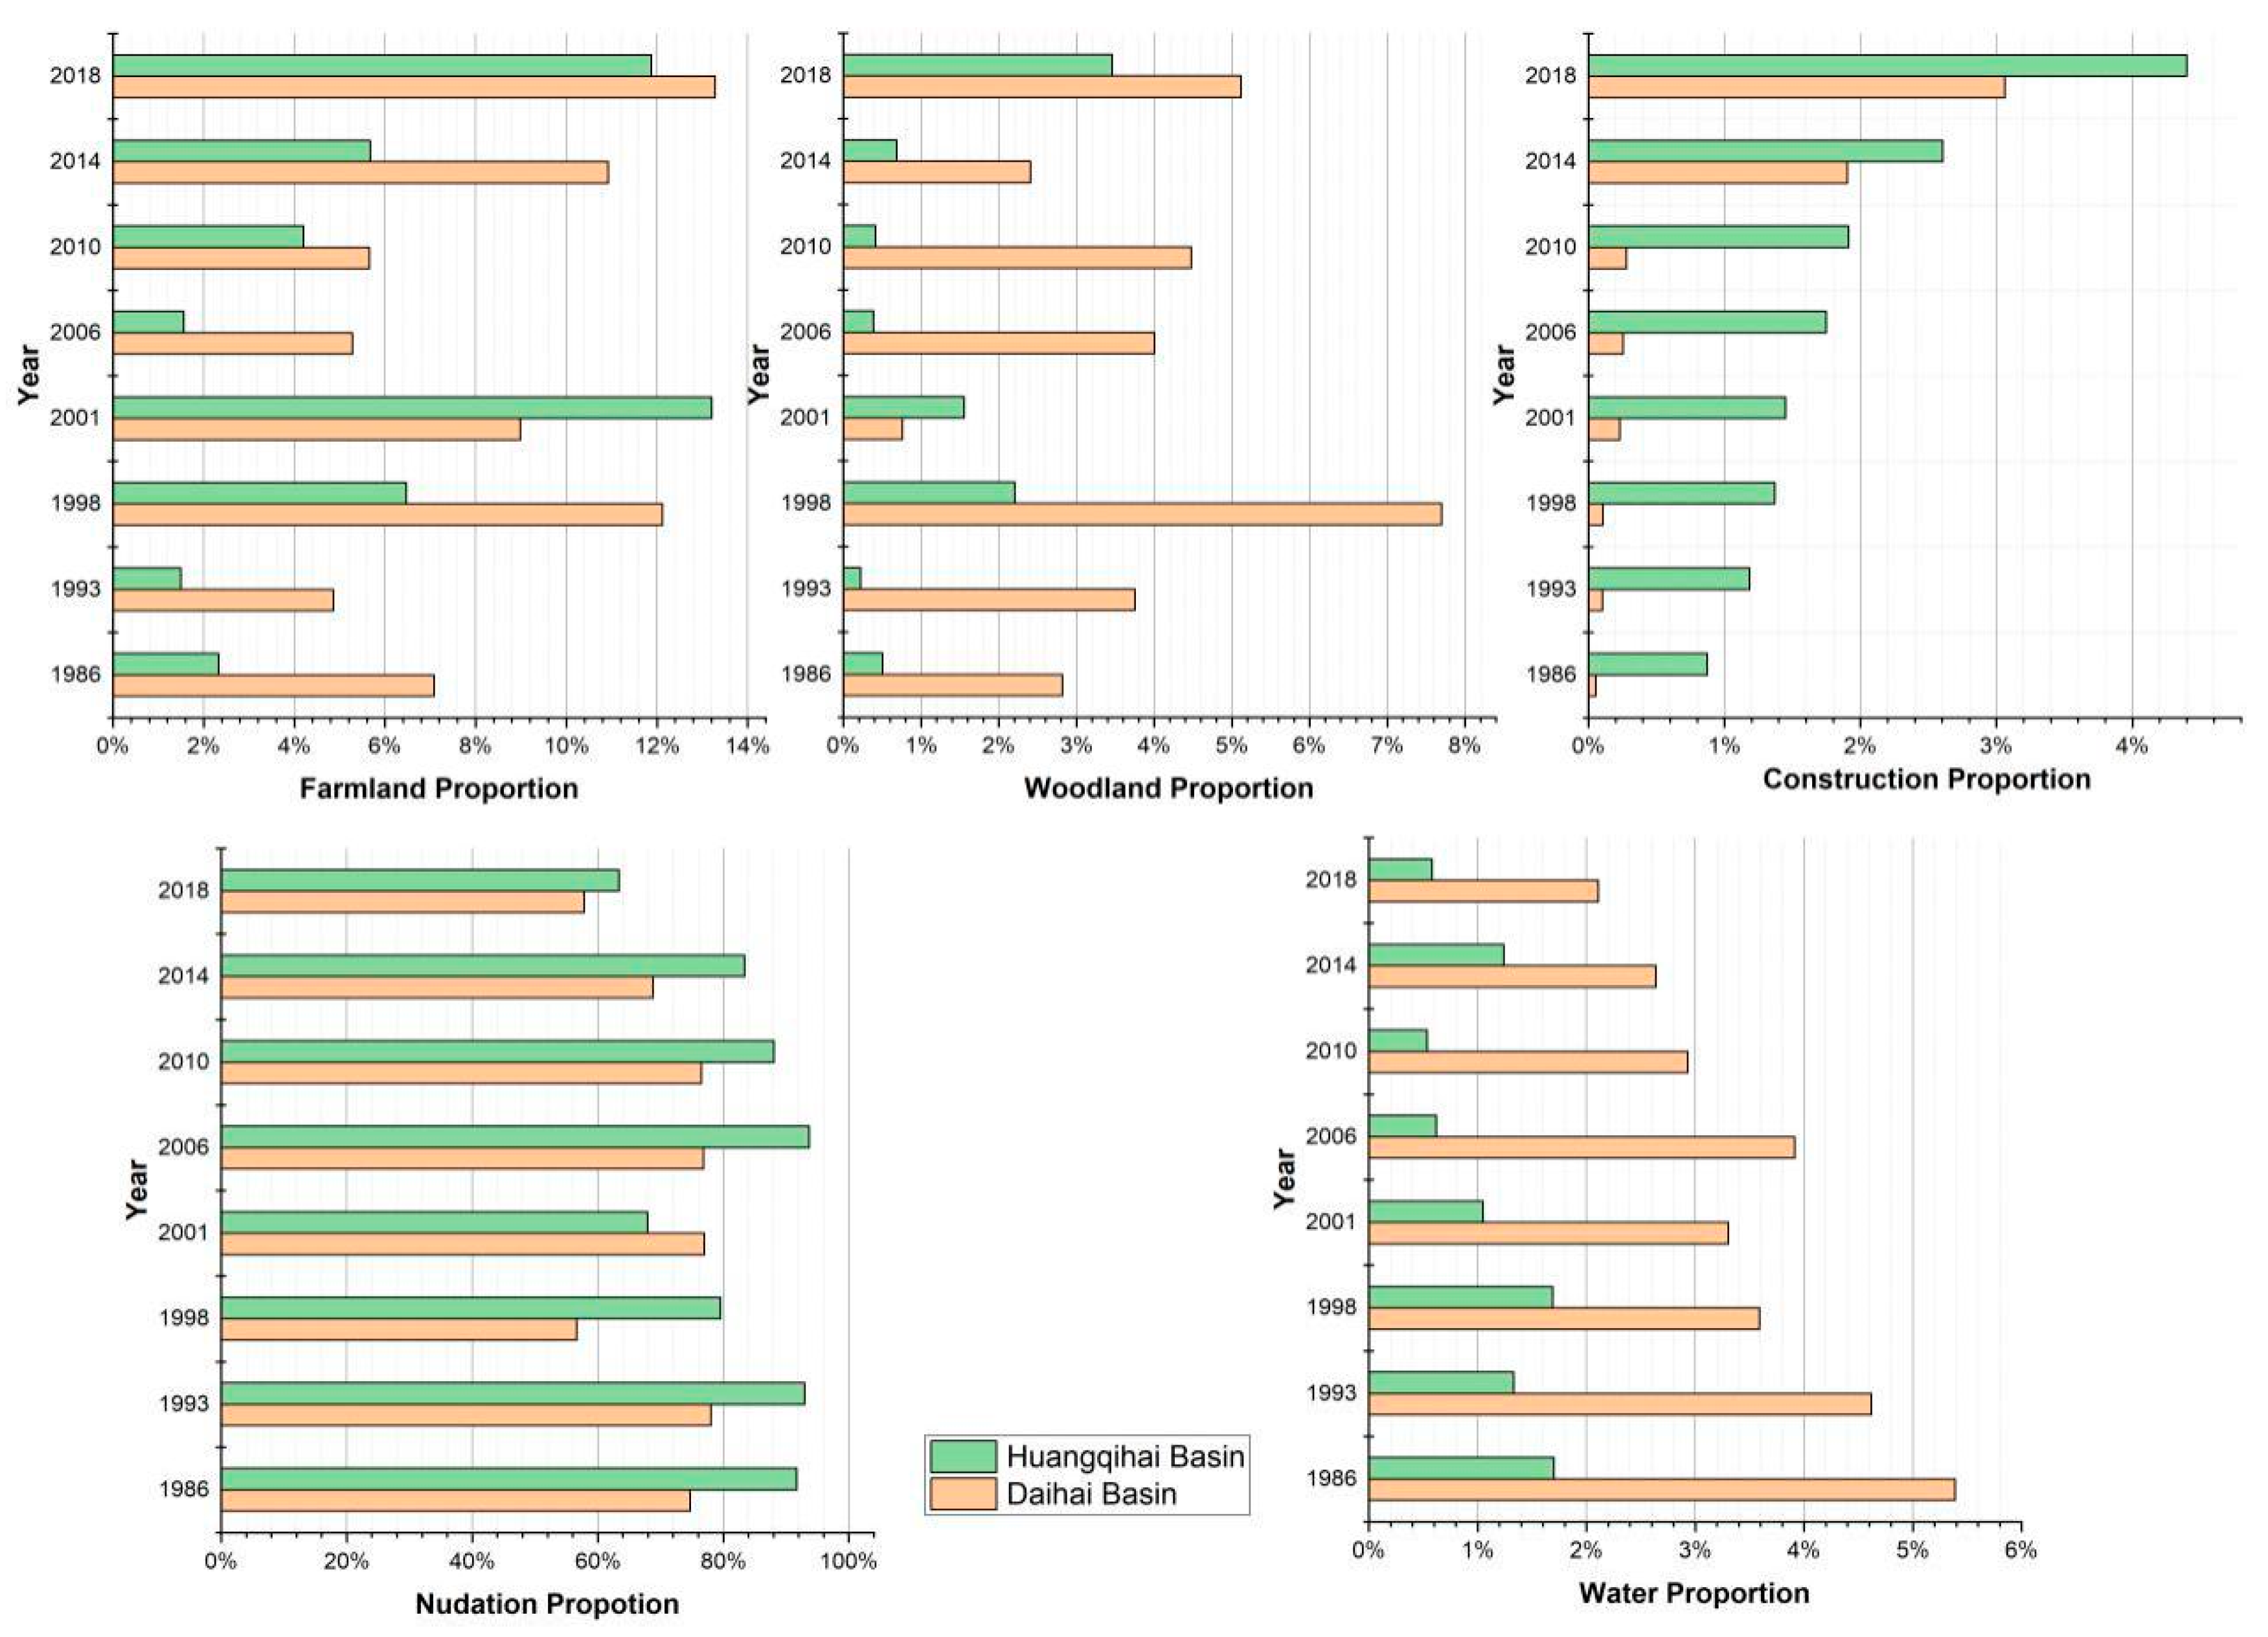
4.2. Ground Composition
5. Discussion
5.1. Qualitative Analysis of the Recharge Process
5.2. Quantitative Analysis of Water Supply and Consumption
5.3. Reasons for Lake Degradation
5.4. Environment Effects and Measures
6. Conclusions
Author Contributions
Funding
Acknowledgments
Conflicts of Interest
References
- Crighton, E.J.; Elliott, S.J.; Upshur, R.; van der Meer, J.; Small, I. The Aral Sea disaster and self-rated health. Health Place 2003, 9, 73–82. [Google Scholar] [CrossRef]
- Lioubimtseva, E.; Henebry, G.M. Climate and environmental change in arid Central Asia: Impacts, vulnerability, and adaptations. J. Arid Environ. 2009, 73, 963–977. [Google Scholar] [CrossRef]
- Sarch, M.-T.; Birkett, C. Fishing and Farming at Lake Chad: Responses to Lake-Level Fluctuations. Geogr. J. 2000, 166, 156–172. [Google Scholar] [CrossRef]
- Williams, W.D. Salinisation: A major threat to water resources in the arid and semi-arid regions of the world. Lakes Reserv. Res. Manag. 1999, 4, 85–91. [Google Scholar] [CrossRef]
- Xiao, X.; Ojima, D.S.; Parton, W.J.; Chen, Z.; Chen, D. Sensitivity of Inner Mongolia grasslands to climate change. J. Biogeogr. 1995, 22, 643–648. [Google Scholar] [CrossRef]
- Tao, S.; Fang, J.; Zhao, X.; Zhao, S.; Shen, H.; Hu, H.; Tang, Z.; Wang, Z.; Guo, Q. Rapid loss of lakes on the Mongolian Plateau. Proc. Natl. Acad. Sci. USA 2015, 112, 2281–2286. [Google Scholar] [CrossRef]
- Zhang, P.; Deng, Q.; Zhang, G.; Ma, J.; Gan, W.; Min, W.; Mao, F.; Wang, Q. Active tectonic blocks and strong earthquakes in the continent of China. Sci. China Ser. D Earth Sci. 2003, 46, 13–24. [Google Scholar] [CrossRef]
- Zhang, G.M.; Ma, H.S.; Wang, H.; Wang, X.L. Boundaries between active-tectonic blocks and strong earthquakes in the China mainland. Chin. J. Geophys. Chin. Ed. 2005, 48, 602–610. [Google Scholar] [CrossRef]
- Jie, B.; Xi, C.; Liao, Y.; Hui, F. Monitoring variations of inland lakes in the arid region of Central Asia. Front. Earth Sci. 2012, 6, 147–156. [Google Scholar] [CrossRef]
- Chiew, F.H.S.; McMahon, T.A. Groundwater Recharge from Rainfall and Irrigation in the Campaspe River Basin. Aust. J. Soil Res. 1991, 29, 651–670. [Google Scholar] [CrossRef]
- Jiansheng, C.; Bichen, J.I.; Zhen, L.I.U.; Zhiwei, Z.; Shiyin, Z. Isotopic and hydro-chemical evidence on the origin of groundwater through deep-circulation ways in Lake Daihai region, Inner Mongolia plateau. J. Lake Sci. 2013, 25, 521–530. [Google Scholar] [CrossRef]
- Dong, C.; Wang, N.a.; Chen, J.; Chen, H.; Chen, L.; Li, Z.; Ma, N. New observational and experimental evidence for the recharge mechanism of the lake group in the Alxa Desert, north-central China. J. Arid Environ. 2016, 124, 48–61. [Google Scholar] [CrossRef]
- Qun, H.; Jiahu, J. Analysis of Water Level Descent in Daihai Lake. J. Lake Sci. 1999, 11, 304–310. [Google Scholar] [CrossRef]
- Wang, T.; Chen, J.S.; Xu, Y.; Zhan, L.C.; Huang, D.W. Isotopes and hydrochemistry of Daihai Lake recharging sources, Northern China. J. Radioanal. Nucl. Chem. 2017, 312, 615–629. [Google Scholar] [CrossRef]
- Xiao, J.; Xu, Q.; Nakamura, T.; Yang, X.; Liang, W.; Inouchi, Y. Holocene vegetation variation in the Daihai Lake region of north-central China: A direct indication of the Asian monsoon climatic history. Quat. Sci. Rev. 2004, 23, 1669–1679. [Google Scholar] [CrossRef]
- Jin, D.; Rui, G.; Yong, W.; Shihong, Z.; Peiyi, Y.; Zhenqing, C.; Zhili, Z. Magnetic Fabric Study of Late Holocene Sediments in Huangqihai Lake, Inner Mongolia and its Sedimentary Significance. Acta Geol. Sin. 2013, 87, 186–196. [Google Scholar] [CrossRef]
- Xiaoqiang, L.; Jie, Z.; Ji, S.; Chengyu, W.; Hongli, Z.; Qianli, S. Vegetation history and climatic variations during the last 14 ka BP inferred from a pollen record at Daihai Lake, north-central China. Rev. Palaeobot. Palynol. 2004, 132, 195–205. [Google Scholar] [CrossRef]
- Zhang, J. Timing and possible forcing mechanisms of Huangqihai Lake fluctuations in semi-arid northern China since the late Glacial. Quat. Int. 2012, 279–280, 559. [Google Scholar] [CrossRef]
- Huazhang, L.; Qingsi, L.; Jiaxing, W. Study of evolution of Huangqihai and Daihai Lakes in holocene in inner mongolia plateau. J. Lake Sci. 1992, 4, 31–39. [Google Scholar] [CrossRef]
- Peng, Y.; Xiao, J.; Nakamura, T.; Liu, B.; Inouchi, Y. Holocene East Asian monsoonal precipitation pattern revealed by grain-size distribution of core sediments of Daihai Lake in Inner Mongolia of north-central China. Earth Planet. Sci. Lett. 2005, 233, 467–479. [Google Scholar] [CrossRef]
- Sun, Q.; Wang, S.; Zhou, J.; Chen, Z.; Shen, J.; Xie, X.; Wu, F.; Chen, P. Sediment geochemistry of Lake Daihai, north-central China: Implications for catchment weathering and climate change during the Holocene. J. Paleolimnol. 2010, 43, 75–87. [Google Scholar] [CrossRef]
- Jin, Z.; Li, F.; Cao, J.; Wang, S.; Yu, J. Geochemistry of Daihai Lake sediments, Inner Mongolia, north China: Implications for provenance, sedimentary sorting, and catchment weathering. Geomorphology 2006, 80, 147–163. [Google Scholar] [CrossRef]
- Xu, L.; Liu, Y.; Sun, Q.; Chen, Z.; Chen, J.; Cheng, P. Climate change and human occupations in the Lake Daihai basin, north-central China over the last 4500years: A geo-archeological perspective. J. Asian Earth Sci. 2017, 138, 367–377. [Google Scholar] [CrossRef]
- Zhang, J.; Jia, Y.; Lai, Z.; Long, H.; Yang, L. Holocene evolution of Huangqihai Lake in semi-arid northern China based on sedimentology and luminescence dating. Holocene 2011, 21, 1261–1268. [Google Scholar] [CrossRef]
- Frantz, D.; Röder, A.; Stellmes, M.; Hill, J. An Operational Radiometric Landsat Preprocessing Framework for Large-Area Time Series Applications. IEEE Trans. Geosci. Remote Sens. 2016, 54, 1–16. [Google Scholar] [CrossRef]
- Jia, P.; Zhang, M.; Yu, W.; Shen, F.; Shen, Y. Convolutional neural network based classification for hyperspectral data. In Proceedings of the 2016 IEEE International Geoscience and Remote Sensing Symposium (IGARSS), Beijing, China, 10–15 July 2016; pp. 5075–5078. [Google Scholar] [CrossRef]
- Zhao, H.; Shi, J.; Qi, X.; Wang, X.; Jia, J. Pyramid Scene Parsing Network. In Proceedings of the 2017 IEEE Conference on Computer Vision and Pattern Recognition (CVPR), Honolulu, HI, USA, 21–26 July 2017; pp. 6230–6239. [Google Scholar] [CrossRef]
- Shelhamer, E.; Long, J.; Darrell, T. Fully Convolutional Networks for Semantic Segmentation. IEEE Trans. Pattern Anal. Mach. Intell. 2016, 39, 640–651. [Google Scholar] [CrossRef]
- Zhang, T.; Tang, H. A Comprehensive Evaluation of Approaches for Built-Up Area Extraction from Landsat OLI Images Using Massive Samples. Remote Sens. 2018, 11. [Google Scholar] [CrossRef]
- Chen, M.; Liu, J. Historical trends of wetland areas in the agriculture and pasture interlaced zone: A case study of the Huangqihai Lake Basin in northern China. Ecol. Model. 2015, 318, 168–176. [Google Scholar] [CrossRef]
- Chen, S.; Chen, J.; Lin, G.; Zhang, W.; Miao, H.; Wei, L.; Huang, J.; Han, X.-G. Energy balance and partition in Inner Mongolia steppe ecosystems with different land use types. Agric. For. Meteorol. 2009, 149, 1800–1809. [Google Scholar] [CrossRef]
- Dyer, J. A GIS-Based Water Balance Approach Using a LiDAR-Derived DEM Captures Fine-Scale Vegetation Patterns. Remote Sens. 2019, 11, 2385. [Google Scholar] [CrossRef]
- Xiao, J.; Liu, Z.; Duan, A.; Liu, Z. Water Production Function during the Whole Growing Stage for Main Crops in China. Chin. Agric. Sci. Bull. 2008, 3, 430–434. [Google Scholar]
- Penman, H. Natural Evaporation From Open Water, Bare Soil and Grass. Proc. R. Soc. A Math. Phys. Eng. Sci. 1948, 193, 120–145. [Google Scholar] [CrossRef]
- Guoyan, P.; Zhu, O.; Qunying, L.; Qiang, Y.; Jishun, W. Water Consumption of Seven Forage Cultivars Under Different Climatic Conditions in the North China Plain. J. Resour. Ecol. 2011, 2, 74–82. [Google Scholar]
- Jiang, L.; Yang, Y.; Shang, S. Evaluation on irrigation efficiency of irrigation district in arid region based on evapotranspiration estimated from Remote Sensing data. Nongye Gongcheng Xuebao Trans. Chin. Soc. Agric. Eng. 2013, 29, 95–101. [Google Scholar] [CrossRef]
- Shunjun, H.; Changyan, T.; Yudong, S.; Bing, C.; Fang, W. Conversion Coefficient of Water Surface Evaporation in Tarim River Basin. J. Desert Res. 2005, 5, 649–651. [Google Scholar]
- Dong, J.; Wang, Y.; Zhang, S.H.; Fu, X.M.; Yao, D.L. Grain size analysis of Holocene lacustrine sediments in the Huangqihai Lake of Inner Mongolia and its sedimentological significance. Geol. Bull. China 2014, 33, 1514–1522. [Google Scholar]
- Fang, L.; Tao, S.; Zhu, J.; Liu, Y. Impacts of climate change and irrigation on lakes in arid northwest China. J. Arid Environ. 2018, 154, 34–39. [Google Scholar] [CrossRef]
- Liang, K.; Yan, G. Application of Landsat Imagery to Investigate Lake Area Variations and Relict Gull Habitat in Hongjian Lake, Ordos Plateau, China. Remote Sens. 2017, 9, 1019. [Google Scholar] [CrossRef]
- Liu, J.; Kang, S.; Gong, T.; Lu, A. Growth of a high-elevation large inland lake, associated with climate change and permafrost degradation in Tibet. Hydrol. Earth Syst. Sci. 2010, 14, 481–489. [Google Scholar] [CrossRef]
- Yao, J.Q.; Chen, Y.N.; Zhao, Y.; Yu, X.J. Hydroclimatic changes of Lake Bosten in Northwest China during the last decades. Sci. Rep. 2018, 8, 9118. [Google Scholar] [CrossRef]
- Gibson, J.J.; Prowse, T.D.; Peters, D.L. Partitioning impacts of climate and regulation on water level variability in Great Slave Lake. J. Hydrol. 2006, 329, 196–206. [Google Scholar] [CrossRef]
- Chen, J.S.; Wang, Q.Q. A discussion of groundwater recharge sources in arid areas of North China. Water Resour. Prot. 2012, 28, 1–8. [Google Scholar] [CrossRef]
- Ma, M.; Wang, X.; Veroustraete, F.; Dong, L. Change in area of Ebinur Lake during the 1998–2005 period. Int. J. Remote Sens. 2007, 28, 5523–5533. [Google Scholar] [CrossRef]
- Zedler, J.B.; Kercher, S. Wetland resources: Status, trends, ecosystem services, and restorability. Annu. Rev. Environ. Resour. 2005, 30, 39–74. [Google Scholar] [CrossRef]


| Daihai Lake | Huangqihai Lake | ||||
|---|---|---|---|---|---|
| Index | Time | Data Source | Index | Time | Data Source |
| 1 | 1984/5/26 | Landsat 5(TM) | 1 | 1984/5/26 | Landsat 5(TM) |
| 2 | 1986/5/16 | Landsat 5(TM) | 2 | 1986/5/16 | Landsat 5(TM) |
| 3 | 1987/9/15 | Landsat 5(TM) | 3 | 1987/9/15 | Landsat 5(TM) |
| 4 | 1989/9/29 | Landsat 5(TM) | 4 | 1989/9/29 | Landsat 5(TM) |
| 5 | 1990/8/22 | Landsat 5(TM) | 5 | 1990/7/14 | Landsat 5(TM) |
| 6 | 1992/6/17 | Landsat 5(TM) | 6 | 1992/6/17 | Landsat 5(TM) |
| 7 | 1994/4/4 | Landsat 5(TM) | 7 | 1994/4/4 | Landsat 5(TM) |
| 8 | 1996/6/3 | Landsat 5(TM) | 8 | 1996/6/3 | Landsat 5(TM) |
| 9 | 1998/5/24 | Landsat 5(TM) | 9 | 1998/5/24 | Landsat 5(TM) |
| 10 | 1999/7/14 | Landsat7(ETM) SLC-on | 10 | 1999/7/31 | Landsat7(ETM) SLC-on |
| 11 | 2000/5/22 | Landsat7(ETM) SLC-on | 11 | 2000/5/22 | Landsat 7(ETM) SLC-on |
| 12 | 2002/4/10 | Landsat7(ETM) SLC-on | 12 | 2002/4/10 | Landsat 7(ETM) SLC-on |
| 13 | 2004/6/9 | Landsat 5(TM) | 13 | 2004/6/9 | Landsat 5(TM) |
| 14 | 2006/6/15 | Landsat 5(TM) | 14 | 2006/6/15 | Landsat 5(TM) |
| 15 | 2008/9/1 | Landsat 5(TM) | 15 | 2008/9/1 | Landsat 5(TM) |
| 16 | 2010/5/2 | Landsat 5(TM) | 16 | 2010/5/2 | Landsat 5(TM) |
| 17 | 2013/4/15 | Landsat 8(OLI) | 17 | 2013/4/15 | Landsat 8(OLI) |
| 18 | 2014/5/20 | Landsat 8(OLI) | 18 | 2014/5/20 | Landsat 8(OLI) |
| 19 | 2015/5/16 | Landsat 8(OLI) | 19 | 2015/5/16 | Landsat 8(OLI) |
| 20 | 2016/4/23 | Landsat 8(OLI) | 20 | 2016/4/23 | Landsat 8(OLI) |
| 21 | 2017/4/3 | Landsat 8(OLI) | 21 | 2017/4/3 | Landsat 8(OLI) |
| 22 | 2018/3/5 | Landsat 8(OLI) | 22 | 2018/3/5 | Landsat 8(OLI) |
| Dahai Basin | Huangqihai Basin | ||||
|---|---|---|---|---|---|
| Index | Time | Data Source | Index | Time | Data Source |
| 1 | 1986.06 | Landsat 5(TM) | 1 | 1986.06 | Landsat 5(TM) |
| 2 | 1993.09 | Landsat 5(TM) | 2 | 1993.09 | Landsat 5(TM) |
| 3 | 1998.05 | Landsat 5(TM) | 3 | 1998.05 | Landsat 5(TM) |
| 4 | 2001.08 | Landsat 7(TM) SLC-on | 4 | 2001.08 | Landsat 7(TM) SLC-on |
| 5 | 2006.06 | Landsat 5(TM) | 5 | 2006.06 | Landsat 5(TM) |
| 6 | 2010.06 | Landsat 5(TM) | 6 | 2010.06 | Landsat 5(TM) |
| 7 | 2014.08 | Landsat 8(OLI) | 7 | 2014.08 | Landsat 8(OLI) |
| 8 | 2018.05 | Landsat 8(OLI) | 8 | 2018.05 | Landsat 8(OLI) |
| Construction | Farmland | Woodland | Saline–alkali | Nudation | Water | |
|---|---|---|---|---|---|---|
| OA1 | 96.33% | 67.54% | 64.59% | 95.99% | 96.87% | 98.65% |
| OA2 | 95.88% | 72.31% | 69.82% | 96.91% | 97.02% | 97.83% |
| Daihai basin Ground classification (km2) | ||||||
|---|---|---|---|---|---|---|
| Date | Construction | Farmland | Woodland | Nudation | Water | Saline–alkali |
| 1986.06 | 1.39 | 182.72 | 72.73 | 1927.00 | 138.94 | 0.00 |
| 1993.09 | 2.66 | 123.21 | 95.14 | 1975.89 | 116.98 | 0.00 |
| 1998.05 | 3.06 | 349.93 | 222.41 | 1635.72 | 103.68 | 0.00 |
| 2001.08 | 5.90 | 230.25 | 19.61 | 1972.26 | 84.74 | 0.00 |
| 2006.06 | 6.54 | 134.93 | 102.21 | 1961.41 | 99.97 | 9.48 |
| 2010.06 | 7.19 | 145.89 | 115.46 | 1971.03 | 75.56 | 0.00 |
| 2014.08 | 50.89 | 291.80 | 64.41 | 1837.62 | 70.48 | 0.00 |
| 2018.05 | 86.99 | 377.24 | 145.40 | 1642.66 | 59.98 | 4.65 |
| Huangqihai Basin Ground classification (km2) | ||||||
|---|---|---|---|---|---|---|
| Date | Construction | Farmland | Woodland | Nudation | Water | Saline–alkali |
| 1986.05 | 40.30 | 107.45 | 23.35 | 4221.00 | 78.30 | 0.00 |
| 1993.09 | 53.86 | 68.04 | 10.28 | 4226.29 | 60.60 | 47.63 |
| 1998.05 | 67.35 | 317.75 | 108.33 | 3904.10 | 82.97 | 0.00 |
| 2001.08 | 76.23 | 694.73 | 81.77 | 3572.57 | 55.20 | 0.00 |
| 2006.09 | 79.67 | 71.15 | 17.84 | 4265.09 | 28.24 | 2.29 |
| 2010.07 | 89.86 | 197.69 | 19.65 | 4137.20 | 25.23 | 11.07 |
| 2014.05 | 123.78 | 269.59 | 32.54 | 3961.07 | 58.91 | 0.00 |
| 2018.05 | 234.38 | 632.50 | 184.37 | 3375.68 | 31.08 | 50.49 |
| Date | AWC | AIC | TWCHA | PPWC 1 | WVR 2 | EWC | DGR 3 | TGC 4 |
|---|---|---|---|---|---|---|---|---|
| 1986.06 | 3.1 | 4.9 | 9.1 | 0.0 | 1.9 | 8.7 | 15.9 | 17.8 |
| 1993.09 | 2.1 | 3.3 | 6.1 | 0.0 | 2.6 | 5.3 | 8.9 | 11.5 |
| 1998.05 | 5.9 | 9.4 | 17.4 | 0.0 | 1.3 | 5.0 | 21.1 | 22.4 |
| 2001.08 | 3.9 | 6.2 | 11.4 | 0.0 | 3.7 | 2.8 | 10.6 | 14.3 |
| 2006.06 | 2.3 | 3.6 | 6.7 | 1.2 | -0.3 | 4.3 | 23.4 | 23.1 |
| 2010.06 | 2.5 | 3.9 | 7.2 | 1.2 | 2.7 | 3.9 | 20.5 | 23.2 |
| 2014.08 | 4.9 | 7.9 | 14.5 | 1.2 | 1.7 | 2.0 | 26.8 | 28.5 |
| 2018.05 | 6.4 | 10.2 | 18.7 | 1.2 | / | / | / | / |
| Date | AWC | AIC | TWCHA(year) | EWC(year) | TCG |
|---|---|---|---|---|---|
| 1986.05 | 1.1 | 1.7 | 2.1 | 11.4 | 13.5 |
| 1993.09 | 0.7 | 1.1 | 1.3 | 4.1 | 5.4 |
| 1998.05 | 3.1 | 5.0 | 6.2 | 8.2 | 14.4 |
| 2001.08 | 6.8 | 10.8 | 13.4 | 4.0 | 17.4 |
| 2006.09 | 0.7 | 1.1 | 1.5 | 5.3 | 6.8 |
| 2010.07 | 1.9 | 3.1 | 4.3 | 3.0 | 7.3 |
| 2014.05 | 2.6 | 4.2 | 6.0 | 2.9 | 8.9 |
| 2018.05 | 6.2 | 9.9 | 14.1 | / | / |
| Daihai Basin | |||||||
| Date | 1986.06 | 1993.09 | 1998.05 | 2001.08 | 2006.06 | 2010.06 | 2014.08 |
| Human | 47.7 | 40.2 | 72.7 | 71.6 | 77.2 | 80.8 | 89.5 |
| Climate | 52.3 | 59.8 | 27.3 | 28.4 | 22.8 | 19.2 | 10.5. |
| Huangqihai Basin | |||||||
| Date | 1986.05 | 1993.09 | 1998.05 | 2001.08 | 2006.09 | 2010.07 | 2014.05 |
| Human | 15.5 | 24.6 | 43.1 | 76.9 | 22.4 | 58.8 | 67.3 |
| Climate | 84.5 | 75.4 | 56.9 | 23.1 | 77.6 | 41.2 | 32.7 |
© 2019 by the authors. Licensee MDPI, Basel, Switzerland. This article is an open access article distributed under the terms and conditions of the Creative Commons Attribution (CC BY) license (http://creativecommons.org/licenses/by/4.0/).
Share and Cite
Chen, J.; Lv, J.; Li, N.; Wang, Q.; Wang, J. External Groundwater Alleviates the Degradation of Closed Lakes in Semi-Arid Regions of China. Remote Sens. 2020, 12, 45. https://doi.org/10.3390/rs12010045
Chen J, Lv J, Li N, Wang Q, Wang J. External Groundwater Alleviates the Degradation of Closed Lakes in Semi-Arid Regions of China. Remote Sensing. 2020; 12(1):45. https://doi.org/10.3390/rs12010045
Chicago/Turabian StyleChen, Jiaqi, Jiming Lv, Ning Li, Qingwei Wang, and Jian Wang. 2020. "External Groundwater Alleviates the Degradation of Closed Lakes in Semi-Arid Regions of China" Remote Sensing 12, no. 1: 45. https://doi.org/10.3390/rs12010045
APA StyleChen, J., Lv, J., Li, N., Wang, Q., & Wang, J. (2020). External Groundwater Alleviates the Degradation of Closed Lakes in Semi-Arid Regions of China. Remote Sensing, 12(1), 45. https://doi.org/10.3390/rs12010045