Article

Spectral Analysis of Satellite Altimeter and Tide Gauge Data around the Northern Australian Coast

1
School of Civil Engineering and Surveying, University of Southern Queensland, 37 Sinnathamby Blvd, Springfield Central, QLD 4300, Australia
2
School of Engineering, The University of Newcastle, University Drive, Callaghan, NSW 2308, Australia
*
Author to whom correspondence should be addressed.
Remote Sens. 2020, 12(1), 161; https://doi.org/10.3390/rs12010161
Submission received: 5 November 2019 / Revised: 27 December 2019 / Accepted: 27 December 2019 / Published: 2 January 2020
(This article belongs to the Section Ocean Remote Sensing)

Abstract

:
The north of Australia is known for its complex tidal system, where the highest astronomical tides (HATs) reach 12 m. This paper investigates the tidal behaviour in this region by developing spectral climatology for tide gauge and altimetry data. Power spectral density analysis is applied to detect the magnitude of ocean tides in 20 years of sea-level data from multimission satellite altimeters and tide gauges. The spectra of altimetry sea level anomaly (SLA) time series have their strongest peaks centred at approximately 2.11, 5.88, and 7.99 cycles per year (cpy), corresponding to the diurnal and semidiurnal tidal constituents K1, M2, and O1, respectively. Closer to the coastline, the spectra peak at high-frequency overtide and shallow-water constituents such as M4, MK4, and MK3. There have been many large, high-frequency spectral peaks near the coastline, indicating the difficulty of predicting tidal signals by coastal altimetry. Similar to altimetry observations, there are dominant semidiurnal and diurnal tidal peaks in tide gauge SLA time series accompanying a number of overtides. The semidiurnal and diurnal peaks are mostly higher on the northwest coast of Australia compared with the north and northeast coast. The results from both altimetry and tide gauges indicate that tidal range increases with increasing continental shelf.

Graphical Abstract

1. Introduction

Tides are the periodic rise and fall of the ocean due to changes in the gravitational attractive forces of the Moon, Sun, and Earth. Ocean tides are accountable for almost 80% of sea-level variability [1,2]. Understanding the tidal behaviour is important not only for the coastal environment and ecosystems but also for accurate estimations of surge components of sea level and the rate of sea-level rise [3].
Time-series analysis has been widely used in assessing sea-level measurements and detecting the tidal components of sea-level variations [4]. One common method of analysing localised power variations within a time series is spectral analysis, which has numerous applications, including climatology and geoscience [4]. By decomposing a sea-level time series into a time–frequency space, the spectral analysis method determines the dominant tidal component and variation of components over time.
A number of studies have used this method to analyse sea-level signals around the world. Manzano-Agugliaro et al. [5] investigated tidal signals using spectral analysis of seven-year sea-level time series from four tide gauges located at the Strait of Gibraltar. They used the simple fast Fourier transform (FFT) method and showed that tide waves in this region are not stationary; the spectral amplitudes for tide waves M2, S2, and N2 have temporal variation with a period of 1.28 years. Ozsoy et al. [6] analysed 14-year time series of Southampton tide gauges in Solent, U.K., using the classical spectral analysis method (e.g., FFT) to identify the occurrence and characteristics of high-frequency (<6 h) sea-level variations. They indicated that the dominant periods across all eight extreme sea-level events were largely in the range of 0.2–0.3 cycles per hour (cph).
Pirooznia et al. [7] used the least-squares spectral (LSS) analysis method to examine sea-level time series of altimetry data (TOPEX/Poseidon, Jason-1, and Jason-2) and three tide gauges located in the Caspian Sea. The spectral analysis revealed that solar annual (Sa) signals play a dominant role in sea-level variation of the Caspian Sea. They applied the least-square spectral method as it is more suitable than Fourier analysis of gappy, unequally weighted, and unequally spaced data time series. Here, we used the traditional Fourier analysis but filled the gap in data series to overcome its limitation.
The northern parts of Australia, particularly far north Queensland and northwest Western Australia, are made up of a wide and shallow continental shelf and have always experienced large king tides reaching a maximum of 12 m in the northwest (Figure 1). The tidal signals are more complex in such regions and are mainly driven by nonlinear forces and processes such as friction diffusion and advection. Allen and Greenslade [8] calculated the power spectral density of one-year tide gauge time series located around Australia. In this study, we used much longer time series—20 years—from both tide gauges and satellite altimetry to produce background spectra. This resulted in better spectral resolution and determined the spectral peaks more accurately, which helped to understand and accurately simulate tides, especially overtides and compound tides, in this region.
This paper consists of five sections. Following the introduction, the second section presents the data and study region. The third section introduces the theory behind tidal analysis and prediction. In the fourth section, sea level anomaly (SLA) observations are analysed by power spectral density to explore the dominant tide signals in the study region. In the last section, we summarise the findings and draw some conclusions.

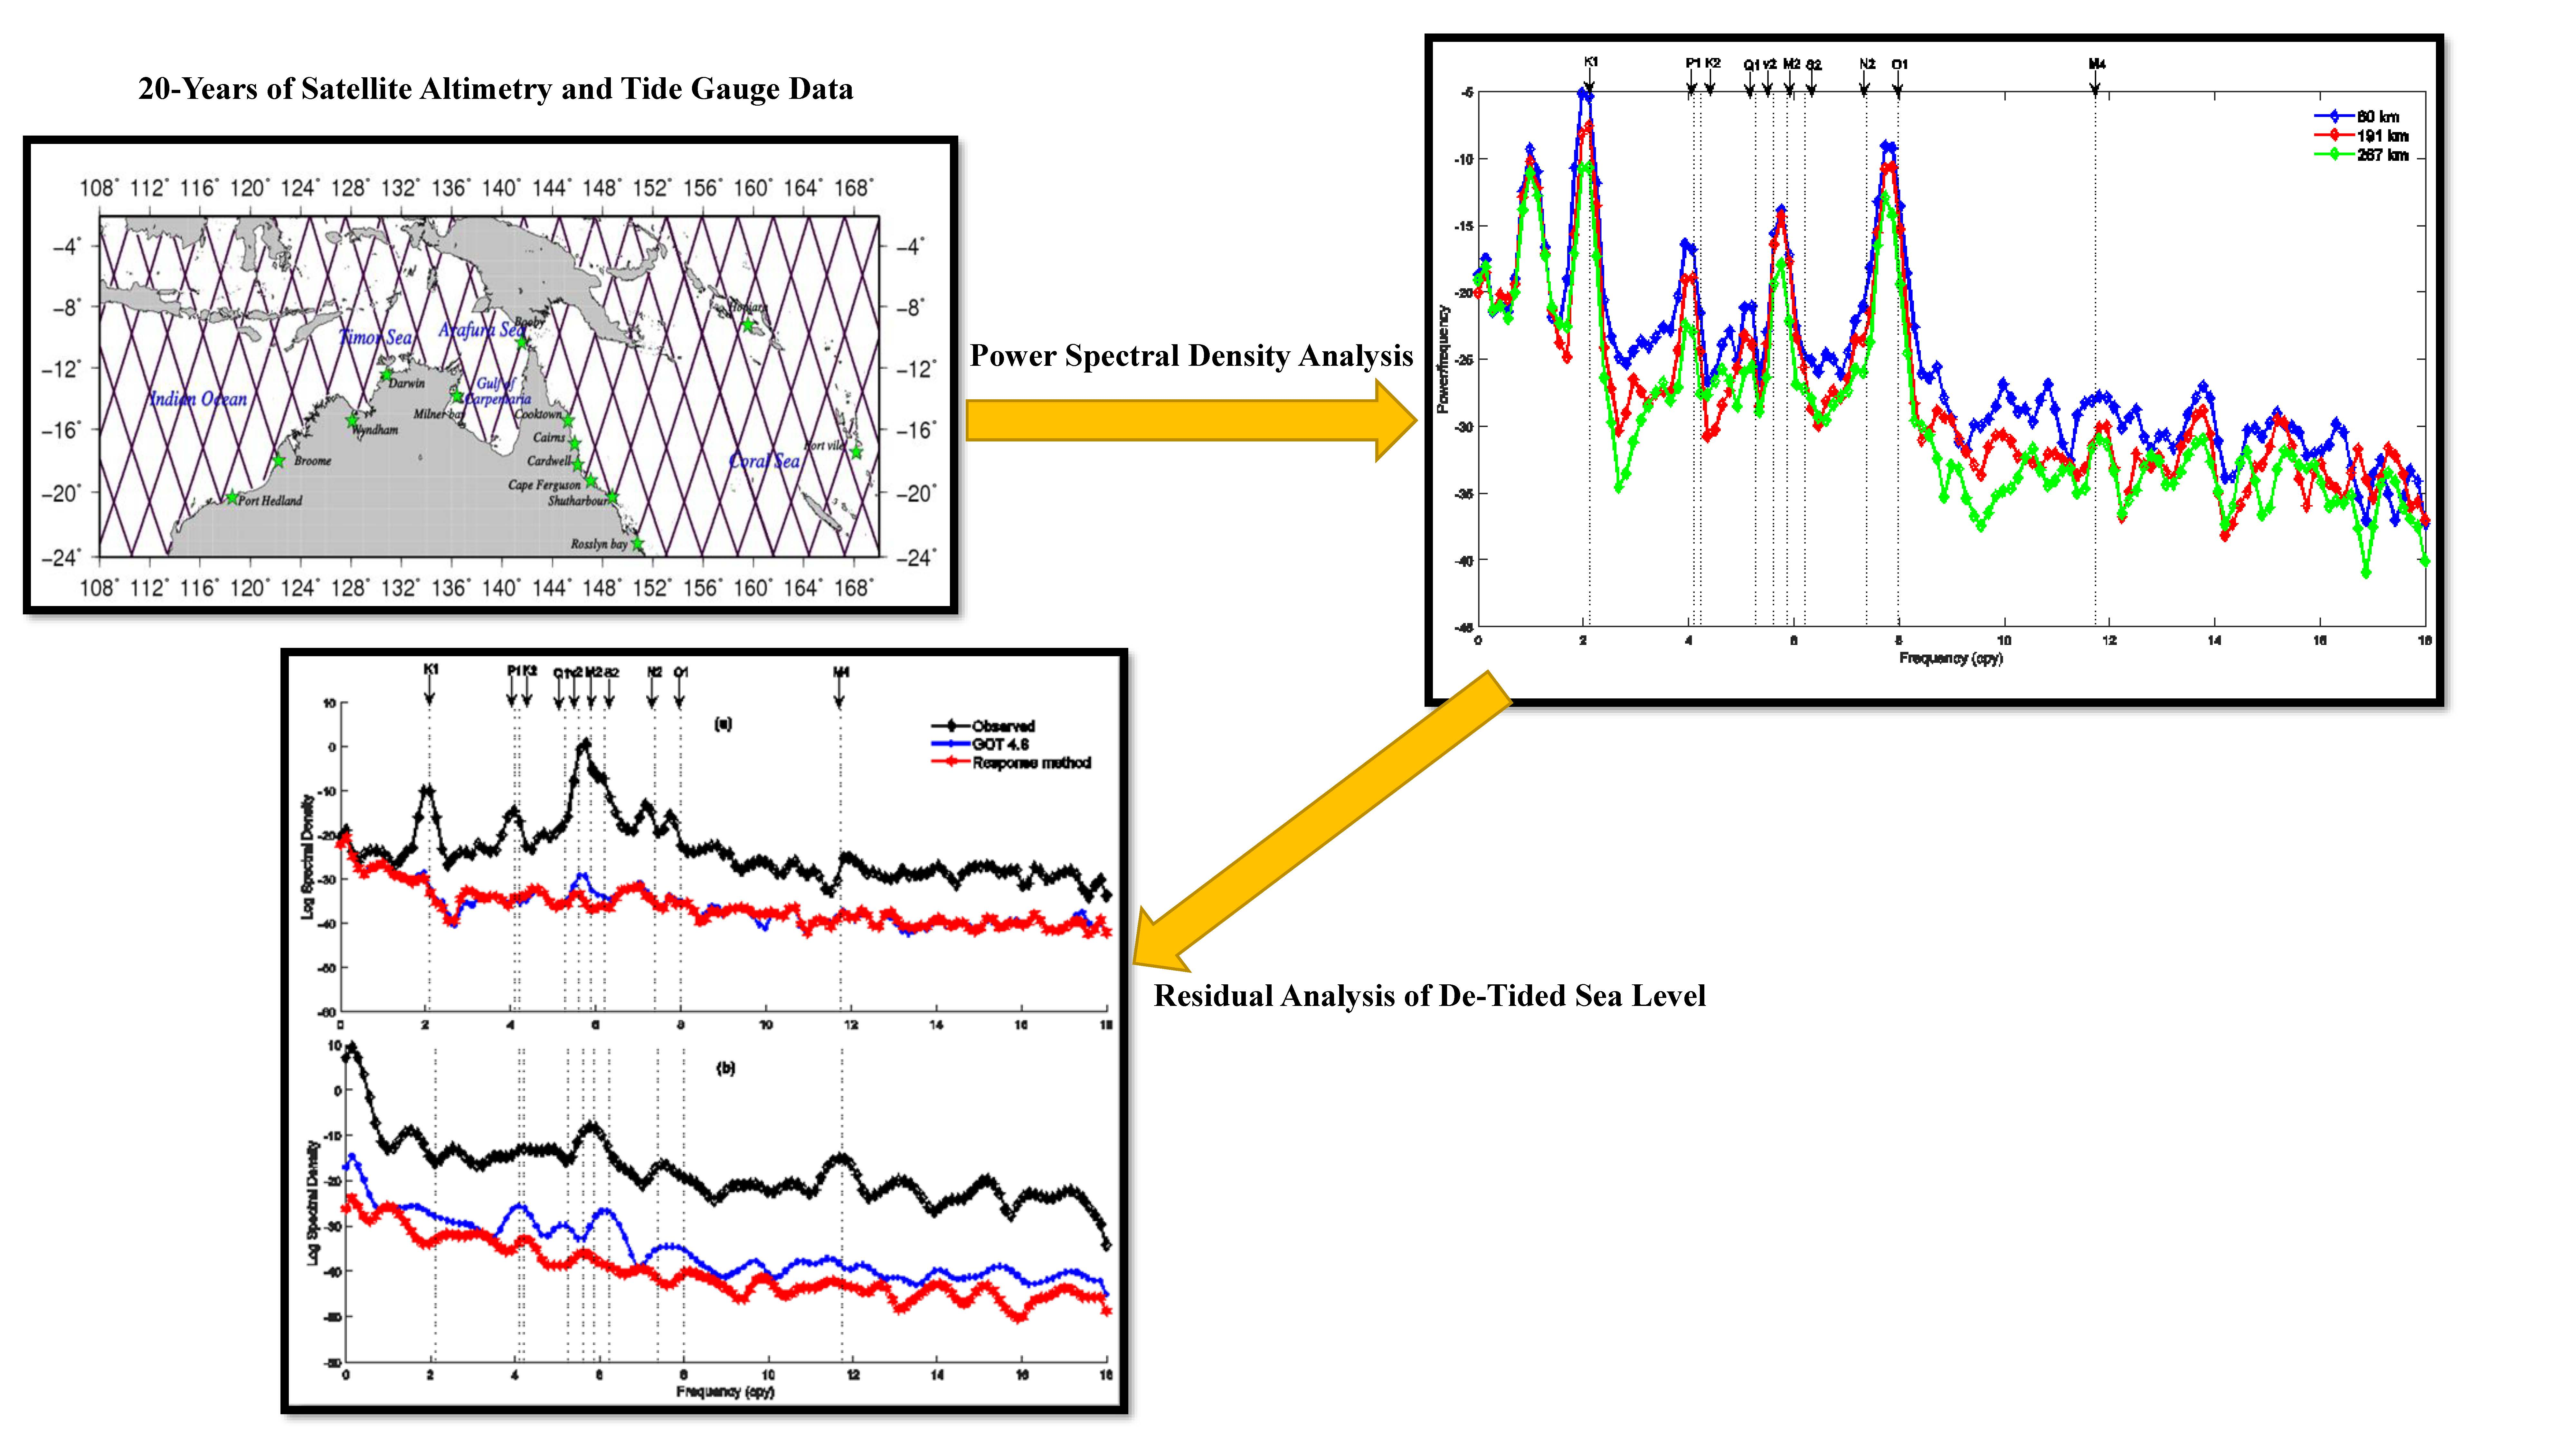
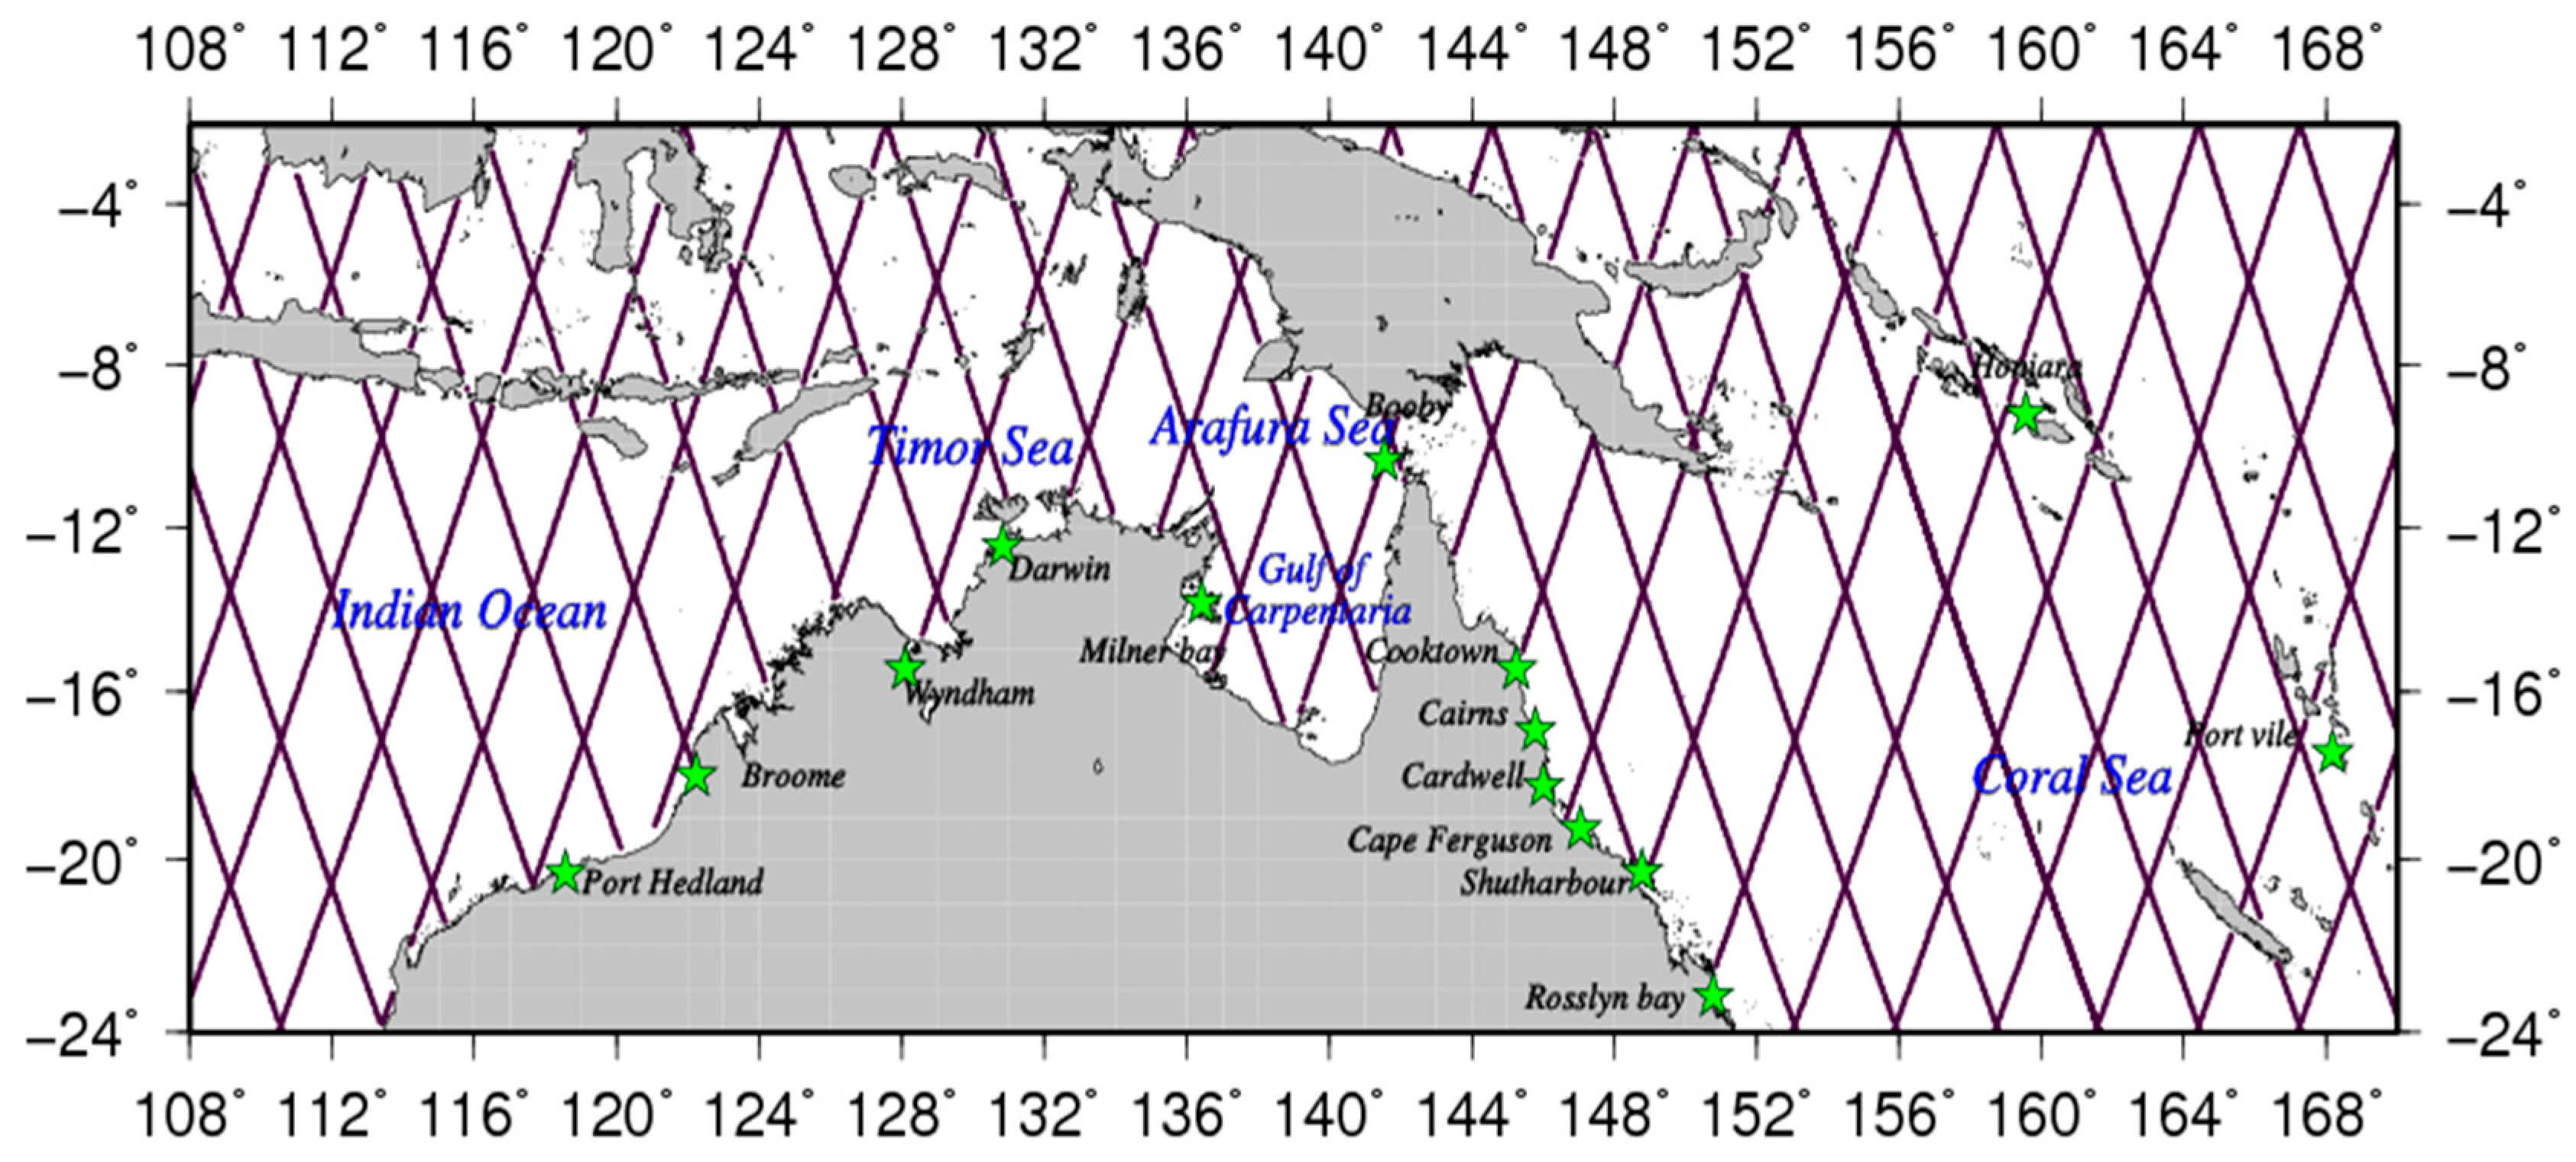
2. Data and Study Region

Twenty years (1993–2013) of altimetry sea-level data from TOPEX/Poseidon (T/P), Jason-1, and Jason-2 satellite altimeters over the north of Australia were used for this study (see Figure 2). The along-track sea surface heights (SSHs) with a sample rate of 1 Hz (~6 km) were extracted from the Radar Altimeter Database System (RADS, http://rads.tudelft.nl/rads/rads.shtml) to reduce interpolation errors and enable us to measure short-lifetime sea-level variations [9].
The standard range and geophysical corrections were applied to the altimetry data. These corrections consisted of ionospheric range delay using smoothed dual-frequency altimeter, modelled dry and wet tropospheric corrections by the European Centre for Medium-Range Weather Forecasts (ECMWF, http://www.ecmwf.int/), the solid Earth and pole tides, and sea state bias correction using the BM4 model [10]. The DTU13 MSS model [11] was used to remove mean sea surface (MSS).
Hourly SSHs from 14 tide gauges (Figure 2) were acquired by the University of Hawaii Sea Level Centre (UHSL, http://uhslc.soest.hawaii.edu/home) and the Australian National Tidal Centre (NTC, http://www.bom.gov.au/oceanography/). All tide gauges data were quality-controlled and corrected for obvious mistakes including datum and time shifts as well as spikes.
All selected stations had long time series (>20 years), and the data gaps at each station were less than ~8% of the whole record. The MSS was then removed from every tide gauge station. Both datasets were corrected for inverse barometric response through the two-dimensional gravity waves model (MOG2D-IB). This decreases the noise in estimating the variations in sea surface heights that are not related to atmospheric pressure [12].

3. Method

A number of methods are proposed to detect the characteristics of the noise in sea-level residuals. The power spectral density (PSD) analysis method suggested by Vaniček [13] is used here. This method has become a common way of analysing localised power variations within a sea-level time series (e.g., [8,14]). The spectral density within a specific interval of frequencies indicates the amount of variance explained by those frequencies.
The power spectral density Pε(f) of sea-level residuals ɛ is mathematically expressed by Equation (1). This equation estimates PSD using a periodogram, which is a function/graph that displays information about the periodic components of a time series. The periodogram estimator is given by
P ε ( f ) = 1 m [ j = 0 m 1 ε i exp ( 2 π i j f ) ]
where m is the number of sea-level measurements, j is the index that varies from 0 to m − 1, and εi denotes the ith element of sea-level residuals εi. An improved PSD estimator is the one proposed by Welch [15]. This method consists of dividing the time-series data into (possibly overlapping) segments, computing a modified periodogram of each segment, and then averaging the PSD estimates. The result is Welch’s PSD estimate. For each spectrum, Welch’s method [15] was applied to estimate the power spectral density.
This method splits the data ε into 8 equal-length overlapping segments (50% overlap). Each segment is then windowed by multiplying with a Hamming window of the same length. Next, the periodograms are estimated by averaging the spectra for each window. Note that the Hamming window function has a sinusoidal shape, which results in a wide peak but low side lobes. This window function is useful for noise measurements and gives better frequency resolution than some of the other windows. Readers can refer to [16] for more information.
It is possible to revise the parameters in Welch’s method to achieve improved estimates relative to the periodogram, especially when the signal-to-noise ratio (SNR) is low. The corresponding noise power (in dB) is plotted over equal-length segments. Each segment is in the form of
P ( f ) = 10 log 10 ( 2 P ε ( f ) f s )
where fs is the sampling frequency. κ in Equation (3) represents the spectral index, which can be estimated by the slope of the spectra in log–log space [17] as
k = P ( f ) 10 log 10 f
Note that the PSD unit is power (e.g., watts) per unit of frequency.
We applied this analysis to the 20-year data of the selected tide gauges and altimetry tracks, as shown in Figure 2. Power spectra of time series were calculated using Equation (2). It is necessary to remove the trend from the datasets before performing PSD analysis, as the result could be overwhelmed by the nonzero mean and the trend terms.
In the first experiment, the tidal signals were not removed from the observations (Section 4.1 and Section 4.3). As such, tidal peaks are very evident in the spectra. Simply subtracting the predicted tide from the observations often does not remove all the tidal variability. For this reason, the analysis was performed using raw observations without removing the tidal signal. In the second experiment, the same analysis method was applied to a time series of de-tided altimetry data (tidal signals removed) using 2 tidal prediction models, and the residuals were compared to evaluate the performance of the models in removing the tidal constituents (Section 4.3).

4. Results

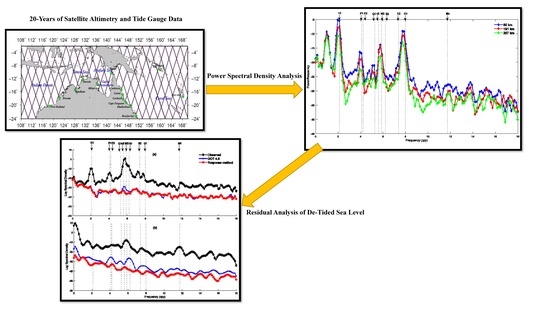
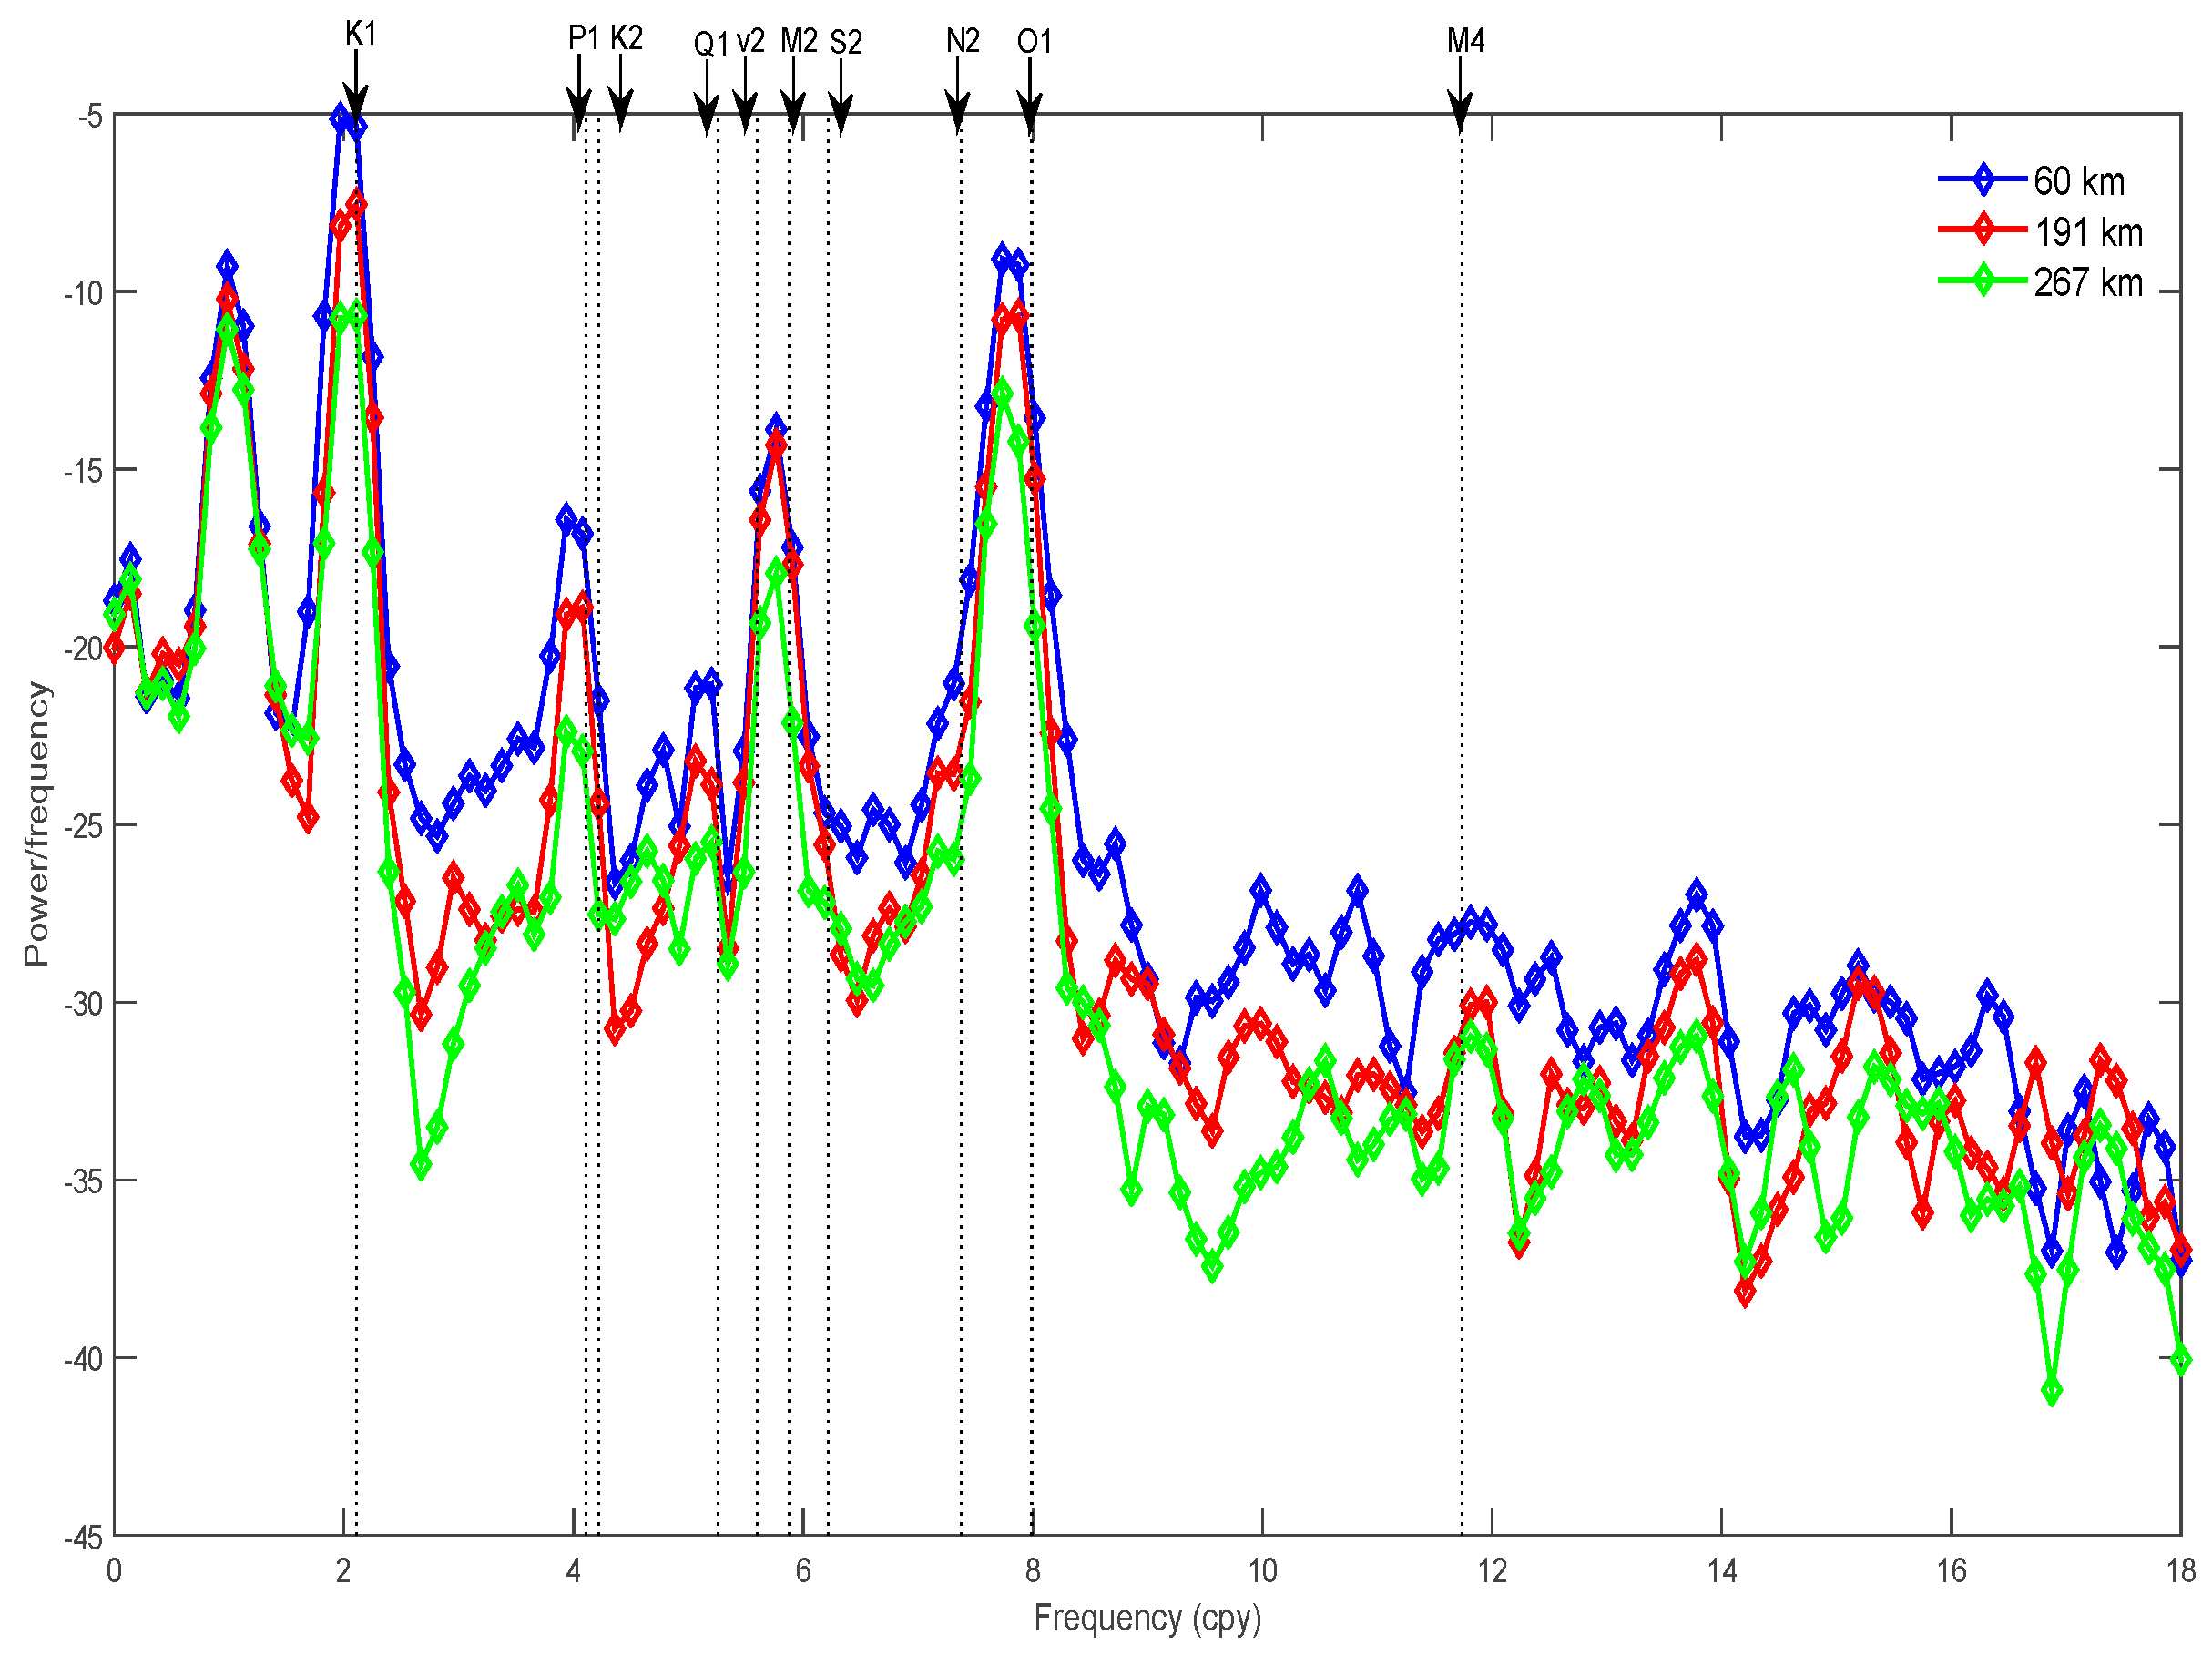
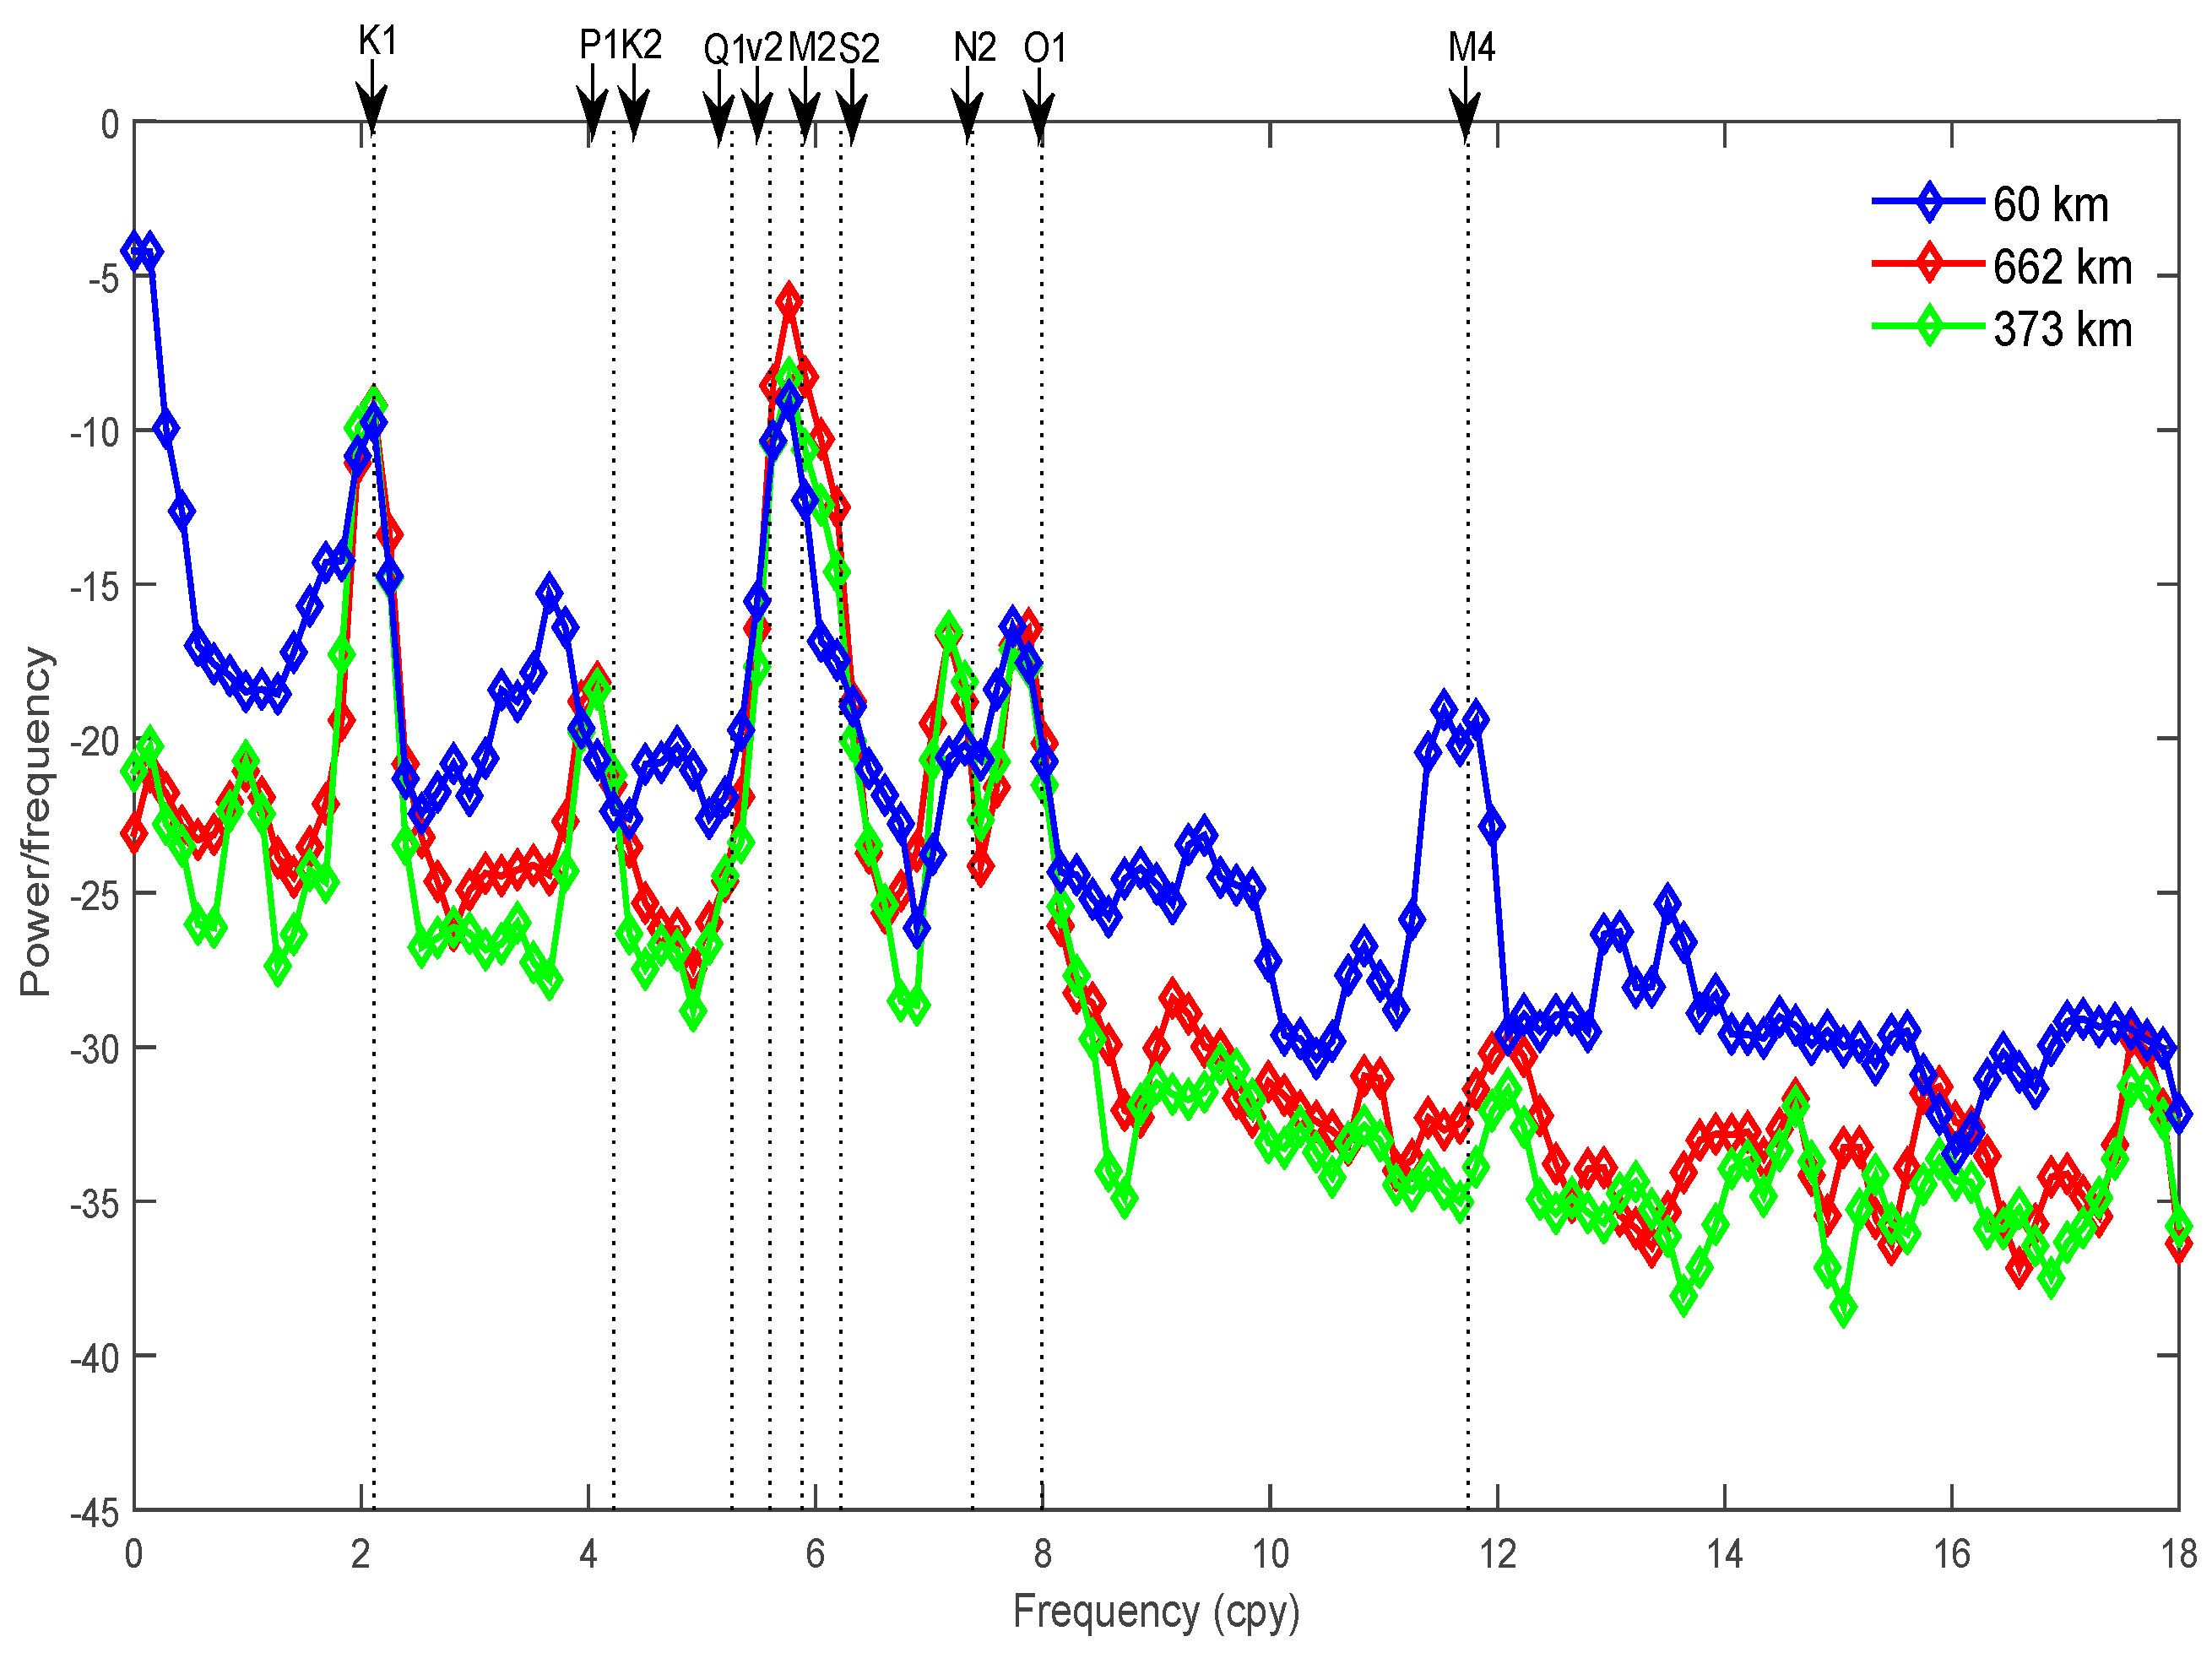
4.1. Spectral Analysis of Satellite Altimetry Data

The tide periods measured by altimetry at each point were not similar to those observed by tide gauges and were aliased into longer periods, as shown in Table 1. For example, M2 and S2 have aliased periods of about 60 days (six cycles of T/P) with respect to T/P sampling rate, which is equivalent to the 12 h of tide gauge data. They separate in 1072 days (107 cycles of T/P), equivalent to 14 days of tide gauge data [18].
After 20 years of altimetric observations, the available altimetric time series are generally much longer than the aliased periods of tidal constituents. Also, the sampling rate of T/P was selected so that the aliased periods of the major constituents would not be the same. Thus, these allow separation of constituents using harmonic analysis of data obtained from the first years of the mission. Consequently, T/P and the following Jason series of missions delivered accurate tidal parameters at each along-track point, allowing us to generate ocean tidal models.
Almost 20 years of TOPEX/Poseidon, Jason 1, and Jason-2 (T/P, J1, and J2) data enable us to distinguish constituents with close aliased periods. Power spectral analysis of the sea level was calculated for 401 points. Sea-level spectra of 12 points along four satellite ground tracks are presented as examples in deep-ocean and shallow-water areas (Figure 3). Gaps in sea-level time series were filled by linear interpolation to predict missing observations. The aliasing period due to errors in the eight main tidal constituents (Table 1) is shown by arrows in Figure 4.
Figure 4 shows the spectra of three points along T/P-Jason ground track 38. The track was chosen to represent the spectrum of sea level along the northwest shelf of Australia. This region is made up of a wide, shallow continental shelf, marginal terraces, and platforms [20]. There are four physiographic regions in this area: (1) inner shelf, with a depth of about 0–30 m; (2) middle shelf, which includes more than 40% of the area, with a depth of 30–200 m, defined by a gentle slope; (3) outer shelf, with a depth of ~200 m to the base of the steep slope; and (4) abyssal plains or deep ocean floor with a flat, gentle slope at depths greater than ~4000 m [21]. Three selected points are located on the inner shelf, the middle shelf, and in deep ocean.
The largest peak is associated with the semidiurnal tidal cycle with frequencies of 5.60 cpy, 5.88 cpy, and 6.22 cpy, which coincide with the frequencies of ʋ2, M2, and S2, respectively. The semidiurnal tides at this location are significantly stronger than at other locations. In the middle shelf and deep ocean, 255 km and 603 km from the coast, respectively, a number of distinct spectral peaks can be found that correspond to the diurnal tidal period of K1 (2.11 cpy), P1 (4.11 cpy), and K2 (4.22 cpy).
Moving toward the coastline, around 48 km from the coastline, more peaks can be seen in the high-frequency range, including one of major overtide M4 (11.76 cpy). The quarter-diurnal tides in the inner shelf are larger than some of the diurnal tides in the deep ocean. There is also a distinct peak with a frequency of 1.66 cpy coinciding with the frequency of MK4, which is generated by the nonlinear interaction between M2 and K2.
Figure 5 displays the spectra of three points along T/P-Jason ground track 240. The satellite track is located in the Gulf of Carpentaria, which is a shallow enclosed sea. It extends from the Wessel Rise on its northwestern side, where it is separated from the Arafura Sea by the Arafura Sill at 53 m water depth, to the Torres Strait on its northeastern side, where it is separated from the Coral Sea through a sill at a depth of 12 m [22]. The gulf has a flat floor with a low slope coastal plain of relatively low relief. The shallowest part is around 40 km west of the Torres Strait, reaching a depth of only 20 m [23], but most parts of the gulf have 50 and 60 m water depth, with a standard deviation of <2 m [22].
Selected points are located in both the shallowest part (~20 m) around 48 km from the coast and the deepest part (~50–60 m) of the gulf around 603 km from the coast. In general, all spectra have a reasonably uniform response over all frequencies. Power spectra show high energy in the low-frequency range with declining energy peaks at higher frequencies. The largest peak is related to the diurnal tidal period with frequencies of 2.11 cpy and 7.99 cpy, which coincide with the frequencies of K1 and O1, respectively. There are distinct spectral peaks corresponding to the semidiurnal tidal period of M2 (5.88 cpy) and K2 (4.22 cpy). The diurnal tidal peaks in the spectra are about the same size as those observed at the northwest shelf of Australia. However, the semidiurnal and overtidal peaks (e.g., M4) are relatively small. There are other peaks with frequencies of 1 cpy and 2 cpy linked to solar annual (Sa) and solar semiannual (Ssa) signals.
Figure 6 shows the spectra of three points along T/P-Jason ground track 251 located on the northeast shelf of Australia. This region extends from the Gulf of Papua in the north to Rosslyn Bay in the south. The boundary consists of carbonate-dominated plateaus such as the east of Queensland and Marion Plateaus. The Great Barrier Reef extends over ~2000 km and encompasses shallow inshore areas and the middle to outer continental shelf [24]. The Great Barrier Reef is the largest extant example of a tropical mixed siliciclastic–carbonate shelf system in the world [25]. It is separated from the offshore plateaus by the Queensland Troughs. The continental shelf in this region is narrowest and shallowest around Australia and occupied by Halimeda banks and shallow coral reefs. Farther to the south, the shelf becomes wider and deeper, where reefs occupy only the mid to outer shelf areas.
Examined points are located around the mid-shelf (~60 km), outer shelf (~373 km), and submarine plateau (~662 km). As observed at other locations, there are dominant semidiurnal tidal (M2, υ2, and S2) and diurnal tidal (K1, P1, and O1) peaks. In the midshelf, however, the quarter-diurnal tidal peak (M4) is relatively stronger compared to other sites. There is also a distinct spectral peak with a frequency of 3.8 cpy corresponding to shallow-water tide MK3 generated by the nonlinear interaction between M2 and K1. Farther away from the coastline (>662 km), the spectra show relatively high power at semidiurnal and diurnal tidal peaks, but the overtidal peaks are significantly weaker.
Figure 7 shows the spectra for three points along T/P-Jason ground track 86, located near the Solomon Islands and Vanuatu. The Solomons are the northern group of islands defining the northeast boundary of the Coral Sea. They are exposed to higher wave energy and high sea-level rise, which causes dramatic coastal erosion in this area. Vanuatu represents the group of islands that lie on the southeast of the Solomon Islands and the western margins of the South Pacific Ocean. These archipelago islands are located in a very shallow and sheltered location reaching ~10 m depth.
The spectrum close to Solomon Islands (~102 km) resembles the spectrum observed close to Vanuatu (~215 km). Both spectra show many diurnal and semidiurnal tidal peaks, with the highest power at K1. There is a distinct spectral peak corresponding to overtide M4 in the Solomon Sea. In the deep water of the Coral Sea, the diurnal tidal peaks in the spectra are similar in size to those observed near Vanuatu and Solomon Sea. However, the semidiurnal and overtidal peaks (e.g., M4) are slightly weaker.
In summary, though the 12 power spectra illustrate different features, most of the computed spectral peaks, over 401 examined points, correspond to the periods expected by the aliasing. The aliasing by the diurnal and semidiurnal signals (e.g., K1, M2, and O1) are dominant in the open ocean area. As we progress toward the coastline, the spectra peak at high-frequency overtides and shallow-water constituents such as M4, MK4, and MK3.

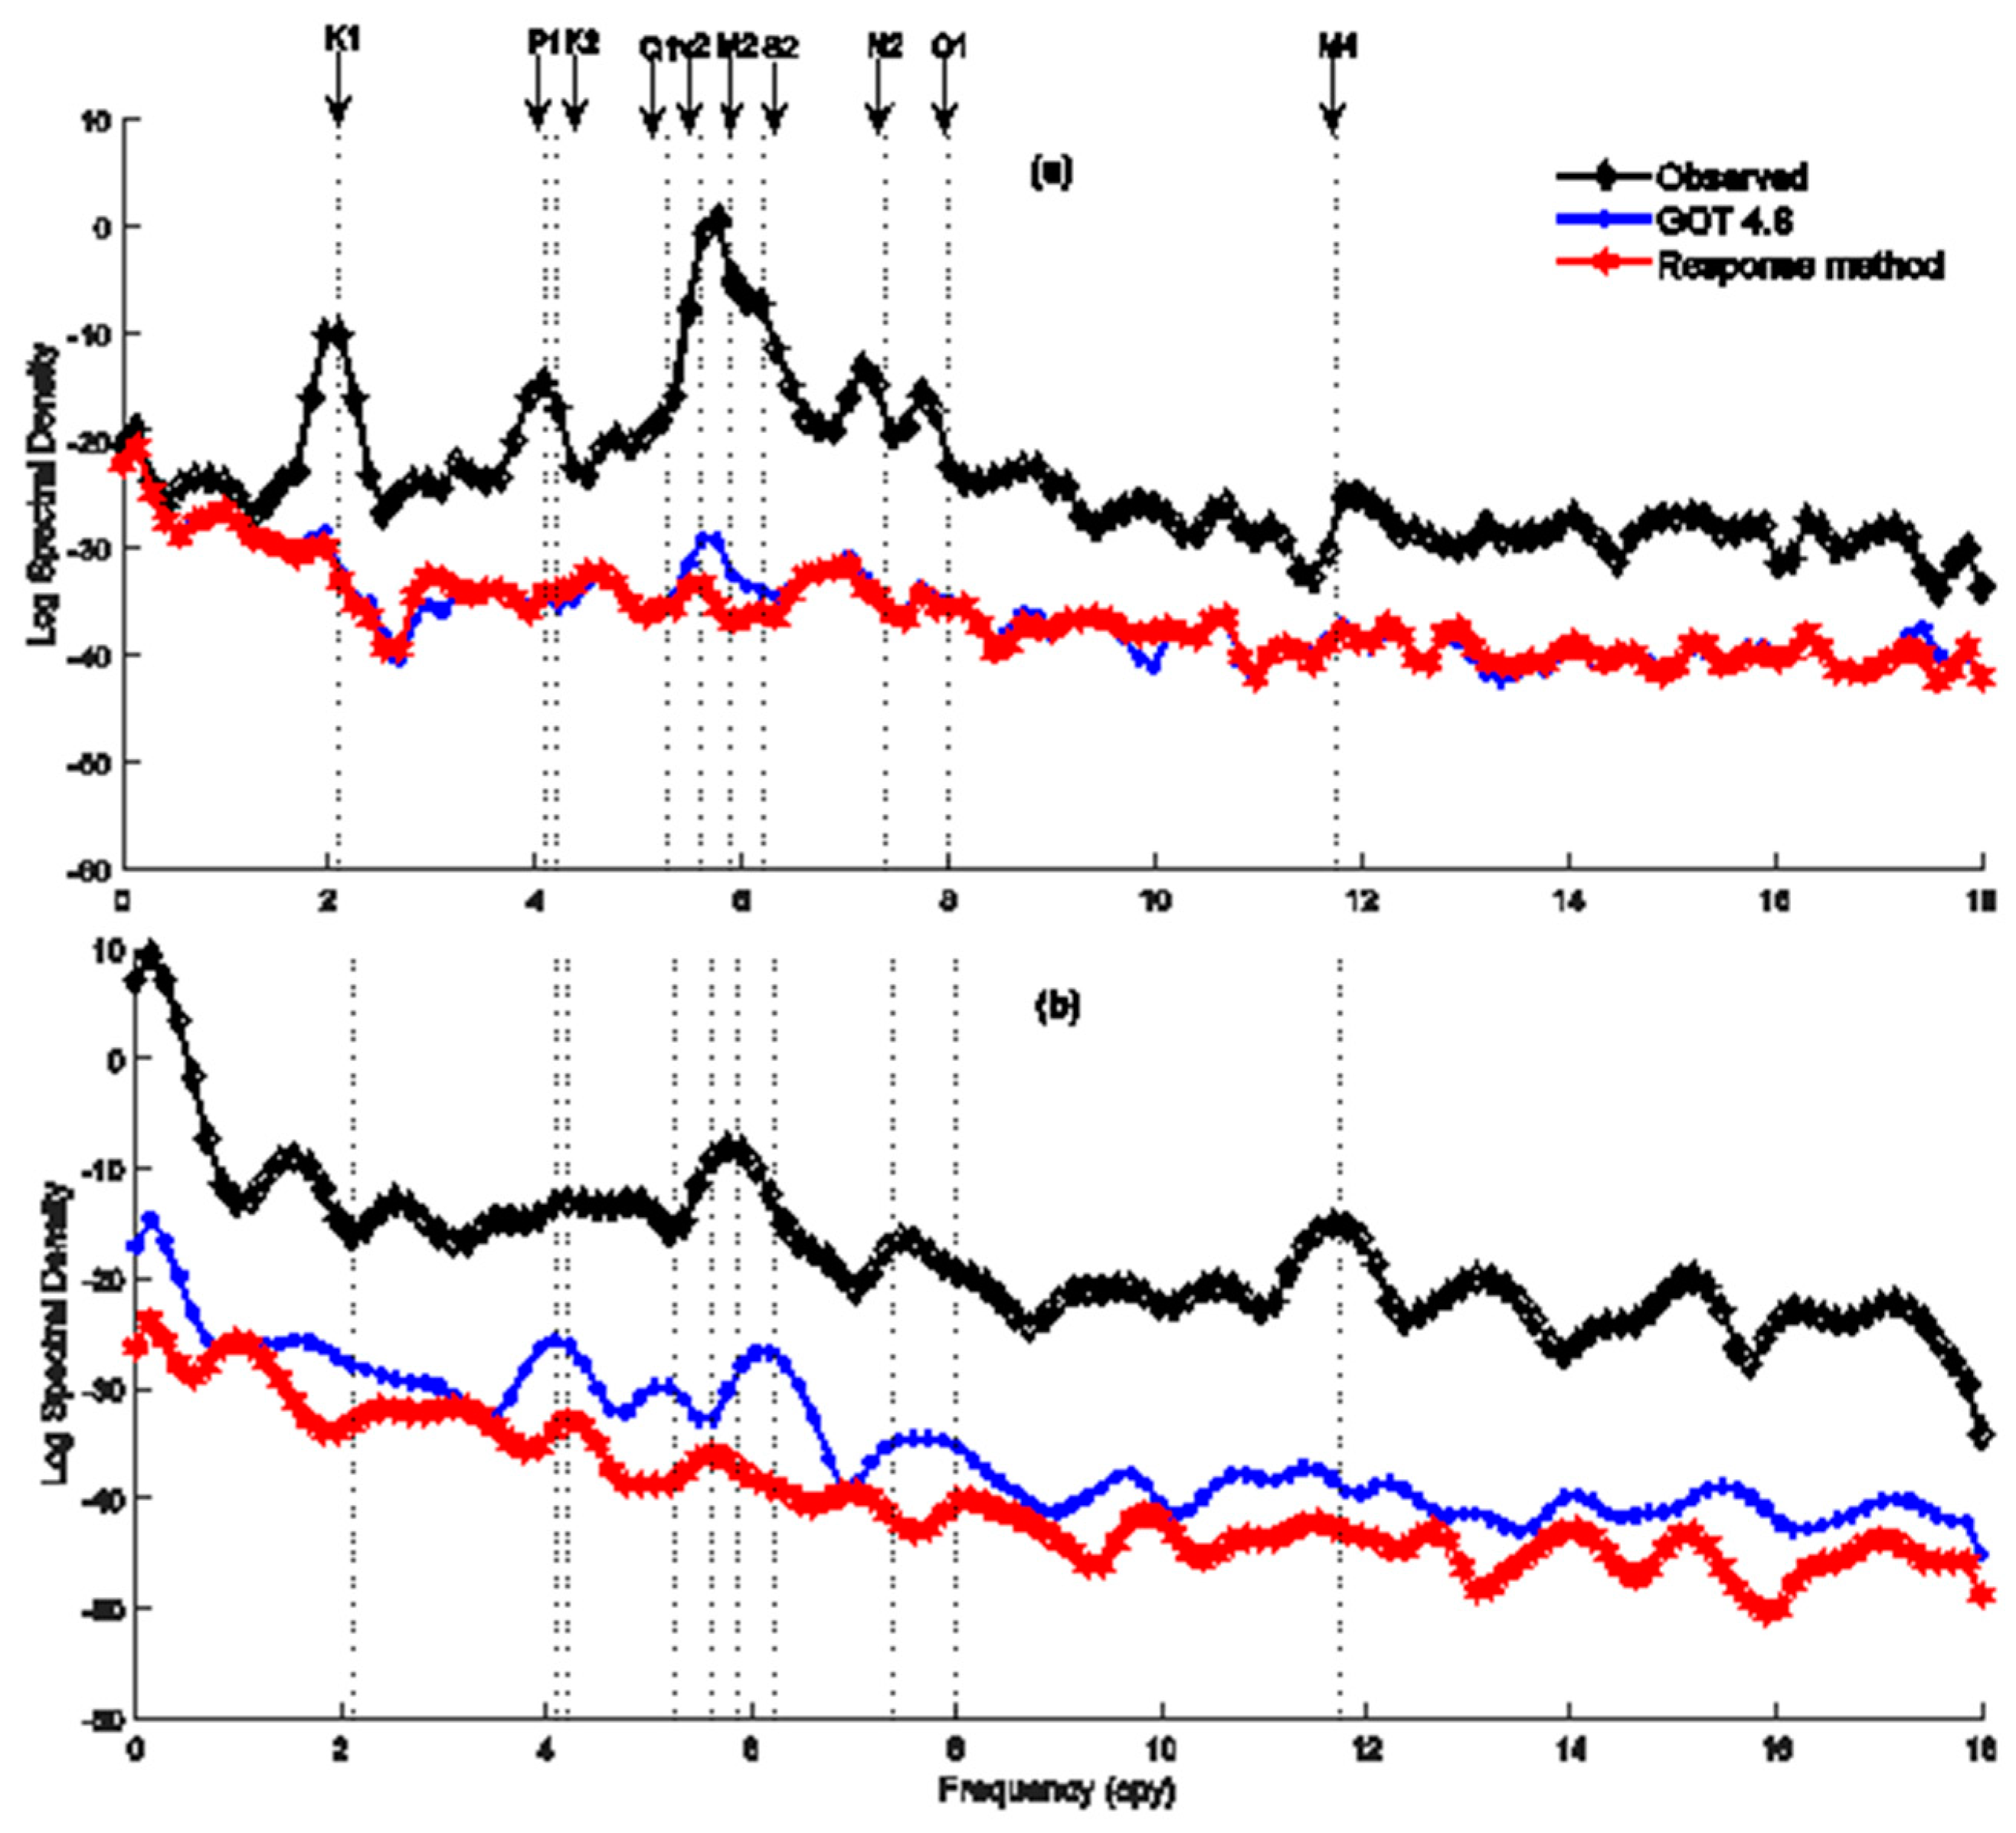
4.2. Spectral Analysis of Tide Gauge Data

The power spectra for the 20-year sea-level data were calculated for 14 sites and are shown in Figure 8 and Figure 9. There are dissimilarities in the spectra from one site to another, linked to the locations of tide gauges. Changes found in the spectra of total wave energy depend on sea-level variability as recorded by sites.
In the spectra for all sites, there is decreased power with increasing frequency. A number of strong, distinct peaks can be found in the low- and middle-frequency bands. Particularly, all have their maximum peak centred at around 1 and 2 cycles per day (cpd), roughly 24 and 12 h, corresponding to the diurnal and semidiurnal tides. Overtidal peaks are mainly at frequencies of about 2.9, 3.9, and 5.7 cpd, corresponding to MS4 (compound of M2 and S2), M4, MK3 (M2 and K1), and M6.
The power spectra for tide gauge stations located on the northeast coast of Australia, Vanuatu, and Solomon Islands are shown in Figure 8. Along the northeast region, tide gauges are located at the Great Barrier Reef shelf, where there is evidence of internal or barotropic shelf edge tides. In the most northern region, Cooktown, Cairns, Cardwell, and Cape Ferguson demonstrate a similar pattern. This area has a narrow continental shelf, which extends roughly 50–100 km offshore. The semidiurnal and diurnal tidal peaks in the spectra are comparable to those observed at other stations. However, all sites have relatively small overtidal peaks, except Cairns, which shows distinct peaks at higher frequency bands.
Farther south along the coast, Rosslyn Bay and Shute Harbour are located where the continental shelf is wider, about 300 km. The low-frequency peaks for these tide gauges are similar to those at nearby Cairns. However, at the higher-frequency band of the spectrum, there are distinct peaks that occur at frequencies of approximately 5.7 cpd, 7.8 cpd, and 9.7 cpd, corresponding to shallow-water and overtidal constituents (e.g., M6 and M8). Similar frequencies were observed in the spectra of altimetry track 251 (Figure 6), located near the Shute Harbour tide gauge station.
Vanuatu and Solomon Islands tide gauge sites are located at Port Vila on the island of Efate and at the end of a pier in Honiara, respectively. Both gauges are relatively sheltered from the open ocean in small basins. It can be seen from Figure 9 that while the major tidal peaks are high in power, the overtidal peaks at these sites are generally smaller. The spectral power is nearly constant at higher frequency ranges.
The power spectra for tide gauges located on the north and northwest coast of Australia are shown in Figure 9. Similar to other stations, there are dominant diurnal and semidiurnal tidal peaks and a number of overtidal peaks, despite the fact that the peaks are relatively higher in comparison to those on the northeast coast, shown in Figure 8. The sea-level spectra of Broome and Port Hedland stations show more strong peaks in the high-frequency band than at any other station. This region has a relatively wide continental shelf, which extends about 500 km from the coastline. The maximum peak corresponds to a semidiurnal tidal band, M2. This region has very large tidal ranges, reaching as high as 10 m between consecutive high and low tides during the spring tides [8]. The results are consistent with the spectral analysis of altimetry track 38, located near the Broome station (Figure 4). Both datasets indicate semidiurnal maximum spectral peaks (M2) and the existence of major compound tides, such as M4.
In respect to the width of the continental shelf, it seems that tide gauge stations located close to narrow shelves (<100 km) are subject to weakening in the low-frequency range and considerable strengthening in the middle and high ranges. Conversely, sites located near wider shelves respond uniformly in each frequency band, showing smaller amplification and attenuation.

4.3. Residual Analysis of De-Tided Sea Level

Power spectral analysis was also performed for de-tided SLAs from altimetry data using the response method (Appendix A) and GOT4.8 (empirical modelling, optionally available through RADS). The PSD curves in Figure 10 clearly outline two tide models performing the same in removing tidal signals in deep ocean areas, with few exceptions. The response method performs slightly better than GOT 4.8 in removing a few tidal signals. In particular, reduced energy occurred for semidiurnal signals with frequencies of 5.88 cpy and 5.60 cpy, which coincide with the frequencies of M2 and υ2.
The difference appears large for the coastal region. Figure 10b illustrates an example of the SLA spectrum in a shallow-water area before and after correcting for tidal frequencies. It is clear from this figure that the response method performed better in removing major tide signals, specifically M2, S2, P1, and K2, from SLAs in shallow water. The results also show that the response method analysis was able to remove compound and shallow-water constituents (e.g., M4). The along-track tide estimates are slightly degraded in shallow water, probably for a number of reasons, including altimetry contamination near the coast. In general, the PSD method can provide estimates of tidal discrepancies and is very straightforward to interpret.

5. Discussion

In this study, we show that altimetry data, despite the low sampling rate, contain valuable information and can be used for tidal prediction. Table 2 provides a comparison between the spectral analysis of tide gauge and altimeter sea-level observations. The tidal analysis results from two datasets were comparable and confirmed the existence of semidiurnal tidal constituents in the northeast and northwest of Australia.
The largest semidiurnal tides at all selected sites were found near Broome and Darwin Station, and the peaks were significantly higher compared to tide gauges located at the northeast coast. In the northeast coast, the results from the Broome tide gauge (Figure 9) were consistent with altimetry track 38 (Figure 4), indicating semidiurnal maximum spectral peaks at M2 and the existence of major overtides such as M4.
In the Gulf of Carpentaria, the dominant tidal constituents were diurnal, overtides, and compound tides including M4, MS4, MK4, and MK3, which makes the tidal prediction complex in this region. The spectra from altimetry and tide gauges were also comparable and illustrated the diurnal tidal plane section.
Overall, using longer time series, we achieved better spectral resolution (especially in higher frequency) from the analysis of tide gauges and altimetry data compared with the previous study in the region with one-year time series of tide gauge data [8].

6. Summary

Power spectral density analysis was applied to identify the number of tidal residuals in altimetry and tide gauge sea-level data. Power spectral analysis of sea level was calculated for 401 points. Sea-level spectra of 12 points along four satellite ground tracks are presented as examples. The spectra of altimetry SLA time series have their strongest peaks centred at approximately 2.11, 5.88, and 7.99 cpy, corresponding to diurnal and semidiurnal tidal constituents K1, M2, and O1, respectively. Closer to the coastline, the spectra peak at high-frequency overtidal and shallow-water constituents M4, MK4, and MK3. There have been many large, high-frequency spectral peaks near the coastline, indicating the difficulty in predicting tidal signals with coastal altimetry.
Similar to altimetry observations, there are dominant semidiurnal and diurnal peaks in tide gauge SLA time series, accompanied by a number of overtidal peaks. The diurnal and semidiurnal peaks are mostly higher in the northwest coast of Australia compared to the north and northeast coast. All spectra display reduced power with increasing frequency. The results indicate that tidal range increases with increasing continental shelf. Minimising tidal prediction errors is crucial in the matter of coastal flood predictions. Such predictions will become more demanding with regard to accuracy given that rapid sea-level rise will increase the threat of storm surge events.

Author Contributions

Conceptualization: Z.G.; Data curation: Z.G.; Funding acquisition: Z.G.; Investigation: Z.G.; Methodology: Z.G.; Project administration: Z.G.; Resources: Z.G.; Software: Z.G.; Supervision: X.D.; Visualization: Z.G.; Writing—original draft: Z.G.; Writing—review & editing: Z.G. All authors have read and agreed to the published version of the manuscript.

Funding

This research was funded by the International Postgraduate Research Scholarship (IPRS) of the University of Newcastle.

Acknowledgments

We would like to thank the anonymous reviewers and editors for their constructive comments on this article. We would like to acknowledge the Radar Altimeter Database System (RADS, http://rads.tudelft.nl/rads/rads.shtml) data team for kindly providing satellite altimetry data. The tide gauge data are taken from the University of Hawaii Sea Level Centre (UHSLC, http://uhslc.soest.hawaii.edu/data/fdh) and the Australian National Tidal Centre (NTC, http://www.bom.gov.au/oceanography/).

Conflicts of Interest

The authors declare no conflict of interest.

Appendix A

Appendix A.1. Response Method

The response analysis method was introduced in [26]. The analysis assumes the concept of smoothness, which means ocean responses to gravitational forces do not contain sharp resonance peaks. This analysis method, which is widely used in electrical engineering, has two clear advantages: (1) it separates the equilibrium tide from the ocean dynamic system; (2) it allows analysis in the spectral domain. The response method processing analysis can be simplified as follows [18]:
P ( t ) = s = S + S w ( s ) v ( t s t )
where P(t) is the tidal measurement at time t, presented as a weighted sum of past and future values of the relevant components of equilibrium tide v; and s is the number of lags, where the lag increment is symbolised by τ. Note that the use of future values of equilibrium tide (negative values of s) is reserved for better illustration of the mathematical concept. It has been suggested that s = 2 and τ = 2 days gives optimum results; thus, Equation (2) can be rewritten as
P ( t ) = w ( 2 ) v ( t 2 τ ) + w ( 1 ) v ( t τ ) + w ( 0 ) v ( t ) + w ( 1 ) v ( t + τ ) + w ( 2 ) v ( t + 2 τ )
The response weight for the first two terms of the above equation (positive lags of +1 and +2) represents the remaining effect of the system response from a previous impulse. Note that the use of future values of equilibrium tide (negative lags of −1 and −2) is reserved for better illustration of the mathematical concept. The admittance of the ocean, in relation to the equilibrium tide, is expressed as a function of frequency through the Fourier transform of the weights:
Z ( w ) = w ( τ ) exp ( i ω τ ) d τ
The discrete form can be written as
Z ( w ) = w ( 2 ) exp ( i ω 2 τ ) + w ( 1 ) exp ( i ω τ ) + w ( 0 ) + w ( 1 ) exp ( i ω τ ) + w ( 2 ) exp ( i ω 2 τ )
After the admittances for each tidal band are determined, the response method can be applied for tidal prediction by using these admittances and the future values of the equilibrium tide.
The obtained admittance function allows a number of minor tides to be inferred by interpolation in the spectral domain, which is assumed to be well defined by the dominant tides. In this way, it is possible to separate tidal constituents with very close frequencies, which are not normally separable from one another by harmonic analysis (e.g., second- and third-degree spherical harmonic tides). Although the response method has fewer parameters to be resolved compared with harmonic analysis, it provides more accurate tidal solutions. Normal response method analysis is designed for linear systems. However, it can be extended to nonlinear equations that describe shallow-water tide propagation [19].

References

  1. Koblinsky, C.J.; Ray, R.D.; Beckley, B.D.; Bremmer, A.; Tsaoussi, L.S.; Wang, Y.M. NASA Ocean Altimeter Pathfinder Project. Report 2; Data Set Validation. 1999. Available online: https://ntrs.nasa.gov/search.jsp?R=19990058149 (accessed on 27 December 2019).
  2. Cherniawsky, J.Y.; Foreman, M.G.G.; Crawford, W.R.; Henry, R.F. Ocean tides from TOPEX/poseidon sea level data. J. Atmos. Ocean. Technol. 2001, 18, 649–664. [Google Scholar] [CrossRef]
  3. Gharineiat, Z.; Deng, X. Description and assessment of regional sea-level trends and variability from altimetry and tide gauges at the northern Australian coast. Adv. Space Res. 2018, 61, 2540–2554. [Google Scholar] [CrossRef] [Green Version]
  4. Erol, S. Time frequency analyses of tide-gauge sensors data. Sensors 2011, 11, 3939–3961. [Google Scholar] [CrossRef] [PubMed]
  5. Manzano-Agugliaro, F.; Corchete, V.; Lastra, X.B. Spectral analysis of tide waves in the strait of gibraltar. Sci. Res. Essays 2011, 6, 453–462. [Google Scholar]
  6. Ozsoy, O.; Haigh, I.D.; Wadey, M.P.; Nicholls, R.J.; Wells, N.C. High-frequency sea level variations and implications for coastal flooding: A case study of the solent, UK. Cont. Shelf Res. 2016, 122, 1–13. [Google Scholar] [CrossRef] [Green Version]
  7. Pirooznia, M.; Emadi, S.R.; Najafi Alamdari, M. Satellite altimetry and coastal tide gauges and tide modeling in the coast of caspian sea. Open J. Mar. Sci. 2016, 6, 258–269. [Google Scholar] [CrossRef] [Green Version]
  8. Allen, S.C.R.; Greenslade, D.J.M. A Spectral Climatology of Australian and South-West Pacific Tide Gauges; CAWCR Technical Report, No. 011; Centre for Australian Weather and Climate Research, a Partnership between the Bureau of Meteorology and CSIRO: Melbourne, Australia, 2009. [Google Scholar]
  9. Gharineiat, Z.; Deng, X. Application of the multi-adaptive regression splines to integrate sea level data from altimetry and tide gauges for monitoring extreme sea level events. Mar. Geod. 2015, 38, 261–276. [Google Scholar] [CrossRef]
  10. Carrère, L.; Lyard, F. Modeling the barotropic response of the global ocean to atmospheric wind and pressure forcing-comparisons with observations. Geophys. Res. Lett. 2003, 30, 1275. [Google Scholar] [CrossRef] [Green Version]
  11. Andersen, O.B.; Knudsen, P.; Stenseng, L. The DTU13 MSS (mean sea surface) and MDT (mean dynamic topography) from 21 years of satellite altimetry. Int. Assoc. Geod. Symp. 2015, 144, 1–10. [Google Scholar]
  12. Dorandeu, J.; Le Traon, P.Y. Effects of global mean atmospheric pressure variations on mean sea level changes from TOPEX/Poseidon. J. Atmosp. Ocean. Technol. 1999, 16, 1279–1283. [Google Scholar] [CrossRef]
  13. Vaniček, P. Approximate spectral analysis by least squares fit. Astrophys. Space Sci. 1969, 4, 387–391. [Google Scholar] [CrossRef]
  14. Trupin, A.; Wahr, J. Spectroscopic analysis of global tide gauge sea level data. Geophys. J. Int. 1990, 100, 441–453. [Google Scholar] [CrossRef] [Green Version]
  15. Welch, P. The use of fast fourier transform for the estimation of power spectra: A method based on time averaging over short, modified periodograms. IEEE Trans. Audio Electroacoust. 1967, 15, 70–73. [Google Scholar] [CrossRef] [Green Version]
  16. Allen, J. Short-term spectral analysis, and modification by discrete fourier transform. IEEE Trans. Acoust. Speech Signal Process. 1977, 25, 235–238. [Google Scholar] [CrossRef]
  17. Nikolaidis, R. Observation of Geodetic and Seismic Deformation with the Global Positioning System. Ph.D. Thesis, University of California, San Diego, CA, USA, January 2002. [Google Scholar]
  18. Pugh, D.; Woodworth, P. Sea-Level Science: Understanding Tides, Surges, Tsunamis and Mean Sea-Level Changes; Cambridge University Press: Cambridge, UK, 2014. [Google Scholar]
  19. Andersen, O.B. Shallow water tides in the northwest European shelf region from topex/poseidon altimetry. J. Geophys. Res. Oceans 1999, 104, 7729–7741. [Google Scholar] [CrossRef]
  20. Wilson, B. The Biogeography of the Australian North West Shelf: Environmental Change and Life’s Response; Elsevier: Boston, MA, USA, 2013. [Google Scholar]
  21. Baker, C.; Potter, A.; Tran, M.; Heap, A.D. Geomorphology and sedimentology of the northwest marine region of australia; Geoscience Australia: Canberra, Australia, 2008. [Google Scholar]
  22. Chivas, A.R.; García, A.; Van Der Kaars, S.; Couapel, M.J.; Holt, S.; Reeves, J.M.; Wheeler, D.J.; Pearson, G.; Switzer, A.D.; Banerjee, D.; et al. Sea-level and environmental changes since the last interglacial in the gulf of carpentaria, Australia: An overview. Quat. Int. 2001, 83, 19–46. [Google Scholar] [CrossRef]
  23. Wolanski, E.; Lambrechts, J.; Thomas, C.; Deleersnijder, E. The net water circulation through Torres strait. Cont. Shelf Res. 2013, 64, 66–74. [Google Scholar] [CrossRef]
  24. Mathews, E.J.; Heap, A.D.; Woods, M. Inter-reefal seabed sediments and geomorphology of the great barrier reef, a spatial analysis. Geosci. Aust. 2007, 9, 140. [Google Scholar]
  25. Fielding, C.R.; Trueman, J.D.; Dickens, G.R.; Page, M. Anatomy of the buried burdekin river channel across the great barrier reef shelf: How does a major river operate on a tropical mixed siliciclastic/carbonate margin during sea level lowstand? Sediment. Geol. 2003, 157, 291–301. [Google Scholar] [CrossRef] [Green Version]
  26. Munk, W.H.; Cartwright, D.E. Tidal spectroscopy and prediction, philosophical transactions for the royal society of london. Ser. Math. Phys. Sci. 1966, 259, 533–581. [Google Scholar] [CrossRef]
Figure 1. Highest astronomical tides (HATs) observed around Australia in 2018. Circles indicate locations of tide gauges around coastlines.
Remotesensing 12 00161 g001
Figure 2. Locations of tide gauges (green stars) and distribution of satellite altimeter ground tracks between 1993 and 2013 used for this study.
Remotesensing 12 00161 g002
Figure 3. Locations of 12 altimetry ground track points considered to study spectral analysis in deep ocean and shallow-water areas.
Remotesensing 12 00161 g003
Figure 4. Power spectral density (PSD) of observed sea level anomaly (SLA) along TOPEX-Jason ground track 38. Points are located at 122°7′54.84″E, 17°45′42.84″S (blue curve), 121°25′53.04″E, 16°0′50.40″S (red curve), and 120°17′60.00″E, 13°5′38.40″S (green curve), around 48 km, 255 km, and 603 km, respectively, from the coast. The aliasing period of the eight main tidal constituents (e.g., M2) and major shallow-water tidal constituent (M4) are shown by arrows.
Remotesensing 12 00161 g004
Figure 5. PSD of observed SLA along TOPEX-Jason ground track 240. Points are located at 138°33′16.20″E, 16°18′16.92″S (blue curve), 138°7′57.36″E, 15°14′9.24″S (red curve), and 137°52′2.64″E, 14°33′23.76″S (green curve), around 60 km, 191 km, and 267 km, respectively, from the coast. The aliasing period of the eight main tidal constituents (e.g., M2) and major shallow-water tidal constituent (M4) are shown by arrows.
Remotesensing 12 00161 g005
Figure 6. PSD of observed SLA along TOPEX-Jason ground track 251. Points are located at 149°8′35″E, 19°44′52.80″S (blue curve), 150°10′48.00″E, 17°19′34.32″S (red curve), and 151°8′32.00″E, 14°53′46.00″S (green curve) around 60 km, 373 km, and 662 km, respectively, from the coast. The aliasing period of the eight main tidal constituents (e.g., M2) and major shallow-water tidal constituent (M4) are shown by arrows.
Remotesensing 12 00161 g006
Figure 7. PSD of observed SLA along TOPEX-Jason ground track 86. Points are located at 158°48′13.00″E, 9°58′4.80″S (blue curve), 162°18′57.26″E, 19°2′42.96″S (red curve), and 160°39′22.68″E, 14°50′44.88″S (green curve) around 102 km, 215 km, and 700 km, respectively, from the coast. The aliasing period of the eight main tidal constituents (e.g., M2) and major shallow-water tidal constituent (M4) are shown by arrows.
Remotesensing 12 00161 g007
Figure 8. PSD of measured SLA from tide gauges located on the northeast coast of Australia, Vanuatu, and the Solomon Islands. Scales are identical in all graphs.
Remotesensing 12 00161 g008
Figure 9. PSD of observed SLA from tide gauges located on the north and northwest coast of Australia. Scales are identical in all graphs.
Remotesensing 12 00161 g009
Figure 10. PSD profiles of observed and de-tided SLAs (after removing tides) as examples of tidal prediction in (a) deep ocean and (b) shallow-water areas. Points are located at 122°7′54.84″E, 17°45′42.84″S (a), and 121°25′53.04″E, 16°0′50.40″S (b). Scales are identical in both graphs.
Remotesensing 12 00161 g010
Table 1. Aliased periods (days) of major semidiurnal and diurnal tidal constituents and shallow-water tidal constituents sampled by TOPEX/Poseidon, Jason-1, and Jason-2 [19]. cpy, cycles per year.
TidePeriod (Hours)Aliasing Period (Days)Aliasing Frequency (cpy)
O125.81945.717.99
P124.06688.924.11
K123.935173.322.11
N212.65849.557.38
υ212.62665.255.60
M212.42162.085.88
S212.00058.776.22
K211.96786.664.22
M46.21031.0511.76
M64.14020.6917.64
MK38.17796.833.8
MK46.088219.601.66
MS46.1031083.940.33
Table 2. Maximum spectral peaks found at three tide gauge stations and their corresponding altimetry data.
Station NameMaximum Peaks From Tide Gauge DataMaximum Peaks from Nearest Altimetry DataDominant Tidal Components
Shute HarbourM2, S2, υ2M2, S2, υ2Semidiurnal
Milner BayK1, O1, P1K1, O1, P1Diurnal and compound
BroomeM2, S2, υ2M2, S2, υ2Semidiurnal
Port VilaM2, K1, S2M2, K1, S2Diurnal and semidiurnal

