Article

Extraction of Information about Individual Trees from High-Spatial-Resolution UAV-Acquired Images of an Orchard

1
International Institute for Earth System Science, Nanjing University, Nanjing 210023, China
2
Jiangsu Provincial Key Laboratory of Geographic Information Science and Technology, Nanjing University, Nanjing 210023, China
3
Collaborative Innovation Center for the South Sea Studies, Nanjing University, Nanjing 210093, China
4
College of Resources and Environment, Shandong Agricultural University, Tai’an 271018, China
*
Author to whom correspondence should be addressed.
Remote Sens. 2020, 12(1), 133; https://doi.org/10.3390/rs12010133
Submission received: 1 November 2019 / Revised: 19 December 2019 / Accepted: 24 December 2019 / Published: 1 January 2020
(This article belongs to the Special Issue Remote Sensing and Decision Support for Precision Orchard Production)

Abstract

:
The extraction of information about individual trees is essential to supporting the growing of fruit in orchard management. Data acquired from spectral sensors mounted on unmanned aerial vehicles (UAVs) have very high spatial and temporal resolution. However, an efficient and reliable method for extracting information about individual trees with irregular tree-crown shapes and a complicated background is lacking. In this study, we developed and tested the performance of an approach, based on UAV imagery, to extracting information about individual trees in an orchard with a complicated background that includes apple trees (Plot 1) and pear trees (Plot 2). The workflow involves the construction of a digital orthophoto map (DOM), digital surface models (DSMs), and digital terrain models (DTMs) using the Structure from Motion (SfM) and Multi-View Stereo (MVS) approaches, as well as the calculation of the Excess Green minus Excess Red Index (ExGR) and the selection of various thresholds. Furthermore, a local-maxima filter method and marker-controlled watershed segmentation were used for the detection and delineation, respectively, of individual trees. The accuracy of the proposed method was evaluated by comparing its results with manual estimates of the numbers of trees and the areas and diameters of tree-crowns, all three of which parameters were obtained from the DOM. The results of the proposed method are in good agreement with these manual estimates: The F-scores for the estimated numbers of individual trees were 99.0% and 99.3% in Plot 1 and Plot 2, respectively, while the Producer’s Accuracy (PA) and User’s Accuracy (UA) for the delineation of individual tree-crowns were above 95% for both of the plots. For the area of individual tree-crowns, root-mean-square error (RMSE) values of 0.72 m2 and 0.48 m2 were obtained for Plot 1 and Plot 2, respectively, while for the diameter of individual tree-crowns, RMSE values of 0.39 m and 0.26 m were obtained for Plot 1 (339 trees correctly identified) and Plot 2 (203 trees correctly identified), respectively. Both the areas and diameters of individual tree-crowns were overestimated to varying degrees.

Graphical Abstract

1. Introduction

Precision Farming (or Precision Agriculture) refers to the observation of crop growth and timely strategic responses to small variations in crop production [1]. Commonly, precision farming aims to have efficient utilization of resources per unit of time and area for achieving targeted production of agricultural produce [2]. As a technology-enabled, information-based, and decision-focused system, precision farming has been successfully applied in field crop production and horticulture, including orchards [3]. Precision farming not only increases production and profits, but also reduces environmental impacts.
Accordingly, remote sensing has been widely applied in the field of precision farming. With the rapid development of remote sensing technology, diverse types of remote sensing data—including multispectral (hyperspectral) satellite remote sensing data, aerial remote sensing data, and Light Detection and Ranging (LiDAR) data—from different sensor platforms have become the data sources of orchard management and monitoring. Additionally, the remote sensing methods that were constructed based on the above data have advantages over traditional manual surveys (which are time-consuming and inefficient), such as a higher spatiotemporal resolution. Though the spatial resolution of the remote sensing data from a satellite platform could be in the decimeter range (e.g., WorldView-4), it is difficult to use these data to monitor the details of individual tree-crowns. However, aerial remote sensing data may provide resolutions at the centimeter level that could precisely observe the individual fruit trees in an orchard. Remote sensing image data from a satellite platform have been extensively applied on a large scale due to their wide coverage and the abundance of spectral information that they provide, such as crop identification [4], fruit crop plantation mapping [5], crops acreage estimation [6], and individual tree detection [7]. Recently, various machine learning methods have also been applied in the management of individual trees. However, the major focus is tree detection and counting [8,9,10]. Commonly, the input into these methods requires a training dataset to be built, which is time-consuming and laborious. Satellite remote sensing image data are relatively difficult to use to monitor horticultural crop structure parameters at the level of individual trees.
In contrast, aerial remote sensing data and LiDAR data have been used to derive individual tree structure parameters in orchards. LiDAR data can be used to estimate geometrical and structural parameters accurately, and most studies are focused on deriving structural parameters, such as leaf area and canopy volume, based on data processing and high-resolution, three-dimensional (3D) modeling [11]. Additionally, these data can also be used to detect individual trees and estimate tree height [12]. However, the acquisition of LiDAR data is more costly and has higher operational complexity than the acquisition of aerial remote sensing data, particularly aerial remote sensing data from unmanned aerial vehicles (UAVs). UAVs have been employed in precision farming studies due to their high flexibility and low price [13]. Additionally, UAVs can allow for closer monitoring of plants and provide spatial sensory information at a higher resolution [14]. Studies have shown that UAV-based remote sensing data can be applied to many aspects of precision farming, including biomass monitoring [15], measuring a canopy’s structure and condition [16], irrigation detection [17], quantifying pruning impacts [18], and tree parameter evaluation [19].
In the monitoring of orchards, measurements of an individual tree’s parameters, such as tree-crown characteristics, are essential to monitoring the dynamics of fruit tree growth and optimizing orchard management [20,21]. Additionally, precise knowledge of the shape, size, and spatial distribution of a tree canopy and quantifying the structure of individual trees in orchards allow for the selection of appropriate horticultural techniques, such as the precise method for the application of fertilizer and irrigation [22]. Traditionally, trees in orchards are planted in fixed planting patterns with a fixed spacing, and accordingly remote sensing can increase the speed and effectiveness of precision management.
Recently, remote sensing data obtained from UAVs—primarily multispectral data—have been used to monitor fruit trees to inform orchard management. In order to extract information about individual trees from UAV images, it is necessary to eliminate the background of the image as much as possible. This background consists mostly of bare soil, shadows, background vegetation (such as weeds and dwarf shrubs), and other ground targets (such as well houses and other artificial objects). The remote sensing image data from UAVs that are used in most existing studies that derive the parameters of fruit trees not only contain the red band, green band, and blue band, but also contain the Near Infrared (NIR) band [23,24,25]. The NIR band can be used to effectively distinguish vegetation in an image. Under these circumstances, one of the main purposes of this study is to establish a method that uses remote sensing image data that only contain the red band, green band, and blue band in order to derive individual tree parameters more precisely.
Typically, the characterization of individual trees in orchards based on images from UAVs involves the estimation of tree numbers [26,27], tree height [28,29], and tree-crown parameters [21,29], which provide key indicators of plant growth [18] and plant yield [30] as well as for the assessment of pruning effects [24]. The most important parameters for the characterization of individual trees in orchards require the detection of individual trees and the delineation of individual tree-crowns. The detection of individual trees is performed in order to count the number of trees in the field, whereas the delineation of individual tree-crowns is performed to estimate tree-crown parameters.
The processing of images obtained from UAVs using photogrammetric processing techniques, including Structure from Motion (SfM) and Multi-View Stereo (MVS), can enable the production of many advanced data products, such as three-dimensional point clouds, digital orthophoto maps (DOMs), digital elevation models (DEMs), digital surface models (DSMs), and digital terrain models (DTMs) [31]. All of these data products represent basic data for the characterization of individual trees. The study areas of the abovementioned studies include oil palm orchards, chestnut orchards, olive orchards, peach orchards, lychee orchards, citrus orchards, and mango orchards. Most of these orchards do not have a complex natural environment, which means that the backgrounds of the UAV-based images acquired in these orchards are uniform or easy to distinguish.
In this study, we propose an original method that allows for more accurate long-term precision management of fruit tree orchards. This method involves the detection of individual trees, the delineation of individual tree-crowns, and the estimation of individual tree-crown parameters. Our study areas are two neighboring apple and pear tree plots in an orchard. First, we used the SfM and MVS approaches to derive a digital orthophoto mosaic (DOM), a digital surface model (DSM), a digital terrain model (DTM), and a digital height model (DHM) based on the UAV images. Then, height threshold segmentation based on the DHM and the ExGR index based on the DOM were combined to eliminate the impact of the image’s background. Subsequently, we used the local-maxima filter method and marker-controlled watershed segmentation to detect individual trees and delineate individual tree-crowns, respectively. Then, the number of trees was counted and the areas and diameters of tree-crowns were calculated. We tested the accuracy of the results generated by the proposed method against the reference data. The specific aims of this study are as follows: (1) to construct an original method to extract individual tree parameters that eliminates the influence of the image’s background; (2) to validate the accuracy of this method in terms of the detection of individual trees in an apple orchard and a pear orchard using a local-maxima filter; (3) to access the accuracy of this method in terms of the delineation of individual trees in the same two orchards; and (4) to assess the accuracy of this method in terms of the estimations of tree-crown area and tree-crown diameter.
The paper is organized as follows. Section 2 describes the study areas, the data’s acquisition, the proposed method, and the validation method. Section 3 shows and reports the results that were obtained using the proposed method. Section 4 is devoted to a discussion, and Section 5 presents our conclusions.

2. Materials and Methods
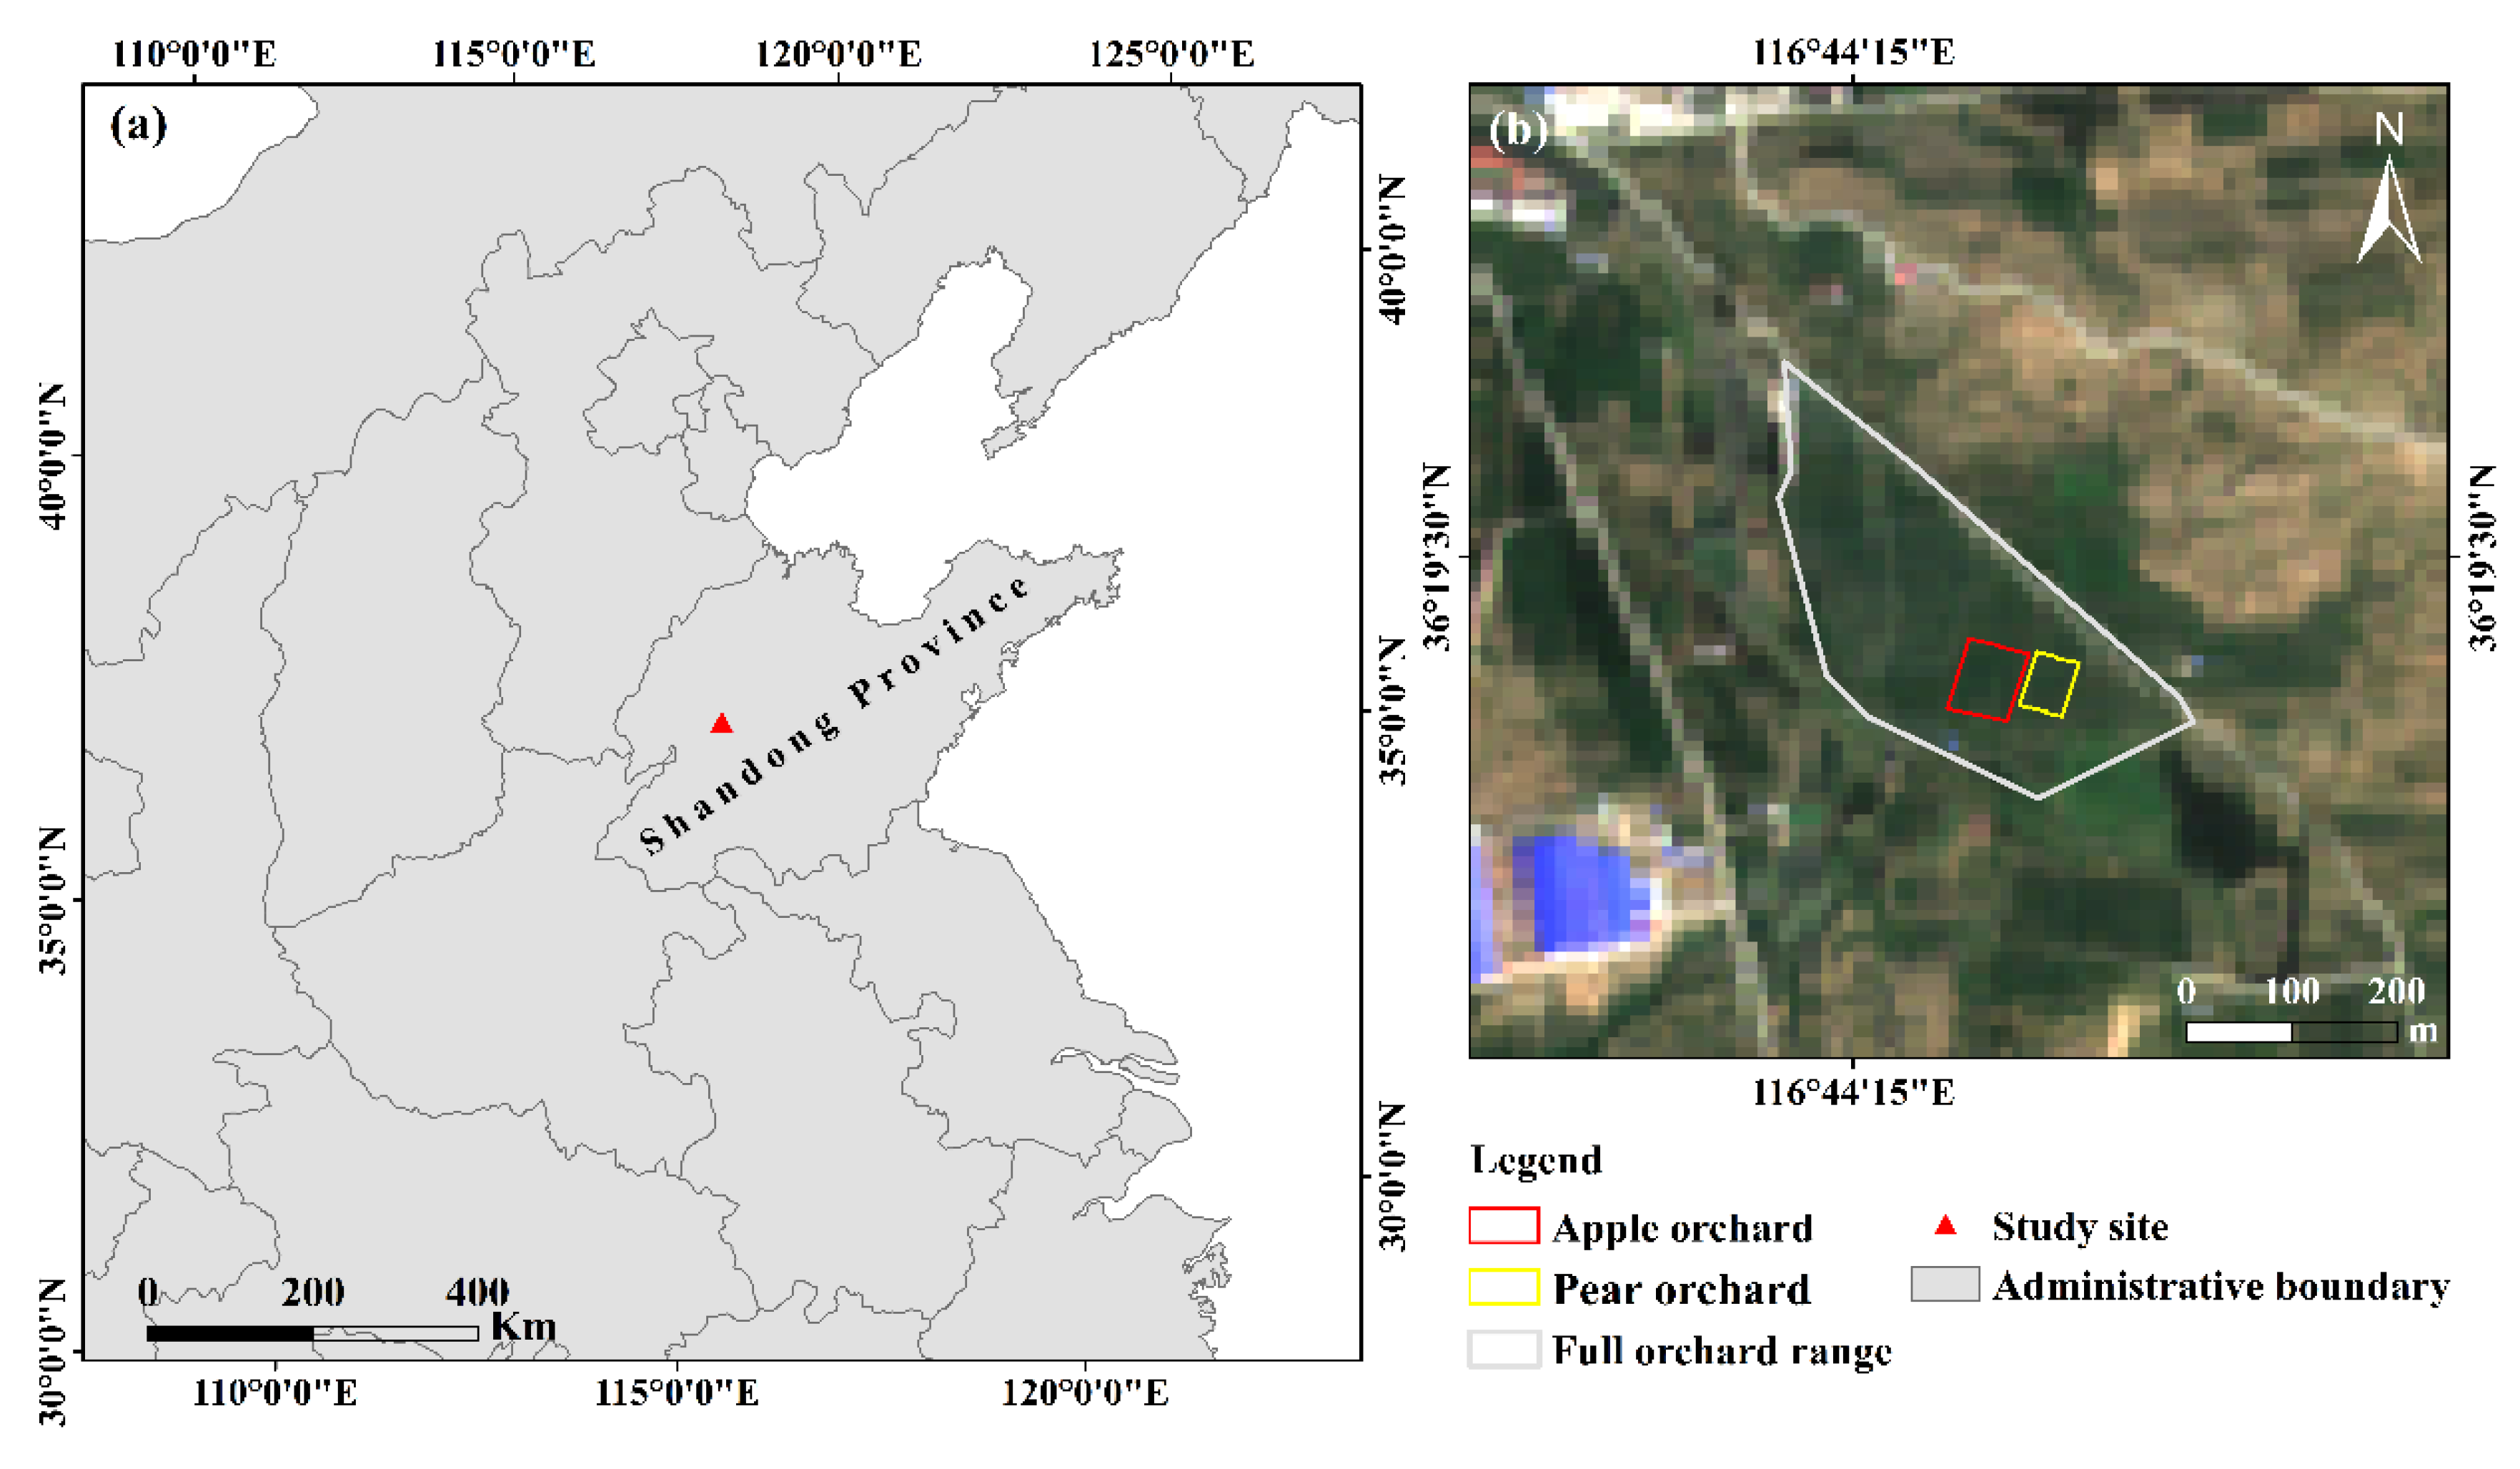
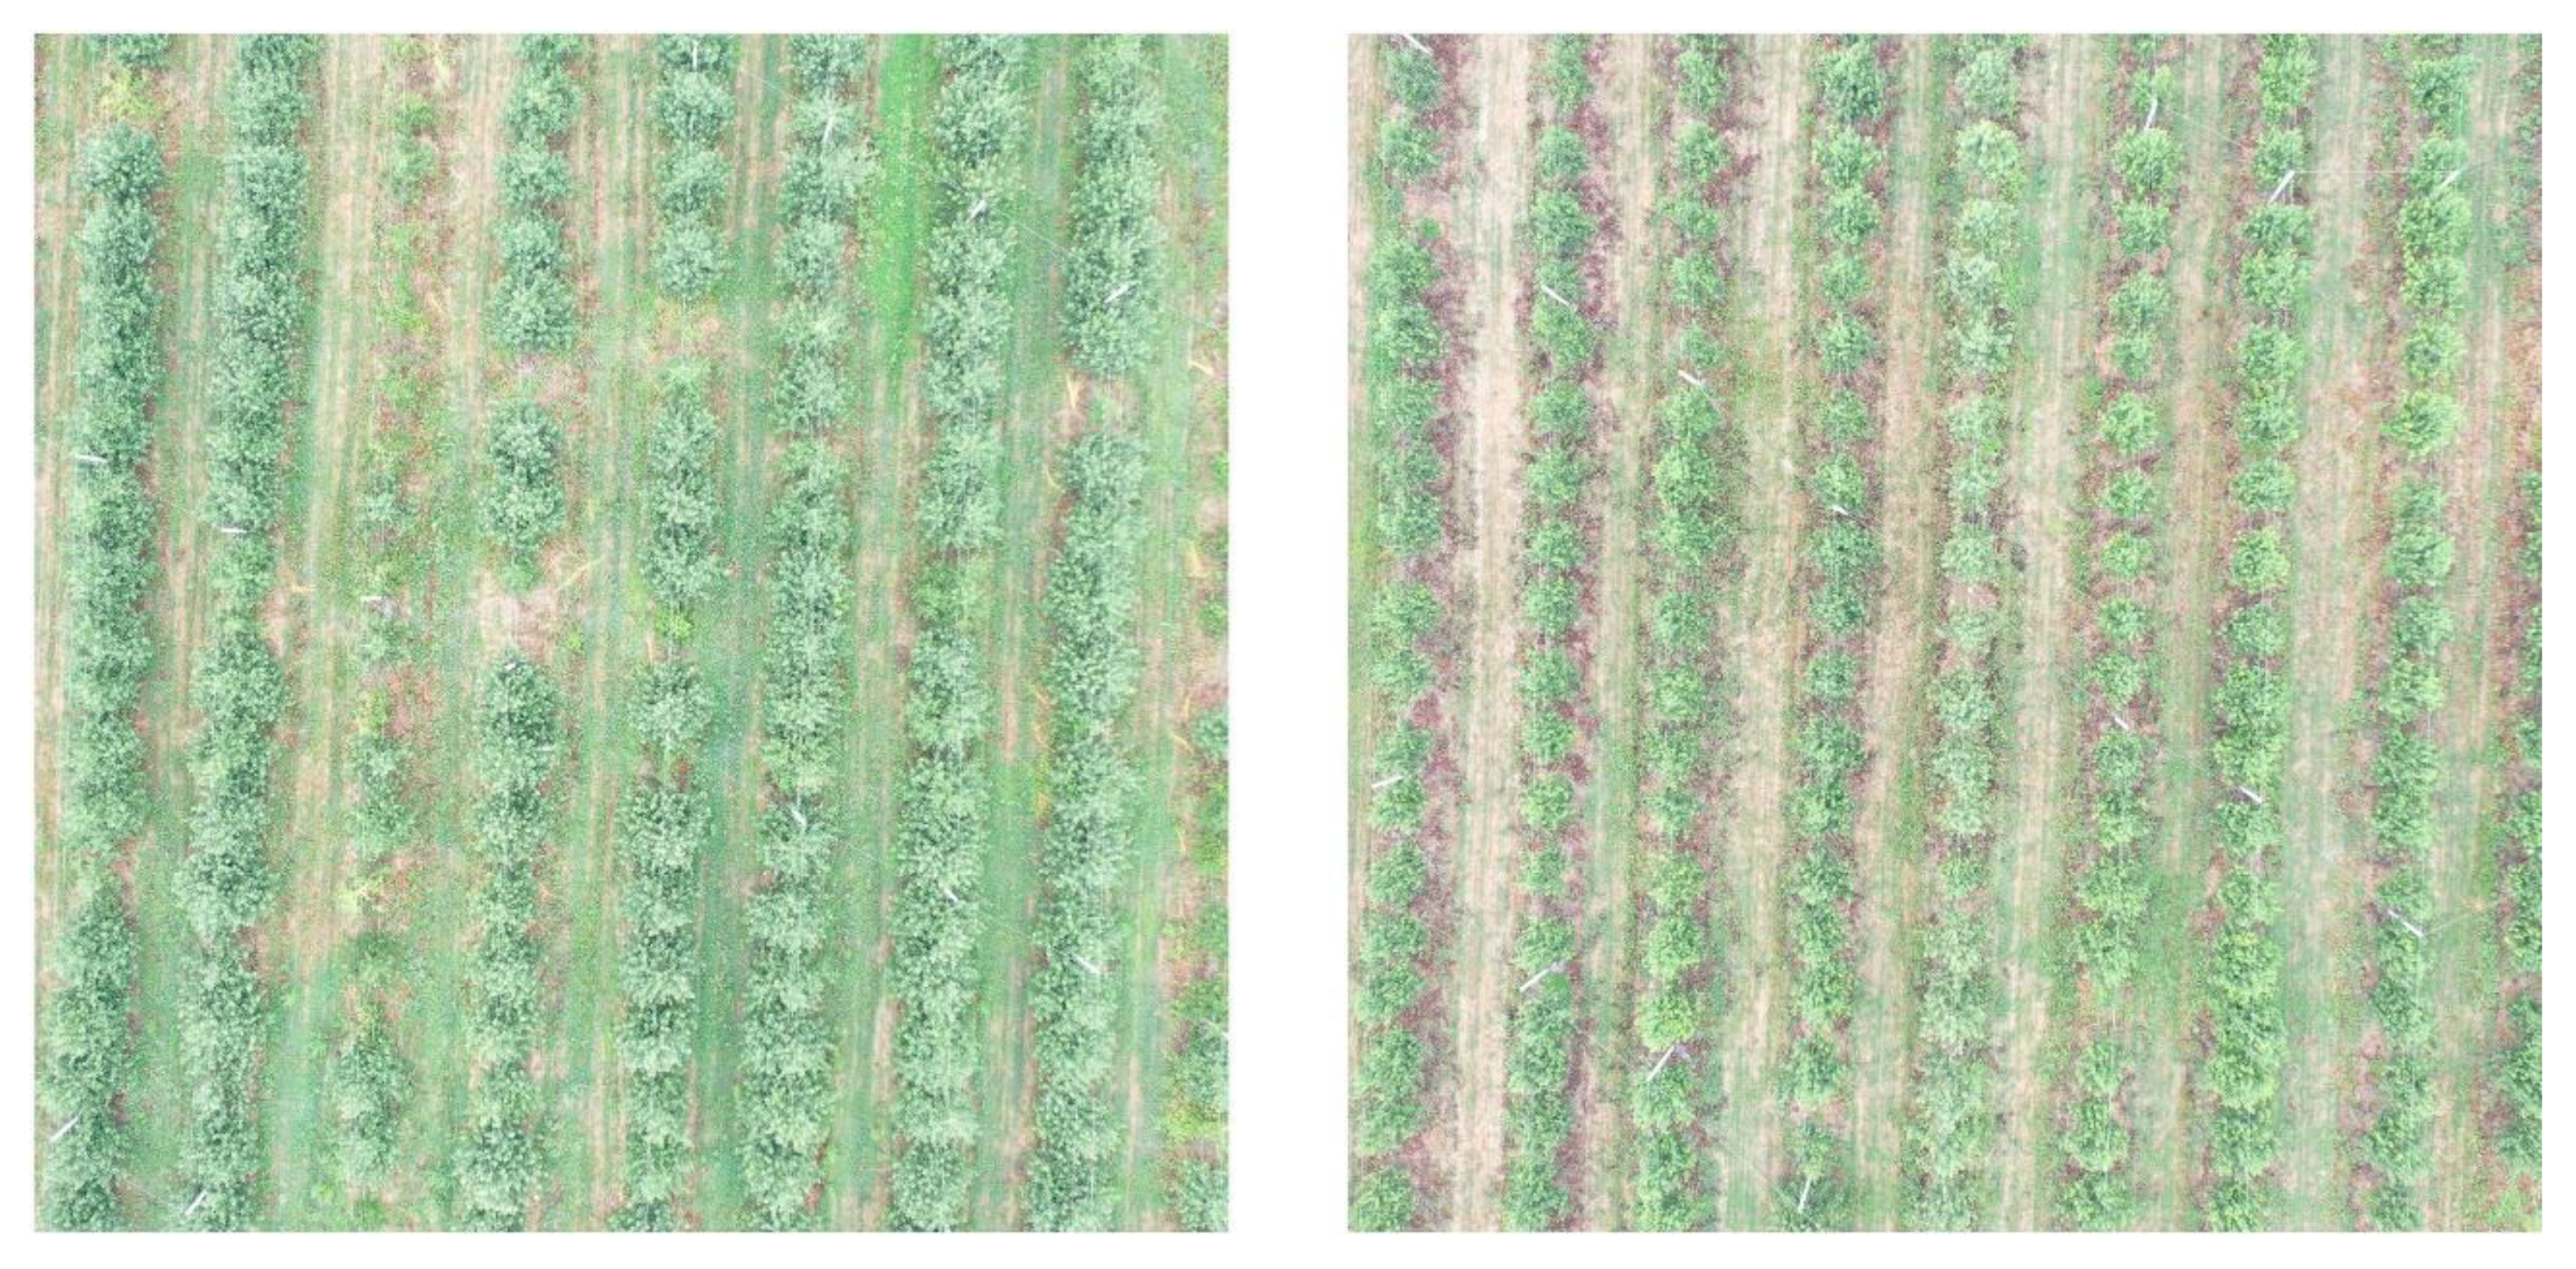
2.1. Study Areas

The study areas are located in Jinan city, Shandong Province, Eastern China (36°19′27.97″N, 116°44′39.19″E; Figure 1). The study was conducted in an orchard that contains two neighboring apple and pear tree plots (Figure 2. The study areas consisted of a plot containing apple trees (Plot 1) and a plot containing pear trees (Plot 2) (Figure 2). The total areas of Plot 1 and Plot 2 were 3196.35 and 1778.69 m2, respectively. All of the fruit trees were planted with a fixed spacing in the spring of 2015. The row spacing and the plant spacing of the apple trees were 4 m and 1.5 m, respectively, and those of the pear trees were 4.5 m and 2 m, respectively. Besides the fruit trees, both of the plots contained weeds within 50 cm of the land surface below the tree canopy. Additionally, there were many discontinuous soil patches across the two plots. The branches of the apple trees (i.e., in Plot 1) were disordered, and the branches of adjacent trees crossed one another. Conversely, most of the branches of the pear trees (i.e., in Plot 2) did not cross the branches of adjacent trees. Scientific management measures and techniques, such as irrigation and fertilization, were regularly adopted in the orchard to ensure the healthy growth of fruit trees and the maximization of fruit yield.

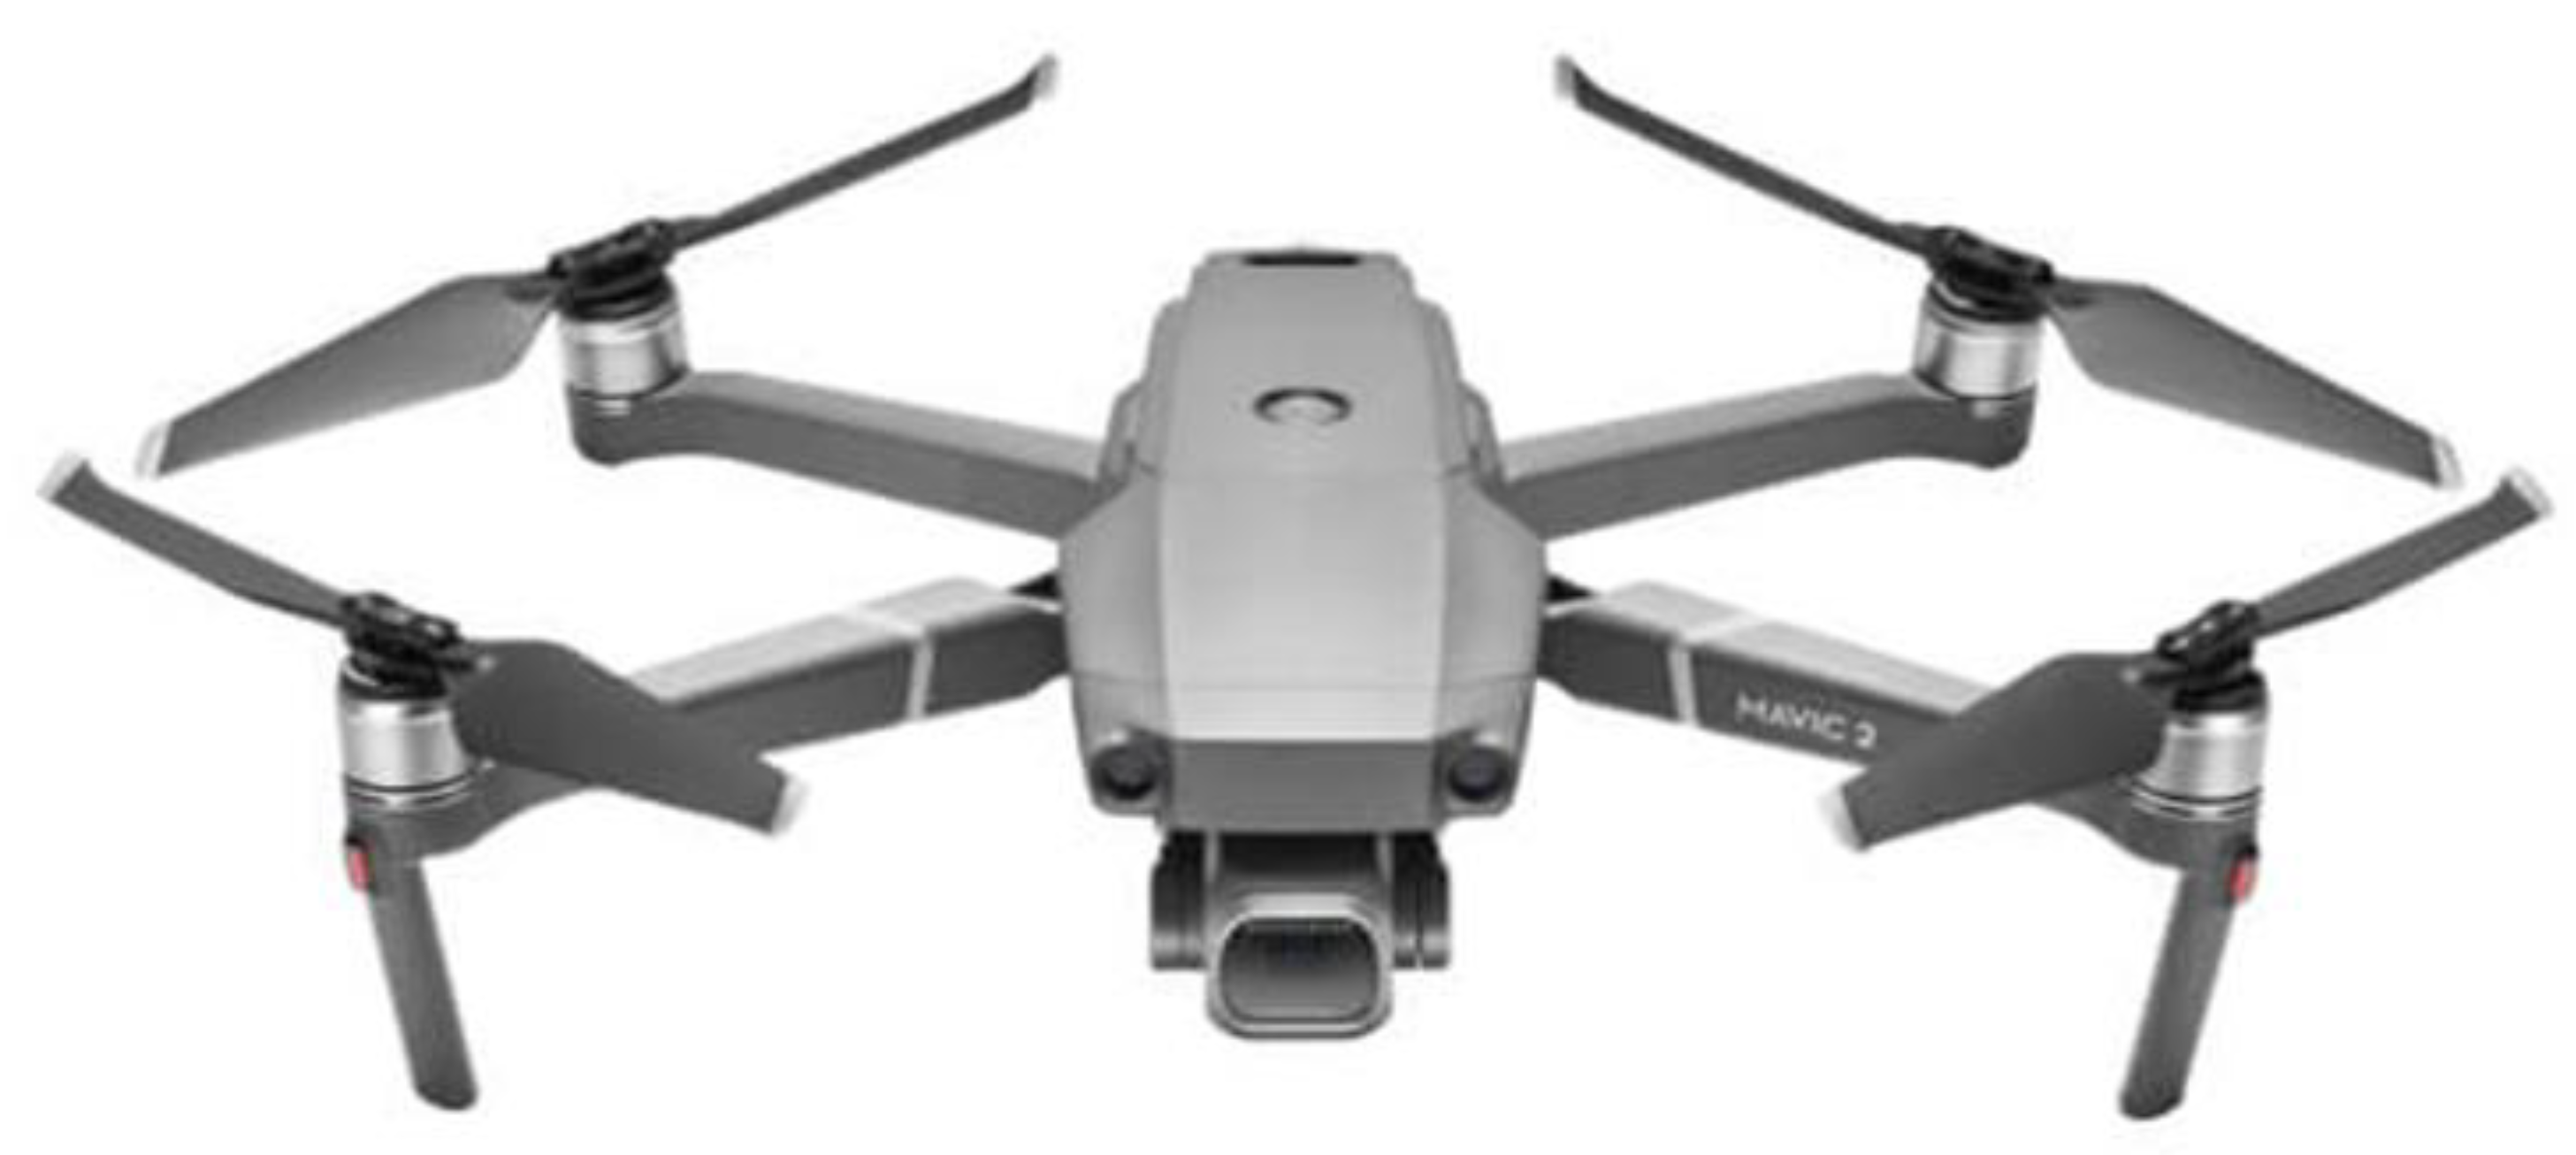
2.2. Acquisition of Images by UAV

Images of the two study areas were obtained using a commercially available UAV, namely a quad-rotor DJI Mavic 2 Pro (DJI Corporation, Shenzhen, China). An image of the UAV is shown in Figure 3. The UAV was powered by a rechargeable battery, which allowed for a continuous flight time of almost 30 minutes, and was equipped with a Complementary Metal Oxide Semiconductor (CMOS) camera (DJI Corporation, Shenzhen, China; Hasselblad, Gothenburg, Sweden). The specifications of the UAV and camera are shown in Table 1. The images were acquired during a flight in July 2019. As the UAV flew over each plot, it maintained a height of 50 m above the tree canopy and a low speed of 3 m/s on average, and the camera collected data automatically by vertical photography at an interval of 2 s. Considering the accuracy of the data, we set the side-overlap of the flight lines to 80% and the frontal-overlap of the flight lines to 85%. The remaining parameters were all set to their default values. Finally, the UAV-acquired images were saved in 24-bit standard red green blue (sRGB) format at a size of 5472 × 3648 pixels.
During the images’ acquisition, the flight schedule was set to 10:00–13:00 local time in order to ensure good lighting conditions. The weather conditions during the flights were advantageous for the experiment, being calm and cloudless; therefore, there was little random error and interference due to weather conditions.

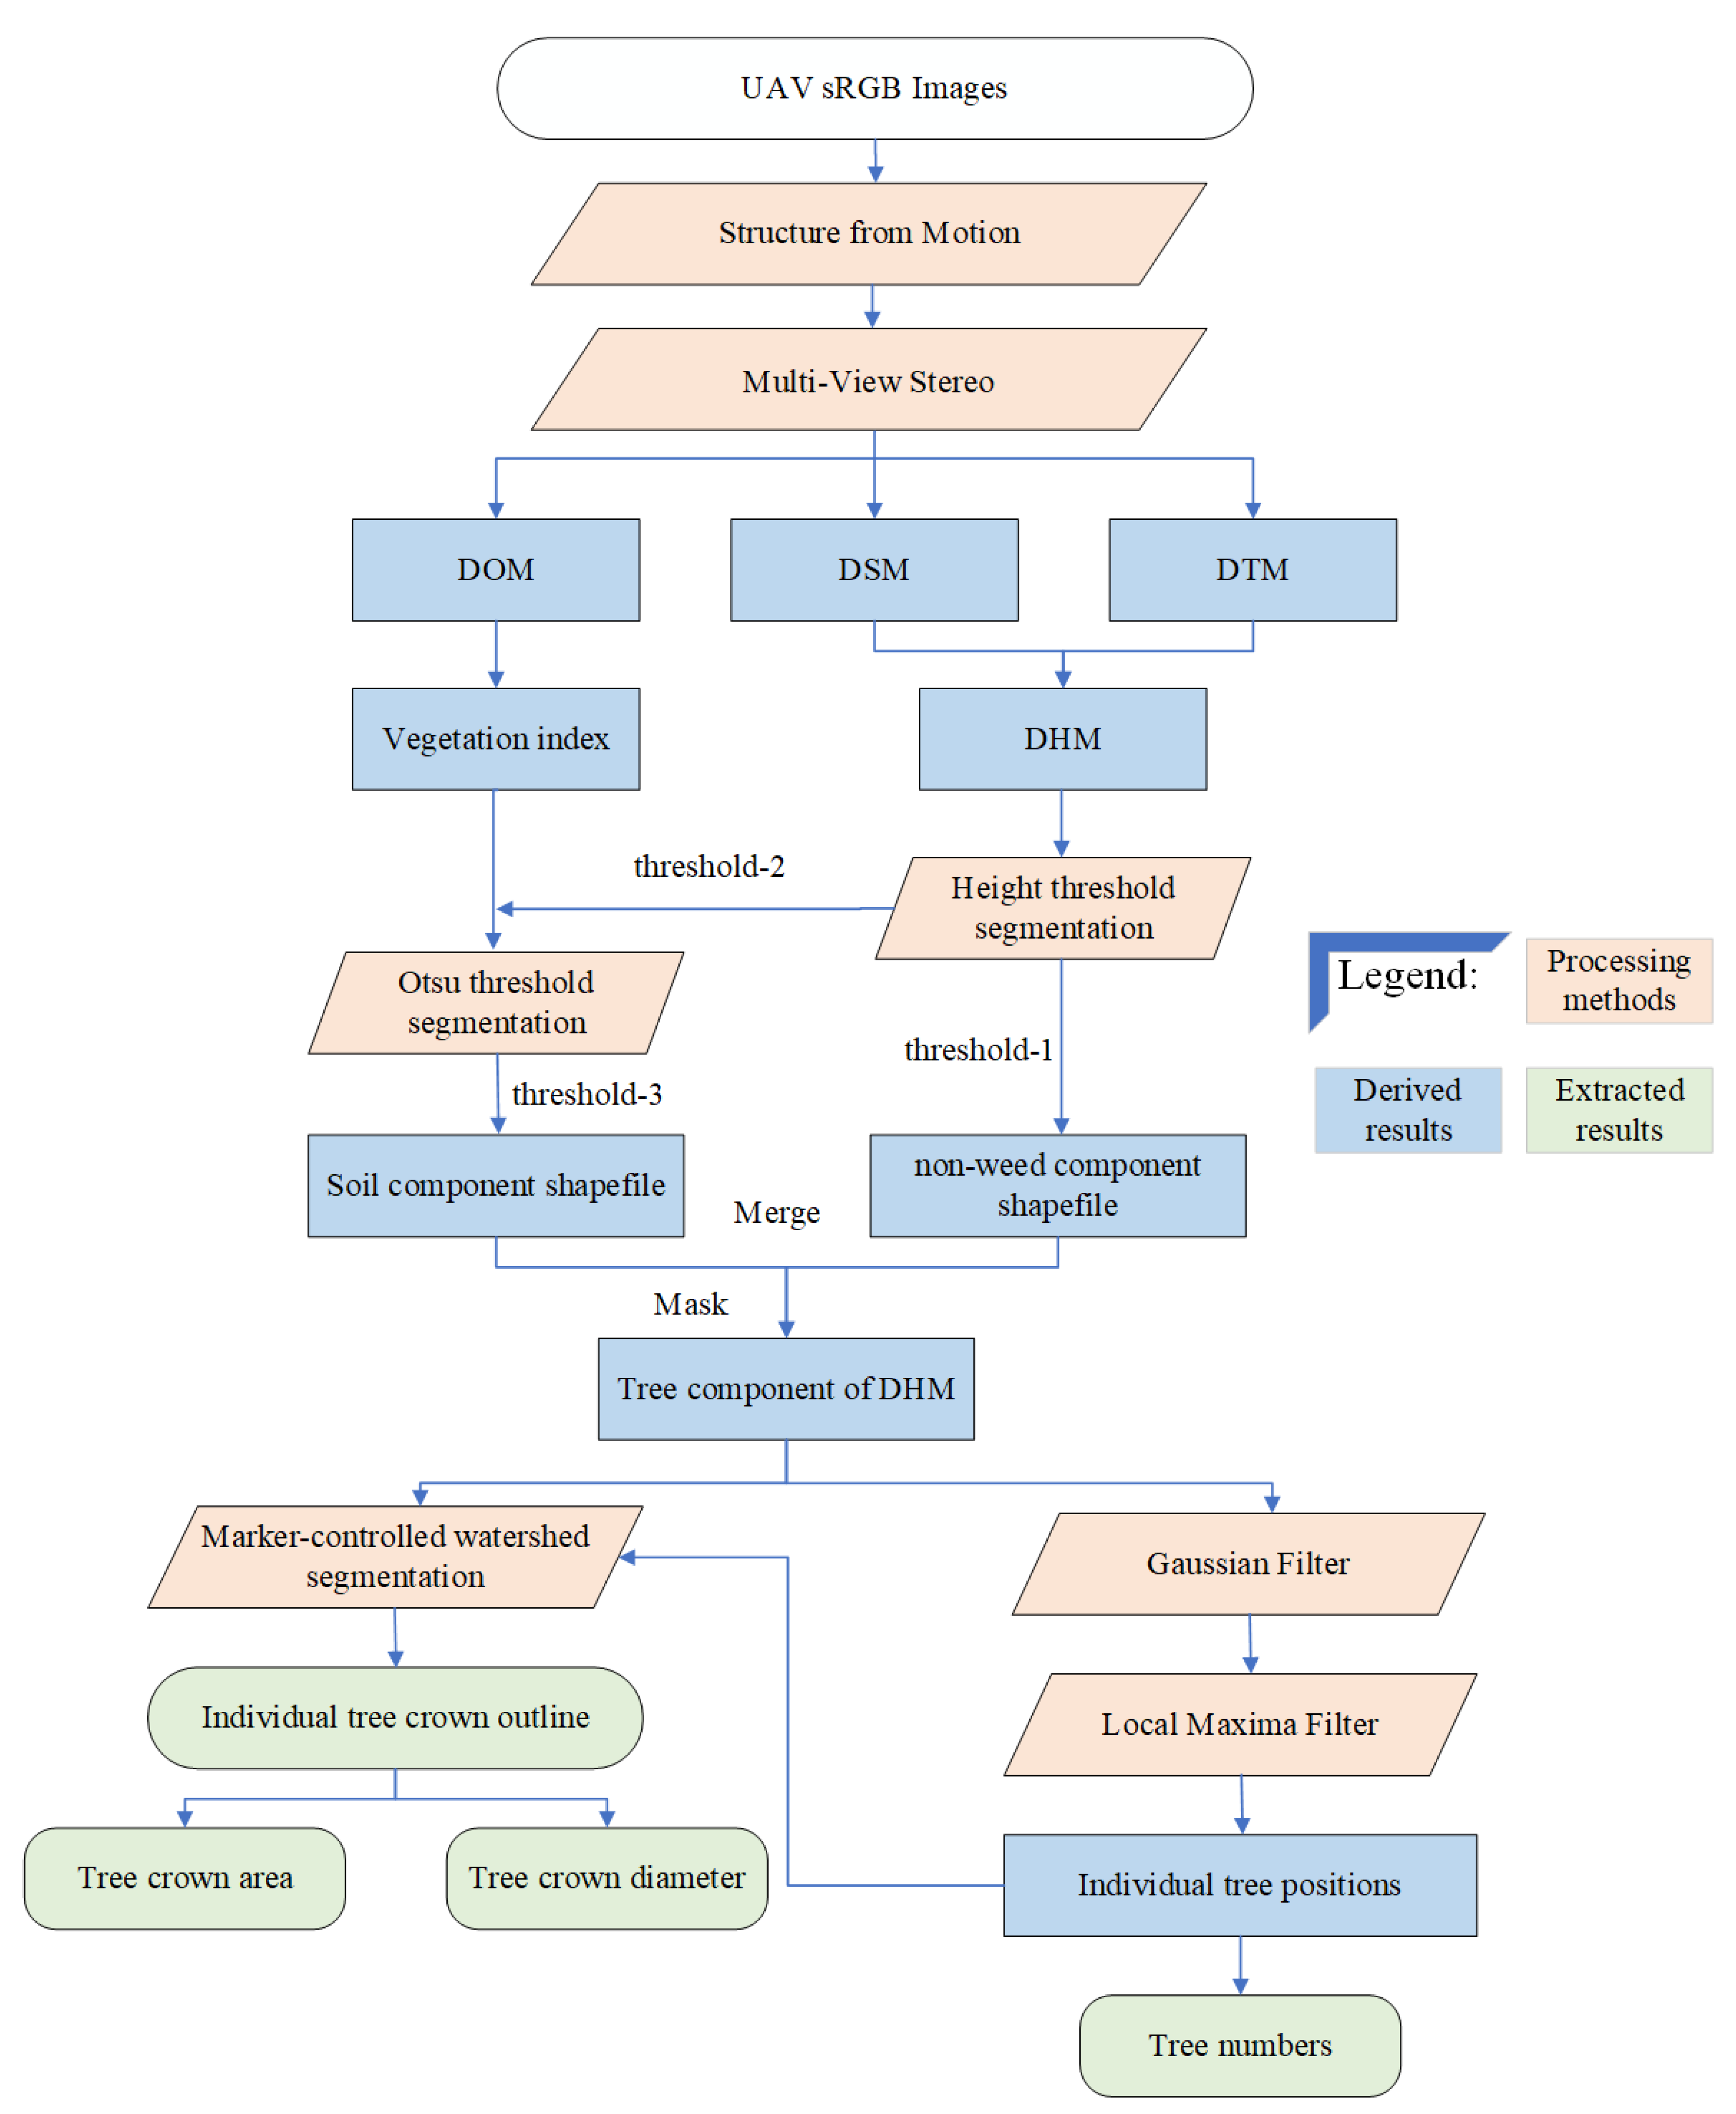
2.3. Proposed Method

The framework of the proposed method is presented schematically in Figure 4. The figure shows the main parts of the processing methods, the derived results, and the extracted results. All of the processing steps were conducted using a desktop computer equipped with an Intel®Core™ i7-8700 central processing unit (CPU) and 16 GB of random access memory (RAM).

2.3.1. Image Processing

The SfM and MVS approaches were used to perform multi-image 3D reconstruction from two-dimensional (2D) image data. The SfM and MVS approaches that are integrated into the Pix4Dmapper version 4.5.2 software (Pix4D, Lausanne, Switzerland) were used to process the UAV-acquired images in order to produce DTMs, DSMs, and DOMs. The settings for the processing steps are shown in Table 2.
When all of the images had been loaded, the first processing stage involved aligning the images by matching specific features (known as keypoints) that were present in all of the images. This process was performed automatically by the Pix4Dmapper software to create tie points in order to establish a baseline for the next processing stage. In the second processing stage, a densified point cloud and a 3D textured mesh were produced. Then, a DSM was created based on the point cloud generated in the previous stage; the inverse distance-weighting method was chosen for this step. Additionally, a DOM was generated at the same time as the DSM; the DOM was generated using orthorectification, which removes perspective distortions from the images. Furthermore, a DTM was generated based on the DSM using the independent module in the Pix4Dmapper software. The ground sample distance (GSD) of the DTM was set to 5 times the GSD of the DOM; the GSD of the DOM was chosen based on the optimal value that was determined using the Pix4Dmapper software.
Additionally, a digital height model (DHM) was generated by subtracting the DTM from the DSM (i.e., DHM = DSM − DTM); this represents the information about the height of the objects above the land surface. The DSM represents the height of the natural surface features, and the DTM is a mathematical representation of the ground surface that contains terrain elevation data in the form of a rectangular grid in which a unique elevation value is assigned to each pixel. The DOM, DSM, DTM, and DHM formed the basis for the remaining processing steps.

2.3.2. Separation of Vegetation and Soil

The main components of the study plots are fruit trees, weeds, and soil. The unobvious shadow component was not considered in this study due to the idealized experimental environment, since the more highly transparent the air is, the greater the intensity of direct solar radiation, such that the shadows of trees are not obvious on the ground. The presence of soil can influence the accuracy of the identification of individual trees. Therefore, in the DOM, we classified the vegetation—that is, fruit trees and weeds—as the foreground, and classified the soil as the background.
Previous studies have used several vegetation indices based on UAV-acquired RGB images; examples are the Excess Green Vegetation Index (ExG) [32], the Excess Green minus Excess Red Index (ExGR) [33], the Excess Red Vegetation Index (ExR) [34], the Normalized Difference Index (NDI) [35], and the Green–Red Vegetation Index (GRVI) [36]. Recently, these vegetation indices have been widely used for the identification of vegetation, under the assumption that vegetation is a strong green color and the background only consists of bare soil, and their validity has been proven [37]. Meyer et al. [38] showed that the ExGR has an especially high vegetation separation accuracy when using digital color images acquired in natural light. Therefore, in this study, the ExGR (Equation (1)) was used to enhance vegetation information.
ExGR = ExG ExR ,
ExG = 2 × g r b ,  
ExR = 1.4 × r b ,
where r, g, and b are the pixel values of the red band, green band, and blue band of the DOM, respectively.
After computing the ExGR index, Otsu threshold segmentation was used to separate the vegetation and soil by determining a pixel-value threshold. As a threshold segmentation method, Otsu has good performance, and the optimal threshold value was determined by calculating the minimum intra-class variance and maximum inter-class variance using only the gray level histogram of the image [39]. Many pixels around the tops of tree-crowns were classified as soil due to their high digital number (DN) value, which was close to the DN value of soil. This is mainly due to the fact that the treetop area has a higher reflectance than the lower and middle parts of the tree-crown. Hence, before we applied the Otsu threshold segmentation method, we performed height threshold segmentation on the DHM to mask the treetop area in order to avoid confusion between the pixels of the treetop area and the pixels of the soil area. Height threshold segmentation uses a threshold that represents the height value of the DHM to segment the DHM. Finally, only the shapefile result of the soil component in the DOM was derived in this section. The processing steps were conducted using the MATLAB R2019a (MathWorks, Natick, MA, USA) and ENVI version 5.3 (Exelis, Boulder, CO, USA) software.

2.3.3. Detection of Individual Trees

Information about the position of individual trees was extracted using the tree component of the DHM by using a local-maxima filter method. This method uses the spectral characteristics of the tree-crown area, and requires at least one or more local-maxima pixels around the tree-crown in the grayscale image, because there must be one or more pixels around the tops of tree-crowns to exhibit a specular reflectance that produces a high DN value.
In this study, before implementing the local-maxima filter, a Gaussian filter was used to smooth the DHM in order to eliminate heterogeneity in the DHM as much as possible. Then, the local maxima that were classified as treetops were identified in the DHM by using the local-maxima filter. When using the local-maxima filter, the min_distance parameter was set manually in order to ensure that an appropriate number of local-maxima pixels was obtained over the whole image. The x-positions and y-positions of the local-maxima pixels in the DHM were extracted and saved as .txt files. All of the above processing steps were implemented using the Python version 3.7 programming language. Then, a shapefile representing the positions of local-maxima pixels was generated by vectoring the .txt files using the ArcGIS version 10.6 software (ESRI, Redlands, CA, USA), and each tree was marked with a unique ID number. Finally, the number of elements in the shapefile was taken as the number of fruit trees within the plot.

2.3.4. Extraction of Tree Components from the DHM

As well as separating the vegetation from the soil, another challenge is separating the fruit trees from weeds using spectral characteristics of the DOM. In this study, in order to accurately extract individual fruit trees, the trees and weeds were separated by applying height threshold segmentation to the DHM. In short, the pixel values of the DHM represent the heights of the trees and weeds. Height threshold segmentation is based on the difference in height between trees and weeds as determined from the DHM. Then, a shapefile was created containing the non-weed components in the DOM. Afterwards, the shapefiles containing the soil components and non-weed components were merged, and this combined shapefile was used to mask the soil and weed areas in the DHM and thus determine the tree component of the DHM. All of the processing steps were conducted using the ENVI version 5.3 and ArcGIS version 10.6 software.

2.3.5. Delineation of Individual Tree-Crowns

Tree-crowns were extracted using the marker-controlled watershed segmentation algorithm, which is a mathematical morphological segmentation algorithm based on topology theory [40]. This algorithm considers the input image as a topographic surface in which higher pixel values correspond to higher altitudes, and simulates the flooding of the topographic surface using specific seed points or markers [41]. The algorithm generates “watershed ridge lines” and “catchment basins” in an image by treating it as a surface where the pixels with high DN values represent high elevations and the pixels with low DN values represent low elevations [42]. The key step in this method is to determine the seed points. In this study, the local maxima that were determined in the previous step were considered as the seed points. The DHM that only contained the tree component was used as the input image for the marker-controlled watershed segmentation algorithm. This processing step was implemented using the MATLAB R2019a software.
The result of the marker-controlled watershed segmentation was saved in the raster-based tagged (.TIFF) image file format. Then, the individual tree-crowns were identified by vectorizing this TIFF file, the area of the individual tree-crowns was calculated using the ArcGIS version 10.6 software, and the tree-crown elements in the polygon shapefiles were marked with a unique ID number corresponding to the ID number assigned in Section 2.3.3. Then, the diameters of the individual tree-crowns were estimated based on the diameters of the elements in the minimum circumscribed circle shapefile that was generated based on the tree-crown shapefile using the ArcGIS version 10.6 software.

2.4. Validation

In order to validate the proposed method and evaluate the accuracy of the data derived from the photogrammetric processing of the UAV-acquired images, statistical analysis was carried out based on reference data on tree numbers, tree-crown outlines, tree-crown areas, and tree-crown diameters.

2.4.1. Number of Detected Trees

The validation was performed by comparing the number of trees that was estimated using the proposed method with the number of trees determined by visual interpretation of the DOM.
The result was validated by first comparing the shapefile representing the positions of the local-maxima pixels with the manually identified tree positions. Three possible results were considered: (1) true positive (TP), meaning that a tree was extracted correctly; (2) false positive (FP), meaning the incorrect classification of an object or group of pixels as a tree; and (3) false negative (FN), meaning that a tree was not extracted [43]. Then, further statistical analysis was conducted on the TPs, FPs, and FNs to determine the Producer’s Accuracy (PA), User’s Accuracy (UA), F-score, and overall accuracy (OA) by using the following equations [44,45]:
PA = TP TP + FN × 100 % ,
UA = TP TP + FP × 100 % ,
F = 2 × PA × UA PA + UA ,
OA = TP TP + FN + FP × 100 % .

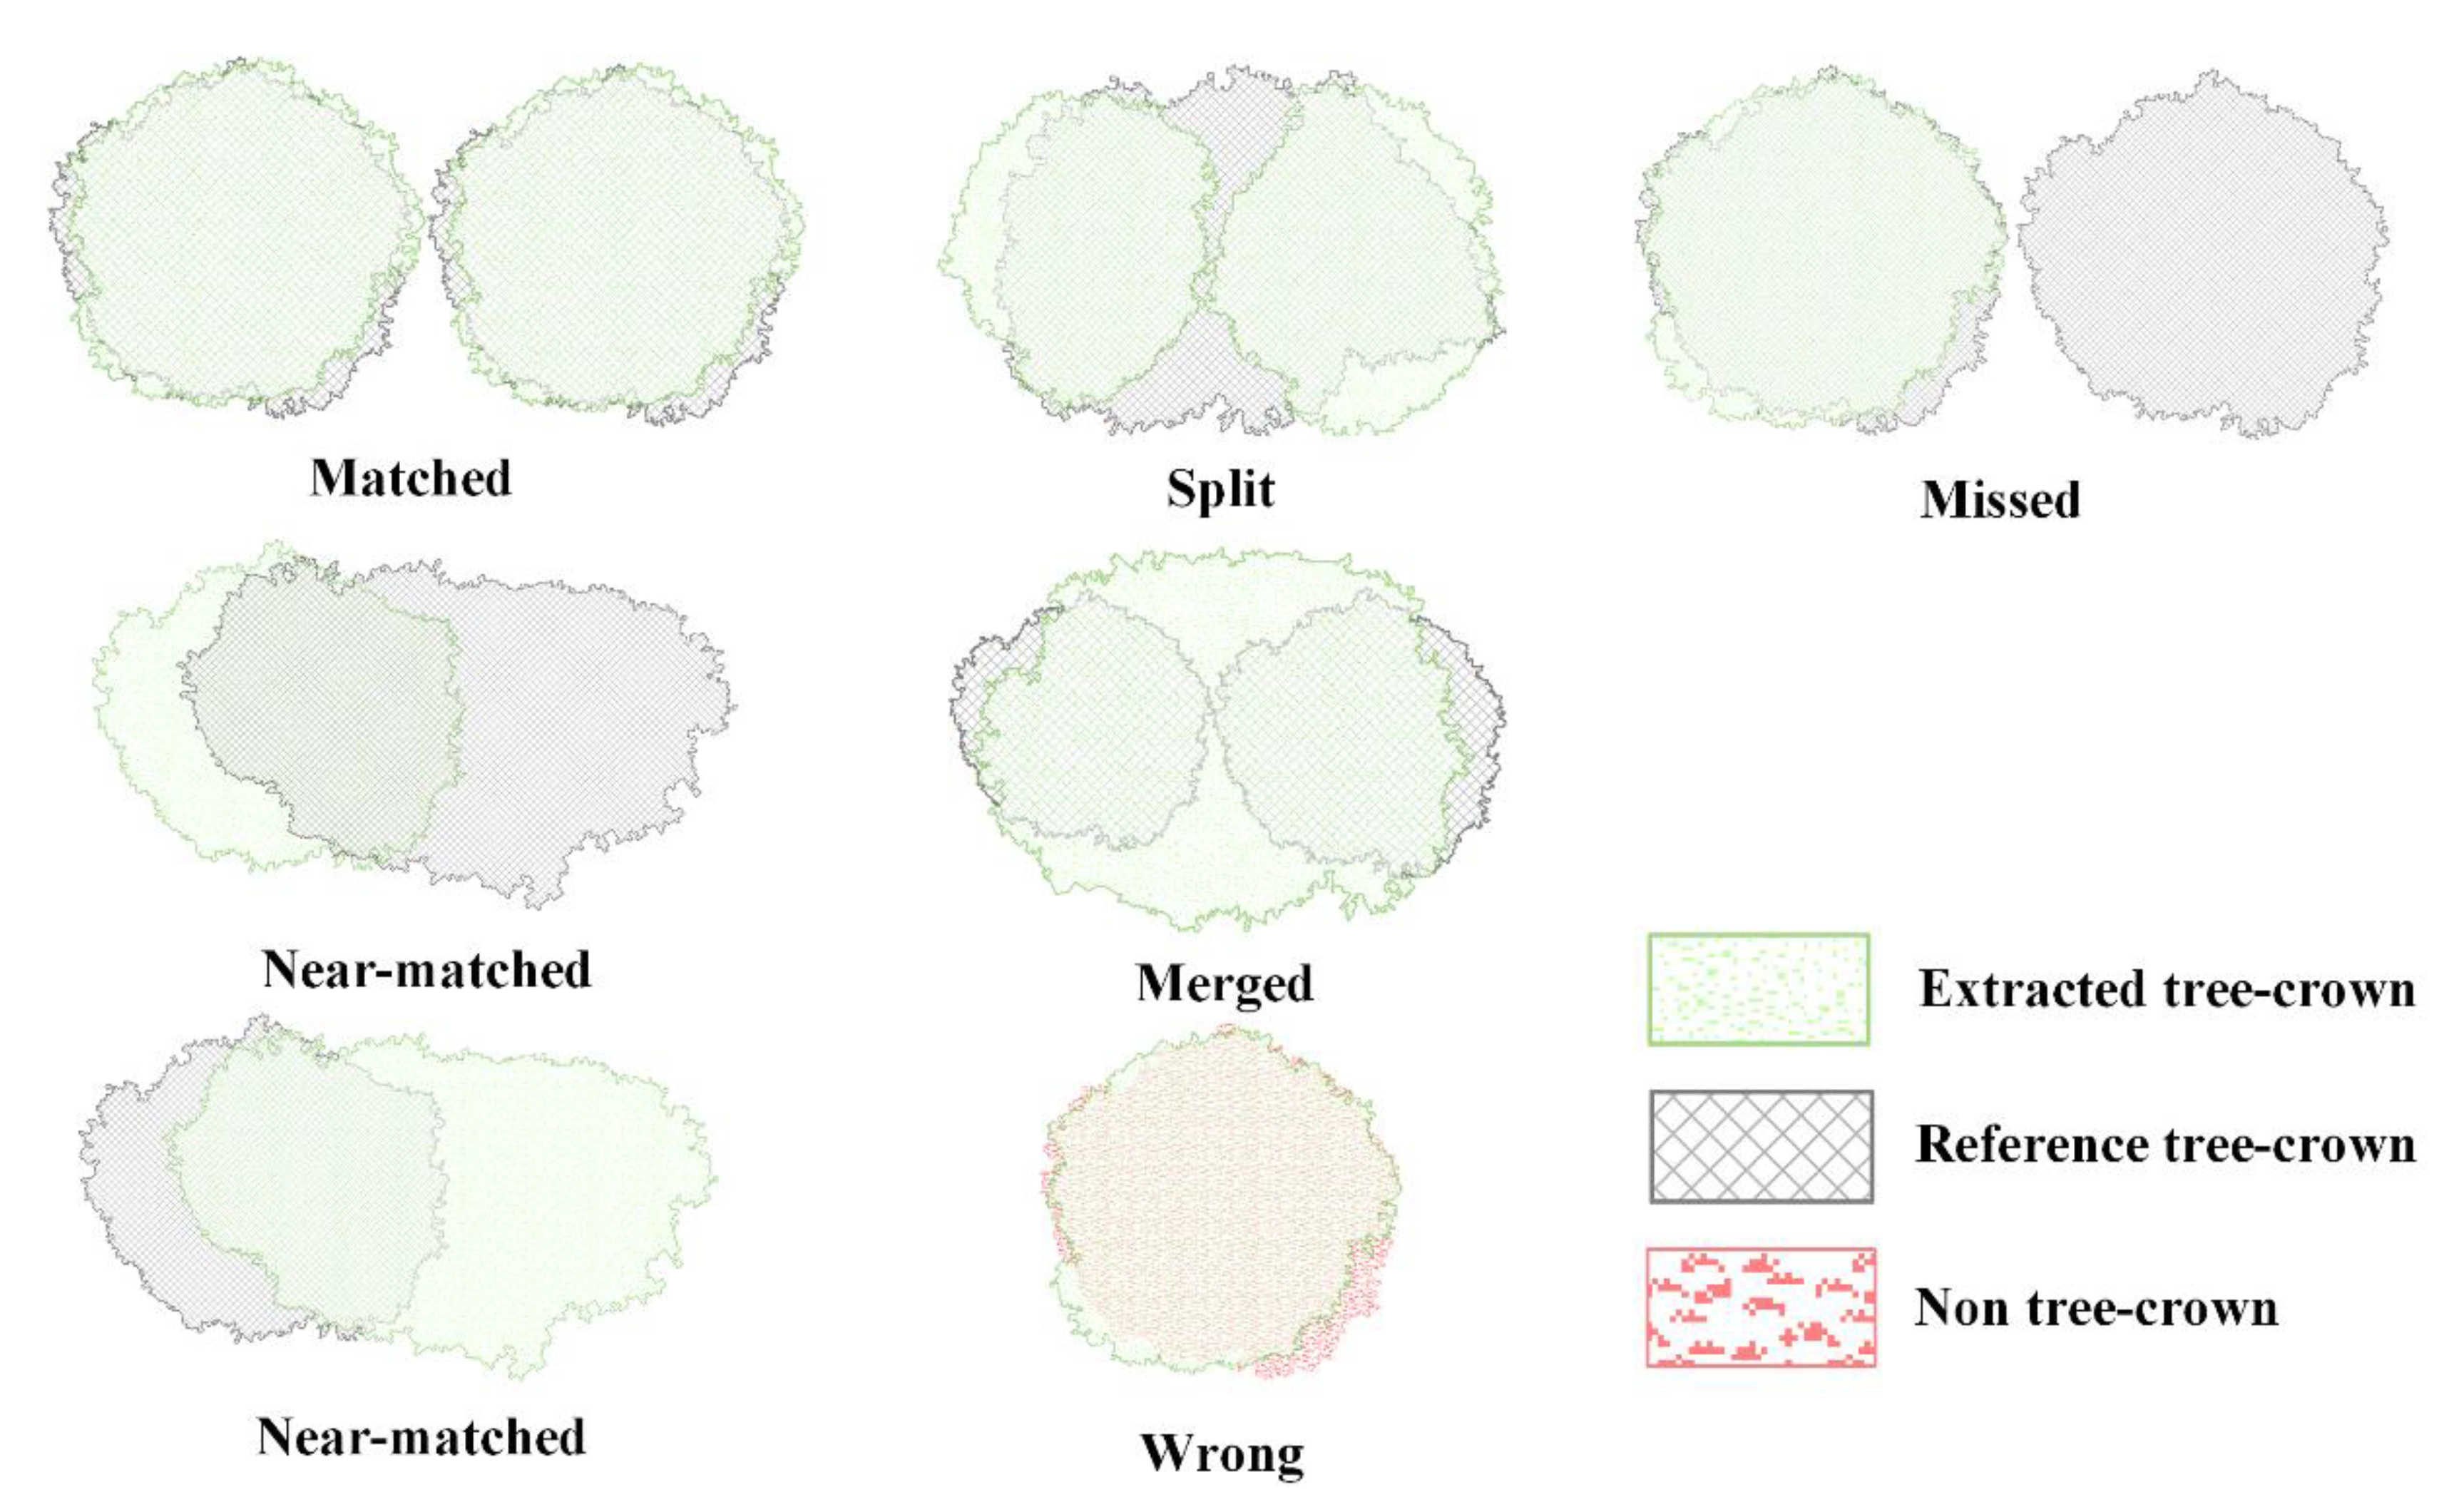
2.4.2. Delineation of Tree-Crowns

In order to validate the delineation of tree-crowns that was achieved using the proposed method, tree-crowns were manually delineated by visual interpretation of the DOM by a person with professional experience in the analysis of remote sensing images. According to the spatial relationships between the manually delineated (reference) tree-crowns and the tree-crowns that were delineated using the proposed method (extracted tree-crowns), six categories of matching accuracy (Figure 5) were defined, as follows [46,47]:
  • Matched. If more than 50% of a reference tree-crown overlaps with only one extracted tree-crown element in the extracted tree-crown shapefile, and the center the reference tree-crown also overlaps with the extracted tree-crown, we considered the extracted tree-crown to have been matched correctly;
  • Near-matched. If a reference tree-crown and an extracted tree-crown overlap by more than 50% of the tree-crown area on only one side of the extracted tree-crown, and the center of the reference tree-crown also overlaps with the extracted tree-crown, the reference tree-crown was classified as near-matched;
  • Merged. If more than one reference tree-crown overlapped with one extracted tree-crown, and the centers of the reference tree-crowns were also covered by the extracted tree-crown, these reference tree-crowns were all considered to be merged tree-crowns;
  • Split. If more than 50% of a reference tree-crown is occupied by more than one extracted tree-crown, this reference crown was considered to be a split tree-crown;
  • Missed. If less than 50% of a reference tree-crown overlaps with any extracted tree-crowns, this reference tree-crown was considered to be missed;
  • Wrong. If an extracted tree-crown was misidentified (i.e., an FP), this extracted tree-crown was classified as wrong.
The accuracy of tree-crown delineation was determined using the PA and UA parameters when the evaluation reference objects were the extracted tree-crowns and the reference tree-crowns, respectively. The PA and UA were calculated using the following equation:
PA   =   E ma E e E wr × 100 % ,
UA = R ma R e × 100 % ,
E e = E ma + E nm + E me + E sp + E mi + E wr ,
R e = R ma + R nm + R me + R sp + R mi ,
where *ma, *nm, *me, *sp, *mi, and *wr represent the number of matched tree-crowns, the number of near-matched tree-crowns, the number of merged tree-crowns, the number of split tree-crowns, the number of missed tree-crowns, and the number of wrong tree-crowns, respectively; E represents the extracted tree-crown; R represents the reference tree-crown; Ee represents the total number of extracted tree-crowns; and Re represents the total number of reference tree-crowns.

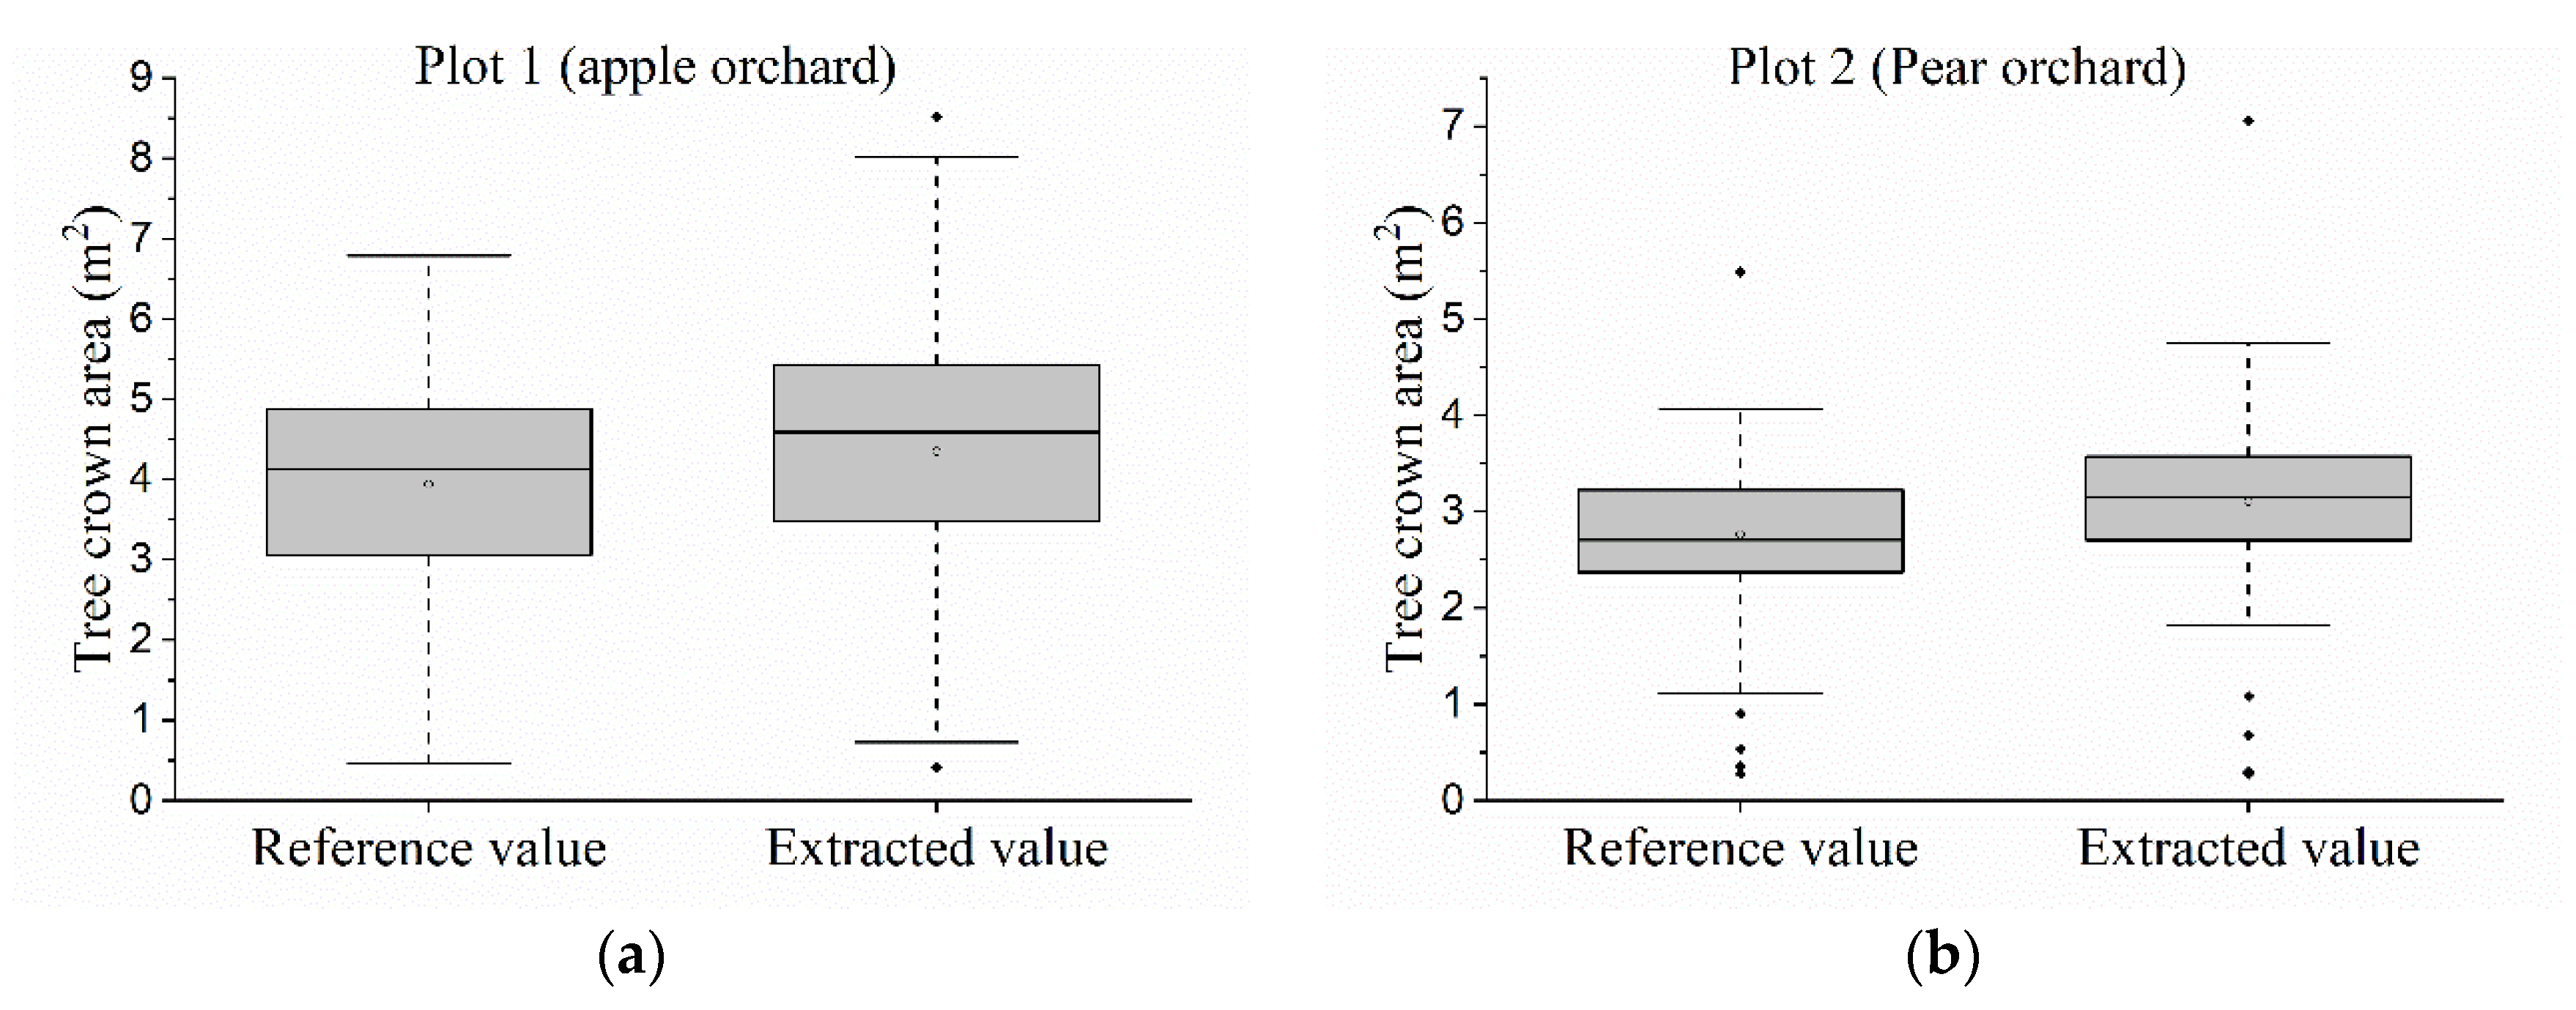
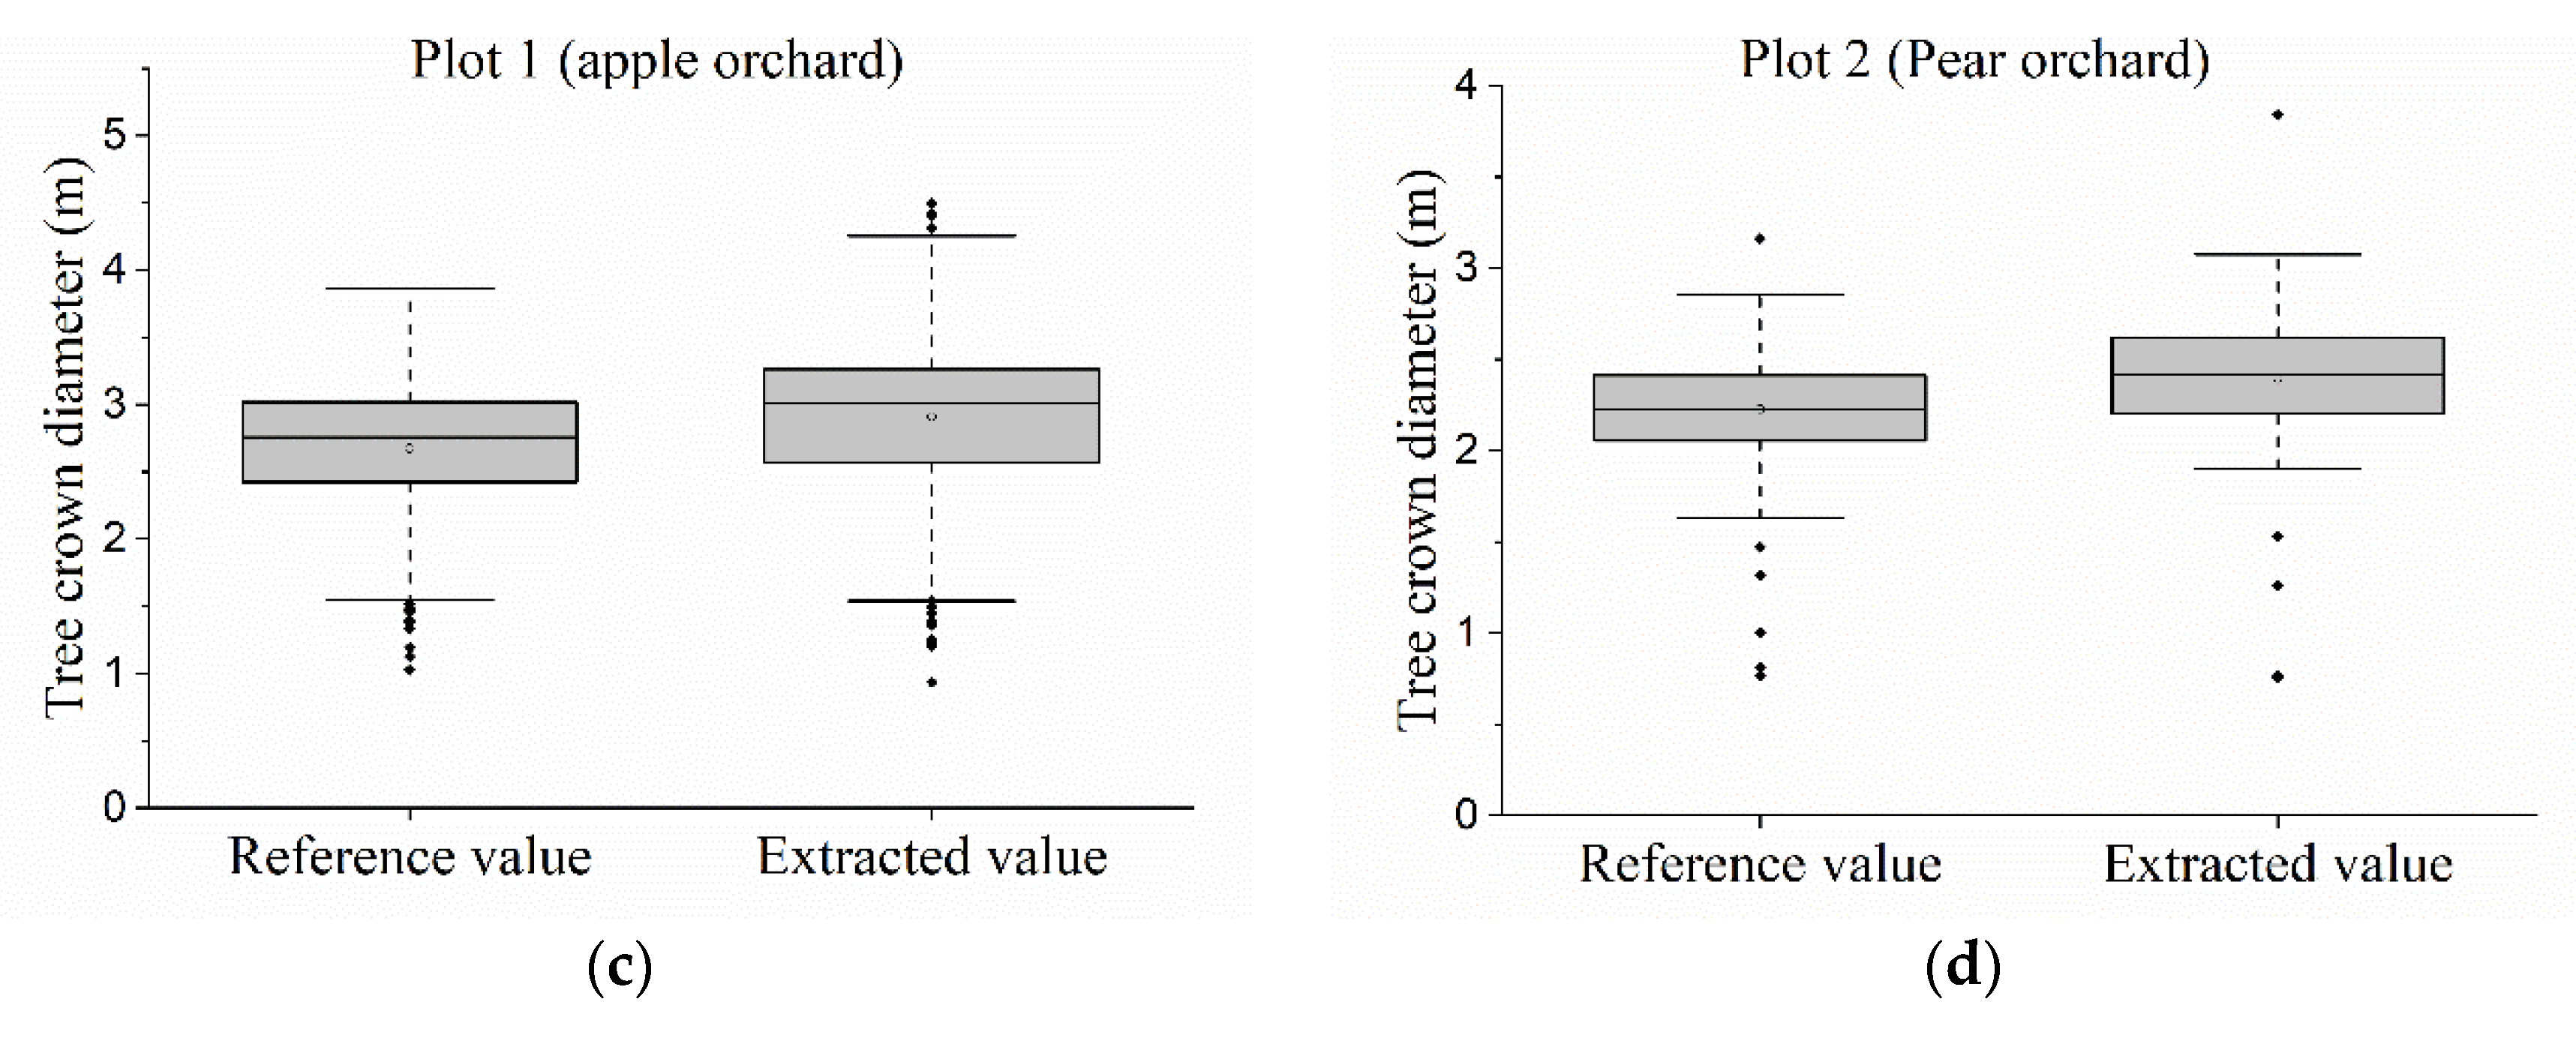
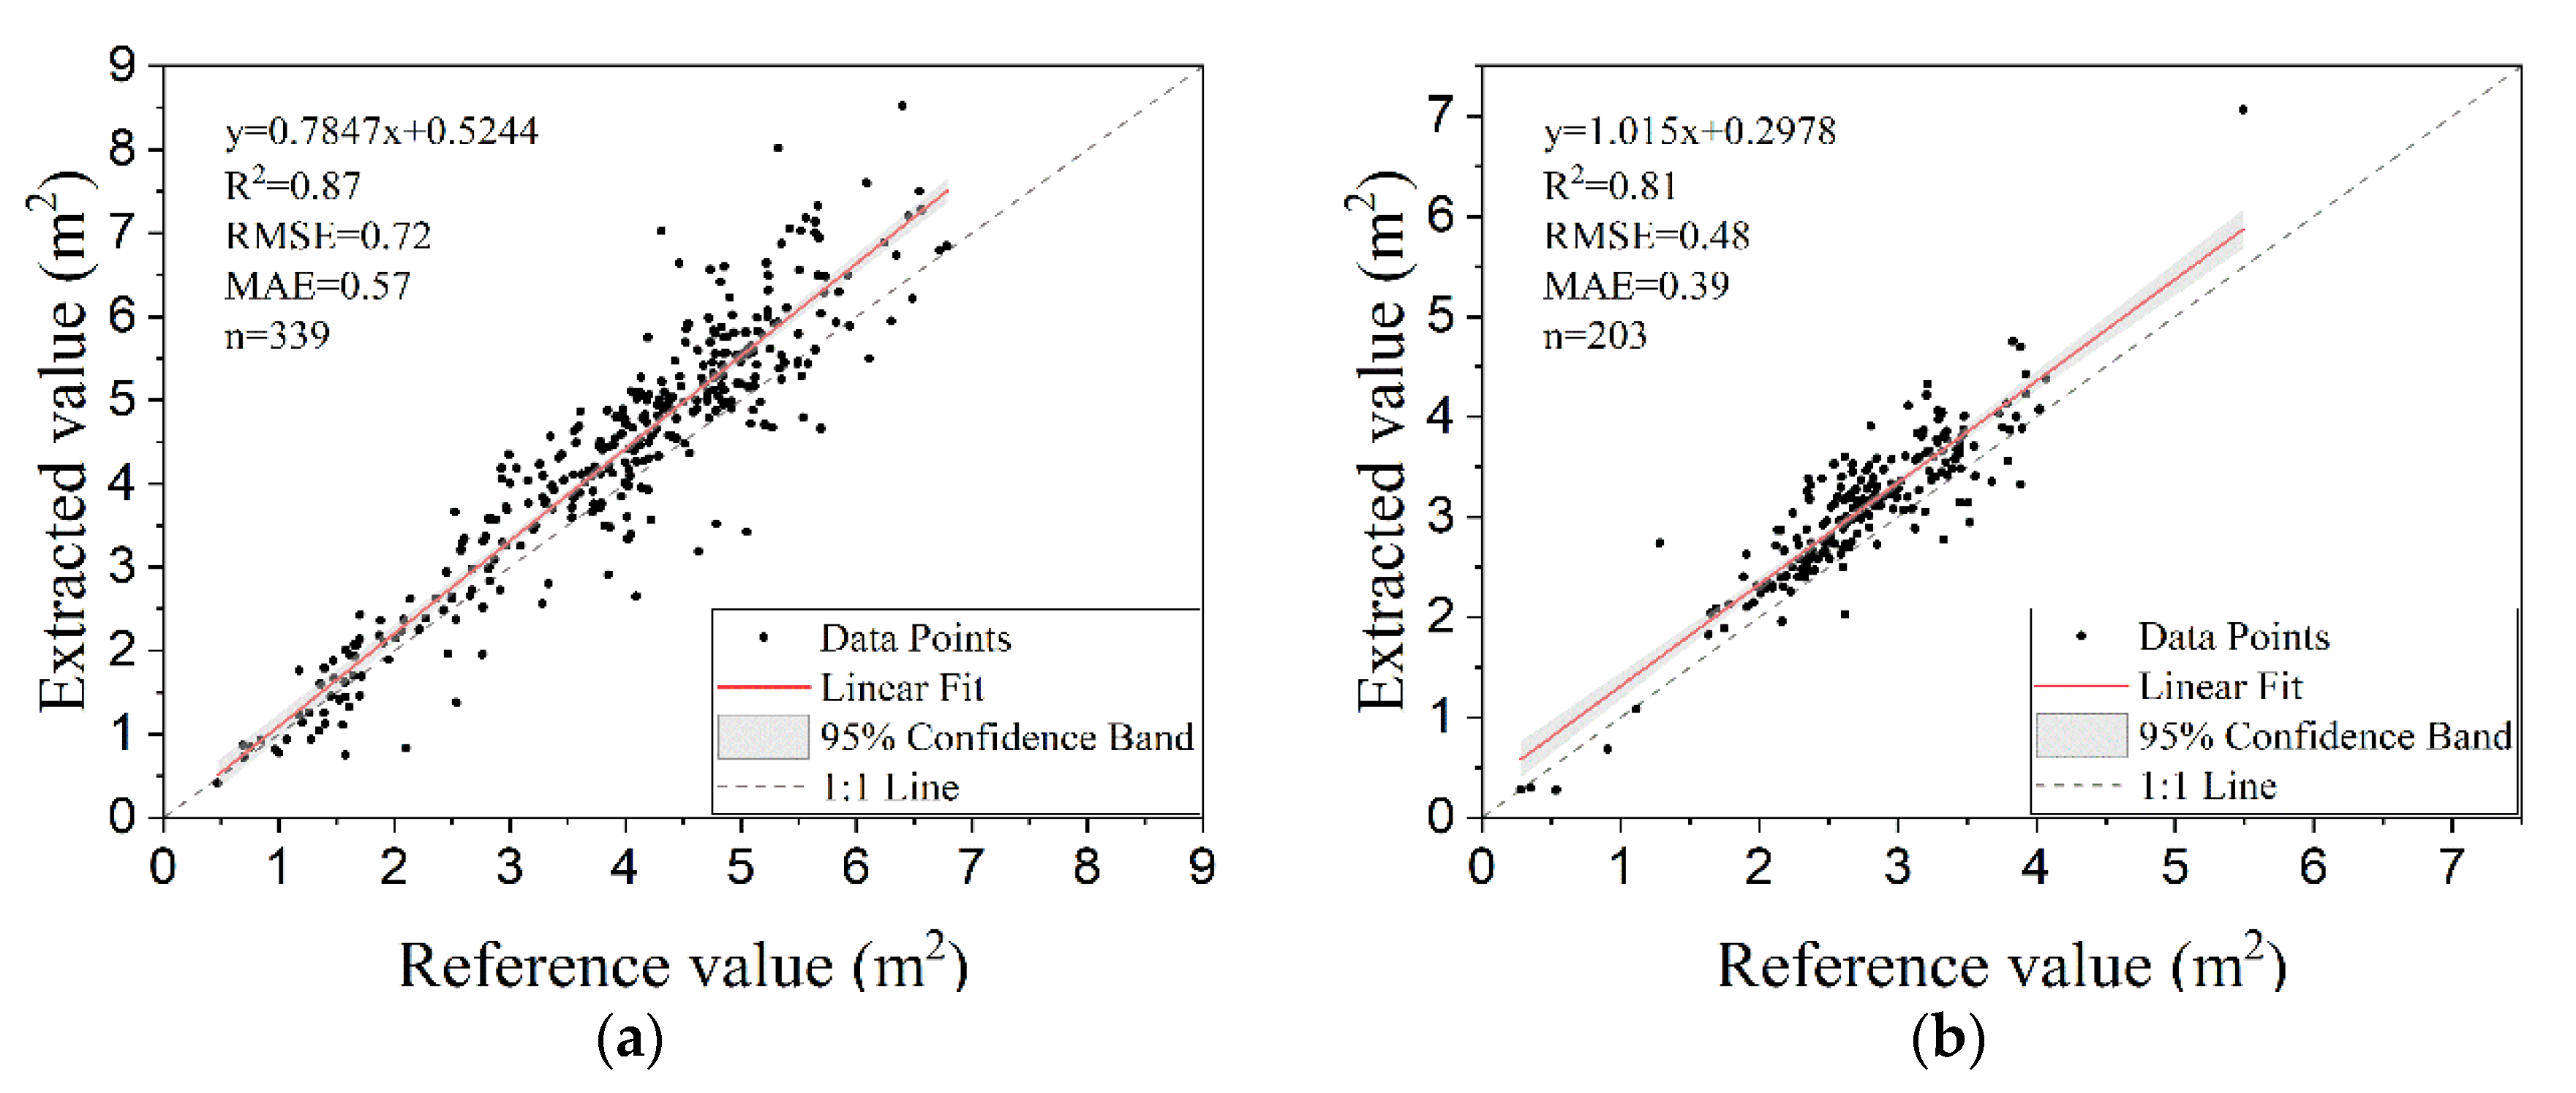
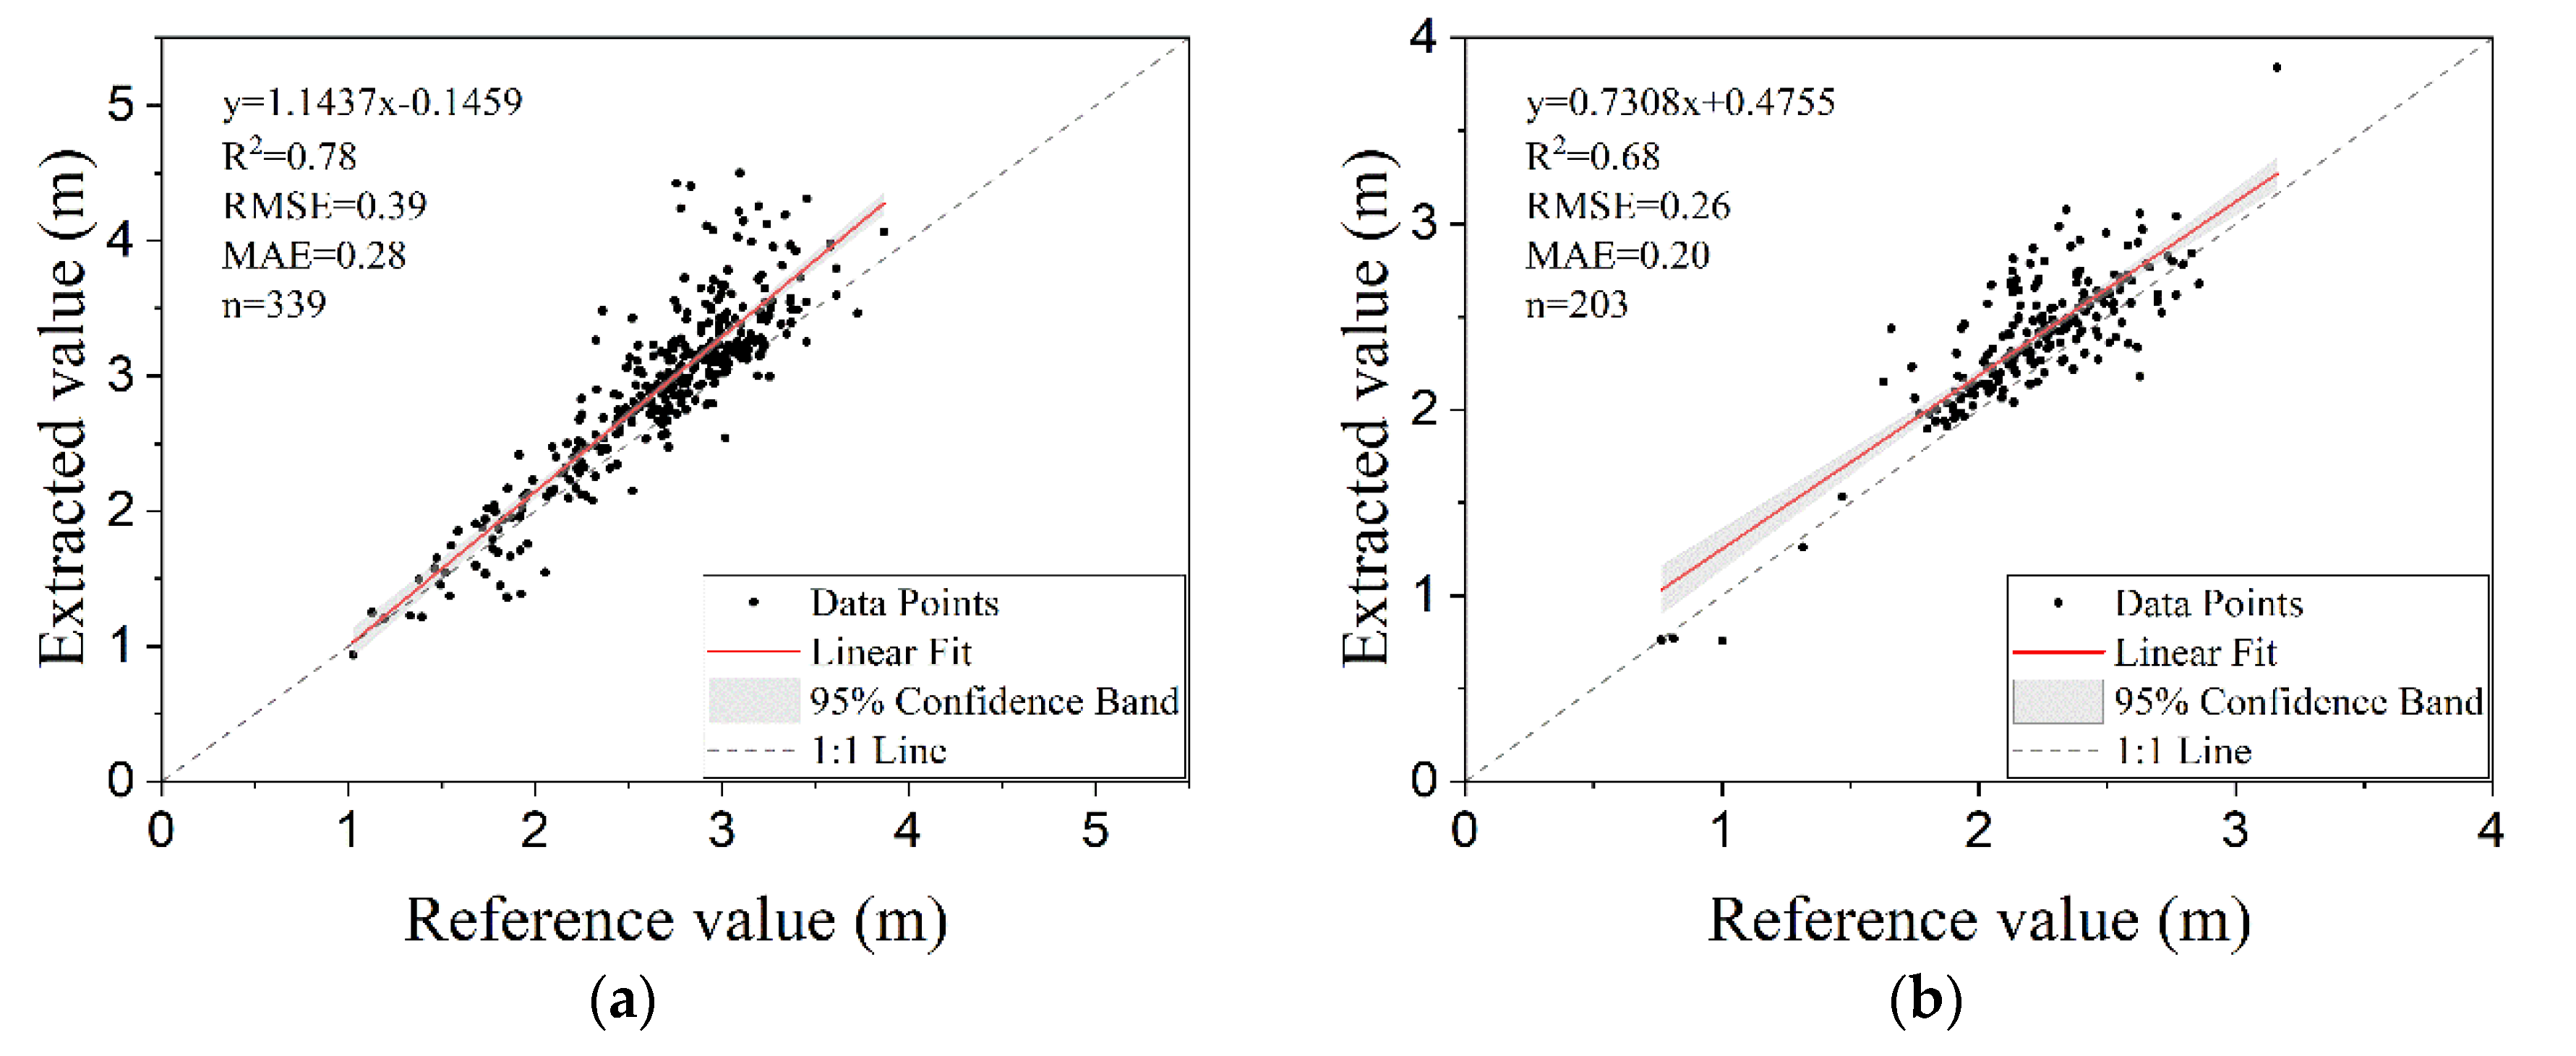
2.4.3. Estimation of Tree-Crown Area and Tree-Crown Diameter

In order to comprehensively analyze the differences between the tree-crown areas and diameters that were estimated by the proposed method and those that were estimated manually (reference data), statistical analyses were conducted in the Microsoft Excel software (Microsoft, Redmond, WA, USA).
Linear regression analysis was used to model the relationship between the extracted data and the reference data. The coefficient of determination (R2) of the regression was used to determine how close the extracted data were to the reference data, with a higher R2 value meaning a higher correlation between the extracted data and the reference data. Additionally, we calculated the root-mean-square error (RMSE), which reflects the standard error, between the estimated and reference data; the smaller the RMSE, the closer the extracted data are to the reference data. Furthermore, the mean absolute error (MAE) was also calculated to evaluate the residuals for both the extracted data and the reference data [48]. The RMSE and MAE are given as follows:
RMSE = 1 n i = 1 n ( x i x i ) 2 ,
MAE = 1 n i = 1 n | x i x i | ,
where x i represents the extracted value and x i represents the reference value.

3. Results

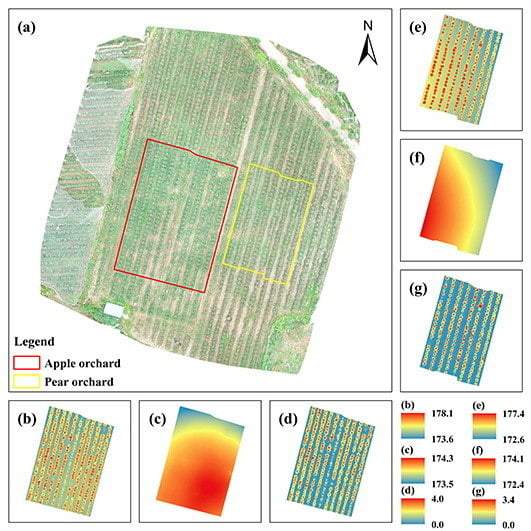
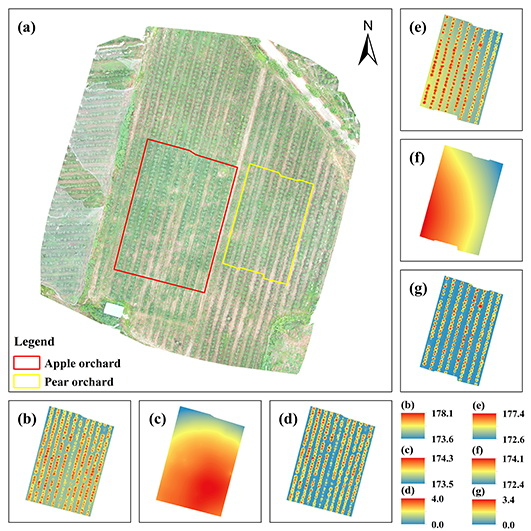
3.1. DOM, DSMs, DTMs, and DHMs

The DOM is shown in Figure 6a. The DOM was generated from a total of 169 UAV-acquired images, covers an area of around 0.022 km2, and has a spatial resolution of 0.0114 m. The DSMs (Figure 6b,e) and DTMs (Figure 6c,f) were generated from the density point cloud that was created using the SfM and MVS approaches using the method of inverse distance weighting. The DSMs and DTMs all have a spatial resolution of 0.0570 m. The DHMs (Figure 6d,g) were computed by subtracting the DTMs from the DSMs.

3.2. Estimation of the Numbers of Individual Trees

The numbers of trees that were detected by the proposed method is shown in Table 3. The manual counting from the DOM identified a total of 559 fruit trees in the two plots—352 in Plot 1 (the apple orchard) and 207 in Plot 2 (the pear orchard). The proposed method detected 345 trees in Plot 1 and 206 pear trees in Plot 2. The PA, UA, and F-score for Plot 1 are 98.3%, 99.7%, and 99.0%, respectively, and are 99.0%, 99.5%, and 99.3%, respectively, for Plot 2. Overall, a large majority of the trees were detected correctly, with an average detection rate of approximately 99.0%.

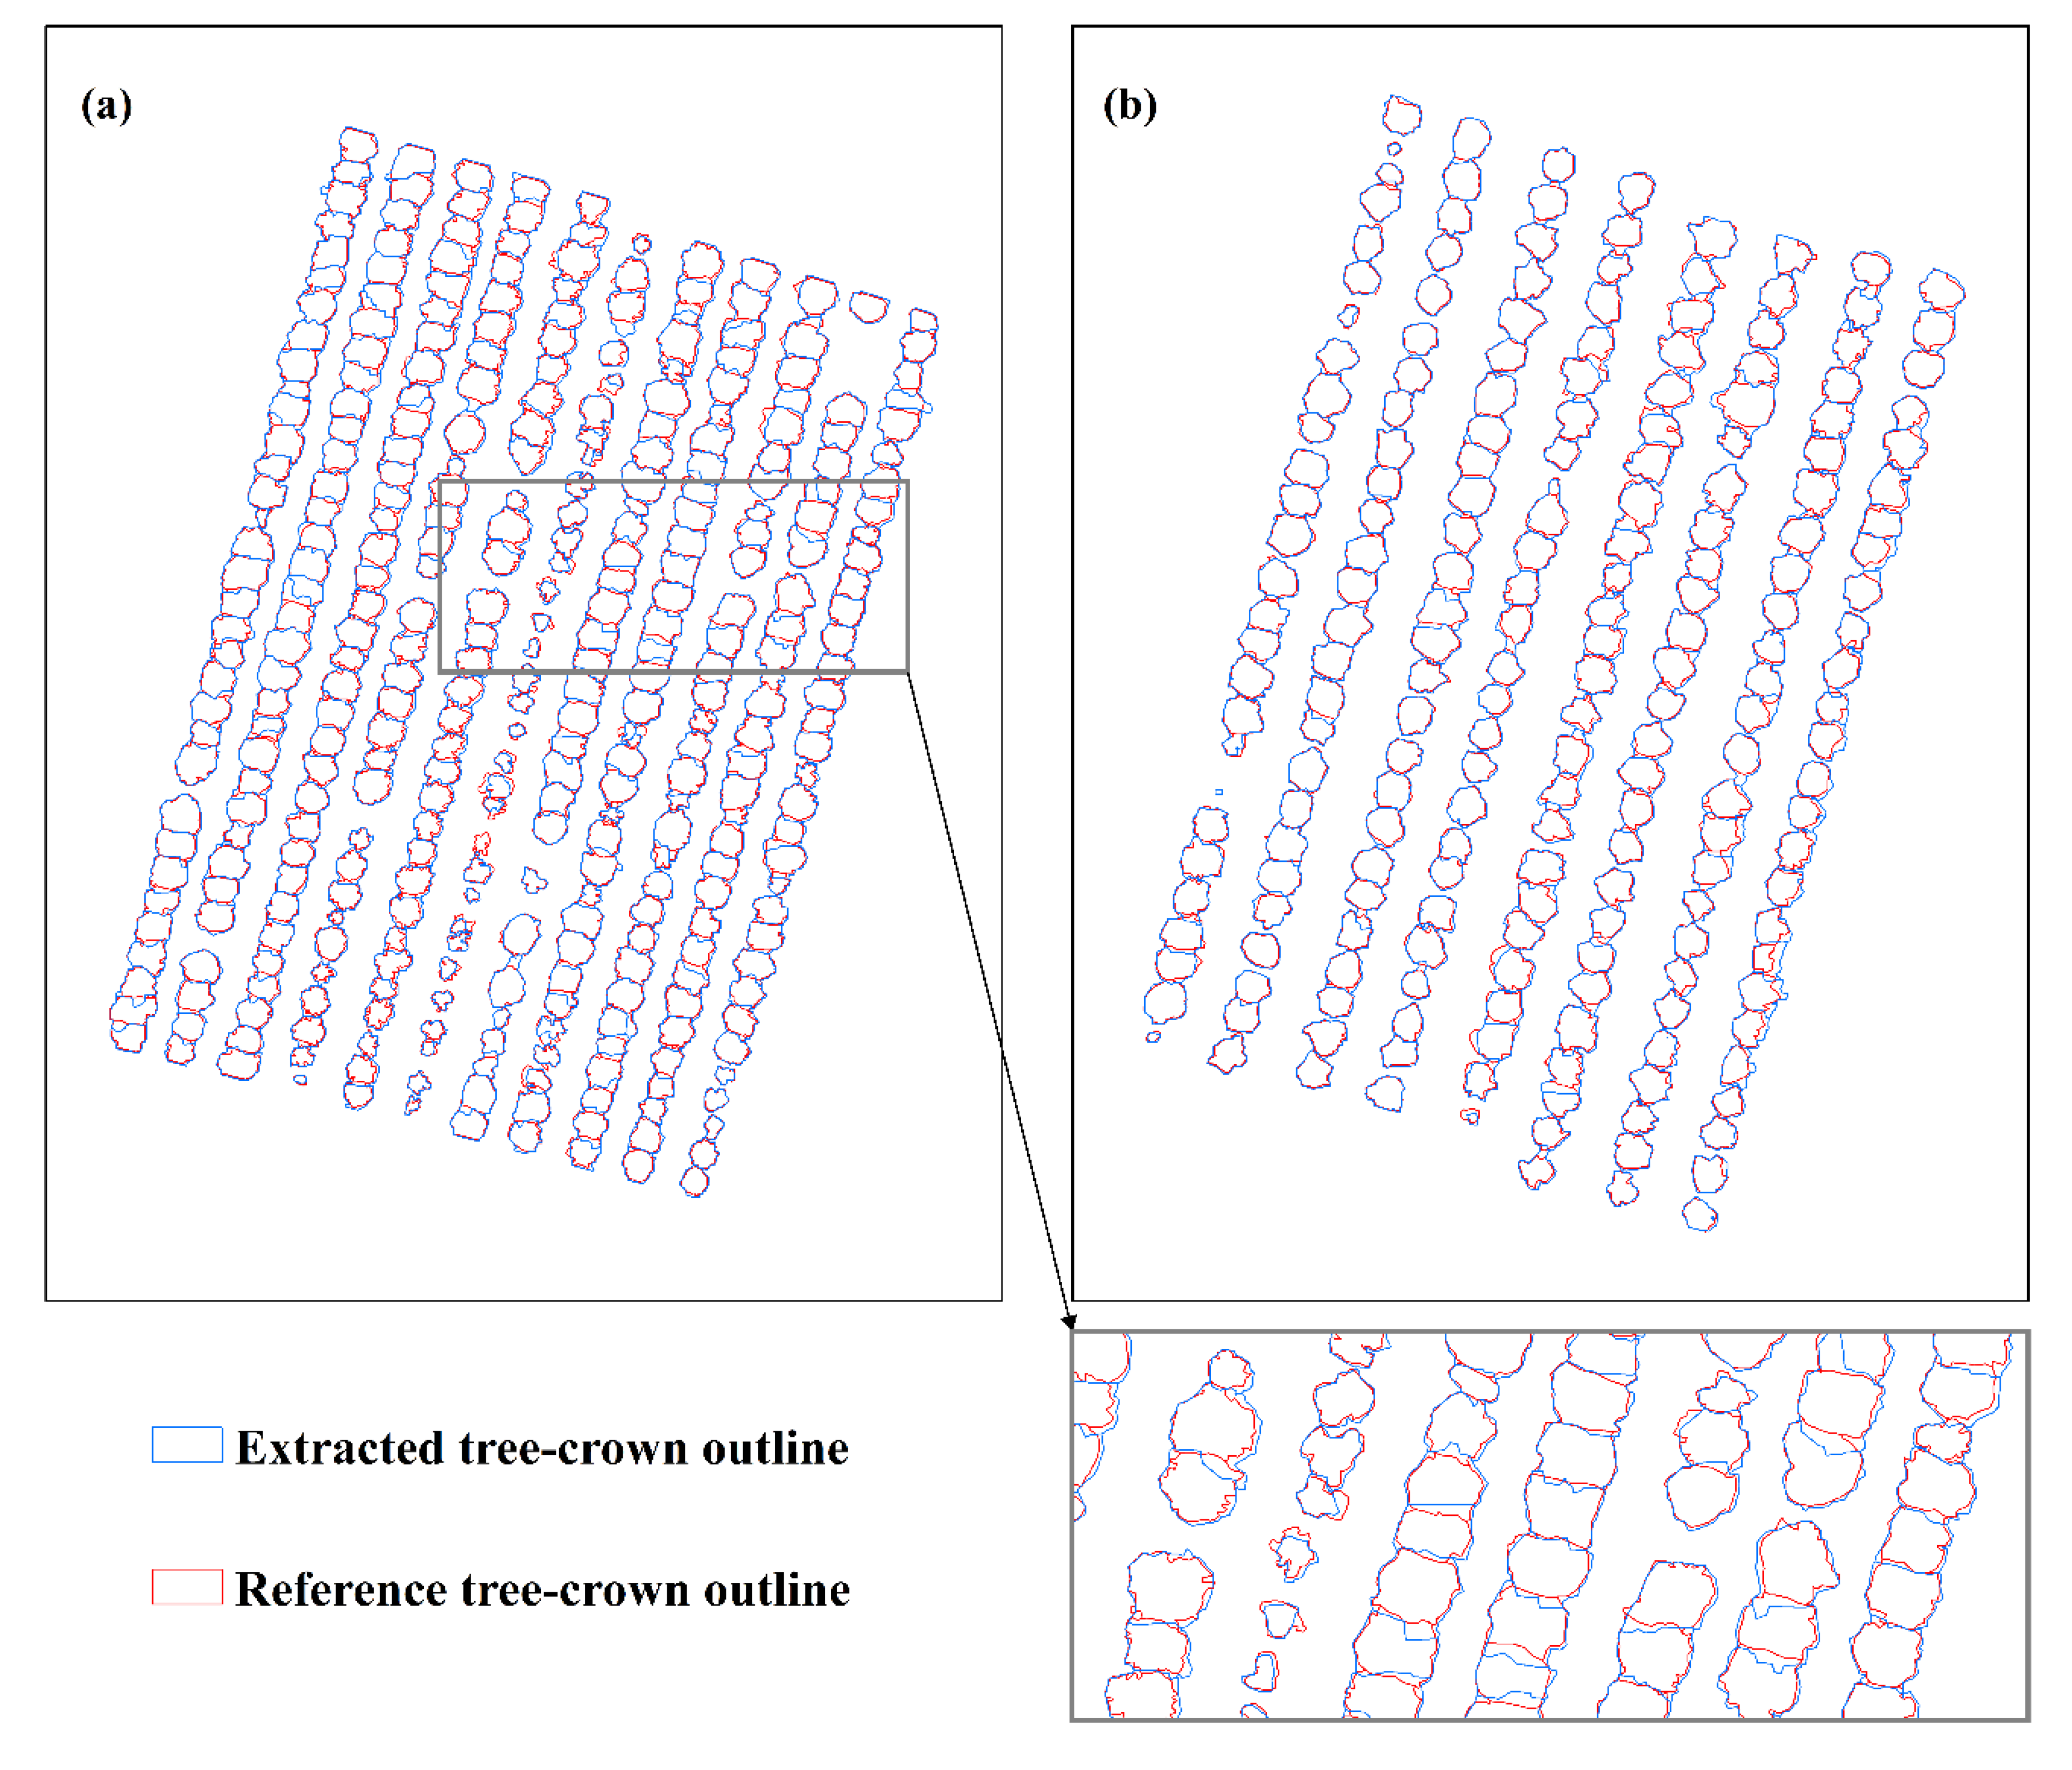
3.3. Delineation of Tree-Crowns

In order to intuitively contrast the tree-crowns delineated using the proposed method and manual inspection, respectively, the results of these two approaches were overlaid for each of the two plots using the ArcGIS Version 10.6 software, as shown in Figure 7. From the figure, it can be seen that the tree-crown outlines that were determined using the two approaches are significantly different.
The accuracies of tree-crown delineation using the proposed method for Plot 1 and Plot 2 are shown in Table 4 and Table 5, respectively. As shown in these tables, the PA and UA of both Plot 1 and Plot 2 are greater than 95.0%. This indicates that the proposed method achieved satisfactory results for the delineation of tree-crowns.

3.4. Estimation of Areas and Diameters of Tree-Crowns

In order to assess the accuracy of the areas and diameters of tree-crowns that were estimated using the proposed method, statistical analysis was conducted for the trees that were positively identified (i.e., TPs). A total of 339 apple trees and 203 pear trees were correctly identified (i.e., were TPs) in Plot 1 and Plot 2, respectively, and only these trees (i.e., a total of 542) were included in the statistical analysis. The results of the statistical analysis are shown in box-and-whisker plots in Figure 8, and also in Table 6 and Table 7. From these results, it can be seen that, for tree-crown area and diameter, the proposed method overestimated the mean, Q1, median, and Q3 for both plots.
Besides the above statistical analysis, linear regression was also performed to determine the relationship between the extracted and reference values of tree-crown area and diameter. The results are shown in Figure 9. As can be seen in this figure, the extracted tree-crown areas are highly correlated with the reference tree-crown areas for both of the two field plots: R2 values of 0.87 and 0.81, RMSE values of 0.72 m2 and 0.48 m2, and MAE values of 0.57 m2 and 0.39 m2 were obtained for Plot 1 and Plot 2, respectively. However, despite the relatively high correlation, and the fact that the best fitting line is close to the 1:1 (x = y) line, these results indicate that the extracted tree-crown areas were overestimated for both of the two plots.
The results of the linear regression for tree-crown diameters are shown in Figure 10. For both of the two field plots, there is a strong relationship between the extracted tree-crown diameters and the reference tree-crown diameters, with R2 values of 0.78 and 0.68 being obtained for Plot 1 and Plot 2, respectively. RMSE values of 0.39 m and 0.26 m, and MAE values of 0.28 m and 0.20 m, were obtained for Plot 1 and Plot 2, respectively. This shows that the proposed method overestimated the tree-crown diameters compared to the reference values. However, the fact that the majority of the data points are distributed close to the 1:1 line shows that the proposed method has a relatively good accuracy.

4. Discussion

4.1. Determination of the Thresholds in the Proposed Method

Three pixel-value thresholds were determined during the processing (Figure 4): the first threshold was used to remove the weed component in the DHM; the second was used to separate the tree-top area from the vegetation index; and the third—which was determined using the Otsu segmentation method—was used to separate the soil component and vegetation component of the vegetation index.
In order to determine Threshold 1 and Threshold 2, prior knowledge is required. In both Plot 1 and Plot 2, Threshold 1 was set to 0.5 m; this value was chosen because the height of the weeds was lower than 0.5 m in these plots, and this threshold could therefore remove almost all of the weed component of the DHM. Threshold 2 was chosen based on the tree condition in the orchard; this threshold was set to 1.5 m and 2.0 m in Plot 1 and Plot 2, respectively. Threshold 3 was taken as the DN value that was automatically calculated by the Otsu segmentation method; accordingly, this threshold was set as 49 and –51 for Plot 1 and Plot 2, respectively; these values represent the DN values of the pixels in the result of the vegetation index. Since the condition of the orchard is not as complex as that of natural forest, these thresholds have reference value.

4.2. Detection of Individual Trees

As expected, the main error in the detection of individual trees was due to FNs. Most of the instances of unidentified trees are shown in Figure 11. In the proposed method, the kernel matrix of the Gaussian filter was set to a size of 5 × 5, and the optimum value of min_distance was set to 5 to ensure that there was only one peak pixel value within one tree-crown area in the two plots. One characteristic of the unidentified (FN) trees is that their heights are significantly lower than average, and another characteristic is that all of these trees are adjacent to a taller tree. However, smaller than average trees can be identified successfully by the proposed method as long as they are separated from other trees. The accuracy of the proposed method for the detection of individual trees is superior or equal to that of the methods of previous studies. Ok el al. [49] presented an approach to detect citrus trees using photogrammetric DSMs based on UAV imagery. Their method was found to have an overall precision of 91.1% in a pixel-based analysis and 97.5% in an object-based analysis. Marques et al. [31] detected the numbers of trees in a chestnut orchard by using a combination of visible and near-infrared domain bands and a canopy height model. They obtained a mean accuracy of around 99% for all flight campaigns.

4.3. Delineation of Individual Tree-Crowns and Estimation of Tree-Crown Parameters

In the proposed method, the delineation of individual tree-crowns is based on the detection of individual trees. Thus, the accuracy of individual tree detection affects the accuracy of the delineation of individual tree-crowns to a certain extent. The other factor that influences the accuracy of tree-crown delineation is the method that is used to extract individual tree-crowns; the inaccurate extraction of tree-crowns causes errors in the calculation of tree-crown parameters, i.e., tree-crown area and tree-crown diameter. The marker-controlled watershed segmentation method was used in this study to segment individual tree-crowns. The advantage of this method is that it can distinguish between adjacent tree-crowns and thus identify individual tree-crowns. However, since this method considered the DN value of images, if two adjacent tree-crowns are similar in structure then the DN value within these two tree-crown areas in the DHM result will have no obvious transition, and these two crowns will be separated inaccurately.
Relatively little research has been conducted on the accuracy of estimates of individual tree-crown areas that are obtained using image processing algorithms. The results of this study indicate that the proposed method can estimate the areas and diameters of individual tree-crowns with a high accuracy and a relatively low error compared to previous studies. Mu et al. [21] used high-resolution UAV images to characterize the crowns of peach trees; by taking the manual delineation of 12 trees as a reference, the RMSE of the proposed method was found to be 0.08 m (R2 = 0.99) and 0.15 m (R2 = 0.93) for the two orthogonal crown widths, respectively, and 3.87 m2 for the crown projection area (R2 = 0.89). Díaz-Varela et al. [50] estimated the tree-crown diameters of olive trees in an olive orchard, and obtained RMSEs of 0.32 m (R2 = 0.58) and 0.28 m (R2 = 0.22) for two study areas, respectively.

4.4. Limitations of the Proposed Method

There are some limitations of the proposed method. On the one hand, the lack of Ground Control Points (GCPs) may introduce some error, despite the fact that the experiment was conducted in an ideal environment by professionals. In the data processing, GCPs can be used to correct the geographic coordinate information. Hence, this limitation will be taken into account during the experimental design in future research.
On the other hand, considering the potential impact of the atmospheric environment on the relative radiometric calibration of images, it is necessary that the UAV flight experiment be performed repeatedly under different climatic conditions and at different heights in future research.

5. Conclusions

The aim of this study was to extract precise information about individual trees in an orchard with a complex background. The study involved: (1) the detection of individual trees; (2) the delineation of individual tree-crowns; and (3) the estimation of individual tree-crown parameters (area and diameter).
With regard to the first objective, it was shown that the proposed method achieved a high tree-detection accuracy (an approximately 99.0% detection rate), while its major limitation was that it failed to identify some small trees. Concerning the second objective, the proposed method also achieved a high tree-crown delineation accuracy, with both the UA and PA being greater than 95%, which confirms that the proposed method was able to separate individual tree-crowns effectively; however, the method had difficulty in directly distinguishing tree-crowns and weeds in the images. Finally, regarding the third objective, the areas and diameters of individual tree-crowns were also estimated with high accuracy, with a low RMSE and a high correlation being observed between the extracted and reference data. In the future, the consolidation of individual methods—including precision mapping and the monitoring of plant growth—could contribute to the management of orchards.

Author Contributions

Conceptualization, X.D. and Q.T.; Data curation, X.D.; Formal analysis, X.D.; Funding acquisition, Q.T.; Investigation, X.D., Z.Z., R.Y., Q.T., and X.Z.; Methodology, X.D.; Project administration, Q.T.; Software, X.D. and Z.Z.; Validation, X.D.; Visualization, X.D.; Writing—original draft, X.D.; Writing—review & editing, X.D., Z.Z., R.Y., Q.T., and X.Z. All authors have read and agreed to the published version of the manuscript.

Funding

This study was supported by the National Science and Technology Major Project of China (30-Y20A07-9003-17/18 & 03-Y20A04-9001-17/18), the Natural Science Foundation of China (41771370), the National Key Research and Development Program of China (2017YFD0600903), and the 13th Five-Year Plan of Civil Aerospace Technology Advanced Research Projects.

Conflicts of Interest

The authors declare no conflicts of interest.

References

  1. Panda, S.S.; Hoogenboom, G.; Paz, J.O. Remote sensing and geospatial technological applications for site-specific management of fruit and nut crops: A review. Remote Sens. 2010, 2, 1973–1997. [Google Scholar] [CrossRef] [Green Version]
  2. Das, U. Precision Farming a Promising Technology in Horticulture: A Review. Int. J. Pure Appl. Biosci. 2018, 6, 1596–1606. [Google Scholar] [CrossRef]
  3. Gebbers, R.; Adamchuk, V.I. Precision agriculture and food security. Science 2010, 327, 828–831. [Google Scholar] [CrossRef] [PubMed]
  4. Aguilar, M.A.; Vallario, A.; Aguilar, F.J.; Lorca, A.G.; Parente, C. Object-based greenhouse horticultural crop identification from multi-temporal satellite imagery: A case study in Almeria, Spain. Remote Sens. 2015, 7, 7378–7401. [Google Scholar] [CrossRef] [Green Version]
  5. Singh, V.; Patel, A.N.; Dalwadi, A.; Kathota, J.; Suthar, J.; Kalubarme, M.H. Horticultural Fruit Crop Plantations Mapping using Geo-informatics Technology in Gujarat State India. Int. J. Adv. Remote Sens. GIS 2017, 6, 2033–2049. [Google Scholar] [CrossRef] [Green Version]
  6. Paul, N.C.; Sahoo, P.M.; Ahmad, T.; Sahoo, R.N.; Krishna, G.; Lal, S.B. Acreage estimation of mango orchards using hyperspectral satellite data. Hortic. Soc. India 2018, 75, 27–33. [Google Scholar] [CrossRef]
  7. Roth, S.I.B.; Leiterer, R.; Volpi, M.; Celio, E.; Schaepman, M.E.; Joerg, P.C. Automated detection of individual clove trees for yield quantification in northeastern Madagascar based on multi-spectral satellite data. Remote Sens. Environ. 2019, 221, 144–156. [Google Scholar] [CrossRef]
  8. Csillik, O.; Cherbini, J.; Johnson, R.; Lyons, A.; Kelly, M. Identification of Citrus Trees from Unmanned Aerial Vehicle Imagery Using Convolutional Neural Networks. Drones 2018, 2, 39. [Google Scholar] [CrossRef] [Green Version]
  9. Morales, G.; Kemper, G.; Sevillano, G.; Arteaga, D.; Ortega, I.; Telles, J. Automatic segmentation of Mauritia flexuosa in unmanned aerial vehicle (UAV) imagery using deep learning. Forests 2018, 9, 736. [Google Scholar] [CrossRef] [Green Version]
  10. Mubin, N.A.; Nadarajoo, E.; Shafri, H.Z.M.; Hamedianfar, A. Young and mature oil palm tree detection and counting using convolutional neural network deep learning method. Int. J. Remote Sens. 2019, 40, 7500–7515. [Google Scholar] [CrossRef]
  11. Colaço, A.F.; Molin, J.P.; Rosell-Polo, J.R.; Escolà, A. Application of light detection and ranging and ultrasonic sensors to high-throughput phenotyping and precision horticulture: Current status and challenges. Hortic. Res. 2018, 5, 1–11. [Google Scholar] [CrossRef] [PubMed] [Green Version]
  12. Kwak, D.A.; Lee, W.K.; Lee, J.H.; Biging, G.S.; Gong, P. Detection of individual trees and estimation of tree height using LiDAR data. J. For. Res. 2007, 12, 425–434. [Google Scholar] [CrossRef]
  13. Maes, W.H.; Steppe, K. Perspectives for Remote Sensing with Unmanned Aerial Vehicles in Precision Agriculture. Trends Plant Sci. 2019, 24, 152–164. [Google Scholar] [CrossRef] [PubMed]
  14. Christiansen, M.P.; Laursen, M.S.; Jørgensen, R.N.; Skovsen, S.; Gislum, R. Designing and testing a UAV mapping system for agricultural field surveying. Sensors 2017, 17, 2703. [Google Scholar] [CrossRef] [PubMed] [Green Version]
  15. Ballesteros, R.; Ortega, J.F.; Hernandez, D.; Moreno, M.A. Onion biomass monitoring using UAV-based RGB imaging. Precis. Agric. 2018, 19, 840–857. [Google Scholar] [CrossRef]
  16. Tu, Y.H.; Johansen, K.; Phinn, S.; Robson, A. Measuring canopy structure and condition using multi-spectral UAS imagery in a horticultural environment. Remote Sens. 2019, 11, 269. [Google Scholar] [CrossRef] [Green Version]
  17. Jorge, J.; Vallbé, M.; Soler, J.A. Detection of irrigation inhomogeneities in an olive grove using the NDRE vegetation index obtained from UAV images. Eur. J. Remote Sens. 2019, 52, 169–177. [Google Scholar] [CrossRef] [Green Version]
  18. Jiménez-Brenes, F.M.; López-Granados, F.; Castro, A.I.; Torres-Sánchez, J.; Serrano, N.; Peña, J.M. Quantifying pruning impacts on olive tree architecture and annual canopy growth by using UAV-based 3D modelling. Plant Methods 2017, 13, 55. [Google Scholar] [CrossRef] [Green Version]
  19. Ampatzidis, Y.; Partel, V.; Meyering, B.; Albrecht, U. Citrus rootstock evaluation utilizing UAV-based remote sensing and artificial intelligence. Comput. Electron. Agric. 2019, 164, 104900. [Google Scholar] [CrossRef]
  20. Maillard, P.; Gomes, M.F. Detection and counting of orchard trees from vhr images using a geometrical-optical model and marked template matching. In Proceedings of the ISPRS Annals of the Photogrammetry, Remote Sensing and Spatial Information Sciences, Prague, Czech Republic, 12–19 July 2016; Volumn III-7, pp. 75–82. [Google Scholar]
  21. Mu, Y.; Fujii, Y.; Takata, D.; Zheng, B.; Noshita, K.; Honda, K.; Ninomiya, S.; Guo, W. Characterization of peach tree crown by using high-resolution images from an unmanned aerial vehicle. Hortic. Res. 2018, 5, 74. [Google Scholar] [CrossRef] [Green Version]
  22. Gongal, A.; Silwal, A.; Amatya, S.; Karkee, M.; Zhang, Q.; Lewis, K. Apple crop-load estimation with over-the-row machine vision system. Comput. Electron. Agric. 2016, 120, 26–35. [Google Scholar] [CrossRef]
  23. Caruso, G.; Tozzini, L.; Rallo, G.; Primicerio, J.; Moriondo, M.; Palai, G.; Gucci, R. Estimating biophysical and geometrical parameters of grapevine canopies (‘Sangiovese’) by an unmanned aerial vehicle (UAV) and VIS-NIR cameras. Vitis 2017, 56, 63–70. [Google Scholar]
  24. Johansen, K.; Raharjo, T.; McCabe, M.F. Using multi-spectral UAV imagery to extract tree crop structural properties and assess pruning effects. Remote Sens. 2018, 10, 854. [Google Scholar] [CrossRef] [Green Version]
  25. Caruso, G.; Zarco-Tejada, P.J.; González-Dugo, V.; Moriondo, M.; Tozzini, L.; Palai, G.; Rallo, G.; Hornero, A.; Primicerio, J.; Gucci, R. High-resolution imagery acquired from an unmanned platform to estimate biophysical and geometrical parameters of olive trees under different irrigation regimes. PLoS ONE 2019, 14, e0210804. [Google Scholar] [CrossRef] [Green Version]
  26. Salamí, E.; Gallardo, A.; Skorobogatov, G.; Barrado, C. On-the-fly olive tree counting using a UAS and cloud services. Remote Sens. 2019, 11, 316. [Google Scholar] [CrossRef] [Green Version]
  27. Ok, A.O.; Ozdarici-Ok, A. Detection of citrus trees from UAV DSMs. In Proceedings of the ISPRS Annals of the Photogrammetry, Remote Sensing and Spatial Information Sciences, Hannover, Germany, 6–9 June 2017; Volumn 4, pp. 27–34. [Google Scholar]
  28. Torres-Sánchez, J.; López-Granados, F.; Serrano, N.; Arquero, O.; Peña, J.M. High-throughput 3-D monitoring of agricultural-tree plantations with Unmanned Aerial Vehicle (UAV) technology. PLoS ONE 2015, 10, e0130479. [Google Scholar] [CrossRef] [Green Version]
  29. Fawcett, D.; Azlan, B.; Hill, T.C.; Kho, L.K.; Bennie, J.; Anderson, K. Unmanned aerial vehicle (UAV) derived structure-from-motion photogrammetry point clouds for oil palm (Elaeis guineensis) canopy segmentation and height estimation. Int. J. Remote Sens. 2019, 40, 1–23. [Google Scholar] [CrossRef] [Green Version]
  30. Sarron, J.; Malézieux, É.; Sané, C.A.B.; Faye, É. Mango yield mapping at the orchard scale based on tree structure and land cover assessed by UAV. Remote Sens. 2018, 10, 1900. [Google Scholar] [CrossRef] [Green Version]
  31. Marques, P.; Pádua, L.; Adão, T.; Hruška, J.; Peres, E.; Sousa, A.; Sousa, J.J. UAV-Based Automatic Detection and Monitoring of Chestnut Trees. Remote Sens. 2019, 11, 855. [Google Scholar] [CrossRef] [Green Version]
  32. Gevaert, C.M.; Persello, C.; Sliuzas, R.; Vosselman, G. Informal settlement classification using point-cloud and image-based features from UAV data. ISPRS J. Photogramm. Remote Sens. 2017, 125, 225–236. [Google Scholar] [CrossRef]
  33. Neto, J.C. A Combined Statistical-Soft Computing Approach for Classification and Mapping Weed Species in Minimum—Tillage Systems. Ph.D. Thesis, University of Nebraska—Lincoln, Lincoln, NE, USA, August 2004. [Google Scholar]
  34. Bendig, J.; Yu, K.; Aasen, H.; Bolten, A.; Bennertz, S.; Broscheit, J.; Gnyp, M.L.; Bareth, G. Combining UAV-based plant height from crop surface models, visible, and near infrared vegetation indices for biomass monitoring in barley. Int. J. Appl. Earth Obs. Geoinf. 2015, 39, 79–87. [Google Scholar] [CrossRef]
  35. Pérez, A.J.; López, F.; Benlloch, J.V.; Christensen, S. Colour and shape analysis techniques for weed detection in cereal fields. Comput. Electron. Agric. 2000, 25, 197–212. [Google Scholar] [CrossRef]
  36. Tucker, C.J. Red and photographic infrared linear combinations for monitoring vegetation. Remote Sens. Environ. 1979, 8, 127–150. [Google Scholar] [CrossRef] [Green Version]
  37. Yang, W.; Wang, S.; Zhao, X.; Zhang, J.; Feng, J. Greenness identification based on HSV decision tree. Inf. Process. Agric. 2015, 2, 149–160. [Google Scholar] [CrossRef] [Green Version]
  38. Meyer, G.E.; Neto, J.C. Verification of color vegetation indices for automated crop imaging applications. Comput. Electron. Agric. 2008, 63, 282–293. [Google Scholar] [CrossRef]
  39. Lv, J.; Wang, F.; Xu, L.; Ma, Z.; Yang, B. A segmentation method of bagged green apple image. Sci. Hortic. 2019, 246, 411–417. [Google Scholar] [CrossRef]
  40. Huang, H.; Li, X.; Chen, C. Individual Tree Crown Detection and Delineation from Very-High-Resolution UAV Images Based on Bias Field and Marker-Controlled Watershed Segmentation Algorithms. IEEE J. Sel. Top. Appl. Earth Obs. Remote Sens. 2018, 11, 2253–2262. [Google Scholar] [CrossRef]
  41. Marker-Controlled_Watershed. Available online: https://imagej.net/Marker-controlled_Watershed (accessed on 23 October 2019).
  42. Bala, A. An Improved Watershed Image Segmentation Technique using MATLAB. Int. J. Sci. Eng. Res. 2012, 3, 1–4. [Google Scholar]
  43. Mohan, M.; Silva, C.A.; Klauberg, C.; Jat, P.; Catts, G.; Cardil, A.; Hudak, A.T.; Dia, M. Individual tree detection from unmanned aerial vehicle (UAV) derived canopy height model in an open canopy mixed conifer forest. Forests 2017, 8, 340. [Google Scholar] [CrossRef] [Green Version]
  44. Ozdarici-Ok, A. Automatic detection and delineation of citrus trees from VHR satellite imagery. Int. J. Remote Sens. 2015, 36, 4275–4296. [Google Scholar] [CrossRef]
  45. Yin, D.; Wang, L. How to assess the accuracy of the individual tree-based forest inventory derived from remotely sensed data: A review. Int. J. Remote Sens. 2016, 37, 4521–4553. [Google Scholar] [CrossRef]
  46. Jing, L.; Hu, B.; Li, J.; Noland, T. Automated delineation of individual tree crowns from lidar data by multi-scale analysis and segmentation. PERS Photogramm. Eng. Remote Sens. 2012, 78, 1275–1284. [Google Scholar] [CrossRef]
  47. Fang, F.; Im, J.; Lee, J.; Kim, K. An improved tree crown delineation method based on live crown ratios from airborne LiDAR data. GISci. Remote Sens. 2016, 53, 402–419. [Google Scholar] [CrossRef]
  48. Pohl, C.; Van Genderen, J. Remote Sensing Image Fusion: A Practical Guide; CRC Press: Boca Raton, FL, USA, 2016. [Google Scholar]
  49. Ok, A.O.; Ozdarici-Ok, A. 2-D delineation of individual citrus trees from UAV-based dense photogrammetric surface models. Int. J. Digit. Earth 2018, 11, 583–608. [Google Scholar] [CrossRef]
  50. Díaz-Varela, R.A.; de la Rosa, R.; León, L.; Zarco-Tejada, P.J. High-resolution airborne UAV imagery to assess olive tree crown parameters using 3D photo reconstruction: Application in breeding trials. Remote Sens. 2015, 7, 4213–4232. [Google Scholar] [CrossRef] [Green Version]
Figure 1. Overview of the study areas. (a) The location of the study areas in China. (b) An image of the study areas acquired by the Sentinel-2 satellite.
Remotesensing 12 00133 g001
Figure 2. Images of Plot 1(left) and Plot 2 (right) obtained by an unmanned aerial vehicle (UAV).
Remotesensing 12 00133 g002
Figure 3. The DJI Mavic 2 Pro UAV used for the images’ acquisition.
Remotesensing 12 00133 g003
Figure 4. A schematic showing the workflow of the proposed method.
Remotesensing 12 00133 g004
Figure 5. Categories of tree-crown matching based on the spatial relationships between the reference tree-crowns and the tree-crowns extracted using the proposed method.
Remotesensing 12 00133 g005
Figure 6. The digital orthophoto mosaic (DOM), digital surface models (DSMs), digital terrain models (DTMs), and digital height models (DHMs) generated from UAV-acquired images. (a) shows the DOM of the wider study area. (b,e), (c,f), and (d,g) show the DSMs, DTMs, and DHMs for Plot 1 and Plot 2, respectively.
Remotesensing 12 00133 g006
Figure 7. Overlays of the outlines of extracted and reference tree-crowns for (a) Plot 1 and (b) Plot 2.
Remotesensing 12 00133 g007
Figure 8. Box-and-whisker plots showing the statistical differences between the reference values and extracted values of tree-crown area (a,b) and tree-crown diameter (c,d) for the two study plots at the individual tree level.
Remotesensing 12 00133 g008aRemotesensing 12 00133 g008b
Figure 9. Results of the linear regression between the extracted and reference tree-crown areas for Plot 1 (a) and Plot 2 (b).
Remotesensing 12 00133 g009
Figure 10. Results of the linear regression between the extracted and reference tree-crown diameters for Plot 1 (a) and Plot 2 (b).
Remotesensing 12 00133 g010
Figure 11. Examples of unidentified trees. (a): Plot 1; (b): Plot 2.
Remotesensing 12 00133 g011
Table 1. The specifications of the DJI Mavic 2 Pro UAV.
ParametersSpecifications
AircraftTakeoff weight0.907 kg
BatteryLithium-Polymer 4S battery: 3850 mAh
Maximum flight time31 minutes (at a consistent 25 kph)
CameraSensor1″ (CMOS)
Camera lensFOV 77° 28 mm
Effective pixels20 Megapixels
Pixel size2.4 μm ∗ 2.4 μm
Still image size5472 × 3648 (pixels)
Image formatJPEG
Table 2. Settings used for the processing of UAV-acquired images.
Processing StepsParametersSetting
Initial processing Keypoints Image ScaleFull
Matching Image PairsAerial Grid or Corridor
Targeted Number of Keypoints Automatic
Calibration MethodStandard
Point Cloud and MeshImage ScaleMultiscale, 1/2 (Half image size, Default)
Point Density Optimal
Minimum Number of Matches3
Generate 3D Textured MeshYes
3D Textured Mesh SettingsMedium Resolution (default)
Color Balancing: no
DSM, Orthomosaic, and indexResolution1*GSD (1.14 (cm/pixel))
DSM FiltersNoise Filtering: yes
Surface Smoothing: yes, Type: Sharp
Raster DSMGenerated: yes
Method: Inverse Distance Weighting
Merge Tiles: yes
OrthomosaicGenerated: yes
Merge Tiles: yes
Raster DTMGenerated: yes
Resolution: 5*GSD (1.14 (cm/pixel))
Table 3. Evaluation of the accuracy of tree detection by the proposed method in the two study plots.
Evaluate IndicatorsPlot 1Plot 2
TP345206
FP11
FN62
PA (%)98.399.0
UA (%)99.799.5
F (%)99.099.3
Table 4. The Producer’s Accuracy (PA) of tree-crown delineation for Plot 1 and Plot 2 using the proposed method.
CategoriesPlot 1Plot 2
Ema336201
Enm32
Eme00
Esp62
Emi00
Ewr01
PA (%)97.498.0
Table 5. The User’s Accuracy (UA) of tree-crown delineation for Plot 1 and Plot 2 using the proposed method.
CategoriesPlot 1Plot 2
Rma336201
Rnm32
Rme124
Rsp00
Rmi10
UA (%)95.597.1
Table 6. Results of the statistical analysis of the areas of the extracted and reference tree-crowns for the two study plots.
Statistical ParametersPlot 1Plot 2
Ae(m2)Ar (m2)Ae(m2)Ar(m2)
Min0.412 0.470 0.274 0.280
Q13.479 3.058 2.701 2.368
Median4.592 4.130 3.149 2.707
Q35.434 4.877 3.572 3.227
Max8.521 6.789 7.061 5.492
Mean4.351 3.939 3.105 2.766
Ae is the extracted tree-crown area, Ar is the reference tree-crown area, Q1 is the first quartile, and Q3 is the third quartile.
Table 7. Results of the statistical analysis of the diameters of the extracted and reference tree-crowns for the two study plots.
Statistical ParametersPlot 1Plot 2
De(m)Dr(m)De(m)Dr(m)
Min0.938 1.026 0.7560.766
Q12.574 2.424 2.2012.055
Median3.008 2.759 2.4162.228
Q33.264 3.018 2.6212.414
Max4.498 3.866 3.8393.162
Mean2.914 2.675 2.3952.226
De is the extracted tree-crown diameter and Dr is the reference tree-crown diameter.

