1. Introduction
One of the factors with the most influence on Mediterranean forest ecosystems is wildfires, as they damage the vegetation layer, modifying the water and sediment patterns and nutrient cycling [
1,
2,
3]. Fire severity is a key factor for the management of post-fire vegetation regeneration strategies [
4,
5] because it quantifies the impact of fire, describing the amount of damage inside the boundaries of a wildfire.
In situ evaluations of fire damage need expert intervention and used to be expensive and time-consuming. As an alternative, several indirect estimations of burn and fire severity have been developed based on remote sensing imagery. While the concept of burn severity includes both short- and long-term impacts of fire on an ecological system, fire severity only quantifies the short-term effects of fire in the immediate post-fire context [
6]. The indirect estimation methods can be divided into three groups: spectral unmixing [
7,
8], simulation techniques [
9] and spectral indices [
10,
11].
The Normalized Difference Vegetation Index (NDVI) and Normalized Burn Ratio (NBR) are two fire severity indices that are more frequently used when multispectral imagery is available, for example, from the Landsat Thematic Mapper or other terrestrial observation satellites [
5,
12,
13,
14,
15,
16,
17]. Both indices indirectly estimate photosynthetic activity through the characteristic difference between the red and infrared radiance of healthy plants. Specifically, NDVI uses the near-infrared portion of the electromagnetic spectrum and NBR uses the shortwave-infrared portion; for example, [
18] determined that shortwave-infrared band registered from the WorldView-3 satellite can provide valuable information for burn severity pattern detection.
Maybe because the red edge band used not to be available in most of the terrestrial observation satellite sensors, the Normalized Difference Red Edge (NDRE) has not been used as a fire severity estimator. Nevertheless, the red edge is sensitive to the chlorophyll content in leaves, variability in leaf area, and soil background effects, which can be useful for fire damage detection. When multispectral imagery is not available, some indices have been developed based on the characteristic difference between the green reflectance of vigorous vegetation and the other visible red and blue wavelengths [
11,
19].
The short-term effects of fire on vegetation are directly proportional to the increment of photosynthetic activity. So, fire severity is estimated through the difference (d) between indices pre- and post-fire.
Following the development of different sensors carried by satellites and some other aerial platforms in the last years, fire and burn severity estimations have been carried out. In [
20] the authors combined hyperspectral images from the MODIS satellite with field data to provide reliable estimates of fire severity levels of damage. Both Aerial Laser Scanners and Terrestrial Laser Scanners were applied by [
21] to map the estimated severity and by [
22] to monitor changes in a forest produced by a prescribed fire, respectively. The potential of radar imagery from the ALOS satellite for mapping burned areas was studied by [
23]. Fire and carbon emissions were estimated by [
24] using satellite-based vegetation optical depth with passive microwave satellite observations. The spatial and temporal distribution of surface temperature after fire and the severity were evaluated by [
14] using thermal imagery from the Landsat satellite.
Recently, Unmanned Aerial Vehicles (UAVs) have enabled the use of a large variety of sensors with the capacity for close range sensing and are applied in environmental engineering in general and for monitoring ecosystem responses to wildfire in particular [
25]. Digital cameras operating in the visible spectrum are used for UAV-photogrammetric projects combined with the Structure from Motion (SfM) [
26] and multi-view stereopsis (MSV) [
27] techniques, producing very high-resolution orthoimages and Digital Elevation Models (DEMs) as well as very dense point clouds of the terrain [
28,
29]. When the UAV sensor includes multispectral images, all the indices designed for satellite imagery can be applied or adapted to UAV applications.
Due to the low altitude of flights and high resolution of the sensors carried by UAVs, the accuracies of photogrammetric products can reach 0.053 m, 0.070 m, and 0.061 m in the X, Y, and Z directions, respectively, even in environs with extreme topography [
30]. These accuracy levels make it possible to evaluate severity at a local scale and to calibrate satellite data based on a regional scale, for example [
31], to correlate two fire severity indices obtained from a RGB sensor mounted on a UAV with two other classic indices obtained from a Landsat satellite, obtaining R
2 up to 0.81.
Furthermore, the facility of UAVs for flight based on the Global Navigation Satellite System (GNSS) is applied for autonomous navigation and flight route programming, which is very convenient for multitemporal monitoring of fire impacts on ecosystems and their regeneration. Unlike in satellite imagery, the temporal resolution of UAV imagery is controlled by the user, so flights can be programmed post-fire or even at the same time as the fire is occurring.
Despite all the technical characteristics and potential for fire severity classification, as far as we know, UAV imagery has only been applied for validation of fire severity indices based on remote sensing [
32] and for obtaining fire severity maps based on the visible spectrum [
19].
The aim of this work was to evaluate the utility of fire severity multispectral indices based on very high-resolution spatial imagery for classification of relative fire severity.
2. Materials and Methods
In this paper, the Excess Green Index (EGI) index in the domain of the visible spectrum and the NDVI and Normalized Difference Red Edge (NDRE) indices in the domain of the multispectral spectrum were applied to fire severity mapping based on UAV photogrammetric products and evaluated. The input data included multispectral imagery with visible, red edge, and near-infrared bands and in situ data evaluated before and after the prescribed fire, taking into account that there are no precedents in the use of NDRE as a fire severity index. Both flights were carried out pre- and post-prescribed fires in a Mediterranean shrubland located on the northern face of the Sierra de los Filabres, belonging to the siliceous territory of the Nevado-Filábride complex, in the Almeria province of southern Spain.
The differences between pre- and post-fire indices were reclassified into fire severity classes which were compared, for the purpose of the evaluation indices, with the reference data of fire severity. This reference map was obtained using in situ sampled data of fire damages as training information for Object-Based Image Analysis (OBIA) and then this segmentation was applied to supervised severity classification.
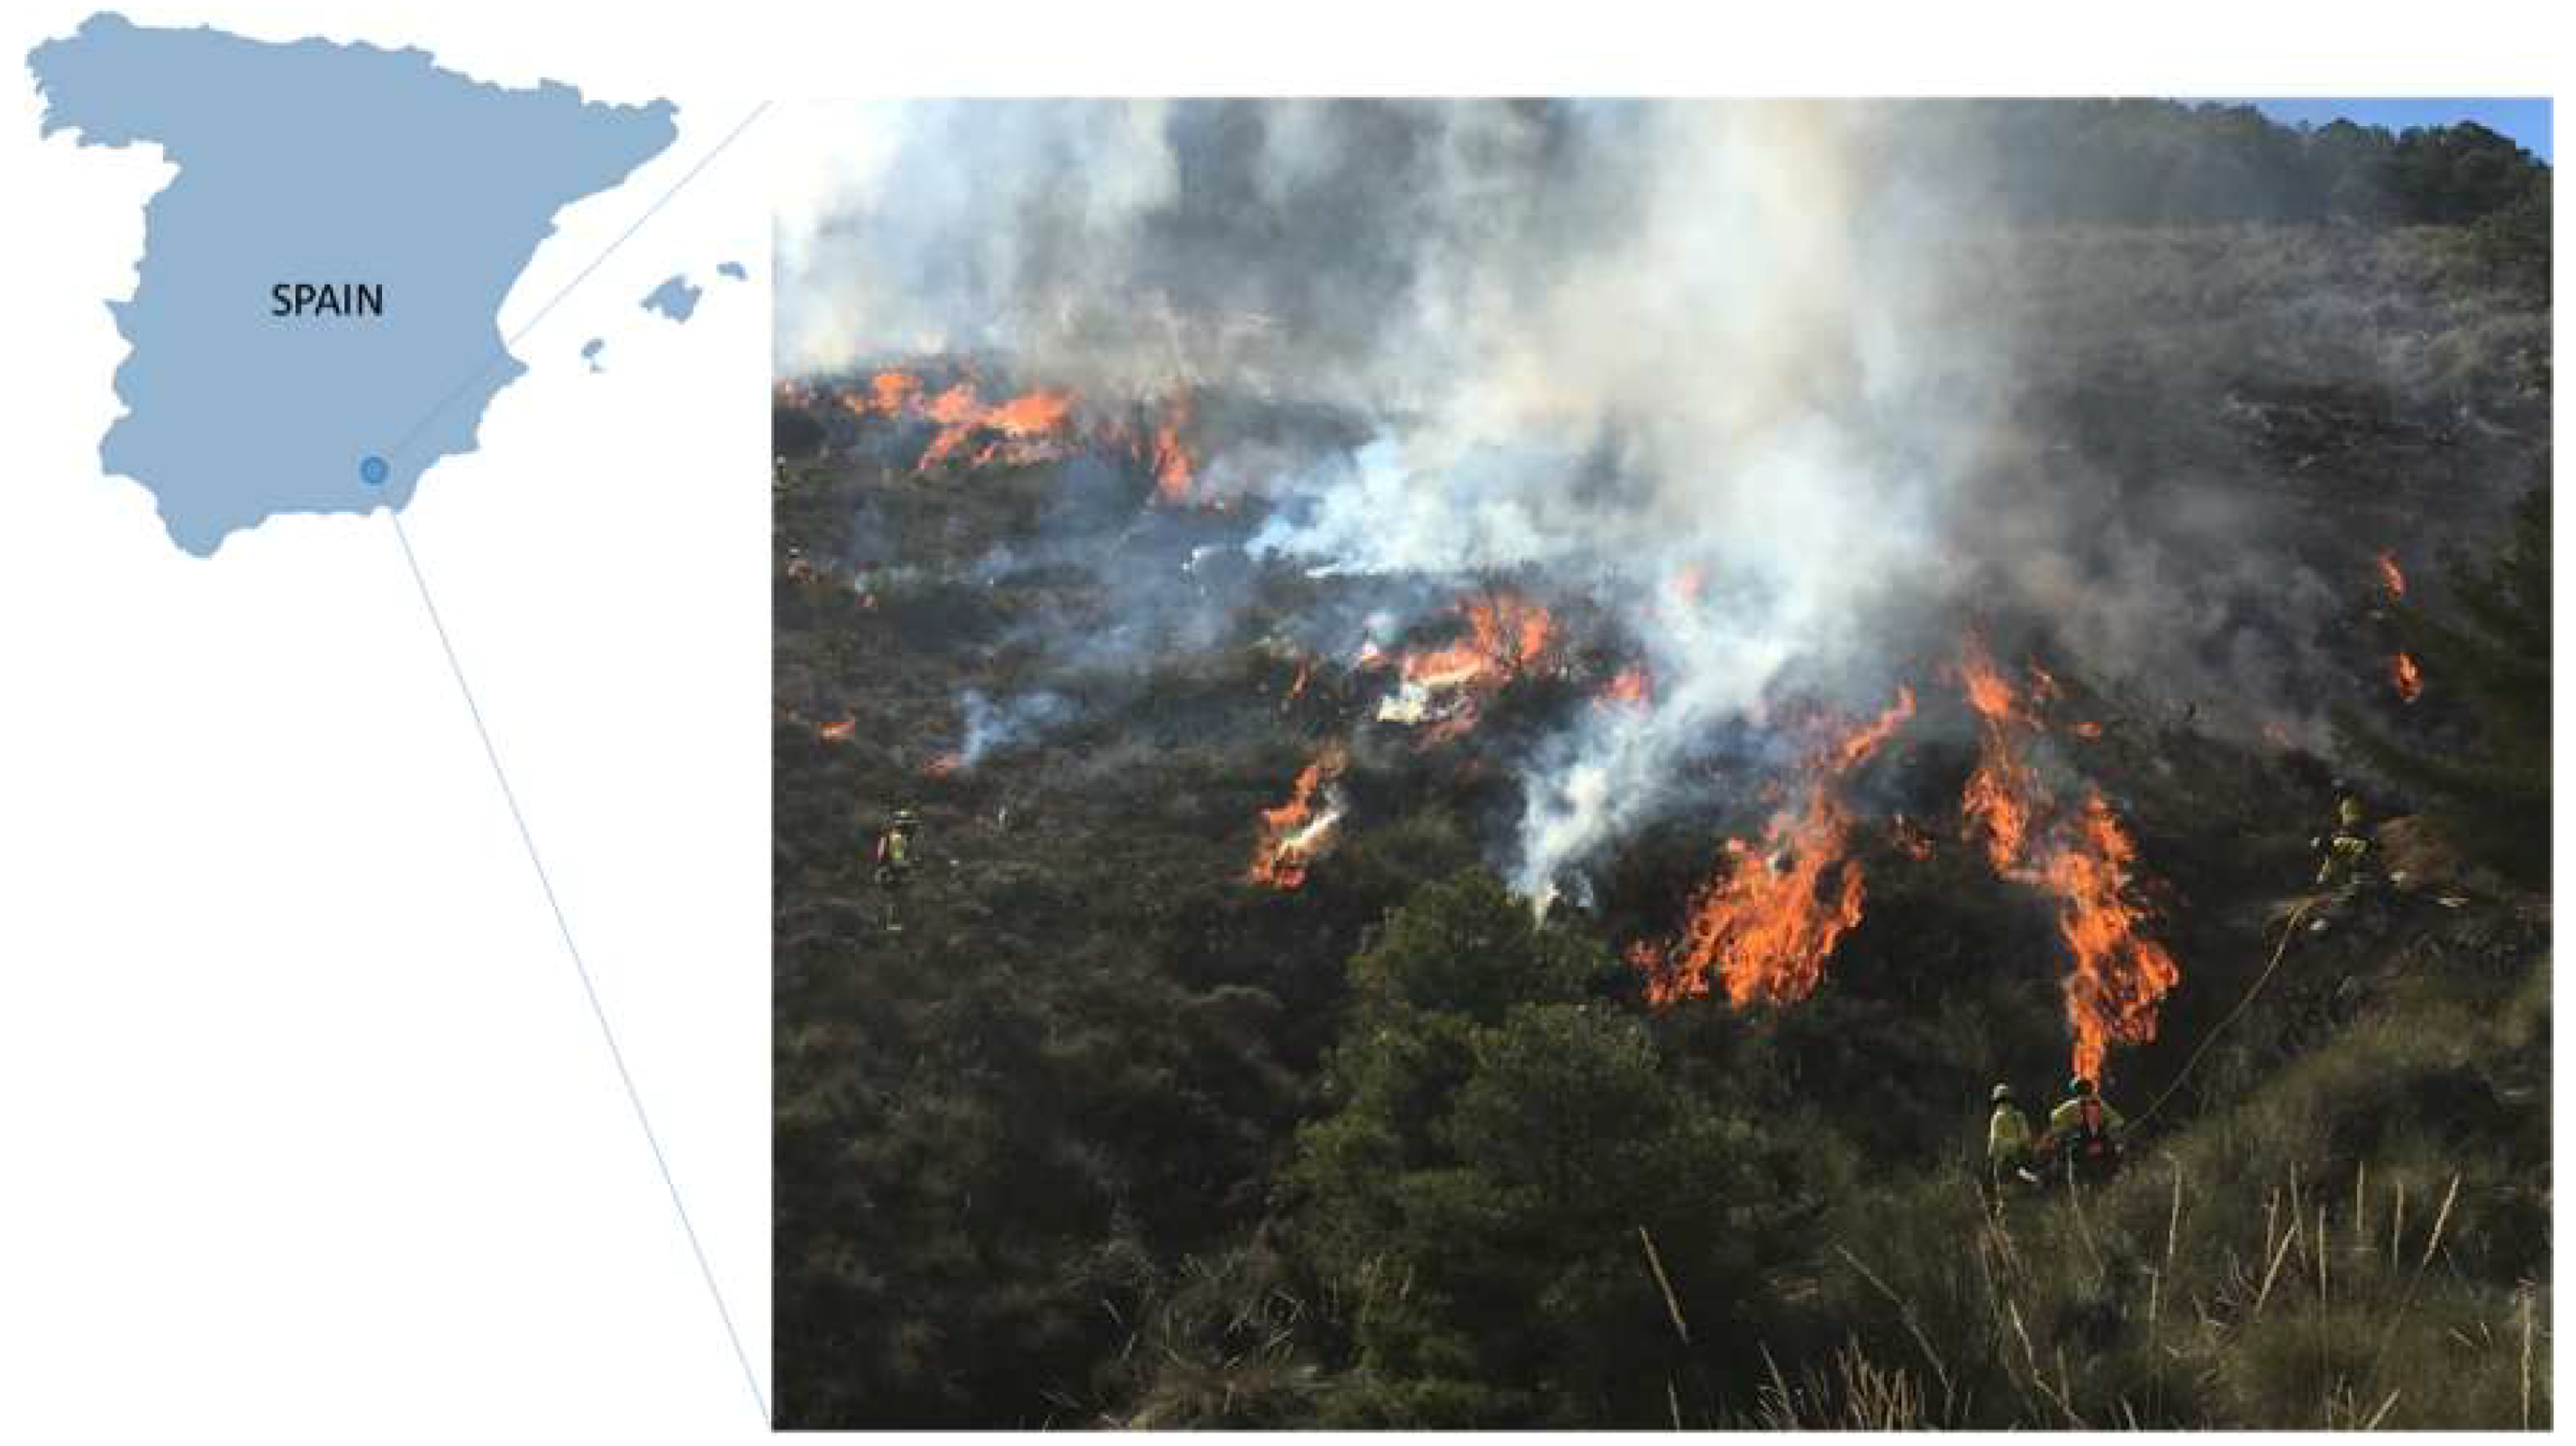
2.1. Study Area
The experimental plot was located on the northern face of the Sierra de los Filabres, with geographic coordinates of 37°18’35.30″N, 2°36’9.67″W (
Figure 1), in the Alcóntar municipality, in the province of Almería (Spain), belonging to the Béticas Mountain range [
33]. The forest is 5.5 km and 3.5 km from the Special Conservation Areas of Calares de Sierra de Baza and Sierra de Baza, respectively, which are included in the European Natura 2000 Protected Areas Network [
34].
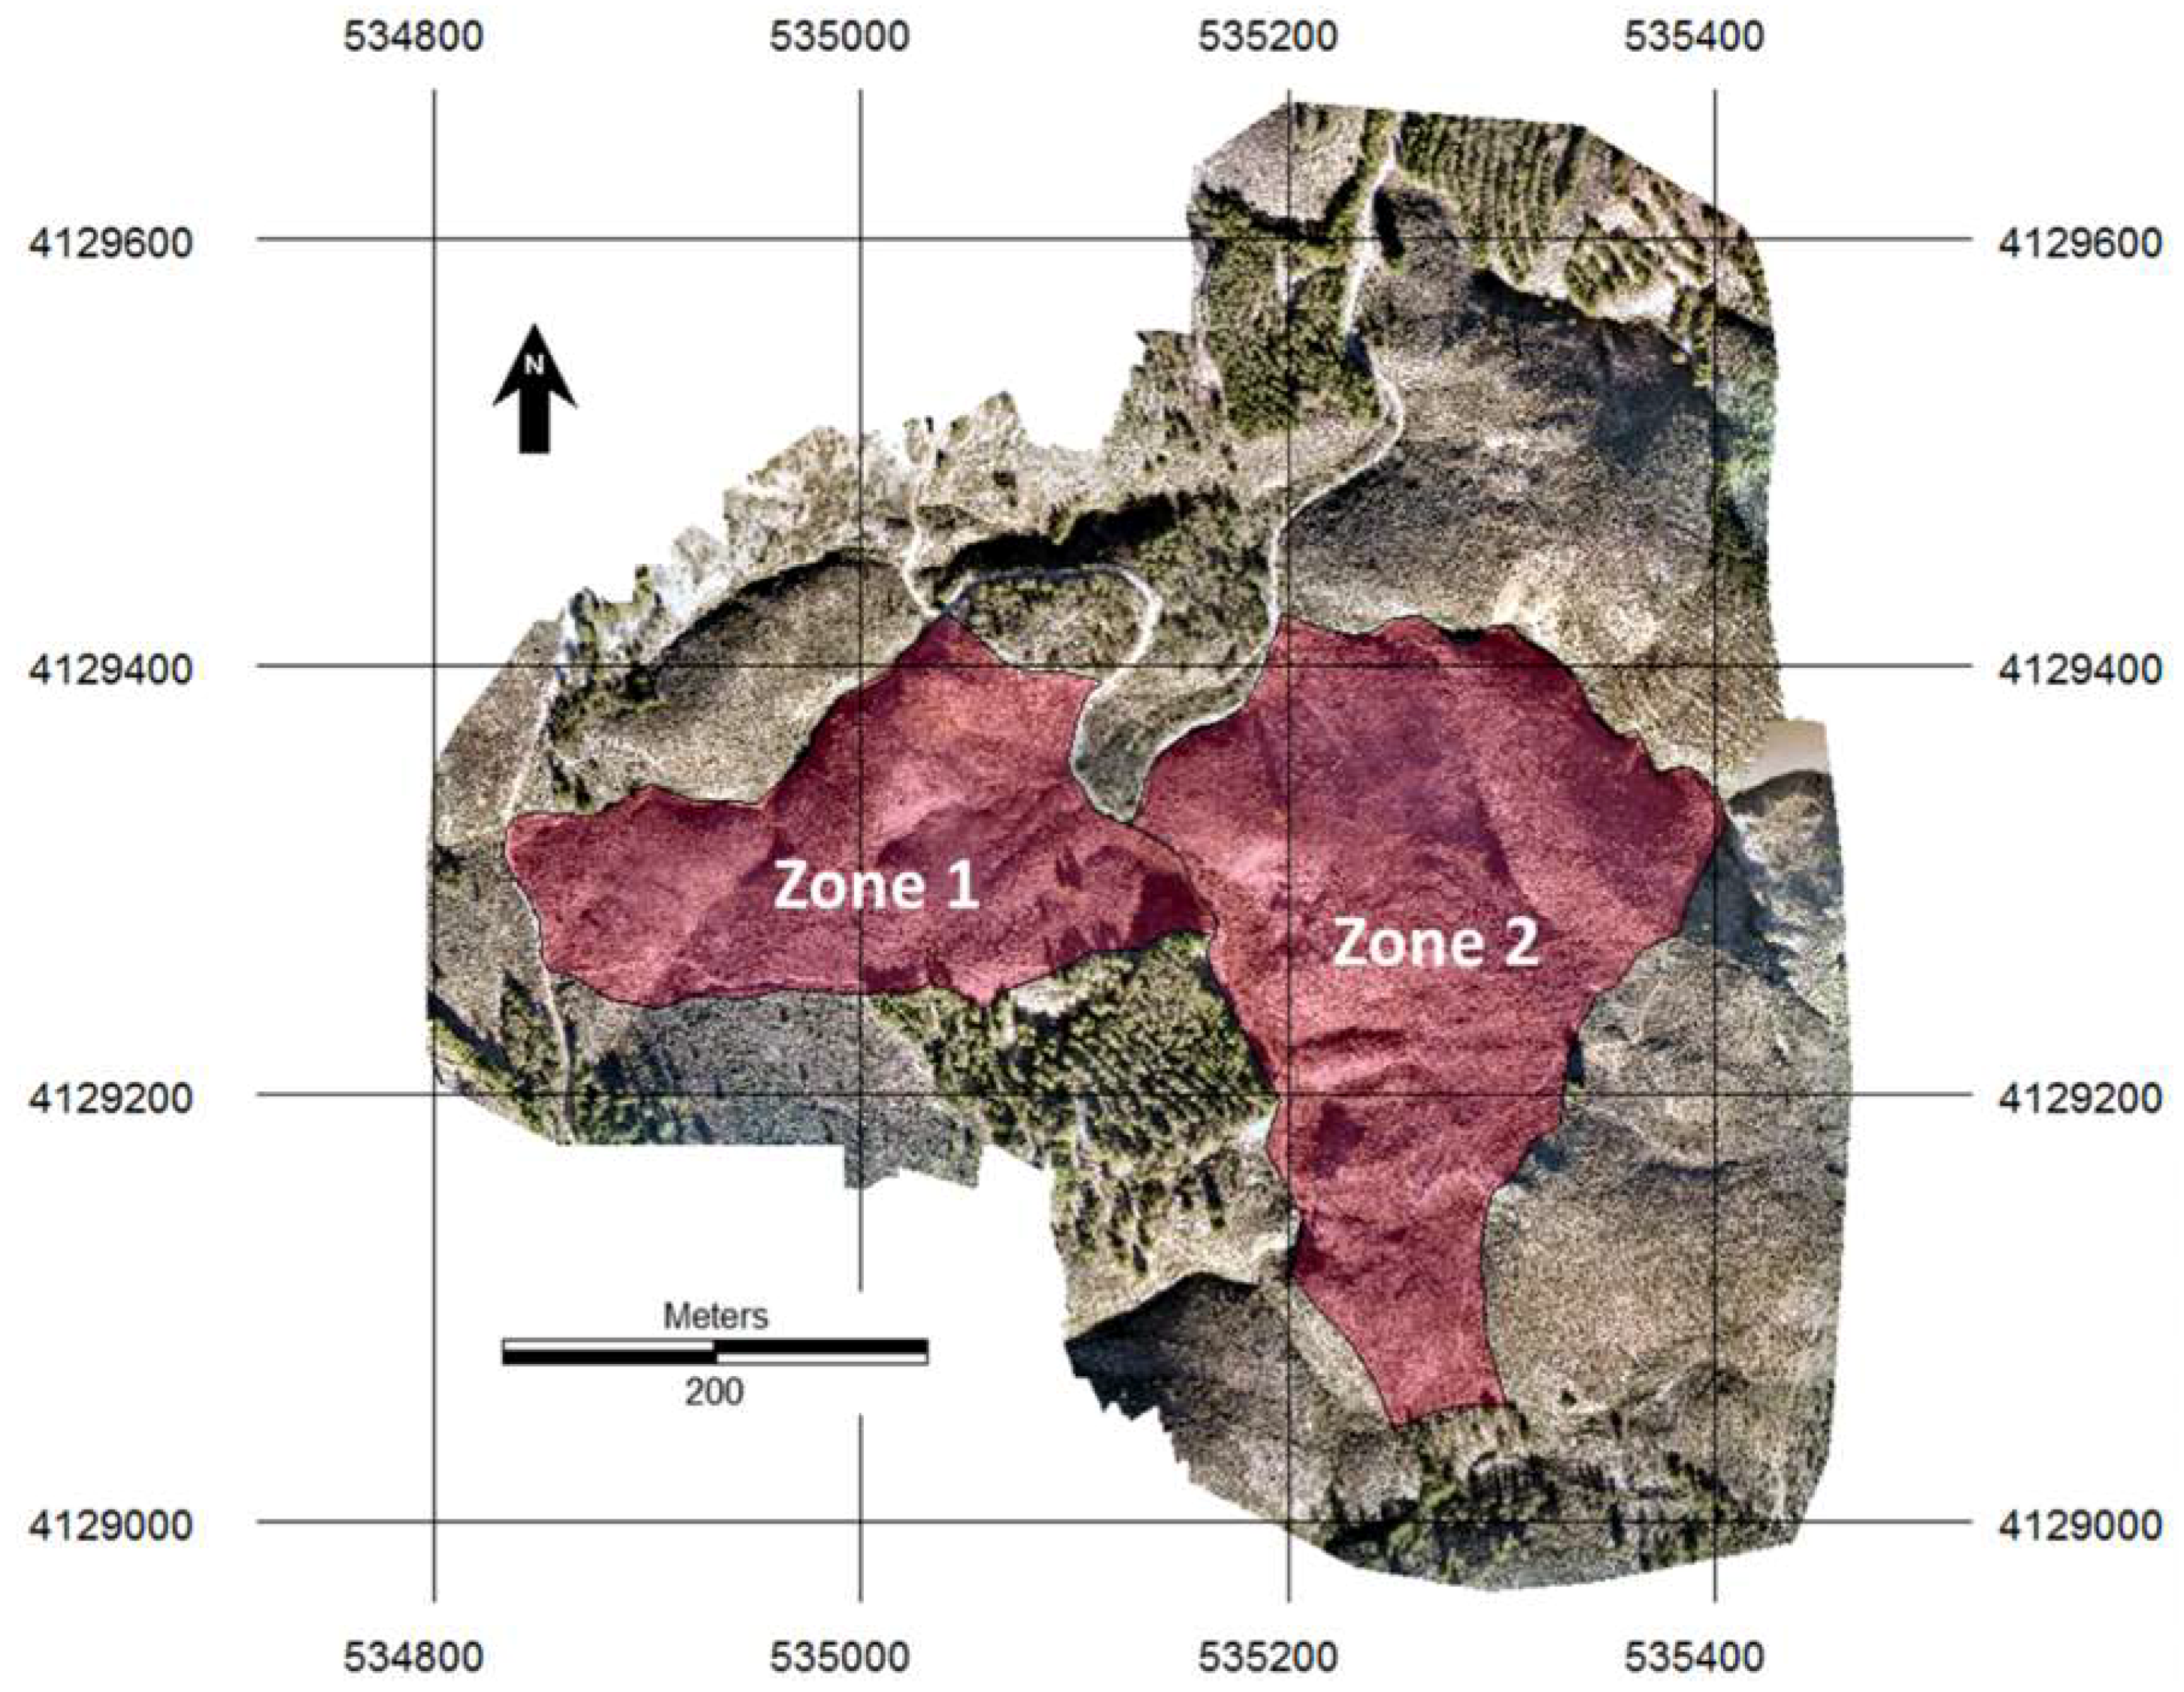
The total surface of the study area was 12.42 ha, divided into two zones of 3.41 and 5.61 ha, and numbered 1 and 2 respectively, where two practices were combined: prescribed fire and directed grazing after fire. Zones 1 and 2, shaded in
Figure 2, were burned on 18 December 2018, and after that, zone 2 was managed through grazing practice in order to test whether the natural regeneration process of shrubs after fire is slowed by the cattle action. Fire severity maps were necessary to characterize the initial fire damage at the beginning of the regeneration process. Average elevation of the study area was 1288.46 m over the sea level ranging from 1233 to 1240 m and average slope was 41.51%.
The climate in Sierra de los Filabres is classified as semiarid Mediterranean with a short, warm, arid summer and long, cold, dry winter. The annual average temperature is 13.9 °C and the annual average precipitation is 444 mm. Precipitation is scarce and irregular; pluriannual droughts are relatively frequent and intense.
The potential vegetation includes mid-mountain basophil holm oaks. Shrubs in regressive phase abound, as a consequence of anthropogenic action on the territory which is now abandoned, including old rain-fed crops, mining, and recent reforestation. The two most frequent species are gorse (Genista scorpius) and esparto grass (Macrochloa tenacissima).
According to the Environmental Information Network of Andalusia (REDIAM) [
35], soils in the study area are classified as eutric cambisols, eutric regosols, and chromic luvisols with lithosols.
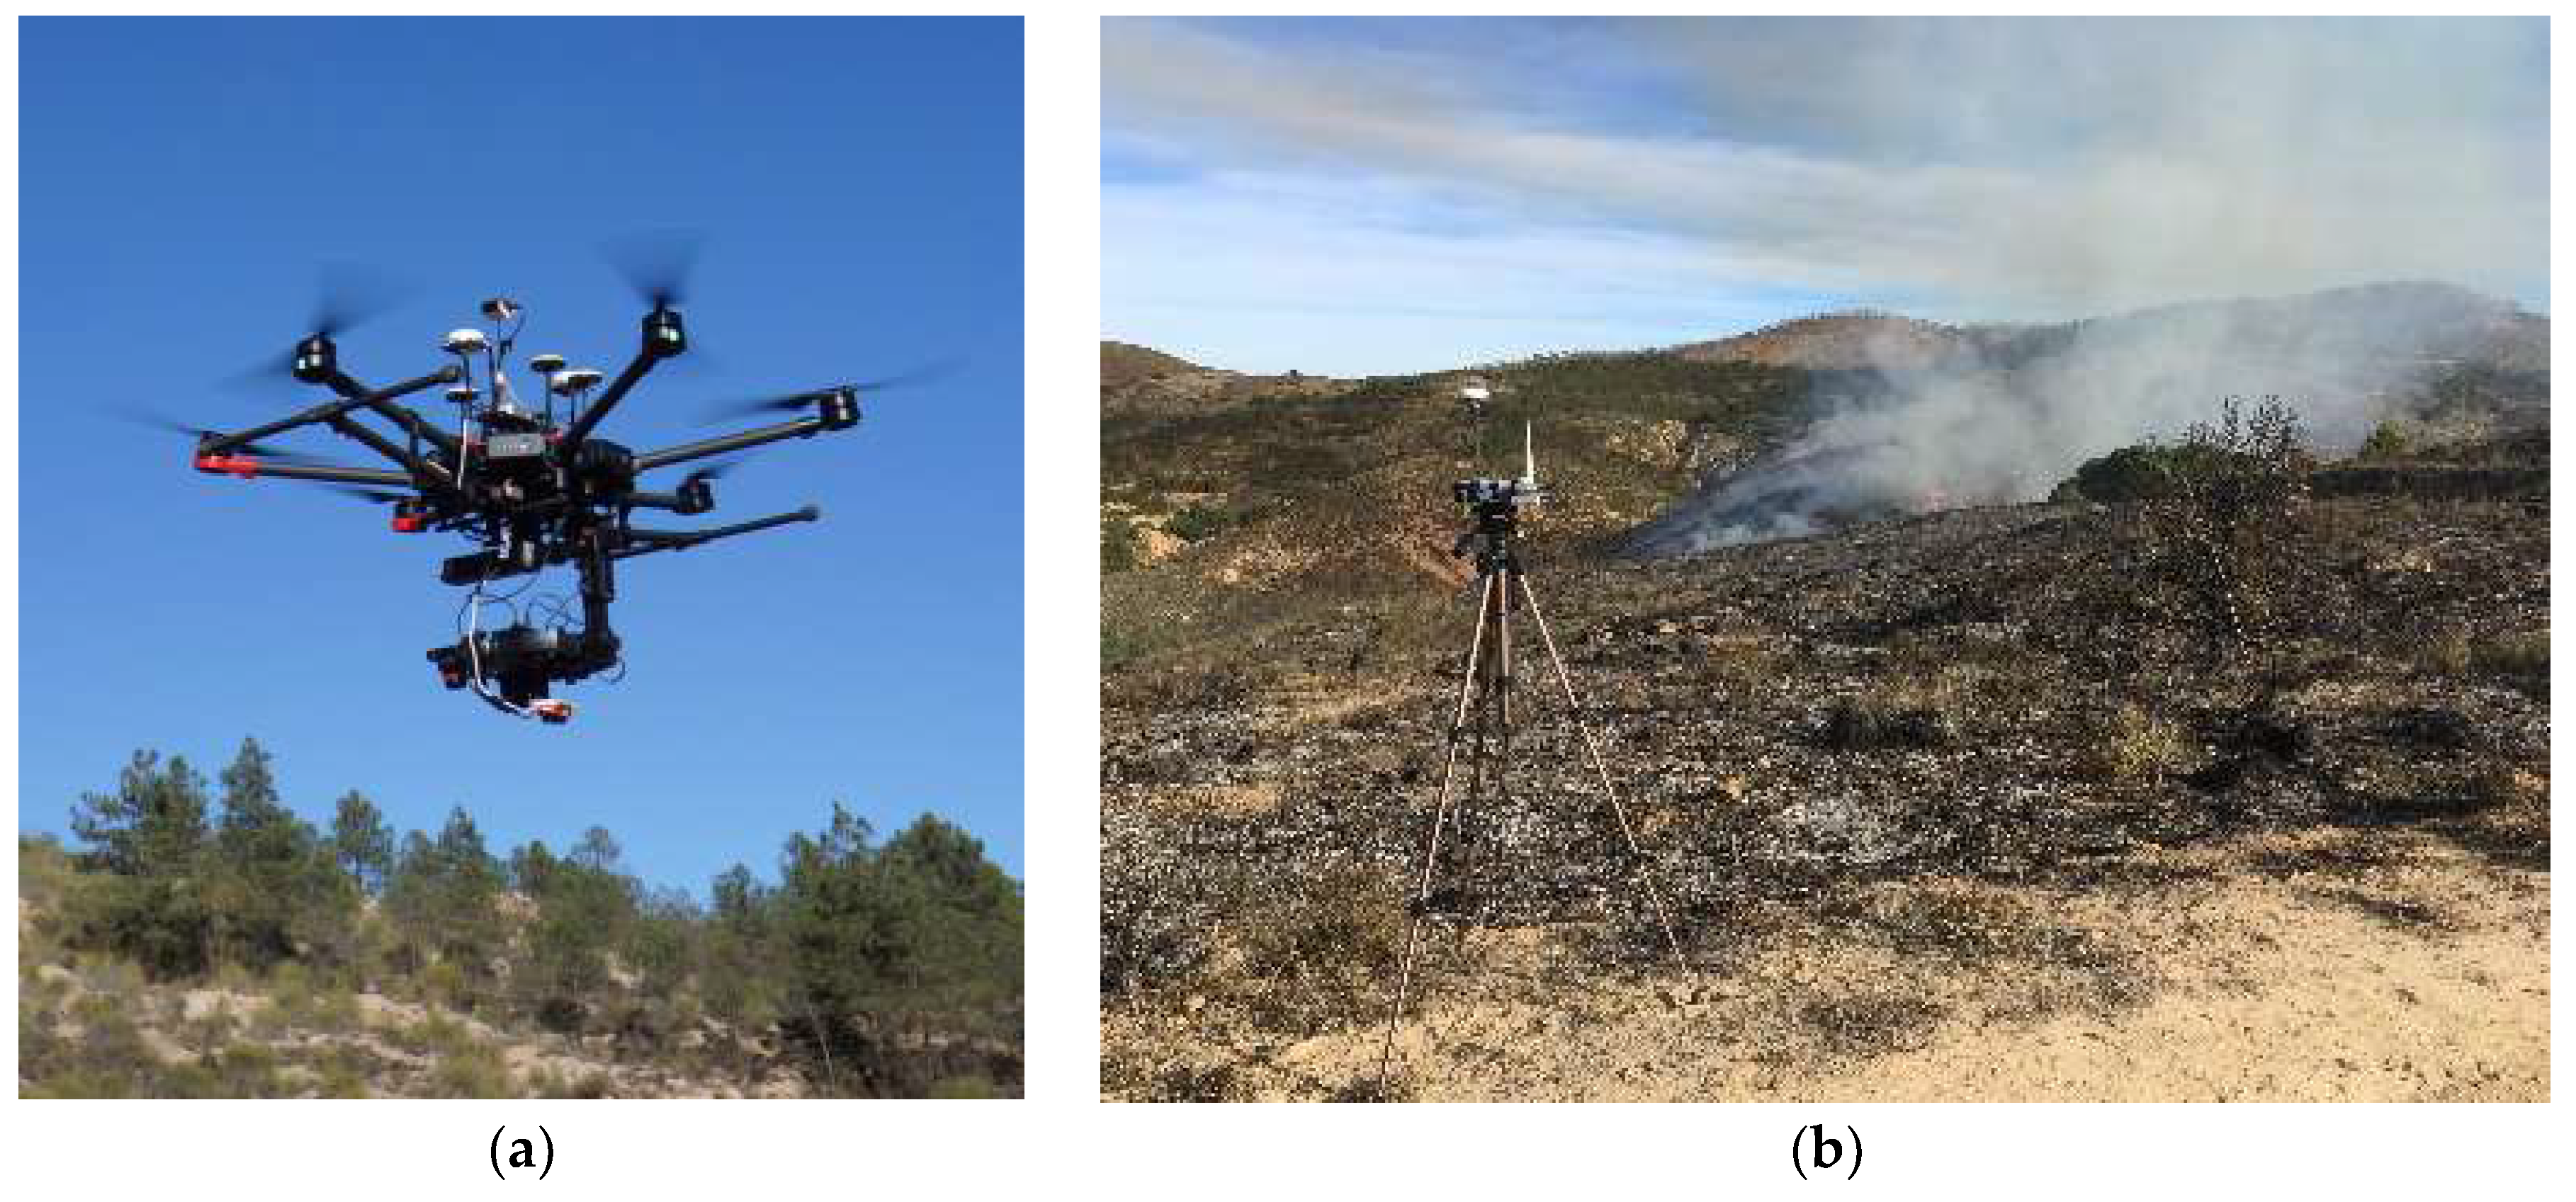
2.2. Unmanned Aerial Vehicle and Sensor
The images used in this work were taken from a rotatory wing DJI Matrice 600 Pro UAV with six rotors. The UAV was equipped with a Parrot Sequoia multispectral camera [
36] mounted on a motion-compensated three-axis gimbal (
Figure 3).
The Parrot Sequoia camera (
Figure 4) has four sensors with a resolution of 1.2 megapixels (1280 × 960) that collects multispectral imagery, employing global shutter in the green, red, red-edge and near-infrared wavelengths. The four lenses have a fixed focal length of 4 mm and horizontal and vertical FOV of 61.9 and 48.5 respectively. The Average Ground Sample Distance (GSD) was 7.22 cm, corresponding to a flight height of 56 m. Furthermore, the camera includes an integrated high-resolution RGB sensor of 16 megapixels (4608 × 3456), rolling shutter, and a minimum GSD of 1.5 cm at a flight height of 56 m, which are useful for the UAV photogrammetric process.
One of the most interesting characteristics of this multispectral camera is that it is equipped with an irradiance sensor to record light conditions in the same spectral bands as the multispectral sensor and at the same time as the flights. Thanks to this device, light changes throughout the time of flight can be compensated by calculating the absolute reflectance during post-processing.
The navigation and positioning system of the UAV was based on GNSS with a triple-redundant antenna system in addition to a differential real time kinematic (d-RTK) device, composed of a double antenna onboard the UAV and base station that emits real-time corrections to the onboard system. Using dynamic differential technology, the horizontal and vertical positioning accuracies that can be achieved are 1 cm + 1 ppm and 2 cm + 1 ppm, respectively, while the orientation accuracy is 1.3 degrees.
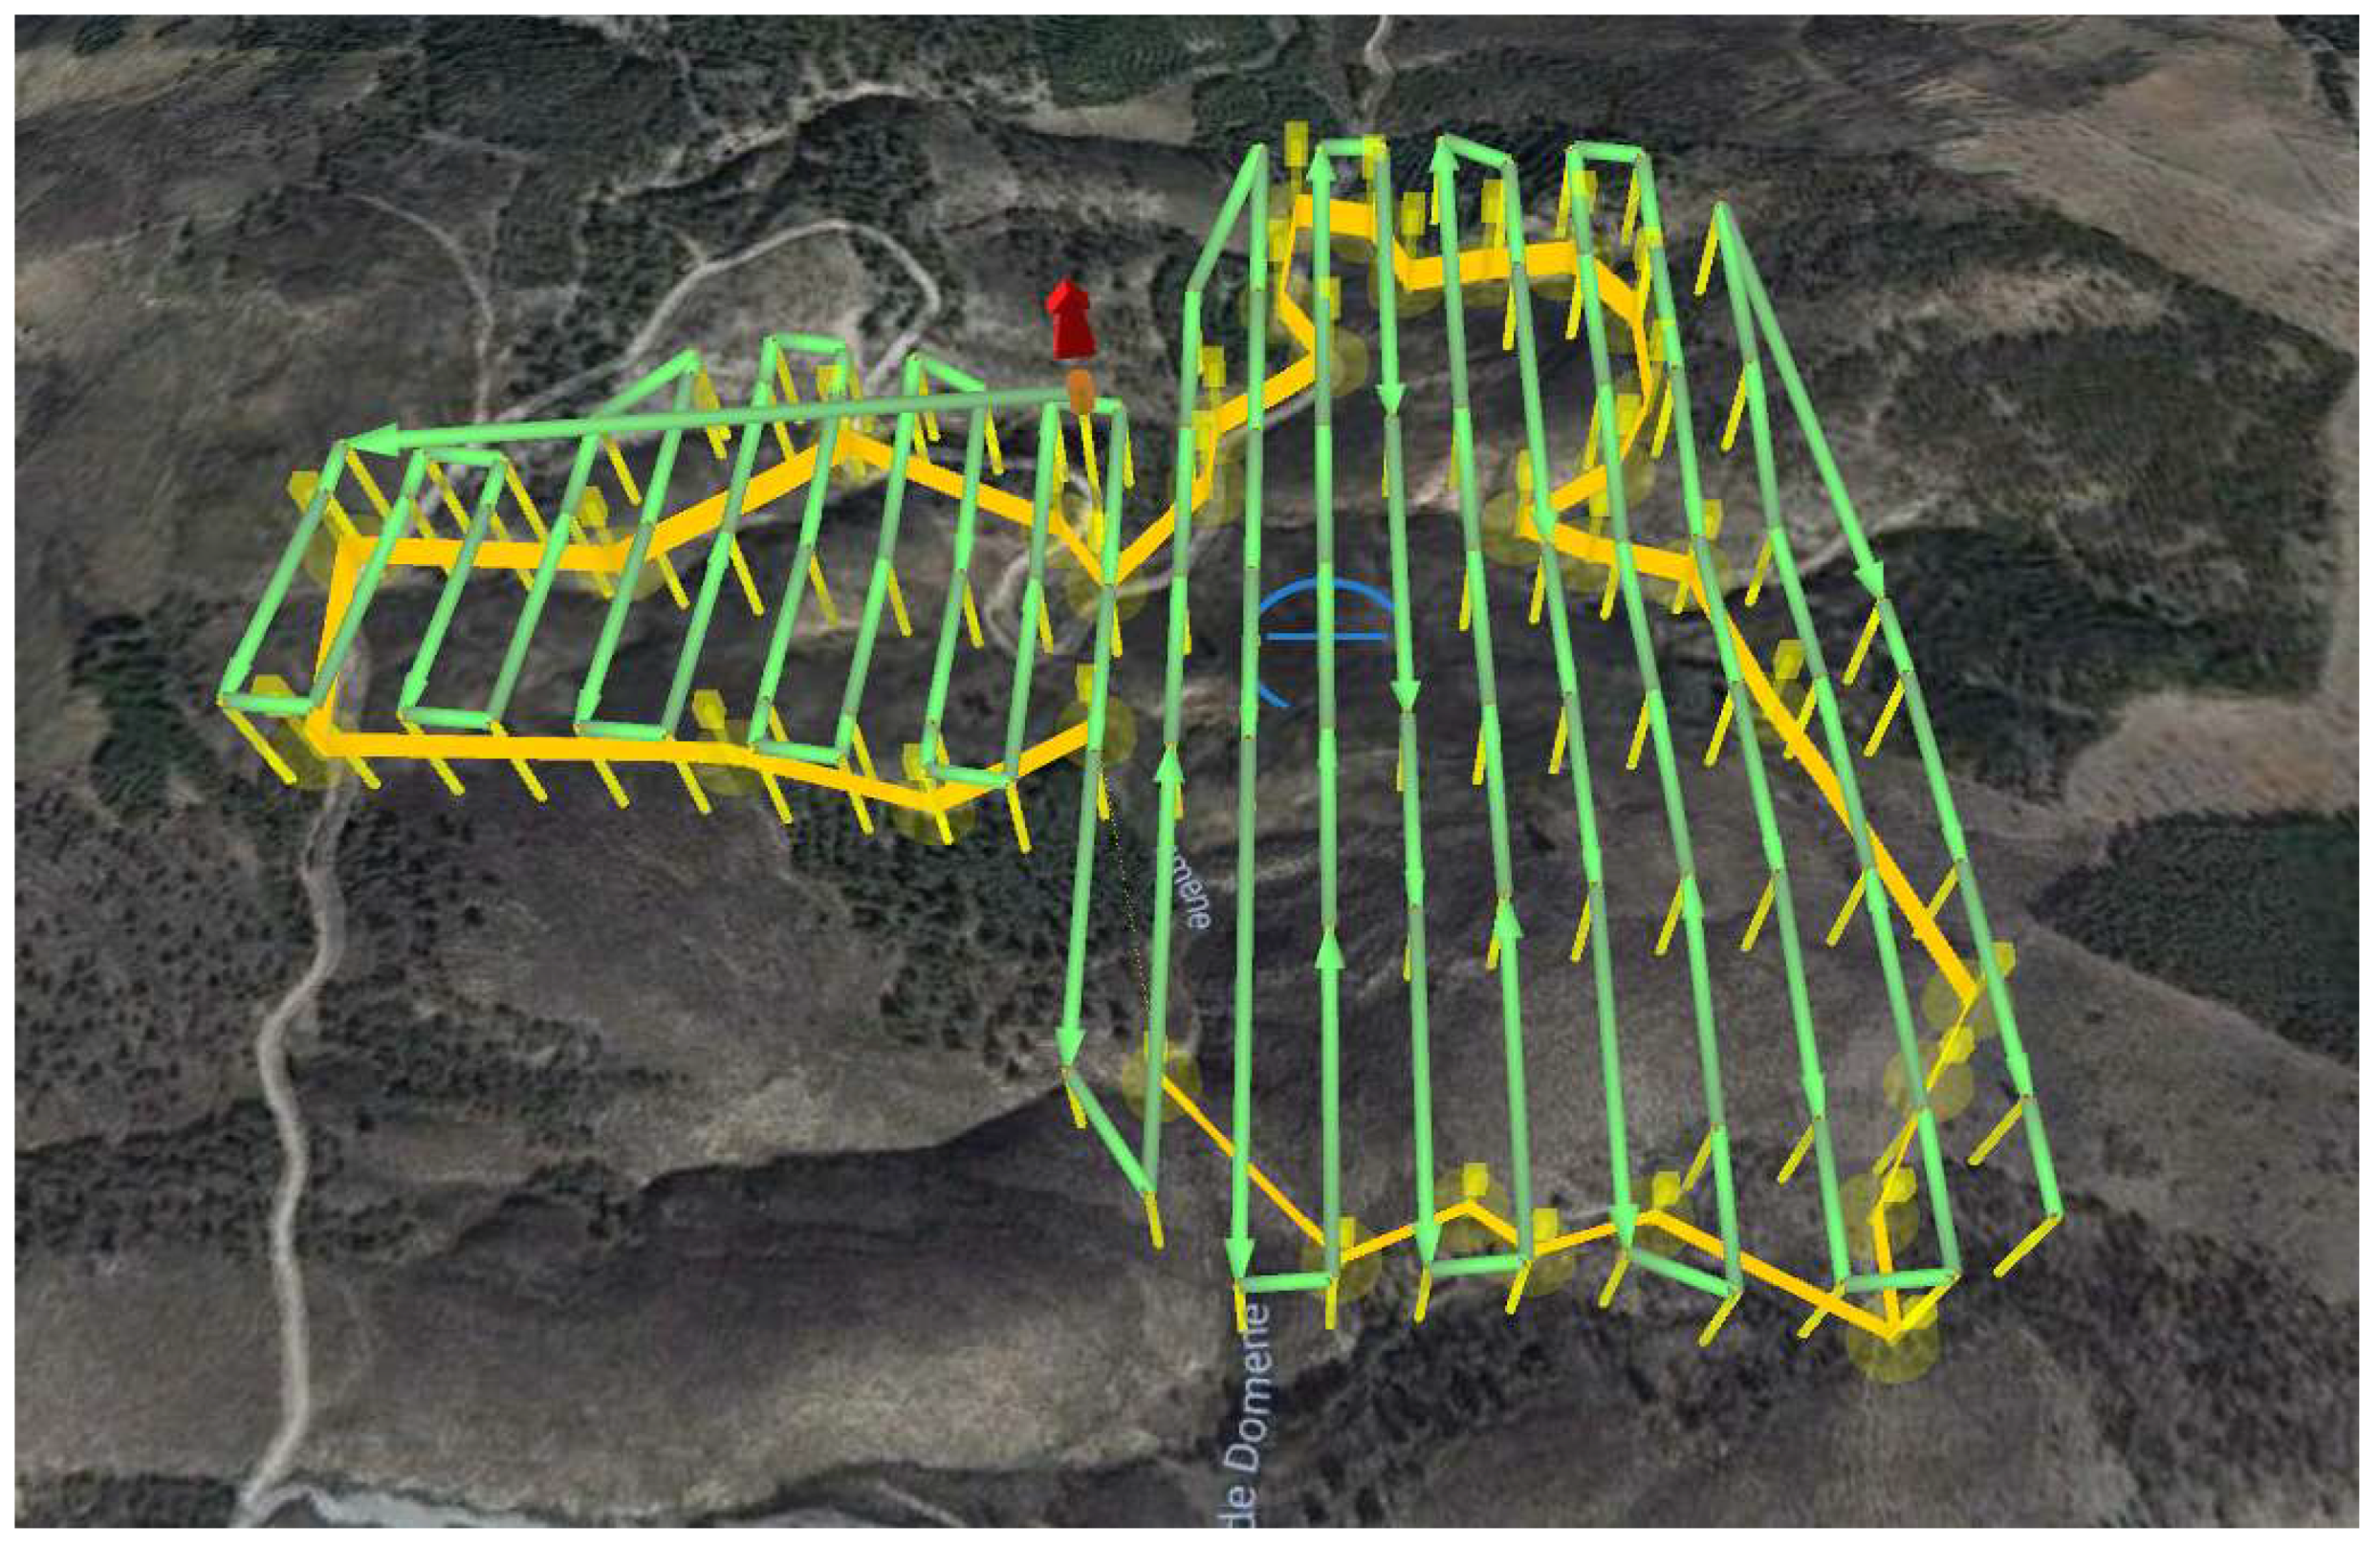
2.3. Flight Route Planning
When the topography is mountainous and the height of flight is low, changes of scale between images and even within an image can be problematic for photogrammetric process. This is a typical problem with UAV-photogrammetric flights that can be solved by planning flight routes that are composed of equidistant waypoints over the terrain.
Both pre-fire and post-fire flights were planned with one unique design (
Figure 5), following the flight route equidistant criteria with an altitude over ground level (AGL) of 56.2 m using UgCS 3.0 PRO software [
37]. The reference DSM was previously obtained from a low-resolution prospective UAV-photogrammetric flight.
At the AGL of 56.2 m, the GSD of the multispectral imagery can reach up to 3 cm. A total of 5475 images were acquired in each of the flights carried out on 17 and 18 December 2018, with longitudinal and transversal overlaps of 70% and 55% respectively and total time of flight of 38 min at UAV speed of 4 m/s. At the time of flights, the sun elevation was from 29.33° to 23.71°.
2.4. Survey Campaign
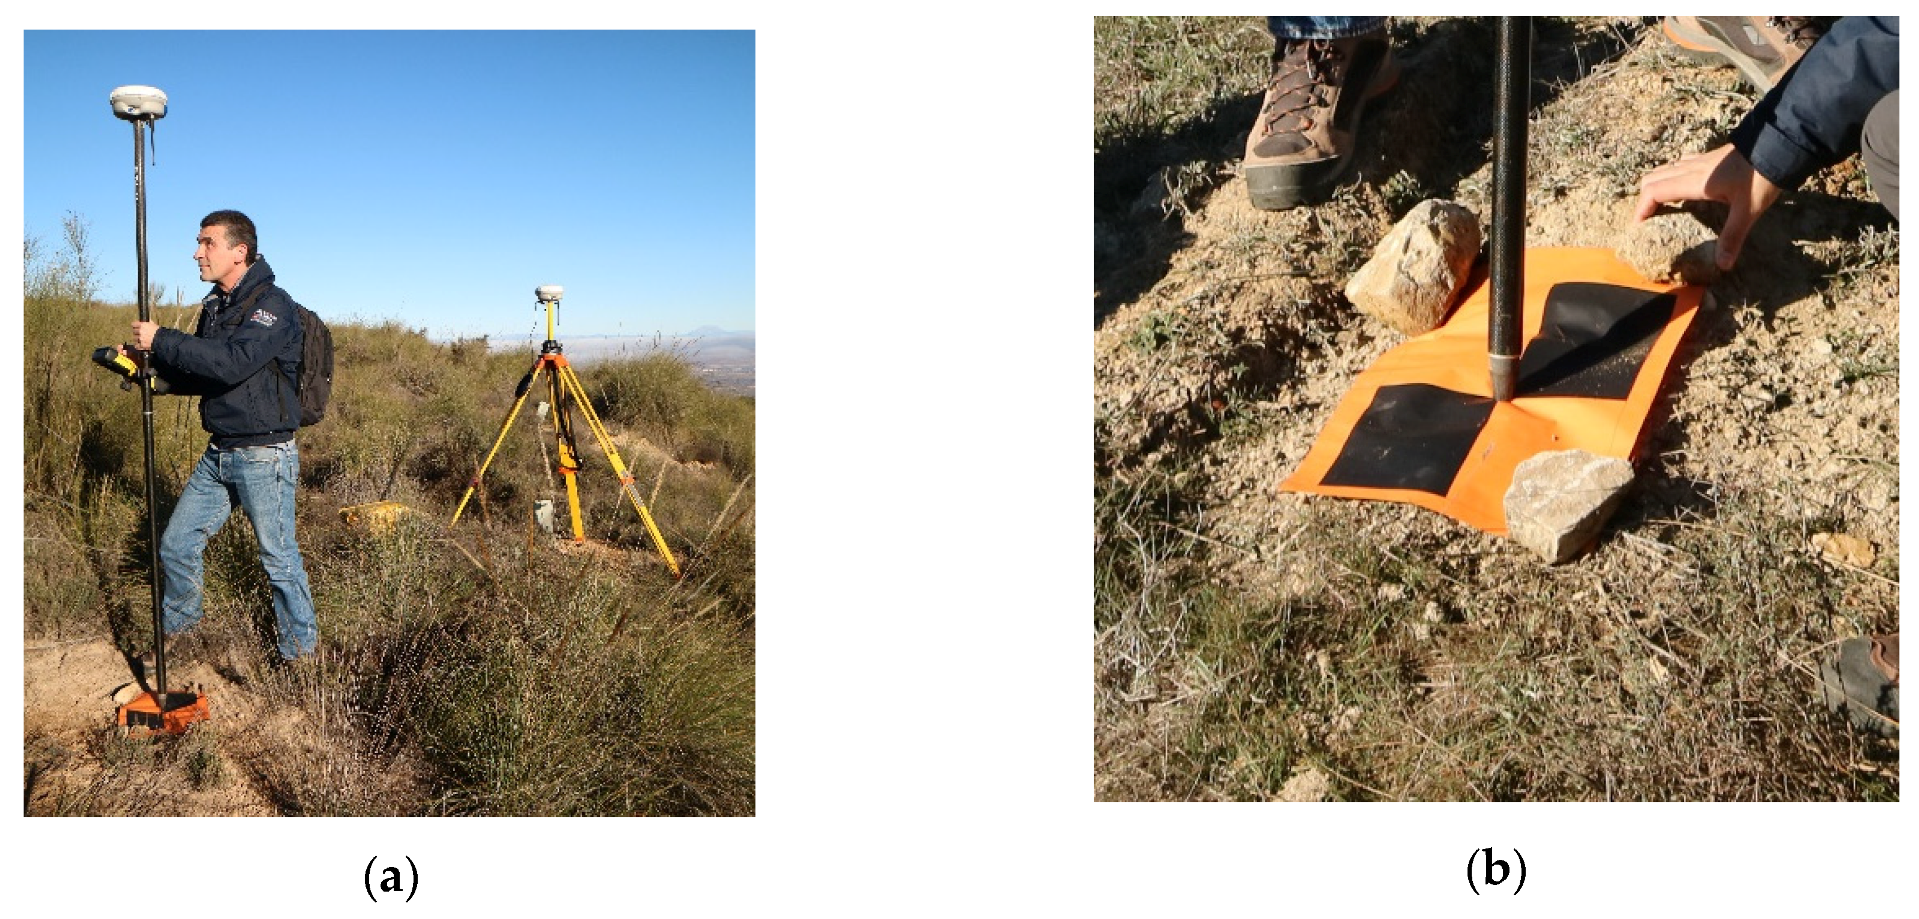
Time series imagery has to be referred to the same coordinate system to be processed. Prior to the pre- and post-fire image acquisition, 10 ground control points (GCPs) were scattered on the study area for georeferencing and co-registration following the conclusions of [
29,
38]. In a survey campaign, 3D coordinates of GCPs were measured with a highly accurate GNSS receptor Trimble R6 working in post-processed kinematic mode (PPK) (
Figure 6), with the base station at a fixed point on the studied surface terrain.
The post-processing was carried out through Trimble Real Time eXtended (RTX) correction services [
39], a high-accuracy global GNSS correction technology that combines real-time data with positioning and compression algorithms. For RTX post-processed measurements, these dual-frequency geodetic instruments have a manufacturer’s stated horizontal accuracy specification of up to 2 cm.
Horizontal coordinates were referred to the official reference system in Spain, UTM 30 N (European Terrestrial Reference System 1989, ETRS89), and elevations were referred to MSL using the EGM08 geoid model.
2.5. Photogrammetric Algorithm
The photogrammetric pre- and post-fire projects were processed using Pix4Dmapper Pro version 3.1.23 [
40], a software application based on the SfM and MVS algorithms [
26,
27] which allows a significant reduction in the computing time required for most of the processes involved in UAV multispectral photogrammetric projects.
After previous quality checking of the imagery acquired by the sensor in a complete flight mission, the internal calibration parameters and coordinates of the image principal points of all the images were loaded from the EXIF data and considered as initial data for the iterative process of block adjustment. Sets of tie points in the overlapped areas of the images were automatically identified by autocorrelation algorithms. It was checked that the number of overlapping images computed for each pixel of the resulting orthomosaic was sufficient to match a large number of tie points throughout the study area. The bundle block adjustment process depends directly on the number of 2D and 3D keypoint observations.
The internal camera parameters, including the radial and decentring distortion coefficients, focal length, and principal point coordinates, were optimized by an iterative field camera calibration process for each of the four sensors included in the multispectral camera.
Manual identification of the GCP coordinates in the images made it possible to assign the absolute geolocation of the photogrammetric block.
Finally, some products were obtained from the photogrammetric projects based on the triangular irregular network (TIN) resulting from the densified terrain point cloud. These are the Digital Elevation Model (DEM), an RGB orthoimage, and monochromatic reflectance orthorectified images corresponding to each of the four channels.
2.6. Reference Data Map
The evaluation of fire severity indices was carried out using statistical tests that compare the level of matching between classes of damage estimated from the indices with the reference data map. According to several authors e.g. [
15,
19,
20], in situ evaluation of the vegetation affected by fire is time-consuming, expensive, and sometimes unfeasible because of accessibility problems regarding forest locations [
17]. Nevertheless, [
32] advised about the potential of RGB UAV imagery for photointerpretation of fire severity.
In this work, the fire severity was checked in situ in 42 sample plots of 1 m
2 distributed in the study area. This information was georeferenced and used to generate training sites based on the previous segmentation of the multispectral reflectance. OBIA was applied by [
41] for modelling aboveground forest biomass.
Once a training site map was obtained, the well-known supervised classification algorithm Artificial Neural Network [
42,
43] was used to delineate a reference data map.
2.7. Fire Severity Indices
According to [
19], the EGI index is the fire severity index belonging to the visible spectrum domain which best separates three classes of severity maximizing the spectral contrast between pre- and post-fire UAV imagery by accentuating the differences between the green reflectance peak and the reflectance of blue and red.
NDVI is the most frequently used index for fire severity estimation, classically based on multispectral satellite imagery. It represents the directly proportional relationship between vegetal health and the difference between reflectance in the near-infrared (NIR) and red bands due to the characteristic property of the chlorophyll of differential absorbance in both wavelengths.
The NDRE index is similar to NDVI, but red is substituted by red-edge (RE). In practice, NDRE can correct two inconveniences that can occur with NDVI [
44]. The first is related to the fact that red is absorbed strongly by the top of the vegetal canopy so that lower levels of the canopy do not contribute much to the NDVI values. The second is that in certain states of vegetation, the high chlorophyll content saturates the maximum NDVI value, losing the capacity to represent variability in the vegetation state. The RE is not as strongly absorbed by the top of the canopy and can reduce both effects.
Once the three indices were calculated with pre- and post-fire imagery, the differences (d) between the two epochs were calculated. The resulting dEGI, dNDVI, and dNDRE values were reclassified in four classes including unburned, low, medium, and high severity using statistically established umbral values.
2.8. Chi-Squared Test and Confusion Matrices
The quality of estimation offered by the three indices was established by means of two statistical analyses that evaluate the statistical significance of differences in classification accuracy [
45]. A confusion matrix was generated for dEGI, dNDVI, and dNDRE as the predicted classes versus the reference data map as the actual classes. The accuracy of cross-tabulations, expressed by the overall accuracy and kappa coefficient of agreement, were evaluated.
Secondly, the statistical significance of the difference between indices was determined by the McNemar chi-squared test with the proportion of correct allocations.
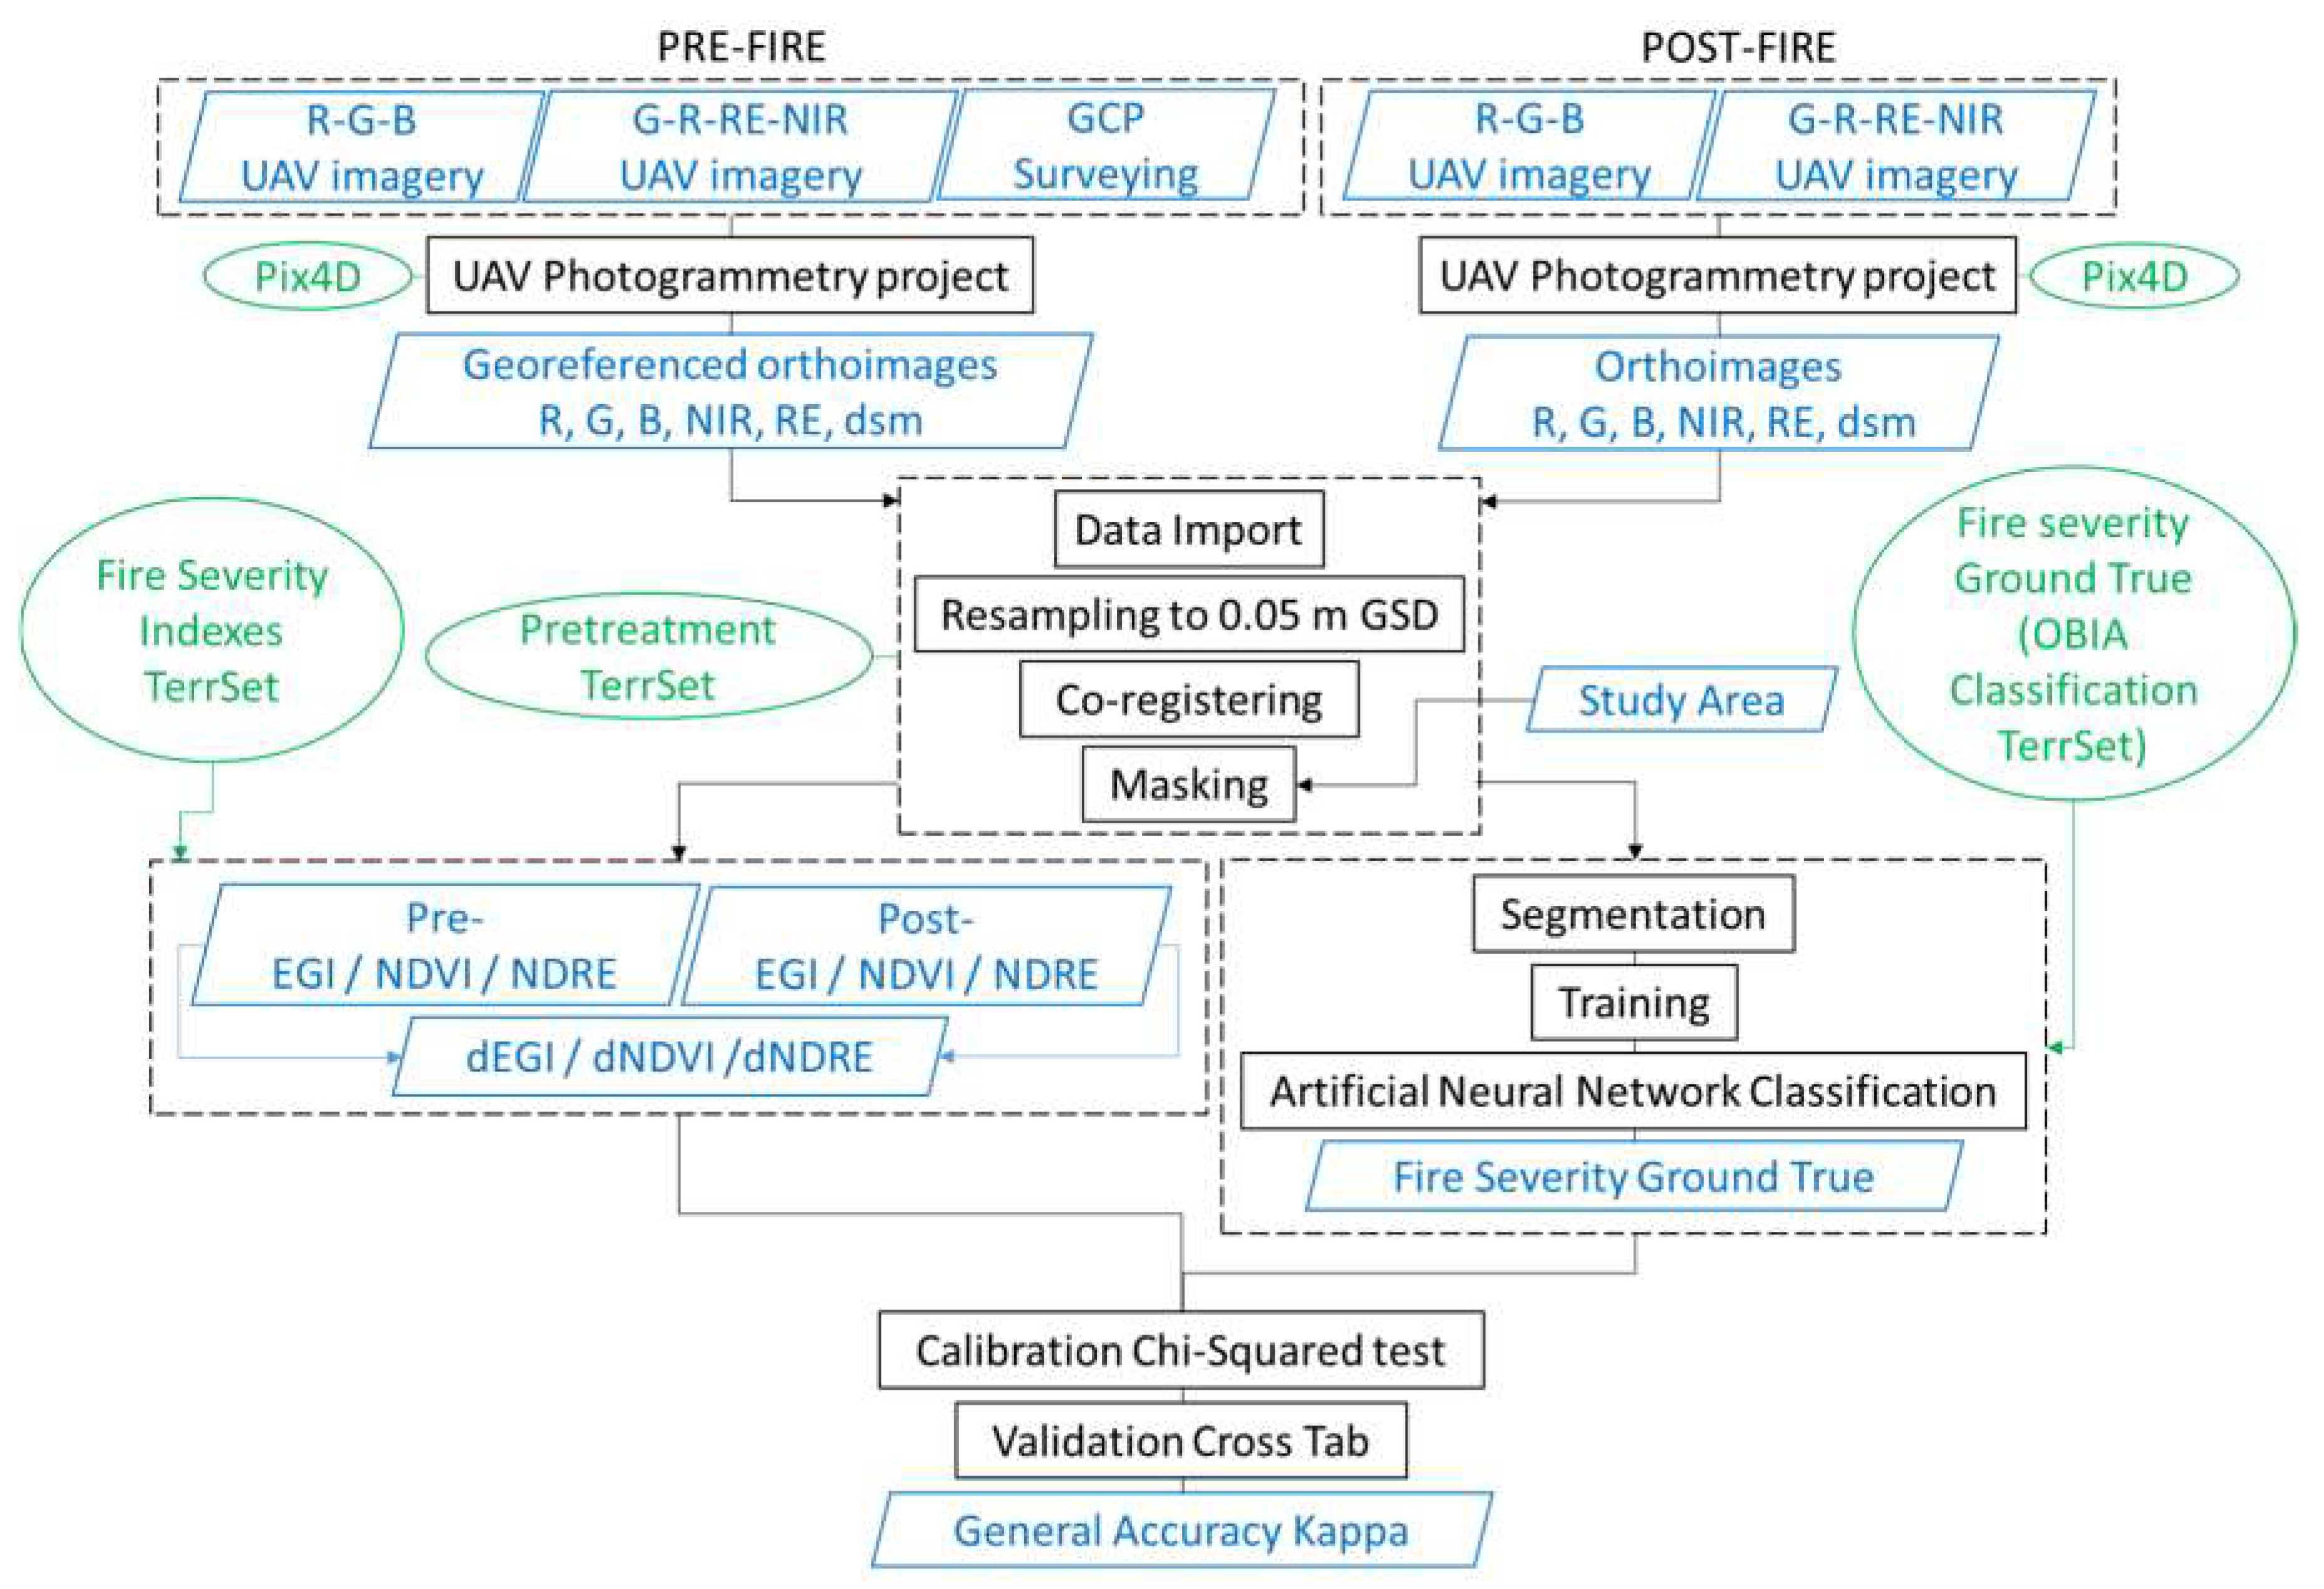
All procedures after the UAV photogrammetric projects, involving imagery pretreatment, calculation of fire severity indices, OBIA classification of reference data, and calibration and validation assessments, were carried out with the TerrSet Geospatial and Modeling System software version 18.31 [
46].
The data processing is summarized in the flowchart shown in
Figure 7.
3. Results
3.1. UAV Photogrammetric Products
Both pre- and post-fire flights were processed independently by the same method. Input data included the three visible channels with 1.2 megapixels and four multispectral channels with 16 megapixels, all of them from Sequoia, and both mixture projects were carried out with Pix4Dmapper Pro software. Both projects processed close to 1825 visible images, about 98% of which were calibrated in five blocks and 3650 multispectral images, 95% of them calibrated, covering an area of 33.66 ha. In the bundle block adjustment assessment, a median of 61,300 keypoints per image were identified in the case of visible imagery and 10,000 keypoints were identified per multispectral image. In order to address the photogrammetric projects more efficiently, products obtained from visible and multispectral images had 7.22 and 3 cm of GSD respectively and were georeferenced with an RMS error of 4 cm.
The image positions were distributed along 22 flight paths with a frequency shutter speed sufficient to obtain an overlapped mosaic in which every pixel of the final products would be registered in at least five images.
Based on the laboratory calibration of the internal optical parameters by the manufacturer, a field calibration was carried out for each of the multispectral and visible sensors, including the distortion parameters, focal length, centre, and size of the sensors. Regarding the internal co-registration of the multispectral images, all four model cameras were referred to a unique reference through a median of 5320 matches between each pair of channels.
Once the photogrammetric blocks had been adjusted, they were referenced to the official coordinate system UTM zone 30, northern hemisphere, and elevations referred to MSL with the EGM08 geoid model through the base coordinates obtained from RTX post-processing with accuracies of 1.8, 3.4, and 1.1 cm in the X, Y, and Z coordinates respectively.
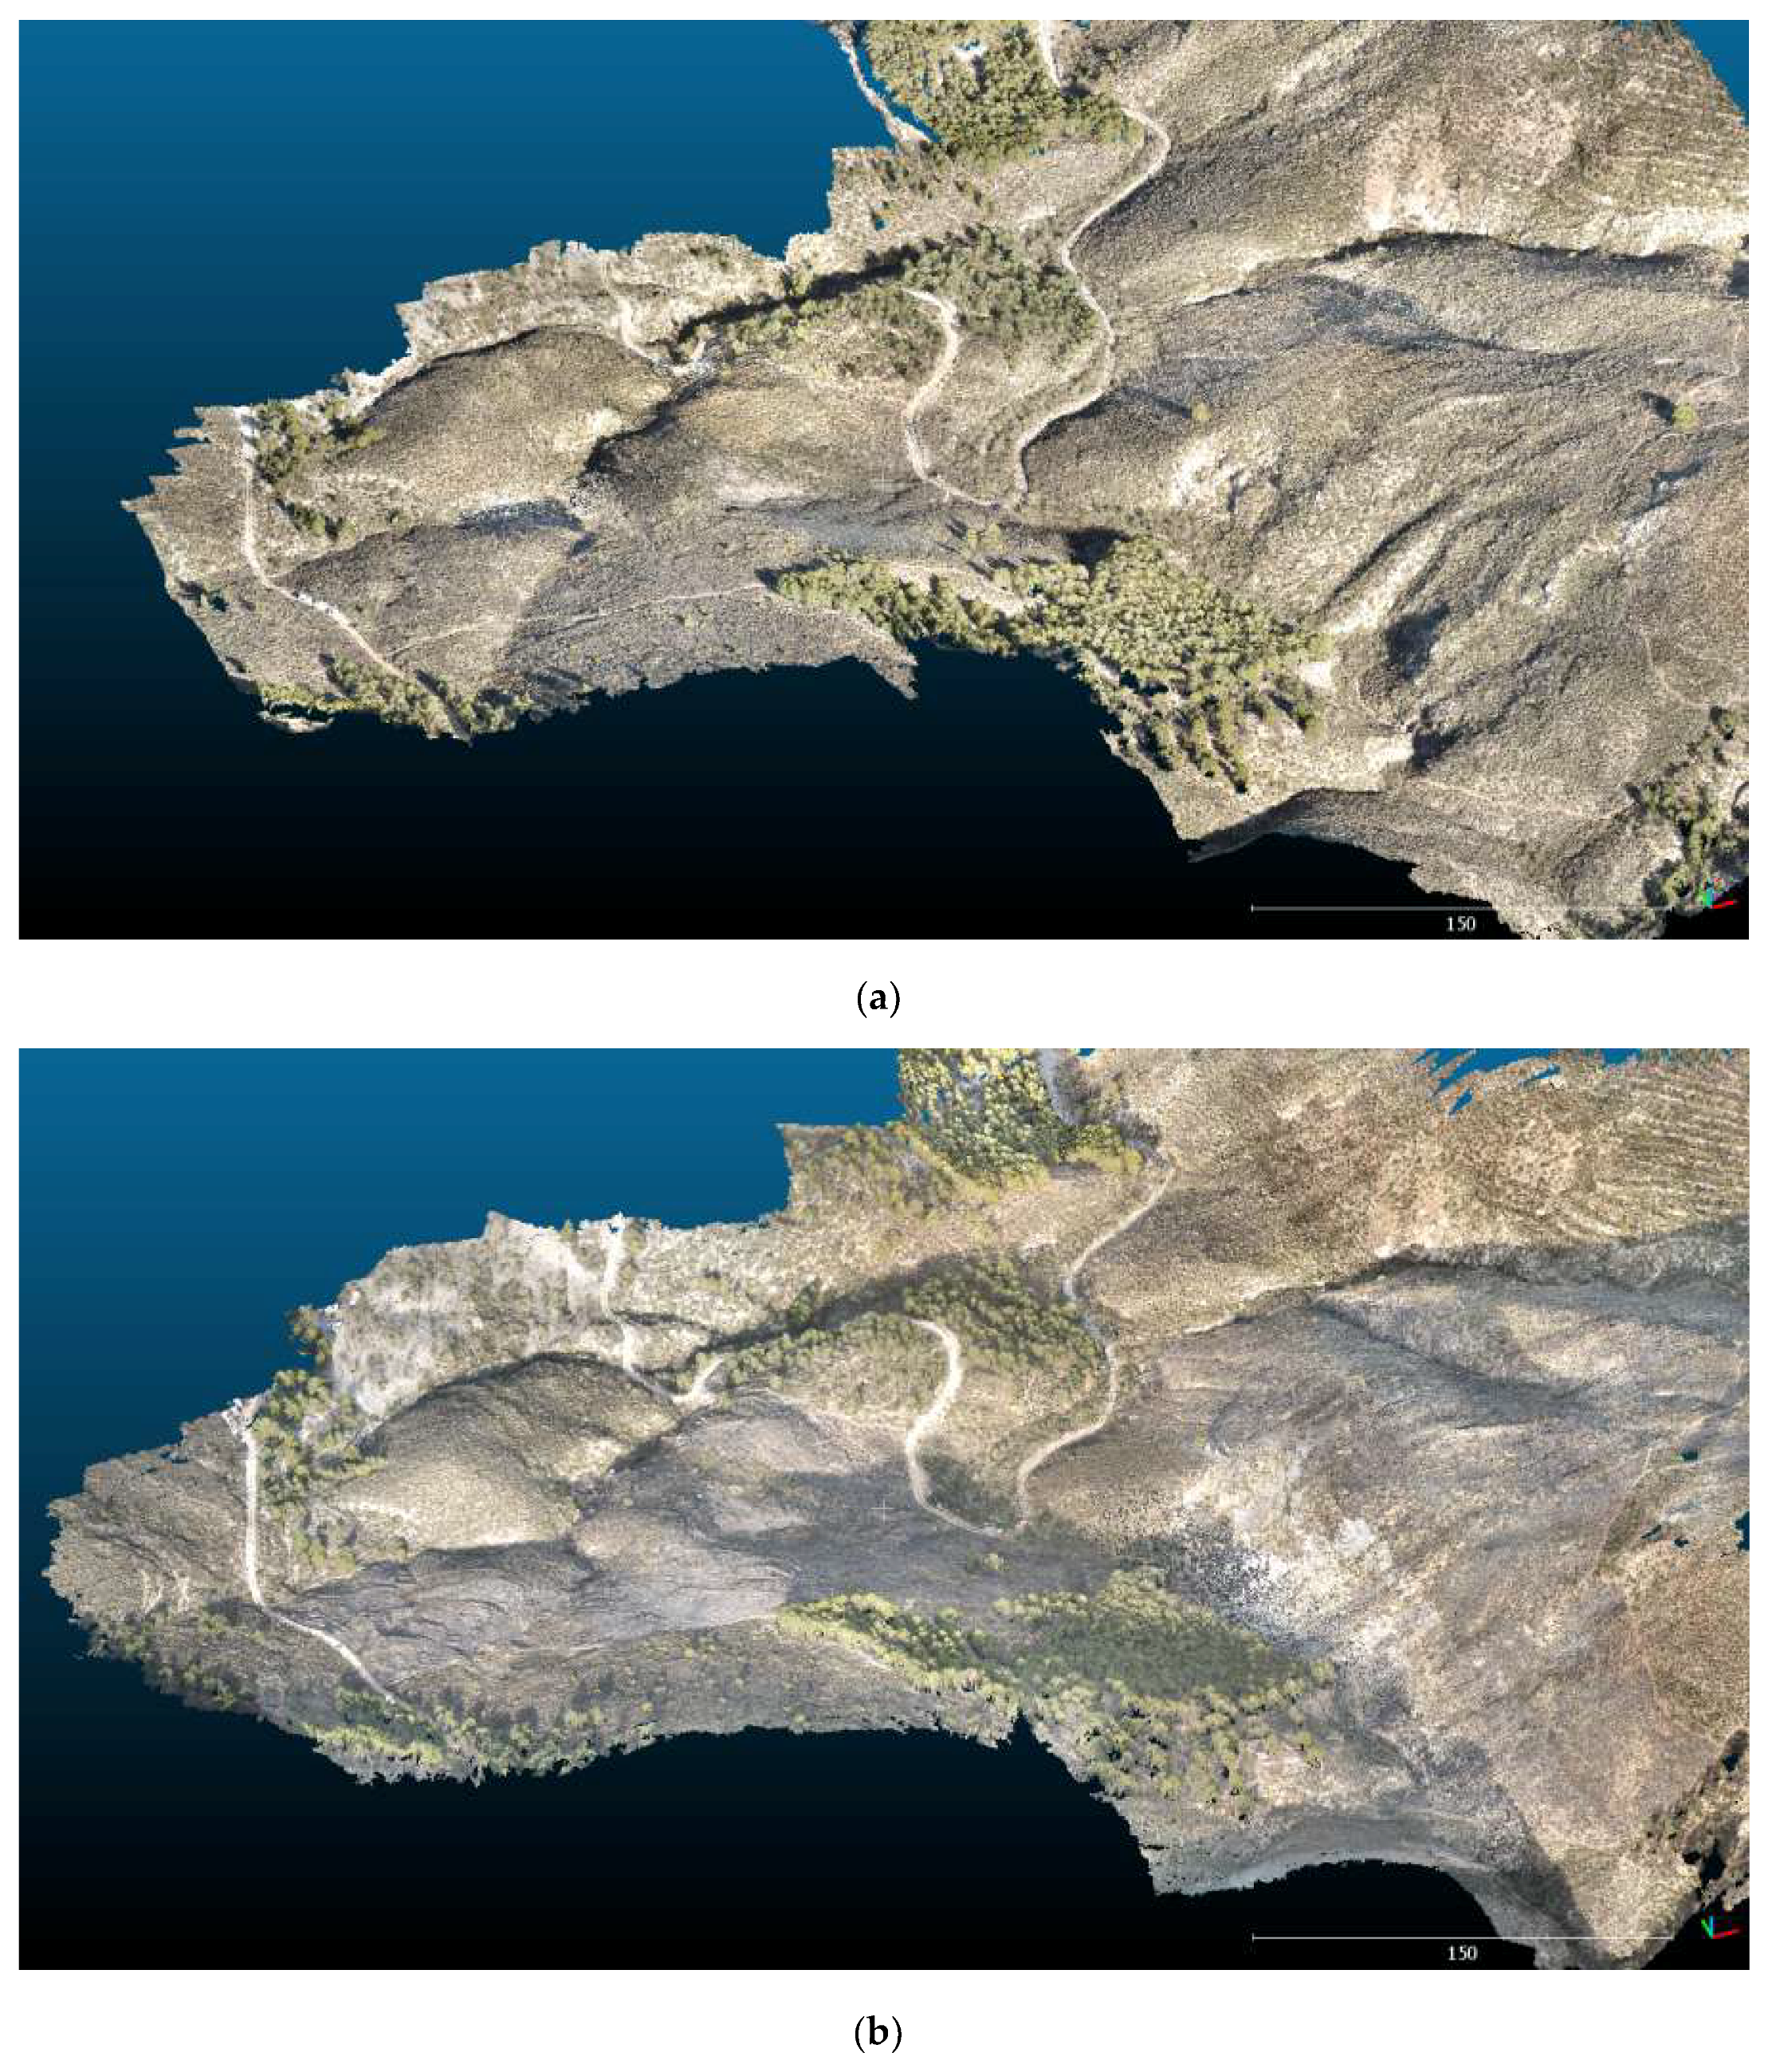
The results include a dense point cloud covering the surface, the DSM, and visible and multispectral orthoimagery. The point clouds were composed of 76.97 million 3D points, which implies an average density of 43.97 points/m
3, irregularly distributed (
Figure 8).
Applying the Inverse Distance Weighting method, both DSMs were obtained from their respective point clouds. The last step in the photogrammetric process was to orthorectify all the visible and multispectral pre- and post-fire images using their respective DSMs with their original pixel size (
Figure 9).
All the pre- and post-fire images were co-registered and resampled to a common GSD of 5 cm to carry out multitemporal operations, obtaining the fire severity estimator indices and the fire severity reference data with TerrSet software.
3.2. Fire Severity Reference Data
The three steps involved in the OBIA classification procedure that produced the fire severity reference data were segmentation of the study area into homogenous spectral similarity units, training, and classification.
The segmentation procedure creates an image of segments that have spectral similarity across the space and multispectral bands. Firstly, an image of variance of each of the bands was calculated as an estimator of variability. In these images, each pixel represents the variance of a 3 × 3 pixel window centred on it. An averaged variance image was obtained by weighted averaging of all variance images. The same weight was considered for all the bands. In the second step, the variance image was used as a DEM in a watershed delineation, labelling every catchment independently. Finally, a generalization process was applied to merge those neighbouring catchments that fulfilled two conditions: the similarity must be high and the difference between the mean and standard deviation of the catchments must be less than a preset threshold that controls the generalization level.
Typically, the segmentation data input includes multispectral bands, but taking into account that fire effects are related to modification between pre- and post-fire DSMs, the input data set was integrated by green, red, and red edge bands corresponding to the post-fire orthoimagery and d-DSM, each of them weighted by 0.2.
In order to obtain a training image, 42 samples of 1 m
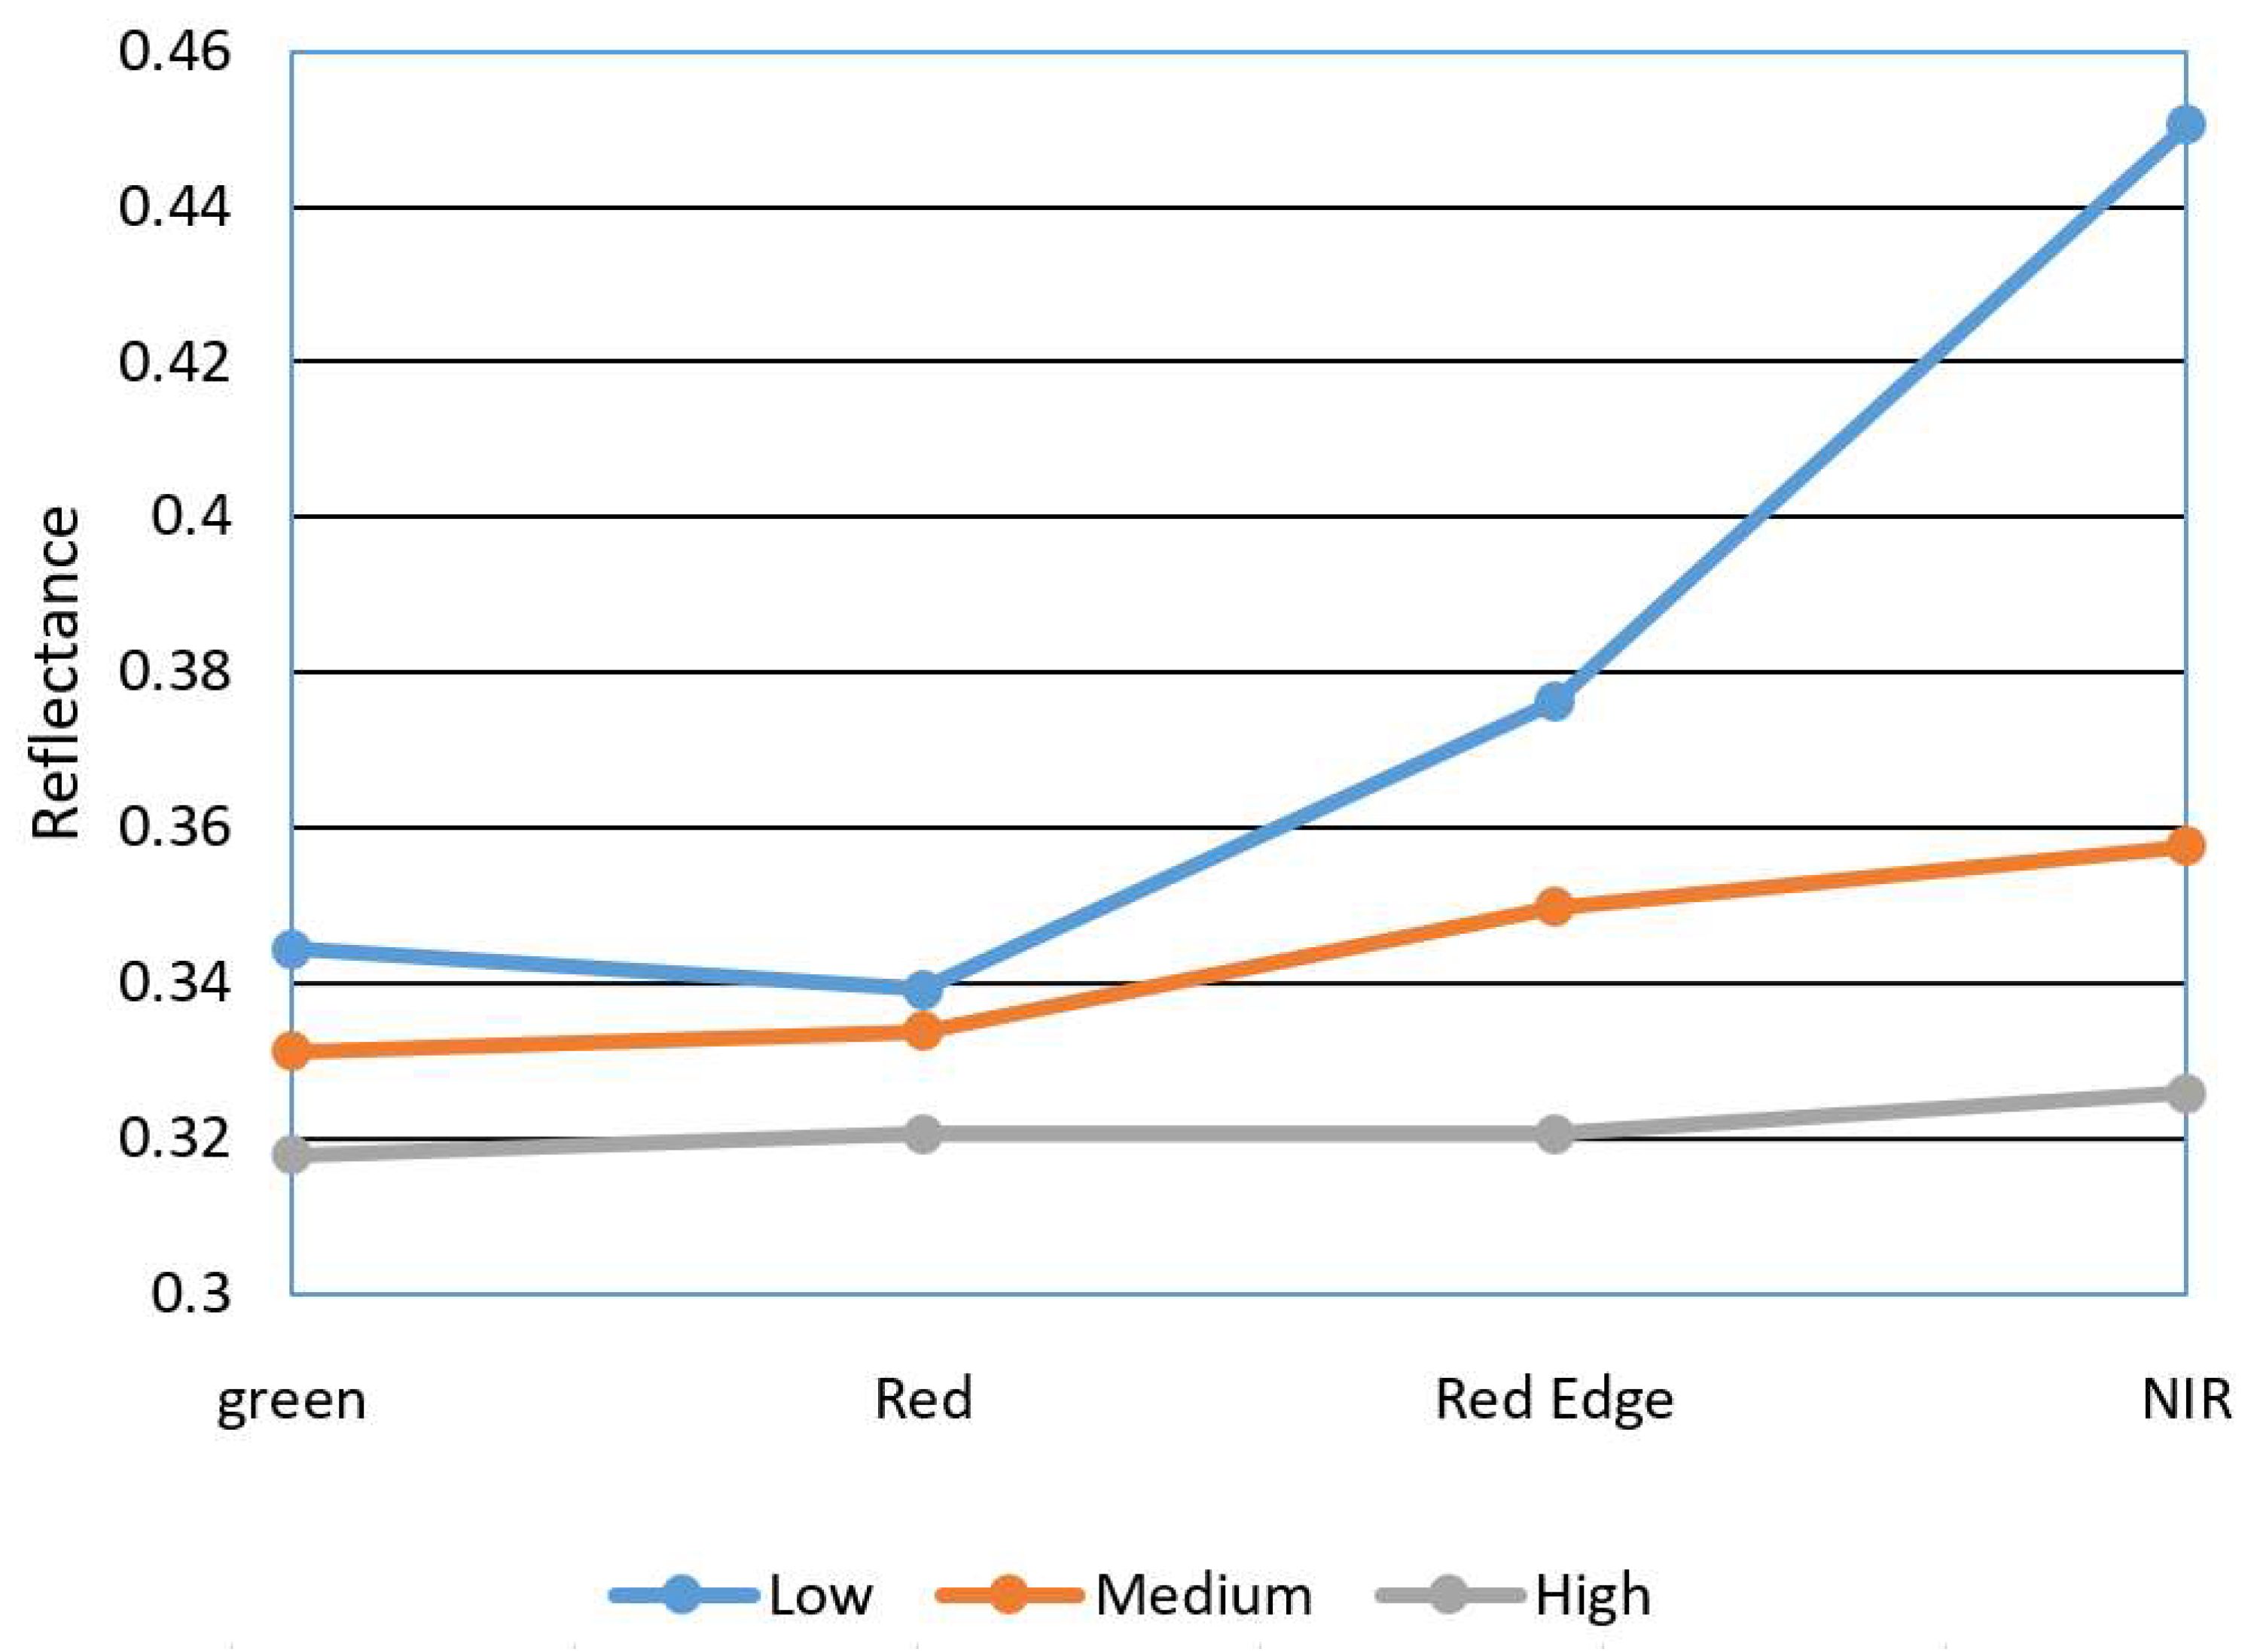
2 each were recorded in situ and georeferenced and the fire severity level was measured as low, medium, or high class. This classification was assigned to the segments with the same position as the in situ samples, obtaining a training image. Spectral signatures extracted from the training sites showed that a higher severity level more closely matched the typical signature of bare soil (
Figure 10), while low severity maintained a high difference between the NIR and red bands of typical healthy vegetation.
A separability analysis was carried out over all possible pairwise combinations of the three spectral signatures, obtaining the Transformed Divergence as a separability measure [
47] (
Table 1). The average separability over all pairwise combinations of signatures was 1237.44 using a scale factor of 2000.
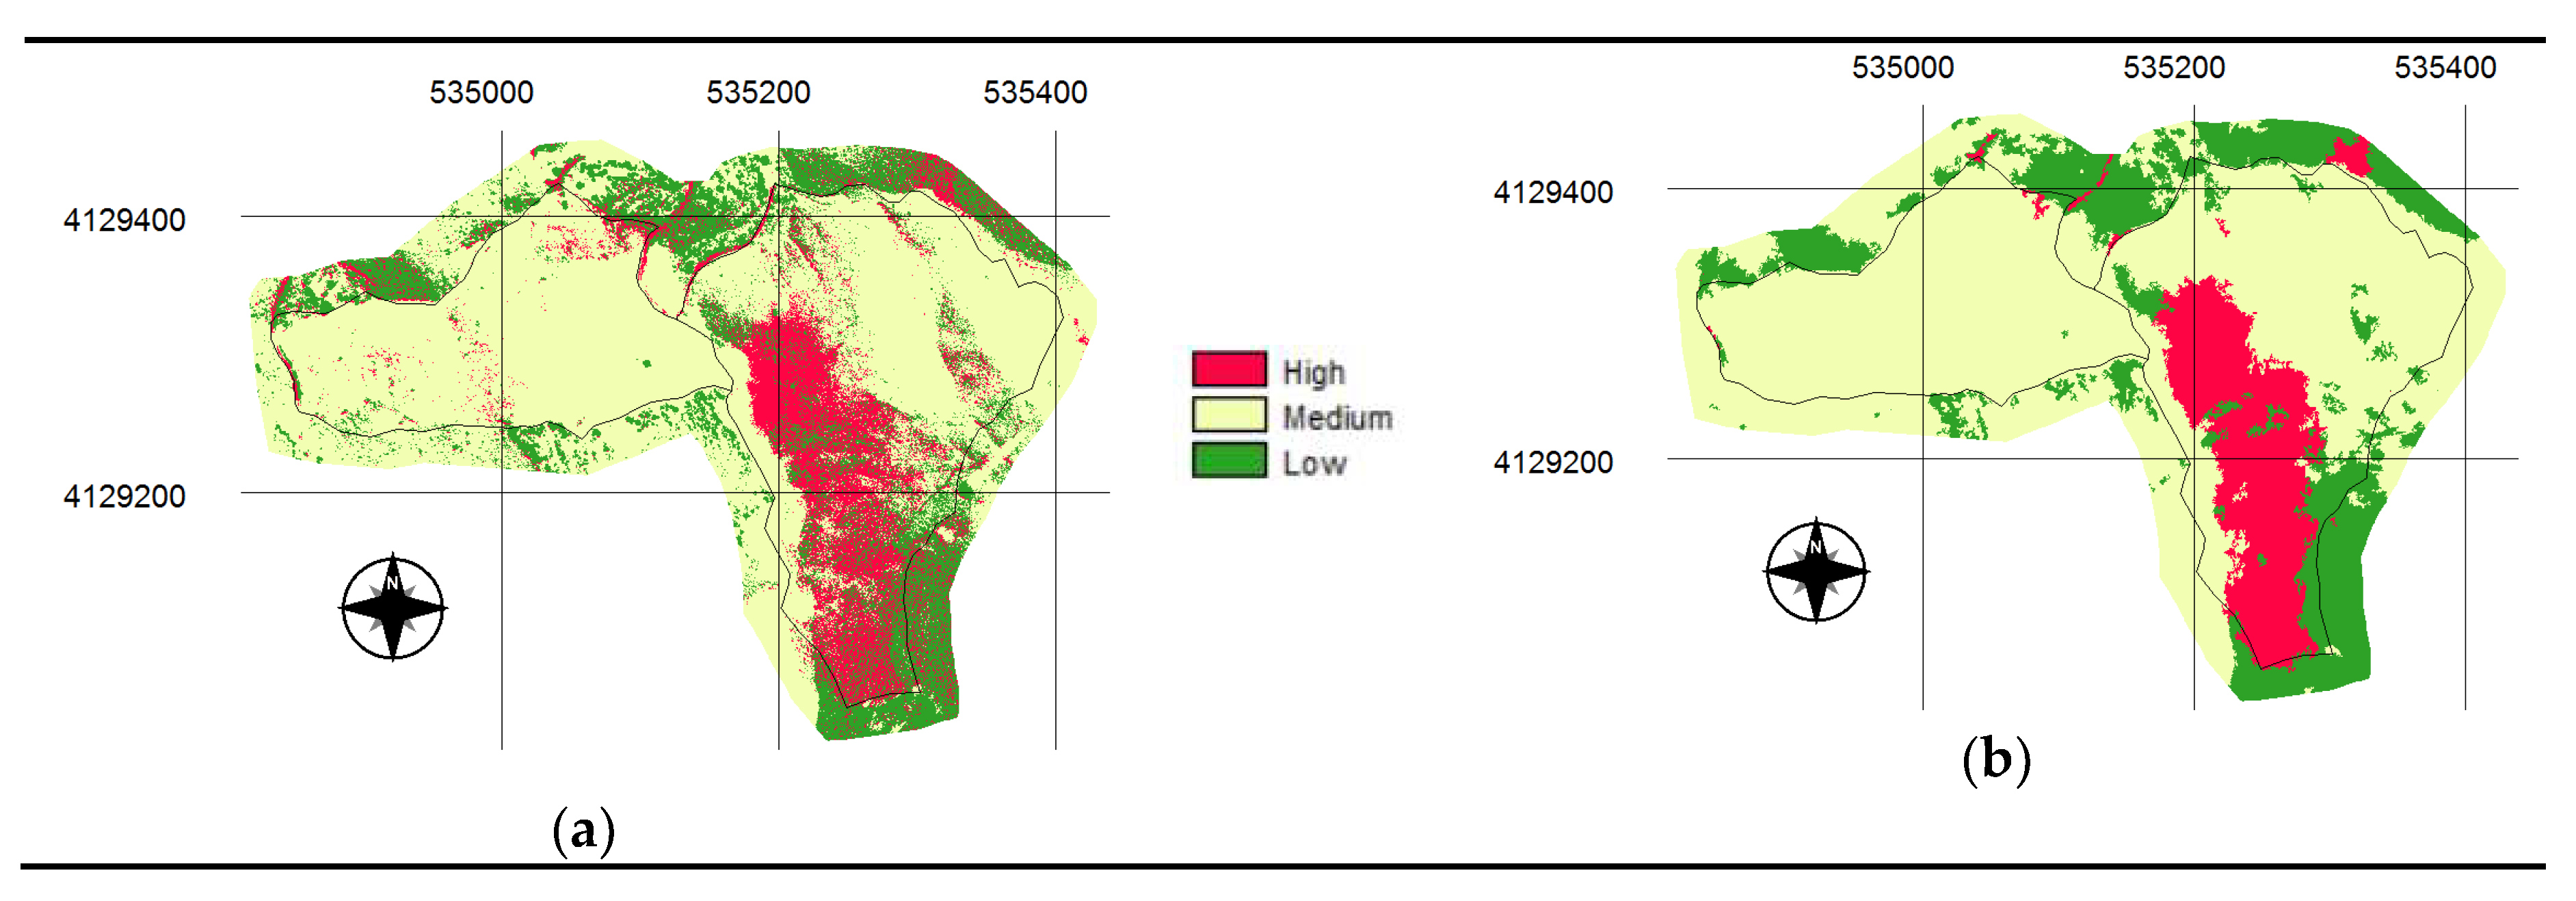
The classification process was carried out by a multi-layer perceptron neural network classifier, using a back-propagation algorithm [
47,
48]. The training assessment used spectral signatures characterized in the training image in an iterative process with an initial dynamic learning rate of 0.01, a momentum factor of 0.5, and a sigmoid constant of 1. After almost 10,000 iterations the training RMS was 0.039 and the testing RMS was 0.040. The artificial neural network was composed of one input layer with four neurons, corresponding to the multispectral bands, one single hidden layer of five neurons, and one output layer with three neurons corresponding to the three severity classes. Once the artificial neural network was trained, a pixel-based classification was obtained. In order to avoid the difficulties associated with the typical dispersion of pixel-based classification, generalization was carried out, resulting in an object-based classification using a majority rule classifier based on the majority class within a segment (
Figure 11).
3.3. Fire Severity Indexes
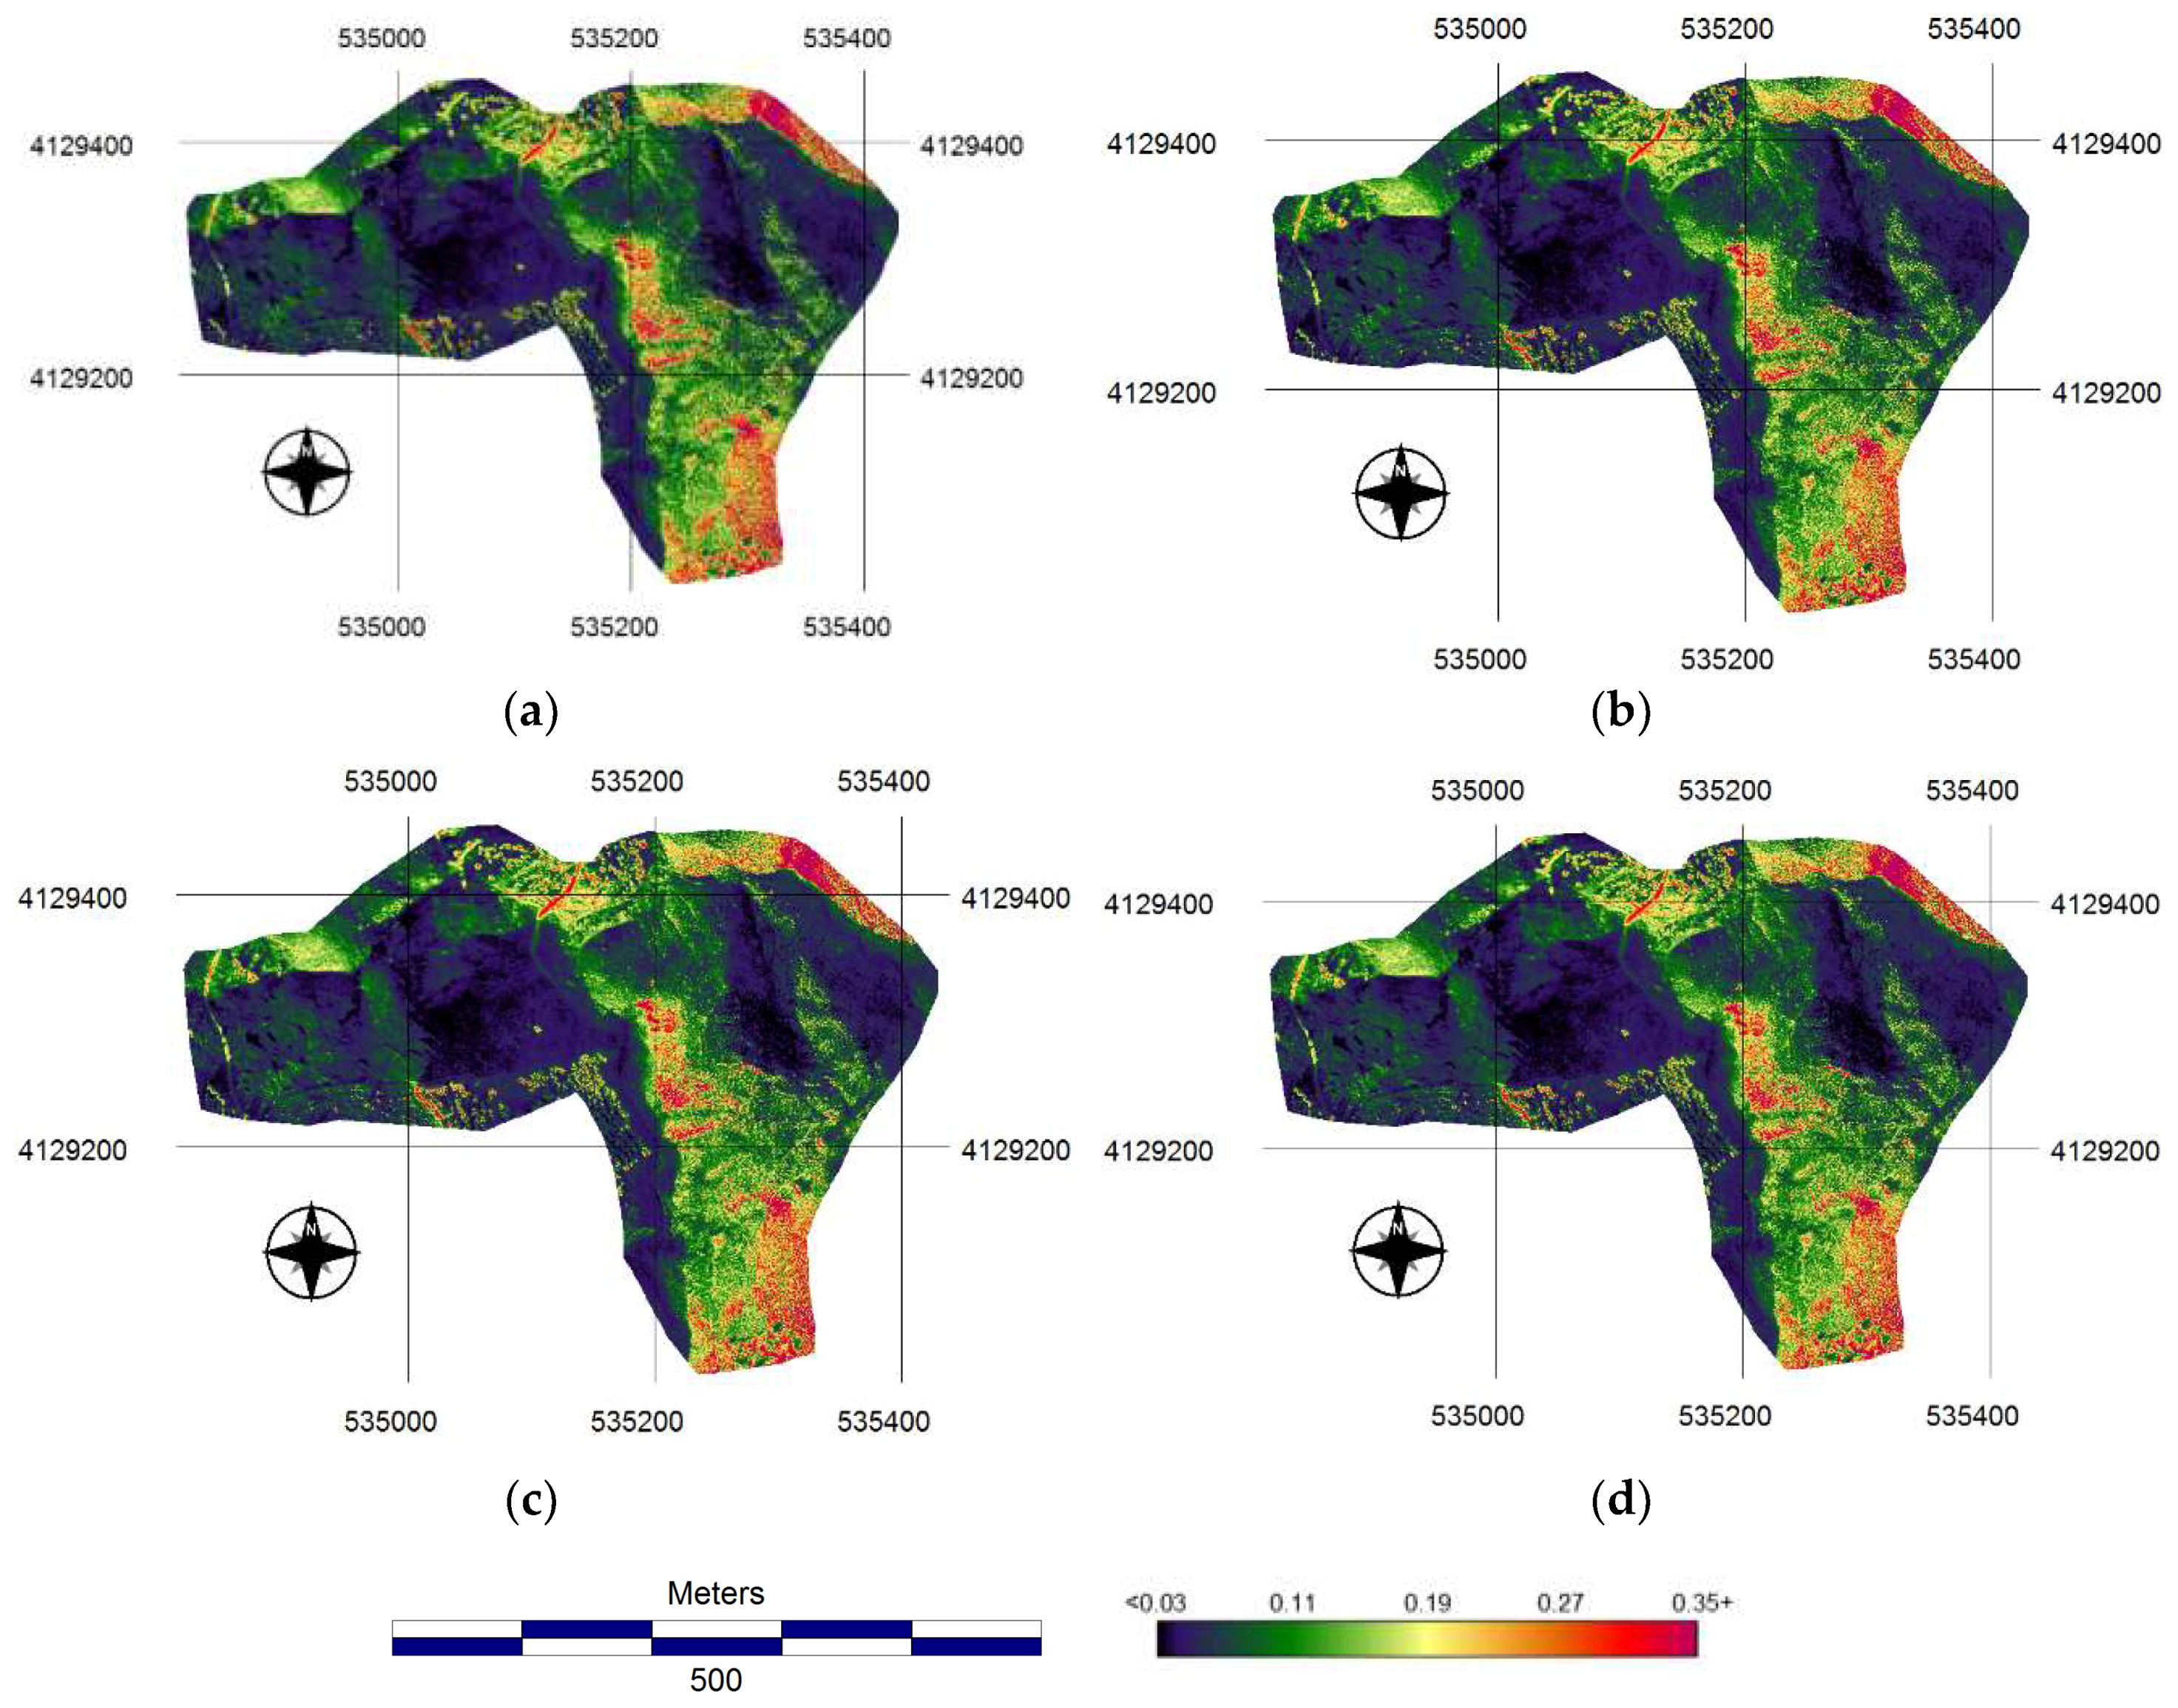
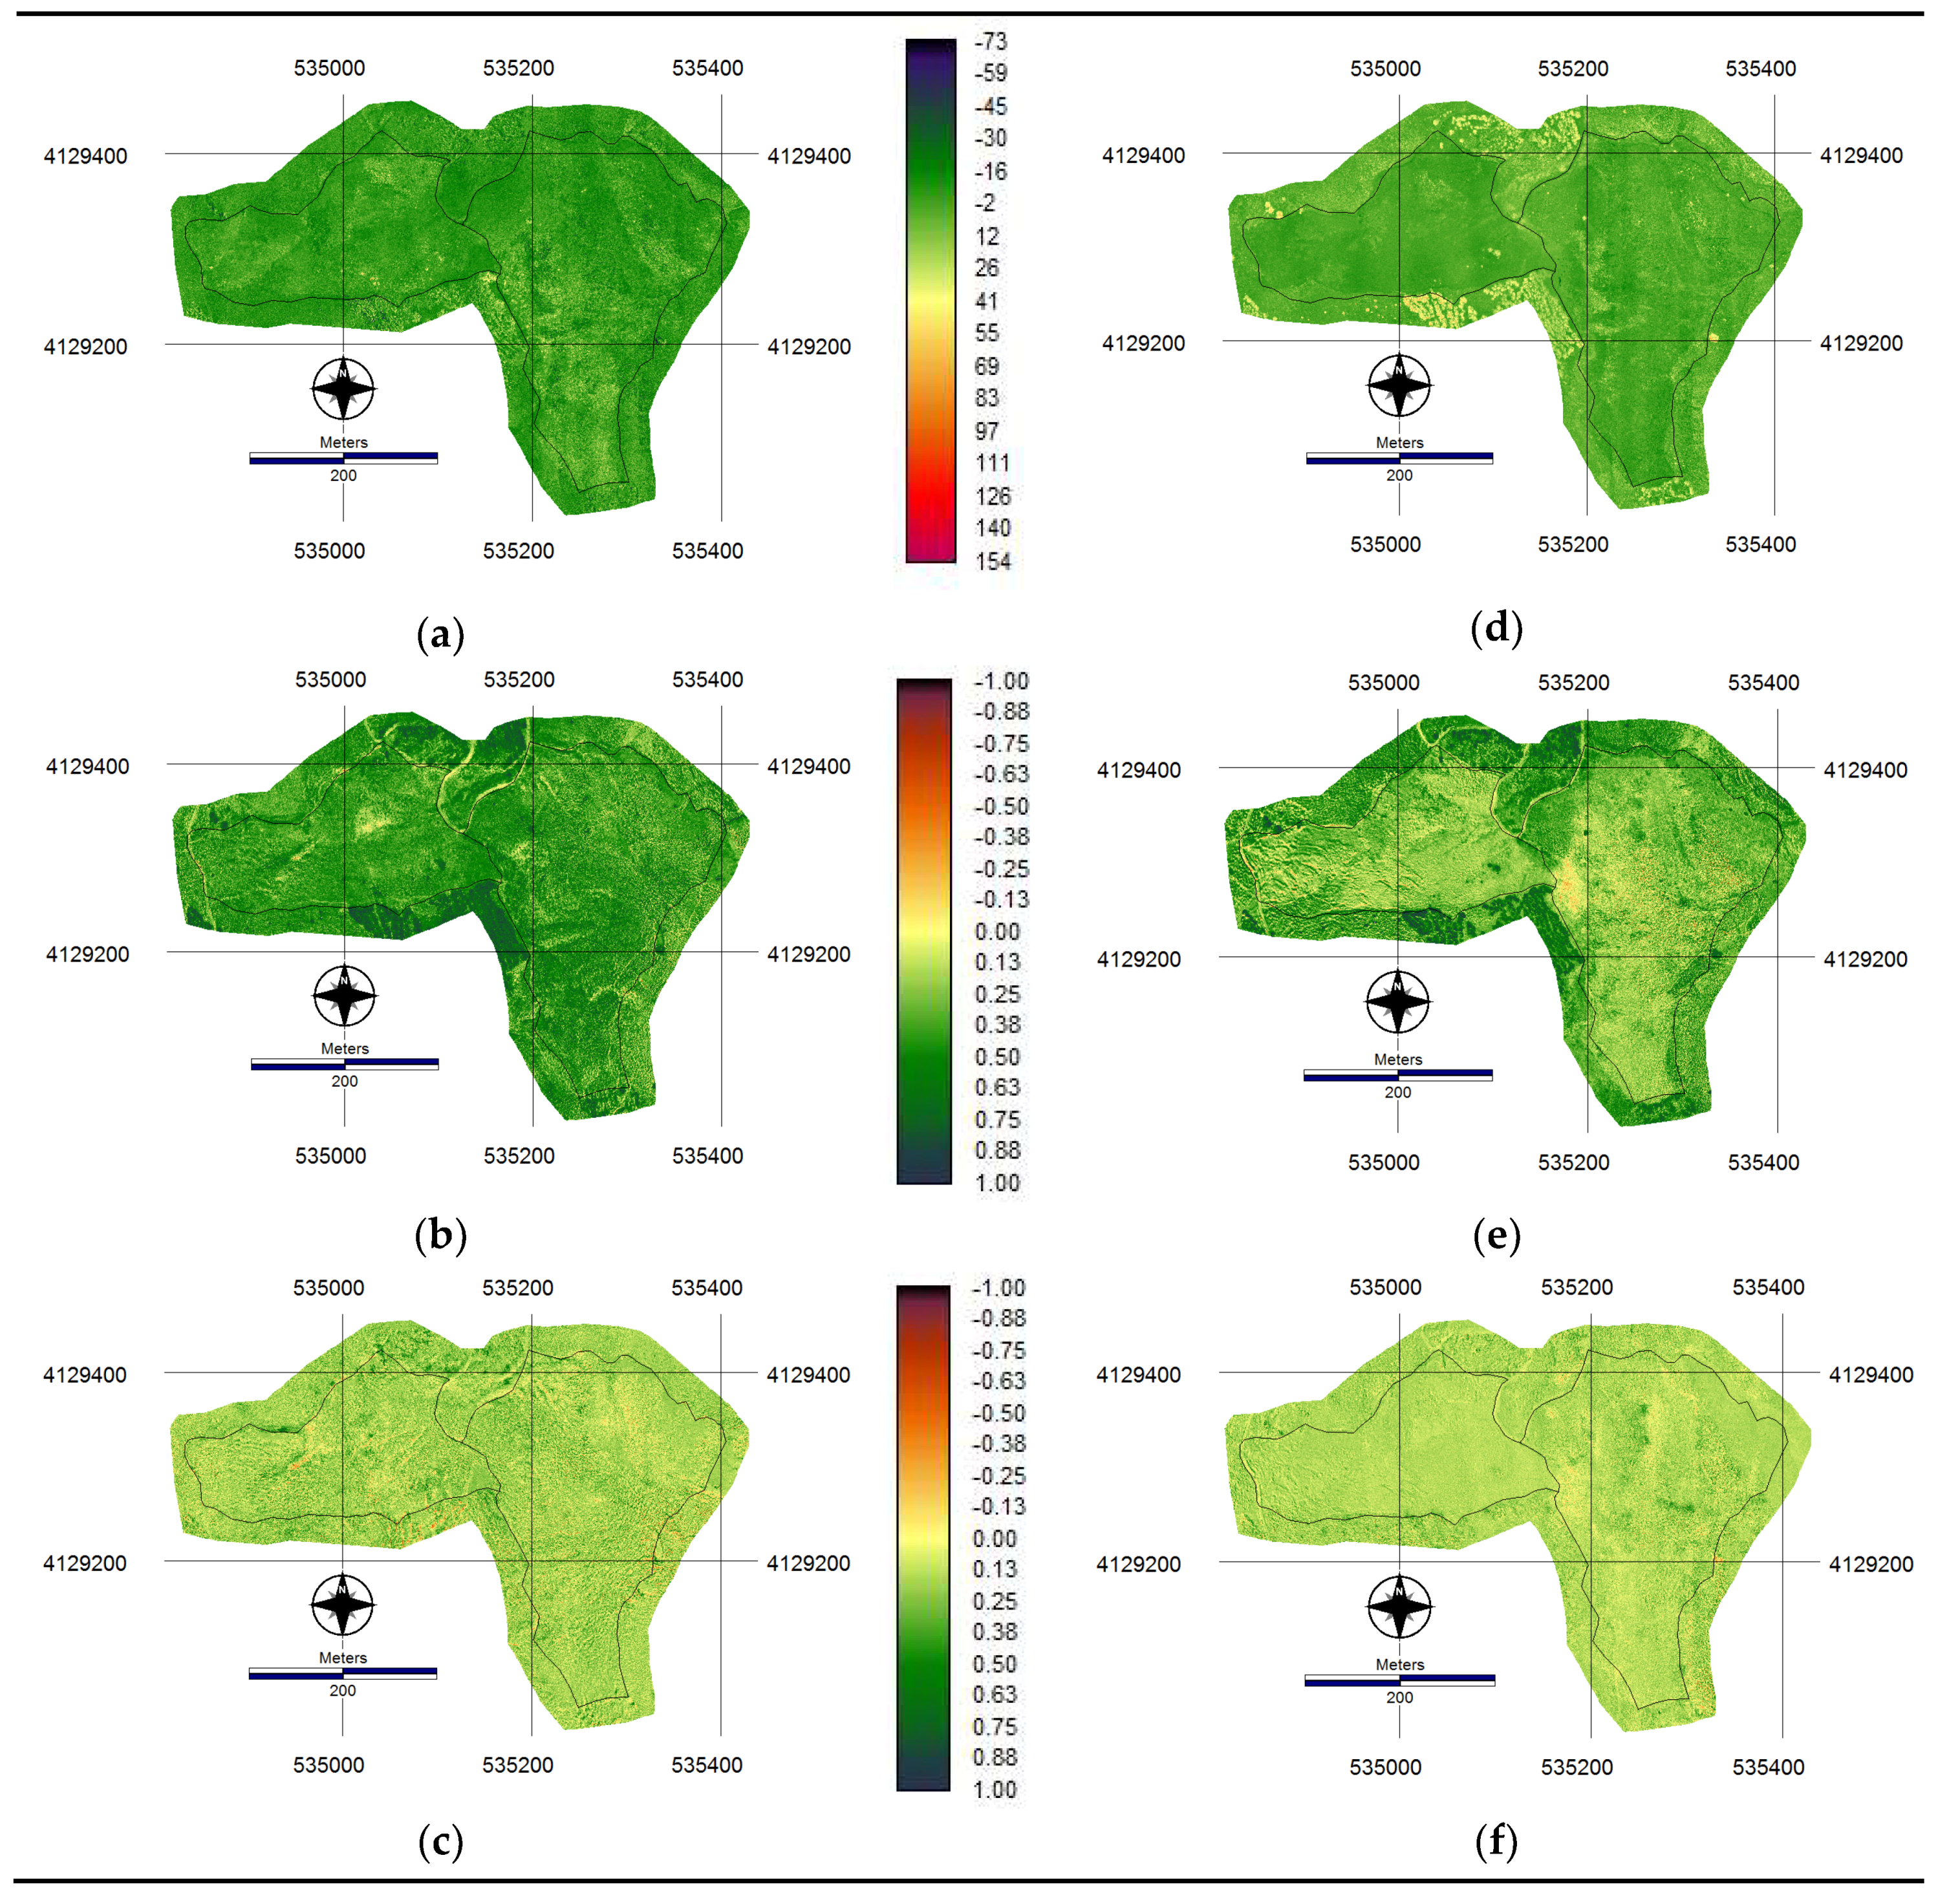
The three selected indices were calculated with pre- and post-fire imagery (
Figure 12). The resulting EGI image is in the range of −63 to 154 radiance units. Instead, both NDVI and NDVI are in the dimensionless range from −1 to 1. In all cases, higher values of the indices indicate greater vegetal vigour.
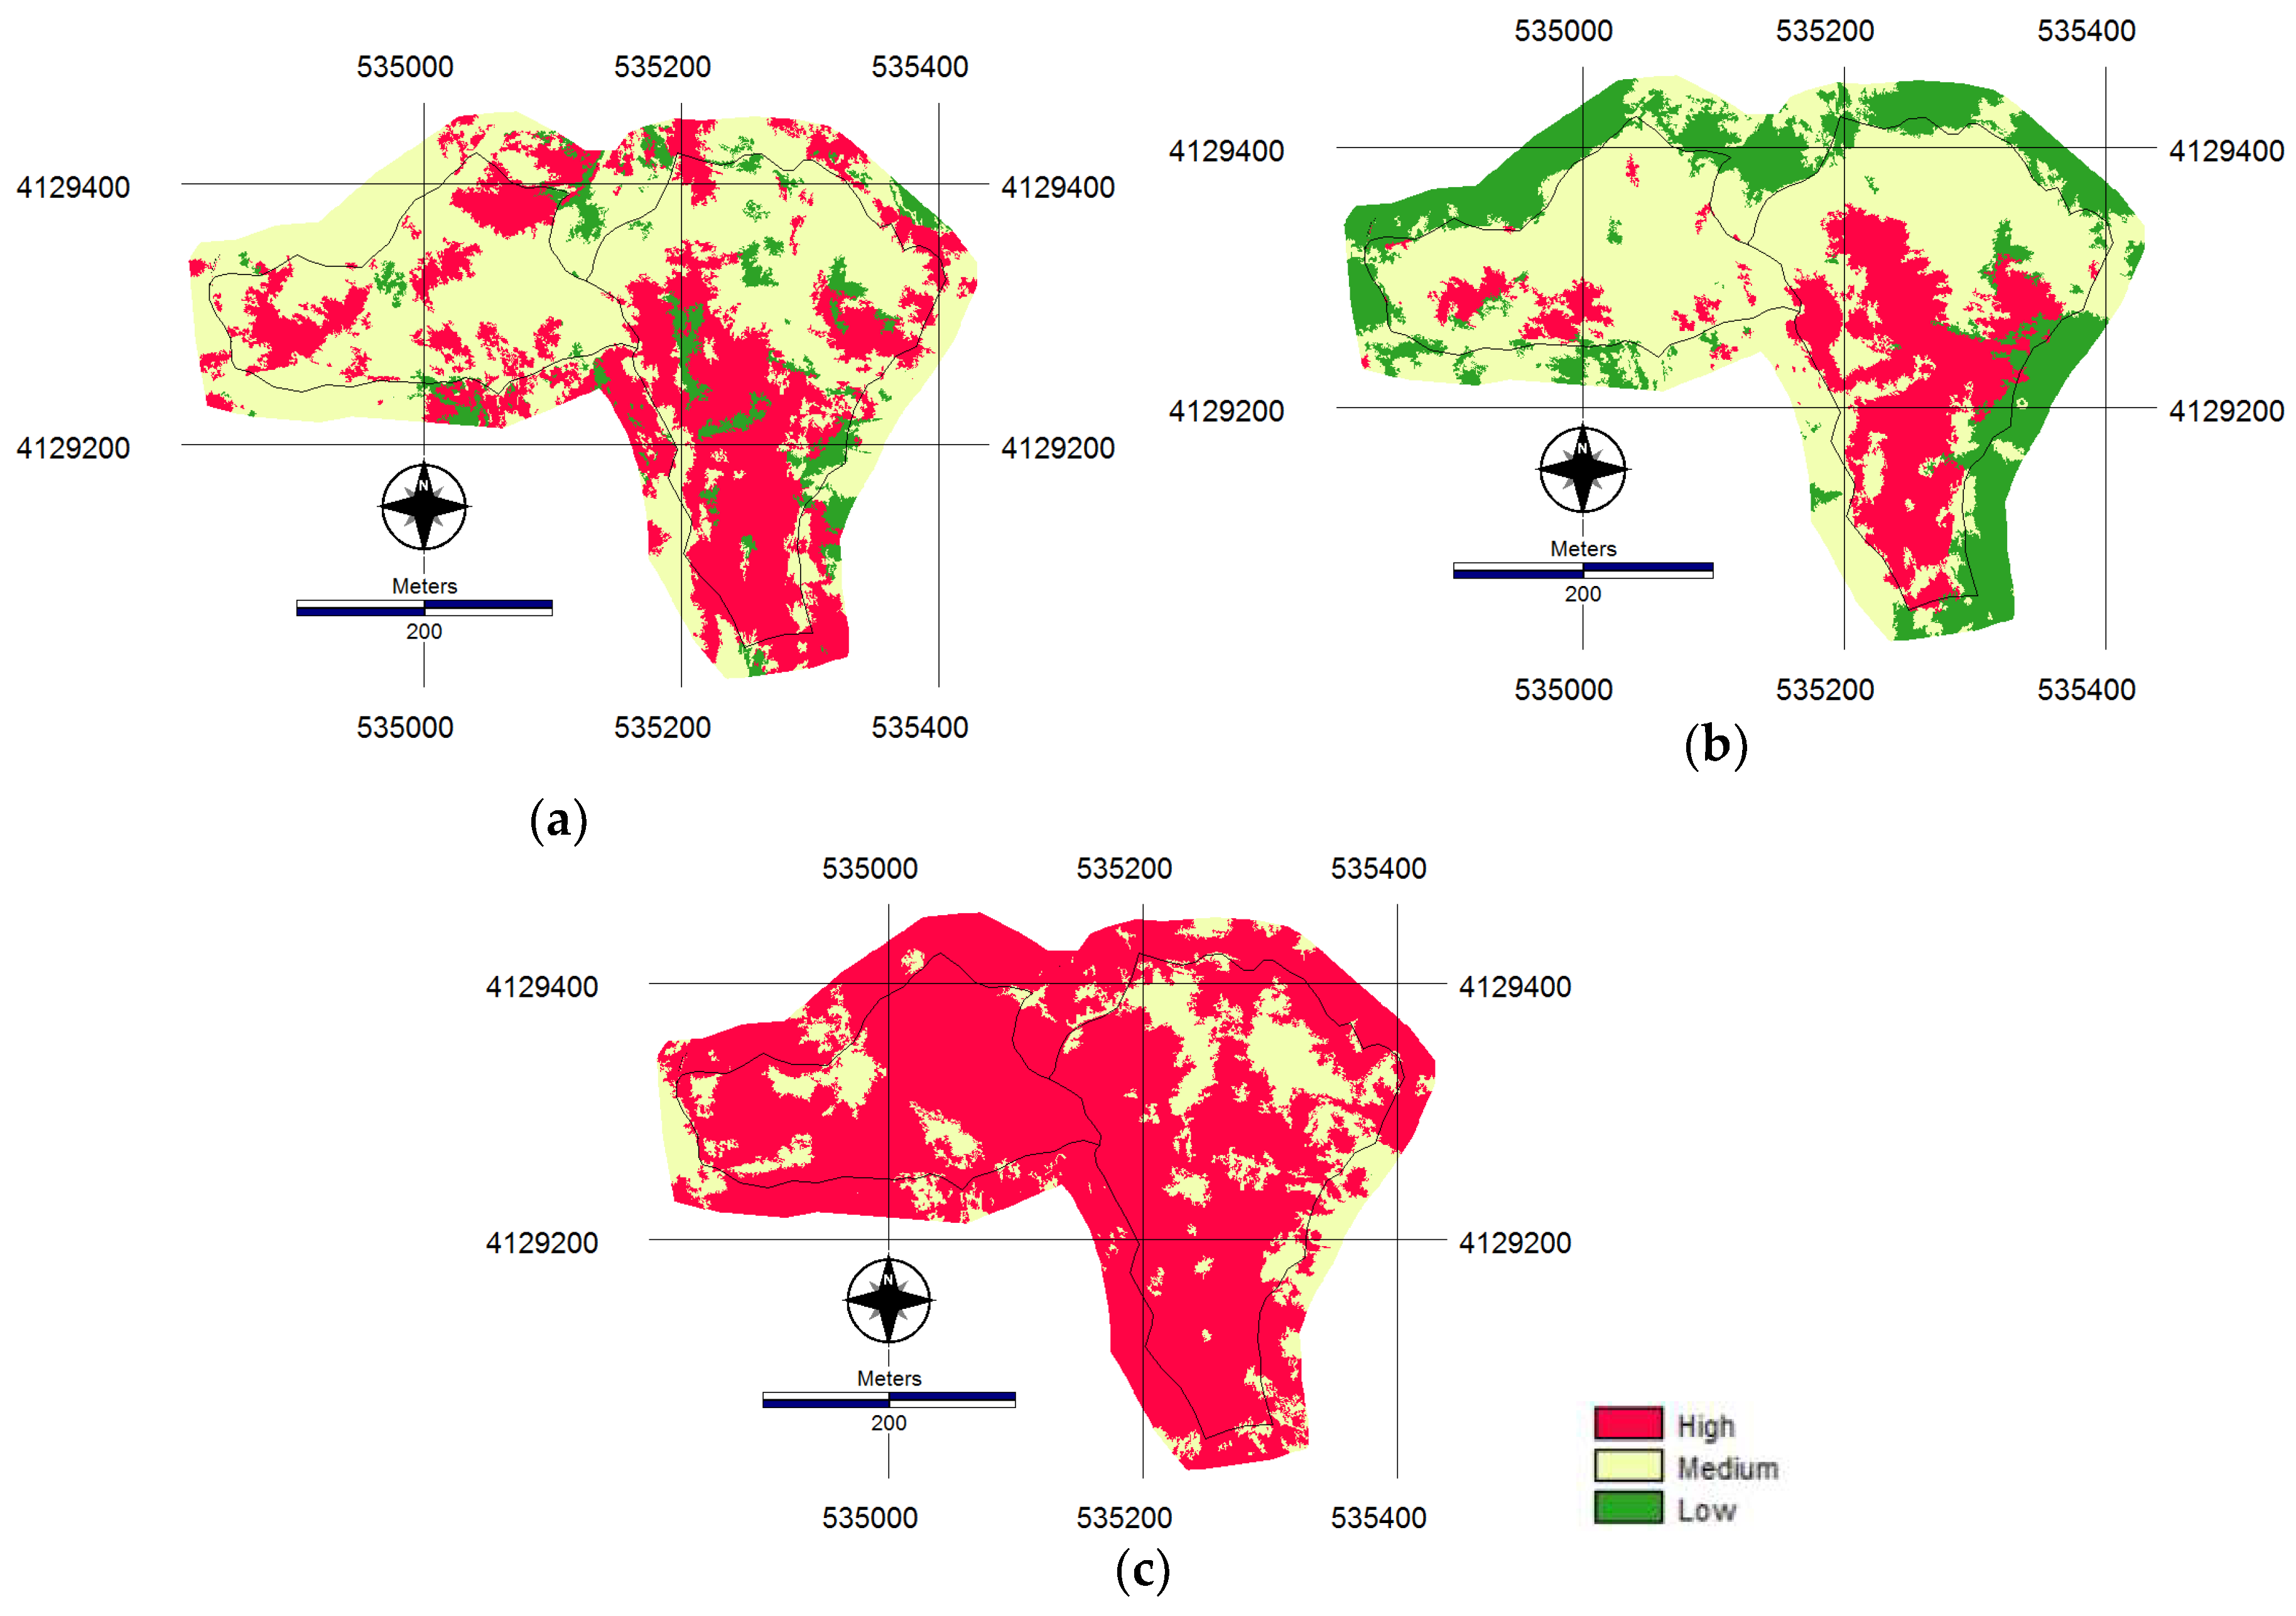
The difference between pre- and post-fire index images is related to the loss of vegetation vigour caused by the effects of fire. The values of the three difference of indices were reclassified as high, medium, and low severity using threshold values that separate three classes with the same proportion of fire severity reference data. The resulting pixel-based classifications corresponding to each of the difference of indices were generalized to object-based by the majority rule classification, using the same segments which were obtained in the reference data classification process (
Figure 13).
4. Discussion
Many authors [
29,
30,
38] recognize that changes in scale in UAV photogrammetric imagery are a very important source of error in the products, especially for terrain with strong topography. In the case of this work, the difference in altitudes in the study area was 114.5 m, with an average slope of 69.20 degrees with a standard deviation of 145.31 degrees. In these conditions, a prospective low-resolution DSM was obtained prior to pre- and post-fire data collection. The flight routes were planned with a constant height of flight with respect to the prospective DSM. With this practice, errors associated with scale variation in the input images were reduced, incrementing significantly the geometric accuracy of the orthoimages.
Regarding the radiometic resolution of the orthoimages, [
19] concluded that it was necessary to transform the recorded digital levels of raw images into reflectance units in order to carry out multitemporal comparisons. In this work, radiometric correction was applied using the irradiance models based on the differences between camera images and the sun sensor registers of the camera. The result was that some variations of light conditions during the flights and between flights were normalized, transforming the digital numbers into irradiance in the pixels of all the orthoimages. Nevertheless, [
19] advised that there is a loss of accuracy in such photogrammetric flights carried out with many projected shadows.
Figure 8 shows that pre- and post-fire imagery presented small shadows projected by small vegetation. Furthermore, post-fire imagery presented a large shadow produced by the surrounding topographic morphology. None of these shadows were related to a loss of accuracy of the fire severity estimators, maybe because of the very light conditions in both photogrammetric flights.
The accuracy of the survey campaign for georeferencing and co-registering of the orthoimages is critical for obtaining good results. Some authors [
29,
30,
38] consider differential GNSS systems working in RTK mode to be appropriate for this purpose. In this work, this kind of device was used, and a post-processing RTX was carried out with an RMS of the same order of magnitude as in previous works.
Transformed Divergence is the most commonly used separability measure. A common rule of thumb when using a constant multiplier of 2000 is to use a value of 1600 as the threshold. For example, values of 1600 or more represent signatures with good separability. See the reference to Richards (1993) in Note 6 below for more detail.
Neural network classification based on OBIA for delineating the shape of severity classes was demonstrated to be an objective way to establish the reference data based on in situ sample evaluations, as recognized by [
25,
32]. In order to separate pixels or segments belonging to one or another severity class, a threshold value has to be previously established. In most of the previous works, the classes were photointerpreted, and in some works, the classes were validated with in situ information. In this work, a neural network algorithm established those thresholds based on an objective statistical characterization of the classes, and were validated with photointerpretation and the reference data collected in situ. Furthermore, a separability study of the classes was carried out to detect possible confusions a priori, which allowed the application of an iterative process to refine the class delineation. According to [
47], values of Transformed Divergence higher than 1600 indicate signatures with good separability. According to the results listed in
Table 1, the medium class has more likelihood of confusion with other classes, especially the high class. A suggested future line of research is to apply the Random Forest algorithm [
41] to classify the reference data with the aim of minimizing the confusion between classes.
Although NDRE is in general indicated for vegetation masses in a disperse or low-vigour state, due to the tendency of NDVI to become saturated, McNemar chi-squared tests showed no evidence of differences between all the possible pairwise comparisons of fire severity indices with 95% confidence. This fact could be explained by the high density of shrubs present in the study area.
The similarity between reference data and the three fire severity indices was evaluated through the corresponding cross-tabulation of confusion matrices.
Table 2 shows the results of these comparisons based on the Kappa and Cramer’s Value statistics [
45,
49].
The order of magnitude of the Kappa statistic is similar that those obtained by [
19], which tested only indices based on the visible spectrum. They show Kappa values of 0.37, 0.31 and 0.06 for three indexes obtained from the visible spectrum (EGI, EGIR and MEGI respectively). They concluded that image differencing using RGB UAV imagery is able to classify fire severity at a local scale (10,000 m
2–1 km
2) with satisfactory accuracies. The resulting Kappa value of 0.536, associate to d-NDVI index, improves those obtained by [
19] likely because the use of multispectral bands instead of visible, and the classification algorithms applied.
5. Conclusions
Regarding the d-EGI, d-NDVI, and d-NDRE comparison, no significant differences were obtained between their classes but the similarity between d-NDVI and the reference data was higher. Therefore, d-NDVI is the best estimator of fire severity obtained from multispectral UAV-imagery flying at a constant height close to 55 m above the terrain of a forest environ with high slopes and Mediterranean vegetation.
Very high-resolution multispectral UAV imagery was demonstrated to be adequate for satisfactory estimation of fire severity based on the analysis of pre- and post-fire images, at a local scale up to 15 ha.
The artificial neural network algorithm based on OBIA segmentation was an objective method of characterizing the fire severity reference data according to the measurements collected in situ and validated with orthoimagery photointerpretation.

 ,
, 


