Article

Cropland Product Fusion Method Based on the Overall Consistency Difference: A Case Study of China

1
State Key Laboratory of Information Engineering in Surveying, Mapping and Remote Sensing, Wuhan University, Wuhan 430079, China
2
Hubei Provincial Engineering Research Center of Natural Resources Remote Sensing Monitoring, Wuhan University, Wuhan 430079, China
3
Faculty of Resources and Environmental Science, Hubei University, Wuhan 430062, China
*
Author to whom correspondence should be addressed.
Remote Sens. 2019, 11(9), 1065; https://doi.org/10.3390/rs11091065
Submission received: 8 April 2019 / Revised: 25 April 2019 / Accepted: 26 April 2019 / Published: 6 May 2019
(This article belongs to the Section Remote Sensing Image Processing)

Abstract

:
There is inconsistency between the existing remote sensing cropland products, whose accuracy of estimated cropland area and spatial positioning needs to be improved. The existing generalized methods of generating synergy cropland products for improving the accuracy of existing products do not consider the overall consistency difference between the different products in each grid cell in the fusion process. To reduce the impact of the abnormal estimated cropland areas of the individual cropland products on the results, this paper proposes a method of generating a synergy cropland product by fusing the multiple existing cropland products, based on the overall consistency difference. In the proposed method, the process of fusing the multiple existing cropland products is based on the overall consistency difference of the estimated cropland area of all the cropland products in each grid cell. The synergy cropland product is then generated after determining the best combination level with the cropland statistics. In this study, we set 2010 as the base year, and used the proposed method to conduct experiments with four remote sensing cropland products: GlobCover 2009, MODIS Cropland, MCD12Q1, and FROM-GLC within China, and national cropland statistics. The results show that the synergy cropland product generated by the proposed method has a higher accuracy of cropland area estimation and spatial positioning than the results obtained by the generalized model, as well as the original products.

1. Introduction

Accurate cropland distribution information is very important for food security and environmental sustainability [1]. Satellite remote sensing imagery provides us with an efficient data source, from which large-area cropland distribution information can be obtained, along with its spatial and temporal variations [2]. In recent decades, a number of global and intercontinental remote sensing land-cover products that include cropland categories have been released, many of which are available to the public free of charge. The early land-cover products have a low spatial resolution, usually 1 km, as in IGBP-DISCover [3], UMD LandCover [4], and GLC2000 [5]. With the improvement of satellite technology and classification methods, the spatial resolution of the land-cover products has been improved to 500 m, as in MODIS Collection 5 [6,7], and then 300 m, as in GlobCover 2009 [8]. Nowadays, several cropland products with a resolution of 30 m are available, such as GlobeLand30 [9,10] and FROM-GLC [11]. However, there is considerable inconsistency between the cropland categories extracted from the different remote sensing land-cover products. In addition, the estimated cropland areas of these products are quite different from the official statistics, and the spatial positioning accuracy is poor as it is limited by mixed pixels [12,13].
There have been several studies focusing on improving the accuracy of the existing remote sensing products through multi-source data fusion. Some studies have employed locational information and smoothing techniques and predicted the distribution of cropland by using geographic regression analysis between geographic data as training samples and the existing remote sensing products [14,15,16,17,18,19]. Other studies have used multi-source data fusion methods such as Dempster–Shafer evidence theory [18], fuzzy set theory [20], and Bayesian theory [21,22]. The methods mentioned above have improved the accuracy of land-cover products and cropland products, to a certain extent, but a lot of hard-to-obtain prior knowledge is needed. Some studies have established fusion decision rules to fuse multi-source data by analyzing the consistency between them, but they have ignored their quality differences [23,24,25,26,27]. Fritz et al. [28], Lu et al. [29], and Chen et al. [19] ranked the input multi-source data by their accuracy assessment and assign different weights accordingly, to generate synergy cropland products, and provided a feasible scheme to solve the above problems [12]. Nevertheless, the existing generalized methods used in the previous studies do not consider the overall consistency difference between the different products in each grid cell in the process of fusing cropland products for generating a synergy cropland product, and are thus greatly affected by the low-quality products with abnormal cropland areas, resulting in a large difference between the estimated results and the actual cropland areas.
In this paper, to reduce the impact of the abnormal estimated cropland areas of individual products on the results, we propose a new method for generating a synergy cropland product by fusing the multiple existing products based on the overall consistency difference. In the proposed method, we first create a fusion combination level table, where the overall consistency difference of the estimated cropland area of all the products in each grid cell is considered as the basis of the fusion. The synergy cropland product is finally generated after determining the best combination level with the cropland statistics. The proposed method can quickly and efficiently obtain the cropland distribution result of the study area, i.e., the synergy cropland product, with a high accuracy of cropland area estimation, as well as spatial positioning, without relying on training samples. In the experiments conducted in this study, we set 2010 as the base year, and used the remote sensing cropland products of GlobCover 2009 [8], MODIS Cropland [7], MCD12Q1 [6], and FROM-GLC [11], along with national cropland statistics from the Geographical Information Monitoring Cloud Platform, to generate a new synergy cropland product for China. The synergy cropland product is an improvement on every original product and the result generated by the existing method based on a generalized model, in both the accuracy of the cropland area estimation and the accuracy of the spatial positioning.
The rest of this paper is organized as follows. In Section 2, we describe the four cropland products used in this paper and the generalized model. In Section 3, we introduce the model proposed in this paper for generating the synergy cropland product. In Section 4, we describe the experiments conducted with the proposed method and carry out a quality assessment of the synergy cropland product. We then compare the synergy cropland product with the results obtained by the generalized model, as well as the original products, to analyze the experimental results. Finally, a summary and discussion are provided in Section 5.

2. Background

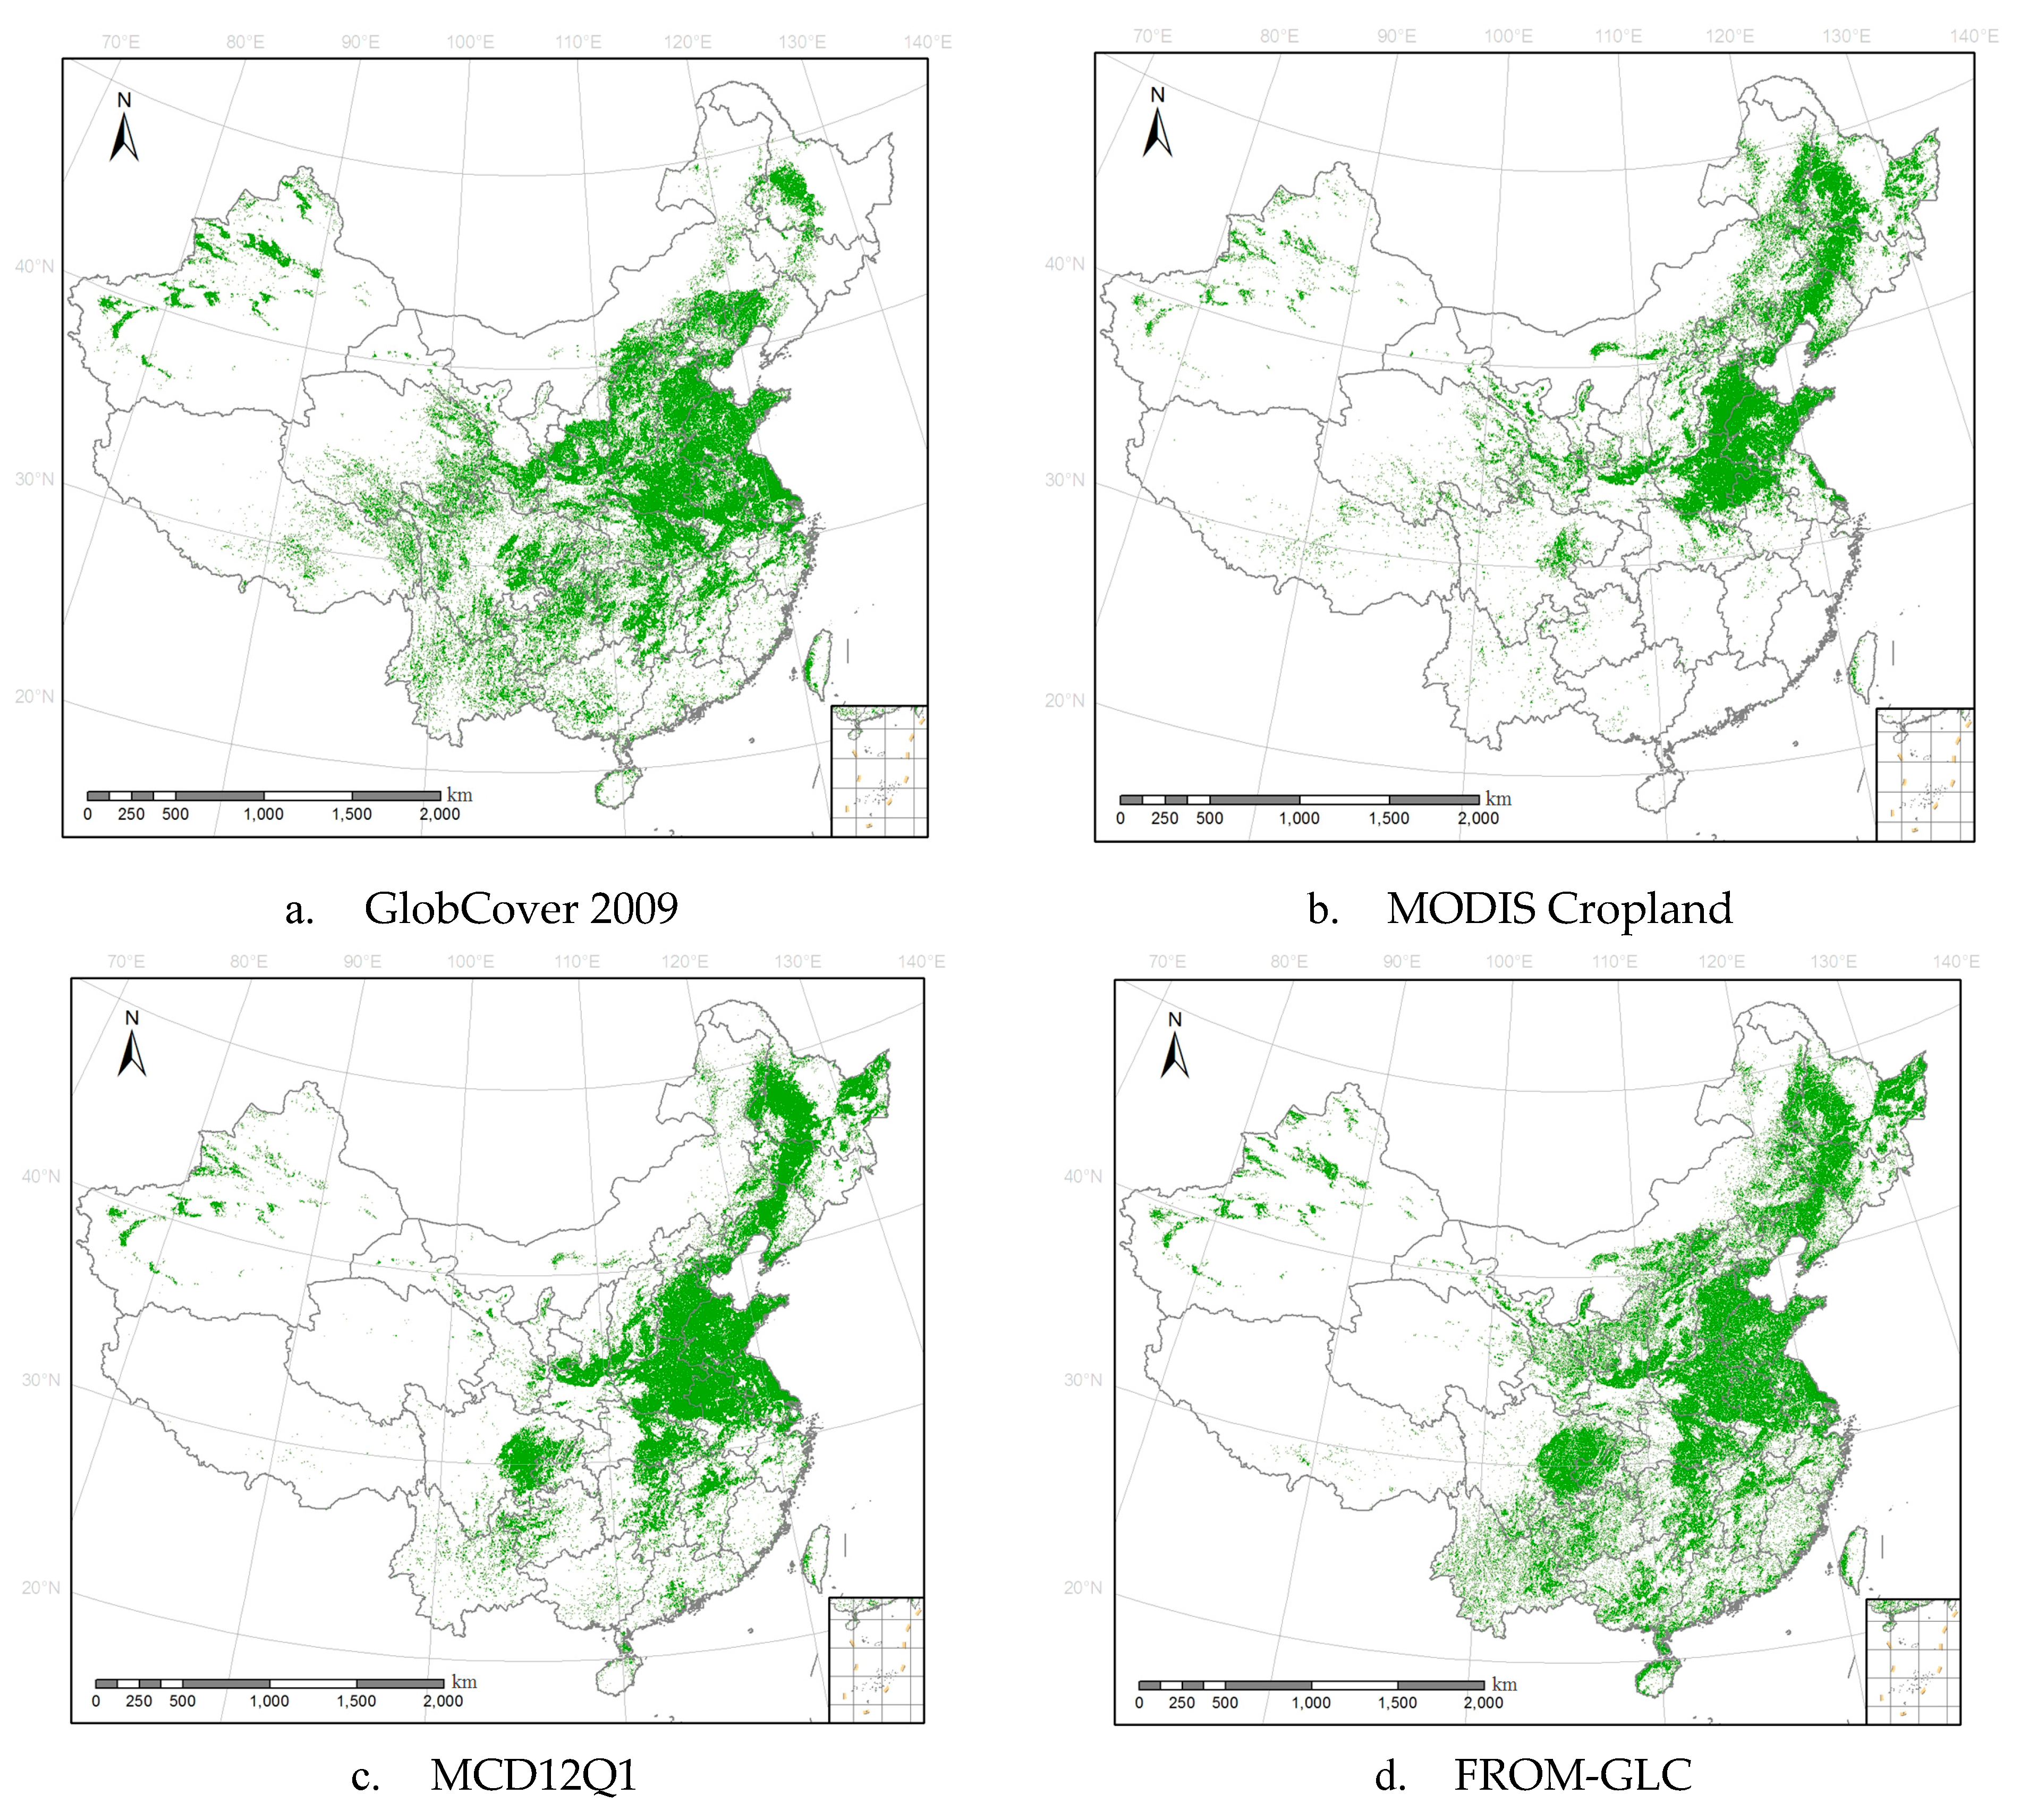
2.1. Description of the Data Sources for Fusion

In order to generate the best synergy cropland product for China, in the process of fusion, the national cropland statistics of China for 2010, obtained from the Geographical Information Monitoring Cloud Platform, were selected as the non-remote sensing data, and four different remote sensing cropland products at global or regional scales were selected as the remote sensing data sources, obtained from four land-cover products: GlobCover 2009, MODIS Cropland, MCD12Q1, and FROM-GLC. After extracting the cropland type information of each land-cover product, cutting all the products with a Chinese regional vector map, the obtained cropland parts of all the land-cover products for China are shown in Figure 1. Table 1 provides detailed information on these remote sensing cropland products.
There are differences in the spatial resolutions, data sources, temporal coverage, classification methods, and accuracy between the remote sensing cropland products. Therefore, these products have great inconsistencies in spatial distribution.
The GlobCover 2009 product, which is produced by the European Space Agency (ESA) and the Université Catholique de Louvain (UCL), is mainly based on medium resolution imaging spectrometer (MERIS) reflectivity data with a spatial resolution of 300 m. The MODIS Cropland product is based on 250-m moderate resolution imaging spectroradiometer (MODIS) data from 2000 to 2008. For this product, the probability of cropland was calculated using a decision tree classifier with the MODIS metrics. Then, according to the statistical data of the cropland area, a threshold was set to determine the area of cropland. Boston University developed a new global land-cover product known as MCD12Q1 with a 500-m spatial resolution using MODIS data from 2000 to 2012. The spectral and temporal features of MODIS bands 1–7 and the enhanced vegetation index were used to implement decision tree classification. The data from 2010 were used in this study. The FROM-GLC product is the first comprehensive high-resolution land-cover map of the world, which was created by researchers at Tsinghua University using Landsat Thematic Mapper (TM)/Enhanced Thematic Mapper Plus (ETM+) images. It was produced by integrating many automatic classification algorithms (random forest, the fast clustering algorithm based on feature space transformation, etc.). Although these input cropland products are slightly different in temporal coverage, the impact of the inconsistency between them is much larger than that of the temporal difference on the final synergy product.

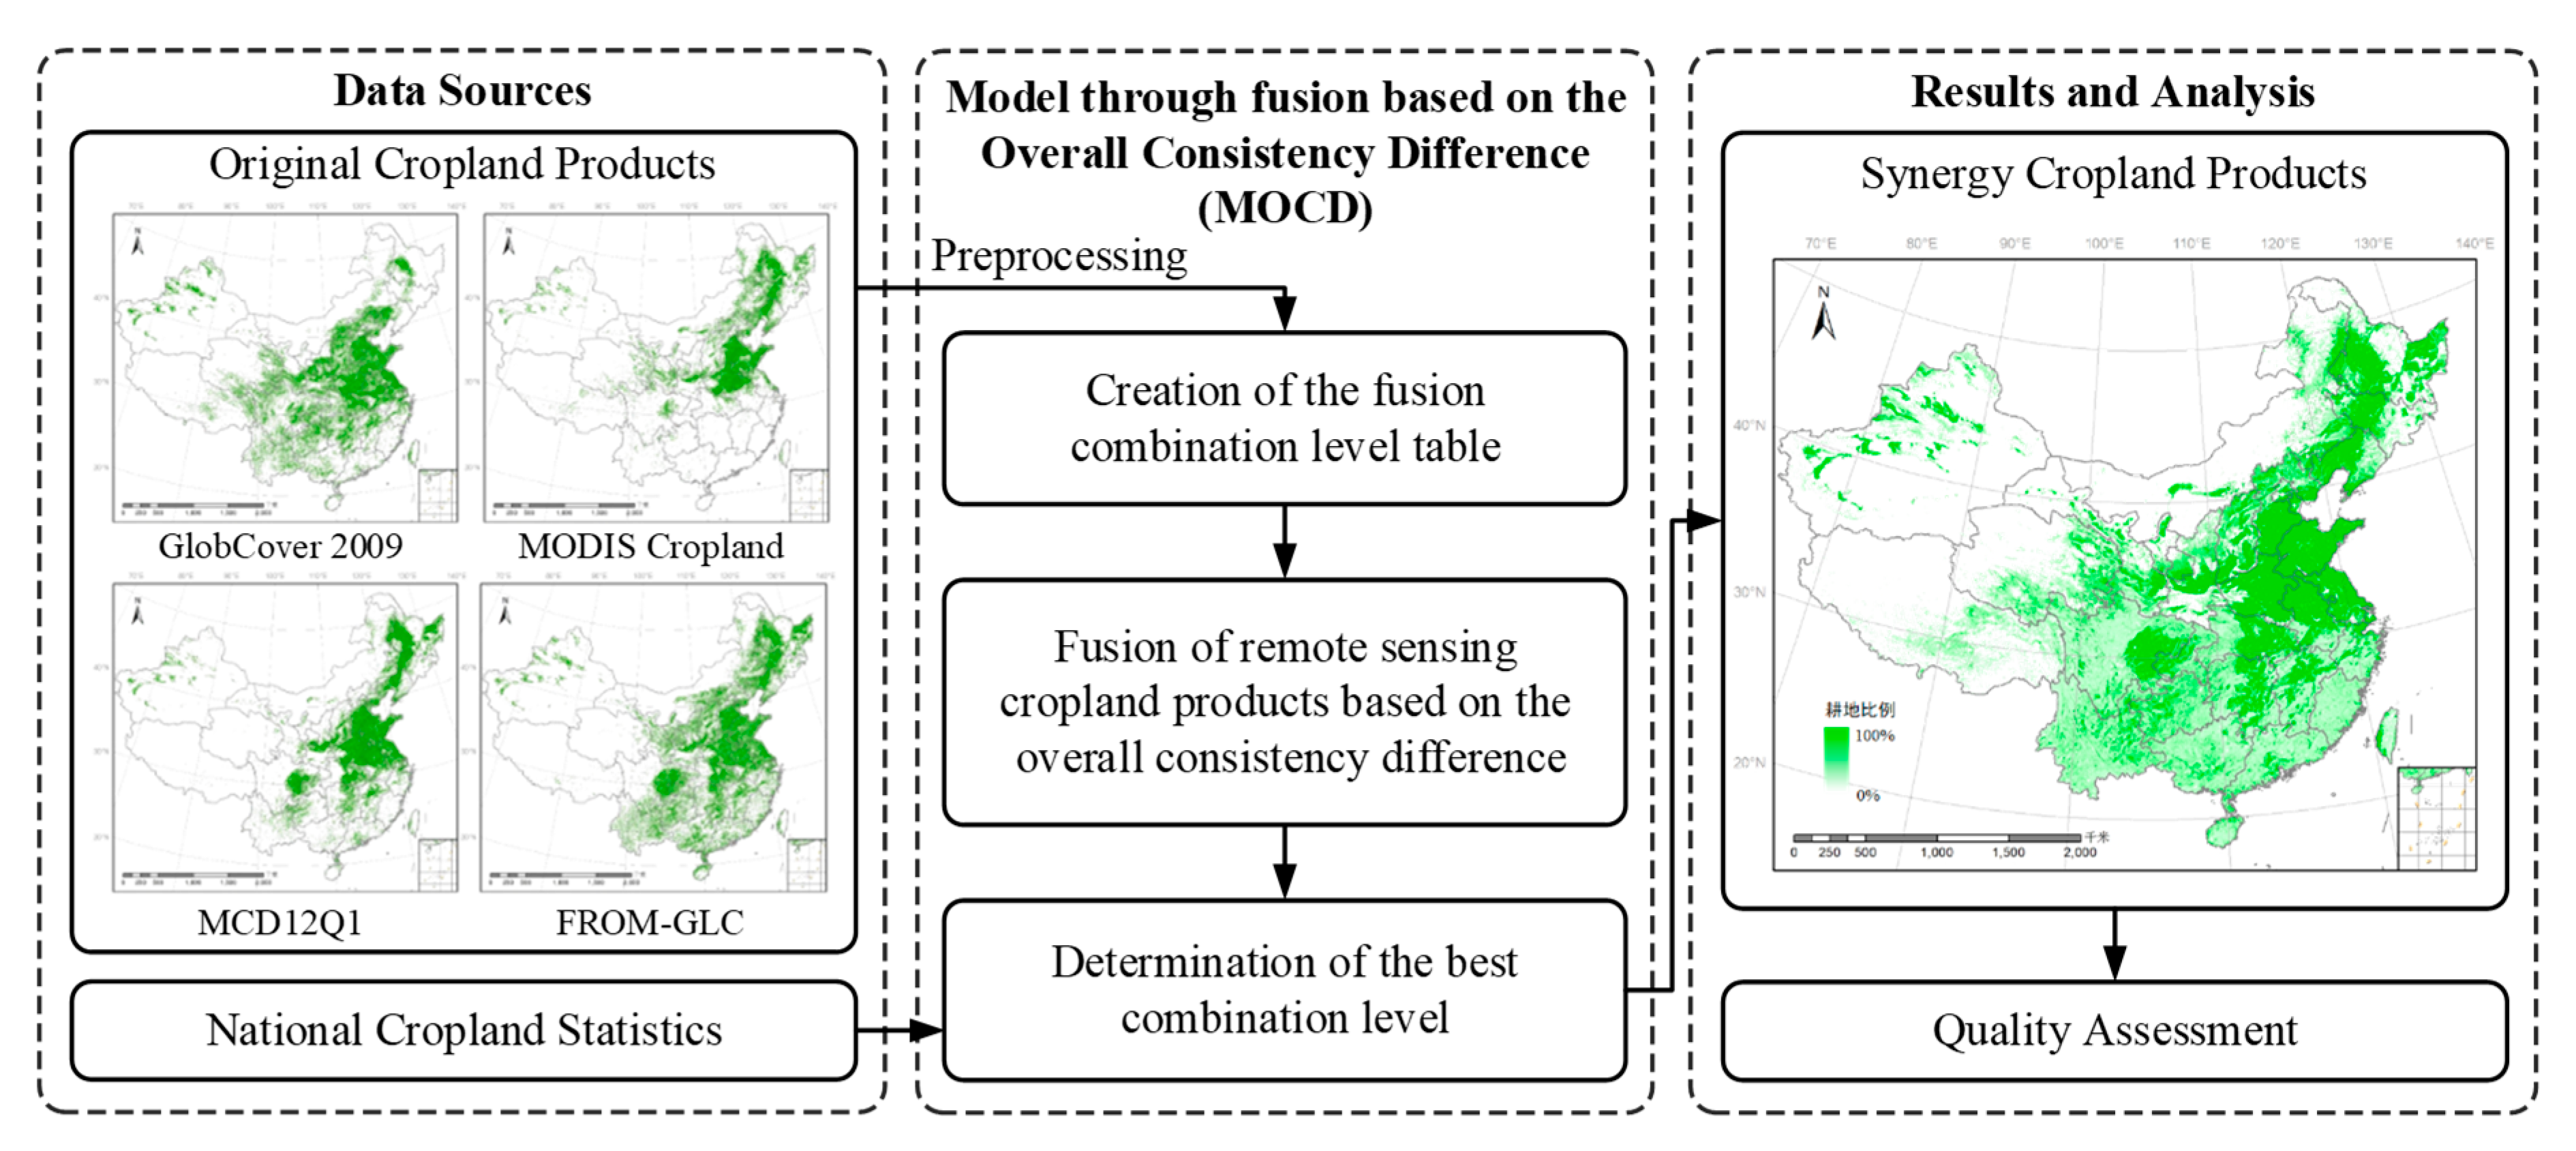
2.2. Generalized Model for Generating a Synergy Cropland Product

The basis of our study is the generalized model of multi-source remote sensing data consistency fusion [28], or named as modified fuzzy agreement scoring (MFAS) [19] or hierarchical optimization synergy approach (HPSA) [29]. The generalized fusion model for generating a synergy cropland product based on data consistency involves establishing certain decision rules by analyzing the consistency differences of the existing remote sensing cropland products, so as to generate a synergy cropland product [12,19]. This is essentially equivalent to decision-level fusion of the multiple existing remote sensing classification products.
The general logic of the generalized model is that, after resampling to a certain size grid cell, a grid cell with greater consistency among the existing remote sensing cropland products is more likely to truly contain cropland [19,28,29]. Based on this principle, the generalized model can be divided into the following three steps: (1) Create the fusion combination level table according to the difference in product quality according to the quality of each cropland product; (2) fuse the multiple existing products according to the established fusion combination level table based on the direct arithmetic average method; and (3) determine the best combination level constraint adaptively with the cropland statistics.

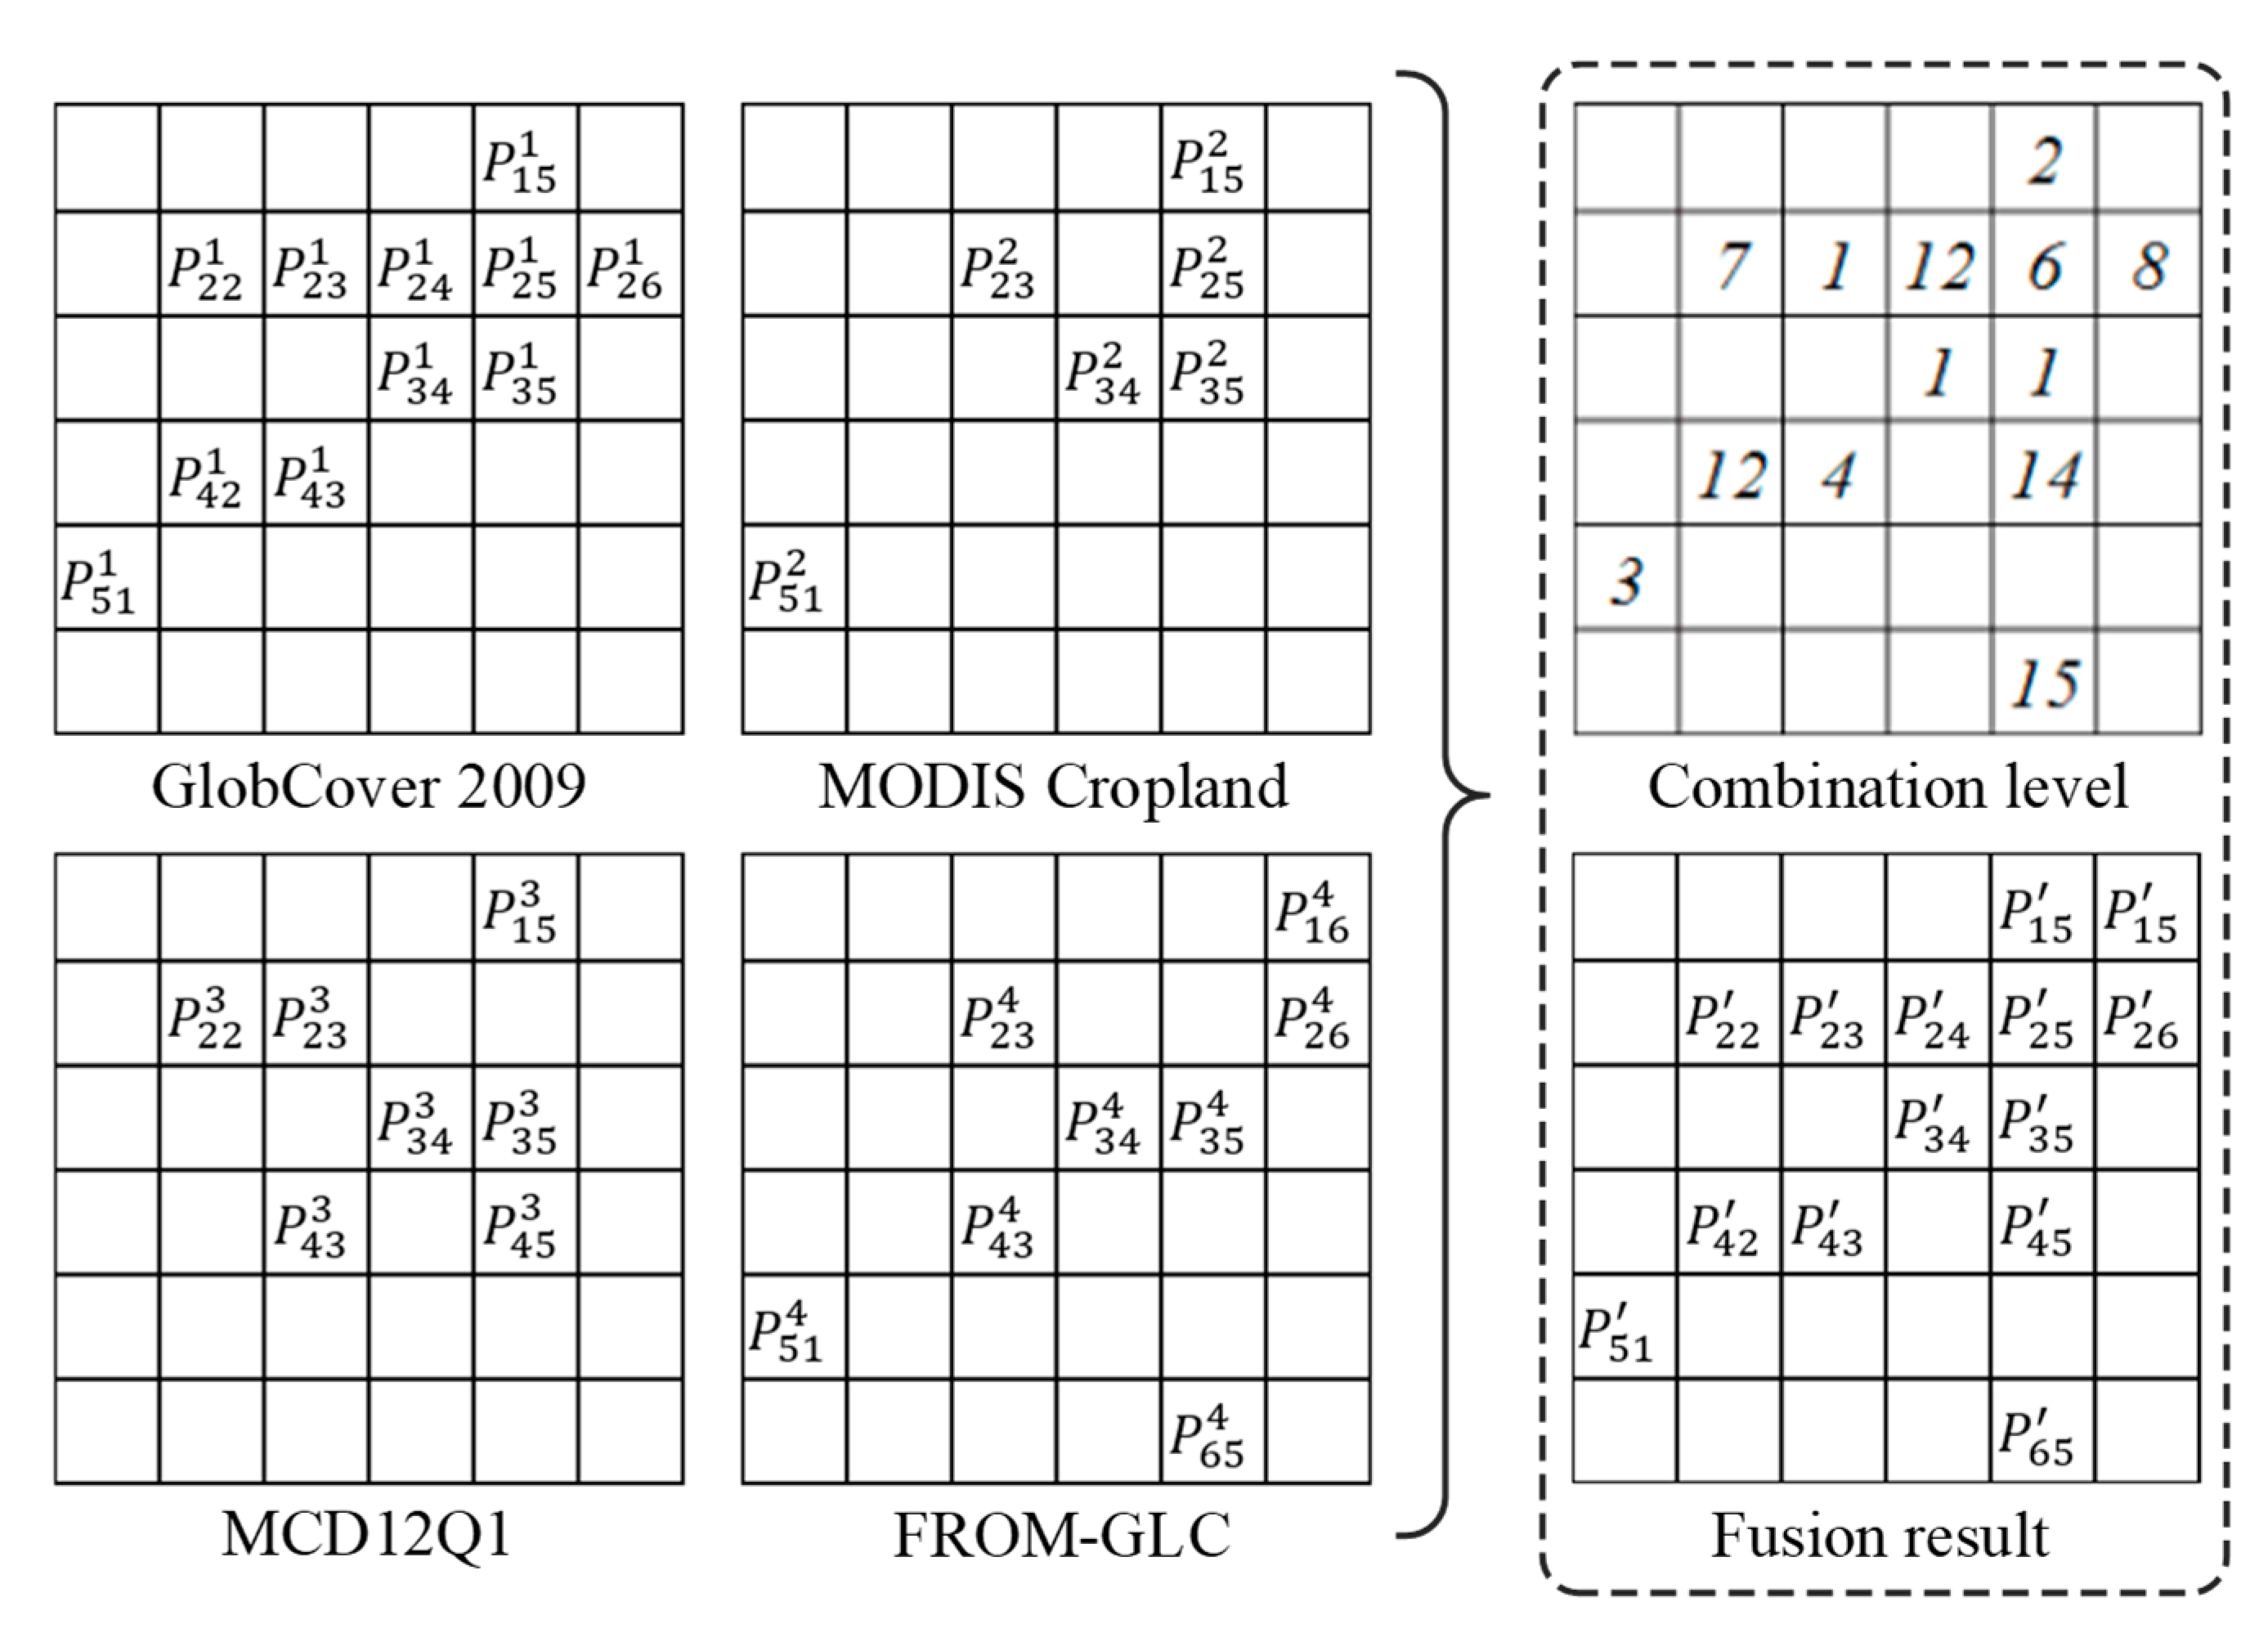
2.2.1. Creation of the Fusion Combination Level Table

As greater consistency between remote sensing cropland products means a greater likelihood of proximity to actual cropland area, the different consistency levels can be divided according to the overall consistency difference between all the used remote sensing cropland products. Thus, there are M consistency levels for M products. The higher the consistency between the products, the higher the consistency level the grid cell obtains, and the higher the likelihood or probability that cropland exists at the grid cell.
When there are M different product combinations for certain consistency levels, there are 2 M 1 different product combinations in total. Therefore, according to the accuracy difference of the different original products in the estimation of cropland area, we give different weights to the different products, so that we can sort these different product combinations and make a fusion combination level table for the generation of the synergy cropland product.

2.2.2. Fusion of Cropland Products Based on the Direct Arithmetic Average Method

The fusion of remote sensing cropland products based on the direct arithmetic average method involves simply calculating the average cropland proportion of the different products in the grid cell. The fusion is then conducted according to the fusion combination level table.
The proportion of cropland area in each grid cell ( x , y ) after fusion is:
P x , y = α = 1 M P x , y α M
where P x , y α is the cropland proportion of the product α , and M’ is the number of products with a proportion of cropland area greater than 0 in the grid cell; that is, the agreement level is determined according to the product consistency.

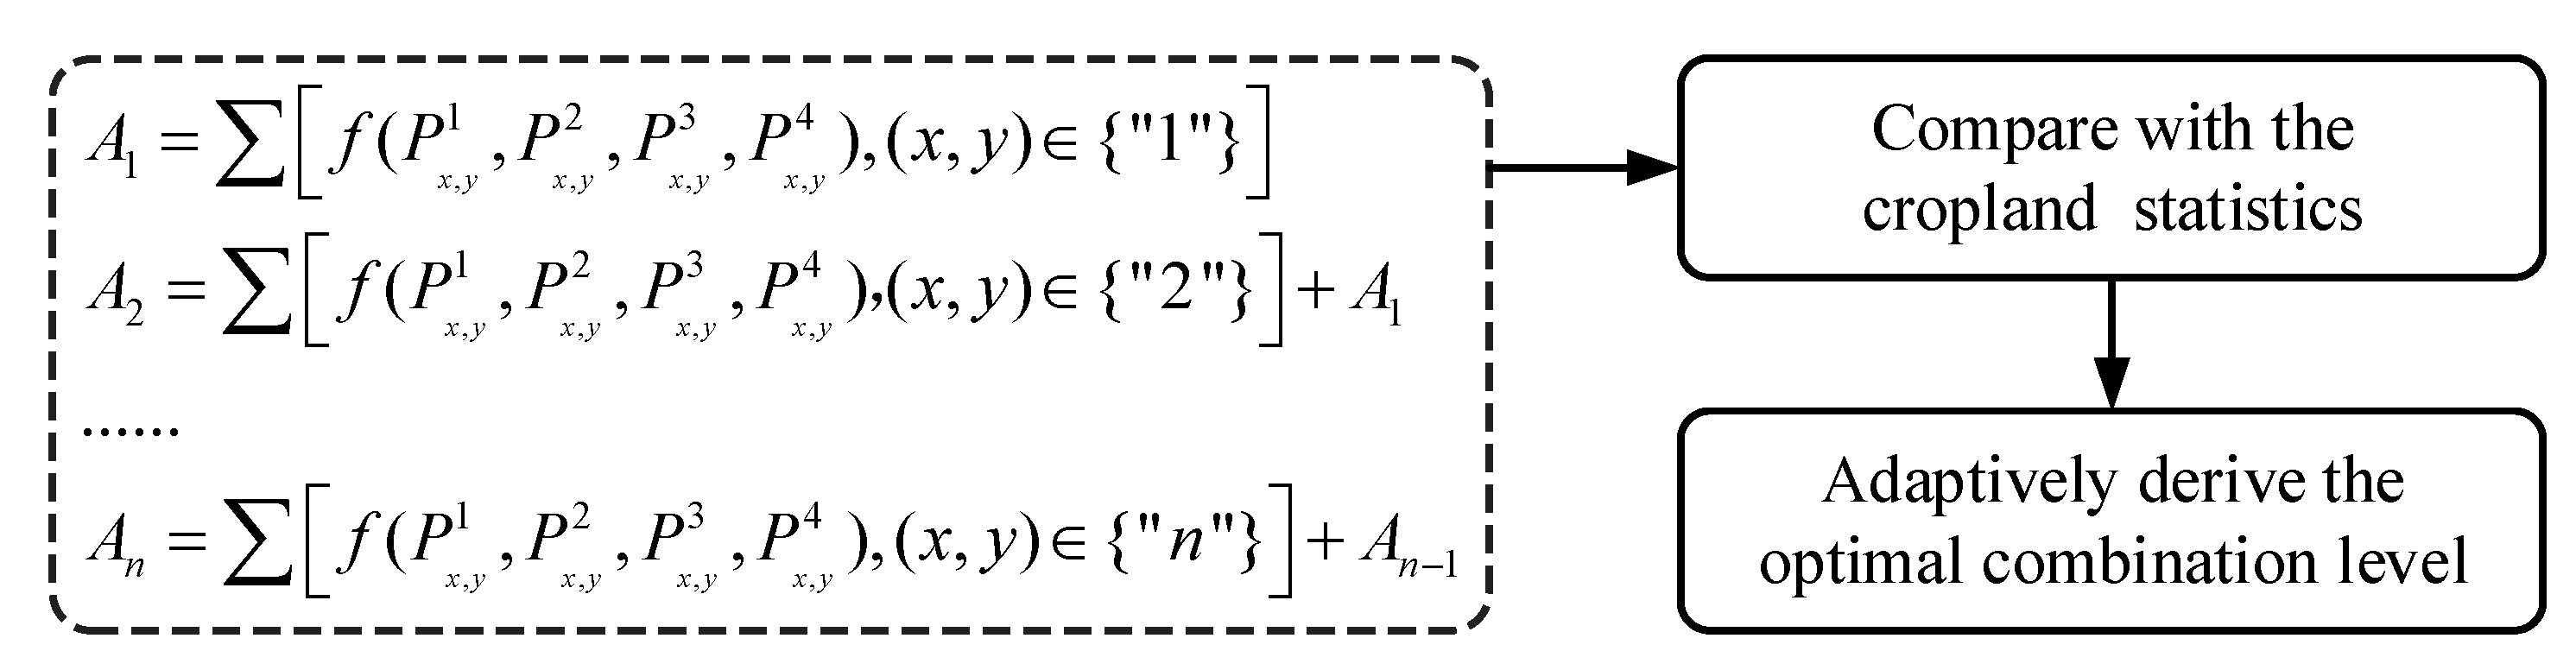
2.2.3. Determination of the Best Combination Level with Cropland Statistics

After the hierarchical integration of each grid cell according to the different fusion levels, the fusion results at the different levels are obtained, which means that the different grid cells are fused at their corresponding fusion levels. When the fusion according to the different fusion levels is completed, the results of the fusion are accumulated in different combination levels until the results are the closest to the statistics of the cropland area, and the optimal combination level is obtained. The synergy cropland product can then be generated.
Through the attempts of many researchers, the generalized model can be used to generate a synergy cropland product with a higher accuracy of cropland area estimation and spatial positioning than the original products, to a certain extent. However, as the fused cropland proportions of the grid cells at different combination levels are calculated based on the average cropland proportion of different products, the generalized model is only suitable for use in grid cells with a high overall consistency. It is thus greatly affected by the proportion of cropland area of an abnormal product, which may result in a large difference between the calculation result and the actual cropland area.

3. Model for Generating the Synergy Cropland Product by Fusing the Cropland Products Based on the Overall Consistency Difference

In order to reduce the impact of the individual abnormal product on the overall proportion of cropland area, we have improved the fusion algorithm based on direct arithmetic average in the generalized model, and innovatively propose a model for generating a synergy product through fusion of the cropland products based on the overall consistency difference.
As the principle used in the generalized model is that a grid cell with greater consistency in the existing products is more likely to contain cropland, this model first needs to create the fusion combination level table. This is followed by the fusion of the original cropland products based on the overall consistency difference. The synergy cropland product is then generated after determining the best combination level with the cropland statistics.
It is necessary to verify the accuracy of the synergy cropland product generated by the model and to compare it with the result of the generalized model, as well as the original products, in order to evaluate the model. The specific flowchart of the proposed model is shown in Figure 2.

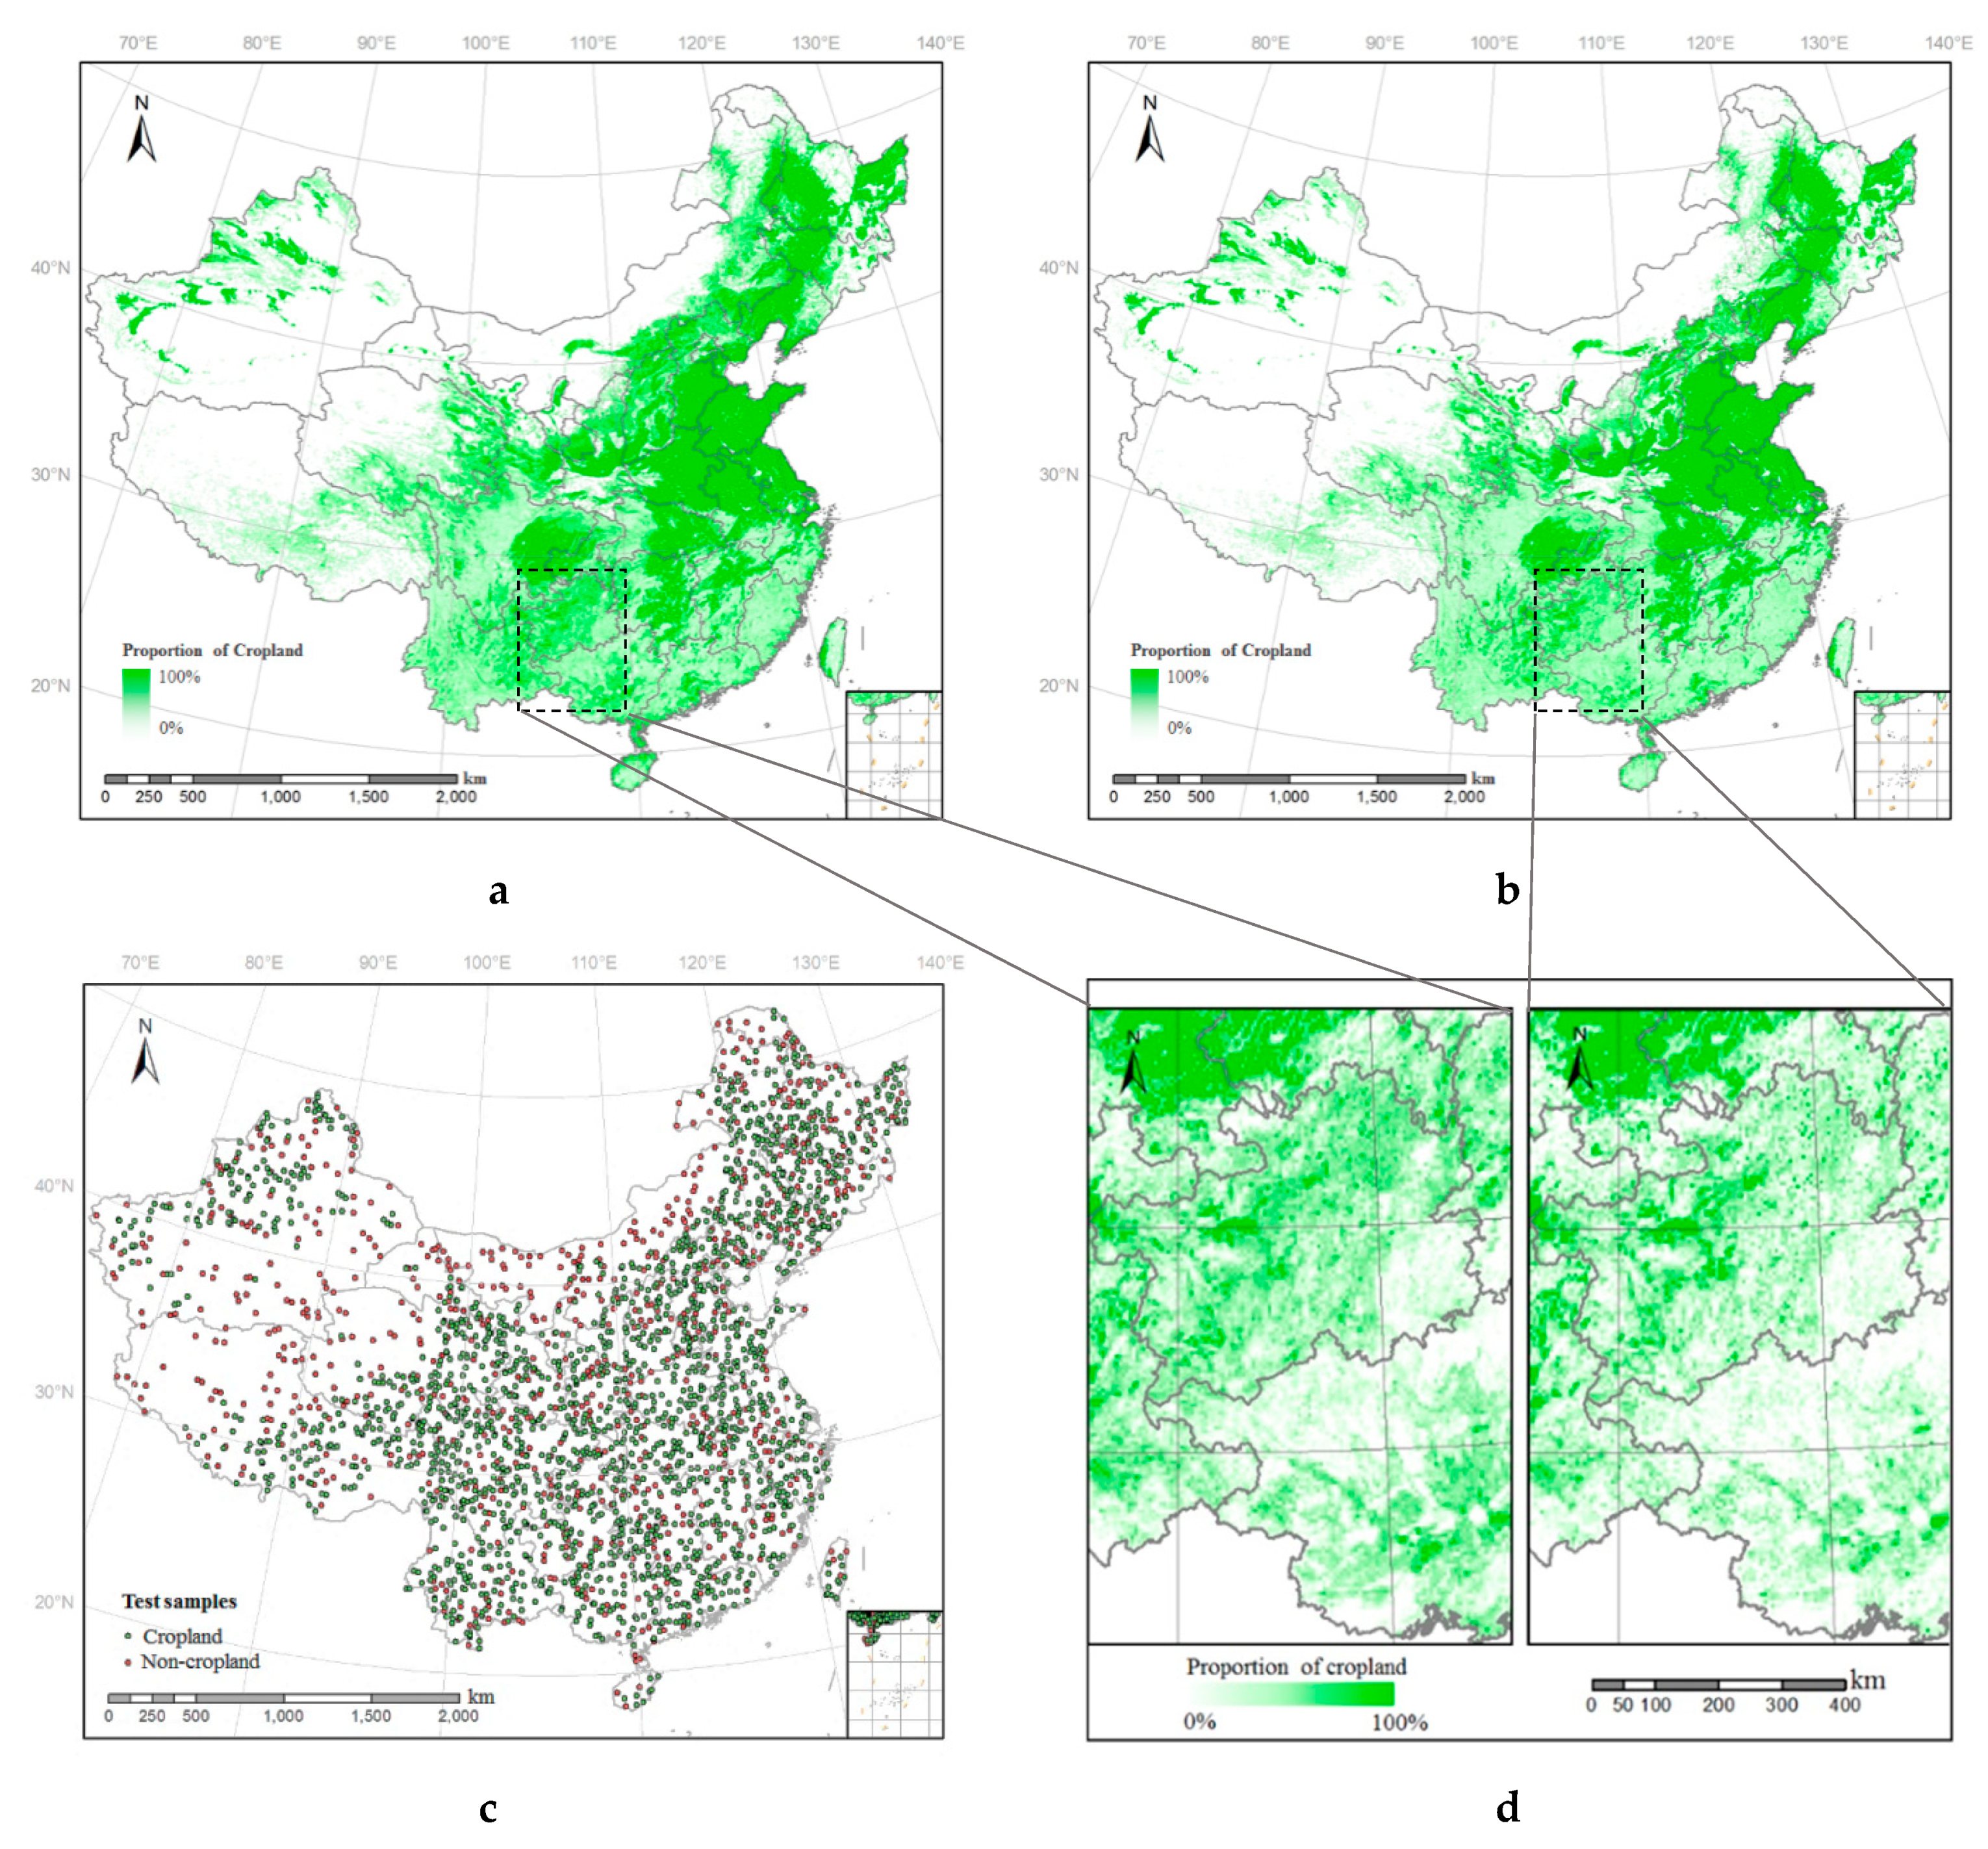
3.1. Preprocessing of Cropland Products

Before the fusion of the different remote sensing cropland products, all the products were unified into the same geographical coordinate system (WGS-1984), and all the products were registered geographically. In addition, the original cropland products needed to be standardized and resampled to the minimum resolution of all the original cropland products, according to the practice of the generalized method [28,29]. After resampling all the products to a 500 × 500 m grid cell, the value inside each grid cell is the proportion of the original cropland product area to the grid cell area, which is used to generate the hybrid percentage map of cropland.

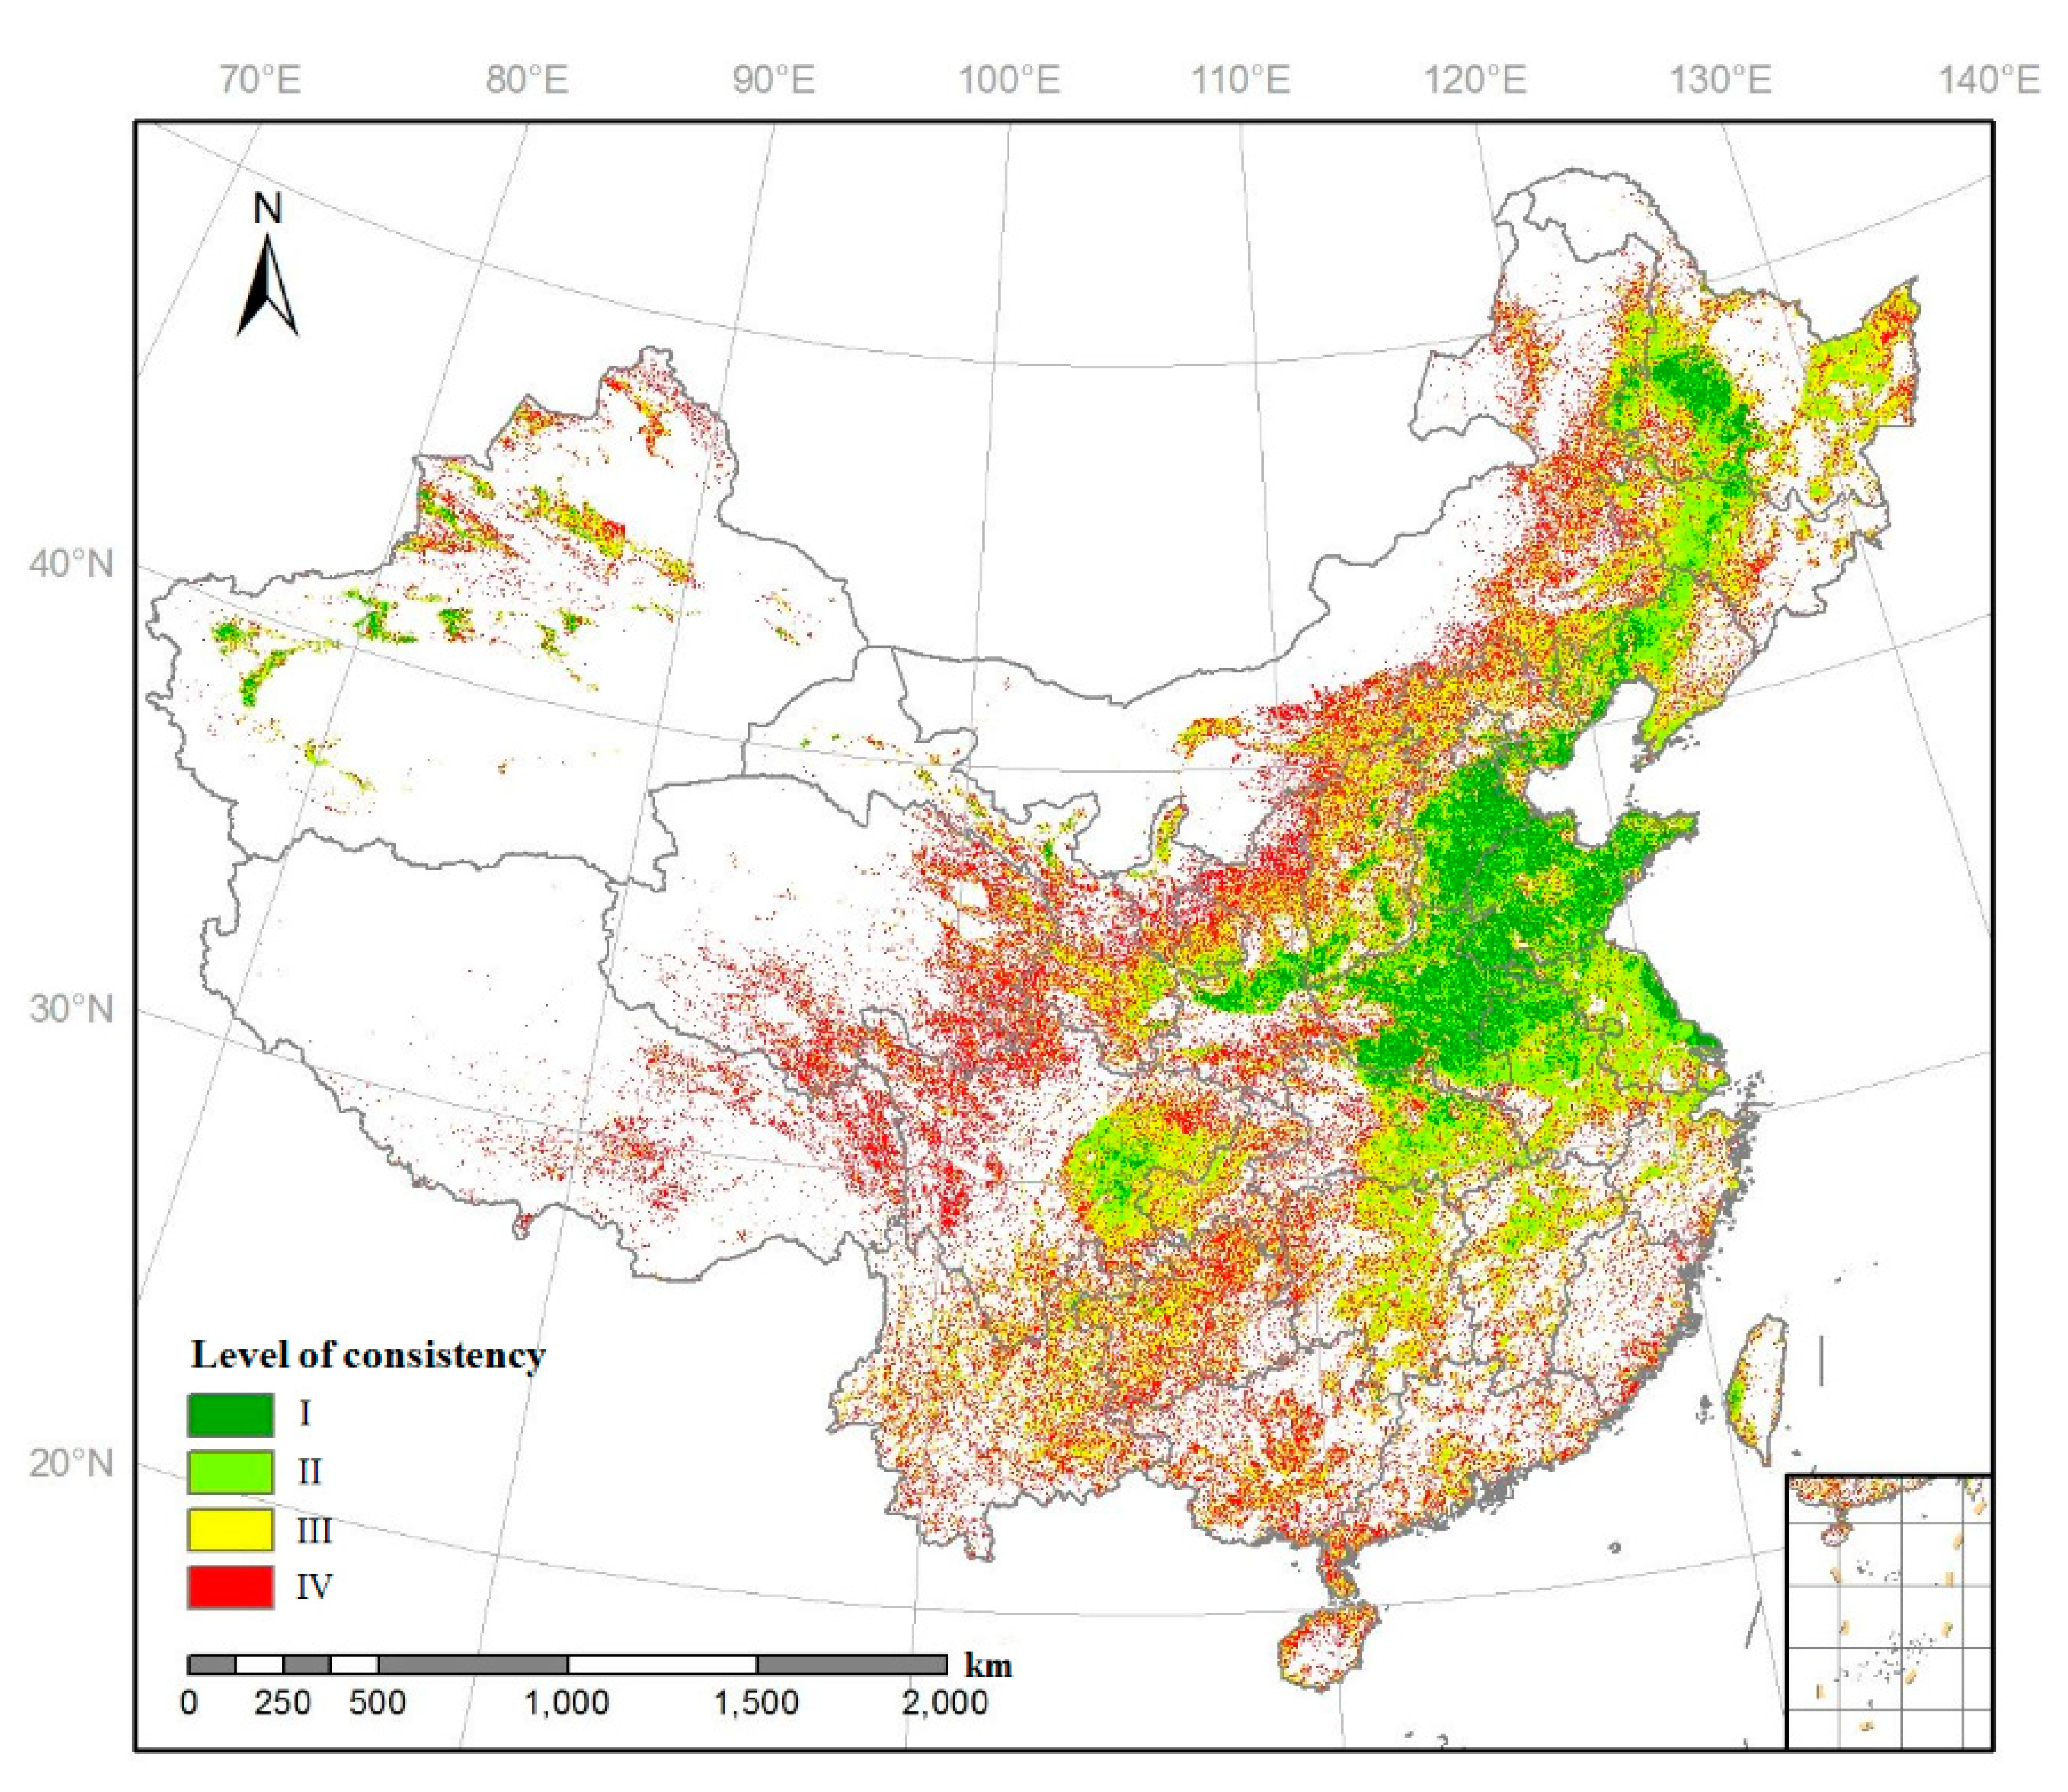
3.2. Creation of the Fusion Combination Level Table

The fusion combination level table can be created according to the principle of greater consistency between original products meaning a greater likelihood of proximity to real cropland. The number of the imported products in this paper is four, so there are four different consistency levels, according to the consistency of the cropland in the different grid cells. The spatial distribution of the consistency levels is shown in Figure 3.
The quality assessment shows that the accuracy of GlobCover 2009, MODIS Cropland, MOD12Q1, and FROM-GLC in the estimation of cropland area decreases in turn. The final fusion combination level table can be created according to the difference in product quality of each product, as shown in Table 2 (where “0” means non-cropland and “1” means containing cropland).
After completion of this part, each grid cell is then divided and marked with the different consistency levels and fusion combination levels. The grid cells with high consistency levels are the focus of this model in the next step.

3.3. Fusion of Remote Sensing Cropland Products Based on the Overall Consistency Difference

For grid cells with a high consistency level, which means that most of the cropland products within the grid cells have values, their cropland area proportions can differ widely. Specifically, a grid cell ( x , y ) belongs to { i } ( i = 1 , 2 , , 5 ) , where { i } represents a set of grid cells with combination level i . Therefore, the differences in overall consistency within the grid cell of the different products need to be considered, to reduce the impact of individual low-quality products.
Therefore, in the process of fusion, which is the most important part of this model, the weight of the cropland area proportion of the products in each grid cell is determined according to the difference of the overall consistency. A higher weight is given to a product with higher consistency with the overall cropland area proportion, and a smaller weight is assigned to a product with a lower overall consistency. According to the above principle, the proportion of cropland area in each grid cell is established.
In content-based remote sensing image retrieval (CBIR), similarity metric is used to indicate the difference between the features of the image to be retrieved and the features of the target image [30,31]. For the data characteristics of the various remote sensing cropland products, similarly, we can also consider a similarity metric called overall consistency metric to represent the difference between a single product and all the products.
In the beginning, a confidence distance between the various cropland products, as the measurement of the mutual support degree between the multiple existing products, in the grid cell ( x , y ) is defined as follows:
Δ x , y α β = Δ x , y β α = | P x , y α P x , y β |
where P x , y α ( α = 1 , 2 , , M ) , P x , y β ( β = 1 , 2 , , M ) are the elements in { P x , y α } , and the set represents the cropland proportions of all the cropland products. The greater the value of Δ x , y α β , the greater the difference in the area proportion between the two products in the grid cell, which means that the mutual support between P x , y α and P x , y β is weaker. The definition of the confidence distance makes full use of the implicit information in each grid cell of the multiple existing cropland products and reduces the requirement for prior information.
In order to standardize the mutual support between the cropland area proportion of all the cropland products, the definition of the consistency distance D x , y α β is as follows:
D x , y α β = max { Δ x , y α β } Δ x , y α β max { Δ x , y α β }
where max { Δ x , y α β } represents the maximum value in Δ x , y α β . If all the proportions in { P x , y α } are exactly equal, the proportion of cropland in the grid cell ( x , y ) can be directly represented by the proportion of any product P x , y α . In addition to this situation, the confidence distances in { Δ x , y α β } are not all 0, which means max { Δ x , y α β } > 0 . Clearly, D x , y α β has the following two characteristics [32]: (1) D x , y α β is inversely proportional to Δ x , y α β ; and (2) D x , y α β [ 0 , 1 ] .
In the case of considering the difference in the spatial distribution quality of the different cropland products, we let R x , y α denote the similarity of P x , y α with all the proportions of { P x , y α } :
R x , y α = β = 1 M w α D x , y α β
where w α is the weight coefficient of each product, which is obtained according to the spatial accuracy of each product. In addition, w α is positively correlated with the kappa coefficient of the spatial positioning accuracy of product α , i.e., w α k a p p a α . At the same time, an overall consistency vector R x , y = w D x , y is constructed to represent the overall degree of support for all the elements in { P x , y α } , where vector R x , y = [ R x , y 1 R x , y 2 R x , y M ] represents the consistency, and vector w = [ w 1 w 2 w M ] represents the weight.
D x , y = [ D x , y 11 D x , y 12 D x , y 1 M D x , y 21 D x , y 22 D x , y 2 M D x , y M 1 D x , y M 2 D x , y M M ]
represents the consistency matrix.
The primary weight w α is different from the weight defined in the similarity metric in the CBIR research. For example, Rui et al. [30] directly use the inverse of the standard deviation metric as the estimation of the weight, which is also a measurement for confidence among data elements. Due to the target objects, the actual equations, and the functions of the similarity metric and the overall consistency R x , y α generated in our research are different. Most importantly, the overall consistency vector R x , y is used for being decomposed to obtain the feature vector corresponding to the maximum eigenvalue and finally generate the weight of different products for fusion process.
The maximum eigenvalue λ x , y ( λ x , y > 0 ) exists in R x , y , and the elements in the eigenvector γ x , y = [ γ x , y 1 γ x , y 2 γ x , y M ] T corresponding to only this eigenvalue are all positive, and to make R x , y γ x , y = λ x , y γ x , y [33].
The eigenvectors corresponding to the maximum eigenvalues are then normalized:
γ x , y α = γ x , y α α = 1 M γ x , y α
where γ x , y α obtained through this process is taken as the weight of P x , y α , the cropland proportion of product α in the fusion process. In CBIR systems, the weights can be dynamically modified by relevance feedback with a recursive implementation [31]. In this paper, the final weights of different products in different grid cells can be also automatically adapted through the process above according to their different overall consistency.
Finally, the proportion of cropland area after fusion in each grid cell ( x , y ) can be calculated as follows:
P x , y = α = 1 M P x , y α γ x , y α .
This significant step can reduce the impact of individual abnormal products whose proportion of cropland area has poor consistency with the cropland area proportion of the overall product. However, this method has certain requirements on the quantity and quality of the cropland products.
Through this process, the cropland area proportion of grid cells with high consistency will rarely be impacted by the abnormal estimated cropland area of individual products and will be closer to the real value, while the cropland area proportion of grid cells with low consistency will be similar to the result by fusion based on the direct arithmetic average.

3.4. Determination of the Best Combination Level

The fusion results at different levels can be obtained after fusing the different original remote sensing cropland products based on the overall consistency difference, which means that different grid cells are fused at their corresponding fusion levels after the so-called hierarchical integration of each cell grid cell according to the different fusion levels, as shown in Figure 4.
According to the established hierarchical order of the fusion combination level, the fusion results are superimposed by combination level, and the best fusion results are obtained by the use of the cropland statistics data as an adaptive constraint, as shown in Figure 5. When this process is completed, the synergy cropland product can be generated.
In the step of using cropland statistics as a constraint of the hierarchical superposition by combination level to obtain the synergy cropland product, the range that should be adjusted when using the cropland statistics to adaptively determine the results is adjusted accordingly as the proportion of cropland area in each grid cell after the fusion is closer to the real value than the value after fusion based on the generalized model, achieving results that are close to the real distribution for cropland.
The proposed model considers the overall consistency difference of the estimated cropland area of all the products in each grid cell as the basis of the fusion and reduces the impact of the abnormal estimated cropland areas of individual products on the result. Therefore, the cropland distribution result of the study area, i.e., the synergy cropland product, with a high accuracy of cropland area estimation, as well as spatial positioning can be obtained quickly and efficiently, without relying on training samples.

4. Experiments and Analysis

4.1. Accuracy Measurement

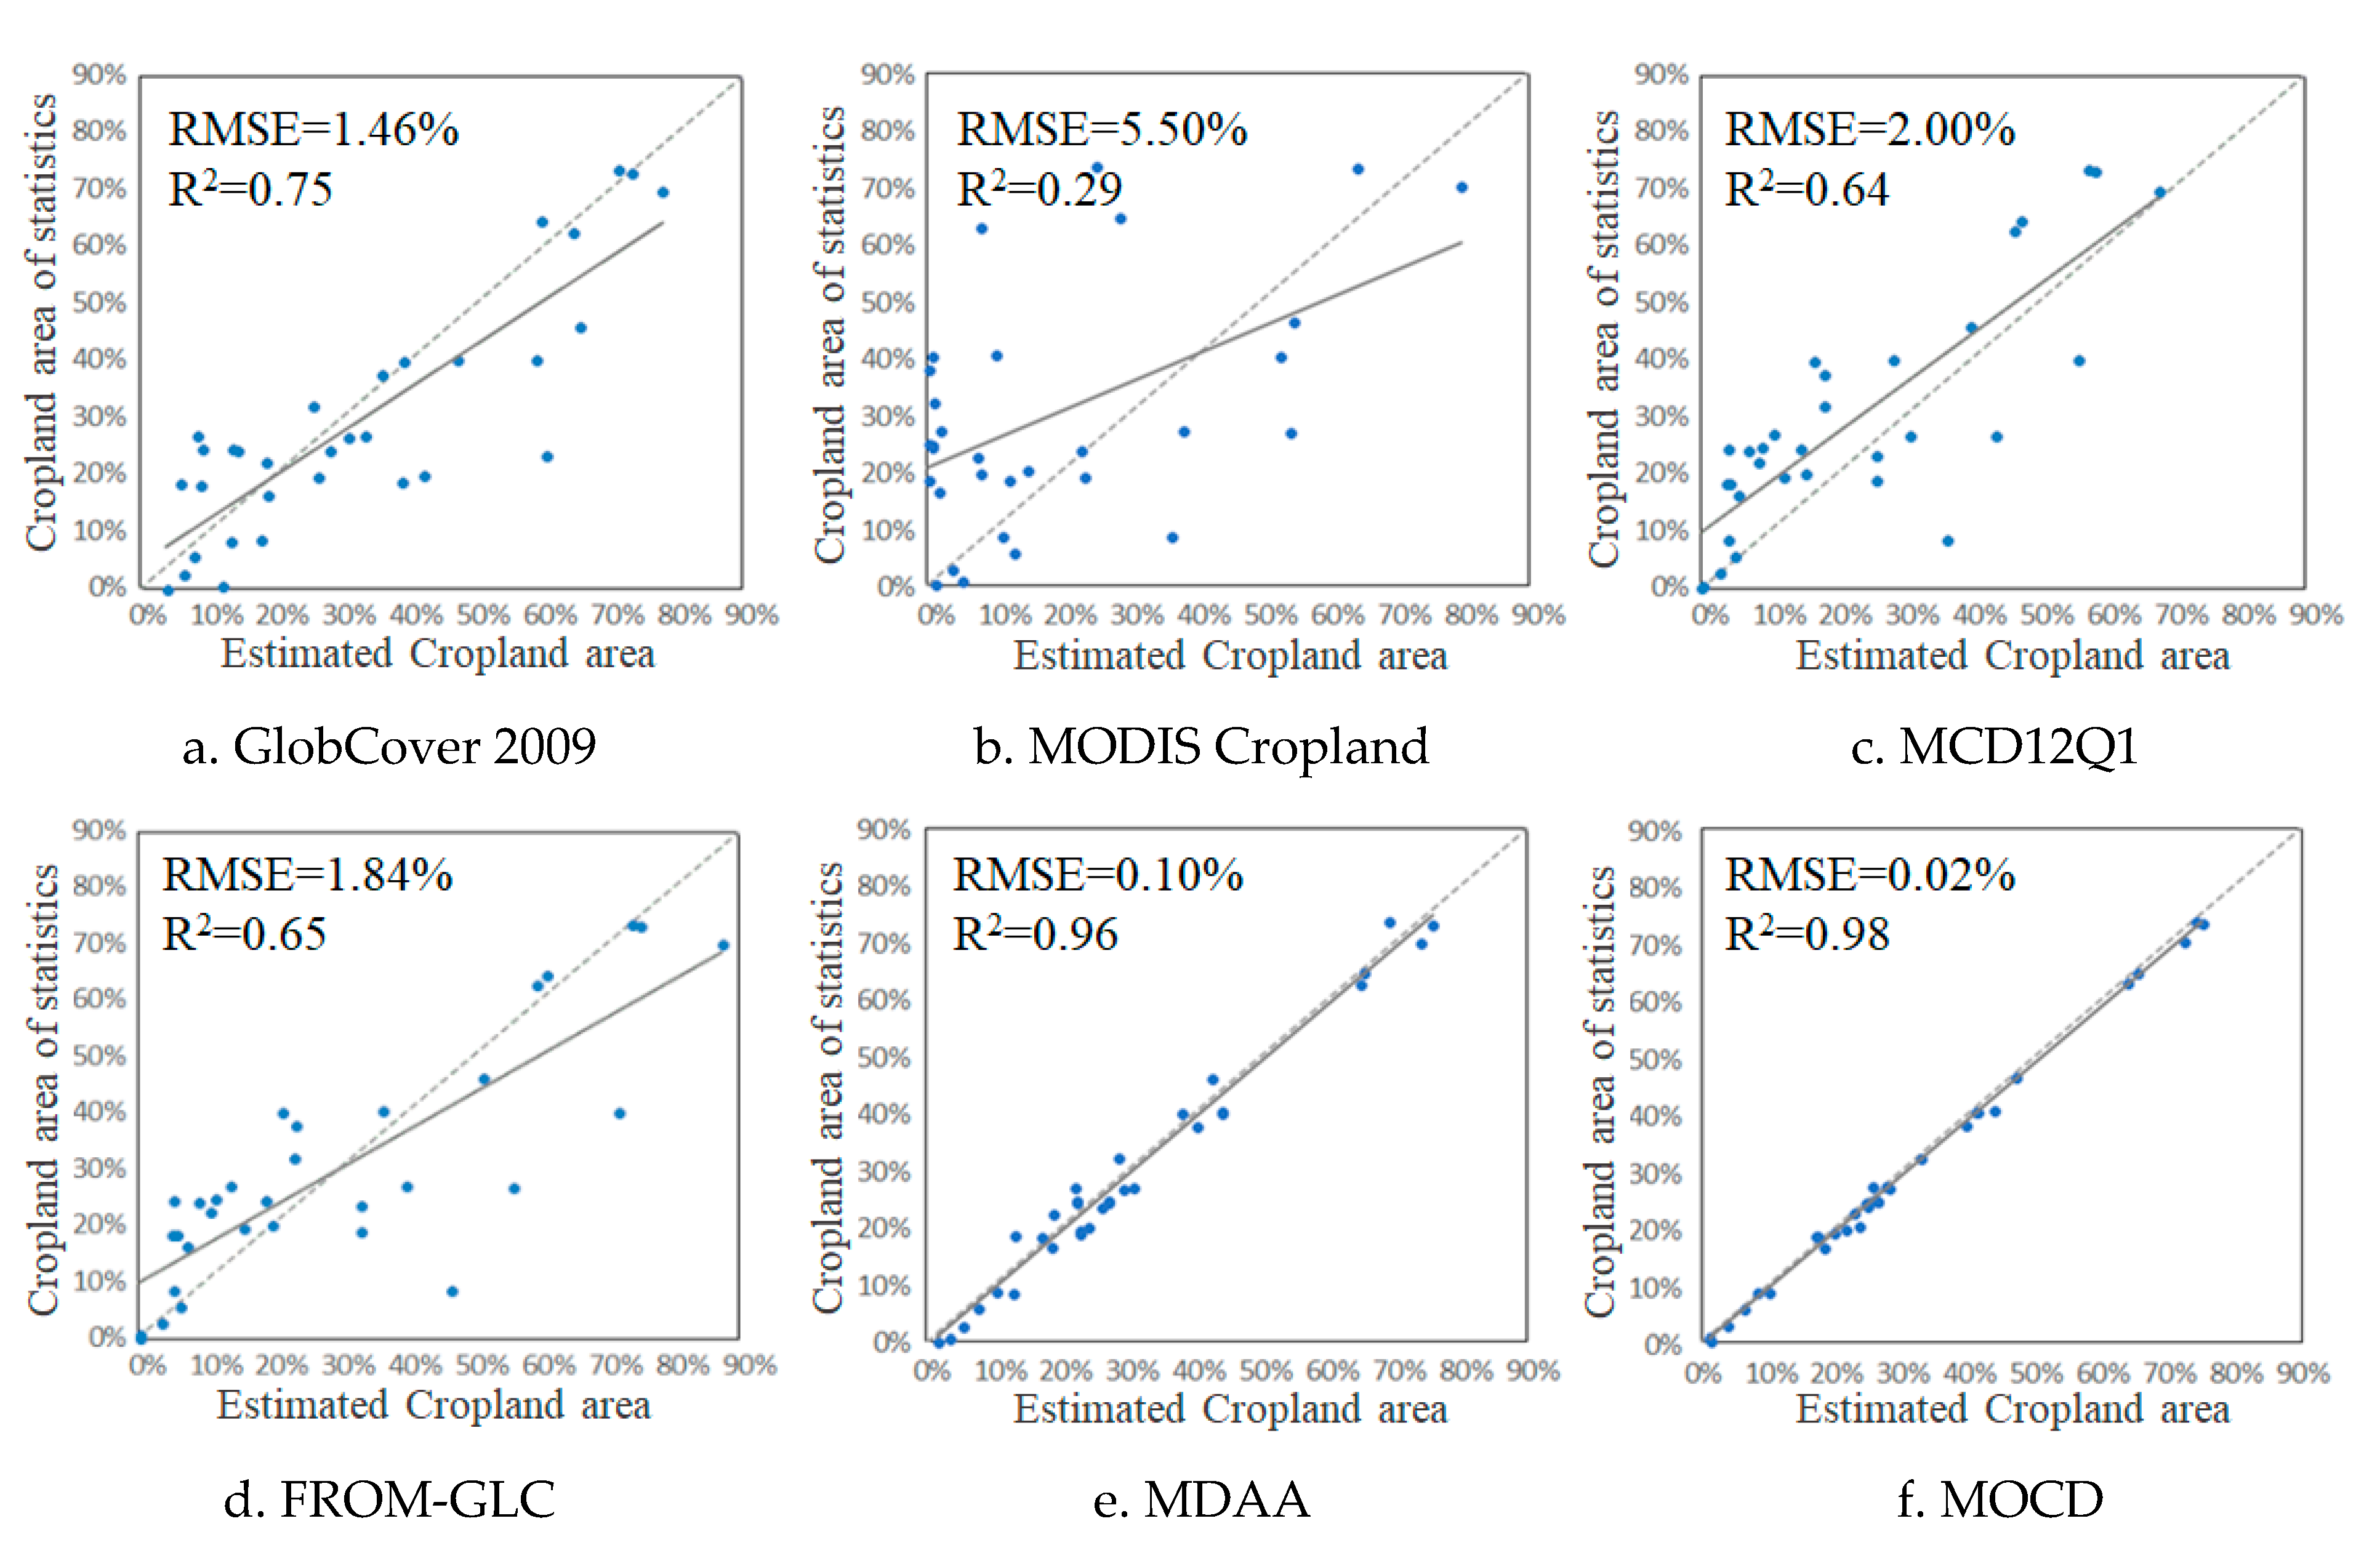
4.1.1. Accuracy of Cropland Area Estimation

The accuracy of the cropland area estimation is obtained by using the cropland statistics to test the estimated cropland area of the remote sensing cropland products.
The calculation methods of difference Δ P k α , total absolute difference A D α , total average absolute difference A A R D α , and total root-mean-square error R M S E α of the set α of cropland products in province k are as follows:
Δ P k α = P k α O k
A D α = 1 N k = 1 N ( P k α O k )
A A R D α = 1 N k = 1 N | ( P k α O k ) / O k |
R M S E α = k = 1 n ( P k α O k ) 2 n
where P k α is the proportion of cropland produced by the product set α in province k ; O k is the proportion of cropland in province k in the cropland statistics of cropland; and n is the total number of provinces, municipalities, and autonomous regions.
Finally, in order to reflect the coincidence of the estimated cropland area of each product and the cropland statistics, the correlation coefficient is calculated on the proportion of cropland area of each product and the proportion of cropland area of the statistics, as shown in Equation (11):
R α = k = 1 n ( P k α P α ¯ ) ( O k O ¯ ) k = 1 n ( P k α P α ¯ ) 2 k = 1 n ( O k O ¯ ) 2
where P α ¯ indicates the average of the proportion of cropland area in each province of the product set α , and O ¯ is the average value of the proportion of cropland area in each province in the cropland statistics. The larger the value of R α , the higher the degree of coincidence between the product set α and the cropland statistics.

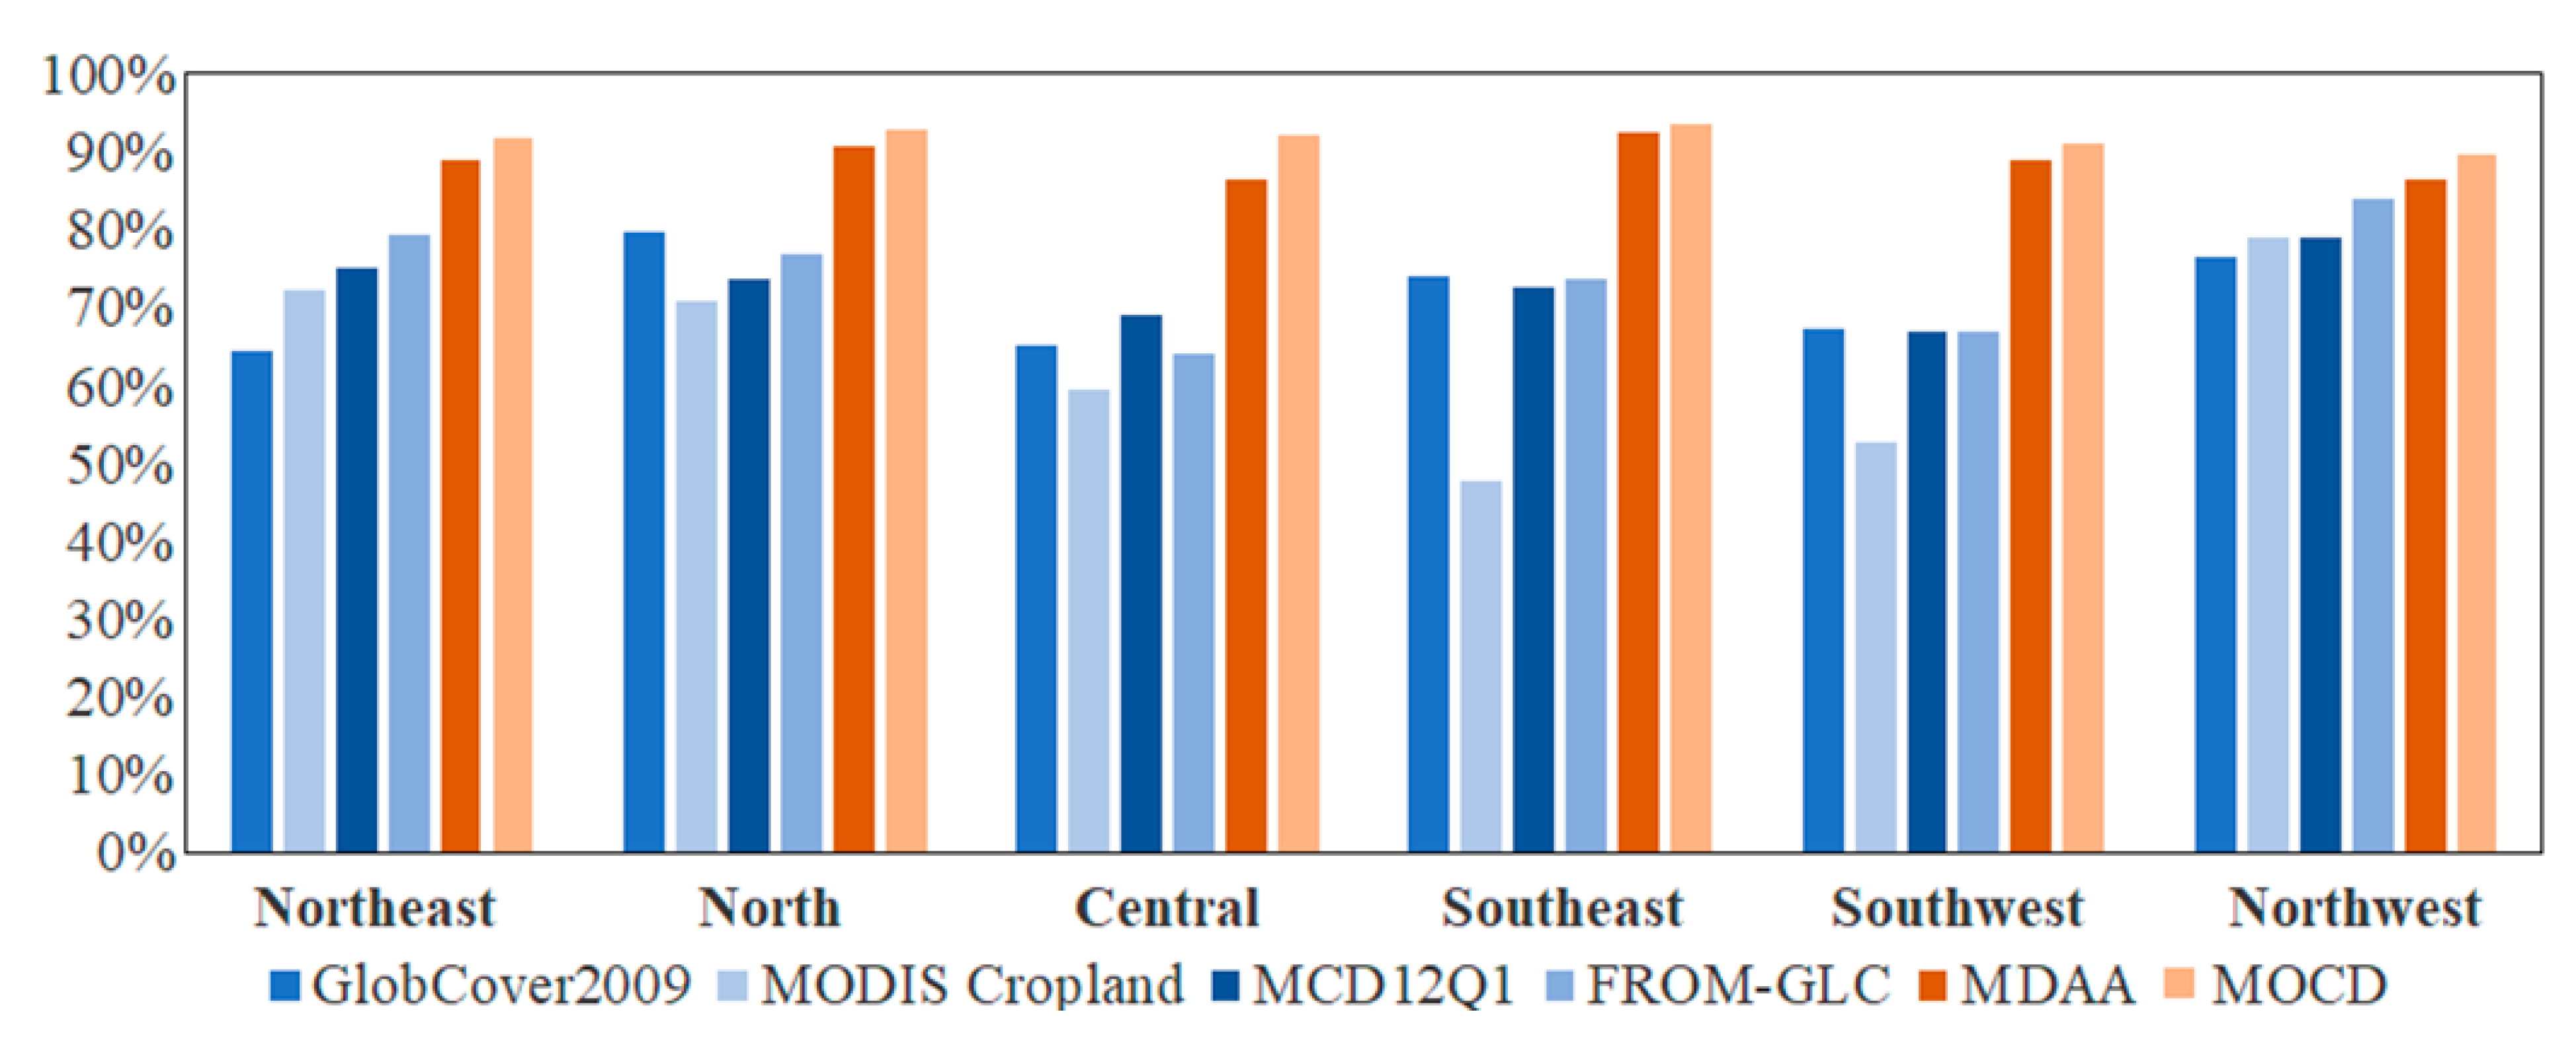
4.1.2. Accuracy of the Spatial Positioning

We use a confusion matrix to evaluate the accuracy of the spatial positioning using selected test samples. Since the categories studied are only cropland and non-cropland, the confusion matrix is as follows:
M = [ T P F P F N T N ]
where T P represents the number of cropland samples correctly predicted as cropland, F P represents the number of non-cropland samples incorrectly predicted as cropland, F N represents the number of cropland samples incorrectly predicted as non-cropland, and T N represents the number of non-cropland samples correctly predicted as non-cropland.
For the experimental results, the classification accuracy is evaluated based on the overall classification accuracy and kappa coefficient, and the error rate of cropland and the leakage rate of cropland are used as auxiliary evaluation criteria [34].
  • Overall accuracy (OA): The OA represents the ratio of correct samples to the total number of test samples N , indicating whether the product category is the same as the real ground-truth data [35]. The equation is as follows:
    O A = T P + T N N .
  • Kappa coefficient (kappa): The kappa coefficient is a discrete calculation method that is a statistic that obtains the consistency of the probability by observing the main diagonal and the total number of rows and columns in the confusion matrix [36]:
    { K a p p a = O A P c 1 P c P c = ( T P + F N ) ( T P + F P ) + ( F P + T N ) ( F N + T N ) N 2 .
In addition, the misclassification rate (MR) and leakage rate (LR) can be calculated as follows:
M R = F P T P + F P ,
L R = F N T P + F N .

4.2. Experimental Results

According to the method described in Section 2 and Section 3, the four original cropland products and the cropland statistics were used to generate the synergy cropland products. All of the above geographic analyzing and processing, as well as the display of the different maps, were supported by ESRI ArcGIS Desktop software. The result of the fusion algorithms and the process of determining the best combination level with cropland statistics are realized by MathWorks MATLAB software. The result of the synergy cropland product obtained using the model through fusion based on the direct arithmetic average method (MDAA) and the result of the synergy cropland product using the model through fusion based on the overall consistency difference (MOCD) are shown in Figure 6.
We then use the accuracy measurements described in Section 4.1 to evaluate the quality of the obtained experimental results and to compare them with the original products. As for the spatial positioning accuracy, it is still difficult to meet the quantitative requirements for the accuracy evaluation of cropland with the existing cropland validation datasets for the China region [37,38]. Therefore, we use high-resolution remote sensing images to obtain test samples for the cropland validation [39], and we use these test samples as a benchmark to compare the spatial positioning accuracy of the different products. In this experiment, the part of the test samples selected by us are based on the spatial distribution map of the consistency level of the four cropland products, and 0.001% of the grid cells are randomly sampled as samples at different consistency levels. Then, the test samples were labeled as cropland or no-cropland by visual interpretation via Google Earth high-resolution images in 2010 obtained from the Google Earth Pro software. Finally, a total of 1993 cropland test samples and 838 non-cropland test samples were obtained to evaluate the spatial positioning accuracy of the original data sets and the synergy cropland products. Their spatial distribution is shown in Figure 6.

4.2.1. Accuracy of the Cropland Area Estimation

Figure 7 shows the scatterplots of the cropland area proportion from statistics, and those estimated by the original products, the synergy cropland product through fusion based on the direct arithmetic average method (MDAA), and the synergy cropland product through fusion based on the overall consistency difference (MOCD). The dotted line in the figure indicates the 1:1 line. It can be seen that the cropland areas estimated by MDAA and MOCD are close to the cropland statistics in all the provinces, as all the points are distributed near the 1:1 line, which is far better than the four original products.
As for MDAA, the maximum area proportion difference does not exceed 5%. The overall root-mean-square error is only 0.1%, and the correlation coefficient is 0.96. This shows that the proportion of cropland area for the synergy cropland product generated by this method has a high degree of coincidence with the official statistics.
As for MOCD, the largest area proportion difference is only 3.28%, and the overall root-mean-square error is only 0.02%. The correlation coefficient is 0.98, which is even better than MDAA. This shows that the proportion of cropland area in each province for the synergy cropland product generated by this method also has a very high degree of coincidence with the official statistics.

4.2.2. Accuracy of the Spatial Positioning

For the spatial positioning accuracy, the experimental results are compared using the cropland and non-cropland test samples. The obtained accuracy indicators are shown in Table 3, and the OA of the spatial positioning in the different geographic regions for these products is shown in Figure 8.
It can be seen from Table 3 and Figure 8 that the spatial positioning accuracy evaluation indices of MDAA and MOCD are significantly improved compared with those of the original cropland products.
As for MDAA, its OA reaches 89.09%, while none of the original remote sensing products have an OA of more than 80%. The kappa coefficient reaches 0.77, indicating high consistency, while no original remote sensing product has a kappa coefficient of more than 0.6. In addition, the cropland MR and LR values are clearly smaller than those of the original products.
As for MOCD, its OA is as high as 91.99%, and is high in all geographical areas, which is better than any other cropland product. The kappa coefficient is 0.83, which means that it is almost identical to the test samples and even better than the result generated by MDAA. At the same time, both the MR and the LR are kept at relatively low values and are better than the values for any other product.

4.3. Results Analysis

It can be seen from the experimental results that the synergy cropland product generated by the model through fusion based on the overall consistency difference (MOCD) is improved in both the estimated accuracy and the spatial positioning accuracy of the cropland area when compared to the synergy cropland product generated by the model through fusion based on the direct arithmetic average method (MDAA), as well as the original products.
This is because MOCD not only considers the difference in the quality of the different cropland products to establish a fusion combination level table, which is an important reason for the higher accuracy of the synergy cropland product, but it also establishes if the cropland area in each product is consistent, based on the overall consistency difference in the proportion of the cropland area of each grid cell ( x , y ) . This weakens the influence of the cropland area proportion of some abnormal cropland products on the grid cell fusion value, so that a fusion result can be obtained first in the high fusion combination level, which is close to the actual cropland area proportion of the grid cell.
The range that should be adjusted when using cropland statistics to adaptively determine the results is adjusted accordingly, achieving a result that is closer to the true cropland area. At the same time, in this process, the complementary nature between the different products can be fully utilized to obtain a synergy cropland product that is closer to the real cropland spatial distribution. Better fusion results from the previous step provide better data for this process, giving this process more scope for adjustment by using cropland statistics to obtain a better synergy cropland product.
Through the fusion based on the overall consistency difference, and the process of determining the best combination level, MOCD can easily obtain a synergy cropland product with a higher accuracy of cropland area estimation, as well as spatial positioning, than the result generated by MDAA and the original cropland products.

5. Conclusions

The method for generating the synergy cropland product by fusing the multiple existing cropland products based on the overall consistency difference has been proposed to obtain a better-quality product, as the existing generalized methods are easily affected by the low-quality products with abnormal cropland areas. In the proposed method, we first create a fusion combination level table. The process of fusing the multiple existing products then considers the overall consistency difference of the estimated cropland area of all the products in each grid cell as the basis of the fusion. The synergy cropland product is finally generated after determining the best combination level with the cropland statistics. This method can reduce the impact of the individual abnormal products on the result. As a result, the cropland distribution result of the study area, i.e., the synergy cropland product, with a high accuracy of cropland area estimation, as well as spatial positioning, can be obtained quickly and efficiently, without relying on training samples.
Experiments were carried out to test the proposed method by using four remote sensing products: GlobCover 2009, MODIS Cropland, MCD12Q1, and FROM-GLC, along with cropland statistics. After the accuracy measurement of the results and the original products, we concluded that the synergy cropland product obtained through fusion of the multiple existing products based on the overall consistency difference (MOCD) has a higher cropland estimated area accuracy and better spatial positioning accuracy than the result obtained by the generalized model, as well as the original products.
In the future, more remote sensing products will be collected as remote sensing data sources to further improve the accuracy of the generated synergy cropland product, especially in areas of landscape heterogeneity. When the number of products is increased, the fusion algorithm based on the overall consistency difference will be even more advantageous. At the same time, the fusion combination level table will have more levels, with which it will be easier to derive a result that is closer to the cropland statistics. In the future, we will continue to explore new ways to reduce the dependence on prior knowledge such as cropland statistics and take the impact of small temporal differences on the change of cropland area into account.

Author Contributions

All the authors made significant contributions to the work. Y.Z., C.L. and X.H. designed the research and analyzed the results. L.W., X.W. and S.J. provided advice for the preparation and revision of the paper.

Acknowledgments

This work was supported by National Key Research and Development Program of China under Grant No. 2017YFB0504202, National Natural Science Foundation of China under Grant Nos. 41622107 and 41771385, Natural Science Foundation of Hubei Province in China under Grant No. 2016CFA029.

Conflicts of Interest

The authors declare no conflict of interest.

References

  1. Liu, J.; Liu, M.; Tian, H.; Zhuang, D.; Zhang, Z.; Zhang, W.; Tang, X.; Deng, X. Spatial and temporal patterns of China’s cropland during 1990–2000: An analysis based on Landsat TM data. Remote Sens. Environ. 2005, 98, 442–456. [Google Scholar] [CrossRef]
  2. Lamb, D.W.; Brown, R.B. Pa—Precision agriculture: Remote-sensing and mapping of weeds in crops. J. Agric. Eng. Res. 2002, 78, 117–125. [Google Scholar] [CrossRef]
  3. Loveland, T.R.; Reed, B.C.; Brown, J.F.; Ohlen, D.O.; Zhu, Z.; Yang, L. Development of a global land cover characteristics database and IGBP discover from 1 km AVHRR data. Int. J. Remote Sens. 2000, 21, 1303–1330. [Google Scholar] [CrossRef]
  4. Hansen, M.; Defries, R.; Townshend, J.R.; Sohlberg, R. UMD Global Land Cover Classification, 1 kilometer, 1.0; Department of Geography, University of Maryland: College Park, MD, USA, 1998. [Google Scholar]
  5. Bartholome, E.; Belward, A.S. GLC2000: A new approach to global land cover mapping from Earth observation data. Int. J. Remote Sens. 2005, 26, 1959–1977. [Google Scholar] [CrossRef]
  6. Friedl, M.A.; Sulla-Menashe, D.; Tan, B.; Schneider, A.; Ramankutty, N.; Sibley, A.; Huang, X. MODIS Collection 5 global land cover: Algorithm refinements and characterization of new datasets. Remote Sens. Environ. 2010, 114, 168–182. [Google Scholar] [CrossRef]
  7. Pittman, K.; Hansen, M.C.; Becker-Reshef, I.; Potapov, P.V.; Justice, C.O. Estimating global cropland extent with multi-year MODIS data. Remote Sens. 2010, 2, 1844–1863. [Google Scholar] [CrossRef]
  8. Bontemps, S.; Defourny, P.; Bogaert, E.V.; Arino, O.; Kalogirou, V.; Perez, J.R. “GLOBCOVER 2009-Products description and validation report. Foro Mundial De La Salud 2010, 17, 285–287. [Google Scholar]
  9. Chen, J.; Chen, J.; Liao, A.; Cao, X.; Chen, L.; Chen, X.; Peng, S.; Han, G.; Zhang, H.; He, C.; et al. Concepts and Key Techniques for 30m Global Land Cover Mapping. Acta Geodaetica Cartogr. Sin. 2014, 43, 551–557. [Google Scholar]
  10. Brovelli, M.A.; Molinari, M.E.; Hussein, E.; Chen, J.; Li, R. The first comprehensive accuracy assessment of GlobeLand30 at a national level: Methodology and results. Remote Sens. 2015, 7, 4191–4212. [Google Scholar] [CrossRef]
  11. Yu, L.; Wang, J.; Gong, P. Improving 30 meter global land cover map FROM-GLC with time series MODIS and auxiliary datasets: A segmentation based approach. Int. J. Remote Sens. 2013, 34, 5851–5867. [Google Scholar] [CrossRef]
  12. Chen, D.; Wu, W.; Lu, M.; Hu, Q.; Zhou, Q. Progresses in Land Cover Data Reconstruction Method Based on Multi-Source Data Fusion. Chin. J. Agric. Resour. Reg. Plan. 2016, 37, 62–70. [Google Scholar]
  13. Lu, M.; Wu, W.; Zhang, L.; Liao, A.; Peng, S.; Tang, H. A comparative analysis of five global cropland datasets in china. Sci. China Earth Sci. 2016, 59, 2307–2317. [Google Scholar] [CrossRef]
  14. Dendoncker, N.; Rounsevell, M.; Bogaert, P. Spatial analysis and modelling of land use distributions in Belgium. Computers. Environ. Urban Syst. 2007, 31, 188–205. [Google Scholar] [CrossRef]
  15. Song, X.P.; Huang, C.; Feng, M.; Sexton, J.O.; Channan, S.; Townshend, J.R. Integrating global land cover products for improved forest cover characterization: An application in North America. Int. J. Digit. Earth 2014, 7, 709–724. [Google Scholar] [CrossRef]
  16. See, L.; Schepaschenko, D.; Lesiv, M.; McCallum, I.; Fritz, S.; Comber, A.; Perger, C.; Schill, C.; Zhao, Y.; Maus, V.; et al. Building a hybrid land cover map with crowdsourcing and geographically weighted regression. ISPRS J. Photogramm. Remote Sens. 2015, 103, 48–56. [Google Scholar] [CrossRef] [Green Version]
  17. Schepaschenko, D.; See, L.; Lesiv, M.; McCallum, I.; Fritz, S.; Salk, C.; Moltchanova, E.; Perger, C.; Shchepashchenko, M.; Shvidenko, A.; et al. Development of a global hybrid forest mask through the synergy of remote sensing, crowdsourcing and FAO statistics. Remote Sens. Environ. 2015, 162, 208–220. [Google Scholar] [CrossRef]
  18. Ran, Y.; Li, X.; Lu, L. China Land Cover Classification at 1 km Spatial Resolution Based on a Multi-source Data Fusion Approach. Adv. Earth Sci. 2009, 24, 192–203. [Google Scholar]
  19. Chen, D.; Lu, M.; Zhou, Q.; Xiao, J.; Ru, Y.; Wei, Y.; Wu, W. Comparison of Two Synergy Approaches for Hybrid Cropland Mapping. Remote Sens. 2019, 11, 213. [Google Scholar] [CrossRef]
  20. Pérez-Hoyos, A.; García-Haro, F.J.; San-Miguel-Ayanz, J. A methodology to generate a synergetic land-cover map by fusion of different land-cover products. Int. J. Appl. Earth Obs. Geoinf. 2012, 19, 72–87. [Google Scholar] [CrossRef]
  21. Gengler, S.; Bogaert, P. Combining land cover products using a minimum divergence and a Bayesian data fusion approach. Int. J. Geogr. Inf. Sci. 2018, 32, 806–826. [Google Scholar] [CrossRef]
  22. Xu, G.; Zhang, H.; Chen, B.; Zhang, H.; Yan, J.; Chen, J.; Che, M.; Lin, X.; Dou, X. A Bayesian based method to generate a synergetic land-cover map from existing land-cover products. Remote Sens. 2014, 6, 5589–5613. [Google Scholar] [CrossRef]
  23. Waldner, F.; Fritz, S.; di Gregorio, A.; Defourny, P. Mapping priorities to focus cropland mapping activities: Fitness assessment of existing global, regional and national cropland maps. Remote Sens. 2015, 7, 7959–7986. [Google Scholar] [CrossRef]
  24. Jung, M.; Henkel, K.; Herold, M.; Churkina, G. Exploiting synergies of global land cover products for carbon cycle modeling. Remote Sens. Environ. 2006, 101, 534–553. [Google Scholar] [CrossRef]
  25. Ramankutty, N.; Evan, A.T.; Monfreda, C.; Foley, J.A. Farming the planet: 1. Geographic distribution of global agricultural lands in the year 2000. Glob. Biogeochem. Cycles 2008, 22, 1–19. [Google Scholar] [CrossRef]
  26. Zhang, N.; Tateishi, R. Integrated use of existing global land cover datasets for producing a new global land cover dataset with a higher accuracy: A case study in Eurasia. Adv. Remote Sens. 2013, 2, 365–372. [Google Scholar] [CrossRef]
  27. Schepaschenko, D.; McCallum, I.; Shvidenko, A.; Fritz, S.; Kraxner, F.; Obersteiner, M. A new hybrid land cover dataset for Russia: A methodology for integrating statistics, remote sensing and in situ information. J. Land Use Sci. 2011, 6, 245–259. [Google Scholar] [CrossRef]
  28. Fritz, S.; You, L.; Bun, A.; See, L.; McCallum, I.; Schill, C.; Perger, C.; Liu, J.; Hansen, M.; Obersteiner, M. Cropland for sub-Saharan Africa: A synergistic approach using five land cover data sets. Geophys. Res. Lett. 2011, 38, 155–170. [Google Scholar] [CrossRef]
  29. Lu, M.; Wu, W.; You, L.; Chen, D.; Zhang, L.; Yang, P.; Tang, H. A Synergy Cropland of China by Fusing Multiple Existing Maps and Statistics. Sensors 2017, 17, 1613. [Google Scholar] [CrossRef] [PubMed]
  30. Rui, Y.; Huang, T.S.; Ortega, M.; Mehrotra, S. Relevance feedback: A power tool for interactive content-based image retrieval. IEEE Trans. Circuits Syst. Video Technol. 1998, 8, 644–655. [Google Scholar]
  31. Doulamis, N.; Doulamis, A. Evaluation of relevance feedback schemes in content-based in retrieval systems. Signal Process. Image Commun. 2006, 21, 334–357. [Google Scholar] [CrossRef]
  32. Liu, Z.; Cheng, Y.; Pan, Q.; Miao, Z. Weight Evidence Combination for Multi-Sensor Conflict Information. Chin. J. Sens. Actuators 2009, 22, 15. [Google Scholar]
  33. Cao, Z. Eigenvalue Problem of Matrix; Science and Technology Publishing House: Beijing, China, 1980. [Google Scholar]
  34. Bo, Y.; Wang, J. Study on Uncertainty of Remote Sensing Information: Classification and Scale Effect Model; Geological Publishing House: Beijing, China, 2003. [Google Scholar]
  35. Congalton, R.G. A review of assessing the accuracy of classifications of remotely sensed data. Remote Sens. Environ. 1991, 37, 35–46. [Google Scholar] [CrossRef]
  36. Viera, A.J.; Garrett, J.M. Understanding interobserver agreement: The kappa statistic. Fam. Med. 2005, 37, 360–363. [Google Scholar]
  37. Gong, P.; Wang, J.; Yu, L.; Zhao, Y.; Zhao, Y.; Liang, L.; Niu, Z.; Huang, X.; Fu, H.; Liu, S.; et al. Finer resolution observation and monitoring of global land cover: First mapping results with Landsat TM and ETM+ data. Int. J. Remote Sens. 2013, 34, 2607–2654. [Google Scholar] [CrossRef]
  38. Fritz, S.; McCallum, I.; Schill, C.; Perger, C.; See, L.; Schepaschenko, D.; Velde, M.; Kraxner, F.; Obersteiner, M. Geo-Wiki: An online platform for improving global land cover. Environ. Model. Softw. 2012, 31, 110–123. [Google Scholar]
  39. Bayas, J.C.L.; See, L.; Perger, C.; Justice, C.; Nakalembe, C.; Dempewolf, J.; Fritz, S. Validation of Automatically Generated Global and Regional Cropland Data Sets: The Case of Tanzania. Remote Sens. 2017, 9, 815. [Google Scholar] [CrossRef]
Figure 1. The remote sensing cropland products within China used in the study (a) GlobCover 2009; (b) MODIS Cropland; (c) MCD12Q1; (d) FROM-GLC.
Remotesensing 11 01065 g001
Figure 2. Flowchart of the proposed model.
Remotesensing 11 01065 g002
Figure 3. Spatial distribution of the consistency level.
Remotesensing 11 01065 g003
Figure 4. Fusion results with different combination levels.
Remotesensing 11 01065 g004
Figure 5. Using cropland statistics to obtain the optimal combination level.
Remotesensing 11 01065 g005
Figure 6. (a) The synergy cropland product generated by the model through fusion based on the direct arithmetic average method (MDAA). (b) The synergy cropland product generated by the model through fusion based on the overall consistency difference (MOCD). (c) Spatial distribution of the test samples. (d) Local zoomed maps of (a) and (b).
Remotesensing 11 01065 g006
Figure 7. Scatterplots of the cropland area from statistics and those estimated by (a) GlobCover 2009; (b) MODIS Cropland; (c) MCD12Q1; (d) FROM-GLC; (e) the synergy cropland product generated by MDAA; and (f) the synergy cropland product generated by MOCD.
Remotesensing 11 01065 g007
Figure 8. Overall accuracy of the spatial positioning in different geo-regions for the cropland products.
Remotesensing 11 01065 g008
Table 1. The remote sensing cropland products used in the study.
ProductGlobCover 2009MODIS CroplandMCD12Q1FROM-GLC
Time2009201020102010
ReferenceESA & UCLUSDABoston UniversityTsinghua University
SatelliteMERISMODISMODISLandsat
Spatial resolution300 m250 m500 m30 m
Table 2. Fusion combination level table.
Consistency LevelCombination LevelGlobCover
2009
MODIS
Cropland
MOD12Q1FROM-GLC
I11111
II21110
31101
41011
50111
III61100
71010
81001
90110
100101
110011
IV121000
130100
140010
150001
Table 3. Accuracy indices of the original and synergy cropland products.
GlobCover 2009MODIS CroplandMCD12Q1FROM-GLCMDAAMOCD
OA76.23%67.99%73.49%79.61%89.09%91.99%
Kappa0.520.380.470.580.770.83
MR21.66%13.68%20.79%19.70%11.09%8.97%
LR21.11%49.86%29.31%21.33%6.49%3.86%

