Letter

Impact of Cyclonic Ocean Eddies on Upper Ocean Thermodynamic Response to Typhoon Soudelor

1
College of Oceanography, Hohai University, Nanjing 210098, China
2
State Key Laboratory of Satellite Ocean Environment Dynamics, Second Institute of Oceanography, Ministry of Natural Resources, Hangzhou 310012, China
3
32021 Army, PLA, Beijing 100094, China
*
Author to whom correspondence should be addressed.
Remote Sens. 2019, 11(8), 938; https://doi.org/10.3390/rs11080938
Submission received: 11 March 2019 / Revised: 11 April 2019 / Accepted: 15 April 2019 / Published: 18 April 2019

Abstract

:
By using multiplatform satellite datasets, Argo observations and numerical model data, the upper ocean thermodynamic responses to Super Typhoon Soudelor are investigated with a focus on the impact of an ocean cyclonic eddy (CE). In addition to the significant surface cooling inside the CE region, an abnormally large rising in subsurface temperature is observed. The maximum warming and heat content change (HCC) reach up to 4.37 °C and 1.73 GJ/m2, respectively. Moreover, the HCC is an order of magnitude larger than that calculated from statistical analysis of Argo profile data in the previous study which only considered the effects caused by typhoons. Meanwhile, the subsurface warming outside the CE is merely 1.74 °C with HCC of 0.39 GJ/m2. Previous studies suggested that typhoon-induced vertical mixing is the primary factor causing subsurface warming but these studies ignored an important mechanism related to the horizontal advection caused by the rotation and movement of mesoscale eddies. This study documents that the eddy-induced horizontal advection has a great impact on the upper ocean responses to typhoons. Therefore, the influence of eddies should be considered when studying the responses of upper ocean to typhoons with pre-existing mesoscale eddies.

Graphical Abstract

1. Introduction

Tropical cyclones, also known as typhoons (with maximum sustained 10 m wind speed greater than 32.7 m/s) in the Northwest Pacific, are an important part of the air-sea system. When typhoons pass over the ocean, the air-sea interaction leads to the exchange of heat, moisture and momentum and causes a dramatic response of the ocean. With the improvement of the resolution of the satellite data and the accuracy of numerical simulations, researchers have carried out a lot of work on the upper ocean responses during the typhoon transits [1,2,3,4,5,6,7,8,9,10,11,12]. The upper ocean responses caused by typhoons have attracted much attention and gradually become a hotspot in the field of atmosphere and oceanography [13,14,15].
The strong wind brought by typhoons causes a strong effect of entrainment, which generally decreases the sea surface temperature (SST) and increases the subsurface temperature. SST plays a major role in the energy exchange between typhoons and ocean. Therefore, it is necessary to study the SST response to typhoons [1,16]. In the Northern Hemisphere, sea surface cooling is usually stronger on the right side of the typhoon track (left side in the Southern Hemisphere), with SST decreasing ranging from 1 °C to 9 °C [1,2,10], sometimes even reaching 11 °C in the marginal seas [17]. In addition, typhoon-induced entrainment makes surface warm water sink into subsurface, leading to an increase of subsurface temperature [1,2,18]. After typhoons, the SST gradually recovers but the thermal anomaly of subsurface warming is retained. This is the so-called “heat pump” effect [19]. The “heat pump” effect directly affects global heat transfer and has a great impact on regulating the ocean circulation and climate system [19,20,21,22].
However, due to the bad weather conditions during typhoons, it is difficult to obtain in situ observations to better study the response of subsurface waters. Some previous studies relied mostly on satellite datasets with focusing on the sea surface response, others have demonstrated that subsurface warming is mainly due to the effect of local entrainment by using limited measurements and numerical simulations [9,23,24]. However, the mechanism of subsurface temperature change is more complicated than expected. The Argo program, which collects the in situ temperature and salinity profiles in the upper ocean, provides opportunities to better understand the subsurface response to typhoons [25,26,27,28]. It appears that some important physical processes under complicated ocean backgrounds, such as the pre-existing mesoscale eddies and initial mixed layer depth, which could influence the temperature change during the passages of typhoons, might be ignored [28,29].
The ocean mesoscale eddies, which are ubiquitous in the global ocean, can modulate the interaction process between typhoon and ocean [6,7,8,30,31,32]. Several studies have shown that the region showing particularly pronounced sea surface cooling and phytoplankton blooms usually coincides with the location of the cyclonic eddy (CE) [4,33]. Mesoscale CEs are generally surrounded with concave upward sea surface height. They are able to make global-scale transports of heat, salt, as well as other water properties (e.g., nutrients and phytoplankton) inside the eddies through their movements [34,35,36], if the ratio of rotational speed U of a CE to its propagation speed c (i.e., U / c ) is larger than 1.
However, it still remains unclear what roles the ocean mesoscale eddies play in the typhoon-eddy interaction. Besides, little attention has been paid to investigating how the response of subsurface ocean is sensitive to the pre-existing ocean eddies. Therefore, this study attempts to further examine the impacts of the pre-existing eddy on typhoon-induced upper ocean response, by using a combination of multi-platform satellite observations, Argo measurements and numerical model outputs. The remainder of this paper is organized as follows: In Section 2, the data and methods used in this study are described briefly; details of the upper ocean responses to Typhoon Soudelor are examined in Section 3; the mechanism related to eddy movement is presented in Section 4; Section 5 discusses about the role of eddy playing in the ocean responses; and finally, the conclusions are given in Section 6.

2. Data and Methods

2.1. Data

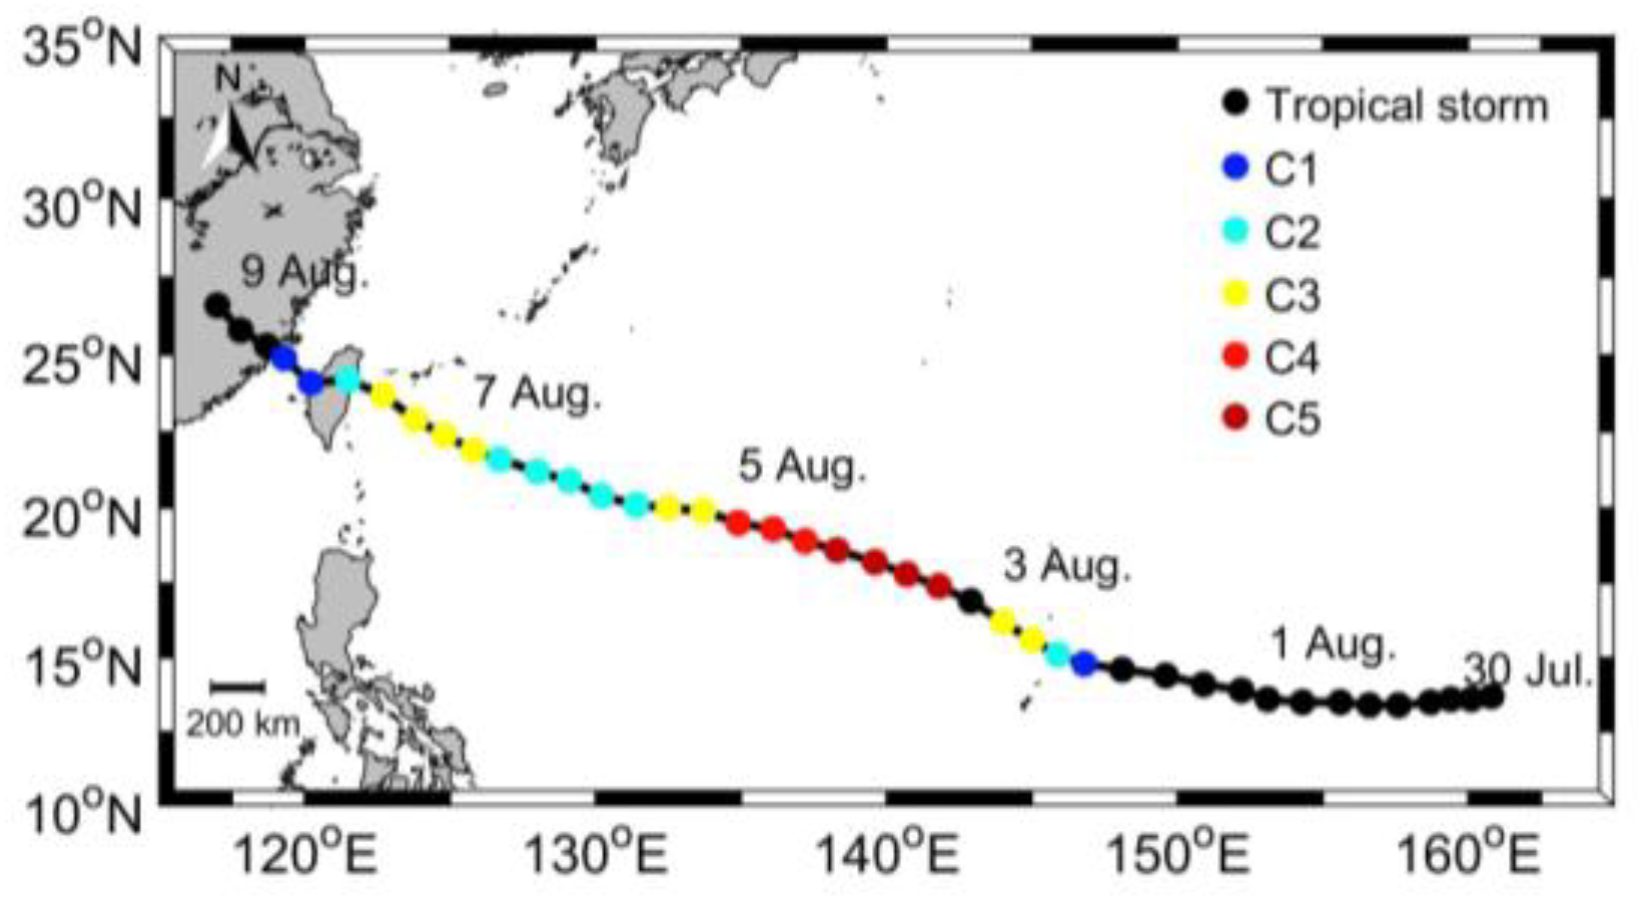
2.1.1. Typhoon Track and Intensity

Super Typhoon Soudelor is the strongest tropical cyclone of the 2015 Pacific typhoon season. Its information is obtained from the best track dataset of the Joint Typhoon Warning Center (JTWC, http://www.usno.navy.mil/NOOC/nmfc-ph/RSS/jtwc/best_tracks). The dataset includes typhoon center positions, maximum sustained winds in knot every 6-h and time (UTC). This dataset is suggested to be more dynamically consistent than some other datasets [37]. As shown in Figure 1, Typhoon Soudelor was formed on July 30 and quickly intensified from 2 August to 6 August. It reached peak intensity as a Category 5 typhoon (on the Saffir–Simpson scale) with a maximum sustained wind speed of 155 knot/h at 1800 UTC on August 3.

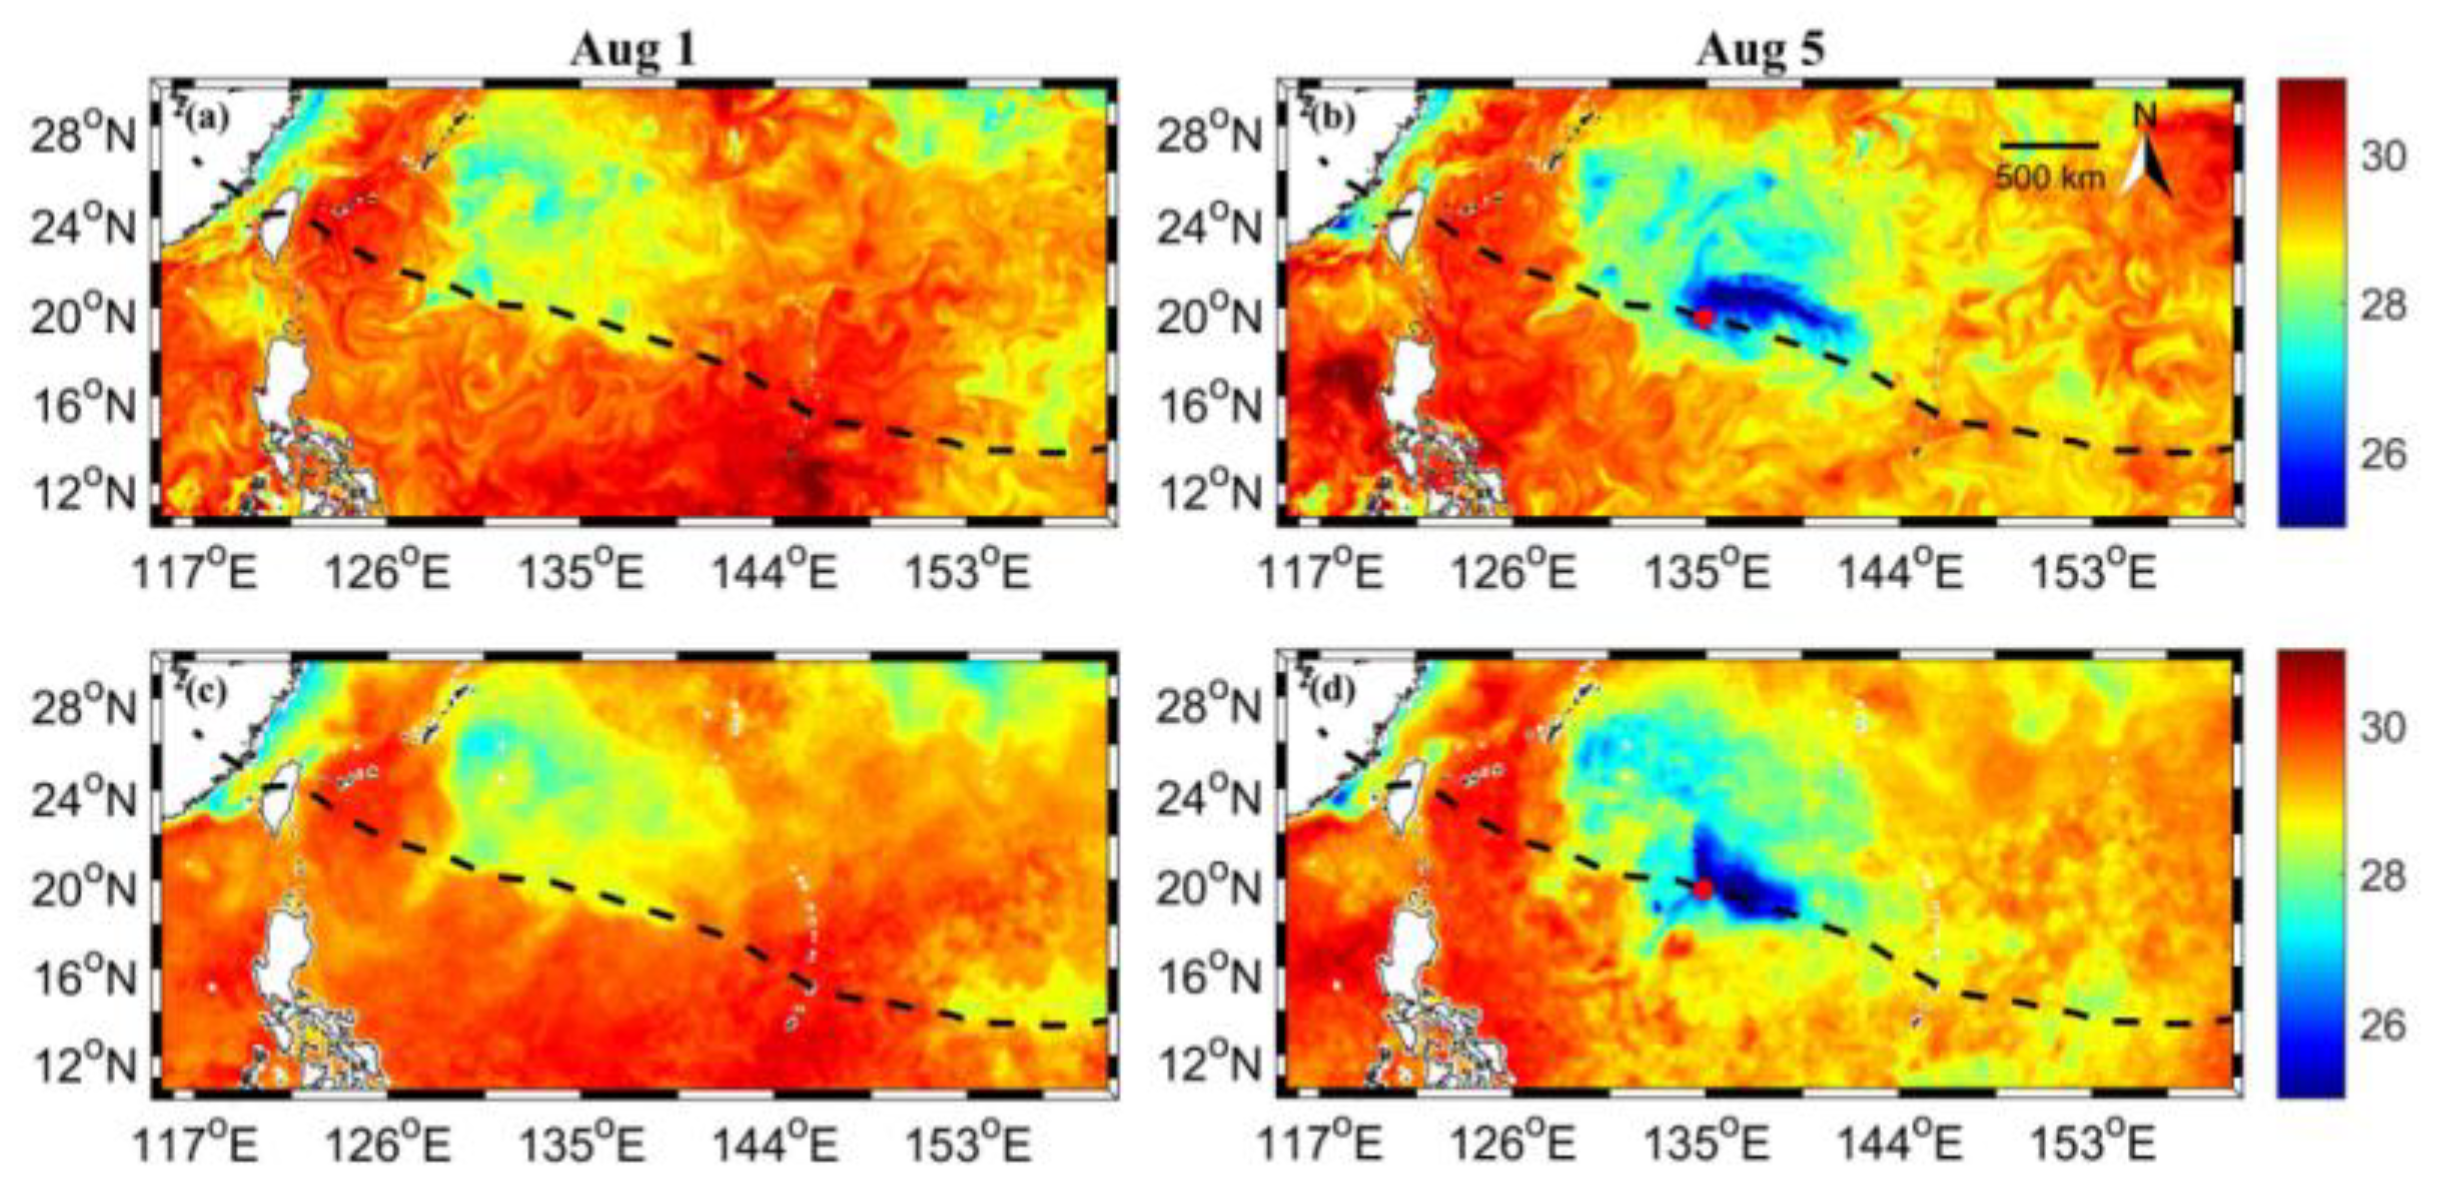
2.1.2. Satellite Observation of Sea Surface Temperature

Microwave and Infrared OI SST (MW-IROISST) is used in this work to study surface response of the ocean to Typhoon Soudelor. This dataset is a merged, daily SST product with 9 km × 9 km spatial resolution, provided by Remote Sensing Systems and sponsored by National Oceanographic Partnership Program (NOPP) and the NASA Earth Science Physical Oceanography Program (http://www.remss.com/). It combines the through-cloud capabilities of the microwave (MW) OI SST product [38] with the high spatial resolution of the infrared (IR) SST by using Optimum Interpolation (OI) method [39].

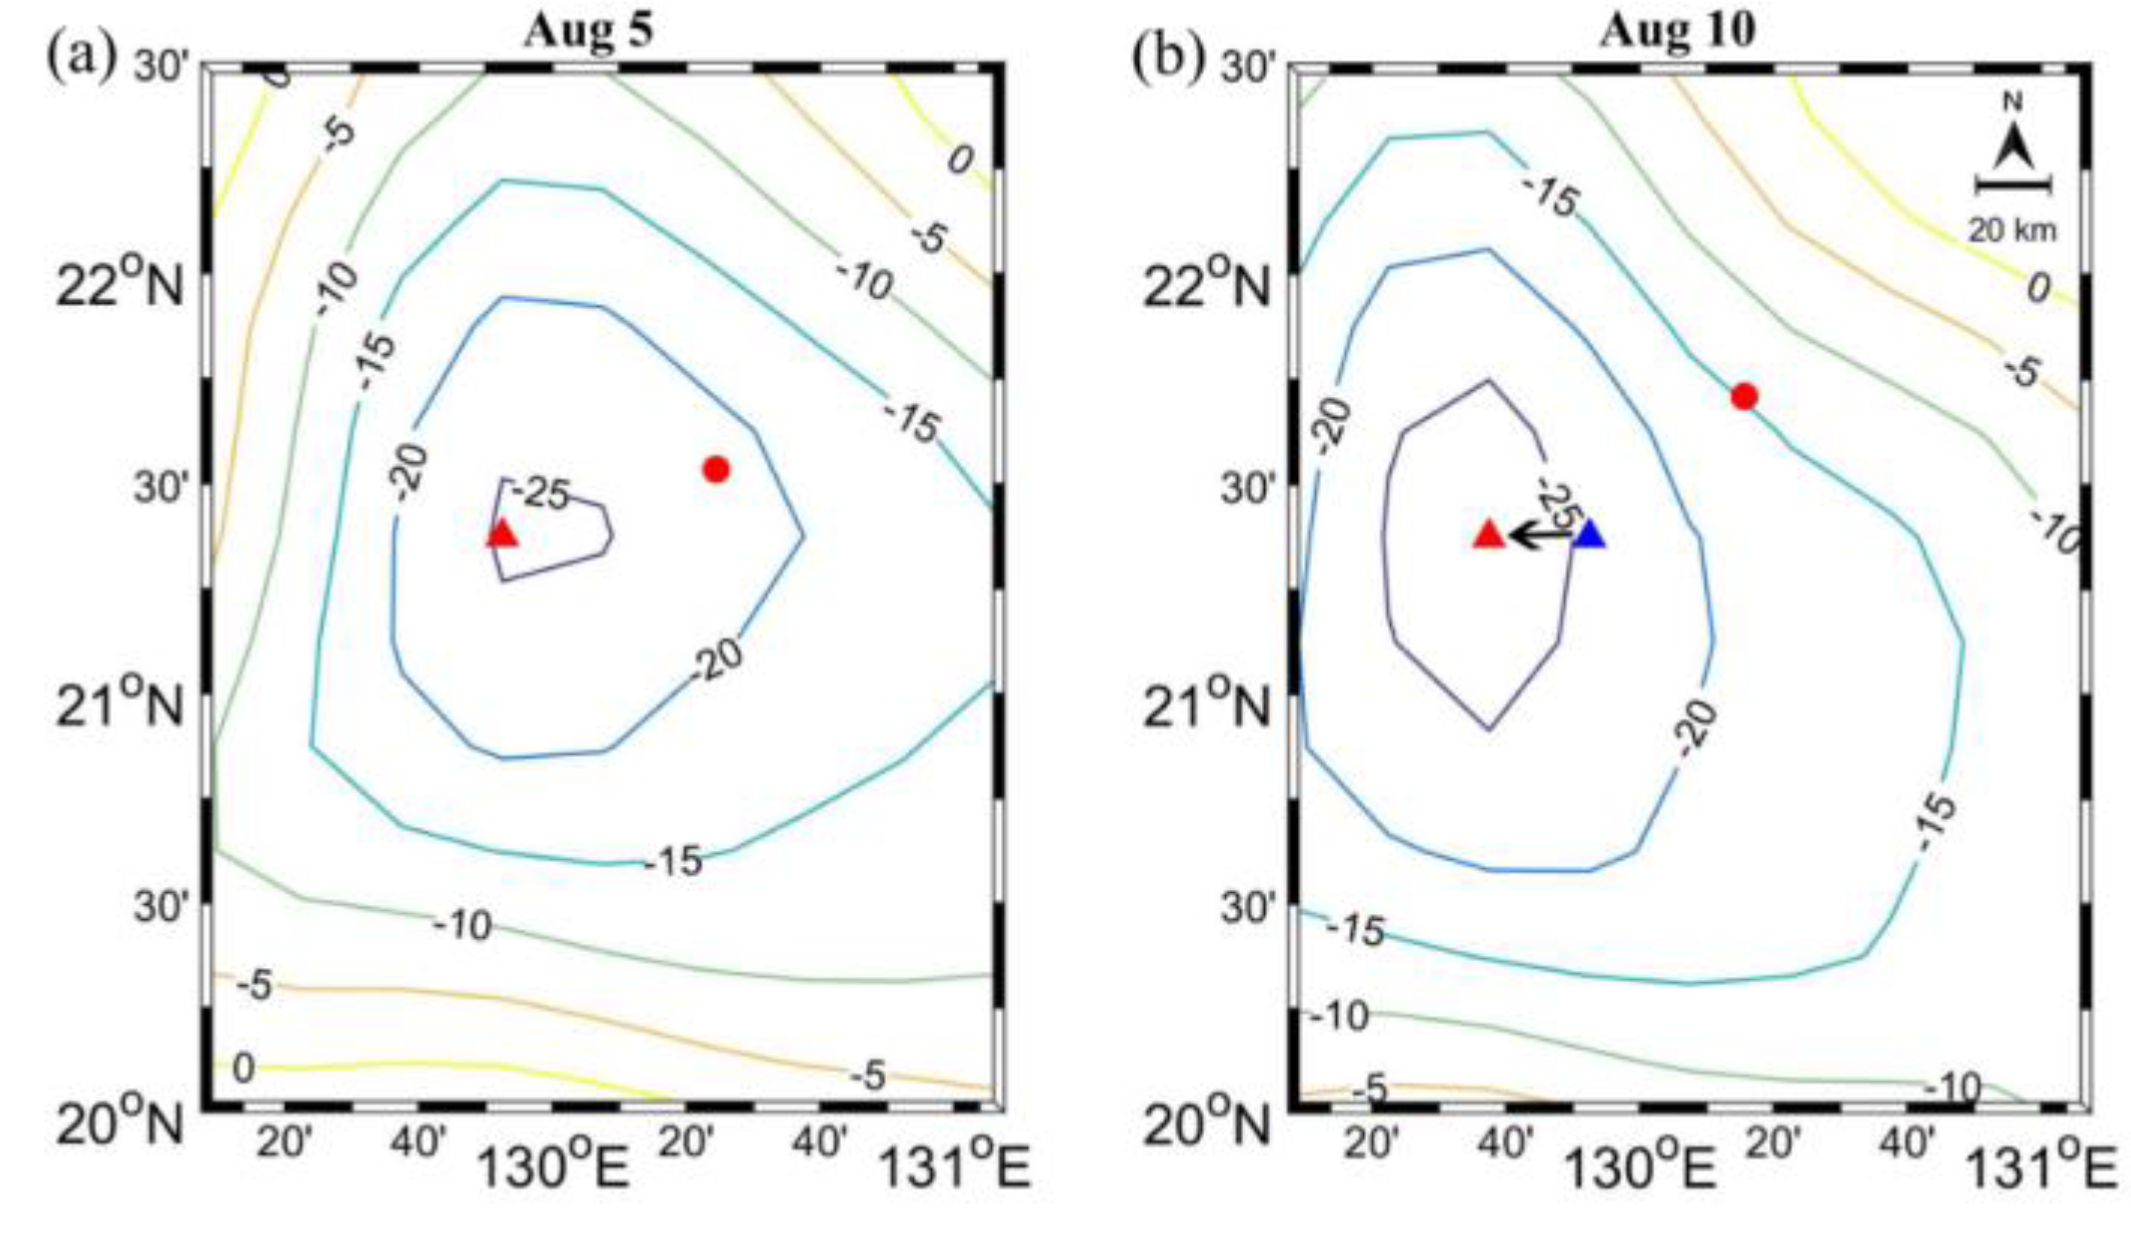
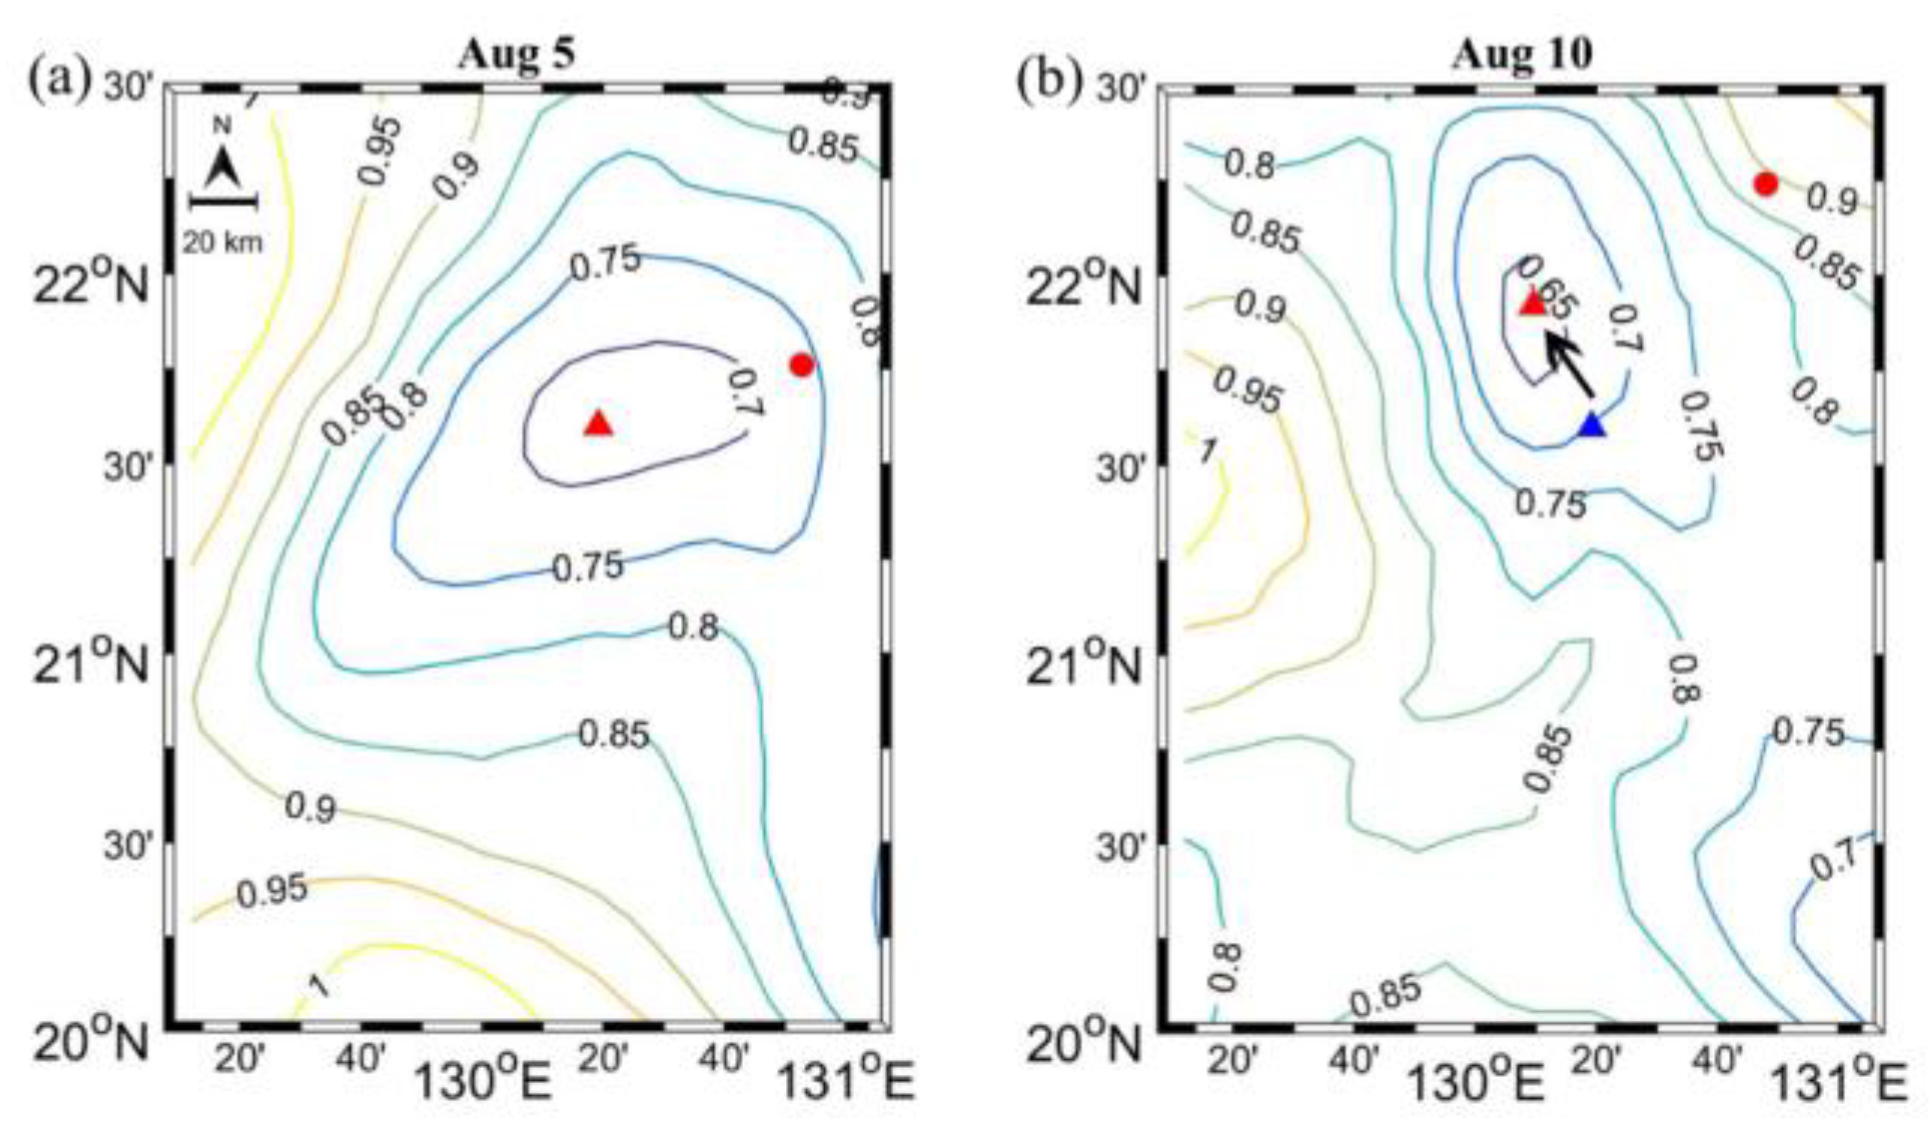
2.1.3. Satellite-Derived Sea Surface Height Anomaly and Surface Current

The daily altimeter-derived sea surface height anomaly (SSHA) and sea surface current datasets with 0.25° × 0.25° spatial resolution are provided by Archiving, Validation and Interpretation of Satellite Data in Oceanography (AVISO). The altimeter products were produced and distributed by the Copernicus Marine and Environment Monitoring Service (CMEMS, http://marine.Coperni cus.eu/). The SSHA dataset is used to identify the mesoscale eddies. Negative values of SSHA are normally corresponding to cyclonic eddies (CEs). In order to calculate the U / c of an eddy, the rotational speed U , which is characterized by the maximum of the average geostrophic speeds within the eddy interior, is determined from the sea surface current dataset.

2.1.4. Argo Observations

The Argo program, deployed in the end of last century, provided a global network of in-situ upper ocean observations by collecting temperature and salinity profiles. In this study, the upper ocean temperature measured by Argo floats are taken from the China Argo Real-time Data Centre (http://www.argo.org.cn/) [40]. We extract the Argo profiles before and after the passage of Typhoon Soudelor.

2.1.5. Numerical Model Data

Daily numerical model outputs, including sea surface height (SSH), three-dimensional ocean currents and temperature are used in this study to explore the possible mechanism of subsurface abnormal warming. We use the dataset with a spatial resolution of 0.08° × 0.08° from the global HYbrid Coordinate Ocean Model (HYCOM) + Navy Coupled Ocean Data Assimilation (NCODA) based ocean prediction system (hereafter called HYCOM, https://www.hycom.org/) [41], which provides access to near real time model outputs. The HYCOM model is driven by the Navy Global Environmental Model version 1.2 wind and heat flux datasets and assimilates available satellite altimeter observations, satellite and in-situ SST, as well as available in-situ XBTs, Argo and moored buoys data [42].

2.2. Methods

2.2.1. Eddy Center Detection

To study the impact of mesoscale eddies on the upper ocean response to Typhoon Soudelor, we need to identify the center of an eddy at different times. Here we take the Okubo-Weiss (OW) criterion. Based on the OW method, the first step is to search for the local minimum of SSHA as a possible eddy center and then determine whether it is real by calculating the OW parameter W [43,44],
W = 4 ( u x 2 + v x u y )
where u and v are the velocities of zonal and meridional surface currents, respectively.
If the center is surrounded by a closed contour of W = 2 × 10 12 s 2 , it is confirmed that the location is a real center of the eddy [45,46]. Based on the locations of the eddy centers from 5 to 10 August, we can estimate the eddy propagation speed c .

2.2.2. Calculation of Heat Content Change

In this study, the upper ocean is defined as 0–200 m depth. To investigate the thermodynamic responses of the upper ocean, the heat content change (HCC) after Typhoon Soudelor at near-surface ( Δ H A ) and subsurface ( Δ H B ) are calculated from a pair of temperature profiles from the same Argo float [25],
Δ H A = c p ρ 0 z c 0 Δ T ( z ) dz  
Δ H B = c p ρ 0 200 z c Δ T ( z ) dz
where ρ 0 is the seawater density (1024 kg/m3); c p is the heat capacity (4186 J/kg°C); Δ T ( z )   =   T 2 ( z )   T 1 ( z ) is the change of temperature, where z is water depth, T 1 ( z ) and T 2 ( z ) are water temperature before and after Typhoon Soudelor, respectively; z c is the depth of the intersection of the two temperature profiles, that is, T 2 ( z c ) =   T 1 ( z c ) .
There exist two cases: (1) the intersection z c is found between the mixed layer depths (MLDs) of the two profiles, that is, MLD 1   <   z c   <   MLD 2 , where MLD 1 and MLD 2 are MLDs before and after typhoon passages, respectively; (2) z c is found beyond the range of MLD 1 and MLD 2 , that is, z c < min ( MLD 1 ,   MLD 2 ) or z c > max ( MLD 1 ,   MLD 2 ) . The MLD is defined as the depth where the temperature is 0.5   ° C lower than SST, that is, SST T ( z   =   MLD ) =   0.5   ° C [47].

2.2.3. Heat Transport by Horizontal Advection

In order to investigate whether and how the horizontal heat advection would influence the upper ocean response to Typhoon Soudelor, we used the heat transport equation to analyze the process of heat transport,
θ t + u θ x + v θ y + w θ z = k θ Δ θ + K θ l ( 2 θ x 2 + 2 θ y 2 ) + K θ z ( 2 θ z 2 )
where θ is potential temperature; k θ is molecular diffusivity; K θ l and K θ z are horizontal and vertical turbulent diffusivities, respectively.
The three terms on the right side of Equation (3) represent the heat transport induced by molecular mixing, horizontal turbulent mixing and vertical turbulent mixing, respectively. The first or second term can be neglected because it has been shown to be very small compared to the third term under tropical cyclone conditions [1,48,49]. Thus, Equation (3) can be simplified as,
θ t   =   u θ x v θ y + [ w θ z + K θ z ( 2 θ z 2 ) ]
where θ t is the time change rate of temperature. The terms u θ x and v θ y are the zonal and meridional advection of heat, respectively. The term [ w θ z + K θ z ( 2 θ z 2 )   ] represents the vertical heat transport induced by the vertical advection and turbulent mixing.

3. Observed Upper Ocean Responses to Super Typhoon Soudelor

3.1. Sea Surface Cooling

SST distributions before and during Super Typhoon Soudelor are shown in Figure 2a–e. Figure 2f shows the variation of SST during and before the typhoon. During the passage of Typhoon Soudelor, there is an evident cool trail along its track with rightward bias. The maximum of decreasing in SST could reach up to 3.43 °C on 6 August (Figure 2d,f), when Soudelor passed over a typical CE region (the area marked with a black box in Figure 2) located to the right side of the typhoon track. This cooling is much stronger than the other regions. A similar signal is also captured by the temperature profiles of Argo floats (Figure 3a,b). Additionally, the average SST decrease inside the typical CE (2.2 °C) is much larger than that in no-eddy regions (0.08 °C). This is consistent with the results in Zheng et al. [6].

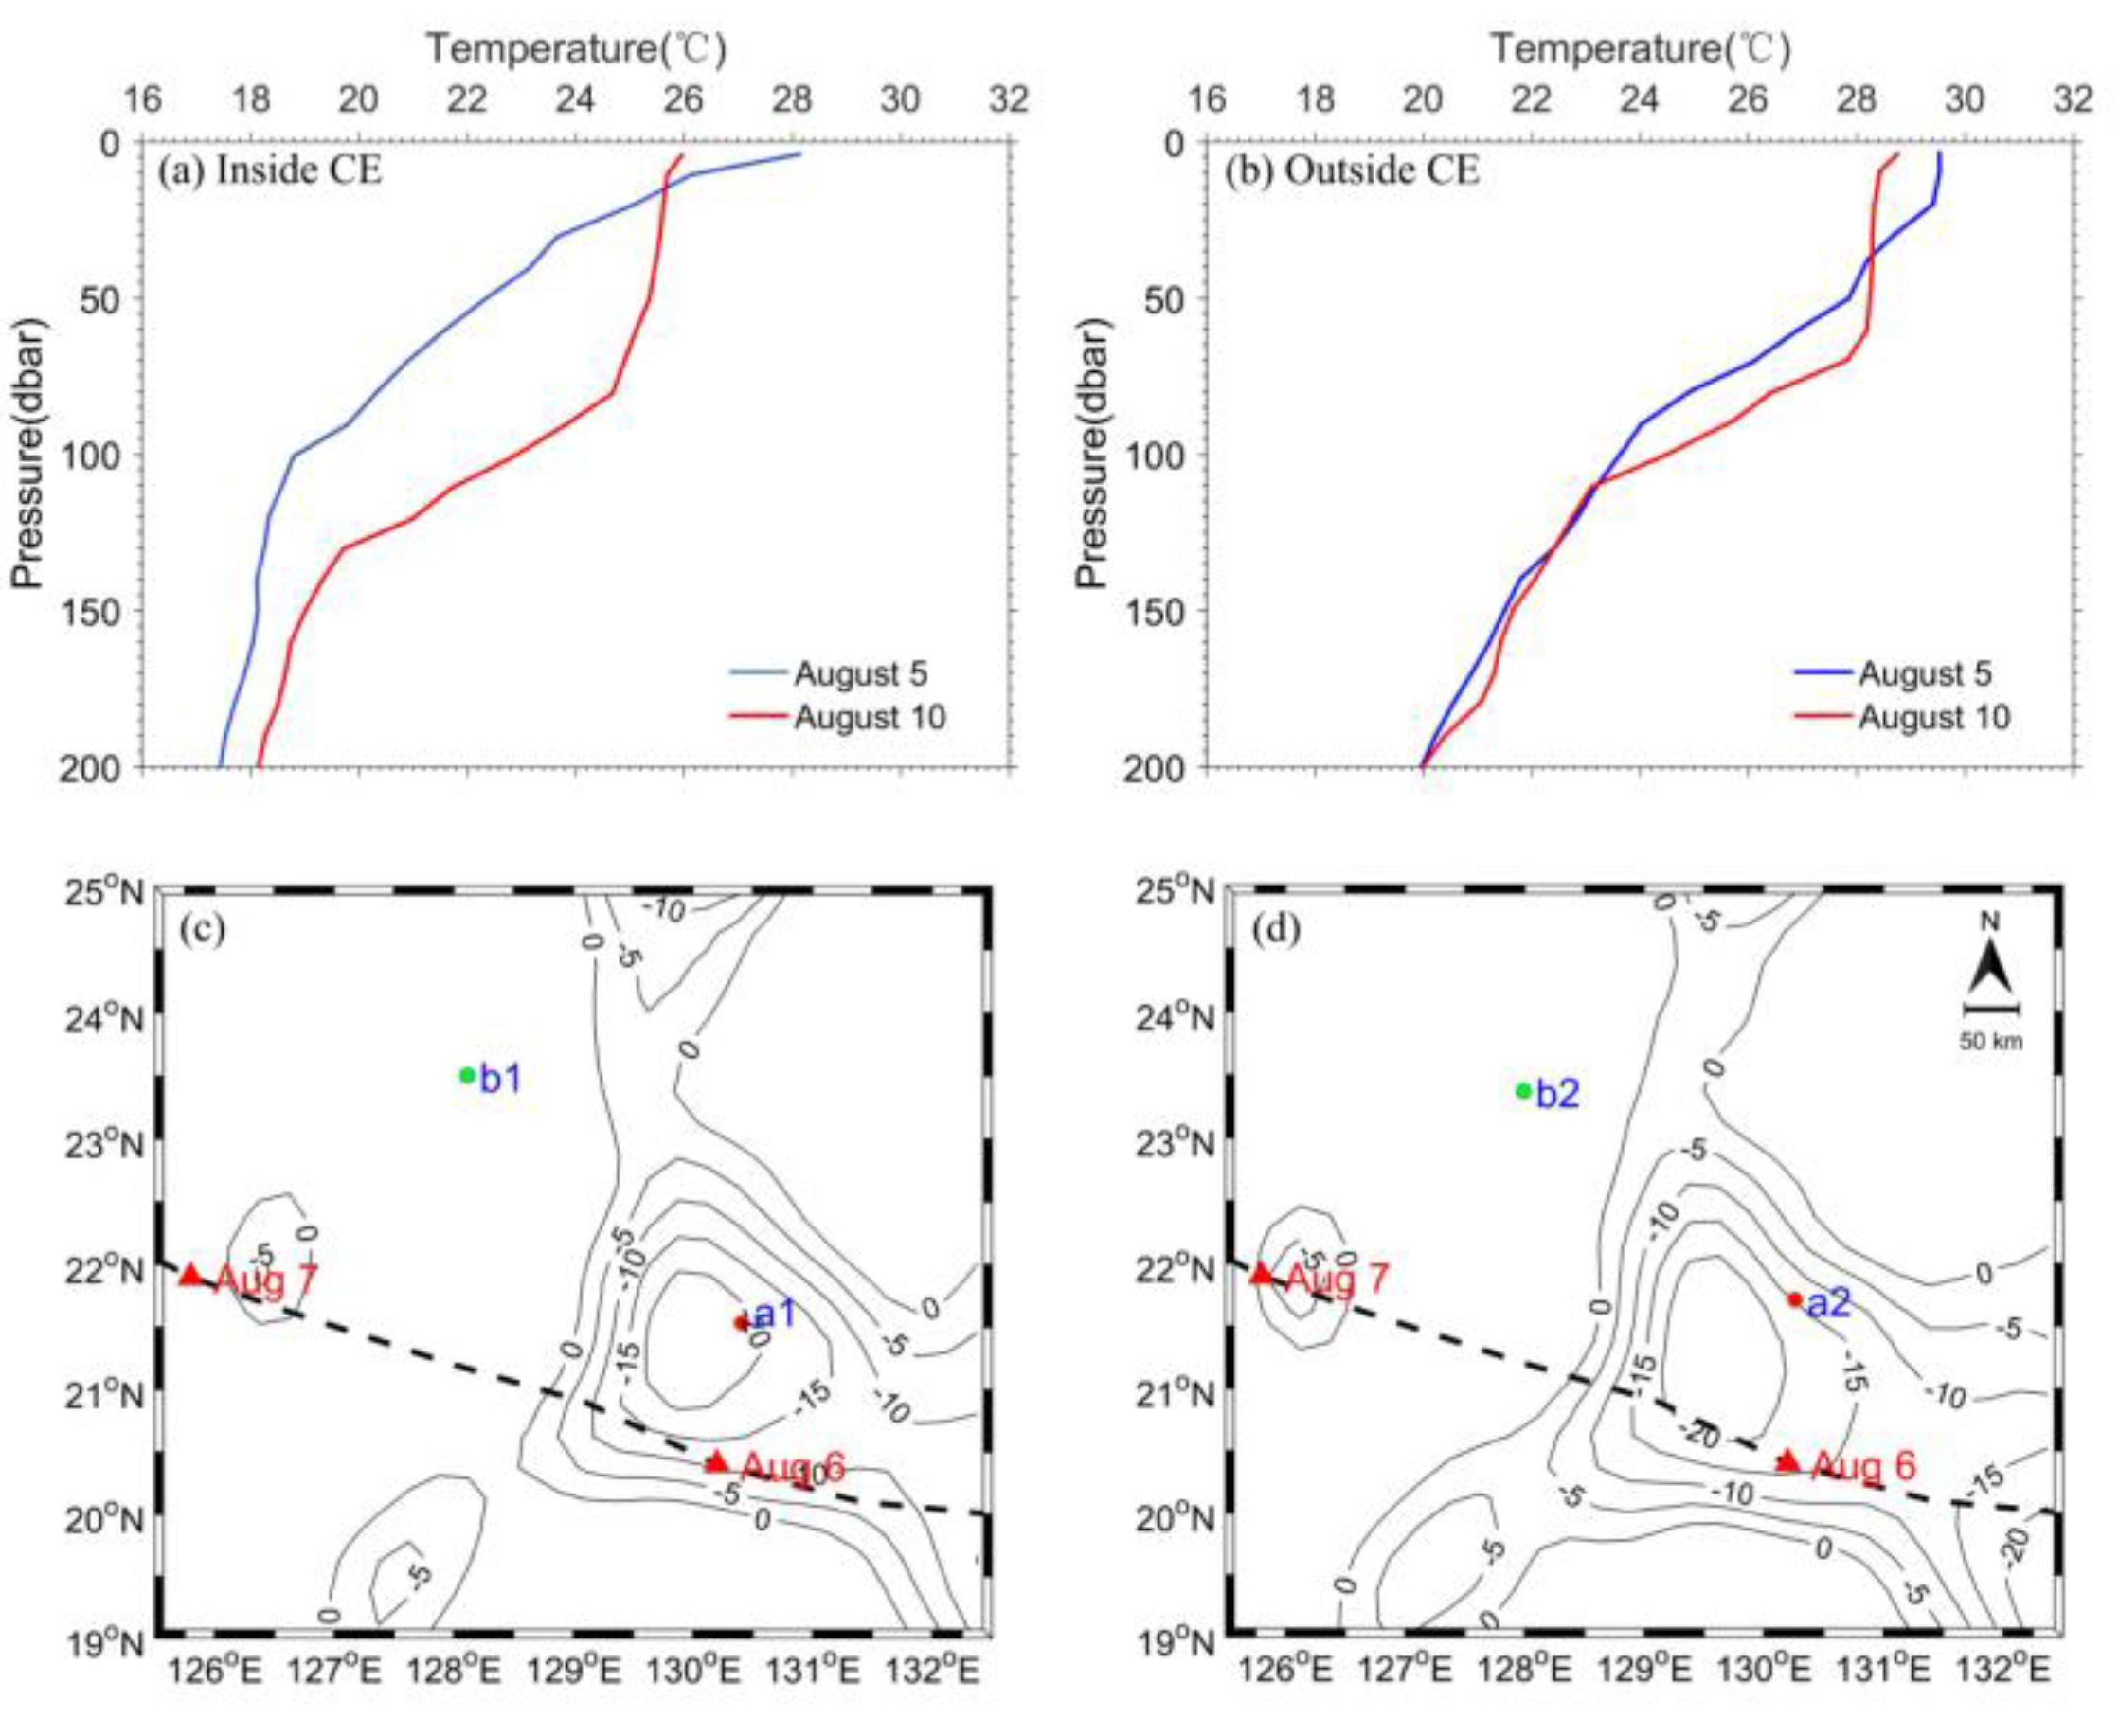
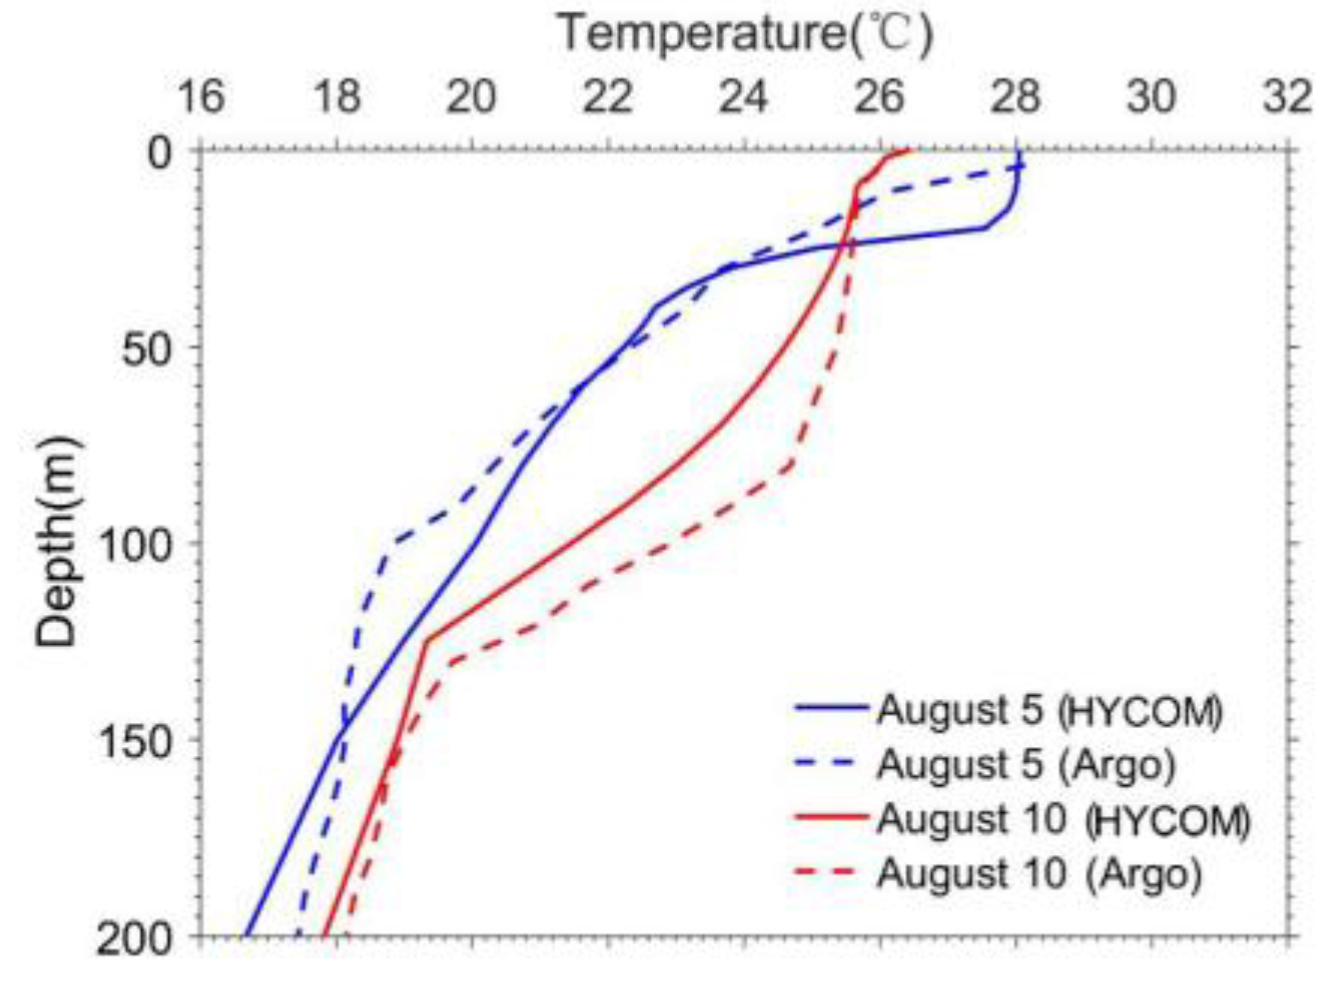
3.2. Subsurface Warming

Figure 3 compares subsurface thermal responses to Typhoon Soudelor inside and outside the CE region revealed by observations from two Argo floats. As shown in Figure 3a,b, the subsurface temperature increases obviously after the typhoon. One mechanism that could result in this phenomenon is the typhoon-induced vertical mixing which brings subsurface cold water up to the surface and pushes surface warm water down to the subsurface at the same time, as discussed in previous studies [1,29]. However, it is notable that the Argo float (130.3°E, 21.6°N) inside the CE observes abnormal warming in subsurface with a maximum temperature increase of 4.37 °C, which is much larger than that (1.74 °C) outside the eddy (128.1°E, 23.4°N).
In addition, the HCC calculated from Argo profiles demonstrates significant difference inside and outside the CE region (Table 1). It reaches 1.73 GJ/m2 inside the eddy, an order of magnitude larger than that calculated by Park et al. [25] based on the statistical analysis without considering other factors except for the influence of typhoons. Outside the eddy, the HCC is merely 0.39 GJ/m2, comparable to the result in Park et al. [25].

3.3. Impact of the Cyclonic Eddy on Upper Ocean Thermodynamic Response

The ocean mesoscale eddy, owing to its special thermal structure, could modulate typhoon-induced SST variation. In this study, the area marked with a black box (Figure 2d,f) is dominated by a strong pre-existing CE. Negative SSHAs of the CE indicate that the mixed layer is relatively shallower than the background ocean environments. As shown in Figure 3a,b, the MLD inside the CE (about 10 m) is much shallower than that outside the eddy (about 30 m). Furthermore, the MLD inside the cold eddy deepens almost as twice as that outside the eddy after Typhoon Soudelor. This means the upper ocean thermodynamic structure in the CE area is relatively unstable, which contributes to uplift the cold water below easily. Therefore, the pre-existing CE is a major factor leading to the stronger sea surface cooling than the normal ocean background.
While for the subsurface temperature response, Argo float “a” or “b” move short distance from 5 to 10 August (Figure 3), implying they are almost under the uniform background ocean environment except that one is inside, and another is outside, the CE region. As Table 1 shows, the HCCs calculated from the two Argo floats measurements are different from each other, especially at the subsurface. Both near-surface (−0.12 GJ/m2) and subsurface (0.39 GJ/m2) HCCs outside the CE are comparable to the average values given by Park et al. [25] based on the statistical analysis of historical Argo temperature profiles. However, the subsurface HCC (1.73 GJ/m2) inside the eddy is not only 4 times that of the outside-eddy value but even an order of magnitude larger than the statistical analysis result [25]. During this period, the average surface heat flux is about 360 W/m2, leading to a heat content increase of 0.16 GJ/m2, which only accounts for 9.7% of the total HCC. Thus, surface heat flux contributes little to the HCC. Likewise, it can be found the total value of HCC in the upper ocean is very small if mainly taking the typhoon-induced mixing into account. As a result, these comparisons suggest that besides the effect of entrainment, the anomalous increase in subsurface temperature in the cold eddy area must be highly related to the influence of the eddy.
The process dominating the upper ocean response can be further explored from the T-S plot (Figure 4) inside the CE. The post-typhoon and pre-typhoon T-S curves shift away from each other, indicating both temperature and salinity change significantly from surface to subsurface. The largest shift occurs at sea surface due to the strongest entrainment and air-sea flux exchange there. As the water gets deeper, the two curves become closer. As pointed out by Liu et al. [29], the stronger the nonadiabatic processes, the larger the shift distance of the curve. It is worth noting that there exists a larger shift distance in our study than Liu’s work, implying that the nonadiabatic process related to horizontal advection plays an important role in the upper ocean response.
In addition, according to the criterion proposed by Chelton et al. [34], if the ratio of the maximum rational speed U to translation speed of eddy c exceeds 1, that is, U / c > 1 , the water properties within the eddy interior will be advected with the eddy as it translates. In our study, the magnitude of U / c is approximately equal to 8.3, revealing that the CE has the capability of transporting water properties, such as heat. As shown in Figure 5, it seems that the cold eddy plays an important role in heat transport as it moves westwards after 5 August. Since Argo observations are sparse in time and space, in order to verify this hypothesis more convincingly, the numerical model datasets are used for further analysis in the next section.

4. The Horizontal Heat Advection Induced by Eddy Movement

In this section, the effect of the cyclonic eddy on the upper ocean response to Typhoon Soudelor is investigated using numerical model data from HYCOM. These data are compared with satellite SST, SSHA data and Argo observations for validation.

4.1. Verification of HYCOM Data

Figure 6 shows the comparison of HYCOM simulated SST with MW-IROISST data before and after Typhoon Soudelor. One can clearly see that, the model outputs are in good agreement with satellite observations, demonstrating that HYCOM can reproduce the ocean conditions under the influence of Soudelor. Furthermore, as shown in Figure 7, similar to satellite altimeter observations, a northwestward cold eddy is found in HYCOM SSH data during the passage of Typhoon Soudelor. The model result is also generally consistent with Argo float measurements (Figure 8). Both of them demonstrate an obvious tendency of sea surface cooling and subsurface warming, although the model simulated variations of SST and subsurface temperature are a little weaker. Meanwhile, near-surface and subsurface HCCs estimated from the model outputs are −0.19 GJ/m2 and 1.03 GJ/m2, respectively, also close to the observations. Therefore, the HYCOM data have the capability of reproducing the variation of the temperature in the upper ocean during Typhoon Soudelor.

4.2. Heat Transport by Horizontal Advection

To further understand the importance of heat transport in horizontal direction, we calculate the values of horizontal advection in Equation (4) using HYCOM data. Figure 9 shows the vertical profiles of the terms θ t   and u θ x at selected point as shown in Figure 7a with red circle from 5 to 6 August (other days are not shown). There exist evident loss (gain) of heat at the surface (subsurface) (Figure 9a) when Typhoon Soudelor passed over the eddy, which is in accordance with the result from Argo observation. Note that, in Figure 9b, the heat transport caused by the horizontal advection in East-West direction is of the same magnitude as the total temperature variations over time. That means the horizontal transport accounts for a significant proportion of the heat transport process. The heat changes of near-surface in Figure 9a,b show different trends because the horizontal advection is just part of the complex physical processes.
Moreover, according to the relative positions of the cyclonic eddy and Argo float in Figure 10, the eddy apparently moves westwards from 5 to 6 August. Since the Argo float is located on the right side of the eddy center, the water at the observed location becomes warmer as the eddy moves westwards. As Figure 11 shows, the closer to the eddy center, the colder the subsurface water is. As the eddy moves westward, the trapped warmer water in the right side of the CE is advected accordingly. This is an important mechanism for the gain of heat in the upper ocean as shown in Figure 9b. Therefore, to a large extent, the increase of heat at the subsurface is related to the horizontal advection induced by the eddy.

5. Discussion

Our study reveals that the upper ocean response to Typhoon Soudelor with pre-existing cyclonic eddy demonstrates both similarity and large difference in comparison with that without eddies. During the passage of Soudelor, SST decreases and subsurface temperature increases owing to the strong entrainment caused by the tropical cyclone. However, the magnitude of temperature change varies significantly with existence of the CE. It is particularly remarkable that the subsurface warming presented by temperature profiles and HCC calculated from Argo float inside the CE region is much stronger than that outside the CE. Furthermore, the HCC is more than 10 times larger than the statistical analysis results in Park et al. [25]. In this study, it has been proved that besides the entrainment, the horizontal advection of heat induced by eddies is another mechanism of subsurface warming that cannot be ignored.
Whether the water in the study region becomes warmer or colder is highly related to the relative position between the study (or observation) location and the eddy. The Typhoon Halola, which was generated in the Northwest Pacific just before Soudelor, is another example. It passed over the same CE area shown in Figure 2 on 24 July. In this case, the subsurface temperature captured by the Argo float (Figure 12) does not increase. On the contrary, it decreases, which cannot result from the effect of typhoon-induced entrainment. As discussed above, the eddy-induced horizontal advection of heat may contribute to this abnormal phenomenon. Figure 13 shows the relative position between the Argo float and CE. It shows that the Argo float has hardly moved from 21 to 26 July but the relative position between the float and CE changes obviously due to the movement of the eddy. As is shown in Figure 11, the float tends to be closer to the eddy center as the eddy moves westwards, in contrast to the example of Typhoon Soudelor. Thus, cold waters are transported by the eddy movement through the float location, leading to the subsurface cooling. Furthermore, the horizontal advection induced by eddy rotation may also contribute to the cooling. In addition to the influence of eddies, the reasons for the abnormal temperature change captured by the Argo float may be related to the relatively weak intensity of Typhoon Halola and the location of the Argo float. That may be why the vertical mixing effect captured by the Argo float is also relatively weak.

6. Conclusions

In this study, by taking advantage of multiple satellite datasets, numerical model outputs and in situ Argo observations, we investigate the upper ocean response to Super Typhoon Soudelor with a focus on SST and subsurface temperature change. A special goal here is to explore the role of horizontal advection induced by the eddy in subsurface temperature change.
At the sea surface, there is an obvious cool trail with rightward bias along the typhoon track. A stronger SST decrease is detected in a typical cyclonic eddy region, so the interaction between the typhoon and pre-existing CE is particularly focused on. Because the CE provides relatively shallow mixed layer, subsurface cold water is easier to be brought up into surface layer. Thus, the pre-existing CE located to the right side of Soudelor’s track contributes to a significant enhancement of rightward sea surface cooling.
At the subsurface, it is notable that the Argo float inside the CE captures an abnormal increase in subsurface temperature and HCC, which is one order of magnitude larger than the result of typhoon-induced HCC calculated by Park et al. [25] based on the statistical analysis. While the HCC observed by the float outside the CE is similar to their result. That means, without taking the effect of the eddy into account, the HCCs almost have no difference.
As proposed by Chelton et al. [34], the mesoscale eddy with the value of U / c exceeding 1 could transport water properties as it moves. By further analyzing the model data, the present study demonstrates the significant influence of the ocean mesoscale eddy on the upper ocean thermodynamic response to Typhoon Soudelor. It is found that the horizontal advection process induced by the eddy movement and rotation is capable of modulating the local temperature and heat content and thus affecting the change of subsurface temperature. Particularly, we point out the relationship between the change of subsurface temperature and eddy movement.
Owing to the limitation of temporal and spatial distributions of the data used in this study, it is hard to distinguish and quantitatively analyze the contribution of typhoon induced entrainment and eddy motion induced horizontal advection process to the upper ocean response to typhoons. Further study is required, combining observations and air-sea coupled numerical models.

Author Contributions

Q.X. and J.N. conceived the original idea and wrote the manuscript. Under the supervision, J.N. carried out data analysis and prepared all of the figures. H.Z. and T.W. helped to improve the results and revised the paper. K.F. provided comments and valuable suggestions on the paper. All authors read and approved the final version of the manuscript.

Funding

This research was funded by the National Key Project of Research and Development Plan of China (Grant No. 2016YFC1401905), the Postgraduate Research & Practice Innovation Program of Jiangsu Province (Grant No. KYCX18_0523), the Fundamental Research Funds for the Central Universities (Hohai University) (Grant No. 2018B702X14), the Natural Science Foundation of Jiangsu Province (Grant No. BK20170864) and the National Natural Science Foundation of China (Grant No. 41806021).

Acknowledgments

The authors thank the editor and two anonymous reviewers for their constructive comments which help to improve the paper. We acknowledge the Joint Typhoon Warming Center (JTWC) for providing Typhoon information (http://www.usno.navy.mil/NOOC/nmfc-ph/RSS/jtwc/best_tracks), the Remote Sensing Systems for providing the SST data (http://www.remss.com/), the Copernicus Marine and Environment Monitoring Service (CMEMS) database for providing the SSHA and surface current datasets (http://marine.Coperni cus.eu/), the China Argo Real-time Data Center for providing the Argo data (http://www.argo.org.cn/) and the Hybrid Coordinate Ocean Model (HYCOM) for providing the ocean analysis data (https://www.hycom.org/).

Conflicts of Interest

The authors declare no conflict of interest.

References

  1. Price, J.F.; Sanford, T.B.; Forristall, G.Z. Forced stage response to a moving hurricane. J. Phys. Oceanogr. 1994, 24, 233–260. [Google Scholar] [CrossRef]
  2. Price, J.F. Upper ocean response to a Hurricane. J. Phys. Oceanogr. 1981, 11, 153–175. [Google Scholar] [CrossRef]
  3. Lin, I.I.; Liu, W.T.; Wu, C.C.; Wong, G.T.F.; Hu, C.; Zhen, Z.; Liang, W.D.; Yang, Y.; Liu, K.K. New evidence for enhanced ocean primary production triggered by tropical cyclone. Geophys. Res. Lett. 2003, 30, 1718. [Google Scholar] [CrossRef]
  4. Walker, N.D.; Leben, R.R.; Balasubramanian, S. Hurricane-forced upwelling and chlorophyll a, enhancement within cold-core cyclones in the Gulf of Mexico. Geophys. Res. Lett. 2005, 32, 18610. [Google Scholar] [CrossRef]
  5. D’Asaro, E.A.; Sanford, T.B.; Niiler, P.P.; Terrill, E.J. Cold wake of Hurricane Frances. Geophys. Res. Lett. 2007, 34, 15609. [Google Scholar] [CrossRef]
  6. Zheng, Z.W.; Ho, C.R.; Kuo, N.J. Importance of pre-existing oceanic conditions to upper ocean response induced by Super Typhoon Hai-Tang. Geophys. Res. Lett. 2008, 35, 288–299. [Google Scholar] [CrossRef]
  7. Zheng, Z.W.; Ho, C.R.; Zheng, Q.A.; Lo, Y.T.; Kuo, N.J.; Gopalakrishnan, G. Effects of preexisting cyclonic eddies on upper ocean responses to category 5 typhoons in the western north pacific. J. Geophys. Res. Oceans 2010, 115. [Google Scholar] [CrossRef]
  8. Zheng, Z.W.; Ho, C.R.; Zheng, Q.A.; Kuo, N.J.; Lo, Y.T. Satellite observation and model simulation of upper ocean biophysical response to Super Typhoon Nakri. Cont. Shelf Res. 2010, 30, 1450–1457. [Google Scholar] [CrossRef]
  9. Zhang, H.; Chen, D.K.; Zhou, L.; Liu, X.H.; Ding, T.; Zhou, B. Upper ocean response to typhoon Kalmaegi (2014). J. Geophys. Res. Oceans 2016, 121, 6520–6535. [Google Scholar] [CrossRef]
  10. Zhang, H.; Wu, R.H.; Chen, D.K.; Liu, X.H.; He, H.L.; Tang, Y.M.; Ke, D.X.; Shen, Z.Q.; Li, J.D.; Xie, J.C.; et al. Net modulation of upper ocean thermal structure by Typhoon Kalmaegi (2014). J. Geophys. Res. Oceans 2018, 123, 7154–7171. [Google Scholar] [CrossRef]
  11. Pan, J.; Sun, Y. Estimate of ocean mixed layer deepening after a typhoon passage over the south china sea by using satellite data. J. Phys. Oceanogr. 2013, 43, 498–506. [Google Scholar] [CrossRef]
  12. Pan, J.Y.; Huang, L.; Devlin, A.T.; Lin, H. Quantification of typhoon-induced phytoplankton blooms using satellite multi-sensor data. Remote Sens. 2018, 10, 318. [Google Scholar] [CrossRef]
  13. Cione, J.J.; Uhlhorn, E.W. Sea surface temperature variability in hurricanes: Implications with respect to intensity change. Mon. Weather Rev. 2003, 131, 1783–1796. [Google Scholar] [CrossRef]
  14. Chen, D.K.; Lei, X.T.; Wang, W.; Wang, G.H.; Han, G.J.; Zhou, L. Upper ocean response and feedback mechanisms to typhoon (in Chinese). Adv. Earth Sci. 2013, 28, 1077–1086. [Google Scholar] [CrossRef]
  15. Zhang, W.Z.; Lin, S.; Jiang, X.M. Influence of tropical cyclones in the western North Pacific. In Recent Developments in Tropical Cyclone Dynamics, Prediction and Detection; Anthony, L., Ed.; InTech: Croatia, Austria, 2016; pp. 3–24. ISBN 978-953-51-2703-1. [Google Scholar]
  16. Ooyama, K. Numerical simulation of the life cycle of tropical cyclones. J. Atmos. Sci. 1969, 26, 3–40. [Google Scholar] [CrossRef]
  17. Chiang, T.L.; Wu, C.R.; Oey, L.Y. Typhoon Kai-Tak: An ocean’s perfect storm. J. Phys. Oceanogr. 2011, 41, 221–233. [Google Scholar] [CrossRef]
  18. Sanford, T.B.; Price, J.F.; Girton, J.B. Upper-ocean response to Hurricane Frances (2004) observed by profiling EM-APEX floats. J. Phys. Oceanogr. 2011, 41, 1041–1056. [Google Scholar] [CrossRef]
  19. Emanuel, K. Contribution of tropical cyclones to meridional heat transport by the oceans. J. Geophys. Res. Atmos. 2001, 106, 14771–14781. [Google Scholar] [CrossRef] [Green Version]
  20. Sriver, R.L.; Huber, M. Observational evidence for an ocean heat pump induced by tropical cyclones. Nature 2007, 447, 577–580. [Google Scholar] [CrossRef]
  21. Sriver, R.L. Observational evidence supports the role of tropical cyclones in regulating climate. Proc. Natl. Acad. Sci. USA 2013, 110, 15173–15174. [Google Scholar] [CrossRef] [Green Version]
  22. Hu, A.; Meehl, G.A. Effect of the Atlantic hurricanes on the oceanic meridional overturning circulation and heat transport. Geophys. Res. Lett. 2009, 36, 03702. [Google Scholar] [CrossRef]
  23. Rao, A.D.; Joshi, M.; Jain, I.; Ravichandran, M. Response of subsurface waters in the eastern Arabian Sea to tropical cyclones. Estuar. Coast. Shelf Sci. 2010, 89, 267–276. [Google Scholar] [CrossRef]
  24. Liu, X.; Wei, J. Understanding surface and subsurface temperature changes induced by tropical cyclones in the Kuroshio. Ocean Dyn. 2015, 65, 1017–1027. [Google Scholar] [CrossRef]
  25. Park, J.J.; Kwon, Y.; Price, J.F. Argo array observation of ocean heat content changes induced by tropical cyclones in the north Pacific. J. Geophys. Res. Oceans 2011, 116. [Google Scholar] [CrossRef] [Green Version]
  26. Sun, L.; Yang, Y.J.; Xian, T. Ocean responses to Typhoon Namtheun explored with Argo floats and multiplatform satellites. Atmos. Ocean 2012, 50, 15–26. [Google Scholar] [CrossRef]
  27. Vissa, N.K.; Satyanarayana, A.N.V.; Kumar, B.P. Response of upper ocean during passage of MALA cyclone utilizing Argo data. Int. J. Appl. Earth Obs. Geoinf. 2012, 14, 149–159. [Google Scholar] [CrossRef]
  28. Wang, G.; Wu, L.; Johnson, N.C.; Ling, Z. Observed three-dimensional structure of ocean cooling induced by Pacific tropical cyclones. Geophys. Res. Lett. 2016, 43, 7632–7638. [Google Scholar] [CrossRef]
  29. Liu, S.S.; Sun, L.; Wu, Q.; Yang, Y.J. The responses of cyclonic and anticyclonic eddies to typhoon forcing: The vertical temperature-salinity structure changes associated with the horizontal convergence /divergence. J. Geophys. Res. Oceans 2017, 122, 4974–4989. [Google Scholar] [CrossRef]
  30. Shay, L.K.; Goni, G.J.; Black, P.G. Effects of a warm oceanic feature on Hurricane Opal. Mon. Weather Rev. 2000, 128, 1366–1383. [Google Scholar] [CrossRef]
  31. Lin, I.I.; Wu, C.C.; Emanuel, K.A.; Lee, I.H.; Wu, C.R.; Pun, I.F. The interaction of Supertyphoon Maemi (2003) with a warm ocean eddy. Mon. Weather Rev. 2005, 133, 2635–2649. [Google Scholar] [CrossRef]
  32. Lu, Z.; Wang, G.; Shang, X.D. Response of a pre-existing cyclonic ocean eddy to a typhoon. J. Phys. Oceanogr. 2016, 46, 2403–2410. [Google Scholar] [CrossRef]
  33. Sun, L.; Yang, Y.J.; Xian, T.; Lu, Z.M.; Fu, Y.F. Strong enhancement of chlorophyll a concentration by a weak typhoon. Mar. Ecol. Prog. Ser. 2010, 404, 39–50. [Google Scholar] [CrossRef] [Green Version]
  34. Chelton, D.B.; Gaube, P.; Schlax, M.G.; Early, J.J.; Samelson, R.M. The influence of nonlinear mesoscale eddies on near-surface oceanic chlorophyll. Science 2011, 334, 328–332. [Google Scholar] [CrossRef] [PubMed]
  35. McGillicuddy, D.J. Eddies masquerade as planetary waves. Science 2011, 334, 318–319. [Google Scholar] [CrossRef]
  36. Dong, C.; McWilliams, J.C.; Liu, Y.; Chen, D. Global heat and salt transports by eddy movement. Nat. Commun. 2014, 5, 3294. [Google Scholar] [CrossRef] [Green Version]
  37. Wu, L.; Zhao, H. Dynamically derived tropical cyclone intensity changes over the western North Pacific. J. Clim. 2012, 25, 89–98. [Google Scholar] [CrossRef]
  38. Gentemann, C.L. Near real time global optimum interpolated microwave SSTs: Applications to hurricane intensity forecasting. In Proceedings of the 26th Conference on Hurricanes and Tropical Meteorology, Miami, FL, USA, 2–7 May 2004. [Google Scholar]
  39. Reynolds, R.W.; Smith, T.M. Improved global sea surface temperature analyses using optimum interpolation. J. Clim. 1994, 7, 929–948. [Google Scholar] [CrossRef]
  40. Liu, Z.H. Global Ocean Argo Scatter Data Set (V2.1) (1996/01-2017/05) User Manual; China Argo Real-time Data Center: Hangzhou, China, 2017. (In Chinese) [Google Scholar]
  41. Chassignet, E.P.; Hurlburt, H.E.; Smedstad, O.M.; Halliwell, G.R.; Hogan, P.J.; Wallcraft, A.J.; Baraille, R.; Bleck, R. The HYCOM (HYbrid Coordinate Ocean Model) data assimilative system. J. Mar. Syst. 2007, 65, 60–83. [Google Scholar] [CrossRef] [Green Version]
  42. Wu, R.H.; Li, C.Y. Upper ocean response to the passage of two sequential typhoons. Deep Sea Res. 2018, 132, 68–79. [Google Scholar] [CrossRef]
  43. Isern-Fontanet, J.; Garcíaladona, E.; Font, J. Identification of marine eddies from altimetric maps. J. Atmos. Ocean. Technol. 2003, 20, 772–778. [Google Scholar] [CrossRef]
  44. Isern-Fontanet, J.; Garcíaladona, E.; Font, J. Vortices of the Mediterranean Sea: An altimetric Perspective. J. Phys. Oceanogr. 2006, 36, 87–103. [Google Scholar] [CrossRef]
  45. Chaigneau, A.; Eldin, G.; Dewitte, B. Eddy activity in the four major upwelling systems from satellite altimetry (1992–2007). Prog. Oceanogr. 2009, 83, 117–123. [Google Scholar] [CrossRef]
  46. Chaigneau, A.; Texier, M.L.; Eldin, G.; Grados, C.; Pizarro, O. Vertical structure of mesoscale eddies in the eastern South Pacific Ocean: A composite analysis from altimetry and Argo profiling floats. J. Geophys. Res. Oceans 2011, 116. [Google Scholar] [CrossRef] [Green Version]
  47. Kara, A.B.; Rochford, P.A.; Hurlburt, H.E. An optimal definition for ocean mixed layer depth. J. Geophys. Res. Oceans 2000, 105, 16803–16821. [Google Scholar] [CrossRef] [Green Version]
  48. Uhlhorn, E.W.; Shay, L.K. Loop current mixed layer energy response to hurricane Lili (2002), Part II: Idealized Numerical Simulations. J. Phys. Oceanogr. 2013, 43, 1173–1192. [Google Scholar] [CrossRef]
  49. Wei, J.; Jiang, G.Q.; Liu, X. Parameterization of typhoon-induced ocean cooling using temperature equation and machine learning algorithms: An example of typhoon Soulik (2013). Ocean Dyn. 2017, 67, 1179–1193. [Google Scholar] [CrossRef]
Figure 1. Track and intensity of Super Typhoon Soudelor in 2015. Dots denote the 6-hourly typhoon center positions with the color indicating the typhoon intensity categorized by the Saffir-Simpson scale.
Remotesensing 11 00938 g001
Figure 2. Distribution of sea surface temperature (SST) (°C) before and during Typhoon Soudelor passed by. (a) SST on July 28, before Typhoon Soudelor was generated; (be) SST during the typhoon; (f) variation of SST during (on 6 August) and before (on 28 July) Typhoon Soudelor. Overlaid is sea surface height anomaly (SSHA) (contours, unit: cm) on 28 July 2015. Only negative values are plotted, with closed contours indicating pre-existing CEs. The black dashed line denotes the typhoon track and the dot denotes the center of the typhoon on each day. The black rectangle in (d,f) represents a typical CE region.
Remotesensing 11 00938 g002
Figure 3. Comparison of Argo observed subsurface temperature responses to Typhoon Soudelor inside (a) and outside (b) the CE region. (c) Negative SSHA before the typhoon (on 5 August). (d) Negative SSHA after the typhoon (on 10 August). Symbols “a” and “b” denote the locations of Argo floats inside and outside the CE region, with “1” and “2” representing the locations before and after the passage of Typhoon Soudelor, respectively. The red triangles denote the center locations of typhoon at 00:00 UTC on 6 and 7 August, respectively.
Remotesensing 11 00938 g003
Figure 4. The T-S plot of the upper ocean (from surface to 200 m) inside the cyclonic eddy (CE). “AF” and “BE” mean after typhoon passage and before typhoon passage, respectively.
Remotesensing 11 00938 g004
Figure 5. Negative SSHA (unit: cm) from AVISO, showing the position of the CE on 5 August (a) and 10 August (b) 2015. The red triangle and dot denote eddy center identified using the OW criterion and position of the Argo float on the same date. The blue triangle in (b) denotes the eddy center on 5 August, indicating the westward movement of the eddy.
Remotesensing 11 00938 g005
Figure 6. Comparison of SST (°C) obtained from HYCOM outputs (a,b) and MW-IROISST data (c,d) before (on 1 August, left column) and during (on 5 August, right column) Typhoon Soudelor passed by. The black dashed line denotes the typhoon track. The red dot denotes the center location of typhoon at 00:00 UTC on 5 August.
Remotesensing 11 00938 g006
Figure 7. Same as Figure 5 but for SSH (unit: m) of HYCOM data, showing the position of the CE on 5 August (a) and 10 August (b) 2015. The relative position between the red dot and HYCOM determined eddy center (red triangle) is the same as that between Argo float and altimeter observed eddy center in Figure 5.
Remotesensing 11 00938 g007
Figure 8. Comparison of temperature profiles obtained from HYCOM data (solid line) and Argo observations (dashed line).
Remotesensing 11 00938 g008
Figure 9. Vertical profiles of the terms θ t (a) and u θ x (b) from 5 to 6 August in Equation (4).
Remotesensing 11 00938 g009
Figure 10. Negative SSHA (unit: cm) from AVISO, showing the position of the CE on 5 August (a) and 6 August (b) 2015. The symbols “I” denotes the location of Argo float on 5 August. The black dashed line is the track of typhoon and “*” denotes the center location of typhoon at 00:00 UTC on 6 August. Overlaid in (b) is contours of negative SSHA on 5 August (red dashed lines), implying the westward movement of the eddy.
Remotesensing 11 00938 g010
Figure 11. Distribution of isotherms in cyclonic eddies. Two isotherms are depicted showing the structure of interior temperature. The red and green dots denote the observed locations of Argo profiles in the case of Soudelor and Halola, respectively.
Remotesensing 11 00938 g011
Figure 12. (a) The track (blue dashed line) of Typhoon Halola in July 2015. The blue dot denotes typhoon center on 24 July. Overlaid is SSHA (contours, unit: cm) on 21 July. Only negative values are plotted. The black rectangle represents the same CE region as shown in Figure 2. (b) Vertical temperature profiles observed by the Argo float inside the CE before (on 21 July) and after Halola (on 26 July).
Remotesensing 11 00938 g012
Figure 13. Contours (black solid lines) of negative SSHA (cm) on 21 July (a) and 26 July (b), respectively. The red and green dots marked with “I-21” and “I-26” denote the locations of Argo float on 21 and 26 July, respectively. Overlaid in (b) are contours of negative SSHA on 21 July (red dashed lines), implying the movement of the eddy.
Remotesensing 11 00938 g013
Table 1. Comparison of Argo observed heat content change with previous study.
Heat Content ChangeNear-Surface HCC (GJ/m2)Subsurface HCC (GJ/m2)Total HCC (GJ/m2)
This study (inside the CE)−0.081.731.65
This study (outside the CE)−0.120.390.27
Park et al. [25]−0.16 ± 0.010.14 ± 0.06−0.02 ± 0.07

