Article

Monitoring Extreme Agricultural Drought over the Horn of Africa (HOA) Using Remote Sensing Measurements

1
Center for Spatial Information Science and Systems (CSISS), College of Science, George Mason University, Fairfax, VA 22030, USA
2
Global Environment and Natural Resources Institute (GENRI) & Department of Geography and GeoInformation Science (GGS), College of Science, George Mason University, Fairfax, VA 22030, USA
*
Author to whom correspondence should be addressed.
Remote Sens. 2019, 11(8), 902; https://doi.org/10.3390/rs11080902
Submission received: 21 December 2018 / Revised: 10 April 2019 / Accepted: 11 April 2019 / Published: 13 April 2019
(This article belongs to the Special Issue Selected Papers from Agro-Geoinformatics 2018)

Abstract

:
The Horn of Africa ((HOA), including Djibouti, Eritrea, Ethiopia, and Somalia) has been slammed by extreme drought within the past years, and has become one of the most food-insecure regions in the world. Millions of people in the HOA are undernourished and are at risk of famine. Meanwhile, global climate change continues to cause more extreme weather and climate events, such as drought and heat waves, which have significant impacts on crop production and food security. This study aimed to investigate extreme drought in the Horn of Africa region, using satellite remote sensing data products from the Moderate Resolution Imaging Spectroradiometer (MODIS), a key instrument onboard the National Aeronautics and Space Administration (NASA) satellites Terra and Aqua, as well as Tropical Rainfall Measuring Mission (TRMM) precipitation data products. Normalized Difference Vegetation Index (NDVI), Vegetation Condition Index (VCI), Temperature Condition Index (TCI), and Vegetation Health Index (VHI) data from 2000 to 2017 were derived from the MODIS measurements and analyzed for assessments of the temporal trend of vegetation health and the impacts of extreme drought events. The results demonstrated the severity of vegetation stress and extreme drought during the past decades. From 1998 to 2017, monthly precipitation over major crop growth seasons decreased significantly. From 2001 to 2017, the mean VHI anomaly of HOA cropland decreased significantly, at a trend of −0.2364 ± 0.1446/year, and the mean TCI anomaly decreased at a trend of −0.2315 ± 0.2009/year. This indicated a deterioration of cropland due to drought conditions in the HOA. During most of the crop growth seasons in 2015 and 2016, the VHI values were below the 10-year (2001–2010) average: This was caused by extreme drought during the 2015–2016 El Niño event, one of the strongest El Niño events in recorded history. In addition, monthly VHI anomalies demonstrated a high correlation with monthly rainfall anomalies in July and August (the growth season of major crops in the HOA), and the trough points of the monthly rainfall and VHI anomaly time series of July and August were consistent with the timing of drought events and El Niño events.

Graphical Abstract

1. Introduction

As a result of global population increases, water, energy, and food security have become critical issues. Additionally, global climate change has caused an increase in the intensity and frequency of extreme weather and climate events, further worsening water, energy, and food security issues. The Horn of Africa (HOA) is a region in eastern Africa (including the countries of Ethiopia, Somalia, Djibouti, and Eritrea), a region where most of the population lives in rural areas and agriculture is the main source of livelihood. In the HOA, agriculture responds heavily to weather conditions, especially precipitation, and is highly vulnerable to extreme weather and climate events. In the HOA, drought has occurred frequently during past decades, and is the main natural hazard that contributes to food insecurity and poverty. An estimated 20 million people in the HOA region were affected by drought [1]. Therefore, establishing the capacity to monitor and predict water, energy, and food security for decision-making and strategic planning toward sustainable development is essential. Satellite remote sensing has become one of the leading technologies for earth observation, and can provide comprehensive information about the dynamics and processes of the earth’s systems [2]. The Normalized Difference Vegetation Index (NDVI), first developed in the 1970s, has been used extensively for vegetation monitoring and drought assessment with measurements from the Advanced Very High Resolution Radiometer (AVHRR) onboard the National Oceanic and Atmospheric Administration (NOAA) satellites [3,4]. To further monitor vegetation status, Kogan et al. developed the Vegetation Condition Index (VCI), Temperature Condition Index (TCI), and Vegetation Health Index (VHI), which are based on relative changes in the NDVI and land surface temperature [5,6,7,8,9]. In 1999, the National Aeronautics and Space Administration (NASA) launched the Moderate Resolution Imaging Spectroradiometer (MODIS) instrument aboard the Terra satellite, followed by another MODIS instrument aboard the Aqua satellite in 2002. Compared to the AVHRR, MODIS has a higher spatial resolution, more spectral channels, more accurate geolocation, and abundant data products [2]. Since then, MODIS data products have been widely used to monitor vegetation dynamics and drought development, and many approaches have been developed using these remote sensing measurements to monitor global vegetation and extreme climate events such as drought, flooding, heat waves, etc. [2,9,10,11,12,13,14,15,16,17,18]. For drought monitoring, many indices have been developed, such as the Palmer-Z index, the Palmer Drought Severity Index (PDSI) [19], Standardized Precipitation Indices (SPIs) [20], and the U.S. Drought Monitor (USDM) [21]. While the SPIs rely on precipitation data, the PDSI uses both precipitation and temperature data, and the USDM integrates multiple indices together, including SPIs and the PDSI, as well as vegetation and hydrologic conditions. Precipitation data are critical parameters in these drought indices. Zargar et al. have reviewed various drought indices and indicated the dependence of drought index implementation on data availability [22]. Wu et al. have evaluated the performance of various MODIS indices for agricultural drought assessments with Palmer-Z index data calculated from 129 ground stations across the “Corn Belt” of the United States [14]. Choi et al. have investigated the NDVI and the Normalized Difference Water Index (NDWI) for drought condition analyses in the eastern HOA [12]. Most of these previous works either used indices from remote sensing data only or combined remote sensing data and ground observations for drought monitoring, while Enenkel et al. developed the Enhanced Combined Drought Index (ECDI) by combining rainfall, soil moisture, land surface temperature, and vegetation status [18]. Rainfall data are critical for drought monitoring and assessment. In the HOA region, there are very limited ground observations available. Therefore, it is more important to develop the capabilities of monitoring agricultural drought and other extreme events using satellite remote sensing measurements of vegetation and rainfall. The Tropical Rainfall Measuring Mission (TRMM) is a joint U.S.–Japan satellite mission to monitor tropical and subtropical precipitation. The TRMM Multisatellite Precipitation Analysis (TMPA) has provided stable and valuable precipitation data for hydrometeorological studies. By incorporating the measurements of instruments onboard multiple satellites, as well as monthly accumulated Global Precipitation Climatology Centre (GPCC) rain gauge analyses, TRMM 3B43 products provide a best-estimate precipitation rate (in mm/hr) [23,24]. Thus, TRMM 3B43 data were reliable for drought monitoring and analysis of long-term rainfall trends and spatial patterns.
This study aimed to investigate agricultural drought through a time series analysis of TRMM 3B43 products and MODIS measurements from 2000 to 2017 by integrating the rainfall, VCI, TCI, and VHI, as well as land cover type data and crop calendar information. For a case study, the extreme drought event in the HOA during the 2015–2016 El Niño event period was investigated. Monthly VHI anomaly time series of the crop growth season were compared to the monthly rainfall anomaly to identify the impacts of drought on crop health. The temporal trends provided insight into the past, current, and future conditions of drought severity and food security, which is helpful in understanding the severity of the food security situation in the HOA, as well as the urgent need for sustainable solutions.

2. Data and Methods

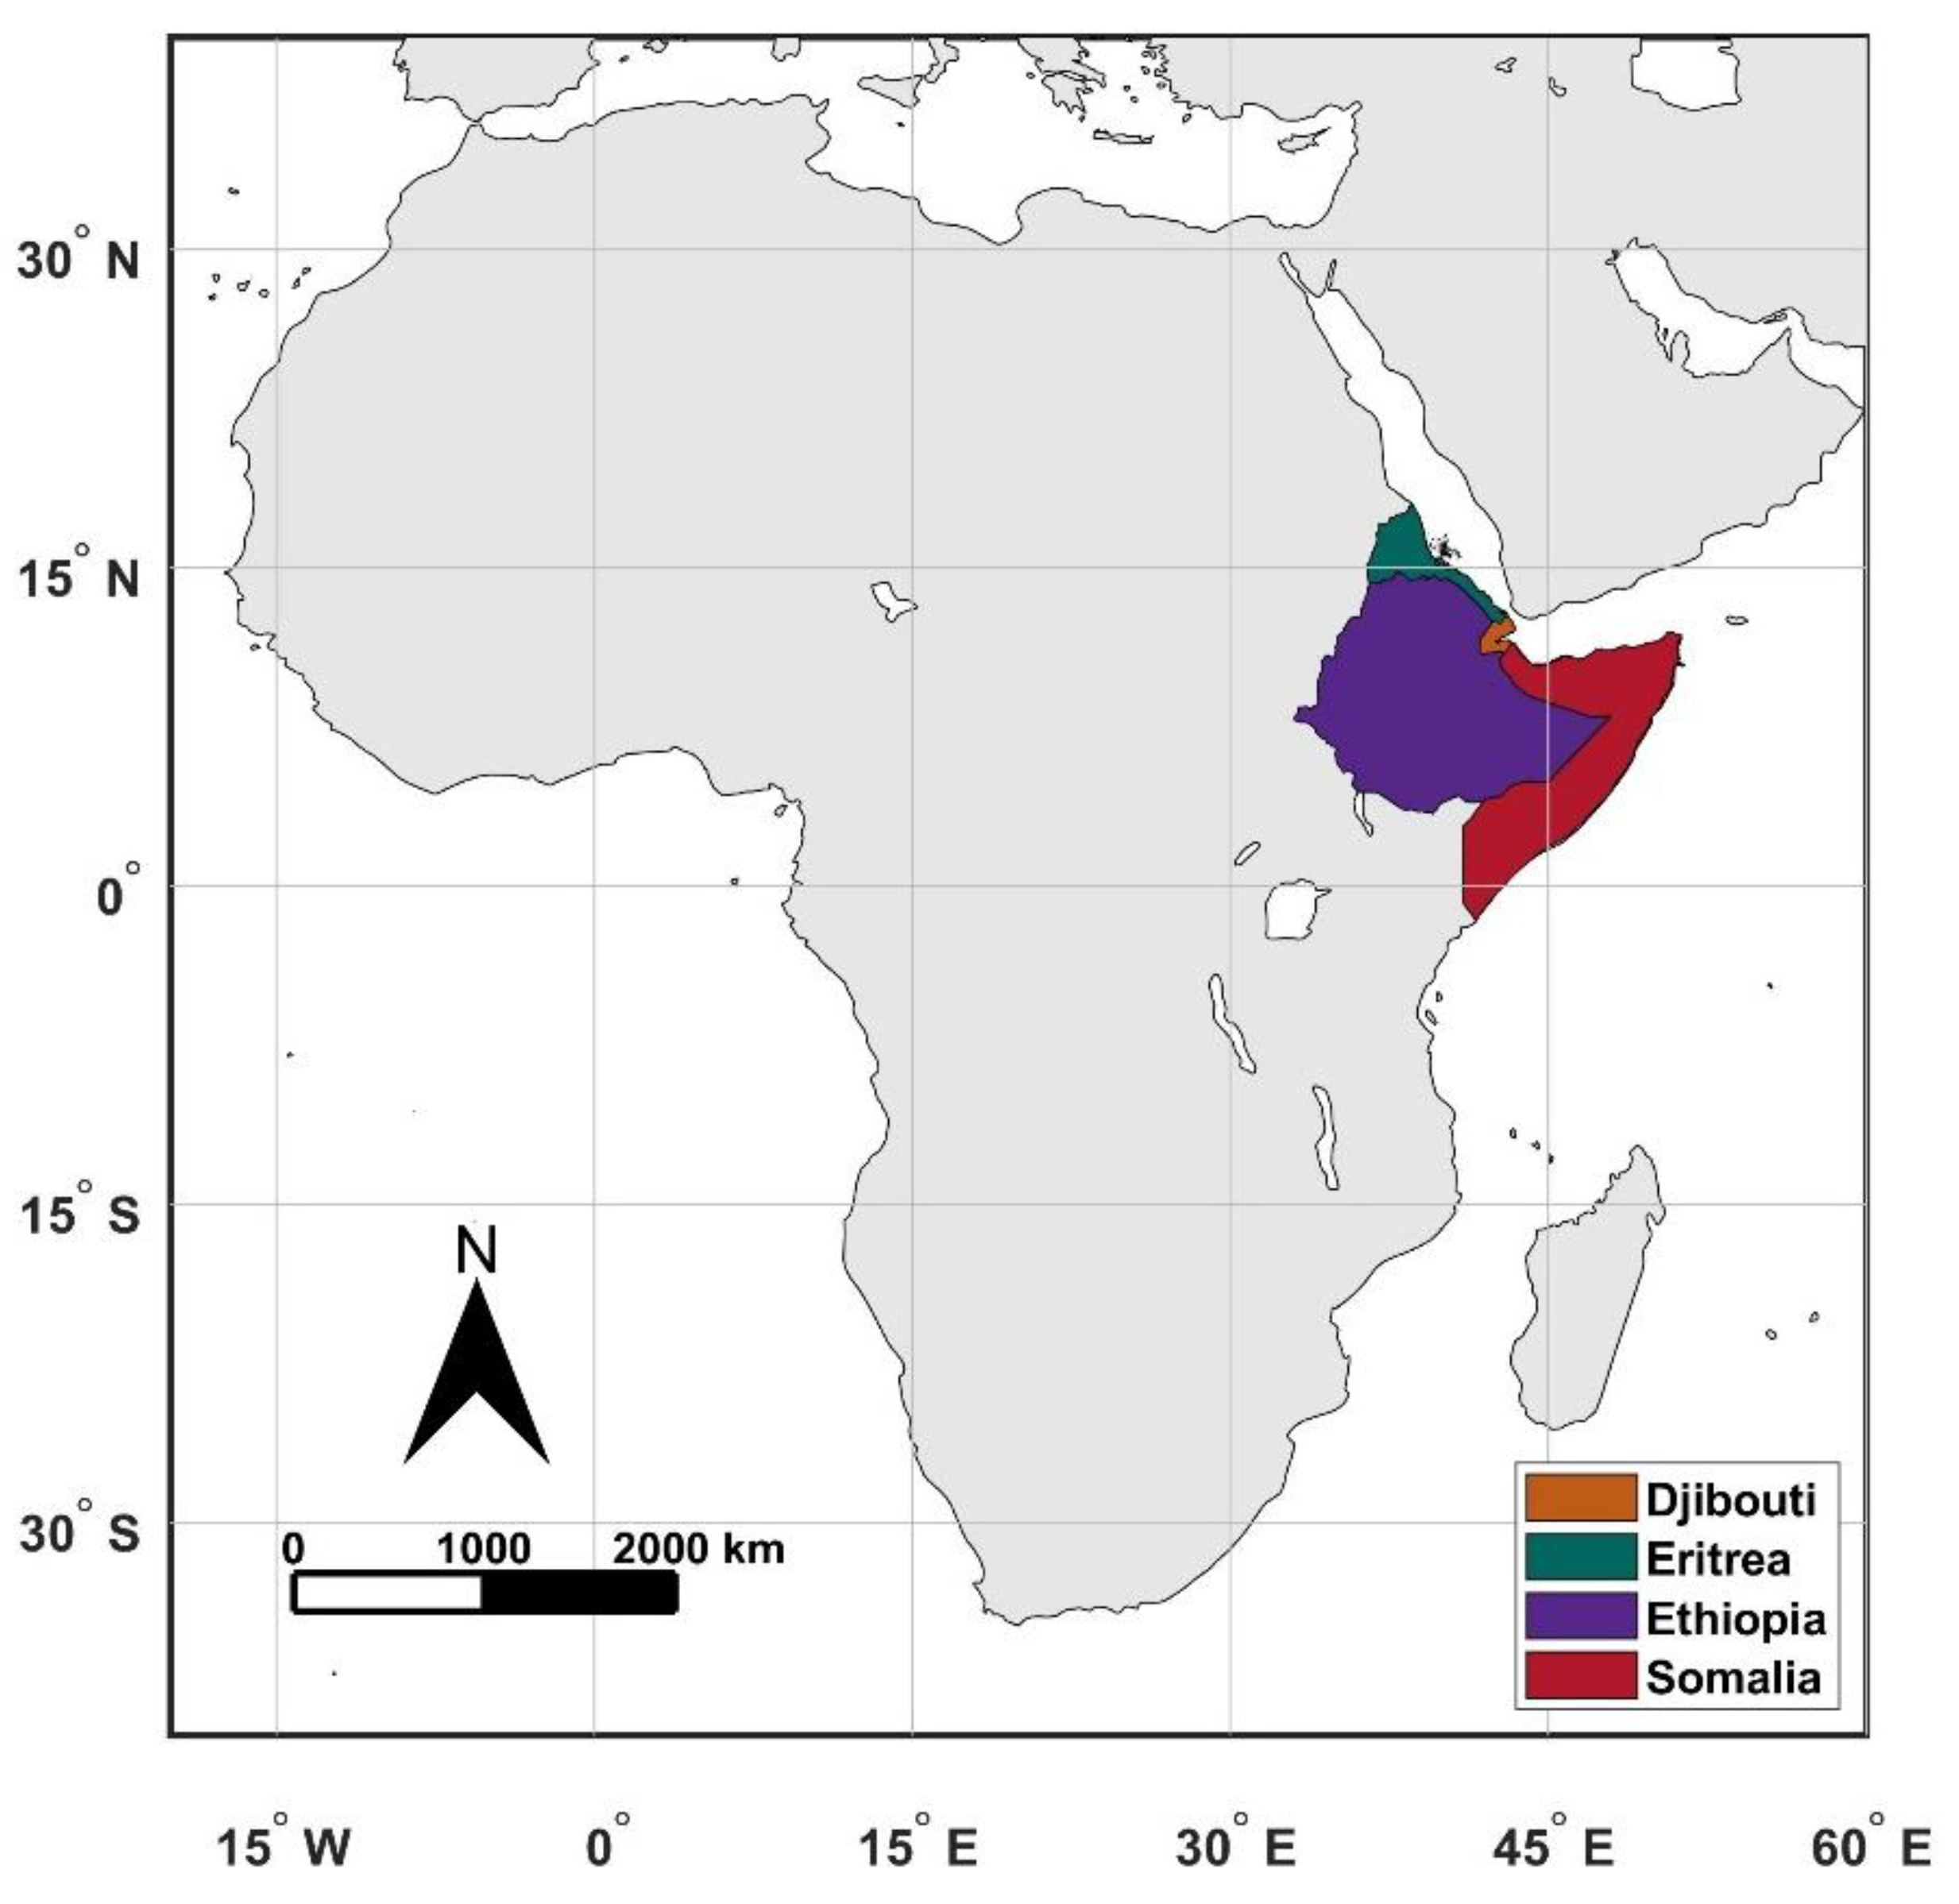
2.1. Study Area and Data

The Horn of Africa is a region in eastern Africa, including the countries of Ethiopia, Somalia, Djibouti, and Eritrea, as illustrated in Figure 1. In this region, agriculture is the primary source of livelihood, and crop production responds primarily to rainfall. There are two rainy seasons in most parts of the HOA, the “long rains” season from March to June, and the “short rains” season from October to November. During the past 30 years, rainfall in the HOA has declined in the “long rains season” [25], which has had significant impacts on agriculture. In Djibouti, the primary crops are vegetables, fruits, and palms. About 80% of its food requirements are imported, including all of its rice, wheat flour, and sugar. In Eritrea, sorghum, corn, millet, barley, wheat, and other crops are grown. In Ethiopia, agriculture is the foundation of the country’s economy. The five major cereals, including teff, wheat, maize, sorghum, and barley, account for about three-fourths of the total area cultivated in Ethiopia. In Somalia, crop production relies on the bimodal rainfall, with two main agricultural seasons, Gucrop production from April to June and Deyr crop production from October to December. Yearly harvest areas of major crops in Ethiopia, Somalia, Djibouti, and Eritrea were collected from the Food and Agriculture Organization Corporate Statistical Database (FAOSTAT) [26]. Figure 2 shows the annual average harvest areas of major crops in these countries from 2001 to 2017. On average, Ethiopia, Somalia, Eritrea, and Djibouti take up 91.10%, 4.70%, 4.12%, and 0.08% of total crop areas in the HOA, respectively.
For agricultural drought monitoring, understanding the crop calendar is essential to assess crop status during growth seasons. The Food and Agriculture Organization (FAO) of the United Nations provides a detailed crop calendar of major crops around the world [27]. Figure 3 shows the calendar of major crops in Eritrea, Ethiopia, and Somalia, the main agricultural areas in the HOA. The growing seasons vary by crop type and area. In Eritrea, the planting period for most crops is from June to July, and the growing season is from August to October. In Ethiopia, the planting period for most crops varies from February to August, while the growing season varies from March to October. In Somalia, the planting season for most crops in the Gucrop production area is April, with the exception of rice, and the main growing season is from May to July.
For crop monitoring, multiple MODIS data products from the years 2000–2017 over the HOA were downloaded from NASA Earth Science Data [28], including MODIS surface reflectance data, MODIS land surface temperature data, and MODIS land cover type data. Ancillary information about crop types was also collected for an integrated analysis. The following is a list of remote sensing data products that were collected and analyzed in this study:
  • Terra MODIS 8-day surface reflectance data (MOD09). The MOD09 products provide an estimate of surface reflectance at 500 m spatial resolution during an 8-day period based on the best possible observations;
  • Terra Land Surface Temperature/Emissivity 8-Day L3 Global 1km (MOD11). MOD11 data products contain day and nighttime land surface temperatures at 1 km spatial resolution, as well as emissivity. Daytime land surface temperature data were used in this study;
  • Terra/Aqua MODIS land cover type data (MCD12). MCD12 products provide data on global land cover type assessments and quality control information at 500 m spatial resolution.
For rainfall, TRMM 3B43 data products from the years 1998 to 2017 were downloaded from NASA Earth Science Data [28]. TRMM 3B43 products provide a best-estimate precipitation rate (in mm/hr) from the measurements of TRMM Precipitation Radar (PR), TRMM Microwave Image (TMI), and instruments onboard other satellites, including the Advanced Microwave Scanning Radiometer for Earth Observing Systems (AMSR-E), the Special Sensor Microwave Imager (SSMI), the Special Sensor Microwave Imager/Sounder (SSMIS), the Advanced Microwave Sounding Unit (AMSU), the Microwave Humidity Sounder (MHS), the microwave-adjusted merged geo-infrared (IR), and monthly accumulated Global Precipitation Climatology Centre (GPCC) rain gauge analysis [23,24]. TRMM 3B43 monthly data cover an area from 50 degrees south to 50 degrees north latitude at a spatial resolution of 0.25° [23,24].

2.2. Data Processing and Analysis

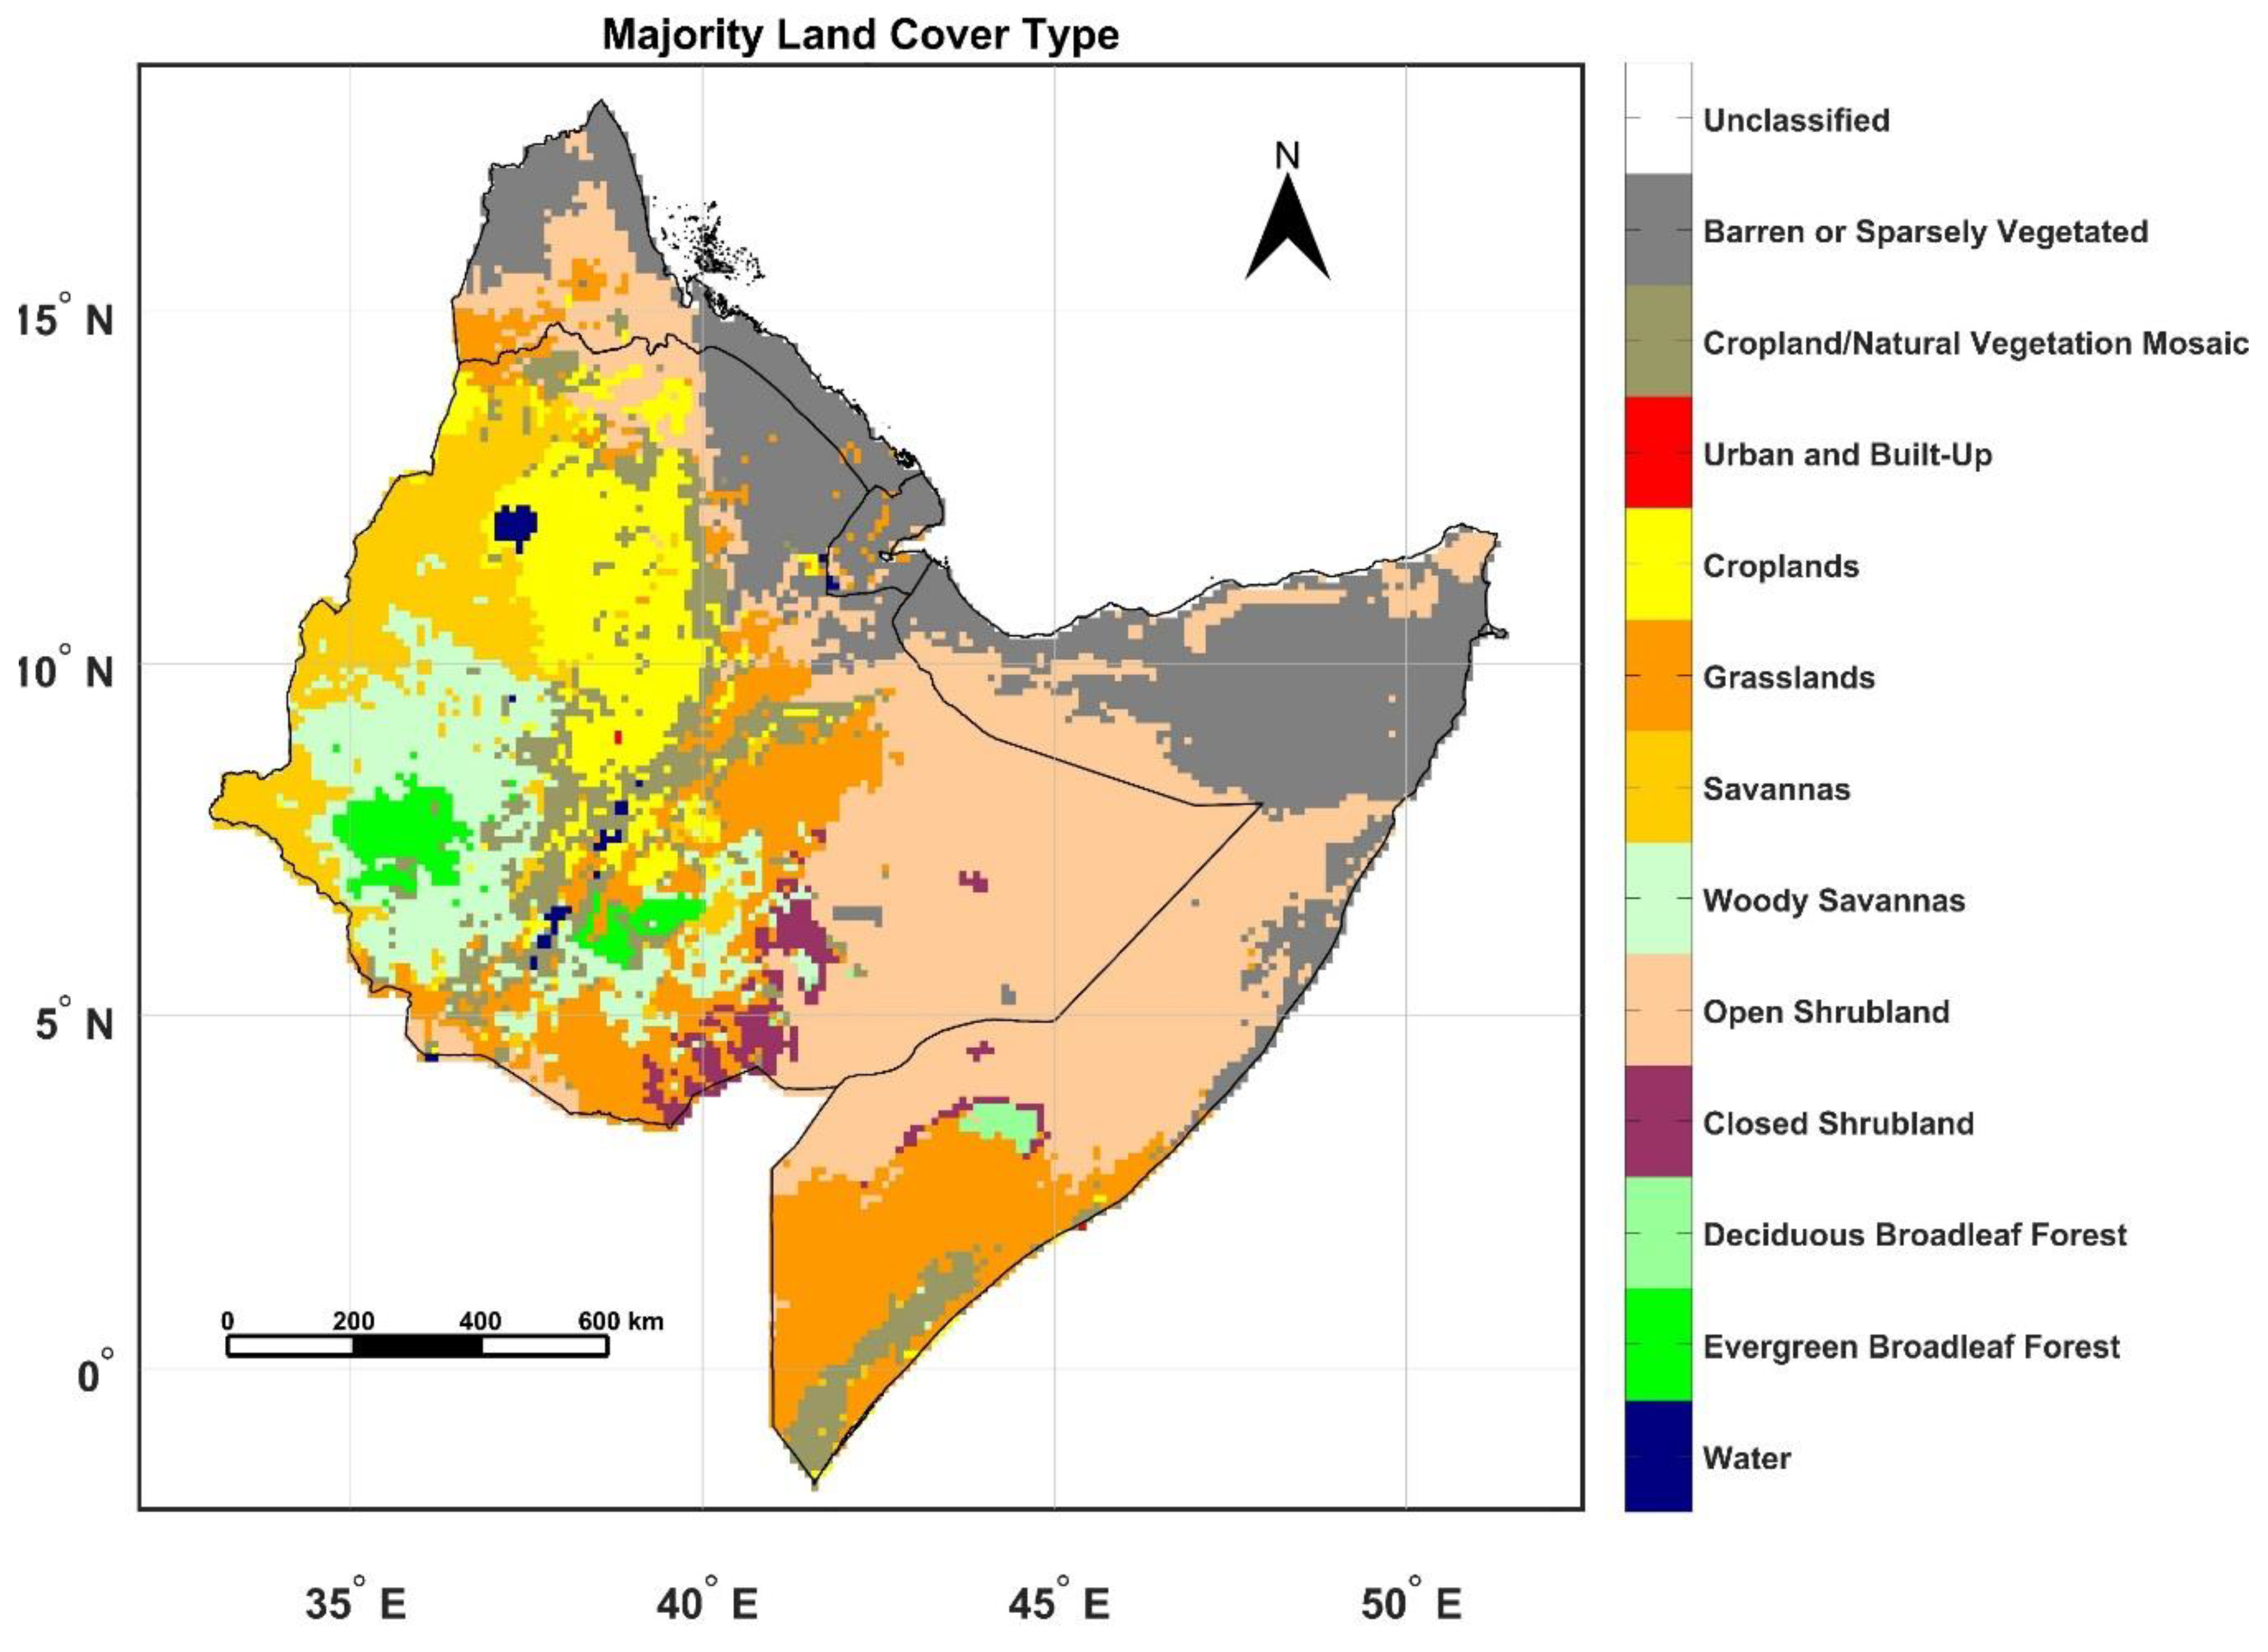
2.2.1. Land Cover Types

There are many land cover type data products available [29], and even the MODIS MCD12 products contain five land cover classification systems. A study by Meroni et al. showed that different remote sensing datasets could give different results [30]. Pérez-Hoyos et al. evaluated the performance of 9 land cover data products and demonstrated that MODIS International Geosphere–Biosphere Programme (IGBP) data are good for cropland monitoring over Africa [29], so the IGBP Type 1 classification in the MCD12 products was used to compose a majority land cover type map of the HOA, as illustrated in Figure 4. In this study, we focused on the agricultural area of the HOA. Croplands, cropland/natural vegetation mosaics, and grasslands were set as the agricultural area. The VCI, TCI, and VHI anomalies of the agricultural area were averaged to generate time series for temporal analysis.

2.2.2. MODIS Vegetation Indices

A study by Klisch and Atzberger indicated the noise issue of NDVI data [17] and used smoothing and filtering techniques to improve the quality of daily NDVI time series [17,31]. In this study, 8-day composite MODIS land surface reflectance data and land surface temperature data were used to calculate the VCI, TCI, and VHI. Each pixel contained the best possible observation during an 8-day period selected according to high observation coverage, low view angle, the absence of clouds, low aerosol loading, etc. We just filtered out invalid data, but did not smooth the data. Further smoothing may have improved the results, as indicated by Klisch and Atzberger [17].
The 8-day NDVI value for each pixel and 8-day temporal period was first calculated from MODIS surface reflectance data:
N D V I ( k ) = ρ n i r ( k )   ρ r e d ( k ) ρ n i r ( k ) +   ρ r e d ( k ) ,
where ρ n i r ( k ) and ρ r e d ( k ) are the surface reflectances of the MODIS near-infrared band (band 2) and red band (band 1) at the kth 8-day period, respectively.
The VCI for each pixel and 8-day period was calculated using current and historical NDVI values, i.e.,
V C I ( k ) = N D V I ( k ) N D V I m i n ( k ) N D V I m a x ( k ) N D V I m i n ( k ) ,
where NDVI(k) is the NDVI value of the kth 8-day period at each pixel, and N D V I m i n ( k ) and N D V I m a x ( k ) are the historical minimum and maximum NDVI values of the kth 8-day period at each pixel, respectively. The VCI value range is 0–100.
The TCI for each pixel and 8-day period was calculated using current and historical land surface temperature data values, i.e.,
T C I ( k ) = L S T m a x ( k ) L S T ( k ) L S T m a x ( k ) L S T m i n ( k ) ,
where LST(k) is the current land surface temperature at each pixel, and L S T m i n ( k ) and L S T m a x ( k ) are the historical minimum and maximum LST values of the kth 8-day period at each pixel, respectively. The TCI value range is 0–100.
The VHI for each pixel and 8-day period was calculated using VCI and TCI, i.e.,
V H I ( k ) = a V C I ( k ) + ( 1 a ) T C I ( k ) ,
where a is a weighting constant that was usually set to 0.5 [5]. The VHI value range is also 0–100.
For a trend analysis and detection of extreme weather and climate events, it is more reliable to use anomalies instead of absolute values. VCI, TCI, and VHI data from the 10 years from 2001 to 2010 were used to derive climatology for each 8-day period using the 10-year mean, and then anomalies were calculated by subtracting climatology. The steps of the MODIS data processing were:
(1)
For each 8-day period during year 2000–2017, use the MODIS Reprojection Tool (MRT) to reproject and resample MODIS surface reflectance data to the study area at 500 m spatial resolution, and then calculate the NDVI based on Equation (1);
(2)
For each 8-day period during years 2000–2017, use the MODIS Reprojection Tool (MRT) to reproject and resample MODIS land surface temperature data (LST) to the study area at 500 m resolution;
(3)
For the study area, use the 2001–2010 10-year data to calculate the maximum and minimum values of NDVI (NDVImax and NDVImin) and the maximum and minimum values of land surface temperature (LSTmax and LSTmin) for each pixel and each 8-day period;
(4)
For each 8-day period during years 2000–2017, calculate the VCI using Equation (2);
(5)
For each 8-day period during years 2000–2017, calculate the TCI using Equation (3);
(6)
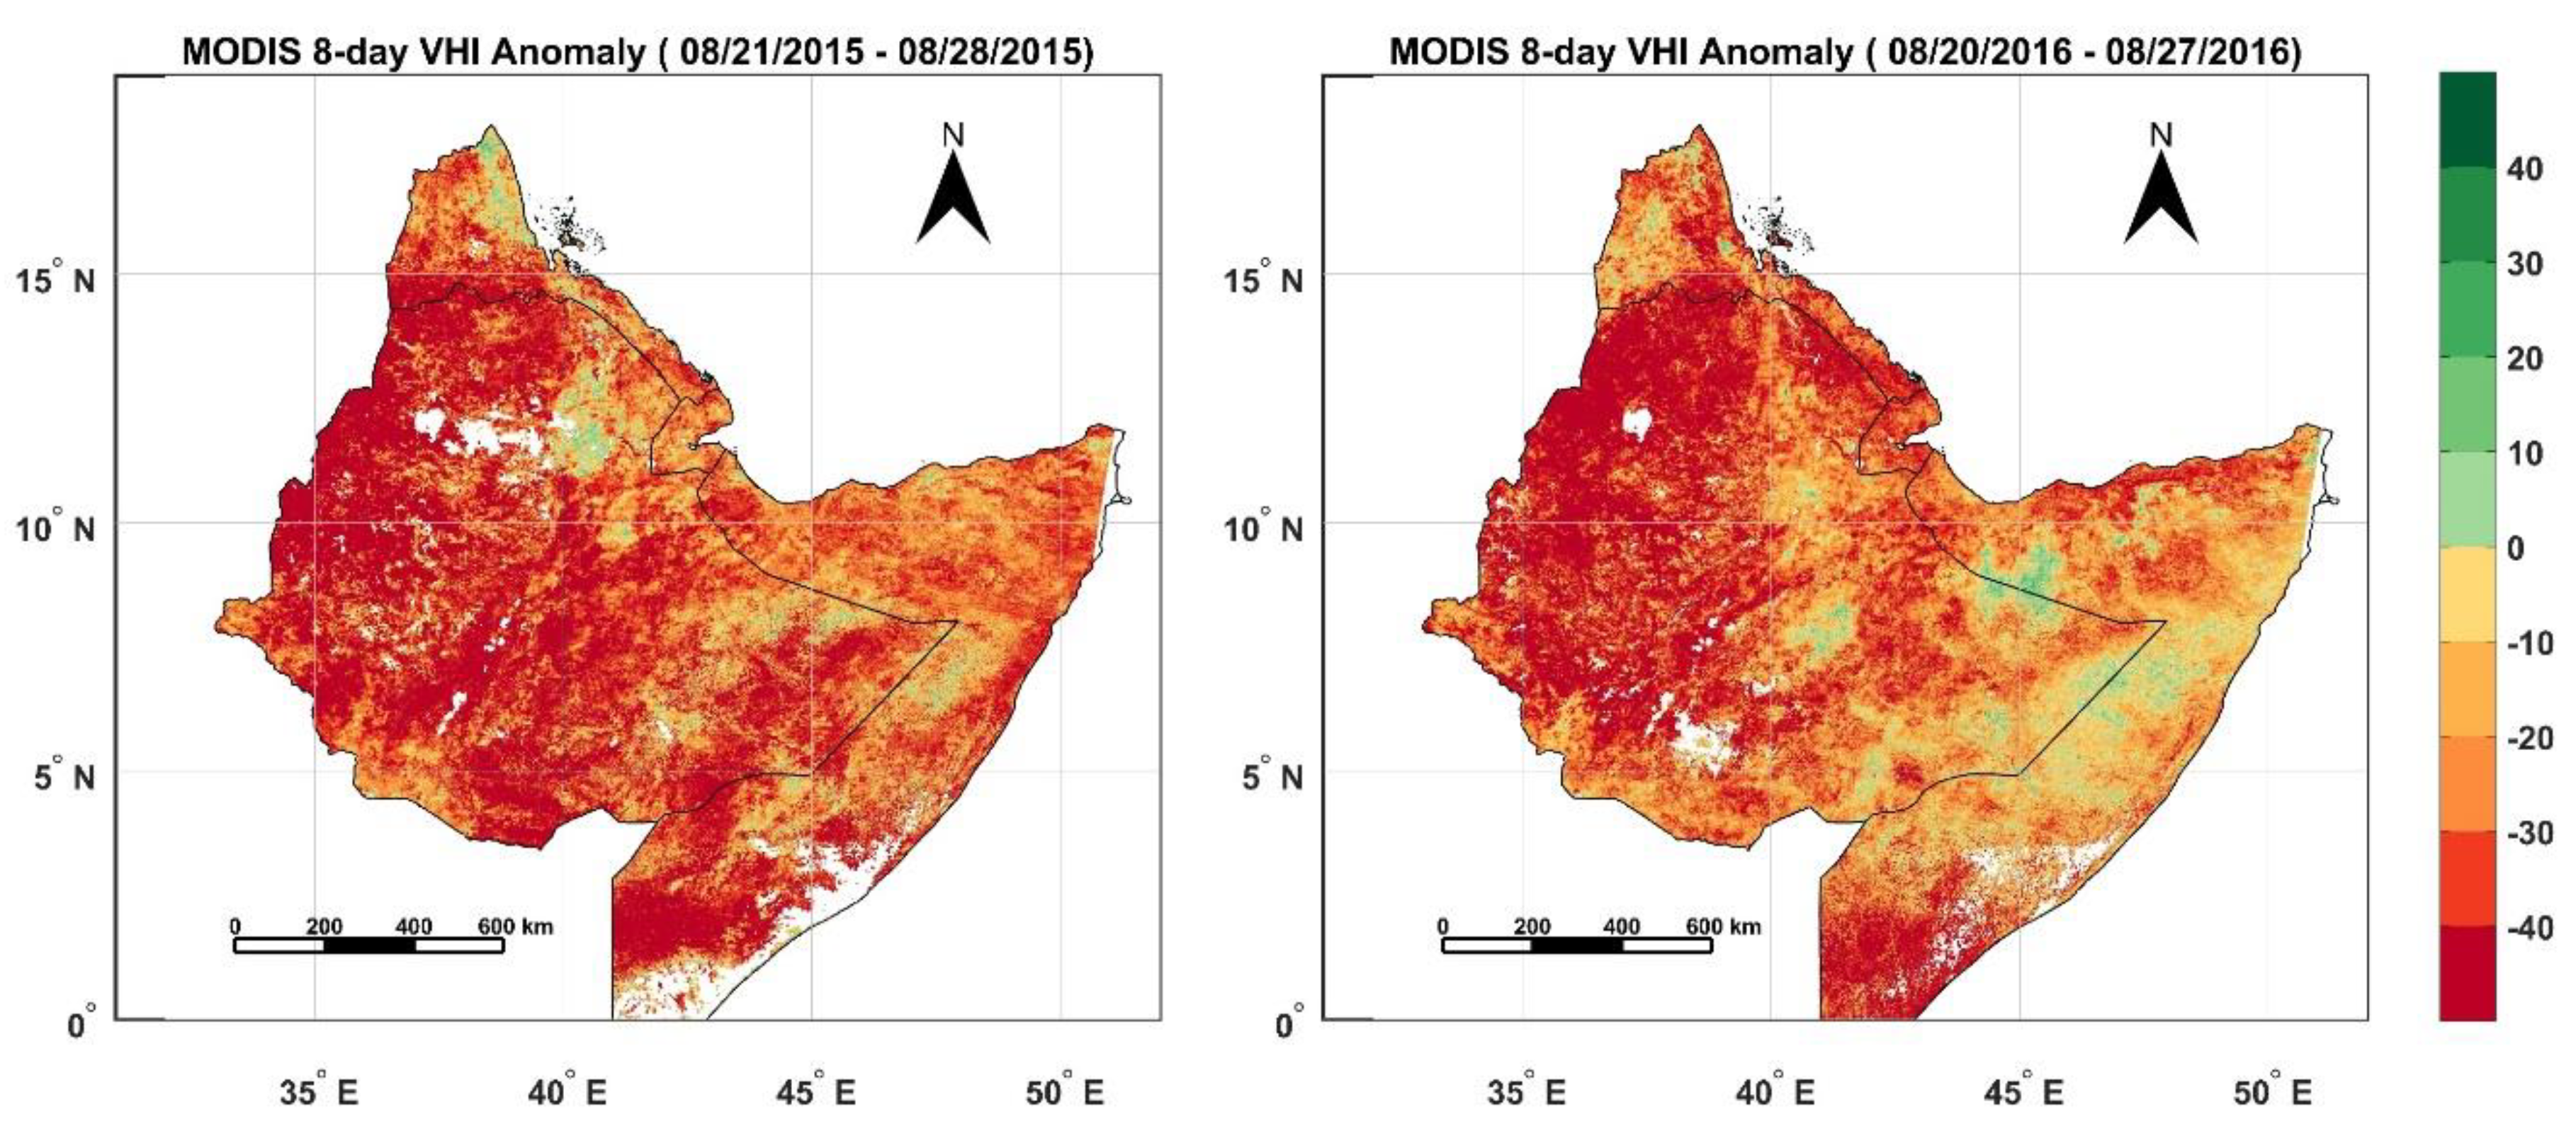
Calculate the VHI using Equation (4) with VCI and TCI data;
(7)
Use the 10 years from 2001 to 2010 as normal to get VCI, TCI, and VHI climatology for each of the 8-day periods;
(8)
Generate 8-day VCI anomaly, TCI anomaly, and VHI anomaly data at 1 km spatial resolution and 8-day temporal resolution by subtracting VCI, TCI, and VHI data from corresponding climatology;
(9)
In addition, reproject and sample MODIS land cover type data over the study area at the same resolution (500 m) with the VCI, TCI, and VHI. The land cover type data are used to generate a spatial mask of the agricultural area for analysis of the VCI, TCI, and VHI;
(10)
Subset VCI, TCI, and VHI anomaly data using the mask for the agricultural area generated in step 9, and then conduct a spatial and temporal analysis.
For a quantitative comparison to the precipitation data, the 8-day VHI anomaly data were composed with monthly VHI time series using the weighted average with the number of days. Suppose a month was covered by M 8-day periods, with { m i } i = 1 M as the number of days in the month for each period. Then the monthly VHI anomaly was calculated with the following equation:
V H I a n o m a l y m o n t h l y ( m ) = i = 1 M m i V H I a n o m a l y 8 d a y ( i ) i = 1 M m i .

2.2.3. Rainfall Data

The TRMM 3B43 rainfall data were also subset to the HOA region using a spatial mask to analyze the spatial patterns and the temporal trend during the past decades. The steps for TRMM 3B43 data processing are:
(1)
Generate a spatial mask at 0.25° spatial resolution for HOA;
(2)
Subset the TRMM 3B43 monthly rainfall data from years 1998 and 2017 to the HOA area;
(3)
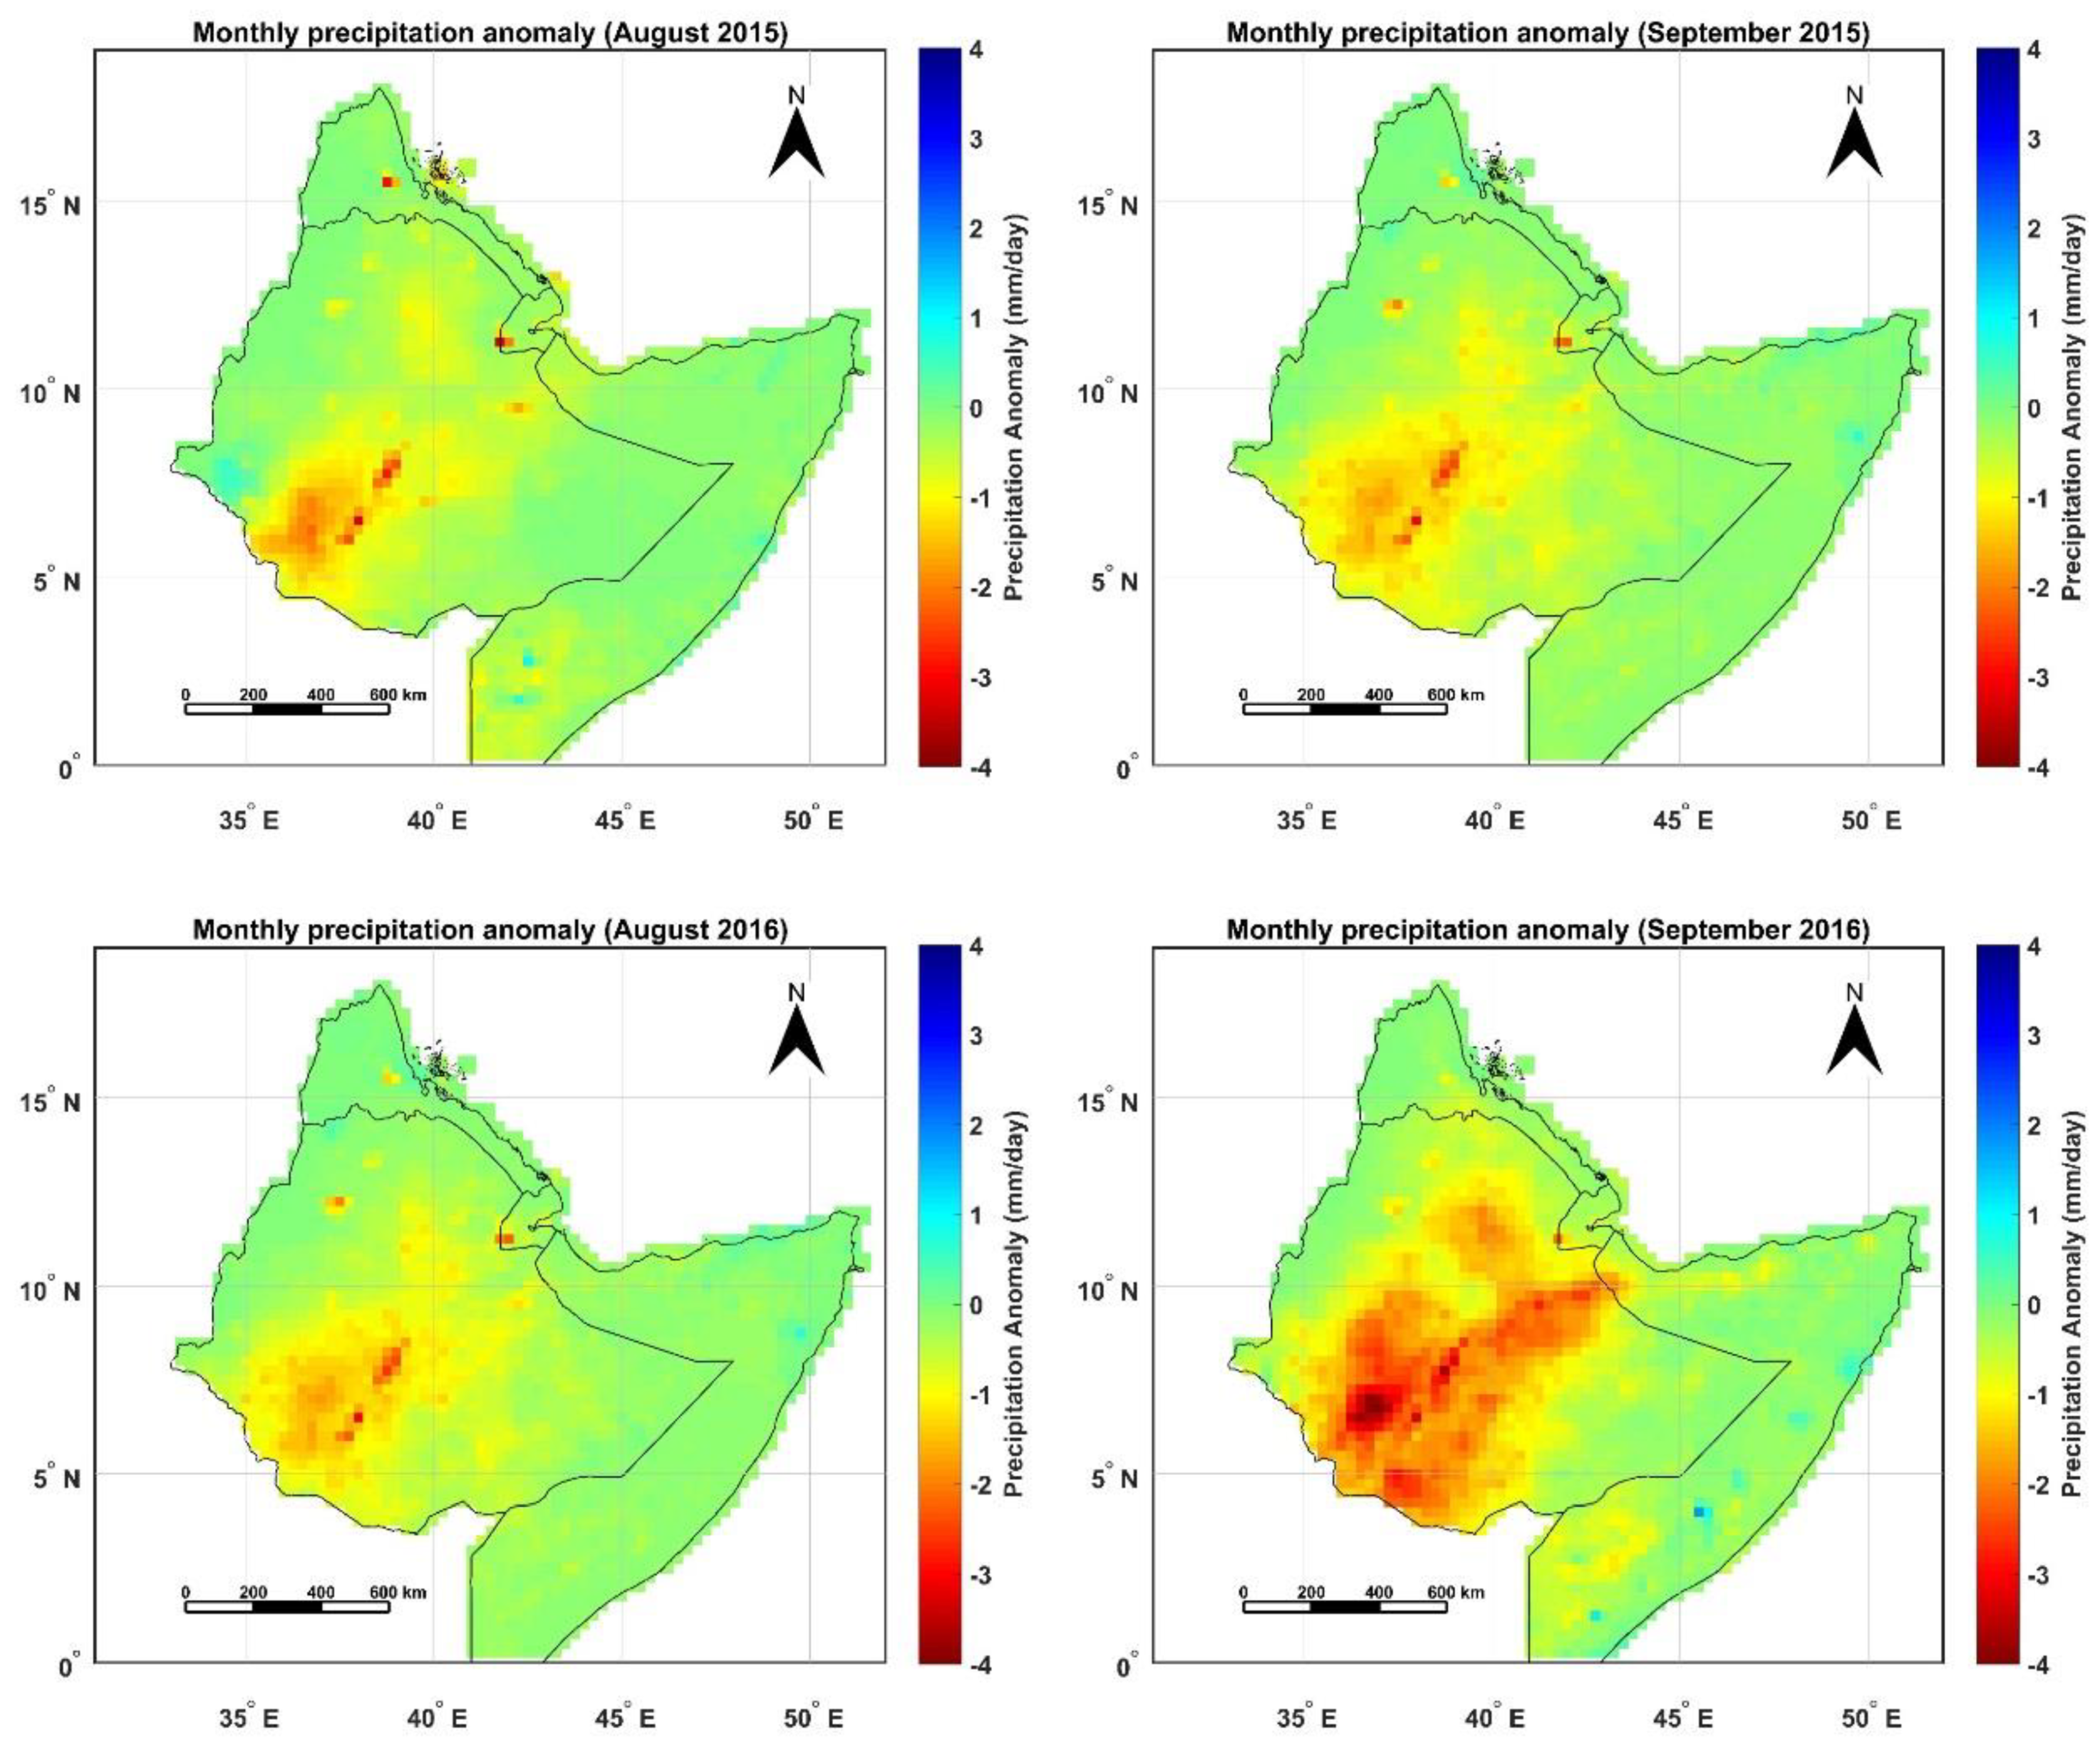
Generate precipitation climatology using the data from years 2001–2010, and then get monthly anomalies of precipitations in the HOA;
(4)
Analyze the spatial patterns and temporal trends of precipitation during crop growth seasons.

3. Results

3.1. The 2015–2016 Extreme Drought Event in the HOA

There is a significant association between drought in the HOA and the El Niño-Southern Oscillation (ENSO) events [32]. The powerful 2015–2016 El Niño event ran from October 2014 to June 2016, followed by a La Niña from July 2016 to January 2017. The events caused extreme drought in Eastern Africa from the second half of 2015, and the drought conditions extended to year 2017. Figure 5 shows the precipitation anomalies during August and September in 2015 and 2016. The rainfalls during these periods in the western HOA, especially the agricultural areas of Ethiopia, were far lower than the 10-year average from 2001 to 2010, which demonstrated extreme drought conditions. According to the crop calendar of Ethiopia (Figure 3), August is the growth season for major crops except cereals, and the drought had significant impacts on crop production in both years, as illustrated in Figure 6 (the VHI anomalies of the HOA in late August 2015 and 2016). The significantly negative anomalies of the VHI in most of the HOA region during both years indicated the impacts of the drought event, especially in the agricultural area of Ethiopia.

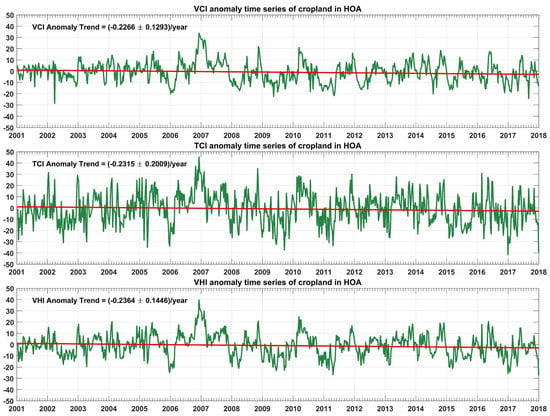
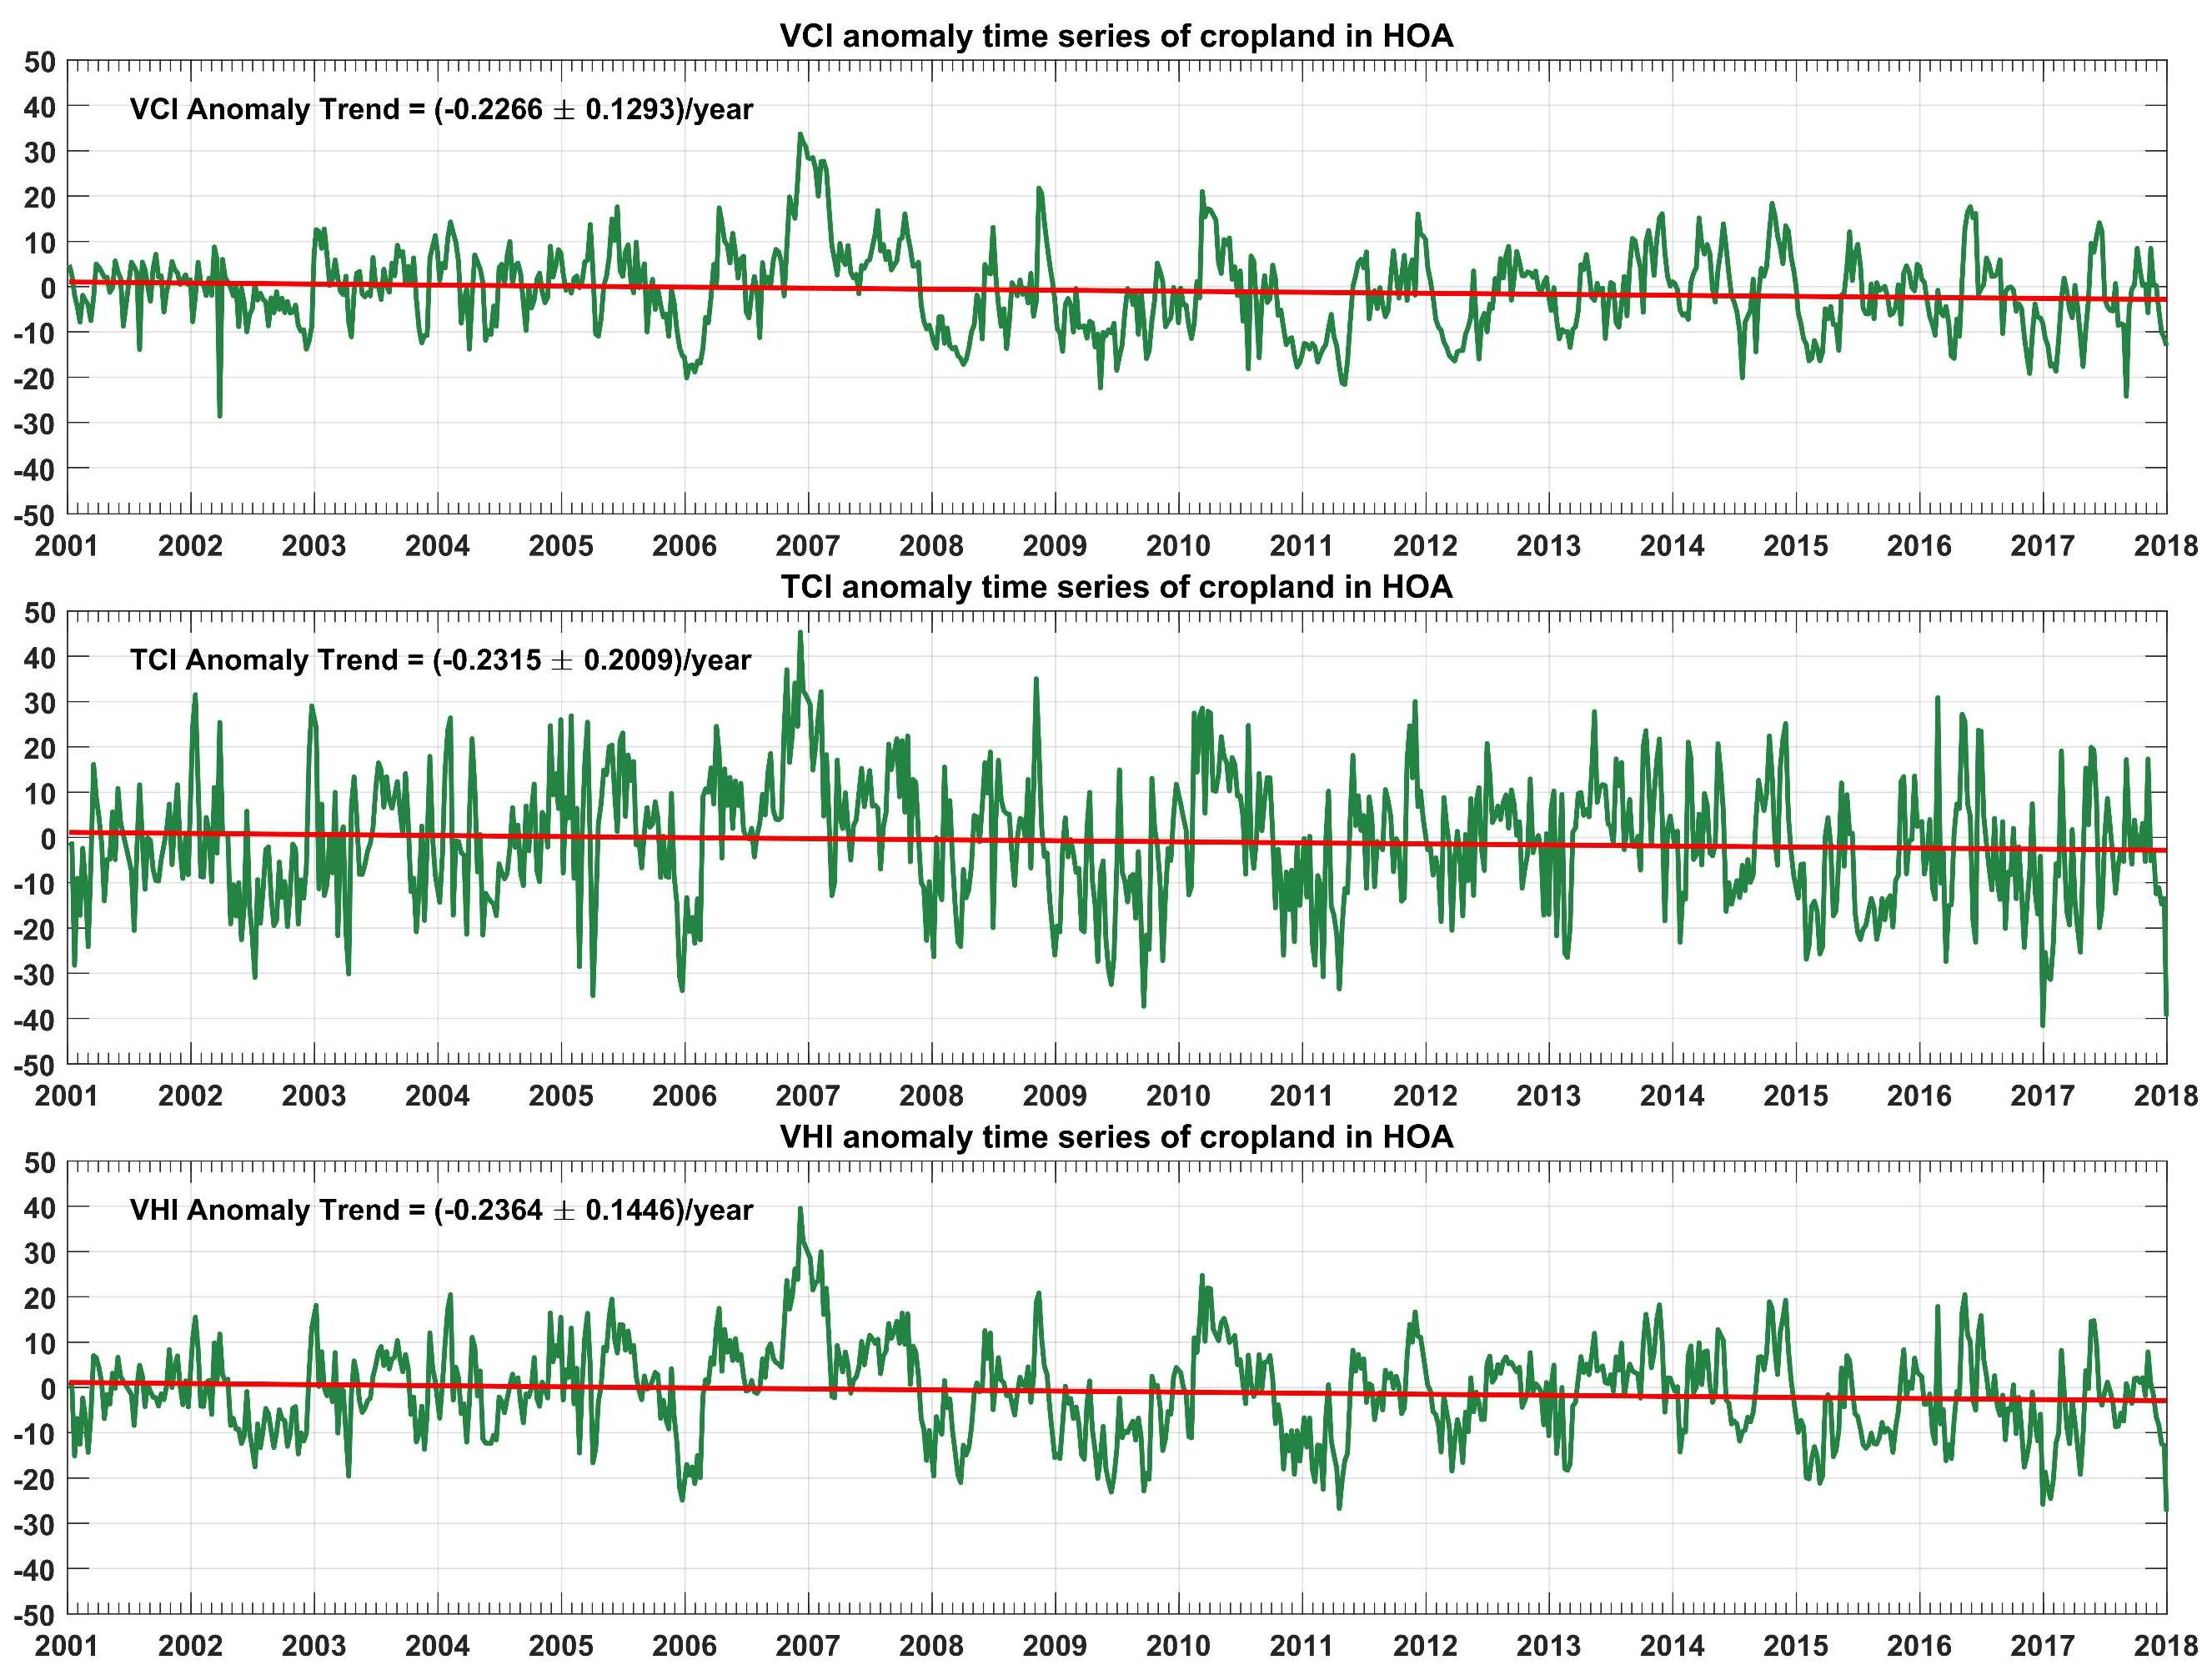
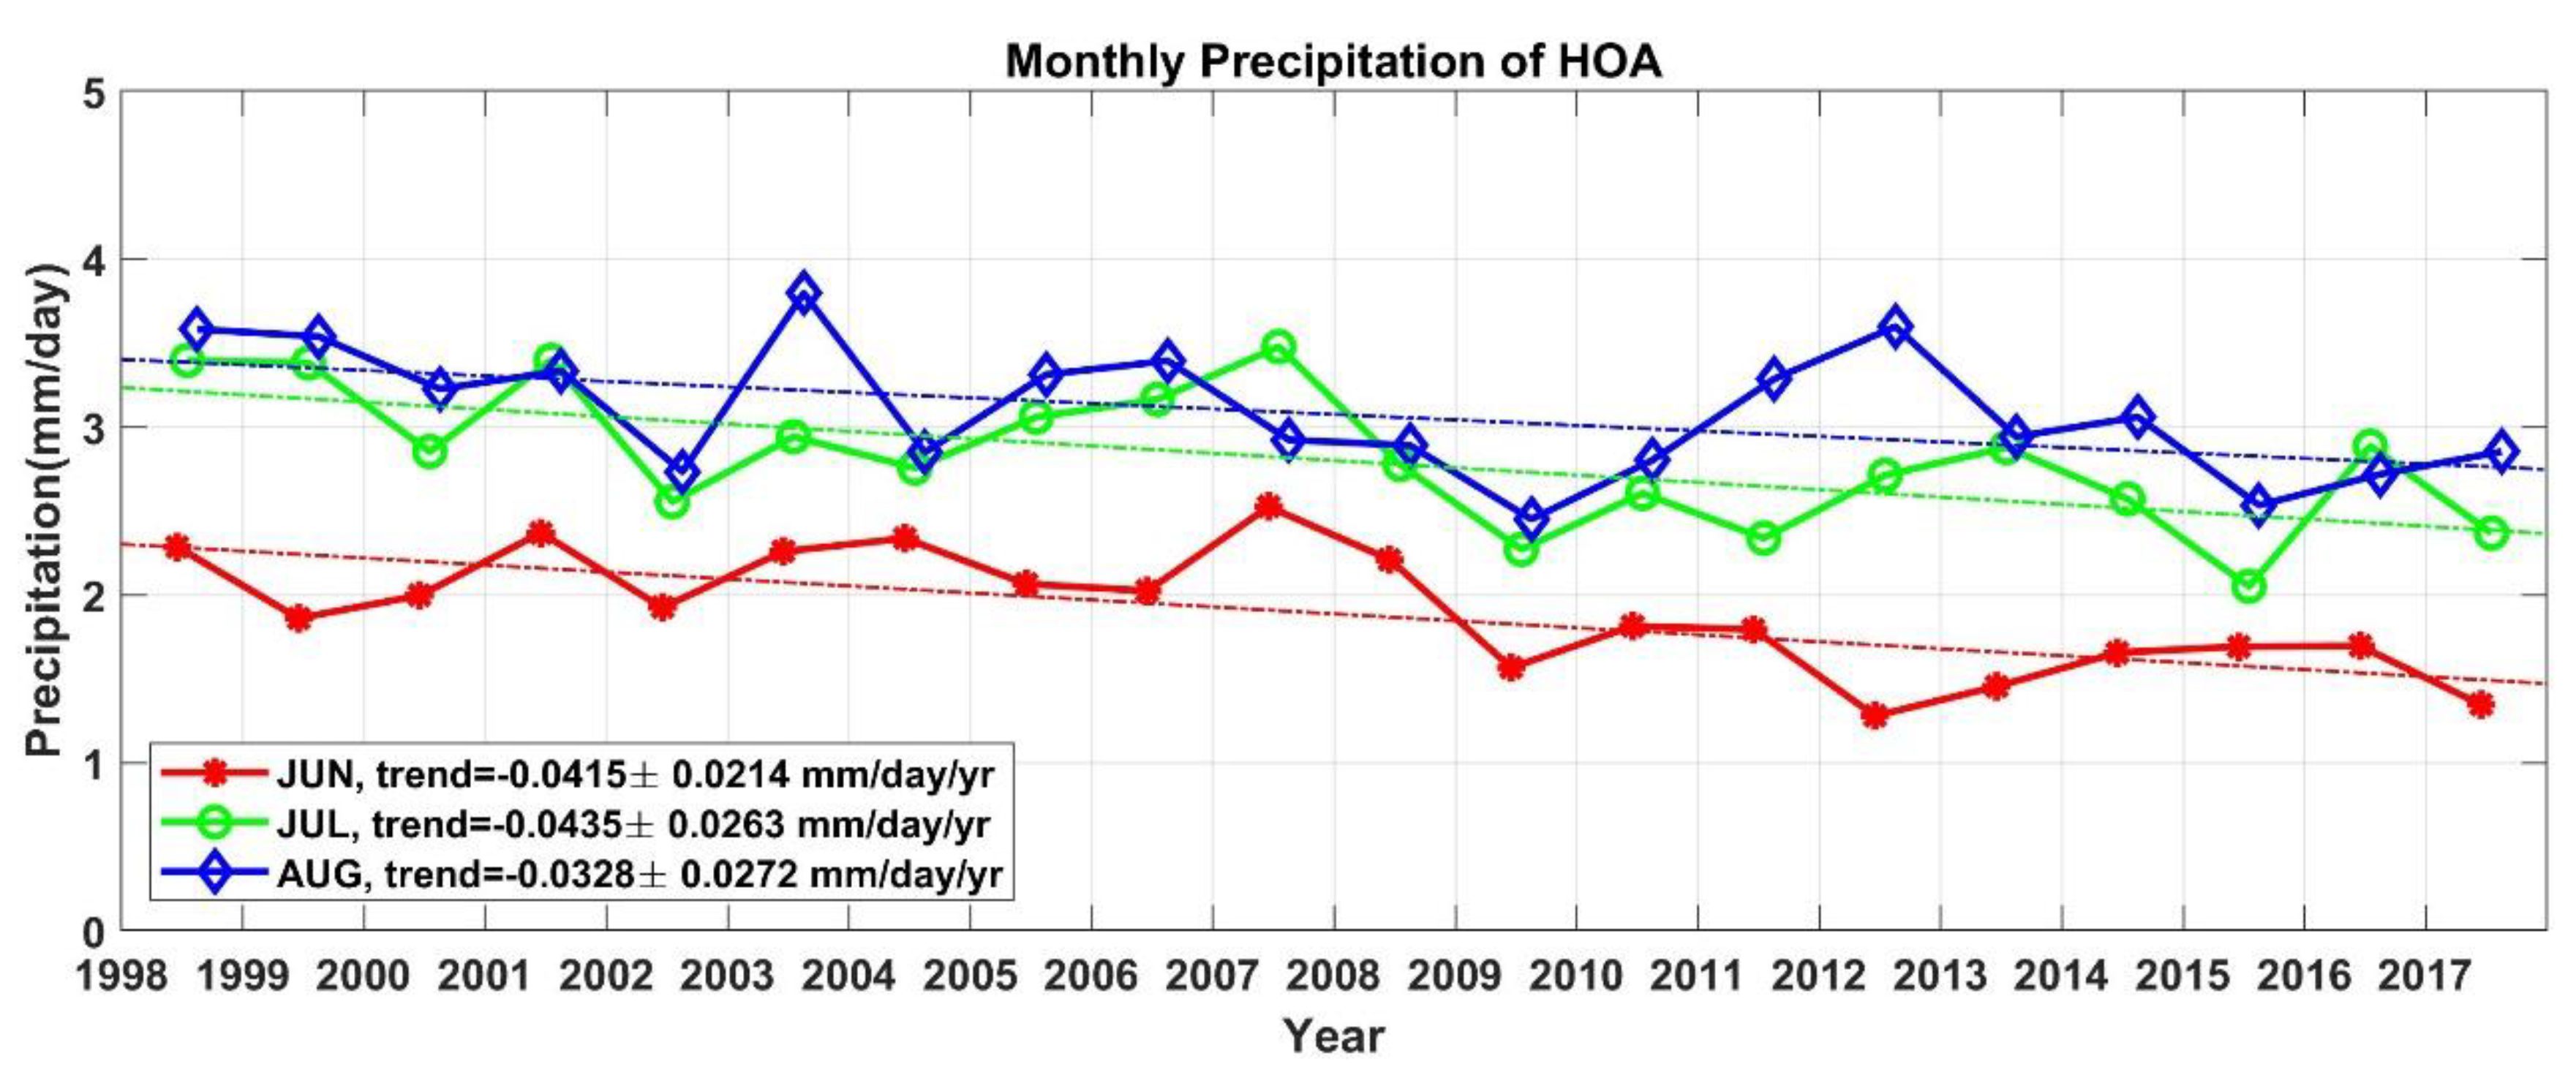
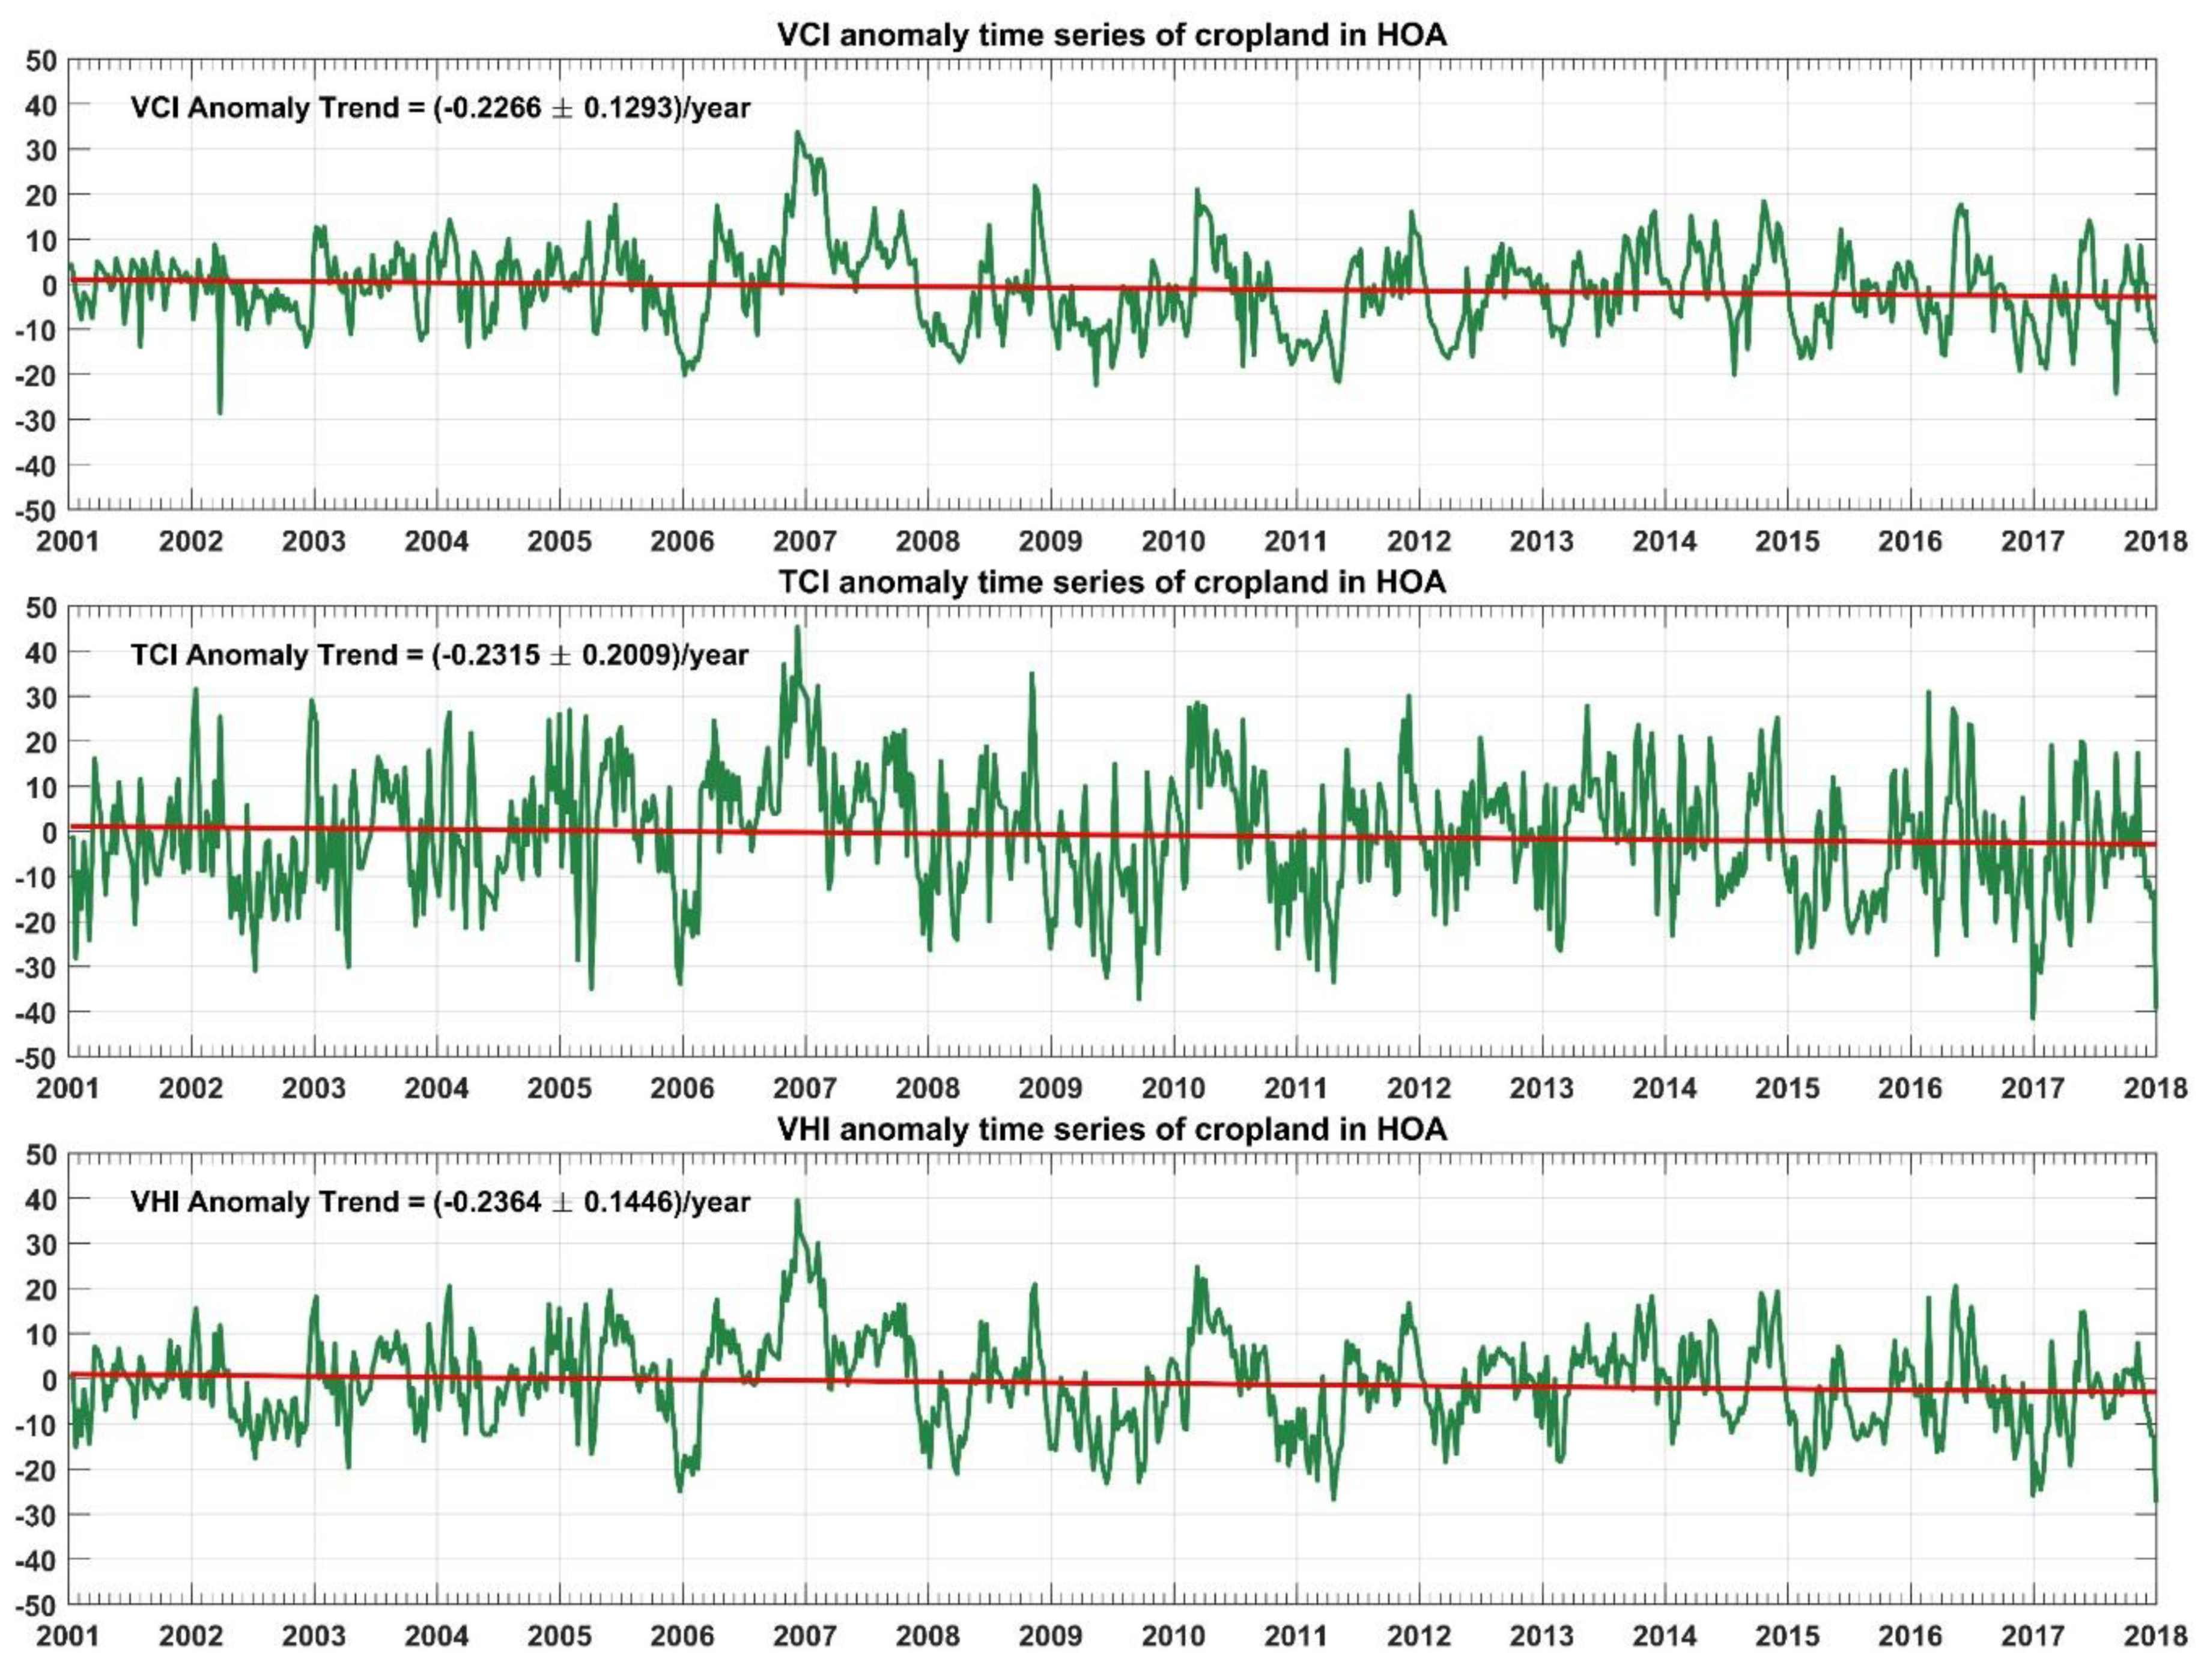
3.2. Temporal Trends of Rainfall and Vegetation Indices in Crop Growing Season

Since agriculture in the HOA depends primarily on rainfall, precipitation during crop planting and growing seasons is critical. Figure 7 shows the time series of monthly rainfalls in June, July, and August from 1998 to 2017. Although the precipitation amounts of these months fluctuated from year to year, the decreasing trends were statistically significant. Especially in June, the precipitation was generally above or around 2 mm/day before 2009, but has been consistently below 2 mm/day since 2009. As summarized in Table 1 (with a 95% confidence interval), the rainfall trends from 1998 to 2017 were negative during the critical periods of major crops. The VCI, TCI, and VHI were investigated to assess the impacts on agriculture. Figure 8 shows VCI, TCI, and VHI anomaly time series of the agricultural area in the HOA and indicates the decreasing trends of all of these three indices for crop status. The results of the statistical analysis are summarized in Table 2. The VCI anomaly had a trend of −0.2266/year, with a range of [−0.3559, −0.0973]/year at a 95% confidence level, and the p-value was 0.0006, which indicates that the VCI decreased at a statistically significant rate over the past 17 years. This illustrates the long-term trend of crop stress in the HOA. The TCI anomaly had a decreasing trend of −0.2315/year, with a range of [−0.4325, −0.0306]/year, and the p-value was 0.024, which means that the TCI also decreased at a statistically significant rate over the past 17 years. Based on the definition of the TCI, it can be concluded that the surface temperature of the agricultural area in the HOA is increasing. Finally, the VHI, a combined indicator of vegetation health, also showed a decreasing trend of −0.2364/year, with a range of [−0.3810, −0.0918]/year at a 95% confidence level. These three indices demonstrate the impacts of drought during the past decades and imply severe food security conditions in the HOA region.

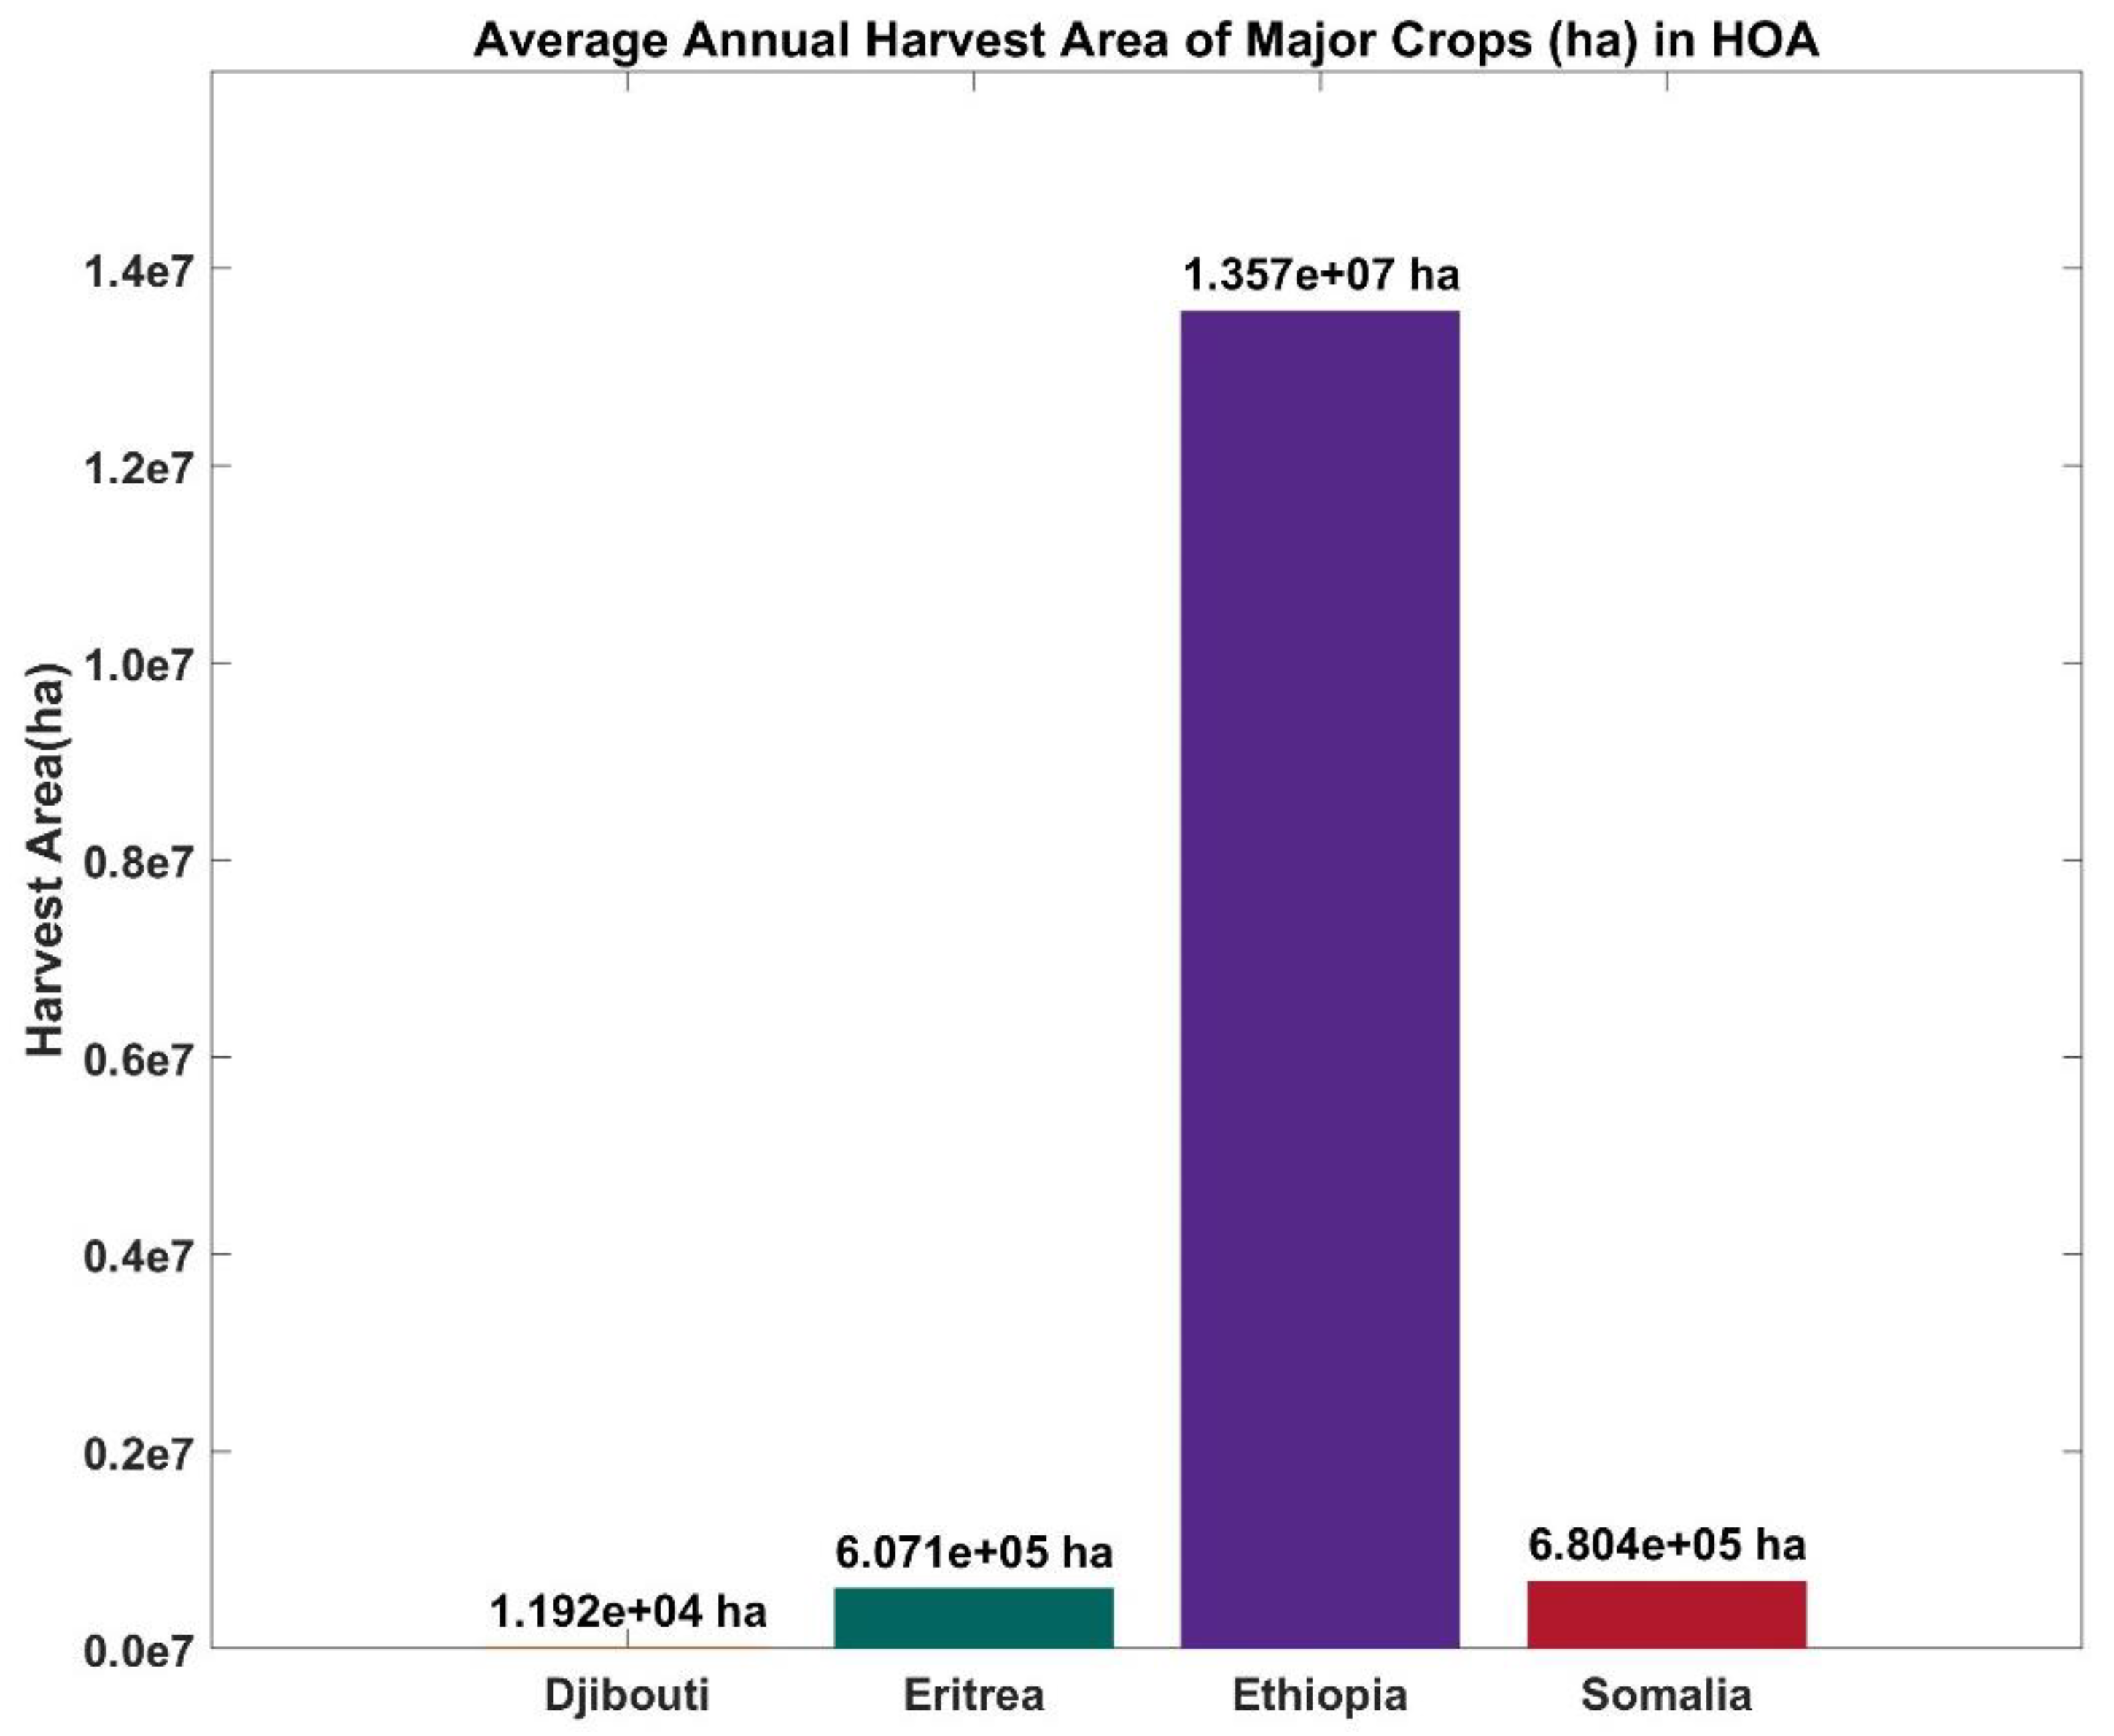
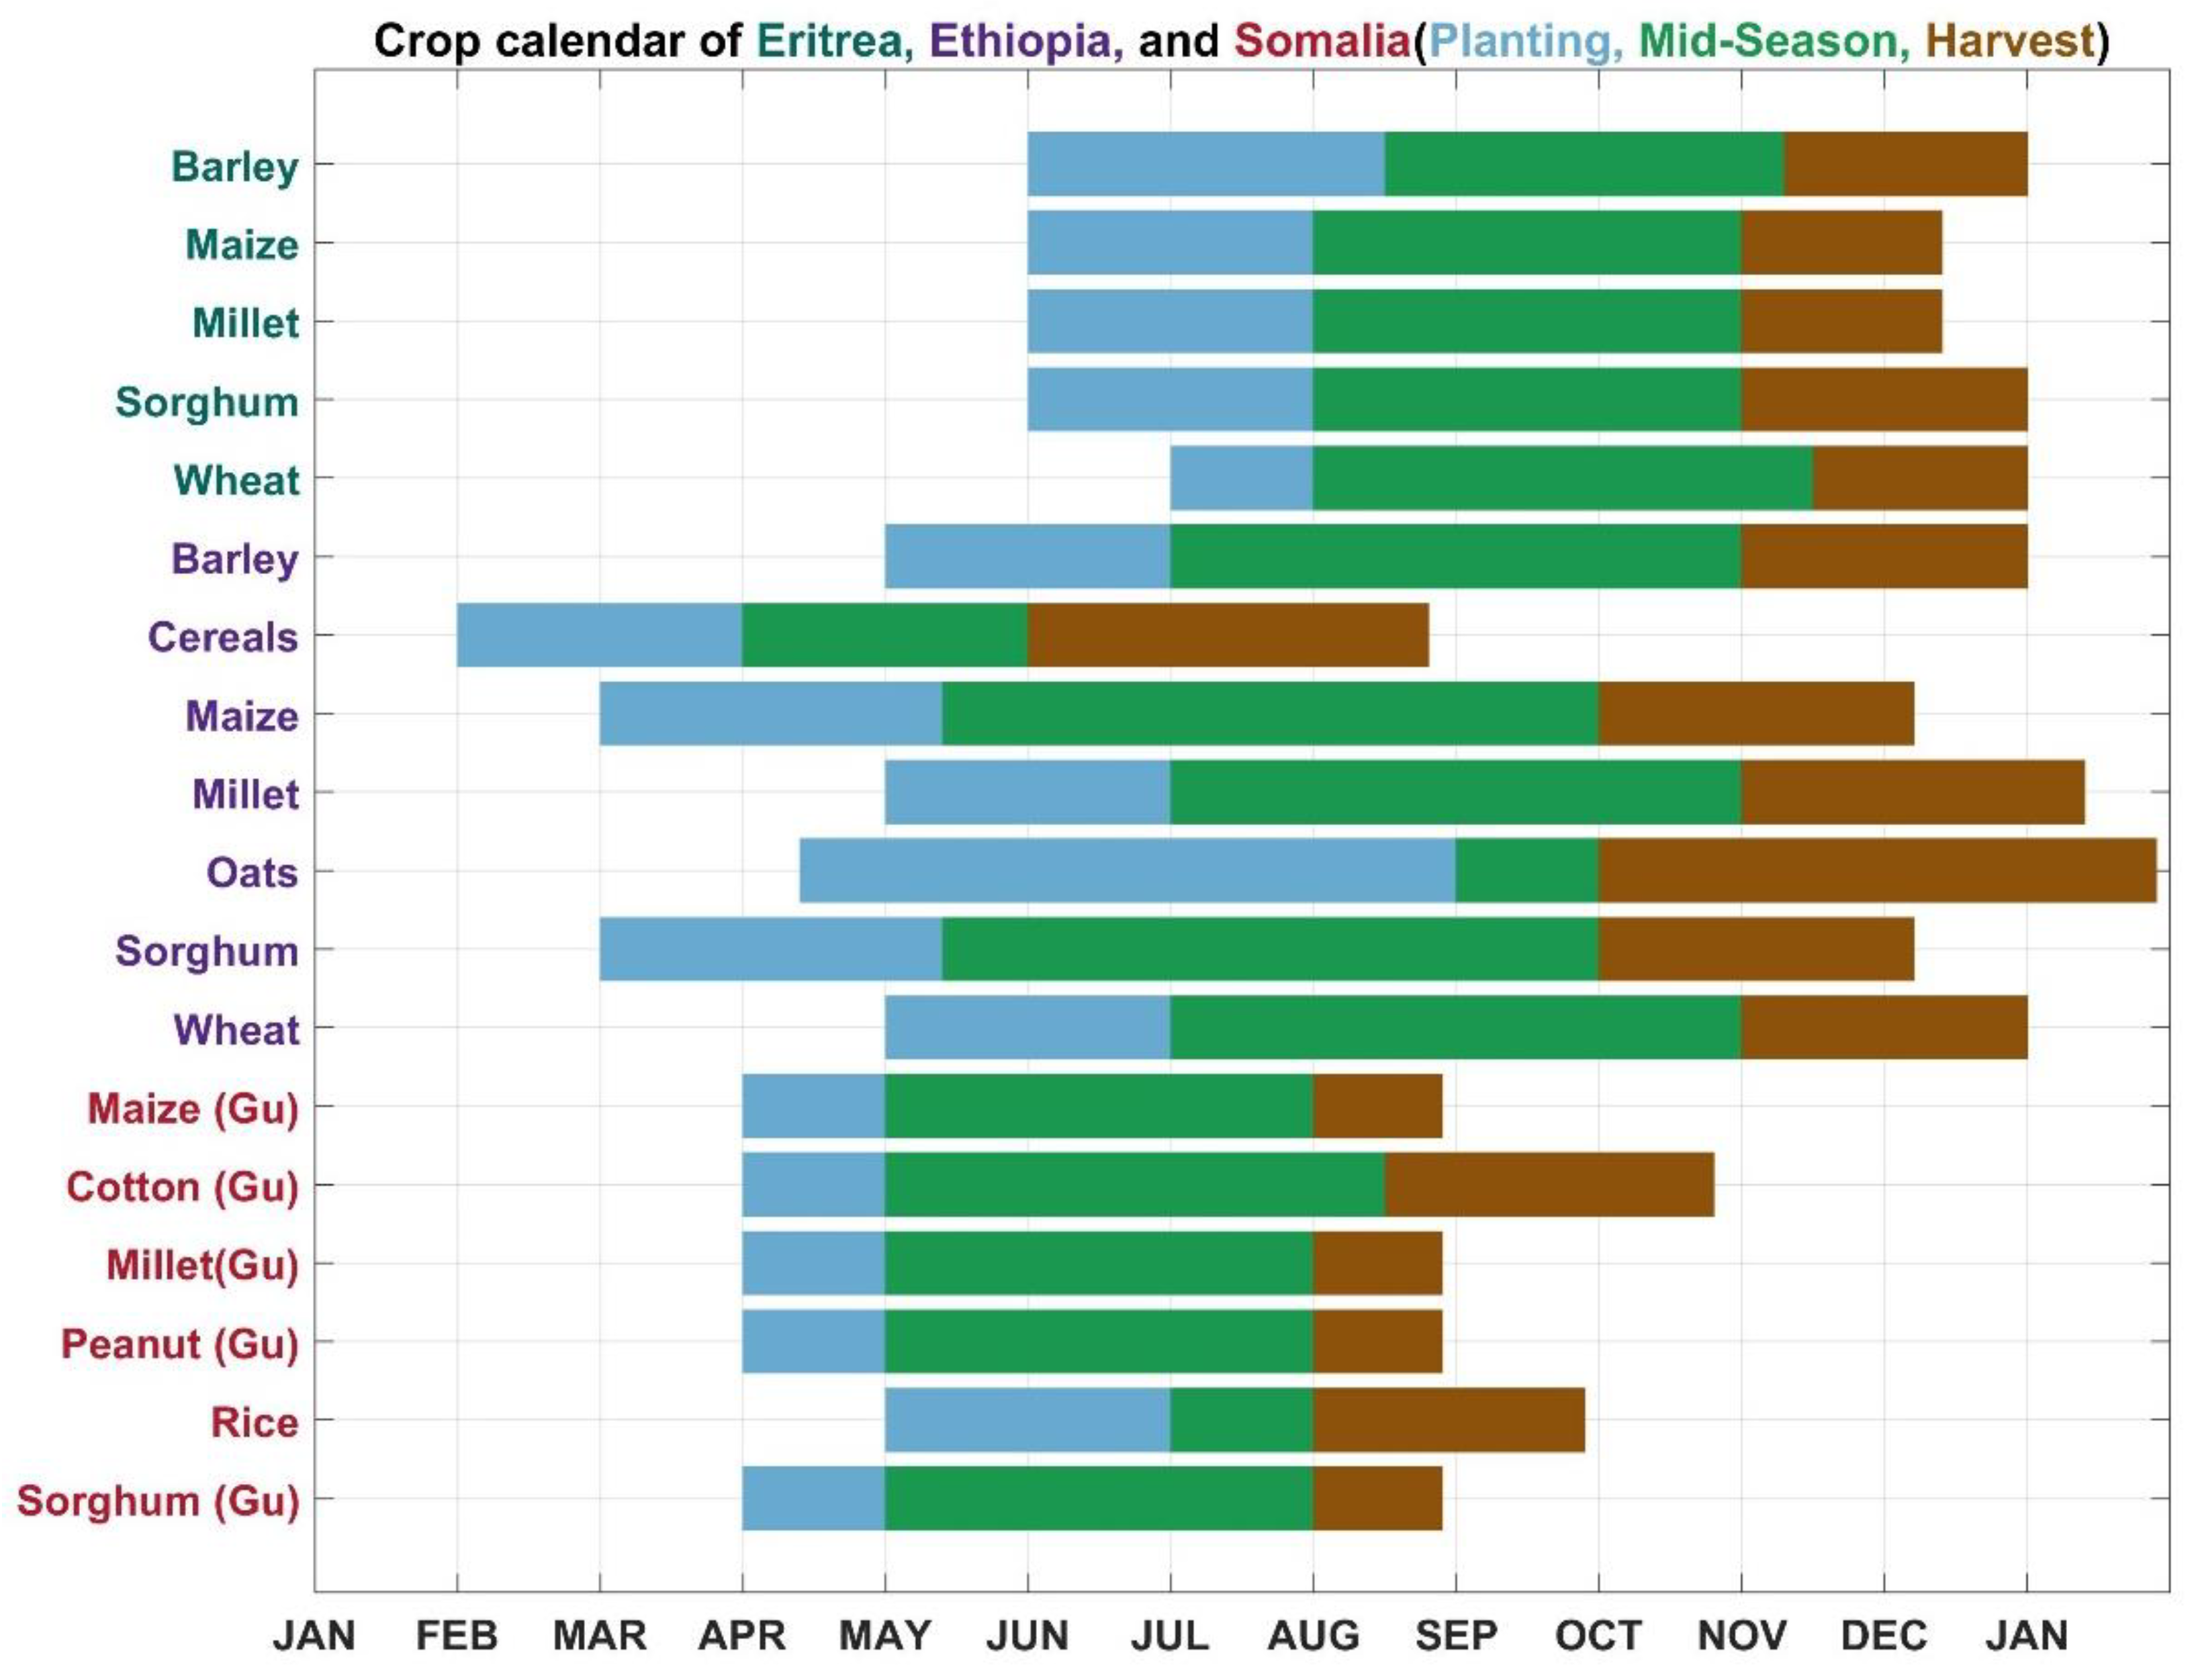
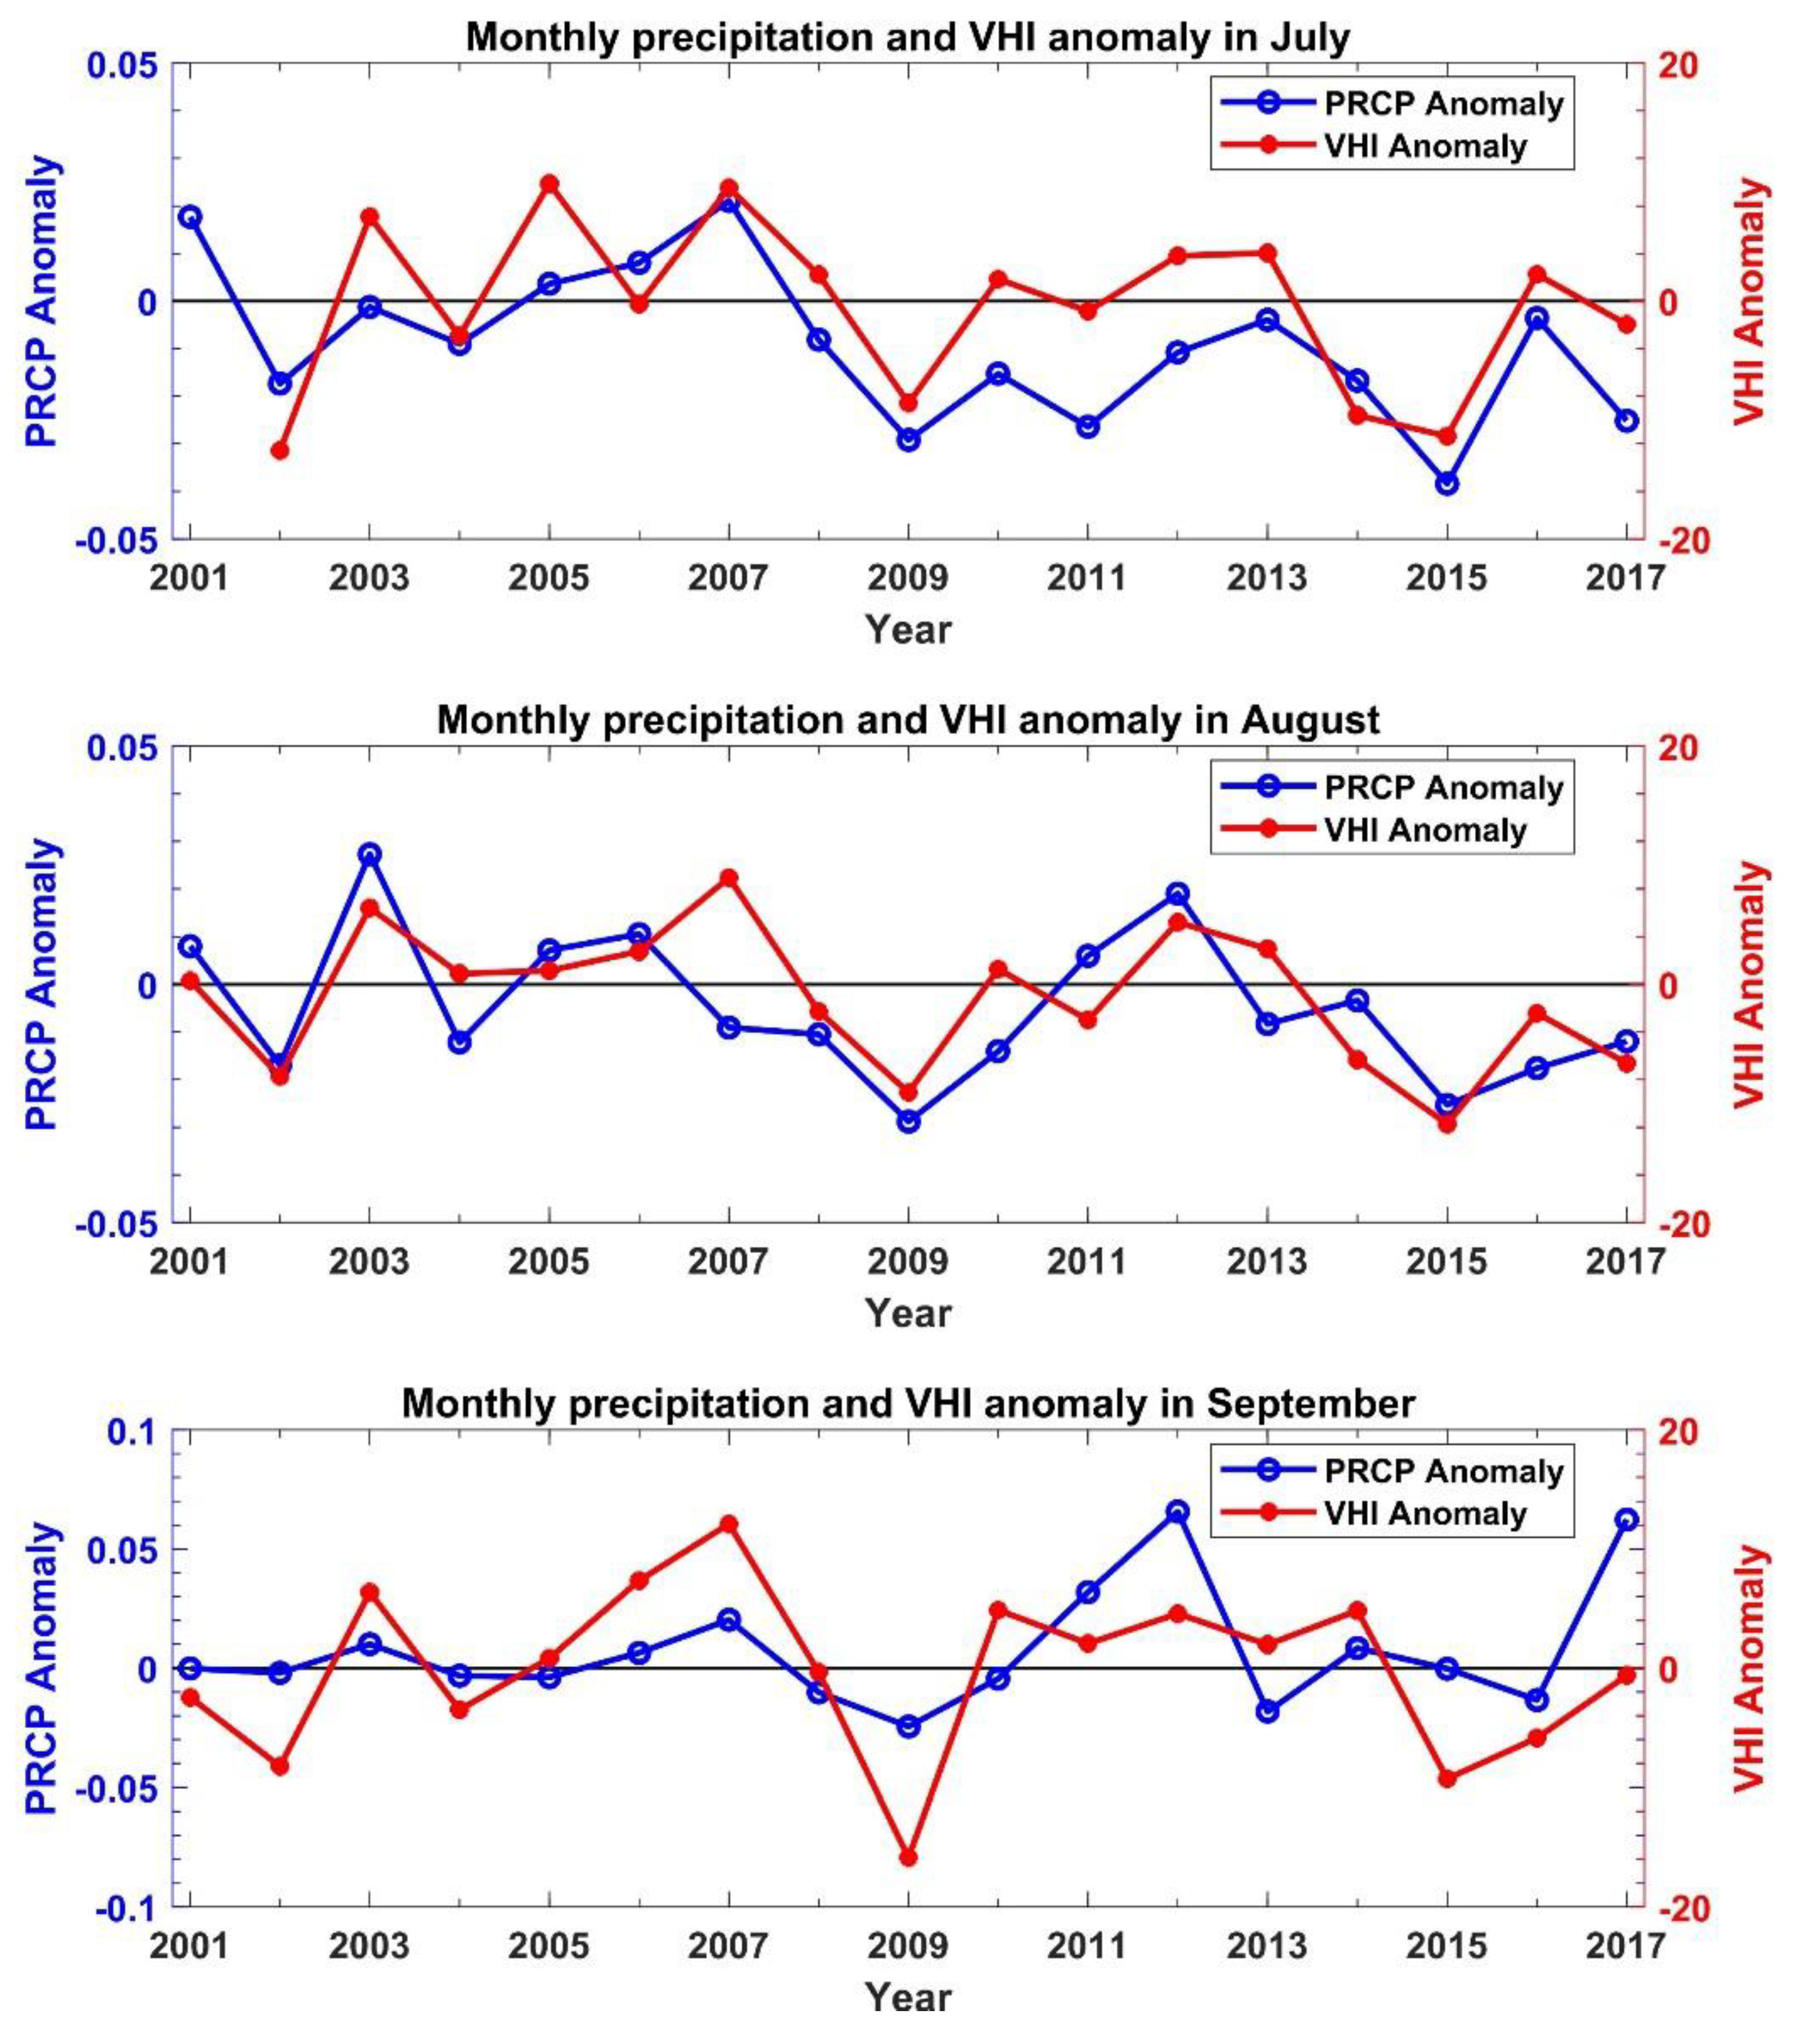
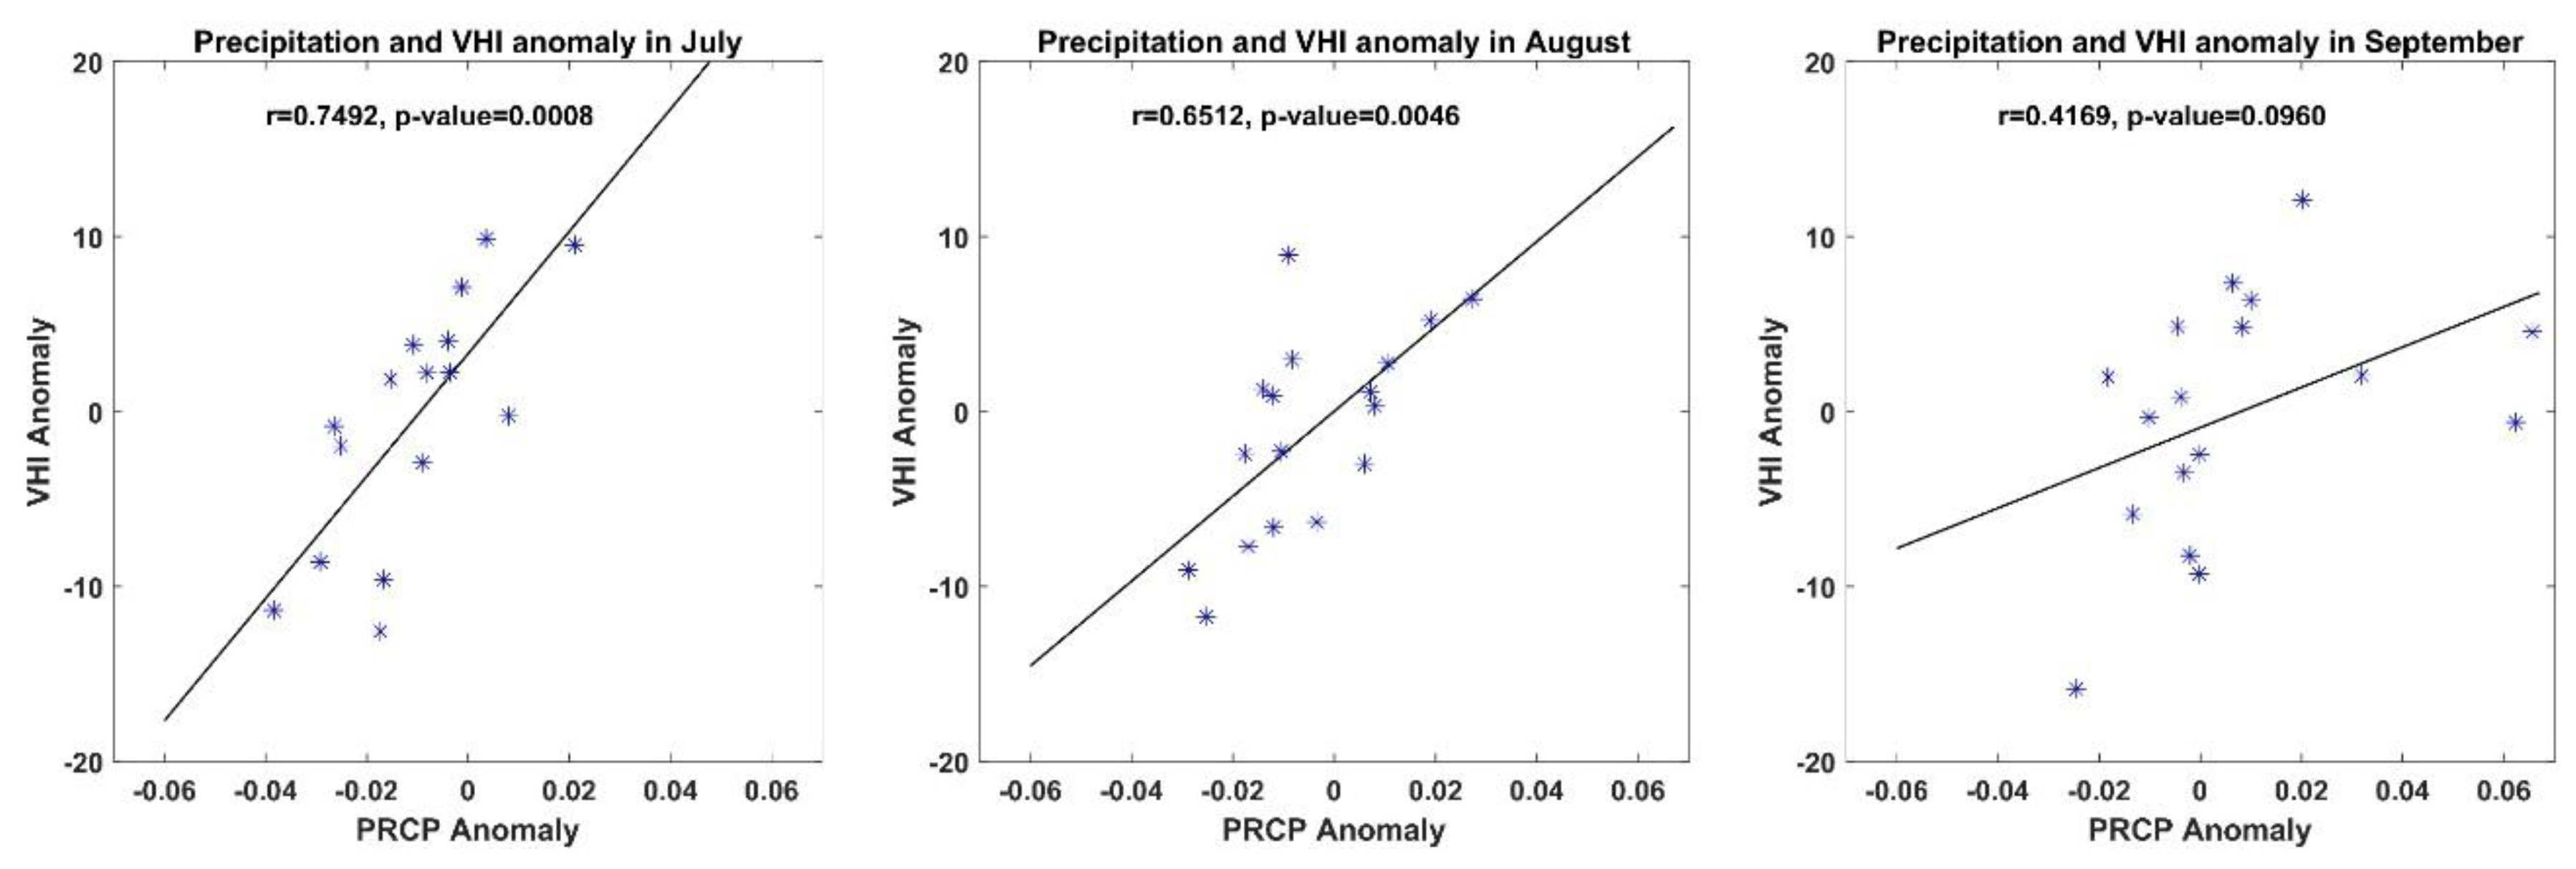
3.3. Rainfall and Crop Status in the Growth Season

In the HOA, agriculture crucially depends on rainfall, and thus rainfall in the crop growth season has significant impacts on crop health. As shown in Figure 2, over 91% of HOA crop areas are located in Ethiopia, where July and August are the critical growth seasons for most crops. Figure 9 shows time series of the monthly rainfall anomalies and VHI anomalies in July and August. The variations in rainfall anomaly and VHI anomaly were very consistent, and the trough points coincided with documented drought events in the study area in the years 2002, 2009, 2011, and 2015 [32]. The monthly rainfall anomaly and VHI anomaly had a high correlation in July and August, with correlation coefficients of 0.7492 and 0.6512, respectively, as illustrated in Figure 10, which means that crop growth in the HOA strongly depended on rainfall.
In addition, rainfall in the HOA was significantly affected by ENSO events [32]. Since 2000, El Niño events have occurred in the years 2002–2003, 2004–2005, 2006–2007, 2009–2010, and 2014–2016: The 2014–2016 event was one of the major ENSO events in history [32,33]. The troughs of rainfall in July and August (Figure 9), which indicated significantly lower rainfall than in normal years, corresponded with the El Niño years. Thus, VHI and TRMM rainfall data could reflect drought conditions in the study area.

4. Discussion

Up to now, over 100 indices have been developed for drought monitoring using various data, including ground observations, modeling, reanalysis, and remote sensing measurements at different spatial and temporal scales [22]. For agricultural drought monitoring, spectral indices derived from remote sensing measurements, such as the NDVI, NDWI, VCI, TCI, and VHI, are widely used [3,4,5,6,7,8,9,10,11,12,13,14,15,16,17,18,22]. The NDVI is one of the most popular vegetation indices. However, it has limitations in monitoring drought directly, because the NDVI is mainly sensitive to vegetation greenness [22]. Some other indices using shortwave infrared channels, such as the NDWI and Normalized Difference Infrared Index (NDII), have been suggested for drought monitoring because of their sensitivity to vegetation and surface water content [22]. Wu et al. compared various MODIS-based indices in a case study on the “Corn Belt” of the United States and suggested the NDII for drought monitoring. Choi et al. used the NDWI for drought monitoring in the eastern HOA and found a decreasing trend from 2000 to 2013 [12]. Kogan proposed the VCI by scaling the NDVI and the TCI by scaling surface temperature with minimum and maximum values of historical data. Case studies have demonstrated that the VCI and TCI had good agreement with precipitation and yield anomalies [6,7,8,9]. Specifically, Unganai and Kogan found that the VCI and TCI around six weeks before harvest time could explain yield variations well [9]. By integrating ancillary information, such as crop phenology and water use function, Wu developed a Phenology-Adjusted Drought Index (PADI) with a weighted average of the NDII during corn growth season and demonstrated the good capability of the PADI for agricultural drought monitoring in the “Corn Belt” of the United States [14].
In the HOA, there are limited ground observations available, and satellite remote sensing measurements are critical. In this study, the TRMM 3B43 precipitation data product was used, while there are some other satellite rainfall data products available, such as the Tropical Applications of Meteorology using Satellite and Ground-Based Observations (TAMSAT) [34], the African Rainfall Climatology and Time series (TARCAT) [35], the Climate Hazards Group Infrared Precipitation with Station data (CHIRPS) [36], the Climate Prediction Centre (CPC) Morphing technique (CMORPH) [37], the Precipitation Estimation from Remotely Sensed Information using Artificial Neural Networks Climate Data Record (PERSIANN-CDR) [38], the CPC Merged Analysis of Precipitation (CMAP) [39], and the Global Precipitation Climatology Project (GPCP) [40]. Because of differences in satellite sensors and rainfall retrieval algorithms, there are biases among these rainfall products. Kimani et al. compared seven satellite rainfall products with ground observations over eastern Africa and demonstrated that all of the selected seven satellite rainfall products could substantially replicate rainfall patterns, and CMORPH, CHIRPS, and TRMM showed consistently high performance during main rainy seasons [41]. Thus, it should be fine to use TRMM 3B43 data for drought assessment in the HOA region. We exploited TRMM data products for a comparative analysis with the VCI, TCI, and VHI. Although crop growth seasons vary significantly in the HOA, most of the cropland is in Ethiopia, where the main growth seasons of most crops are from July and September. Monthly VHI and rainfall anomalies in July and August matched well with drought and El Niño events, as demonstrated in Figure 9 and Figure 10. In September, the troughs of the VHI and rainfall time series also corresponded with drought events (Figure 9), but the correlation coefficient between the VHI anomaly and rainfall anomaly in September was 0.4169 (Figure 10), lower than the correlation coefficients of July and August. As September was close to harvest time, this result was consistent with Unganai and Kogan’s findings in a case study of South Africa. They found that the VCI and TCI around six weeks prior to harvest time could explain corn yield variations well [9]. In this study, the trends of the VCI, TCI, and VHI over cropland and the rainfall in crop growth season were also consistent, as all of them decreased from 2001 to 2017. Further investigation and more detailed analyses would rely on ancillary information and ground observations in the HOA, especially yearly crop maps, including location, planting time and areas, and the yield of each crop type, which were not available when we conducted this study.

5. Conclusions

Due to climate change, the HOA region has been under frequent and extreme drought conditions. Decreasing rainfall during the crop growth season is the cause of increased severity in food security issues. This study investigated rainfall and vegetation status through spatial and temporal analyses using TRMM rainfall data from 1998 to 2017 and MODIS land data products from 2000 to 2017. We found that during the 2015–2016 El Nino period, monthly rainfall during crop growing seasons decreased dramatically. This indicated an extreme drought in the HOA, while the VHI map showed significant vegetation stress during the crop growth season. Monthly rainfall in June, July, and August has significantly decreased from 1998 to 2017. Furthermore, a time series analysis of MODIS measurements from 2000 to 2017 indicated the impacts of drought in the HOA, with significant decreases across all three indices (the VCI, TCI, and VHI) at a 95% confidence level, which implies a long-term increase in surface temperature and decrease in crop health. In addition, the monthly VHI anomaly showed a strong correlation with the monthly rainfall anomaly in July and August, the major crop growth season in the HOA. Both the monthly rainfall anomaly and the VHI anomaly time series in July and August corresponded with the timing of drought events in the study area and ENSO events. This study provides insight into past, current, and future conditions of drought in the HOA agricultural area and will help in understanding the severity of HOA food security and the urgent need for sustainable solutions.

Author Contributions

C.Q. collected and analyzed the data; X.H. analyzed the data; C.Q. and X.H. wrote the manuscript; J.J.Q. and X.H. revised the manuscript.

Funding

This research received no external funding.

Acknowledgments

The TRMM_3B43 V7 precipitation data products were provided by the NASA/Goddard Space Flight Center, and the MODIS data products were downloaded from NASA Earth Science Data (https://earthdata.nasa.gov/).

Conflicts of Interest

The authors declare no conflict of interest.

References

  1. UN Aid Chief Urges Global Action as Starvation, Famine Loom for 20 Million across Four Countries. Available online: https://news.un.org/en/story/2017/03/553152-un-aid-chief-urges-global-action-starvation-famine-loom-20-million-across-four#.WbVBQ9GQxdh (accessed on 8 May 2018).
  2. Townshend, J.R.G.; Justice, C. Towards operational monitoring of terrestrial systems by moderate-resolution remote sensing. Remote Sens. Environ. 2002, 83, 351–359. [Google Scholar] [CrossRef]
  3. Tucker, C.J. Red and photographic infrared linear combinations for monitoring vegetation. Remote Sens. Environ. 1979, 8, 127–150. [Google Scholar] [CrossRef] [Green Version]
  4. Anyamba, A.; Tucker, C.J. Historical perspective of AVHRR NDVI and vegetation drought monitoring. In Remote Sensing of Drought: Innovative Monitoring Approaches; Wardlow, D.B., Anderson, C.M., Verdin, P.J., Eds.; Taylor & Francis: Milton Park, UK, 2012; pp. 23–50. [Google Scholar]
  5. Kogan, F.N. Application of vegetation index and brightness temperature for drought detection. Adv. Space Res. 1995, 15, 91–100. [Google Scholar] [CrossRef]
  6. Kogan, F.N. Droughts of the late 1980s in the United States as derived from NOAA Polar–Orbiting Satellite Data. Bull. Am. Meteorol. Soc. 1995, 76, 655–668. [Google Scholar] [CrossRef]
  7. Liu, W.T.; Kogan, F.N. Monitoring regional drought using the Vegetation Condition Index. Int. J. Remote Sens. 1996, 17, 2761–2782. [Google Scholar] [CrossRef]
  8. Kogan, F.N. Global drought watch from space. Bull. Am. Meteorol. Soc. 1997, 78, 621–636. [Google Scholar] [CrossRef]
  9. Unganai, L.S.; Kogan, F.N. Drought monitoring and corn yield estimation in Southern Africa from AVHRR data. Remote Sens. Environ. 1998, 63, 219–232. [Google Scholar] [CrossRef]
  10. Awange, J.L.; Schumacher, M.; Forootan, E.; Heck, B. Exploring hydro-meteorological drought patterns over the Greater Horn of Africa (1979–2014) using remote sensing and reanalysis products. Adv. Water Resour. 2016, 94, 45–59. [Google Scholar] [CrossRef] [Green Version]
  11. Jiao, W.Z.; Zhang, L.F.; Chang, Q.; Fu, D.J.; Cen, Y.; Tong, Q.X. Evaluating an Enhanced Vegetation Condition Index (VCI) Based on VIUPD for Drought Monitoring in the Continental United States. Remote Sen. 2016, 8, 224. [Google Scholar] [CrossRef]
  12. Choi, T.; Qu, J.J.; Xiong, X. A thirteen-year analysis of drought in the Horn of Africa with MODIS NDVI and NWDI measurements. In Proceedings of the 2nd International Conference on Agro-Geoinformatics, Fairfax, VA, USA, 12–16 August 2013. [Google Scholar]
  13. Wu, D.; Qu, J.J.; Hao, X. Agricultural drought monitoring using MODIS based drought indices over the Corn Belt. Int. J. Remote Sens. 2015, 36, 5403–5425. [Google Scholar] [CrossRef]
  14. Wu, D. An Investigation of Agriculture Drought on the United States Corn Belt Using Satellite Remote Sensing and GIS Technology. Ph.D. Thesis, George Mason University, Fairfax, VA, USA, May 2014. Available online: http://hdl.handle.net/1920/8897 (accessed on 10 July 2018).
  15. Brown, M.E.; Funk, C.C.; Galu, G.; Choularton, R. Earlier Famine Warning Possible Using Remote Sensing and Models. Eos. Trans. AGU 2007, 88, 381–382. [Google Scholar] [CrossRef]
  16. Brown, M.E. Remote Sensing Technology and Land Use Analysis in Food Security Assessment. J. Land Use Sci. 2016, 11, 623–641. [Google Scholar] [CrossRef]
  17. Klisch, A.; Atzberger, C. Operational Drought Monitoring in Kenya Using MODIS NDVI Time Series. Remote Sens. 2016, 8, 267. [Google Scholar] [CrossRef]
  18. Enenkel, M.; Steiner, C.; Mistelbauer, T.; Dorigo, W.; Wagner, W.; See, L.; Atzberger, C.; Schneider, S.; Rogenhofer, E. A Combined Satellite-Derived Drought Indicator to Support Humanitarian Aid Organizations. Remote Sens. 2016, 8, 340. [Google Scholar] [CrossRef]
  19. Palmer, W.C. Meteorological drought. In Weather Bureau Research Paper; US Department of Commerce: Washington, DC, USA, 1965; No. 55, 58. [Google Scholar]
  20. McKee, T.B.; Doesken, N.J.; Kleist, J. The relationship of drought frequency and duration to time scales. In Proceedings of the 8th Conference on Applied Climatology, Anaheim, CA, USA, 17–22 January 1993. [Google Scholar]
  21. Svoboda, M.D.; LeComte, D.; Hayes, M.J. The Drought Monitor. Bull. Am. Meteorol. Soc. 2002, 93, 1181–1190. [Google Scholar] [CrossRef]
  22. Zargar, A.; Sadiq, R.; Naser, B.; Khan, F.I. A review of drought indices. Environ. Rev. 2011, 19, 333–349. [Google Scholar] [CrossRef]
  23. Duan, Z.; Bastiaanssen, W. First results from Version 7 TRMM 3B43 precipitation product in combination with a new downscaling–Calibration procedure. Remote Sens. Environ. 2013, 131, 1–13. [Google Scholar] [CrossRef]
  24. Hafner, J.; DeCarlo, S. Monthly 0.25° × 0.25° TRMM multi-satellite and other sources rainfall (3B43). Available online: http://apdrc.soest.hawaii.edu/datadoc/trmm_3b43.php (accessed on 8 July 2018).
  25. Tierney, J.E.; Ummenhofer, C.C.; deMenocal, P.B. Past and future rainfall in the Horn of Africa. Sci. Adv. 2015, 1, e1500682. [Google Scholar] [CrossRef]
  26. The Food and Agriculture Organization Corporate Statistical Database (FAOSTAT). Available online: http://www.fao.org/faostat/en/#home (accessed on 2 March 2019).
  27. Food and Agriculture Organization (FAO) of the United Nations. Crop Calendar–An Information Tool for Seed Security. Available online: http://www.fao.org/agriculture/seed/cropcalendar/searchbycountry.do (accessed on 8 May 2018).
  28. NASA Earth Science Data. Available online: https://earthdata.nasa.gov/ (accessed on 20 June 2018).
  29. Pérez-Hoyos, A.; Rembold, F.; Kerdiles, H.; Gallego, J. Comparison of Global Land Cover Datasets for Cropland Monitoring. Remote Sens. 2017, 9, 1118. [Google Scholar] [CrossRef]
  30. Meroni, M.; Atzberger, C.; Vancutsem, C.; Gobron, N.; Baret, F.; Lacaze, R.; Eerens, H.; Leo, O. Evaluation of Agreement Between Space Remote Sensing SPOT-VEGETATION fAPAR Time Series. IEEE Trans. Geosci. Remote Sens. 2013, 51, 1951–1962. [Google Scholar] [CrossRef]
  31. Atkinson, P.M.; Jeganathan, C.; Dash, J.; Atzberger, C. Intercomparison of four models for smoothing satellite sensor time-series data to estimate vegetation phenology. Remote Sens. Environ. 2012, 123, 400–417. [Google Scholar] [CrossRef]
  32. Mohammed, Y.; Yimer, F.; Tadesse, M.; Tesfaye, K. Meteorological drought assessment in north east highlands of Ethiopia. Int. J. Clim. Chang. Strateg. 2018, 10, 142–160. [Google Scholar] [CrossRef]
  33. United States Climate Prediction Center. Cold & Warm Episodes by Season. Available online: https://origin.cpc.ncep.noaa.gov/products/analysis_monitoring/ensostuff/ONI_v5.php (accessed on 20 February 2019).
  34. Tarnavsky, E.; Grimes, D.; Maidment, R.; Black, E.; Allan, R.P.; Stringer, M.; Chadwick, R.; Kayitakire, F. Extension of the TAMSAT satellite-based rainfall monitoring over Africa and from 1983 to present. J. Appl. Meteorol. Climatol. 2014, 53, 2805–2822. [Google Scholar] [CrossRef]
  35. Maidment, R.I.; Grimes, D.; Allan, R.P.; Tarnavsky, E.; Stringer, M.; Hewison, T.; Roebeling, R.; Black, E. The 30 year TAMSAT African rainfall climatology and time series (TARCAT) data set. J. Geophys. Res. Atmos. 2014, 119, 10619–10644. [Google Scholar] [CrossRef]
  36. Funk, C.C.; Peterson, P.J.; Landsfeld, M.F.; Pedreros, D.H.; Verdin, J.P.; Rowland, J.D.; Romero, B.E.; Husak, G.J.; Michaelsen, J.C.; Verdin, A.P. A Quasi-Global Precipitation Time Series for Drought Monitoring. In U.S. Geological Survey Data Series 832; US Geological Survey: Reston, VA, USA, 2014; 4p. [Google Scholar]
  37. Joyce, R.J.; Janowiak, J.E.; Arkin, P.A.; Xie, P.P. Cmorph: A method that produces global precipitation estimates from passive microwave and infrared data at high spatial and temporal resolution. J. Hydrometeorol. 2004, 5, 487–503. [Google Scholar] [CrossRef]
  38. Ashouri, H.; Hsu, K.L.; Sorooshian, S.; Braithwaite, D.K.; Knapp, K.R.; Cecil, L.D.; Nelson, B.R.; Prat, O.P. PERSIANN-CDR daily precipitation climate data record from multisatellite observations for hydrological and climate studies. Bull. Am. Meteorol. Soc. 2015, 96, 69–83. [Google Scholar] [CrossRef]
  39. Xie, P.; Arkin, P.A. Global monthly precipitation estimates from satellite-observed outgoing longwave radiation. J. Clim. 1997, 11, 137–164. [Google Scholar] [CrossRef]
  40. Adler, R.F.; Huffman, G.J.; Chang, A.; Ferraro, R.; Xie, P.; Janowiak, J.; Arkin, P. The version 2 global precipitation climatology project (GPCP) monthly precipitation analysis. J. Hydrometeorol. 2003, 4, 1147–1167. [Google Scholar] [CrossRef]
  41. Kimani, M.W.; Hoedjes, J.C.B.; Su, Z. An Assessment of Satellite-Derived Rainfall Products Relative to Ground Observations over East Africa. Remote Sens. 2017, 9, 430. [Google Scholar] [CrossRef]
Figure 1. Map of the Horn of Africa (HOA), the selected study area.
Remotesensing 11 00902 g001
Figure 2. Average annual harvest areas of major crops in the HOA from 2001 to 2017.
Remotesensing 11 00902 g002
Figure 3. Crop calendar for major crops in Eritrea, Ethiopia, and Somalia. Gu indicates the Gucrop production season in Somalia.
Remotesensing 11 00902 g003
Figure 4. Majority land cover types of the HOA composed with the Moderate Resolution Imaging Spectroradiometer (MODIS) MCD12 data product.
Remotesensing 11 00902 g004
Figure 5. Monthly precipitation anomalies indicating extreme drought in the HOA during August and September in the years 2015 and 2016, especially in the agricultural areas of Ethiopia.
Remotesensing 11 00902 g005
Figure 6. MODIS Vegetation Health Index (VHI) anomaly map from August 2015 (left) and August 2016 (right), illustrating extreme drought conditions in the HOA. In most of the HOA region, VHI anomaly values were negative in August 2015 and August 2016, which indicated that VHI values were significantly lower than in normal years.
Remotesensing 11 00902 g006
Figure 7. Monthly precipitation time series of June, July, and August, the growing period of major crops in the HOA.
Remotesensing 11 00902 g007
Figure 8. VCI (top), TCI (middle), and VHI (bottom) anomaly time series of cropland in the HOA from the years 2001 to 2017. The red lines are trend lines.
Remotesensing 11 00902 g008
Figure 9. Monthly rainfall anomalies and VHI anomalies during the crop growing season. The trough points coincide with the timing of drought events and El Niño events.
Remotesensing 11 00902 g009
Figure 10. Monthly VHI anomalies showing a strong correlation with rainfall anomalies in July, August, and September, the major crop growth season in the HOA.
Remotesensing 11 00902 g010
Table 1. Monthly rainfall trends of June, July, and August in the HOA from years 1998 to 2017.
MonthTrendTrend Confidence Interval (95% Level)p-Value
June−0.0415 mm/day/year[−0.0630, −0.0201] mm/day/year7.1941 × 10−4
July−0.0435 mm/day/year[−0.0698, −0.0172] mm/day/year0.0027
August−0.0328 mm/day/year[−0.0600, −0.0055] mm/day/year0.0211
Table 2. Statistics of Vegetation Condition Index (VCI), Temperature Condition Index (TCI), and VHI anomaly trends of HOA cropland from the years 2001 to 2017.
Index AnomalyTrendTrend Confidence Interval (95% Level)p-Value
VCI Anomaly−0.2266/year[−0.3559, −0.0973]/year0.0006
TCI Anomaly−0.2315/year[−0.4325, −0.0306]/year0.0240
VHI Anomaly−0.2364/year[−0.3810, −0.0918]/year0.0014

