Abstract
The scientific community has widely reported the impacts of climate change on the Central Himalaya. To qualify and quantify these effects, long-term land surface temperature observations in both the daytime and nighttime, acquired by the Moderate Resolution Imaging Spectroradiometer from 2000 to 2017, were used in this study to investigate the spatiotemporal variations and their changing mechanism. Two periodic parameters, the mean annual surface temperature (MAST) and the annual maximum temperature (MAXT), were derived based on an annual temperature cycle model to reduce the influences from the cloud cover and were used to analyze their trend during the period. The general thermal environment represented by the average MAST indicated a significant spatial distribution pattern along with the elevation gradient. Behind the clear differences in the daytime and nighttime temperatures at different physiographical regions, the trend test conducted with the Mann-Kendall (MK) method showed that most of the areas with significant changes showed an increasing trend, and the nighttime temperatures exhibited a more significant increasing trend than the daytime temperatures, for both the MAST and MAXT, according to the changing areas. The nighttime changing areas were more widely distributed (more than 28%) than the daytime changing areas (around 10%). The average change rates of the MAST and MAXT in the daytime are 0.102 °C/yr and 0.190 °C/yr, and they are generally faster than those in the nighttime (0.048 °C/yr and 0.091 °C/yr, respectively). The driving force analysis suggested that urban expansion, shifts in the courses of lowland rivers, and the retreat of both the snow and glacier cover presented strong effects on the local thermal environment, in addition to the climatic warming effect. Moreover, the strong topographic gradient greatly influenced the change rate and evidenced a significant elevation-dependent warming effect, especially for the nighttime LST. Generally, this study suggested that the nighttime temperature was more sensitive to climate change than the daytime temperature, and this general warming trend clearly observed in the central Himalayan region could have important influences on local geophysical, hydrological, and ecological processes.
1. Introduction
Mountainous regions are usually characterized as fragile eco-environments. Because mountainous environments are highly sensitive to climate change, their responses to global climatic change are observed earlier than those of the surrounding lowlands, and they are therefore are ideal indicators for related studies. As a result, global climate change issues related to mountainous areas have become a growing concern worldwide, thereby motivating many scientific and political global-scale initiatives, including cooperative regional organizations, international conferences, and projects [1].
The Himalayan Mountains, which constitute one of the most fragile ecosystems in the world, play an important role in providing necessary ecosystem services, including the supply of water, biodiversity, and natural resources; however, these services are significantly affected by the effects of human activity and global warming. The most obvious phenomenon associated with these effects is the rapid retreat and thinning of glaciers in the Himalayas, together with the fast formation and growth of glacial lakes [2]. In tandem with the retreat of glaciers, global warming favors an upslope shift of alpine tree lines around the world, especially in the Himalayas [3].
Over the past decade, increased attention has been paid to the central Himalayan region, which is majorly referred to as Nepal, aiming to quantitatively understand the spatial and temporal change patterns of the climatic environment. Meteorological observations, such as the near-surface air temperature and precipitation data, are important proxies for investigating these changes. For example, based on meteorological measurements from 10 stations, Qi, et al. [4] clarified the characteristics and trends of climate change in the Mt. Everest region located in Central Himalaya. Shrestha, et al. [5] revealed warming trends in the Middle Mountain and Himalayan regions by analyzing the maximum temperature data from 49 stations in Nepal for the period between 1971 and 1994; high-elevation regions in the north presented a greater warming trend than the lowlands in the south, and these changes were attributed mainly to the effects of climate change. Moreover, such warming trends have also been detected based on observations from meteorological stations for both the mean and the extreme surface air temperature [6,7,8]. These findings are consistent with the simulation results that use climate models [9]. In addition, an obvious increase in the near surface air temperature will have significant impacts on the melting of the glaciers and snow cover, which can further influence the hydrological regime of the river basins throughout this region [6,10,11].
Consequently, it is highly important to understand the positive and negative impacts of climate change on mountainous eco-environments from the local to regional scale, in order to assist decision makers in preparing appropriate adaptation strategies for the changing conditions therein. Unfortunately, as is evident from previous assessments based on in situ meteorological observations, considerably few stations are established in mountainous areas of the Central Himalaya, and usually they lack long-term records. Consequently, it is difficult to depict the spatial and temporal dynamics of the climatic environment over these regions with such limited measurements. Although climate models can consistently provide a virtual estimate of climate change and its effects, such models have a coarse resolution that is insufficient for representing the climatic variability on a regional or local scale and for assessing the environmental or hydrological responses [9]. Furthermore, estimates from climate models suffer from simulation uncertainties, thereby affecting the desired understanding of surface processes and the impact assessment [12].
To circumvent the abovementioned limitations, satellite remote sensing provides spatially contiguous high-accuracy and high-resolution information, particularly in remote mountainous areas; thus, remote sensing constitutes an alternative approach for monitoring the dynamics of surface eco-environments and their responses to climate change. Land surface temperature (LST) measurements acquired based on thermal remote sensing have become vital for describing the spatial and temporal variability of the surface thermal environment and investigating its response to climate change [13,14,15,16,17]. To document the biophysical effects of forest change under the local climate, many studies have been conducted to assess the effects of warming and cooling resulting from land cover changes on the daytime and nighttime LST [18,19,20]. Bechtel [21] used the annual temperature cycle (ATC) to obtain the annual LST cycle parameters from Moderate Resolution Imaging Spectroradiometer (MODIS) observations; in doing so, they demonstrated the potential applications of those parameters in global climatology and assessed their influencing factors. Similar analyses can be found in the field of urban thermal environment monitoring and assessment [22,23]. Although evaluations of LST variations are focused primarily on the effects of land cover changes on the LST, the influence of interannual climate variability on the change pattern is also an important factor to be considered [24].
Therefore, the use of long-term remotely sensed LST records can be employed to analyze the spatial and temporal LST characteristics over the central Himalayan region; the results of such analyses should be helpful for better understanding the interactions among various driving factors, including land cover change and climate change, and for performing research on regional and local eco-environmental assessments and adaptation. Unfortunately, few studies have been devoted to this issue within this region [25,26,27]. To fill this research gap and generally investigate the thermal environment and its variations over Central Himalaya, this study selects Nepal as the study area, and the objectives of this study are to (1) quantify the spatial and temporal LST distribution patterns, (2) address the driving mechanisms, including the major influencing factors and surface processes, of the thermal environment, and (3) assess the corresponding potential impacts of climate change. Unlike previous studies based on either mereological observations or climate modeling, this is the first study to provide a comprehensive assessment of the thermal environment using remote sensing data over this region.
2. Materials and Methods
2.1. Study Area
As an important component of the Central Himalaya, Nepal is a typically mountainous country in South Asia, more than 90% of which is occupied by mountain terrain. It resembles a rough rectangle stretching 900 km from east to west in the central Himalayan region (80°04′–88°12′ E, 26°22′–30°27′ N). Physiographically, Nepal is divided into five major regions from south to north (Figure 1), namely, the Terai Plain, Siwalik Hills, Middle Mountain, High Mountain, and High Himalaya, which are divided according to their elevation ranges (lower than 200 m, 200 m to 1000 m, 1000 m to 2000 m, 2000 m to 4000 m, and higher than 4000 m), and the mean altitudes of each region are 136 m, 497 m, 1280 m, 2605 m, and 4739 m, respectively. Each region is oriented almost parallel to the direction of the Himalayan Mountains.
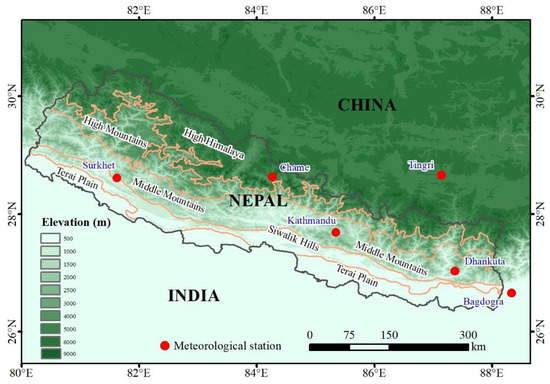
Figure 1.
Elevation map and physiographical regions of Nepal. Note: the red points are meteorological stations.
Due to the high fragility of the montane ecosystem and its substantial dependence on agricultural activity, climate change has, in this region, the strongest impact on many vulnerable issues, such as water resources, biodiversity, agricultural development, and food security. Therefore, Nepal is an ideal study area for investigating the effects of climate change. It exhibits four distinct seasons but is strongly influenced by monsoons and continental factors; consequently, the climate ranges from a subtropical monsoon climate in the south to a warm temperate climate in the Middle Mountain region, a cool temperate climate in the High Mountain region, and an alpine climate in the High Himalaya region.
2.2. Data
2.2.1. Satellite and DEM Data
The MODIS LST product is widely utilized in regional and global studies because of its daily global coverage ability [28,29,30,31,32]. Meanwhile, previous validation studies indicated that it has a relatively high estimation accuracy (within ±1 K in most cases) [33,34], and thus, this product is the best choice for specifying the LST spatial and temporal variability. The daily LST 1-km products are provided by both the Terra and the Aqua platforms, and the Terra MODIS LST product has a longer temporal extent (since Feb. 2000) than the Aqua MODIS LST product (since Jul. 2002). To enable a longer observation period, the Terra MODIS daily 1-km LST data (MOD1A1 Version 6) from the period of February 2000 to December 2017 were used in this study, and they were acquired from the NASA EarthData Search (https://search.earthdata.nasa.gov/search). The overpass time of the Terra satellite is approximately 10:30 (local solar time) in its descending mode and 22:30 in its ascending mode. Both daytime and nighttime LST data were used in this study to analyze the different responses of LST to changes in the surface cover condition and the climatic environment. It should be noted that only high-quality data were selected based on the quality control information.
In addition to the LST product, to investigate the impacts of changes in the land surface characteristics on the variations in the surface thermal environment, the MODIS/Terra 1-km 16-day vegetation index product (MOD13A2) and the MODIS/Terra Snow Cover Daily L3 Global 500 m product (MOD10A2) were downloaded to supply surface vegetation cover and snow cover information, respectively. Based on the 16-day normalized difference vegetation index (NDVI) product, the Savitzky-Golay filter was used with the quality control data to eliminate the influence of clouds on the NDVI data to derive the annual maximum NDVI of each year, so as to the analyze vegetation cover variation. Moreover, because the variation in the snow cover is a good proxy for representing the impacts of climate change, the days of snow cover were acquired from the snow cover product for each year.
For information regarding the surface topography, the 90 m Shuttle Radar Topography Mission (SRTM) digital terrain model elevation data were downloaded from the National Aeronautics and Space Administration (NASA) web portal (https://urs.earthdata.nasa.gov). It was then resampled and aggregated into 1 km, which has the same spatial resolution as the LST product.
2.2.2. Observed Air Temperature Data
The historic trend in the air temperature was analyzed using data from six meteorological stations in/around the study area (Figure 1). Among these stations, four are located in Nepal, and another two (Tingri and Bagdogra) are situated in China and India, respectively. The daily observations are collected from the National Climate Center (http://ncc.cma.gov.cn), and they are used to derive the annual average air temperature for the trend analysis. Details of the stations and data availability are given in Table 1, and each station provides meteorological data with different periods. A big observation gap can be found at most stations, especially for Surkhet and Dhankuta.

Table 1.
Detailed information of the meteorological stations and the data availability.
2.3. Methodology
2.3.1. LST Information Extraction
It is well known that the LST is highly affected by the local atmospheric forcing environment in addition to surface thermal properties. However, the thermal infrared observations are easily contaminated by cloud cover, resulting in many gaps during the surface temperature estimation. Therefore, it is hard to effectively understand the surface thermal environment and its dynamics based on these discontinuous LST observations. The single comparison with observations on a specific day cannot represent the true variation of the thermal environment due to the strong impact from the atmospheric forcing environment. Instead of the instantaneous values, the use of the periodic information at longer temporal scales should be a good choice.
Previous studies have indicated that the annual temperature cycle of the LST can be effectively modeled as a sine function plus a constant term for midlatitude regions [22,35]. This widely accepted ATC model is shown below:
where d is the day of the cycle. The three other parameters, which are usually named the annual cycle parameters (ACPs), are the mean annual surface temperature (MAST), the yearly amplitude of the surface temperature (YAST), and the phase shift (θ). To maintain the rationality of the ATC model, the YAST should be larger than 0, and the phase shift relative to the equinox should range between −182.5 and +182.5 days according to the definition. The day with the maximum temperature (DAYmax) is 91.25-θ. Additionally, since the full cycle was set to 365 days, intercalary days were ignored [21,23,36]. From the above ACPs, the annual maximum temperature (MAXT) can be derived using the MAST and YAST, as follows:
MAXT = MAST + YAST
Therefore, the LST parameters provide annually periodic LST information associated with the irradiation and climatological conditions, and they are useful for specifying the spatial and temporal variations in the surface thermal environment. To enable the reliable retrieval of these ACPs, only good-quality daily LST observations were used in this study during the ATC modeling. In this study, MAST and MAXT are used as the major parameters because of their representative role for the local thermal environment.
2.3.2. LST Trend Analysis
The popularly used Mann-Kendall (MK) test was used in this study to detect the temporal trend of the LST. The MK test is a nonparametric test that has been found to be an excellent tool with a wide applicability in hydroclimatic time series [37,38,39,40]. This test boasts numerous advantages, namely, little interference from abnormal values and a convenient calculation process; moreover, the time series used in this test are not required to follow a specified linear or nonlinear variation trend. Detailed information about this methodology can be found in previous trend analysis studies [41]. In this study, the standardized MK test statistic (Zmk) was used to specify whether a trend is significant or not significant at a significance level of α=0.05. In addition, the trend magnitude was determined by Theil-Sen’s slope, where a positive value indicates a positive trend and vice versa [42].
3. Results
3.1. Spatial Pattern of the Annual Mean LST
The ATC model was applied to the daytime and nighttime LSTs of each year. According to the fitting results, an acceptable fitting accuracy can be derived for most pixels with the root mean squared deviation (RMSD) within 3 K. The relatively poor performance was only found at some high-elevation pixels due to the complex terrain. Based on the estimated yearly MAST, the daytime and nighttime average MAST were derived to present the general thermal environment of Nepal (Figure 2). It is clear that the daytime average MAST (Figure 2a) is systematically higher than the nighttime average MAST (Figure 2b), with mean values of 295.46 K and 283.19 K, respectively. Due to the frequent cloud cover in the High Himalaya region, there are some places with blank values during the nighttime, as shown in Figure 2b. In addition, they both present a banded distribution along the northwest-southeast direction, similar to the physiographical regions shown in Figure 1. This implies the presence of an important impact of the surface topographic conditions on the evolution of the surface thermal environment.
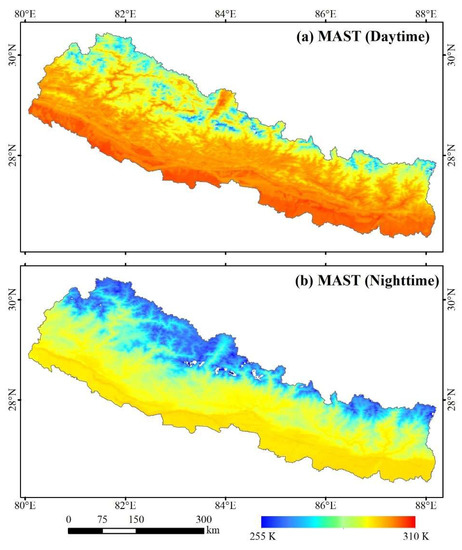
Figure 2.
Annual average the mean annual surface temperature (MAST) during the period 2000 to 2017. (a) Daytime; (b) Nighttime.
To clearly specify the temperature differences among the different physiographical regions, Figure 3a-e illustrate the temperature histograms of both the daytime and the nighttime annual mean MASTs of each physiographical region, from High Himalaya to Terai Plain. From the mean values of each region, there is no doubt that the daytime LSTs are all higher than the nighttime LSTs. Regarding the temperature distribution patterns in the daytime and nighttime, there is an obvious temperature intersection within the mountainous regions (High Himalaya, High Mountains, and Middle Mountains) for both the daytime LSTs and the nighttime LSTs. However, this phenomenon disappears in the Siwalik Hills and Terai Plain, where the daytime LSTs are all higher than the nighttime LSTs. In the Terai Plain, this difference reaches 5 K. In addition to the day-night difference, the standard deviation of the temperature distribution in each region exhibits a decreasing trend from the High Himalaya to the Terai Plain, regardless of the temperature during the day or night. The daytime MAST has the biggest decrement, from 7.39 K in the High Himalaya to 1.2 K in the Terai Plain. All of the above phenomena indicate a strong influence, from topographic changes to the surface temperature evolution, and the effect becomes stronger with the increase of the surface topographic complexity, resulting in the amplification of the surface temperature variation.
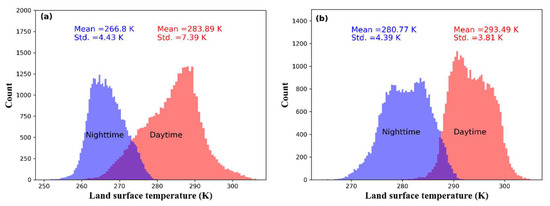
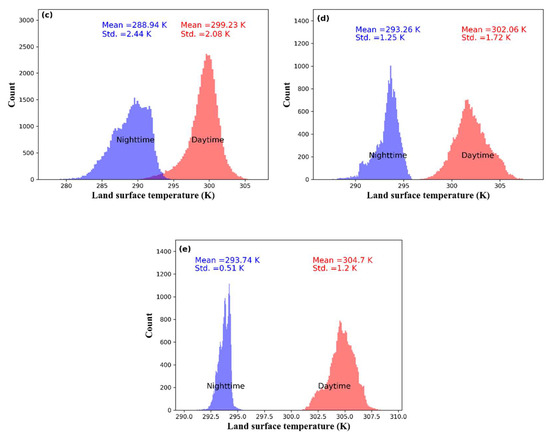
Figure 3.
Histograms of the daytime and nighttime MASTs in each physiographical region. (a) High Himalaya, (b) High Mountains, (c) Middle Mountains, (d) Siwalik Hills, and (e) Terai Plain.
3.2. Temperature Trend Analysis
3.2.1. Regional Analysis
In addition to the analysis of the regional distribution patterns presented above, the average MAST of each physiographical region was calculated for each year to analyze the temporal variation. Figure 4a–e show the trend detection results of the daytime MAST of each region determined through a linear trend analysis. Regarding the linear regression performance, the low value of the coefficients of determination (R2) of each region clearly indicates that the MAST value at the regional level doesn’t have a significant trend. No trend detection passed the significant test at the confidence level of 0.95. The results show that there is no obvious trend for the daytime MAST in each region.
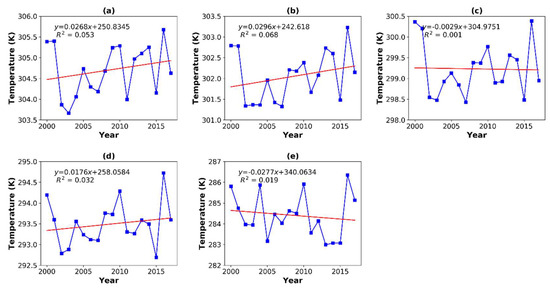
Figure 4.
Temporal variation and linear trend of the average daytime MAST in the (a) Terai Plain, (b) Siwalik Hills, (c) Middle Mountains, (d) High Mountains, and (e) High Himalaya during the period from 2000 to 2017. (*Significant at a 95% confidence level).
However, the trends detected for the nighttime MAST of each region, as shown in Figure 5a–e, are quite different from the daytime results. The linear trends in the nighttime MASTs are much more obvious than those of the daytime MASTs, and most of them pass the significance test except for the High Himalaya. Although the MAST in the High Himalaya indicates an increasing but nonsignificant trend, the positive change rate for all of the regions implies a warming effect during the study period, and the magnitude of this variation is generally larger in the mountainous regions than in the Terai Plain. The results of this trend analysis indicate that the nighttime LST shows a stronger variation than the daytime LST.
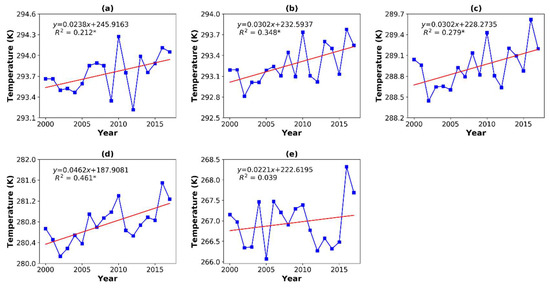
Figure 5.
Temporal variation and linear trend of the average nighttime MAST in the (a) Terai Plain, (b) Siwalik Hills, (c) Middle Mountains, (d) High Mountains, and (e) High Himalaya during the period from 2000 to 2017. (*Significant at a 95% confidence level).
3.2.2. Spatial Distribution of Temperature Variations
To further investigate the temperature variations in detail, the MK test was applied to the yearly MAST. The results of this analysis of significant change areas and their corresponding change rates are given in Figure 6. Most of the areas with a significant variation present an increasing trend. However, upon comparing the daytime MAST change pattern with the nighttime MAST change pattern, it is clear that the former (shown in Figure 6a) occurs over a considerably small area (12.7%), and the variations are located mainly in the Terai Plain, Siwalik Hills, and the boundary areas between the High Mountain and High Himalaya. Hence, the regional analyses shown in Figure 4 generally present a weak increasing trend. In contrast, the nighttime MAST exhibits a more significant change pattern, as presented in Figure 6b. Except for the High Himalaya region, most of the other four regions display a positive trend in the LST. The changing area occupies 31.0% of the study area. These results confirm the significant changes detected from an analysis of the nighttime MAST at the regional level shown in Figure 5. Compared with the change rate for the daytime MAST and nighttime MAST, the daytime MAST has a general higher rate with a mean value of 0.0102 °C/yr than the nighttime MAST (0.048 °C/yr). The daytime variation has a wider distribution than the nighttime variation according to their standard deviation values, shown in Figure 6.
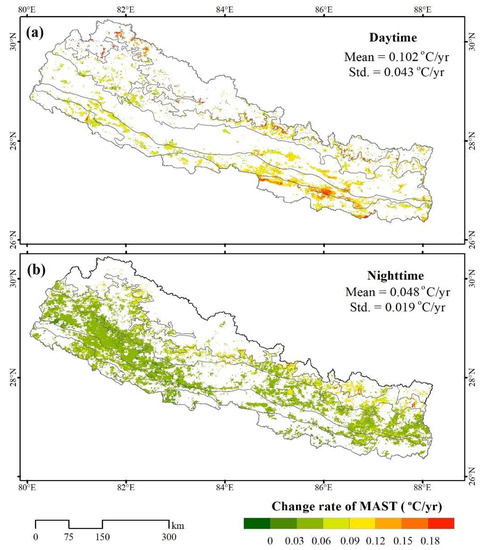
Figure 6.
Change rates in significant changing areas of the (a) daytime MAST and (b) nighttime MAST during the period from 2000 to 2017.
To deepen the understanding of the temperature temporal variation, the MAXT data was derived to perform a similar trend analysis. As shown in Figure 7, the change pattern of MAXT is quite similar to the distribution of the significant change areas of the MAST shown in Figure 6. Most of the detected areas have a striking increasing trend during the study period. Although there is a small increase in the change areas (7.7%) for the daytime MAXT (Figure 7a), it presents a weaker warming effect than the nighttime MAXT, and the location of the changing areas is quite similar to that of the daytime MAST. In contrast, for the nighttime MAXT, 28.2% of the study area exhibits a significant increasing trend.
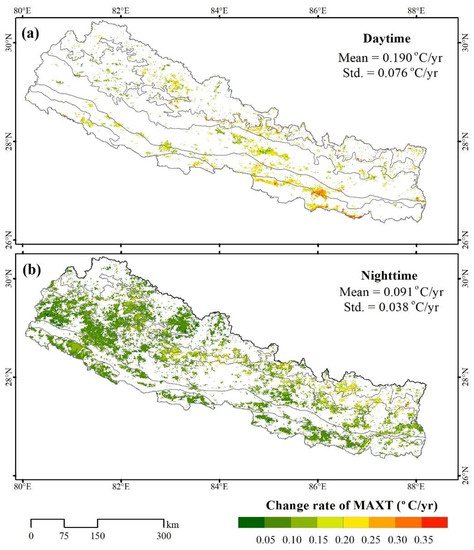
Figure 7.
Change rates in significant changing areas of the (a) daytime MAXT and (b) nighttime MAXT during the period from 2000 to 2017.
Moreover, the magnitude of the change in MAXT is generally higher than that of the change in the MAST for both daytime and nighttime, with average values of 0.190 °C/yr in the daytime and 0.091 °C/yr in the nighttime. The daytime changes are generally highly than those in the nighttime. Moreover, the differences in the change rate illustrate the magnitudes of the warming effect over the different regions well. The nighttime change detection in both Figure 6b and Figure 7b shows that the areas located around the boundary between the High Mountains and High Himalaya present the strongest warming effect with the highest values.
4. Factors Affecting the Temperature Increase
It is well known that land surface conditions are key factors in determining the surface temperature evolution. Therefore, the vegetation cover condition greatly influences the surface thermal properties due to the significant difference in the thermal conductivity between vegetation and bare soil. Due to the suitable heat conditions and relatively sufficient water supply for vegetation growth in Nepal, the general vegetation cover conditions there are considerably good, as indicated by the average maximum NDVI map shown in Figure 8. Most parts of the study area have a high maximum NDVI with a value exceeding 0.6. Only the High Himalaya region is relatively poorly vegetated due to either snow cover or glaciers. Therefore, the small variation in the vegetation coverage over the high vegetated surface should present a limited effect on the surface temperature variation. However, under the circumstances that involve significant changes in the surface cover type, there must be significant changes in the LST. According to this point, the driving factors associated with the temperature increase should be concluded to be the following aspects.
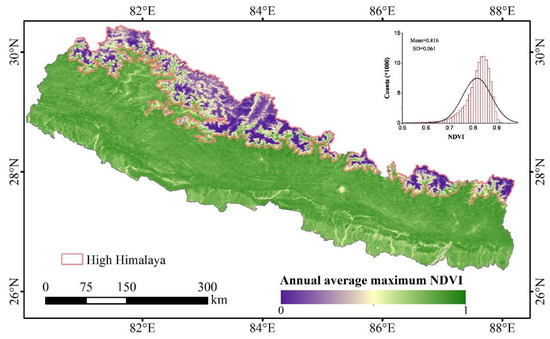
Figure 8.
Annual average maximum normalized difference vegetation index (NDVI) map of Nepal during the period from 2000 to 2017.
4.1. Urban Expansion
The metropolitan city of Kathmandu, located in the Kathmandu Valley, is the capital city of Nepal, and it boasts the most rapid urbanization rate throughout the Himalayas. According to the urban growth monitoring study conducted by Ishtiaque, et al. [43], the urban built-up area changed from 4712.88 hectares in 1999 to 11,020.62 hectares in 2016, based on Landsat images; this large area was converted mainly from agricultural land. The change of the urban area is simply delineated with a dashed yellow line in Figure 9b,c: this clearly presents the change during the period 2000 to 2017. A large expansion of the built-up area is clearly reflected by a reduction in the vegetation cover, especially on the outskirts of the city. Therefore, the fast expansion of the built-up area significantly changes the surface thermal properties. Under the impacts of the urban heat effect, it is reasonable that the urban LST would exhibit a significant warming trend during this period. Therefore, most of the urban areas present a strong increasing trend as shown in Figure 9a, with the maximum change rate close to 0.15 °C/yr.
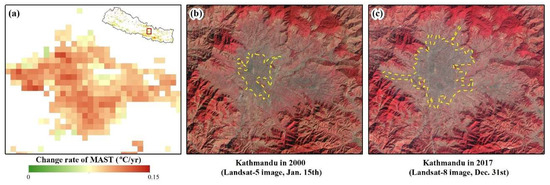
Figure 9.
(a) Change rate of the daytime MAST in Kathmandu during the period from 2000 to 2017; (b) false color image of Kathmandu in 2000 acquired from Landsat-5 satellite data; and (c) false color image of Kathmandu in 2017 acquired from Landsat-8 satellite data.
4.2. River Course Shift
In the Terai Plain, most rivers are braided in the Bhabar zone, a gently sloping region of coarse alluvium below the Siwalik Hills, and these rivers tend to change their course frequently. These rivers usually carry large amounts of sediments, causing their bed level to rise; the flatness of the terrain over which they flow results in frequent shifts in their course. In many cases, these rivers migrate such that they flow through cultivated lands. Among these rivers, the Karnali River, located in far western Nepal, is one of the most dynamic rivers in Nepal. The dynamic nature of Karnali is reflected by its erosive nature and high capacity to carry silts and sands originating from higher elevations. It is estimated that the Karnali River provides approximately 25% of Nepal’s total runoff [44] and carries approximately 20% of Nepal’s total sediment load. The sediment load in the Karnali River was estimated to be approximately 218 million tons per year [45]. The monsoon season (June-September) alone carries more than 90% of the annual sediment load. In addition, numerous flood events have occurred since 2000, including events in 2000, 2008, 2009, 2013, and 2014. The large amount of sediment transported by this river has a strong potential to destroy agricultural land and natural vegetated surfaces along the river course, thereby reducing the vegetation index. Figure 10b,c displays the changes of the river downstream reflected by the comparison between the false color images acquired from Landsat-8 and Landsat-7 in 2017 and 2000, respectively. The river course shifted to the west branch, resulting in less water flowing through the east branch and a significant increase in the LST, as shown in the subregion s1 in Figure 10a. A very strong change rate in the MAST can be observed in this region, with a value above 0.2 °C/yr. Meanwhile, the lack of water supply from the east branch changes the surface water condition in the eastern part and results in a relatively wide area of temperature increase.
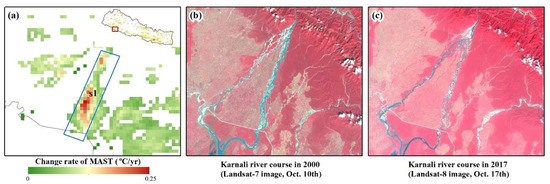
Figure 10.
(a) Change rate of the daytime MAST in the downstream part of the Karnali River in the Terai Plain during the period from 2000 to 2017, (b) false color image of the Karnali River course in 2000 acquired from Landsat-7 satellite data, and (c) false color image of the Karnali River course in 2017 acquired from Landsat-8 satellite data.
Changes in the river course cause significant changes in the surface thermal properties by transforming vegetated surfaces into barren river beds, thereby influencing the water condition along the river course. This phenomenon is reflected exactly by the significant temperature increase represented by the daytime MAST and MAXT, and similar variations can be found in other parts of the Terai Plain.
4.3. Snow and Glacier Retreat
The land surfaces of high-elevation areas, especially the High Himalayan region, are frequently covered by snow or glaciers. However, due to the warming effect of climate change, there is overwhelming evidence of rapid deglaciation in the Himalayas [10]. In addition, the major anthropogenic pollutant, black carbon, has been shown to significantly impact all of the Hindu-Kush, Karakorum and Himalayan mountain ranges by inducing an increase in the net shortwave radiation at the surface by an annual mean of 1 to 3 W/m2 and a localized warming between 0.05 and 0.3 °C [46]. This effect is clearly reflected by the reduction in the duration of the snow cover. The changes detected during this period, based on the MODIS 8-day snow cover product, confirm this impact. As illustrated in Figure 11a,b, the average snow cover duration, recorded as the number of observations per year, demonstrates a general decreasing trend. The mean value changed from 28.63 in 2001 to 28.38 in 2017, which equals 2 days. Due to the lack of fully annual coverage for the MODIS product in 2000, the MK trend test was applied to the data from 2001 and 2017. The detection shown in Figure 11c indicates that the areas with a decreasing snow cover duration are located primarily at the edges of the glaciers situated along the boundary between the High Mountains and High Himalaya regions. The spatial distribution of the snow cover duration is quite consistent with the distribution of the most significant change areas shown in Figure 6 and Figure 7. The mean change rate is -0.31 observations per year, with 2.4 days per year. There is no doubt that reductions in the snow and glacier cover will change the surface albedo, which in turn will increase the surface air temperature and surface temperature, thereby acting as a positive feedback mechanism. Compared to other driving factors, it is clear that the retreat of snow and glacier has the strongest effect. Behind this warming trend, this change will serve as a positive feedback to the thermal environment in those regions.
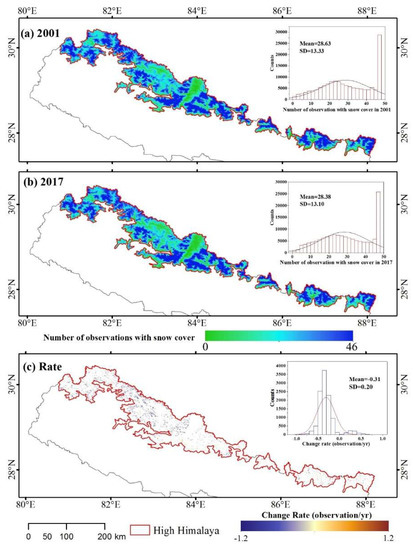
Figure 11.
Number of observations with the snow cover in (a) 2001 and (b) 2017, based on the MODIS 8-day snow cover product; and (c) the trend test during the period from 2001 and 2017.
4.4. Impacts from Climatic Warming
In addition to the LST increase induced by variations in the surface cover condition, the general climatic warming environment represents an important background for analyzing the temperature variations. Although in situ meteorological observations have been acquired over a relatively short period of time in Nepal, the observations indicate that the near-surface air temperature is increasing at a rather high rate with an average annual temperature increase of 0.06 °C between 1977 and 1994, as analyzed by Shrestha, et al. [5]; their study also found that the warming effect is more pronounced in higher-altitude Nepalese areas, such as the High Mountains and High Himalaya regions, while the warming effect is significantly weaker or even lacking in the Terai Plain and Siwalik Hills. Previous studies have also revealed a continuing rise in the maximum temperature at an annual rate between 0.04 °C and 0.08 °C [47].
In this study, we selected six meteorological stations, including one station on the Tibetan Plateau and one station in India close to the eastern edge of Nepal, distributed throughout different parts of this region. Figure 12a–f show the temporal trend of the annual mean air temperature of these stations since the 1970s. Although some stations have data gaps during this period, the trend analysis indicates that most stations exhibit a significant increasing trend, which agrees well with the findings of Shrestha, et al. [5]. Therefore, the study area experienced a definitive warming environment during this period, and the impact was likely stronger for the nighttime LST, according to the wide distribution of increased temperatures.
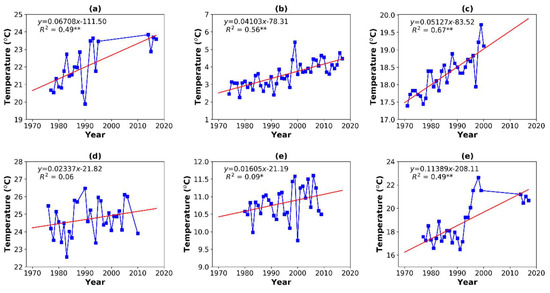
Figure 12.
Temporal trend of the annual mean near-surface air temperature observed at six selected meteorological stations: (a) Surkhet, (b) Tingri, (c) Kathmandu, (d) Bagdogra, (e) Chame, and (f) Dhankuta. (* Significant at a 90% confidence level; ** Significant at a 95% confidence level).
4.5. Elevation-Dependent Warming Effect
Besides the commonly considered factors discussed above, the topographic condition should be an important factor affecting the surface temperature variation due to the typical mountain environment in the Central Himalayas. Studies have clearly indicated that there is a growing evidence that the rate of surface warming is amplified with the elevation. For example, the high-mountain regions usually have a bigger increasing rate than those at the low land [48]. This phenomenon is referred to as the elevation-dependent warming (EDW) effect. In this study, the elevational distribution of the MAST change rate shown in Figure 13 clearly evidences this impact. A general increasing trend can be observed for both the daytime and nighttime MAST, in spite of the short decreasing trend in the daytime change rate during the low-elevation ranges (0 to 1600 m). The decreasing trend in the daytime change rate (Figure 13a) in the low-elevation areas should be attributed to the significantly warmer environment than the high-elevation mountain areas. The warming effect is more complicated in the low-elevation areas. However, the nighttime change rate as shown in Figure 13b exhibits a consistent increasing trend with the increase of elevation, and the comparison between the daytime and nighttime change pattern confirms the conclusion indicated by the Mountain Research Initiative, et al. [48] that the minimum temperatures (referred as the nighttime temperatures) show a stronger tendency towards EDW than the maximum temperatures (referred as the daytime temperatures). In addition to the change pattern, the change rates of the daytime MAST are all higher than those of the nighttime MAST.
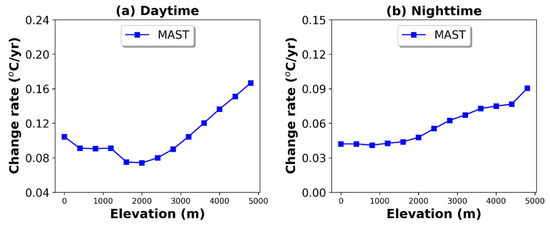
Figure 13.
Distribution of the change rate of the daytime and nighttime MAST at different elevation ranges.
5. Conclusions
Based on both daytime and nighttime MODIS/Terra daily LST products spanning the period from 2000 to 2017, the present study provided new insights into the dynamics of the thermal environment over the Central Himalaya by analyzing the spatiotemporal variability of LST. To eliminate the impacts of cloud cover conditions, especially during the monsoon season, an ATC model was applied to approximate the annual LST cycle and to obtain periodic parameters to describe the surface temperature yearly variation, including the annual mean and maximum values (MAST and MAXT), during both daytime and nighttime.
A reasonable spatial distribution pattern of the LST was observed for the daytime MAST and nighttime MAST over the whole region, where the surface temperature decreases with an increasing surface elevation. The average temperatures in the five physiographical regions displayed significant characteristics associated with their distinct topographic conditions, and the higher-elevation regions showed wider variations than the lower-elevation regions due to topographic complexities.
The trend analyses of the MAST and MAXT indicated a similar spatial distribution pattern. Most significantly changing areas demonstrated a positive trend, and nighttime changes were more significant than daytime changes according to the area statistics. This finding suggests that the nighttime LST is more sensitive to environmental changes than the daytime LST.
Behind the thermal environment variation, changes in the land surface cover are an important triggering factor, and their impacts can be reflected by the urban expansion, river course shift, and the retreat of the snow and glacier cover. In addition, the general warming environment revealed by the near-surface air temperature observations is one of the driving forces for the surface temperature increase.
Unlike previous studies based on in situ near-surface air temperature analyses, this study provided a new approach to better understand the climate change pattern over the Central Himalaya. The results clearly indicated a significant warming trend in the surface thermal environment throughout most of the study area and clearly classified their forcing factors. It suggests that climatic warming plays an important role in this variation, but that human activities also greatly accelerate the observed warming effect with variations in the surface cover condition. There is no doubt that the warming trend should further influence the montane ecosystem provision and modify the major hydro-ecological processes over the study area. However, as a comprehensive analysis, the result finds it hard to discriminate the quantitative contribution of climate change on the local thermal environment from other factors. This should be a further research direction, to predict its impact, especially in the High Himalaya region.
Author Contributions
W.Z., A.L., and Y.W. contributed to the conceptualization of this work, W.Z and J.H. conducted the algorithm design, W.Z. wrote the paper, and A.L., Y.W., and D.X. revised the paper. W.Z., J.H., and F.W. performed the experiment and analyze the results. All authors have contributed significantly and have participated sufficiently to take the responsibility for this research.
Funding
This research was funded by the National Natural Science Foundation of China (41771409), the 135 Strategic Program of the Institute of Mountain Hazards and Environment, CAS (SDS-135-1708), the Strategic Priority Research Program of the Chinese Academy of Sciences (XDA20020401), the Hundred Young Talents Program of the Institute of Mountain Hazards and Environment (SDSQB-2015-02), the CAS "Light of West China" Program, and the Youth Innovation Promotion Association CAS (2016333).
Conflicts of Interest
The authors declare no conflict of interest.
References
- Messerli, B. Global Change and the World’s Mountains; International Mountain Society: Bern, Switzerland; pp. 55–63.
- Khadka, N.; Zhang, G.; Thakuri, S. Glacial Lakes in the Nepal Himalaya: Inventory and Decadal Dynamics (1977–2017). Remote Sens. 2018, 10, 913. [Google Scholar] [CrossRef]
- Sigdel, S.R.; Wang, Y.; Camarero, J.J.; Zhu, H.; Liang, E.; Peñuelas, J. Moisture-mediated responsiveness of treeline shifts to global warming in the Himalayas. Glob. Chang. Biol. 2018, 24, 5549–5559. [Google Scholar] [CrossRef]
- Qi, W.; Zhang, Y.; Gao, J.; Yang, X.; Liu, L.; Khanal, N.R. Climate change on the southern slope of Mt. Qomolangma (Everest) Region in Nepal since 1971. J. Geogr. Sci. 2013, 23, 595–611. [Google Scholar] [CrossRef]
- Shrestha, A.B.; Wake, C.P.; Mayewski, P.A.; Dibb, J.E. Maximum Temperature Trends in the Himalaya and Its Vicinity: An Analysis Based on Temperature Records from Nepal for the Period 1971–1994. J. Clim. 1999, 12, 2775–2786. [Google Scholar] [CrossRef]
- Nepal, S. Impacts of climate change on the hydrological regime of the Koshi river basin in the Himalayan region. J. Hydro-Environ. Res. 2016, 10, 76–89. [Google Scholar] [CrossRef]
- Shrestha, A.B.; Bajracharya, S.R.; Sharma, A.R.; Duo, C.; Kulkarni, A. Observed trends and changes in daily temperature and precipitation extremes over the Koshi river basin 1975–2010. Int. J. Climatol. 2017, 37, 1066–1083. [Google Scholar] [CrossRef]
- Sharma, K.P.; Moore, B.; Vorosmarty, C.J. Anthropogenic, Climatic, and Hydrologic Trends in the Kosi Basin, Himalaya. Clim. Chang. 2000, 47, 141–165. [Google Scholar] [CrossRef]
- Agarwal, A.; Babel, M.S.; Maskey, S.; Shrestha, S.; Kawasaki, A.; Tripathi, N.K. Analysis of temperature projections in the Koshi River Basin, Nepal. Int. J. Climatol. 2016, 36, 266–279. [Google Scholar] [CrossRef]
- Shrestha, A.B.; Aryal, R. Climate change in Nepal and its impact on Himalayan glaciers. Reg. Environ. Chang. 2011, 11, 65–77. [Google Scholar] [CrossRef]
- Immerzeel, W.W.; van Beek, L.P.H.; Bierkens, M.F.P. Climate Change Will Affect the Asian Water Towers. Science 2010, 328, 1382–1385. [Google Scholar] [CrossRef] [PubMed]
- Mishra, V. Climatic uncertainty in Himalayan water towers. J. Geophys. Res. Atmos. 2015, 120, 2689–2705. [Google Scholar] [CrossRef]
- Li, Z.-L.; Tang, B.-H.; Wu, H.; Ren, H.; Yan, G.; Wan, Z.; Trigo, I.F.; Sobrino, J.A. Satellite-derived land surface temperature: Current status and perspectives. Remote Sens. Environ. 2013, 131, 14–37. [Google Scholar] [CrossRef]
- Berg, A.; Lintner, B.R.; Findell, K.L.; Malyshev, S.; Loikith, P.C.; Gentine, P. Impact of soil moisture–atmosphere interactions on surface temperature distribution. J. Clim. 2014, 27, 7976–7993. [Google Scholar] [CrossRef]
- Tomlinson, C.J.; Chapman, L.; Thornes, J.E.; Baker, C. Remote sensing land surface temperature for meteorology and climatology: A review. Meteorol. Appl. 2011, 18, 296–306. [Google Scholar] [CrossRef]
- Bertoldi, G.; Notarnicola, C.; Leitinger, G.; Endrizzi, S.; Zebisch, M.; Della Chiesa, S.; Tappeiner, U. Topographical and ecohydrological controls on land surface temperature in an alpine catchment. Ecohydrology 2010, 3, 189–204. [Google Scholar] [CrossRef]
- Eleftheriou, D.; Kiachidis, K.; Kalmintzis, G.; Kalea, A.; Bantasis, C.; Koumadoraki, P.; Spathara, M.E.; Tsolaki, A.; Tzampazidou, M.I.; Gemitzi, A. Determination of annual and seasonal daytime and nighttime trends of MODIS LST over Greece—Climate change implications. Sci. Total Environ. 2018, 616–617, 937–947. [Google Scholar] [CrossRef] [PubMed]
- Peng, S.-S.; Piao, S.; Zeng, Z.; Ciais, P.; Zhou, L.; Li, L.Z.X.; Myneni, R.B.; Yin, Y.; Zeng, H. Afforestation in China cools local land surface temperature. Proc. Natl. Acad. Sci. USA 2014, 111, 2915–2919. [Google Scholar] [CrossRef]
- Li, Y.; Zhao, M.; Mildrexler, D.J.; Motesharrei, S.; Mu, Q.; Kalnay, E.; Zhao, F.; Li, S.; Wang, K. Potential and Actual impacts of deforestation and afforestation on land surface temperature. J. Geophys. Res. Atmos. 2016, 121, 14372–14386. [Google Scholar] [CrossRef]
- Yuzhen, Z.; Shunlin, L. Impacts of land cover transitions on surface temperature in China based on satellite observations. Environ. Res. Lett. 2018, 13, 024010. [Google Scholar]
- Bechtel, B. A New Global Climatology of Annual Land Surface Temperature. Remote Sens. 2015, 7, 2850. [Google Scholar] [CrossRef]
- Bechtel, B. Robustness of Annual Cycle Parameters to Characterize the Urban Thermal Landscapes. IEEE Geosci. Remote Sens. Lett. 2012, 9, 876–880. [Google Scholar] [CrossRef]
- Fu, P.; Weng, Q. Variability in annual temperature cycle in the urban areas of the United States as revealed by MODIS imagery. ISPRS J. Photogramm. Remote Sens. 2018, 146, 65–73. [Google Scholar] [CrossRef]
- Alkama, R.; Cescatti, A. Biophysical climate impacts of recent changes in global forest cover. Science 2016, 351, 600–604. [Google Scholar] [CrossRef]
- Mishra, B.; Babel, M.S.; Tripathi, N.K. Analysis of climatic variability and snow cover in the Kaligandaki River Basin, Himalaya, Nepal. Theor. Appl. Climatol. 2014, 116, 681–694. [Google Scholar] [CrossRef]
- Shrestha, M.; Wang, L.; Koike, T.; Xue, Y.; Hirabayashi, Y. Modeling the Spatial Distribution of Snow Cover in the Dudhkoshi Region of the Nepal Himalayas. J. Hydrometeorol. 2011, 13, 204–222. [Google Scholar] [CrossRef]
- Shakya, N.; Yamaguchi, Y. Vegetation, water and thermal stress index for study of drought in Nepal and central northeastern India. Int. J. Remote Sens. 2010, 31, 903–912. [Google Scholar] [CrossRef]
- Niclos, R.; Valiente, J.A.; Barbera, M.J.; Caselles, V. Land Surface Air Temperature Retrieval From EOS-MODIS Images. IEEE Geosci. Remote Sens. Lett. 2014, 11, 1380–1384. [Google Scholar] [CrossRef]
- Stroppiana, D.; Antoninetti, M.; Brivio, P.A. Seasonality of MODIS LST over Southern Italy and correlation with land cover, topography and solar radiation. Eur. J. Remote Sens 2014, 47, 133–152. [Google Scholar] [CrossRef]
- Tang, R.; Li, Z.-L. Evaluation of two end-member-based models for regional land surface evapotranspiration estimation from MODIS data. Agric. For. Meteorol. 2015, 202, 69–82. [Google Scholar] [CrossRef]
- Minacapilli, M.; Consoli, S.; Vanella, D.; Ciraolo, G.; Motisi, A. A time domain triangle method approach to estimate actual evapotranspiration: Application in a Mediterranean region using MODIS and MSG-SEVIRI products. Remote Sens. Environ. 2016, 174, 10–23. [Google Scholar] [CrossRef]
- Bai, L.; Long, D.; Yan, L. Estimation of Surface Soil Moisture with Downscaled Land Surface Temperatures Using a Data Fusion Approach for Heterogeneous Agricultural Land. Water Resour. Res. 2019, 55, 1105–1128. [Google Scholar] [CrossRef]
- Wan, Z. New refinements and validation of the collection-6 MODIS land-surface temperature/emissivity product. Remote Sens. Environ. 2014, 140, 36–45. [Google Scholar] [CrossRef]
- Duan, S.-B.; Li, Z.-L.; Wu, H.; Leng, P.; Gao, M.; Wang, C. Radiance-based validation of land surface temperature products derived from Collection 6 MODIS thermal infrared data. Int. J. Appl. Earth Obs. Geoinf. 2018, 70, 84–92. [Google Scholar] [CrossRef]
- Huang, F.; Zhan, W.; Voogt, J.; Hu, L.; Wang, Z.; Quan, J.; Ju, W.; Guo, Z. Temporal upscaling of surface urban heat island by incorporating an annual temperature cycle model: A tale of two cities. Remote Sens. Environ. 2016, 186, 1–12. [Google Scholar] [CrossRef]
- Sismanidis, P.; Bechtel, B.; Keramitsoglou, I.; Kiranoudis, C.T. Mapping the Spatiotemporal Dynamics of Europe’s Land Surface Temperatures. IEEE Geosci. Remote Sens. Lett. 2018, 15, 202–206. [Google Scholar] [CrossRef]
- Pingale, S.M.; Khare, D.; Jat, M.K.; Adamowski, J. Spatial and temporal trends of mean and extreme rainfall and temperature for the 33 urban centers of the arid and semi-arid state of Rajasthan, India. Atmos. Res. 2014, 138, 73–90. [Google Scholar] [CrossRef]
- Araghi, A.; Mousavi Baygi, M.; Adamowski, J.; Malard, J.; Nalley, D.; Hasheminia, S.M. Using wavelet transforms to estimate surface temperature trends and dominant periodicities in Iran based on gridded reanalysis data. Atmos. Res. 2015, 155, 52–72. [Google Scholar] [CrossRef]
- Mondal, A.; Khare, D.; Kundu, S. Spatial and temporal analysis of rainfall and temperature trend of India. Theor. Appl. Climatol. 2015, 122, 143–158. [Google Scholar] [CrossRef]
- Zhang, T.; Peng, J.; Liang, W.; Yang, Y.; Liu, Y. Spatial–temporal patterns of water use efficiency and climate controls in China’s Loess Plateau during 2000–2010. Sci. Total Environ. 2016, 565, 105–122. [Google Scholar] [CrossRef]
- Shadmani, M.; Marofi, S.; Roknian, M. Trend Analysis in Reference Evapotranspiration Using Mann-Kendall and Spearman’s Rho Tests in Arid Regions of Iran. Water Resour. Manag. 2012, 26, 211–224. [Google Scholar] [CrossRef]
- Sen, P.K. Estimates of the Regression Coefficient Based on Kendall’s Tau. J. Am. Stat. Assoc. 1968, 63, 1379–1389. [Google Scholar] [CrossRef]
- Ishtiaque, A.; Shrestha, M.; Chhetri, N. Rapid Urban Growth in the Kathmandu Valley, Nepal: Monitoring Land Use Land Cover Dynamics of a Himalayan City with Landsat Imageries. Environments 2017, 4, 72. [Google Scholar] [CrossRef]
- Aryal, R.S. Water Resources of Nepal in the Context of climate Change; Government of Nepal, Water and Energy Commission Secretariat: Kathmandu, Nepal, 2011.
- Thapa, B.; Shrestha, R.; Dhakal, P.; Thapa, B.S. Sediment in Nepalese hydropower projects. In Proceedings of the International Conference on the Great Himalayas: Climate, Health, Ecology, Management and Conservation, Kathmandu, Nepal, 12–15 January 2003. [Google Scholar]
- Ménégoz, M.; Krinner, G.; Balkanski, Y.; Boucher, O.; Cozic, A.; Lim, S.; Ginot, P.; Laj, P.; Gallée, H.; Wagnon, P.; et al. Snow cover sensitivity to black carbon deposition in the Himalayas: From atmospheric and ice core measurements to regional climate simulations. Atmos. Chem. Phys. 2014, 14, 4237–4249. [Google Scholar] [CrossRef]
- Lohani, S.N. Climate change in Nepal–shall we wait until bitter consequences? J. Agric. Environ. 2007, 8, 38–45. [Google Scholar] [CrossRef][Green Version]
- Mountain Research Initiative EDW Working Group; Pepin, N.; Bradley, R.S.; Diaz, H.F.; Baraer, M.; Caceres, E.B.; Forsythe, N.; Fowler, H.; Greenwood, G.; Hashmi, M.Z.; et al. Elevation-dependent warming in mountain regions of the world. Nat. Clim. Chang. 2015, 5, 424–430. [Google Scholar] [CrossRef]
© 2019 by the authors. Licensee MDPI, Basel, Switzerland. This article is an open access article distributed under the terms and conditions of the Creative Commons Attribution (CC BY) license (http://creativecommons.org/licenses/by/4.0/).