Article

L-Band Passive Microwave Data from SMOS for River Gauging Observations in Tropical Climates

1
Department of Photogrammetry and Geoinformatics, Budapest University of Technology and Economics, H-1111 Budapest, Hungary
2
Jet Propulsion Laboratory, California Institute of Technology, Pasadena, CA 91109, USA
3
Institute of Arctic and Alpine Research, University of Colorado, Boulder, CO 80309, USA
*
Author to whom correspondence should be addressed.
Remote Sens. 2019, 11(7), 835; https://doi.org/10.3390/rs11070835
Submission received: 18 February 2019 / Revised: 2 April 2019 / Accepted: 2 April 2019 / Published: 8 April 2019
(This article belongs to the Section Remote Sensing in Geology, Geomorphology and Hydrology)

Abstract

:
The Global Flood Detection Systems (GFDS) currently operated at the European Commission’s Joint Research Centre (JRC) is a satellite-based observation system that provides daily stream flow measurements of global rivers. The system was initially established using NASA Advanced Microwave Scanning Radiometer—Earth Observing System (AMSR-E) Ka-band passive microwave satellite data. Since its initiation in 2006, the methodology and the GFDS database have been further adapted for data acquired by the Tropical Rainfall Measuring Mission (TRMM) GOES Precipitation Index (GPI), the AMSR2 sensor onboard the Global Change Observation Mission – Water satellite (GCOM-W1), and the Global Precipitation Measurement (GPM) GPM Microwave Imager (GMI) sensor. This paper extends the same flow monitoring methodology to low frequency (L-band) passive microwave observations obtained by the European Space Agency (ESA) Soil Moisture and Ocean Salinity (SMOS) sensor that was launched in 2009. A primary focus is tropical climate regions with dense rainforest vegetation (the Amazon, the Orinoco, and the Congo basins) where high-frequency microwave observations from GFDS reveal a significant influence of vegetation cover and atmospheric humidity. In contrast, SMOS passive microwave signatures at the much lower L-band frequency exhibit deeper penetration through the dense vegetation and minimal atmospheric effects, enabling more robust river stage retrievals in these regions. The SMOS satellite river gauging observations are for 2010–2018 and are compared to single-sensor GFDS data over several river sites. To reduce noise, different filtering techniques were tested to select the one most suitable for analysis of the L-band time series information. In-situ water level (stage) measurements from the French Observation Service SO Hybam database were used for validation to further evaluate the performance of the SMOS data series. In addition to GFDS data, water stage information from Jason-2 and Jason-3 altimetry was compared to the microwave results. Correlation of SMOS gauging time series with in-situ stage data revealed a good agreement (r = 0.8–0.94) during the analyzed period of 2010–2018. Moderate correlation was found with both high frequency GFDS data series and altimetry data series. With lower vegetation attenuation, SMOS signatures exhibited a robust linear relationship with river stage without seasonal bias from the complex hysteresis effects that appeared in the Ka-band observations, apparently due to different attenuation impacts through dense forests at different seasonal vegetation stages.

Graphical Abstract

1. Introduction

Since the earliest Earth-orbiting satellites, remote sensing has been used as a tool to understand and map inundation extent from space. Current satellite technology has successfully addressed the crucial need for hydrological measurements over remote, inaccessible, and extensive locations across the Earth. Hydrological observations from space deliver timely information over vast spatial extents from combinations of satellite sensors and methodologies. Alsdorf and others provide a comprehensive review about measuring hydraulic parameters and hydrology from space [1]. That paper summarizes fundamental principles of in-land water observations from different satellite sensors, including the existing (circa 2007) and planned space missions for water measurements.
Hydrological applications were among the first major uses of optical satellite sensors since the launch of the first Landsat sensor [2]. Optical satellite data have been widely applied in operational flood mapping for decades [3,4,5,6,7], with various algorithms developed to generate automated flood maps from different data sources. Moreover, efforts have been made for automated near real-time operational global flood mapping with the Moderate Resolution Imaging Spectroradiometer (MODIS) instrument on the Terra and Aqua satellites [8]. Yet, methods based on optical sensors are limited by cloud obscurity, hindering systematic observations in tropical climates where cloud cover can be persistent and pervasive.
Water extent mapping is achievable with synthetic aperture radar (SAR) images since water surfaces are generally characterized by weak backscattering due to the specular reflection of incidence microwave signals [9]. The imaging capability of SAR sensors and the weather independent and active illumination capabilities enable SAR data to be extensively used for flood extent mapping [10,11,12,13,14]. Besides water extent monitoring, in-land water surface elevation can also be measured by profiling radar altimetry and by SAR interferometry. SAR-based water level estimates are confounded, however, by difficulties with the acquisition geometry (e.g., overlay effects), wind roughening of the water surface, and vegetation cover, including perennial, seasonal, and transient floating vegetation [15].
Under favorable conditions, altimetry techniques provide a reliable source of water surface elevation measurement comparable to in-situ stage measurements. For the past 20 years, nadir altimetry satellite missions have been successfully used to monitor surface elevation of rivers and lakes. Since the early 1990s, altimetry missions like TOPEX/Poseidon mission (1992–2006) and its successor Jason-1, 2, 3 generations (from 2001 to ongoing), Environmental Satellite (ENVISAT) Radar Altimeter 2 (RA-2) (from 2002 to 2010), or CryoSat-2 (2010—ongoing) have been successfully monitoring in-land water bodies [16,17,18,19]. The Laboratoire d’Etudes en Géophysique et Océanographie Spatiales (LEGOS) in France and the United States Department of Agriculture, Foreign Agricultural Service (USDA-FAS) are routinely monitoring lake and reservoir height variations of many large continental water bodies around the world [20,21].
A limitation of satellite altimetry is that the repeat cycle of sensors ranges between 10 and 369 days. For hydrological observations, the low temporal sampling frequency fails to detect flood extremes or rapid changes in river flow conditions. Moreover, the acquisition geometry enables water level measurements only at intersections of the satellite track with the river channel [19]. For this reason, due to the ground track spacing of altimetry satellites, virtual stations for water level observations are usually located kilometers apart with some much larger spatial gaps.
Passive microwave sensors can overcome these limitations for hydrological applications in both repeat cycle and spatial sampling distances. The first pioneer study to estimate flooded area was completed by Stippel [22] in the Amazon basin using the Scanning Multichannel Microwave Radiometer (SMMR). Inundation extent was derived using linear mixing models of the microwave emission from major landscape units and given the low spatial resolution of the SMMR data. Observations by SMMR were only available at weekly intervals. Since then, new generation microwave instruments have been launched with improved performance and more frequent revisit capability. The Tropical Rainfall Measuring Mission (TRMM) satellite from 1997, which extended over 17 years, measured spatial and temporal variation of tropical rainfall and was used to support hydrologic modeling but without a global coverage [23].
The Advanced Microwave Scanning Radiometer—Earth Observing System (AMSR-E) launched in 2002 was a passive microwave radiometer capable of global monitoring on a nearly daily basis. Several researchers improved hydrological modelling using AMSR-E data [24,25,26], but none of them attempted to directly monitor river flow on a systematic, global, daily basis [7]. The first systems undertaken to monitor global river flow include the Dartmouth Flood Observatory (DFO) River Watch and the European Commission’s Joint Research Center (JRC) Global Flood Detection System (GFDS). Both are based on the methodology developed by Brakenridge and others [27] from the first principle of Maxwell’s equations establishing the fundamental physics of electromagnetic emission and the observed and modeled sensitivity of certain frequencies of emitted microwave emission over the areal coverage of water versus land. In particular, the JRC’s GFDS offers a unique passive microwave satellite gauging database with long-term, systematic, and operational observations of rivers across the world [28].
Microwave observations of river discharge changes have been successfully calibrated to river discharge units using a global flood hydrology model [29]. Such observations have served as a basis for further scientific investigations, such as the analysis of reoccurring events or the effects of global climate change around the world [30]. The GFDS database has also been extensively applied in independent studies [31,32,33,34,35]. The gauging time series have been used for a range of applications, such as estimating stream flow [27,36], river discharge nowcasting and forecasting [37], model calibration, and validation of flood events. Case studies [38,39,40] demonstrate its relevance to filling the missing gap in hydrological observations around the globe. Since its launch in 2006, the GFDS database has been extended with data from successive passive microwave satellites: The Tropical Rainfall Measuring Mission (TRMM), the AMSR2, and the Global Precipitation Measurement (GPM) Microwave Imager sensors [41,42]. Furthermore, GFDS observations have been combined with optical data to monitor and improve discharge estimations [40,43].
In 1995, Mertes [44] recognized that water surface observations from a remote sensing perspective of the Amazon River beneath flooded vegetation is difficult. Other tropical basins such as the Congo or the Mekong have similar dense vegetation cover. High-frequency passive microwave sensors used in the GFDS model generally show low performance in detecting flow variations occurring in densely vegetated areas. This might become a critical issue over tropical rainforests, where high-frequency microwave radiation can be obscured by dense vegetation canopy characterized by highest leaf area index (LAI) 5–7 values compared to other climate regions [45]. In this regard, we investigate here the use of passive microwave data from the European Space Agency (ESA) Soil Moisture and Ocean Salinity (SMOS) mission operated at a lower frequency in the L band. The primary focus is the tropical climate zone and densely vegetated regions.
Launched in 2009, SMOS is an ESA satellite carrying a two-dimensional (2D) coherent passive radiometer operated at the L-band frequency of 1.4 GHz, much lower than the Ka-band frequency of 36.5 GHz used in the GFDS. SMOS uses a coherent interferometric processing method, whereas the Ka-band passive data are from a traditional passive microwave acquisition method using intensity measurements. Over land, SMOS enables measuring the Earth surface emissivity related to soil moisture in the top few centimeters of the soil [46]. SMOS data are broadly used in studies for soil moisture retrieval over land and sea salinity mapping over oceans [47,48]. Yet, only limited case studies apply SMOS data directly to flood mapping or river flow observations. Vittucci et al. [49] uses SMOS data as input to hydrological forecasting but not for systematic river flow monitoring. Parrens et al. [50] map water surface fraction over the Amazon basin by SMOS in a spatial context but not on a pixel-based single-observation methodology. We now compare the performance of low and high frequency passive microwave data to observe changing flow conditions over rivers in the tropical climate on a systematic basis and to provide physical insights into the behavior of different passive microwave sensors in the selected study areas.

2. Methods

2.1. GFDS Single Sensor Method

The GFDS single sensor methodology was initially developed for Ka-band AMSR-E passive microwave senor data. The observations of the descending orbit, H polarization, and 36 GHz frequency, were found to be sensitive to water surface changes. Brightness temperature (Tb) measured by a passive microwave radiometer is related to the physical temperature (T) and the emissivity (ε) of the surface given by:
Tb = ε T
In general, a lower Tb(m) occurs over a footprint containing water bodies compared to a higher Tb(c) over a footprint on land without surface water. Under a constant physical temperature T, Tb(m) decreases over locations along river channel, where rising water level (river stage) causes a corresponding increase in water surface extent. However, microwave radiation is also influenced by many factors including physical temperature (T), permittivity (P), surface roughness (R), and soil moisture (θ):
Tb = f (T, P, R, θ)
Information related to surface water change is primarily conveyed in the emissivity controlled by the effective permittivity over the targeted area, while other factors such as roughness, soil moisture, vegetation cover, and atmospheric conditions may affect the brightness temperature as measured by an orbiting satellite radiometer above the atmosphere. According to (1), the physical temperature T must be cancelled out in order to get at the emissivity ε. This is achieved approximately by dividing the measurement Tb(m) value received over a river channel (measurement pixel) by a calibration observation Tb(c) not influenced by water change (calibration pixel), which is chosen in the vicinity of the measurement pixel, thus the physical temperature T is similar thanks to the long correlation length of regional temperature variability [27]. In this method, the signal ratio is defined by the relationship:
C/M Ratio = Tb(c)/Tb(m)
where Tb(c) and Tb(m) are the brightness temperature of the calibration and measurement pixel, respectively.
The time series of the extracted C/M ratio results in systematic satellite based hydrograph measurements for selected river sites with a daily or near-daily temporal resolution. With this satellite method, the detection of flow condition changes over ungauged and inaccessible remote river channels is, in principle, feasible from space on a frequent temporal sampling basis in the tropics and higher latitudes. The single source GFDS database includes hydrological time series of more than 3000 satellite gauging sites over various river basins around the world (Figure 1). The data include time series from 1997 to present. As new satellites were launched, the initial data series based on AMSR-E satellite data was extended to AMSR2, backwards (using TRMM, to 1997), and GPM high frequency passive microwave sensor data (all at ~37 GHz).
Several studies have shown good correlation values between these Ka-band satellite-retrieved river hydrographs and in-situ gauging measurements [27,28]. The best-performing sites were found in arid and semi-arid climates such as in North Africa, where the low influence of vegetation and low atmospheric humidity conditions provide high signal-to-noise ratios, and the changes in the C/M signal ratio are mostly dependent on water surface area changes and discharge variations. A worse uncertainty occurs in the tropics, where dense vegetation and humid weather conditions may cause inconsistent signal time series [28].

2.2. SMOS Data Processing

Satellite based river gauging time series were obtained from the SMOS data record covering the period from January 2010 to December 2018. For a particular point on Earth, the SMOS acquisition revisit time is between 1 and 3 days, and the complete surface is covered by the sensor in 3 days. For this study, data were downloaded from the French Centre Aval de Traitement des Données SMOS (CATDS) ground segment of the Centre National d’Etudes Spatiales (CNES). It provided SMOS daily gridded data indicated as Level 3 (L3) and Level 4 (L4), which were global products generated from swath data for each day stored in the SMOS Products Dissemination Service (SIPAD) database. Daily gridded data included all brightness temperatures transformed from antenna frame to ground reference frame. The products were bin-averaged in 14 angle classes reaching from 2.5° to 67.5°. Ascending and descending orbits were processed separately [51]. SMOS L3 daily grid products contained brightness temperature (Tb) provided as the top of the atmosphere radiation in both vertical (V) and horizontal (H) polarizations. L3 brightness temperature products were delivered using an open license and free of charge basis [52].
To retrieve satellite hydrographs following the GFDS single sensor methodology [28], the SMOS H-polarization, single inclination 10 (47.5°), and descending orbit variables were extracted from L3 products with a pixel size of 25 × 25 km. Downloaded and compressed grid files were processed in a MATLAB environment, and time series were extracted for the selected river locations. Daily SMOS observations were provided in the Equal-Area Scalable Earth Grid, Version 2.0 (EASE-Grid 2.0) global grid (EPGS: 6933). The latitude-longitude locations of the predefined satellite gauging sites were transformed into the gridded image coordinates to enable data extraction. The Geo2easeGrid converter was used to transform latitude and longitude locations to corresponding row and column values in the EASE2 grid [53].
To compare the Ka-band GFDS and the L-band SMOS based observations, the same methodology and acquisition parameters were chosen for both. Thus, we used H polarization and inclination 47.5° to derive the gauging observations from SMOS data. Inclination 10 (47.5°) was selected due to its highest spatial coverage on a global scale. When using inclination 8 (37.5°) on lower latitudes of the study area, 20% more data gap appeared, and the time series were less complete.
The performance of inundation detection in the tropics is dependent on the capability to penetrate dense vegetation to receive microwave emission from the ground beneath the canopy. With smaller vegetation attenuation effects, lower frequency microwave radiation is less influenced by forest canopy in these regions [49,50]. Thereby, we expected that SMOS brightness temperature results might exhibit a better performance in monitoring river flow conditions or detecting flood events in tropical regions.
The single-sensor GFDS method described in Section 2.1 was used to obtain satellite-based gauging data for selected sites over the world. About 3000 gauging hydrographs were derived for the period covering 2010 to 2018 globally on a nearly daily basis (Figure 1). Satellite gauging time series (C/M signal) were calculated using the calibration and measurement observations in the same day.
To understand the behavior of L-band radiation in densely vegetated rainforests, study areas were selected in the Amazon basin, the Orinoco catchment (both in South America), and the Congo watershed in Africa. All the studied catchments revealed strong seasonal variations in their SMOS C/M signals. In the Amazon region, observations with low noise were found over locations with wide river cross-sections where large lakes are formed nearby the main channel. This can be explained by the fact that the percentage of water surface coverage in the pixel is relatively high. Moreover, over those locations, rising water level causes a significant increase in water extent on the level floodplain without pronounced mountainous topography. Thus, not only the river width or water fraction but also the floodplain morphology plays key roles in the performance of SMOS hydrographs in the study area.
From dozens of potential observation sites, the locations selected for this study were where significant C/M signal variations occurred in the SMOS time series during seasonal flow variations in the tropics. As a result, around 20 sites were included for detailed study to assess the performance of low-frequency SMOS flow observations in regions with dense tropical vegetation (Figure 2). Due to the large pixel size of SMOS data (25 × 25 km) with the inherently low resolution at low frequency (this is a trade-off compared to the finer resolution of high-frequency data), the selection of calibration pixels was limited. In the Amazon, very few pixels were not influenced by water presence on the ground. The annual periodical variations in microwave radiation of many calibration pixels are not only influenced by land surface temperature and other terrestrial and vegetation factors but also by small changes in water area fraction of each pixel.
Locations of the observation/measurement pixels over the river channel were selected based on previous remote sensing optical observations of the Dartmouth Flood Observatory. Satellite gauging sites were selected where significant water area variations occurred during flood events between 1999 and 2005 [27]. The choice of calibration pixel can also influence the resulting C/M signal and change the amount of noise in the C/M time series. The GFDS processor attempts to address this issue by automatically selecting the “driest” (brightest) pixel in a surrounding 9 × 9 pixel grid [54]. However, this approach changes the location of the actual comparison pixel used, and all of the nearby “dry” pixels vary somewhat in their microwave emission values. While both approaches introduce noise, there are advantages to each. Thus: (1) a single, carefully selected comparison pixel (land parcel) will drain input rainwater through discrete and relatively small channels, thus surface water area effects on emission remain small. This provides a good “dry” comparison to the river measurement pixel through the seasons; (2) the GFDS selection approach can be automatically implemented and thus focuses attention on selection of robust river measurement pixels, where changing river discharge correspondingly produces the most easily measured change in water surface areas.
In this study, a manual supervision of the location of the calibration pixels was essential to remove calibration pixels showing signs of significant water presence. Then, to reduce noise of the satellite hydrographs, the extracted time series were smoothed with different filtering techniques described in Section 2.3.
A comprehensive analysis was carried out to evaluate the performance of SMOS-based hydrological observations in the tropics. First, low frequency L-band datasets were compared to high frequency GFDS data series. After that, SMOS-derived gauging measurements were compared with in-situ river stage (water level) data to estimate uncertainty of flow observations and to validate results in the study area of the Amazon, the Orinoco, and the Congo basins. The accuracy estimates were based on water level (elevation) measurements obtained while SMOS datasets were observing water extend variations on the floodplain. This was possible because water stage and water extent are actually dependent variables over most natural flood plains. In a next step, nearby river altimetry observations were compared to in situ-water level observations in order to compare the performance of passive microwave satellite observations and satellite altimetry in the study area. Results are discussed in Section 3.

2.3. SMOS Time Series Filtering

The SMOS C/M (signal ratio) time series revealed varying amounts of noise. To smoothen time series and reduce noise, the initial GFDS methodology applied a 4-day (forward running mean) temporal filter to its data series. However, this caused a slight shift of the measurement values in time and resulted in a temporal delay during any sudden surface water change. To reduce this time delay, different types of filtering methods were tested on the SMOS data to find the one most useful for this specific application. The following types of filtering methods were applied and tested using MATLAB functions:
  • mean filter: moving average over given time window,
  • median filter: moving median over given time window,
  • peak envelope filter: smoothly varying estimate of highs and lows of a signal averaged in a given time window [55],
  • spline smoothening: cubic smoothing curve fitted to the data applying a parameter that controls the degree of fit [55],
  • local regression: locally weighted linear regression where smoothed value is determined by neighboring data points defined within a given span [55].
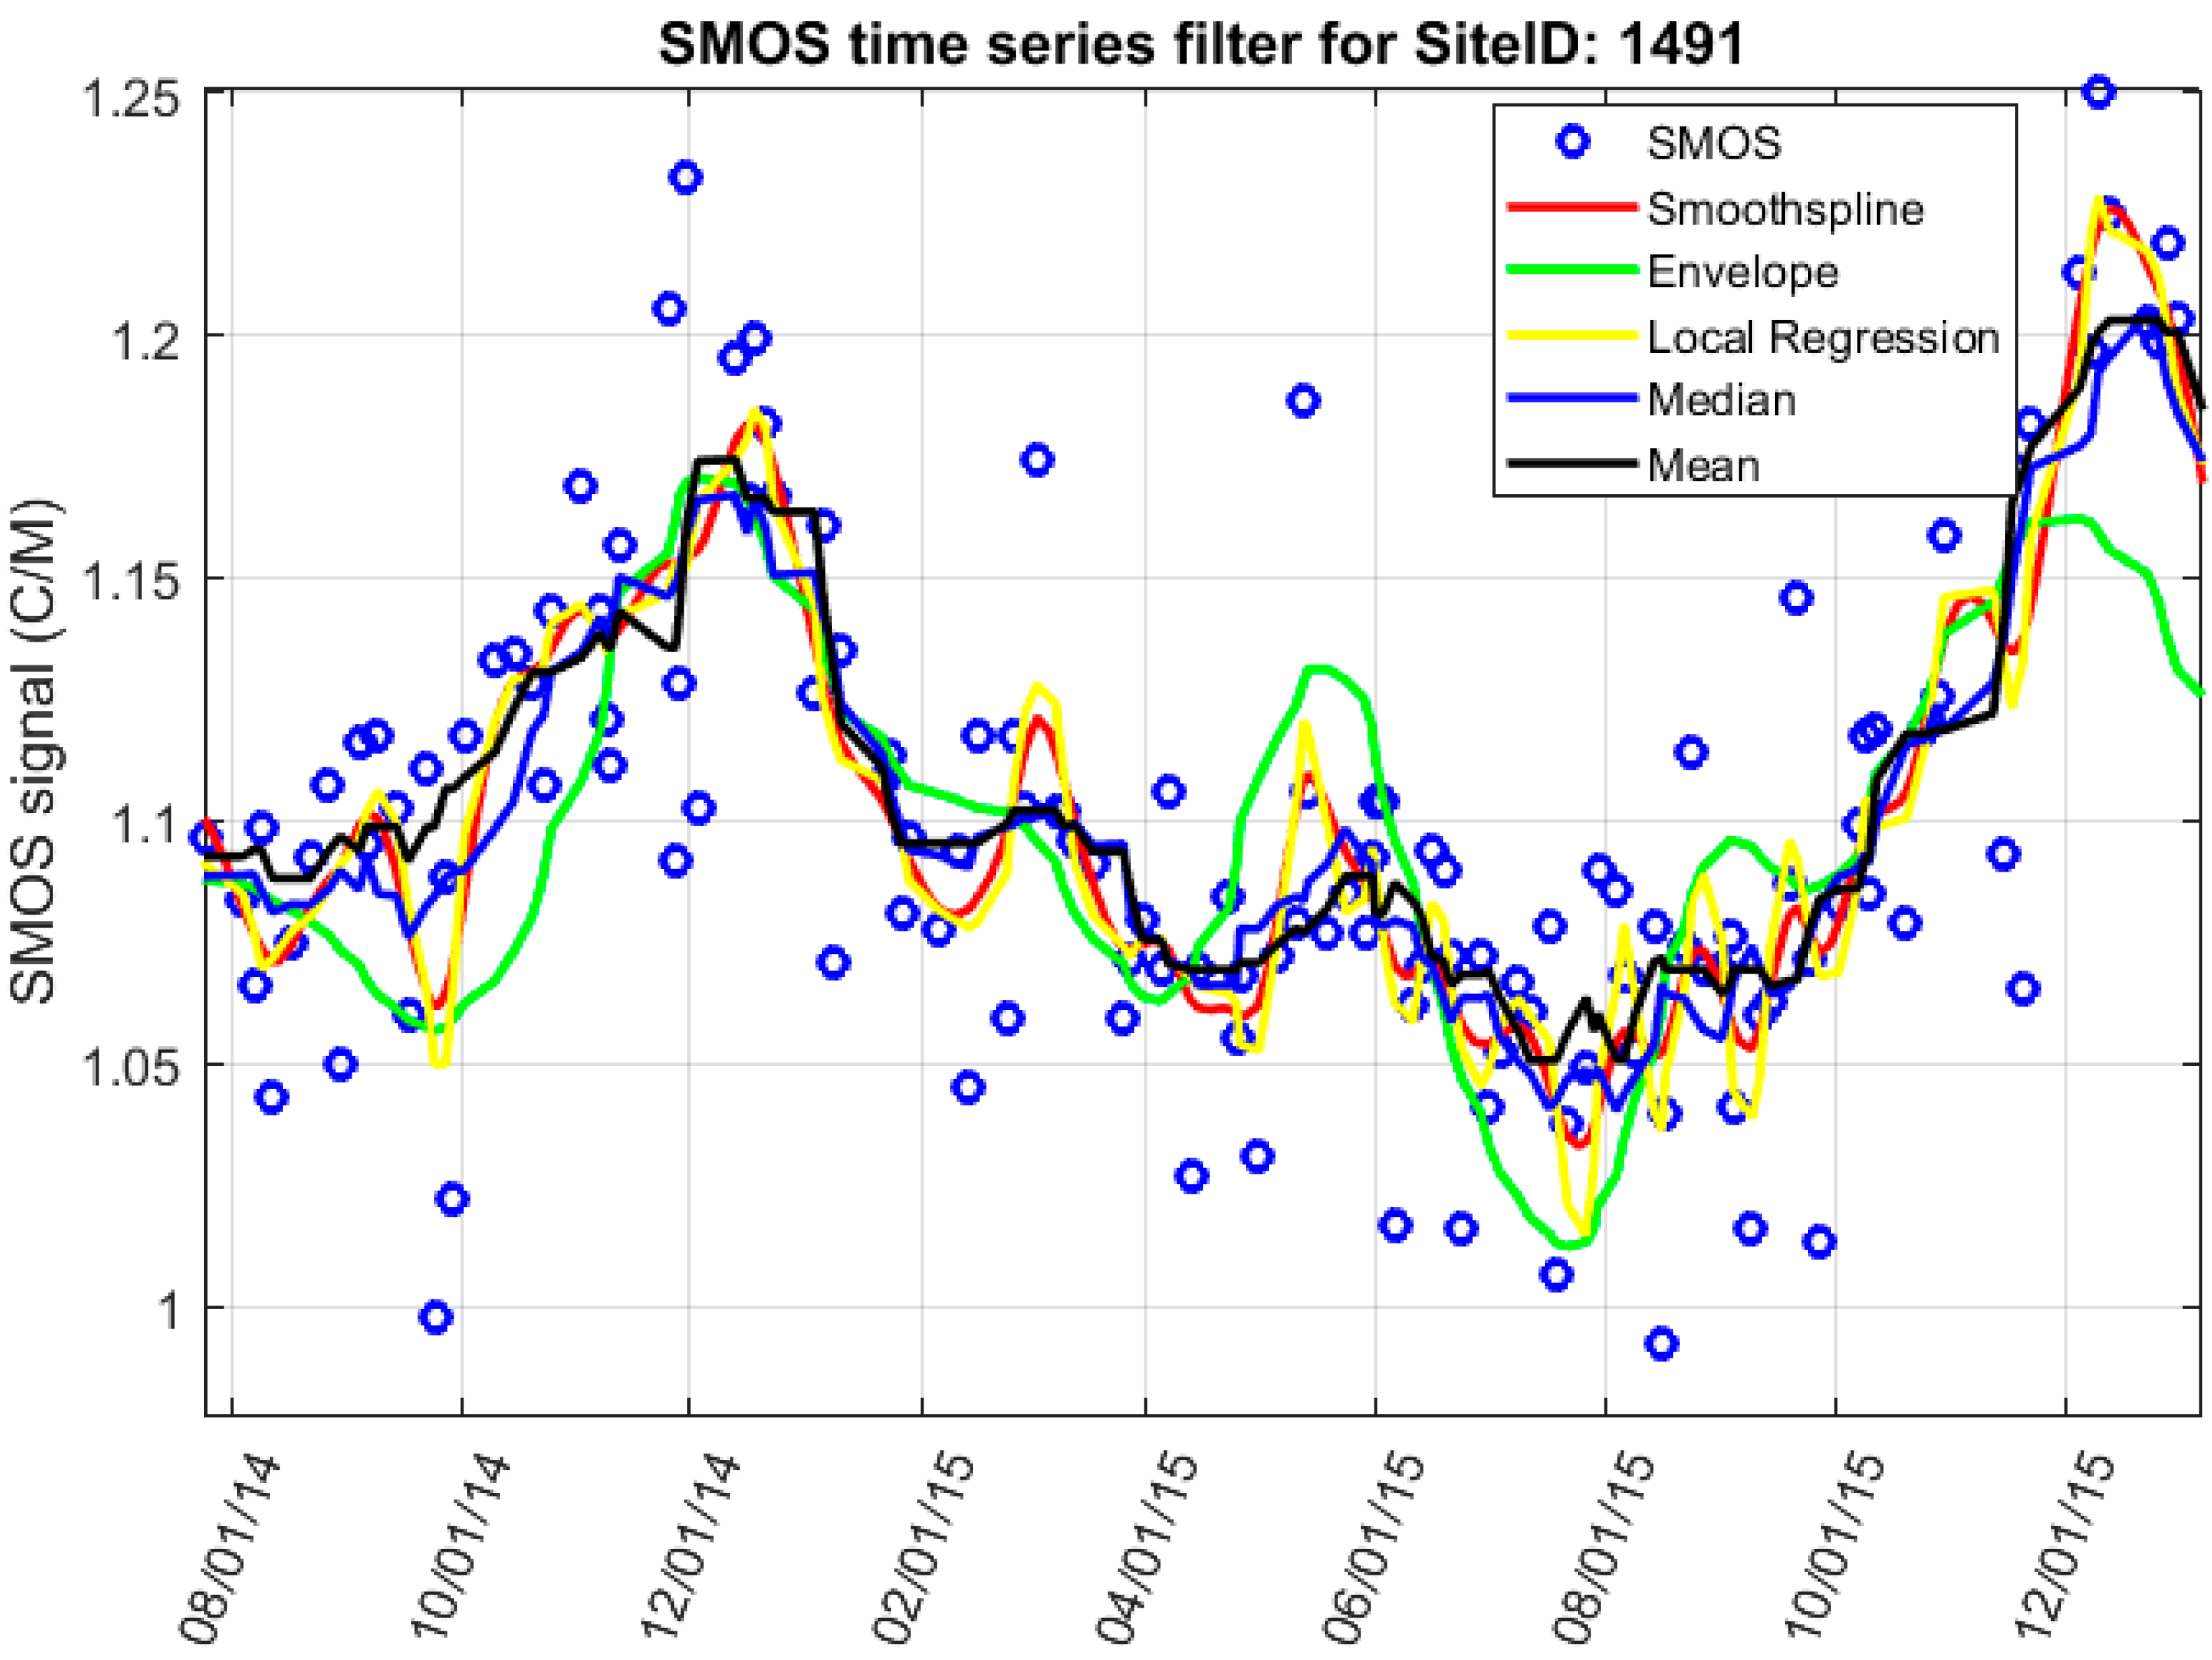
All time series smoothing calculations showed similar temporal trends in general (Figure 3). Opposite trends were only found in short time intervals of 10–20 days, which were considered insignificant within the complete time series of 9 years. However, most of the filtering methods were sensitive to outliers or extreme values except for the median filter, which appeared to form a stable basis to produce smoothed satellite flow hydrographs. In the median filter, no temporal delay was present in the calculation, and results were not sensitive to outliers. Thus, no data pre-processing was required to eliminate extreme values in advance. The same filtering techniques were used in altimetry in-land water elevation measurements to filter elevation time series [19]. This indicated smoother results could be achieved by using the spline filter in case of outliers with larger amplitude variations and as compared to local regression or mean filter.
To evaluate the performance of different smoothing techniques, each filtered time series was compared to river stage (water level) data from in-situ measurements in the selected study areas. The best correlation was found when using the median filter. However, no significant variation of the correlation values (δr = 0.1–0.02) of different filtering techniques was found during data analysis. Whereas the uncertainty could be reduced by different filtering techniques, a major influence was attributable to the location of the observation pixel as described in the previous section.

3. Results

3.1. Performance of SMOS-Based River Gauging

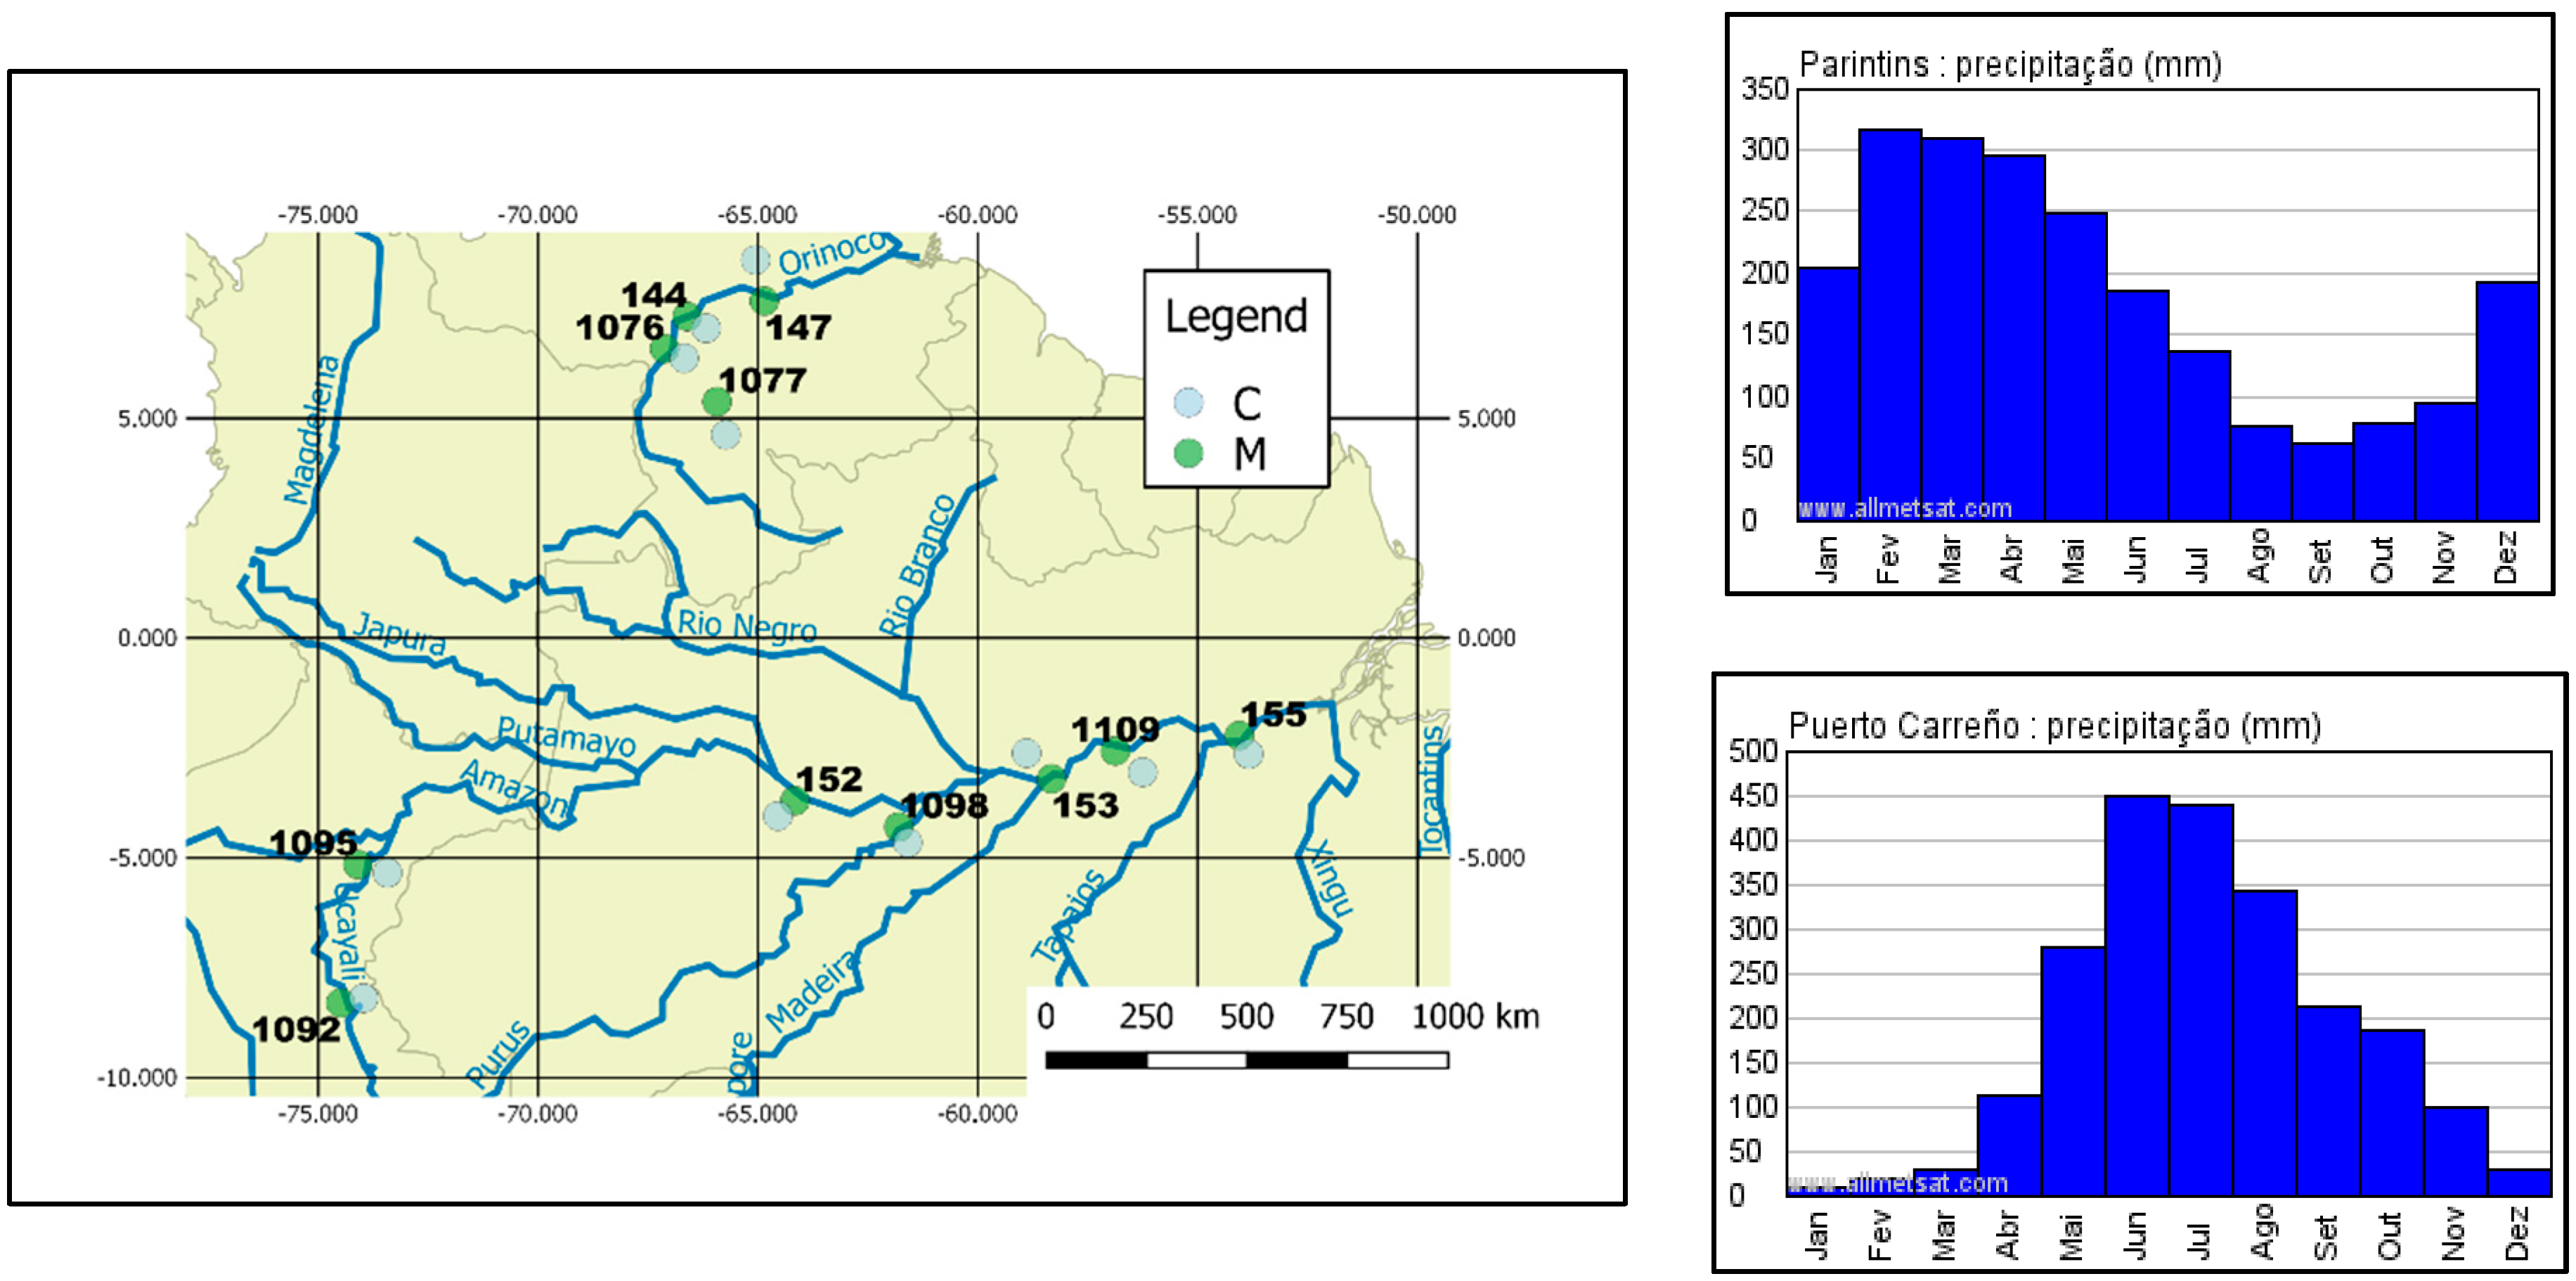
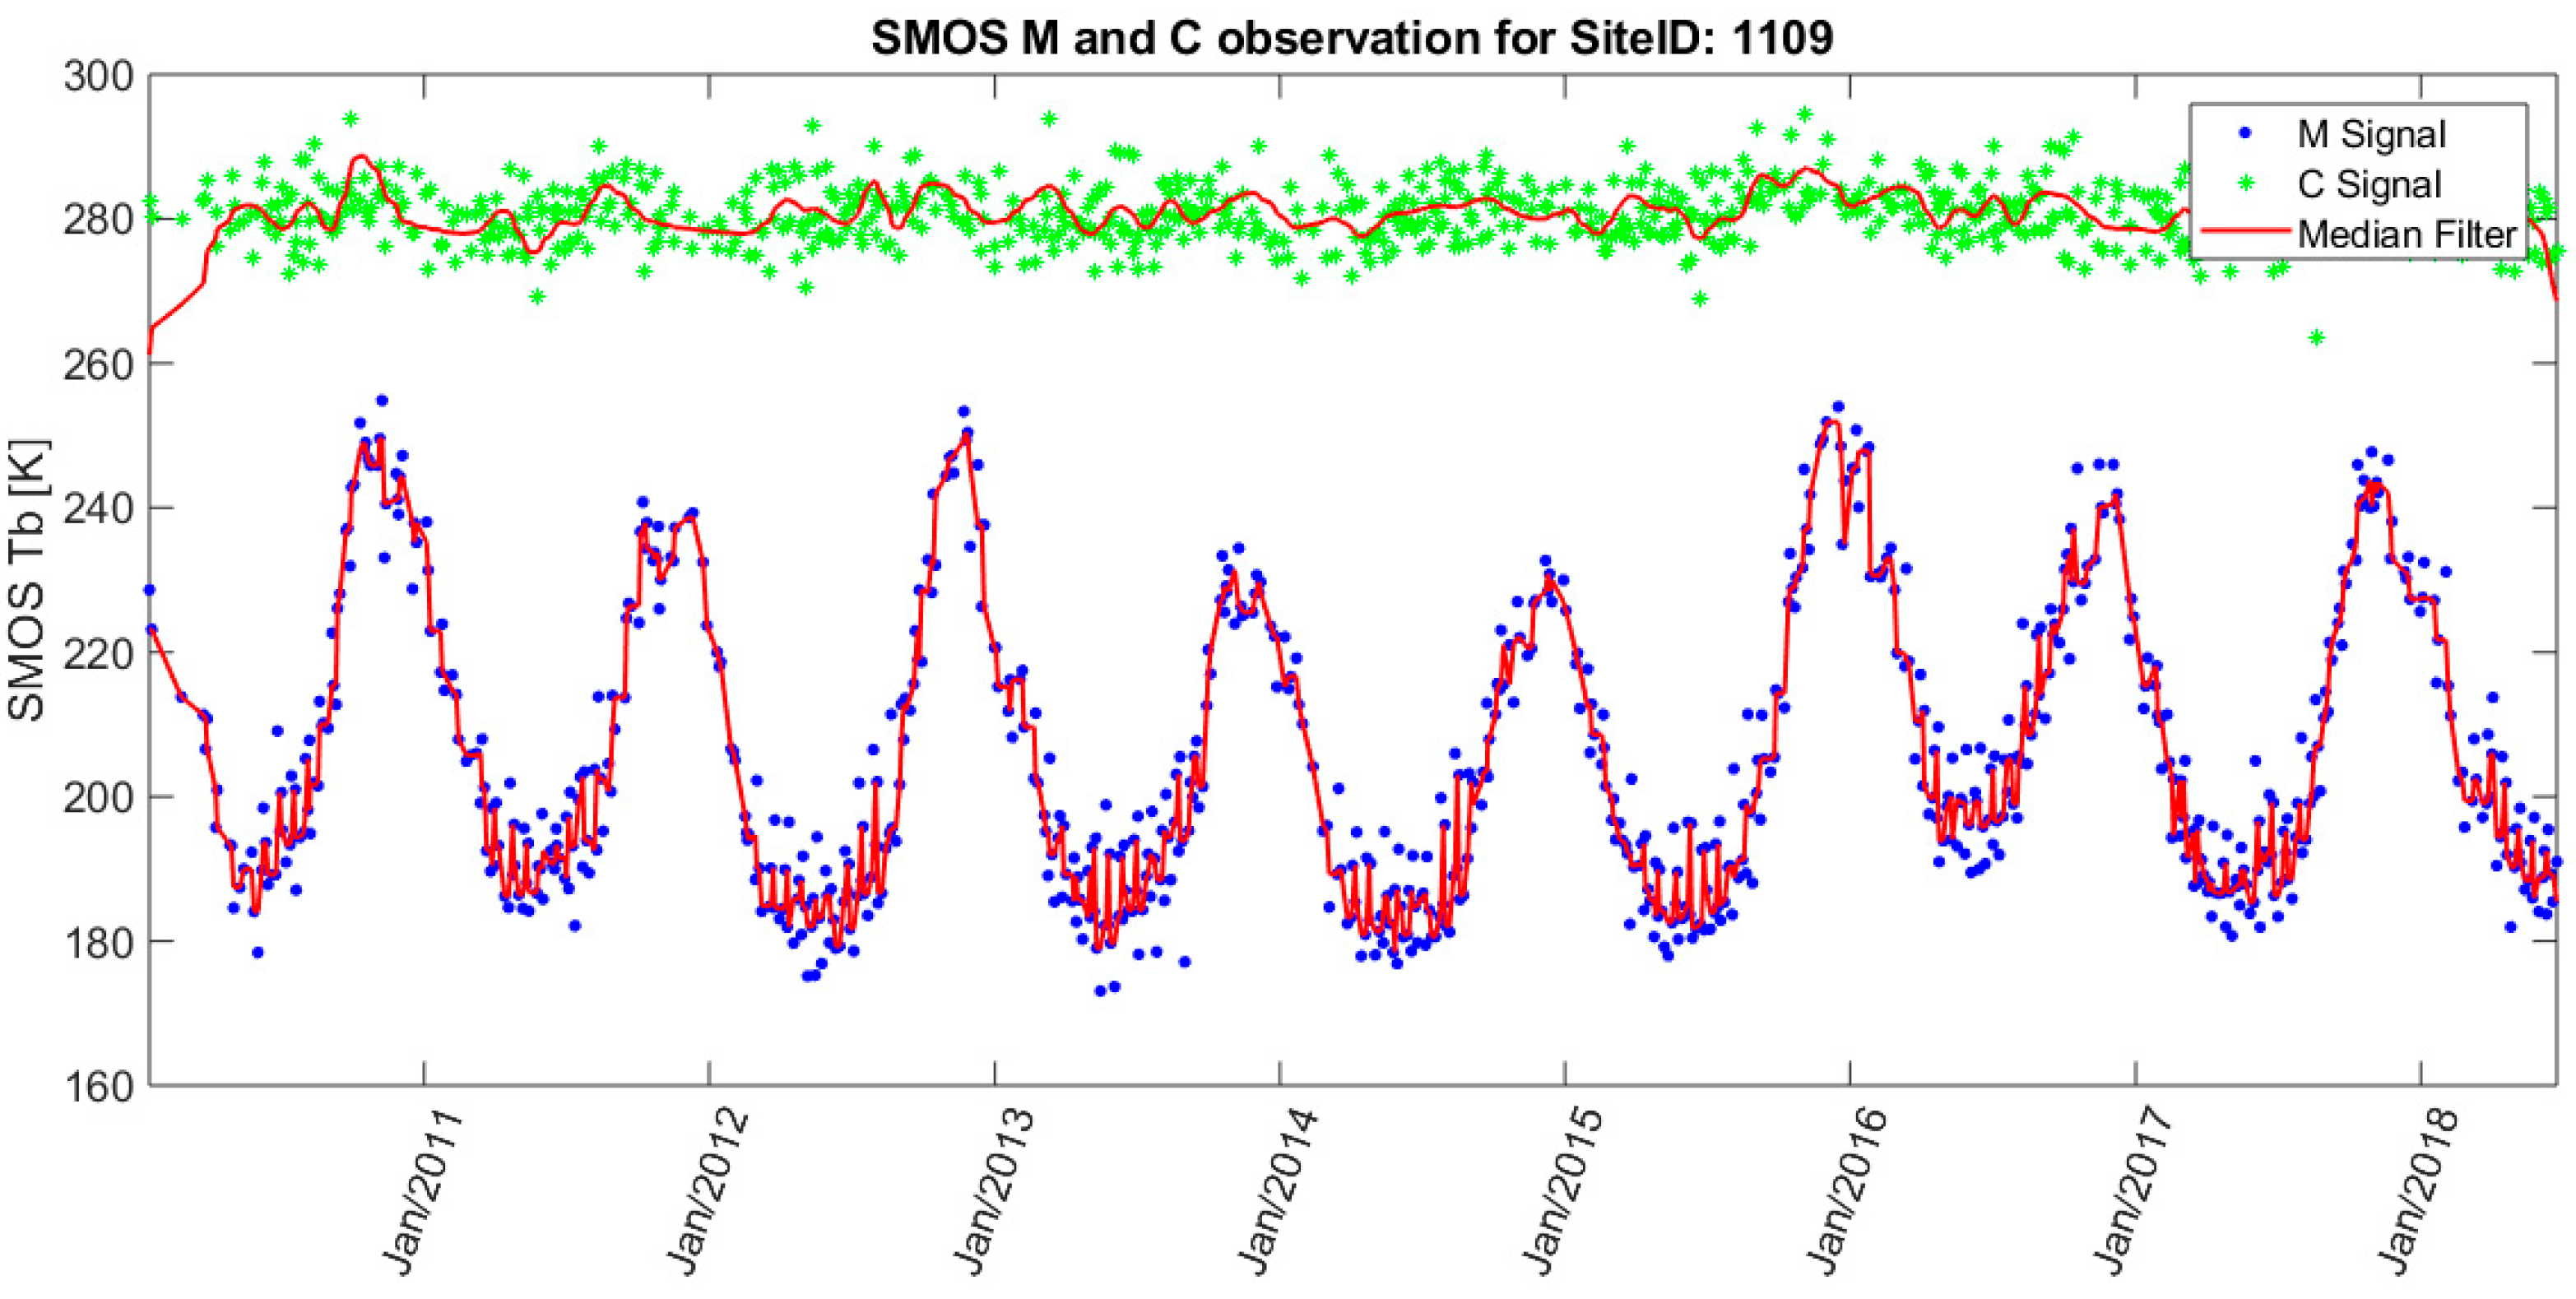
The satellite signal time series of the Amazon River at the town of Parintins, Brazil (Site ID 1109) shown in Figure 4 is characteristic of the SMOS-based Tb(c) and Tb(m) time series. The river site is located in the tropical monsoon climate zone according to Köppen’s classification with dense tropical rainforest vegetation. The dry season is from July to September with the hottest month being October. Precipitation starts to increase at the end of the year with the highest amount of rain in February, March, and April (Figure 2, top right). The climate is clearly reflected in the seasonal variation of the hydrographic signal, a ratio of calibration (“dry” land) pixel Tb(c) over measurement pixel Tb(m) for the selected river section and its floodplain. The maximum Tb(m) values during the driest month are observed near the end of the year. In December, when the rainy season starts, the annual maximum Tb(m) values around 250 K drop until the maximum floodplain water extent is reached with the minimum Tb(m) values around 180 K in June and July. Due to the fact that inundation stays for several months on the floodplain, minimum values only start rising in August and September, indicating the start of the dry season. There can be a time delay in the timing between seasonal change of precipitation in the region compared to the water level or water extent in the river measurement pixel because it takes time for increased surface water over the extensive landscape to reach the river [56].
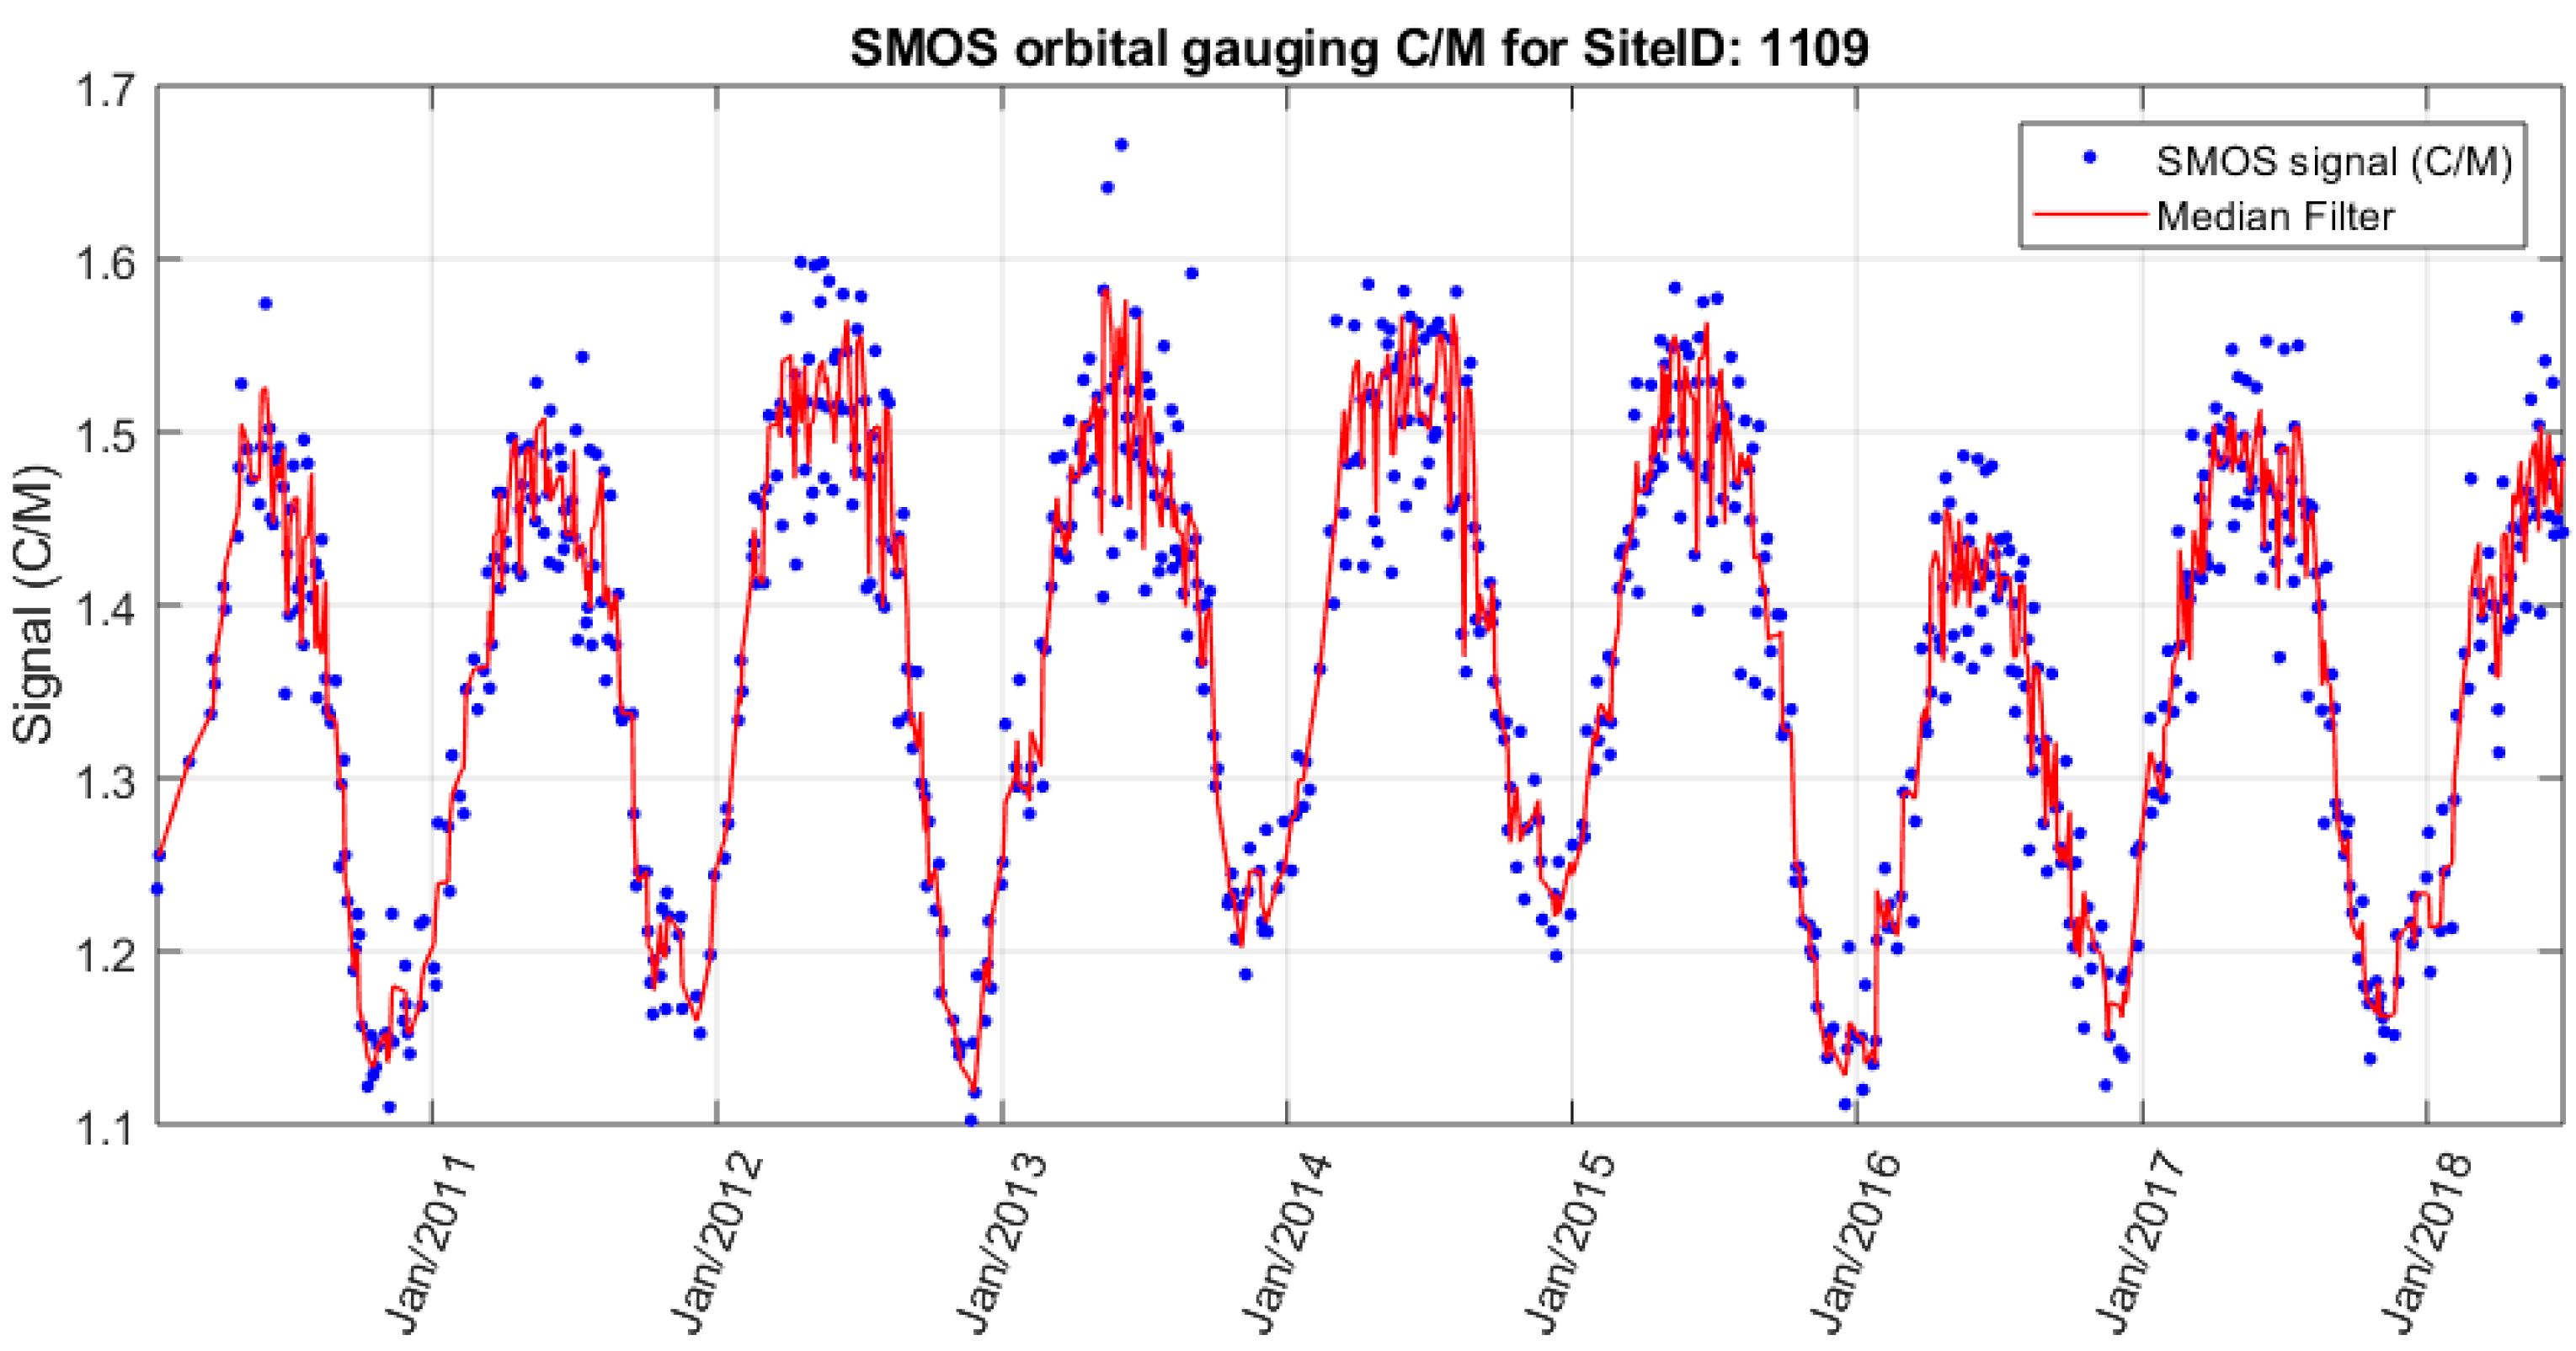
The calculated C/M ratio after normalizing the calibration pixel value by the wet pixel value mostly removed the landscape-wide seasonal temperature trends. The ratio of the dry and wet pixel resulted in a more stable signal for hydrological observation from space, as shown in Figure 5.
Similar periodical fluctuations of the satellite signal were revealed along the Amazon River tributaries with a slight shift in the duration of the rainy season. For example, SMOS gauging observations along the Ucayali River in Peru (Site ID 1095), an upstream tributary of the Amazon River (shown in Figure 6) conveyed that high flow periods indicated by high C/M signal values around 1.12 generally appeared in May and June. In contrast, along downstream regions of the Amazon River (Figure 5, Site ID 1109), the peak shifted towards earlier months of March, April, and May. The SMOS signal clearly revealed local variations of the hydrographic conditions in the upstream and downstream region of the Amazon River and its tributaries.
Regarding the GFDS dataset, time series were extracted starting from 2002 until the sensor stopped operating in 2011. Its replacement, AMSR2, was launched in May 2012. Due to this discontinuity between September 2011 and March 2013, the only satellite source of GFDS flow monitoring was the TRMM 37 GHz signal.
Some of the studied SMOS satellite gauging sites showed similar trends compared to GFDS observations. At other locations, a much stronger response of the SMOS C/M signal to water surface change was found when compared to high frequency data (Figure 6).
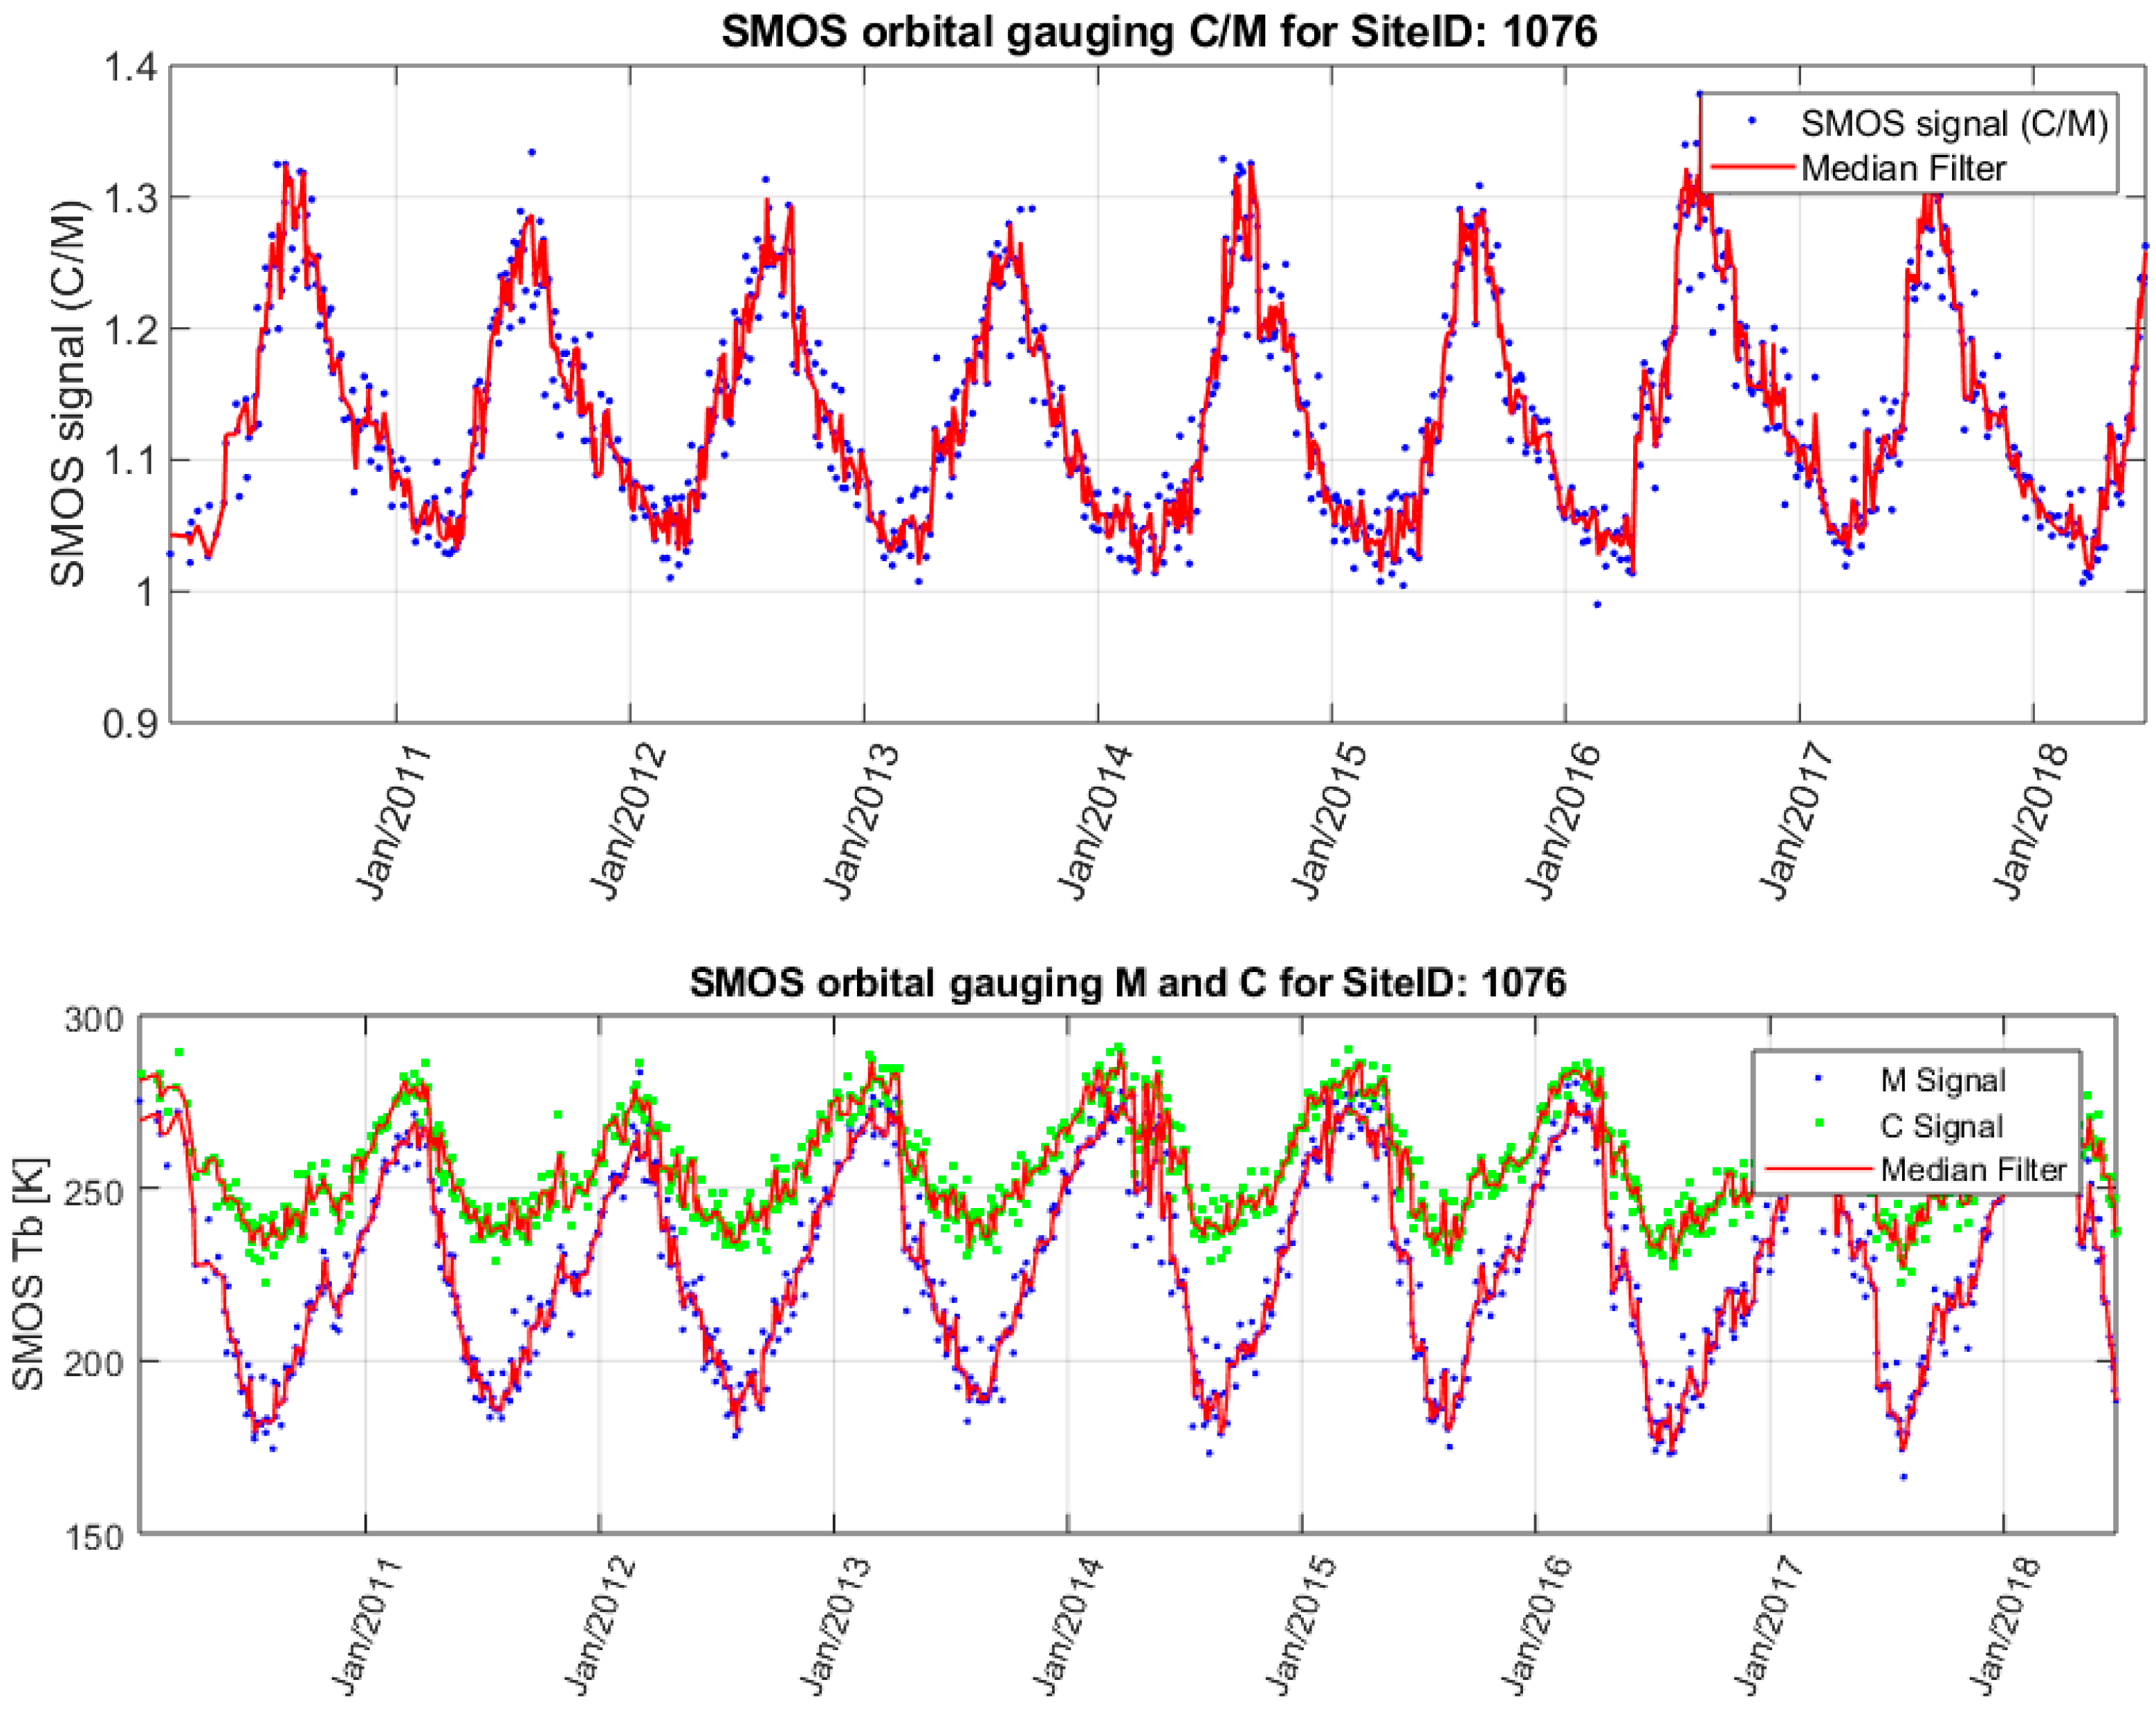
The second largest river by discharge volume is the Orinoco River in South America. Similar to the Amazon watershed, the Orinoco basin is situated in the tropical climate zone. The studied gauging locations are located in the tropical monsoon and savannah climate zone, where most of the precipitation falls from May to October, and dry season is from November until April. On the upstream section of the river, the satellite gauging location near Puerto Carreno in Columbia (Site ID 1076) revealed a strong seasonal variation of the river extent (Figure 7). High flow periods were clearly identifiable from the time series. The SMOS hydrograph showed the highest C/M values related to the summer peak of the channel flow from July to September in the rainy season. The channel exhibited a one to two month of delay between the peak flow and the highest watershed precipitation (Figure 3 and Figure 7). This agreed with the results of in-situ flow measurements. The satellite time series also demonstrated that inundation could stay on the floodplain for at least two months at the observed locations along the Orinoco and its tributaries, consistent with prior results found in the Mississippi River [56].
Similar results were obtained by SMOS observations in Central Africa, where the Congo River and its tributaries were studied. The wet season, which runs from October to May, is longer than the dry season, which covers the remaining months. Precipitation is the lowest in July and August, when almost no rain falls. Most precipitation is in November with an average of 253 mm. Due to the low availability of in situ gauging stations as a consequence of the difficult economic and political situations in the region, only three SMOS satellite gauging sites could be investigated in comparison to ground-based data.
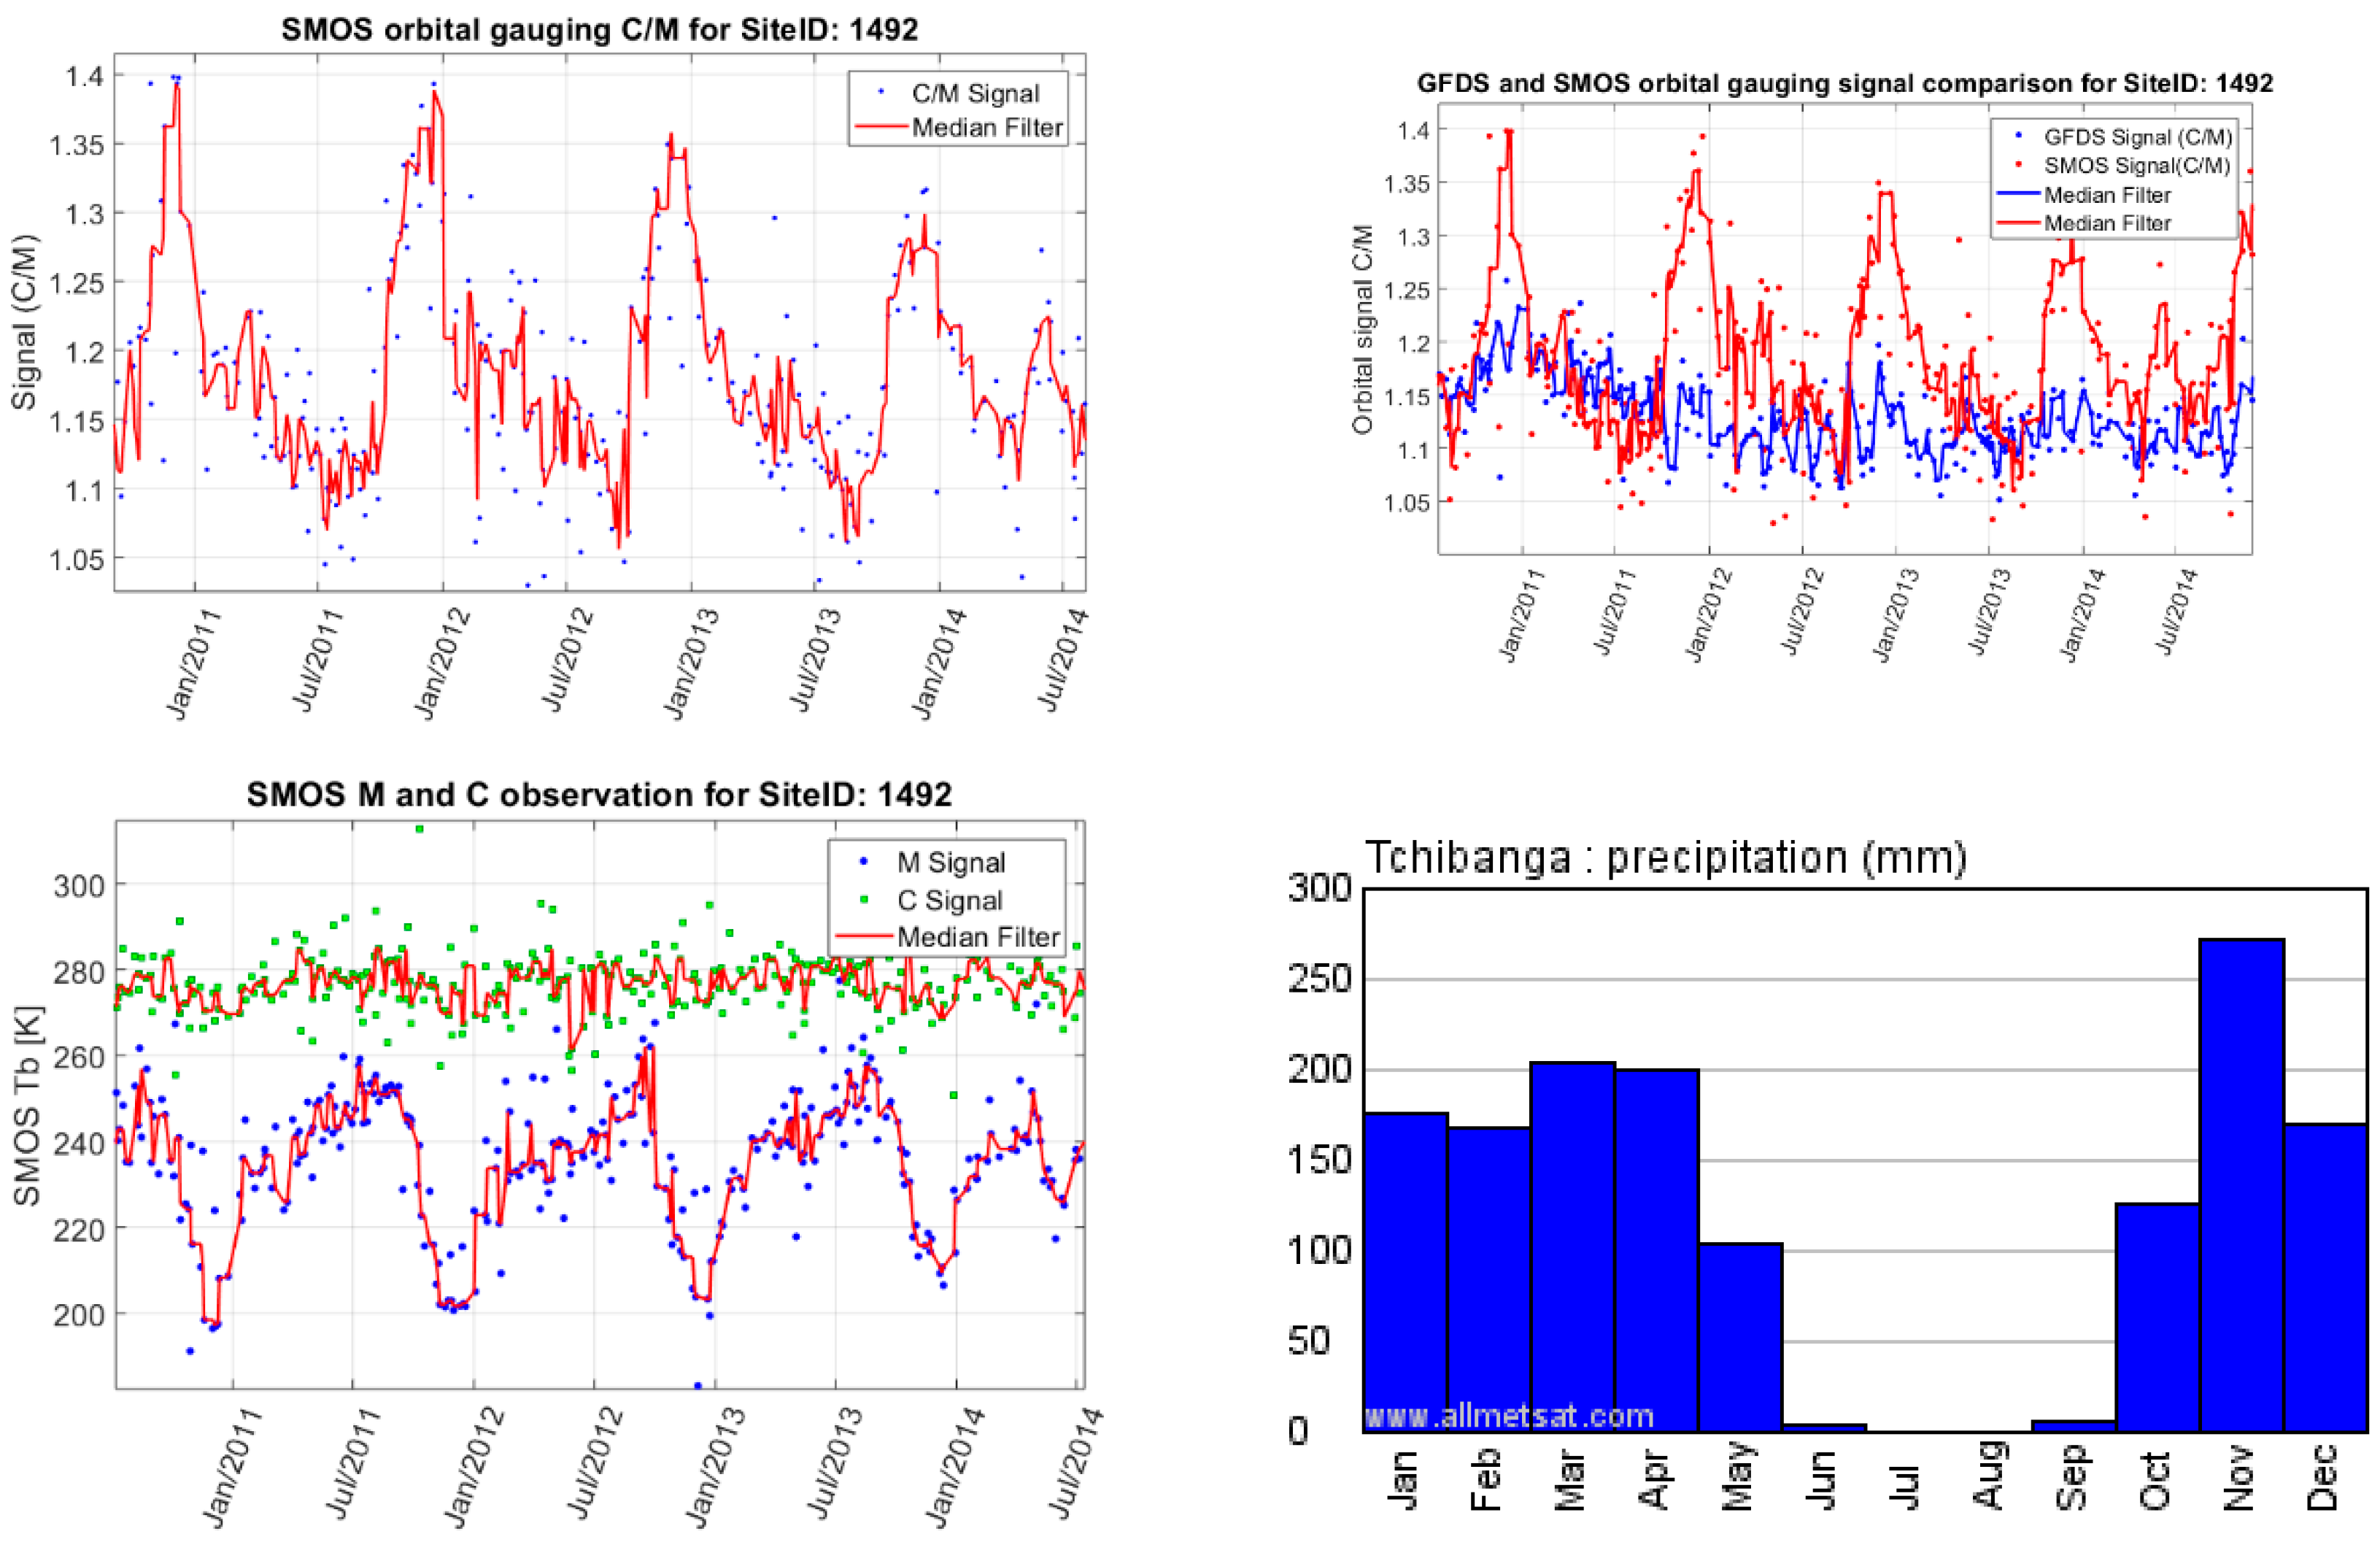
SMOS data performed well on sites upstream of Brazzaville, Republic of Congo, where one of the three existing in-situ stage water level stations is located. In comparison with the high-frequency GFDS data, SMOS signal data exhibited a stronger seasonal signal dynamic range, again indicating the relevance of low frequency microwave radiometers for sensing rivers in densely vegetated forest areas. An example is Site ID 1492 on the Congo River near Lucolela upstream Brazzaville. Figure 8 shows its time series (Figure 8, left side) and its comparison with GFDS data series (Figure 8, right side). Tb(m) pixel values revealed the annual change in dry and wet season with the lowest values from October and November around 200 K related to high flow conditions. At the same time, the calibration or dry pixel stayed relatively constant in time. Signals in the Congo watershed were noisier when compared to tropical regions in South America. However, again, the low frequency data sensitivity to surface water extent was higher when compared with high-frequency GFDS data of the same time period.
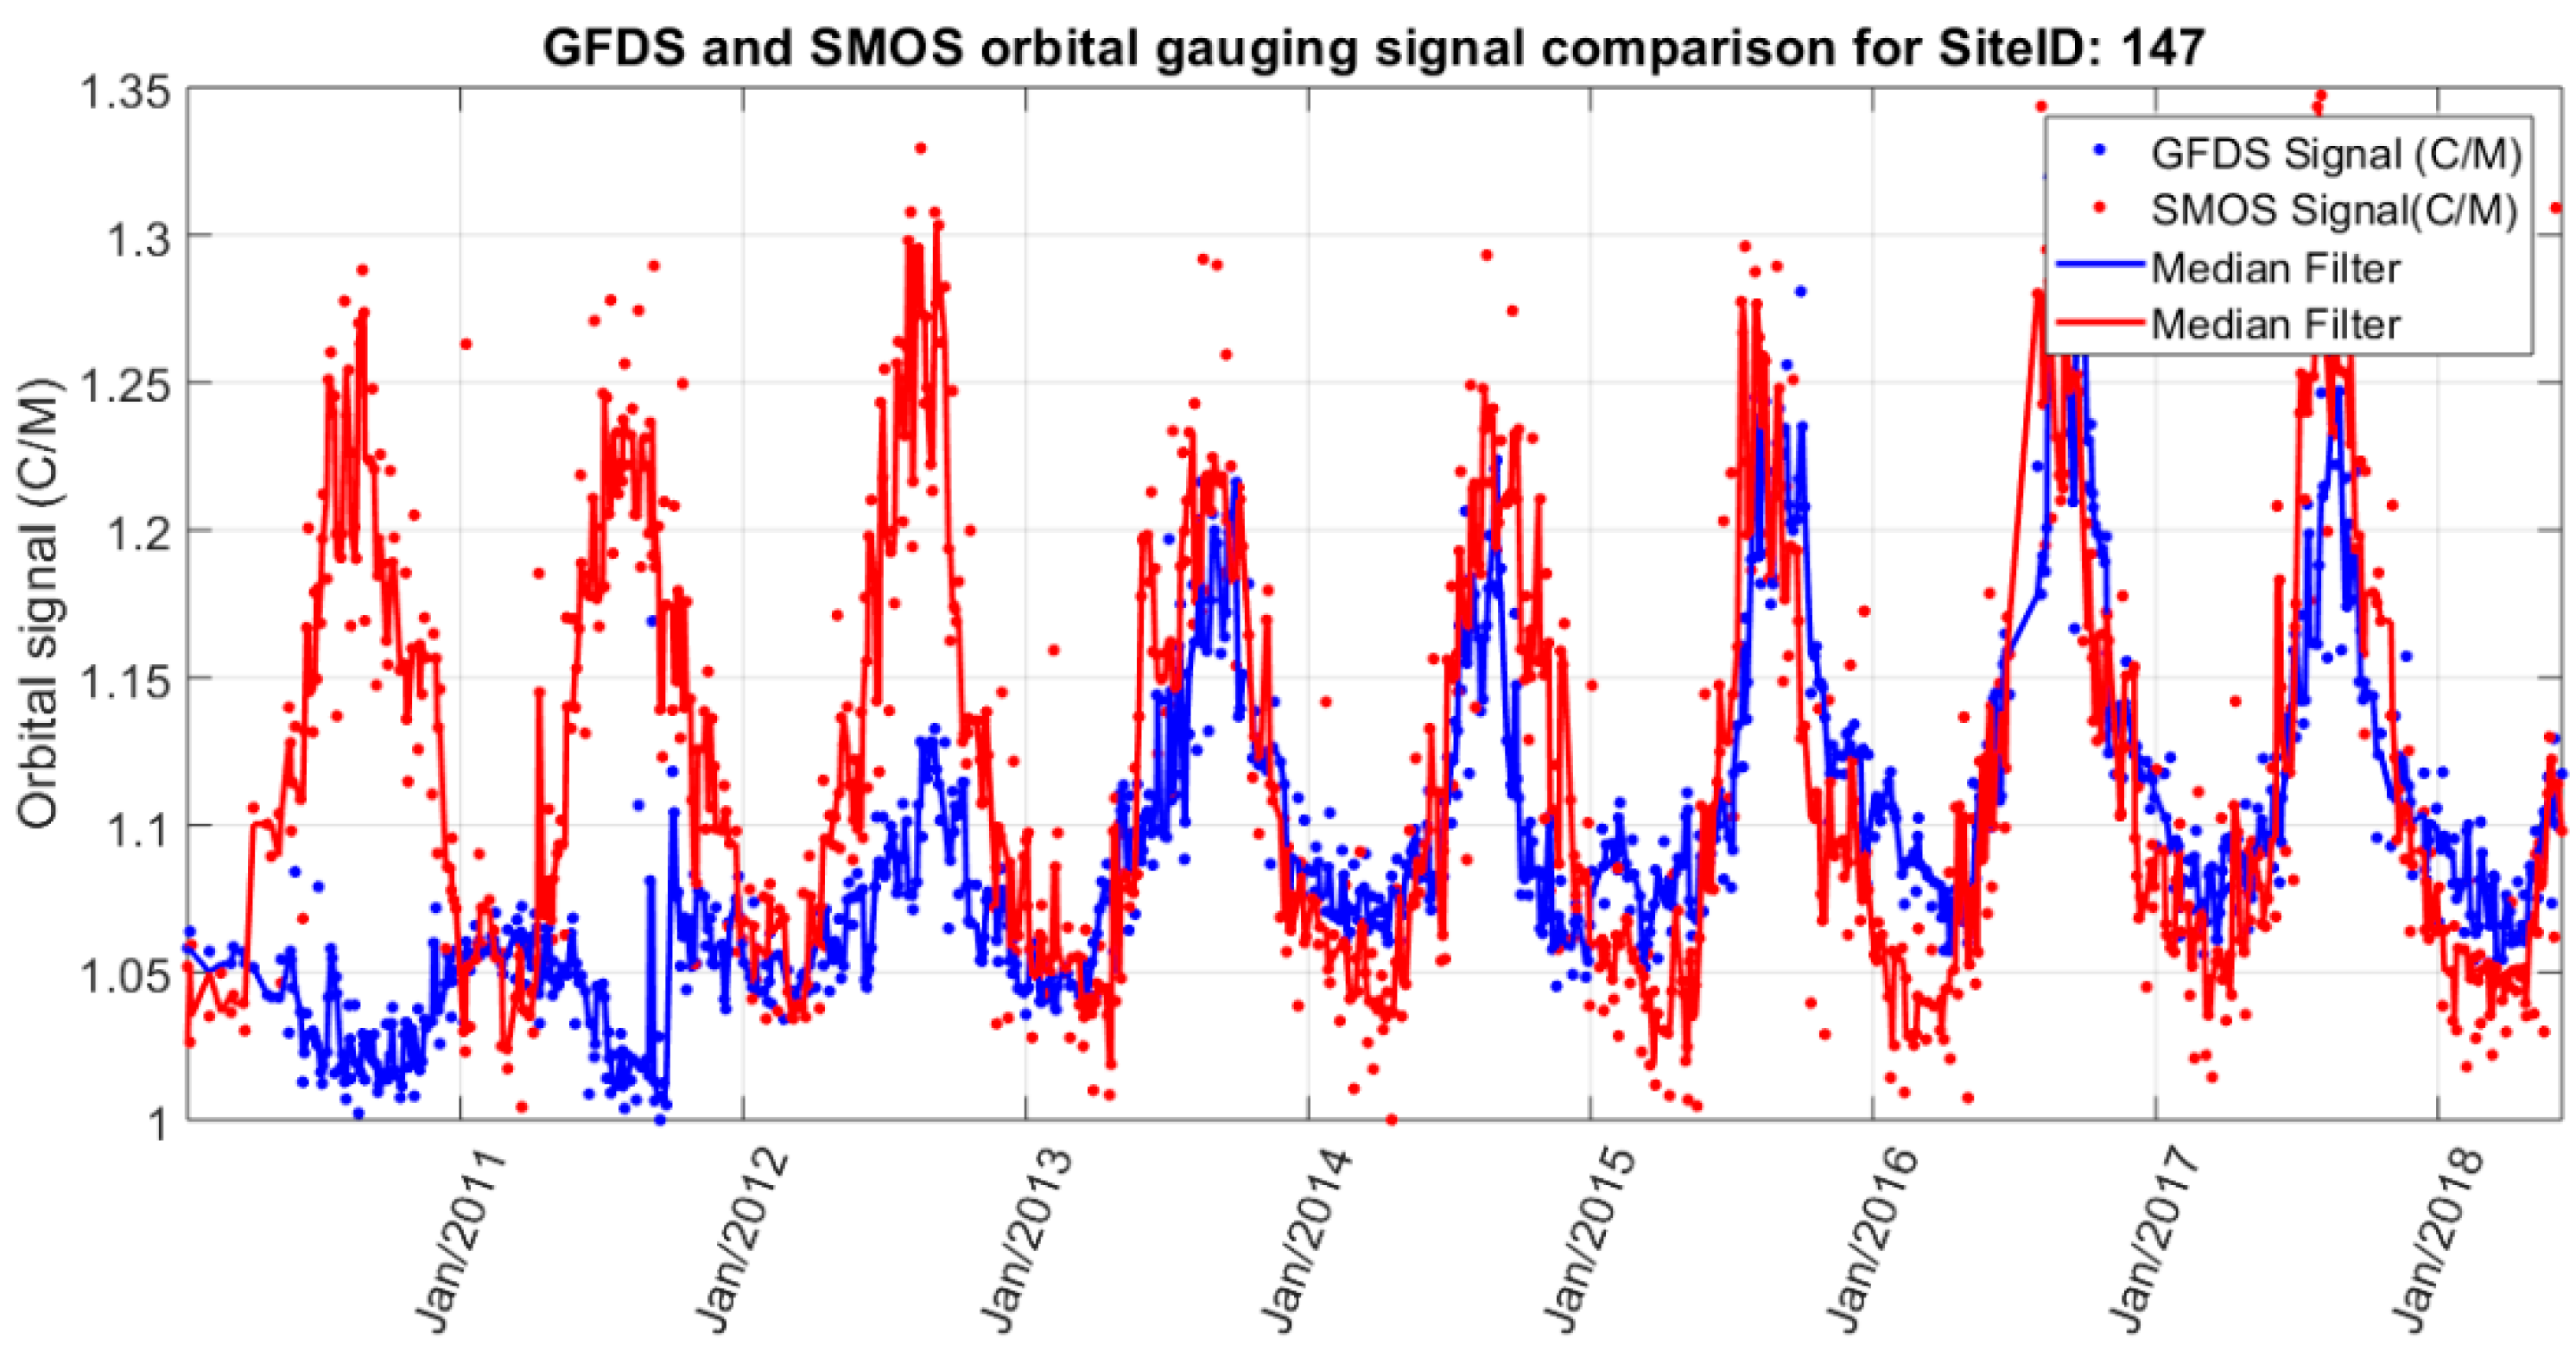
The performance of the three different microwave sensors used in GFDS during the period 2010–2018 was also studied. In the case of Site ID 152 on the Amazon River near Tefe, AMSR-E (January 2010–September 2011) and TRMM (September 2011–March 2013) sensor data better reflected the seasonal periodicity than AMSR2 (March 2013–ongoing) (Figure 9, upper panel). In other cases, the time series were featuring a steadier source of water surface changes for AMSR2 coverage (from September 2013 to present) when compared with AMSR-E and TRMM period; for example, at the station Site ID 147 on the River Orinoco near Ciudad Bolivar (Figure 9, lower panel).
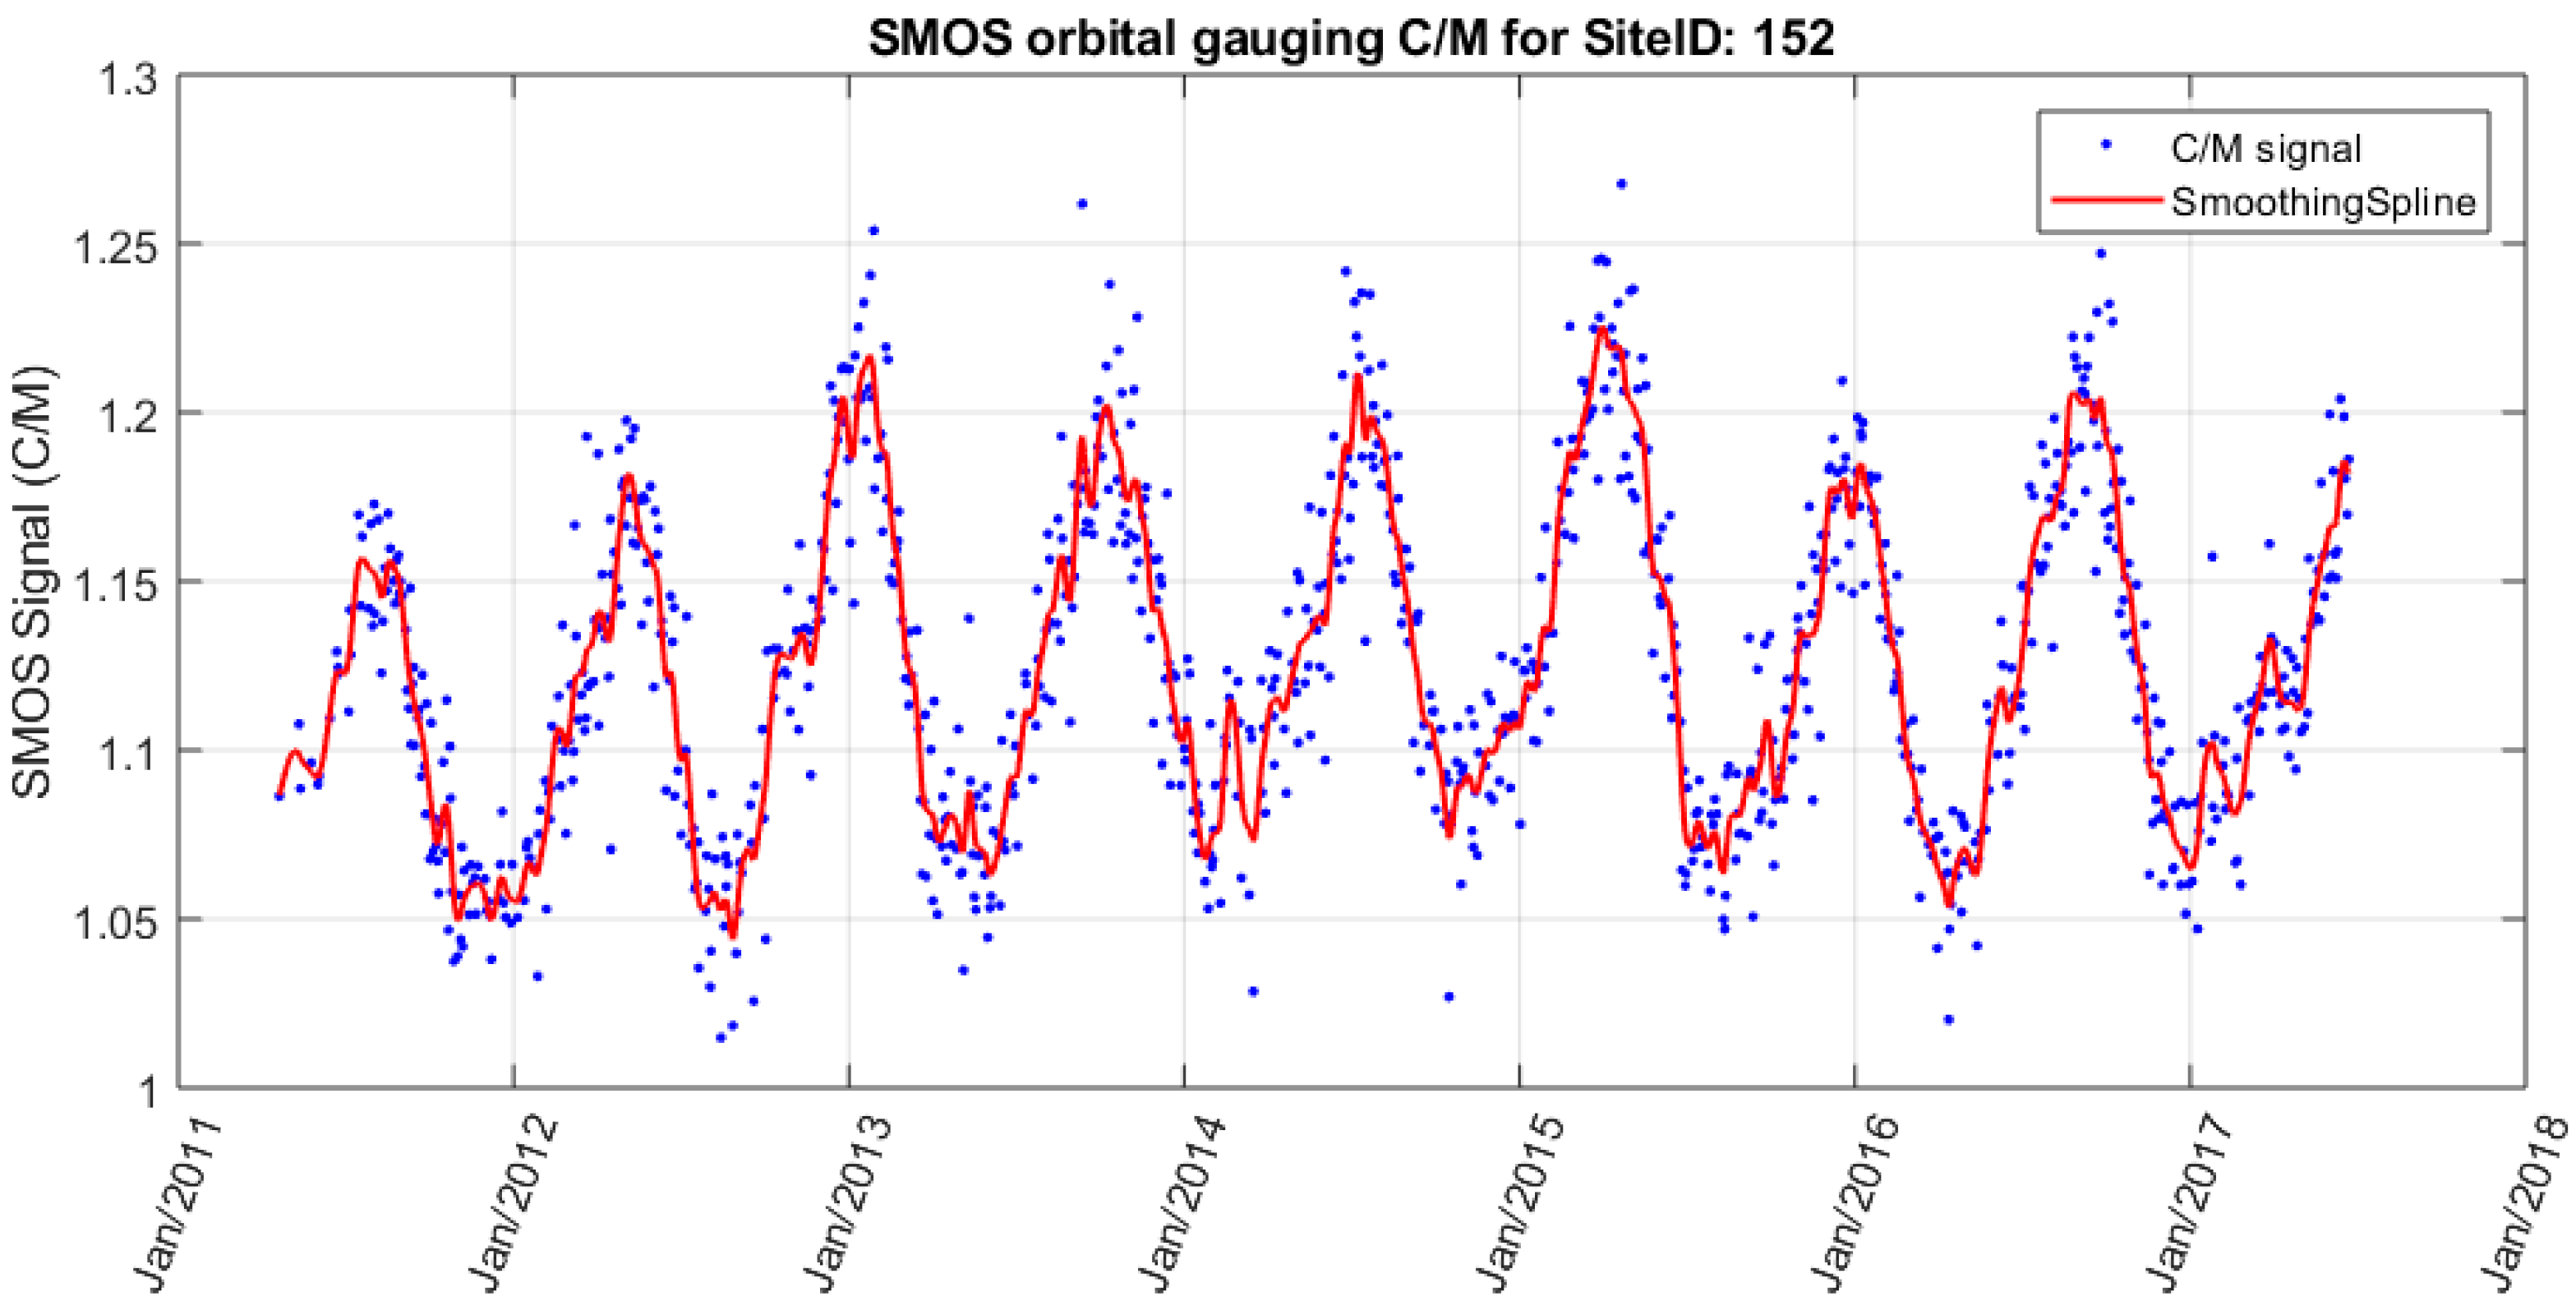
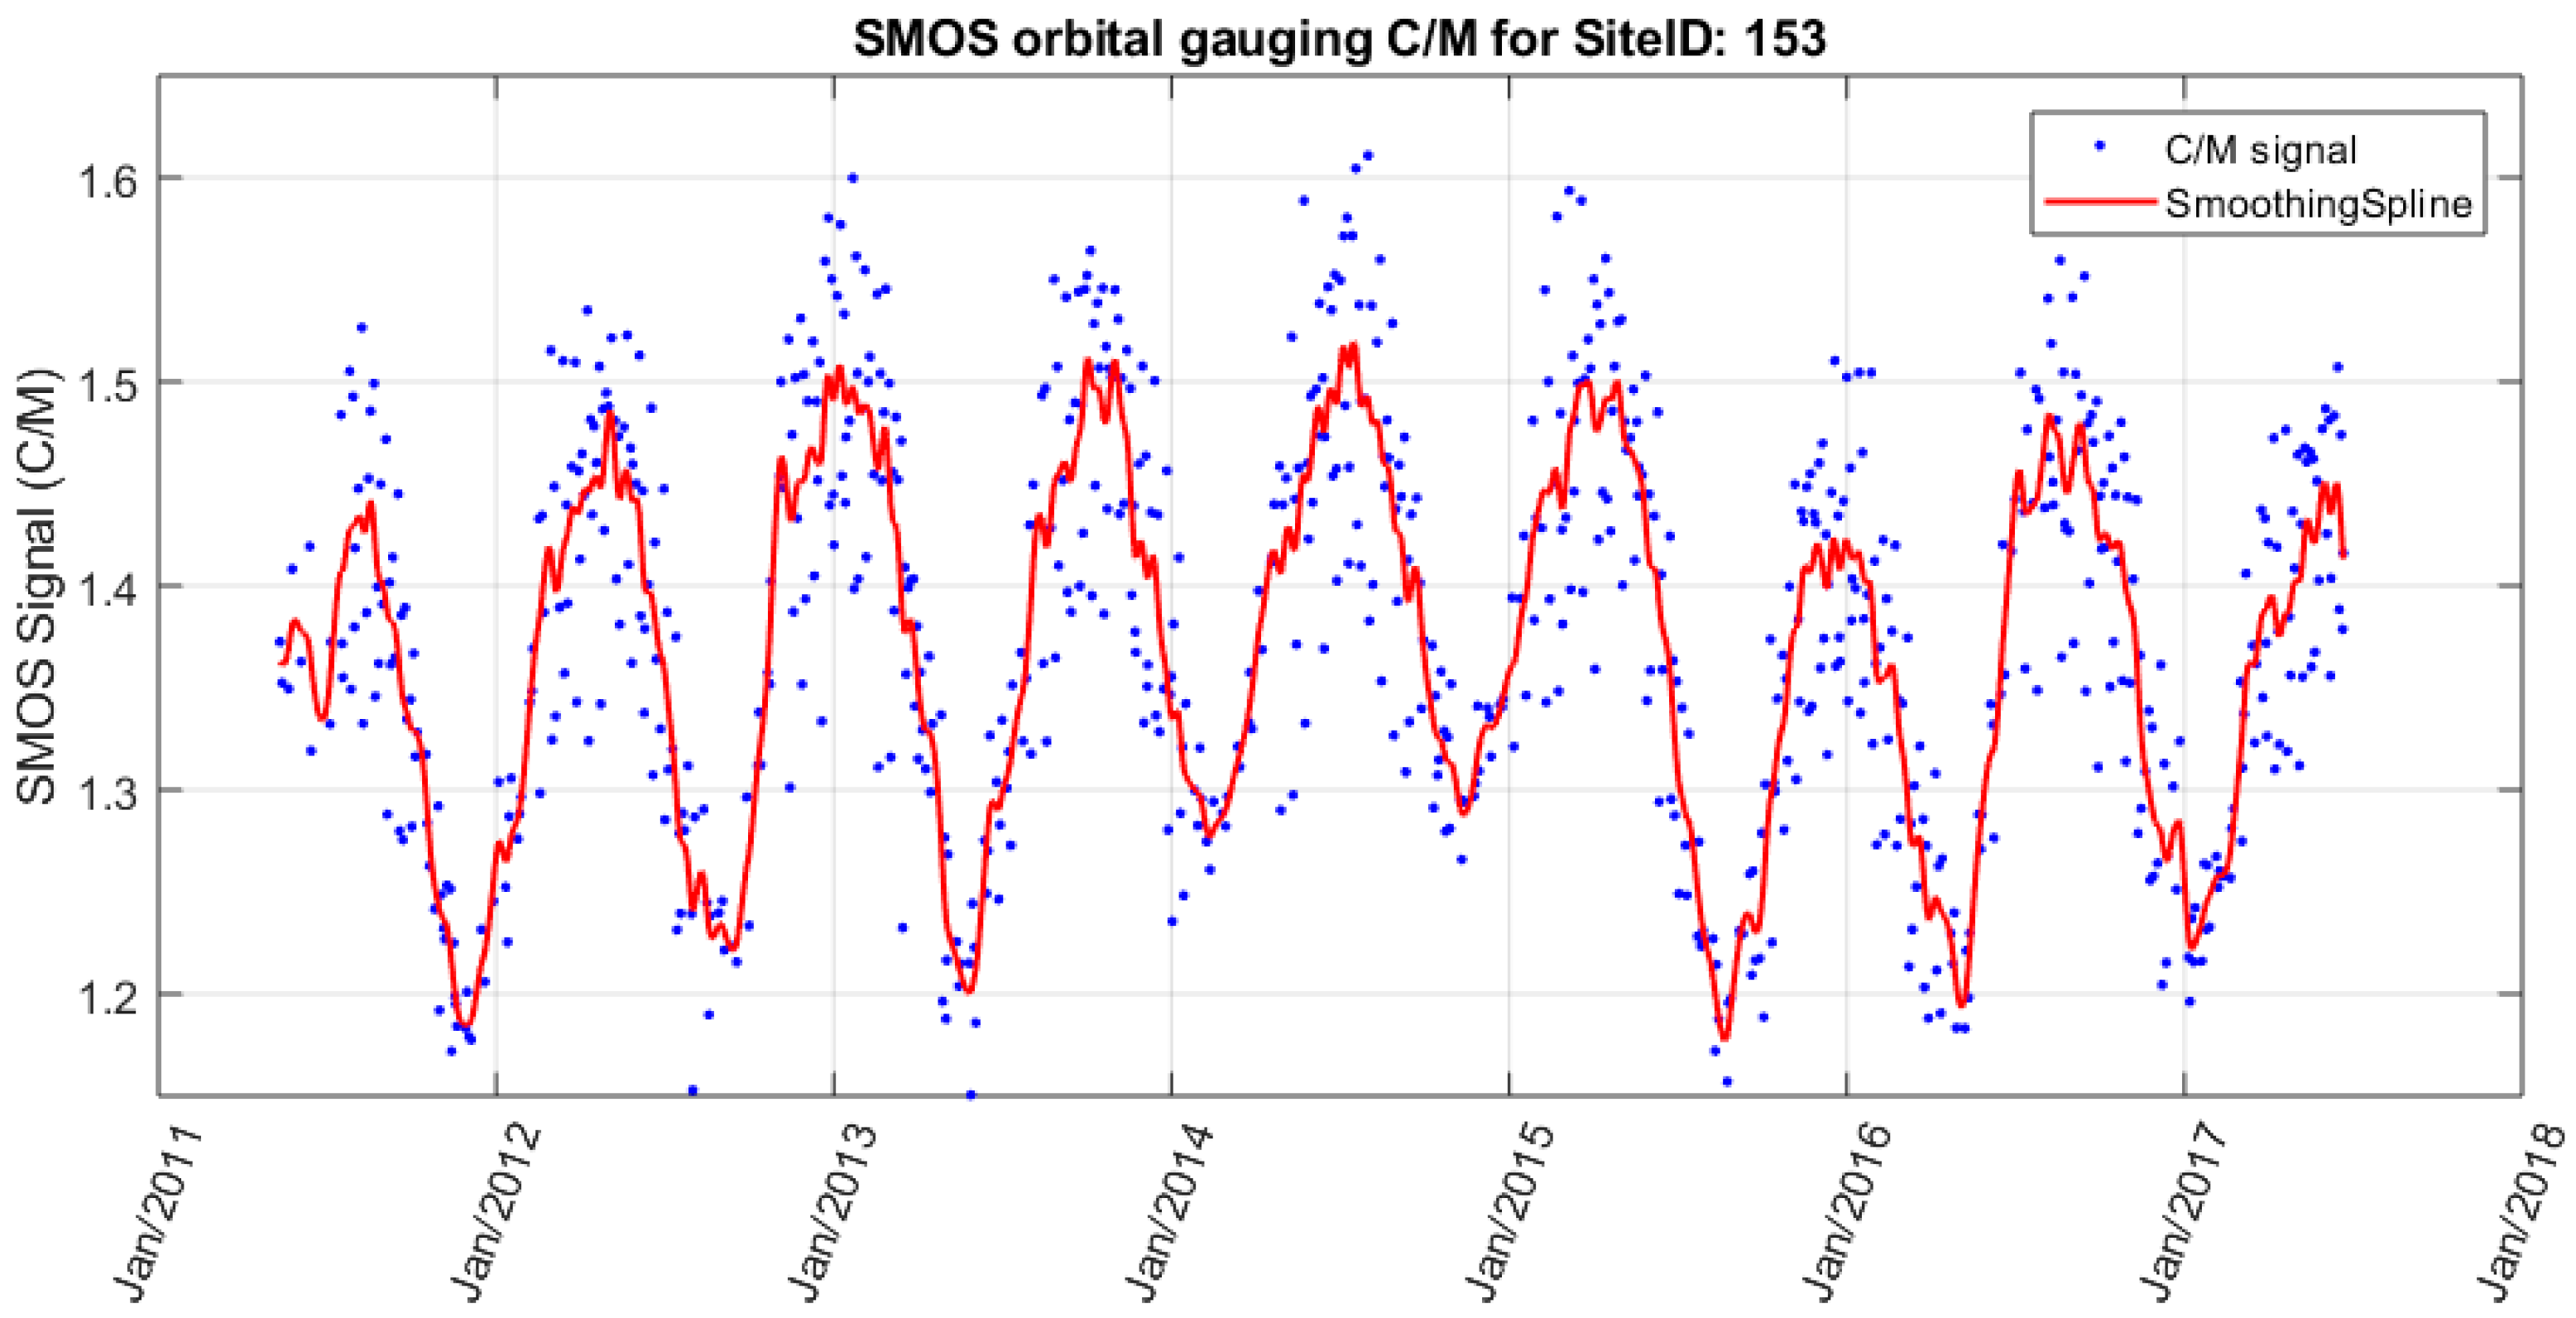
In both of the above cases, SMOS provided a more stable signal with lower noise and a larger dynamic range due to a stronger response to water extent changes on the floodplain. The two SMOS time series cases (Site 152 and Site 147) also revealed a discernable change in the dry and the wet season. Whereas the observations on the Amazon River generally reflected a tropical monsoon climate where higher water levels were observed from the beginning of the year until late June (Figure 9 upper), on the Orinoco River, the maximum water levels were observed in July, August, and September. Furthermore, SMOS data strongly reflected the duration of inundation on the floodplains on different river sections. Site 152 along the Amazon River near Tefe filtered by smoothing spline method showed a relatively rapid increase and decrease in the seasonal water extent compared to Site 153 downstream on the Amazon River near the town of Itaquariara (Figure 10 upper and lower panel). The first is on a narrower upstream section of the Amazon River with a less meandering river channel, while the second is located on the downstream region of the Amazon River with more lakes and wetlands around the main channel. In the latter case, water stayed longer on the floodplain after precipitation declined, as shown in Figure 10.

3.2. Validation of SMOS Gauging Results

To assess the quality of the SMOS-based gauging time series and to estimate uncertainty in the method, a validation procedure was devised. In several steps, different sources of hydrological observations and measures were compared (Table 1). Here, the objective was to investigate the relevance of SMOS data for flow monitoring in the densely vegetated tropics.
First, a comparison was carried out between low-frequency SMOS passive microwave radiation and high-frequency AMSR sensors and TRMM data in the study area, as described in Section 3.1. In the next step, in situ stage data were obtained from SO HYBAM database (http://www.ore-hybam.org). The network covers 15 in situ water level stations in the Amazon catchment, three stations on the Orinoco River, and three stations on the Congo River. Data were downloaded for the nearby satellite gauging stations, and correlation analyses were carried out using ground and satellite data. It was assumed that the most accurate source of information was the in-situ stage water level measurement. Thus, the correlation was determined between both SMOS and stage, and moreover, between GFDS and stage datasets, respectively.
To estimate goodness of fit, both the correlation coefficient and the Nash–Sutcliffe model efficiency coefficient (NSE) were calculated for all studied sites [57]. NSE is used to assess the predictive power of hydrological models and can range from −∞ to one. An efficiency of one (NSE = one) corresponds to a perfect match of modeled (satellite) data to the observed (in-situ) data. An efficiency of zero (NSE = zero) indicates that the model predictions are as accurate as the mean of the observed data, whereas an efficiency less than zero (NSE < zero) occurs when the observed mean and the model values disagree more significantly when NSE becomes more negative.
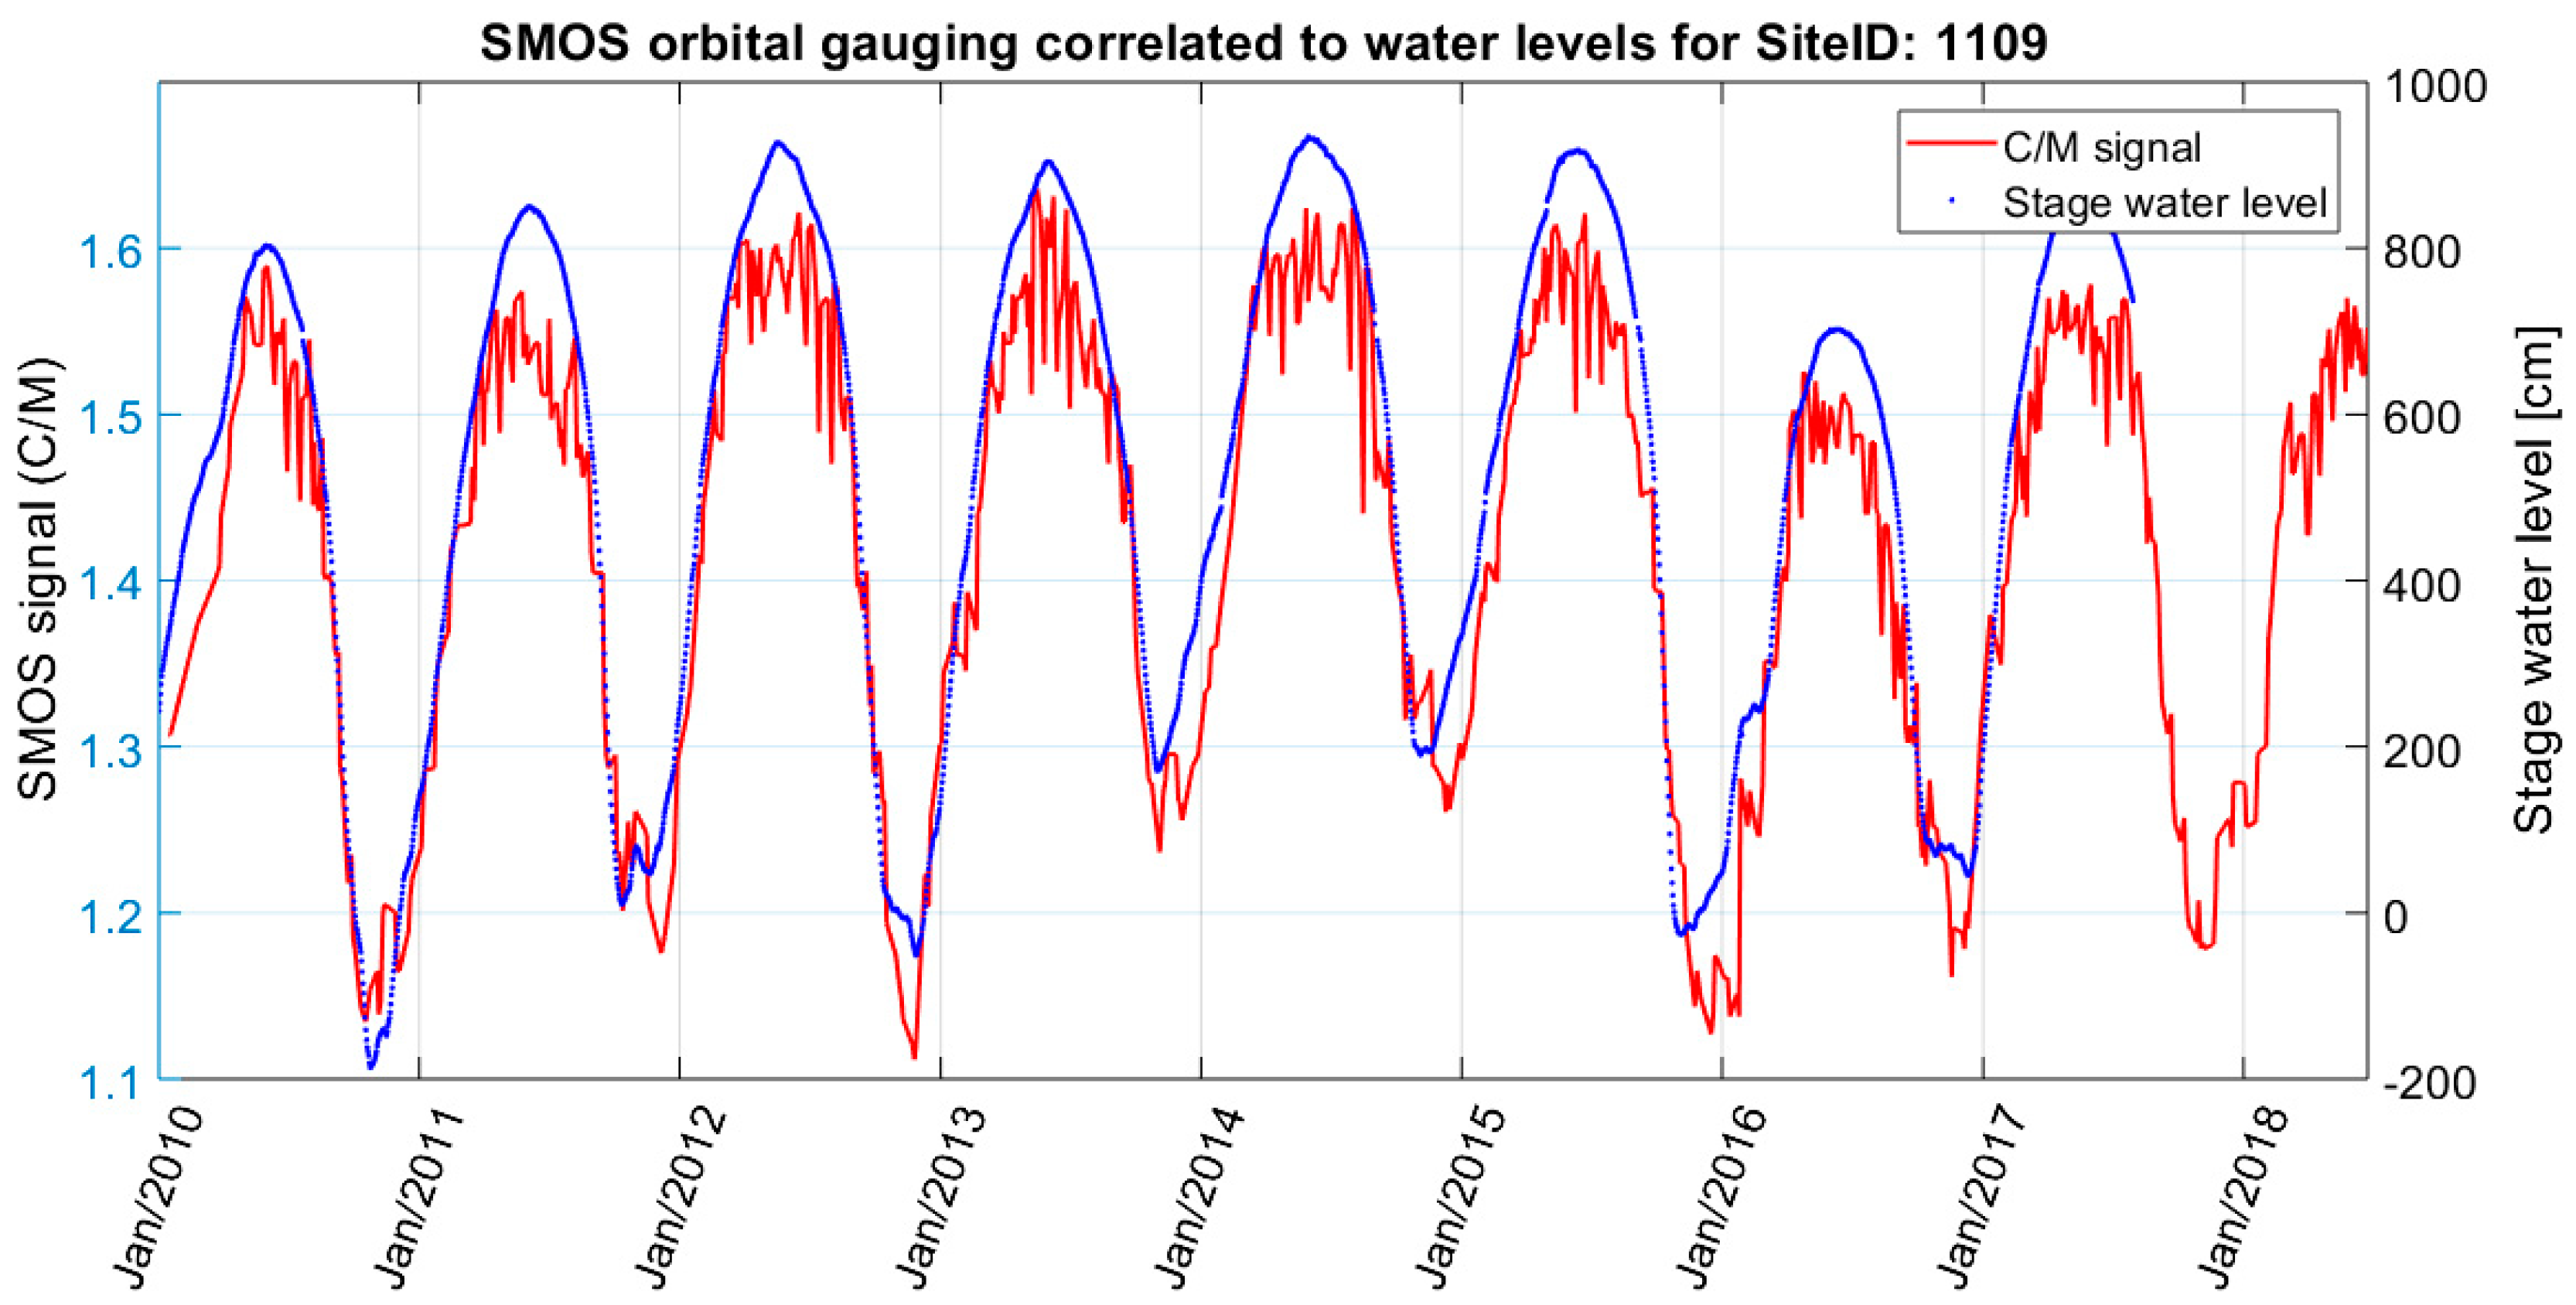
The SMOS C/M signal and the in-situ stage measurements (cm) over the Amazon basin showed a good agreement at most of the study sites. At some locations, there was very good agreement (Figure 11; Amazon River upstream from Parintins). Both the timing and the duration of the low and the high flow periods were well observed in the SMOS time series. The impact of vegetation cover appeared to be reduced by using the low frequency data and was in agreement with other results in the literature [50,56].
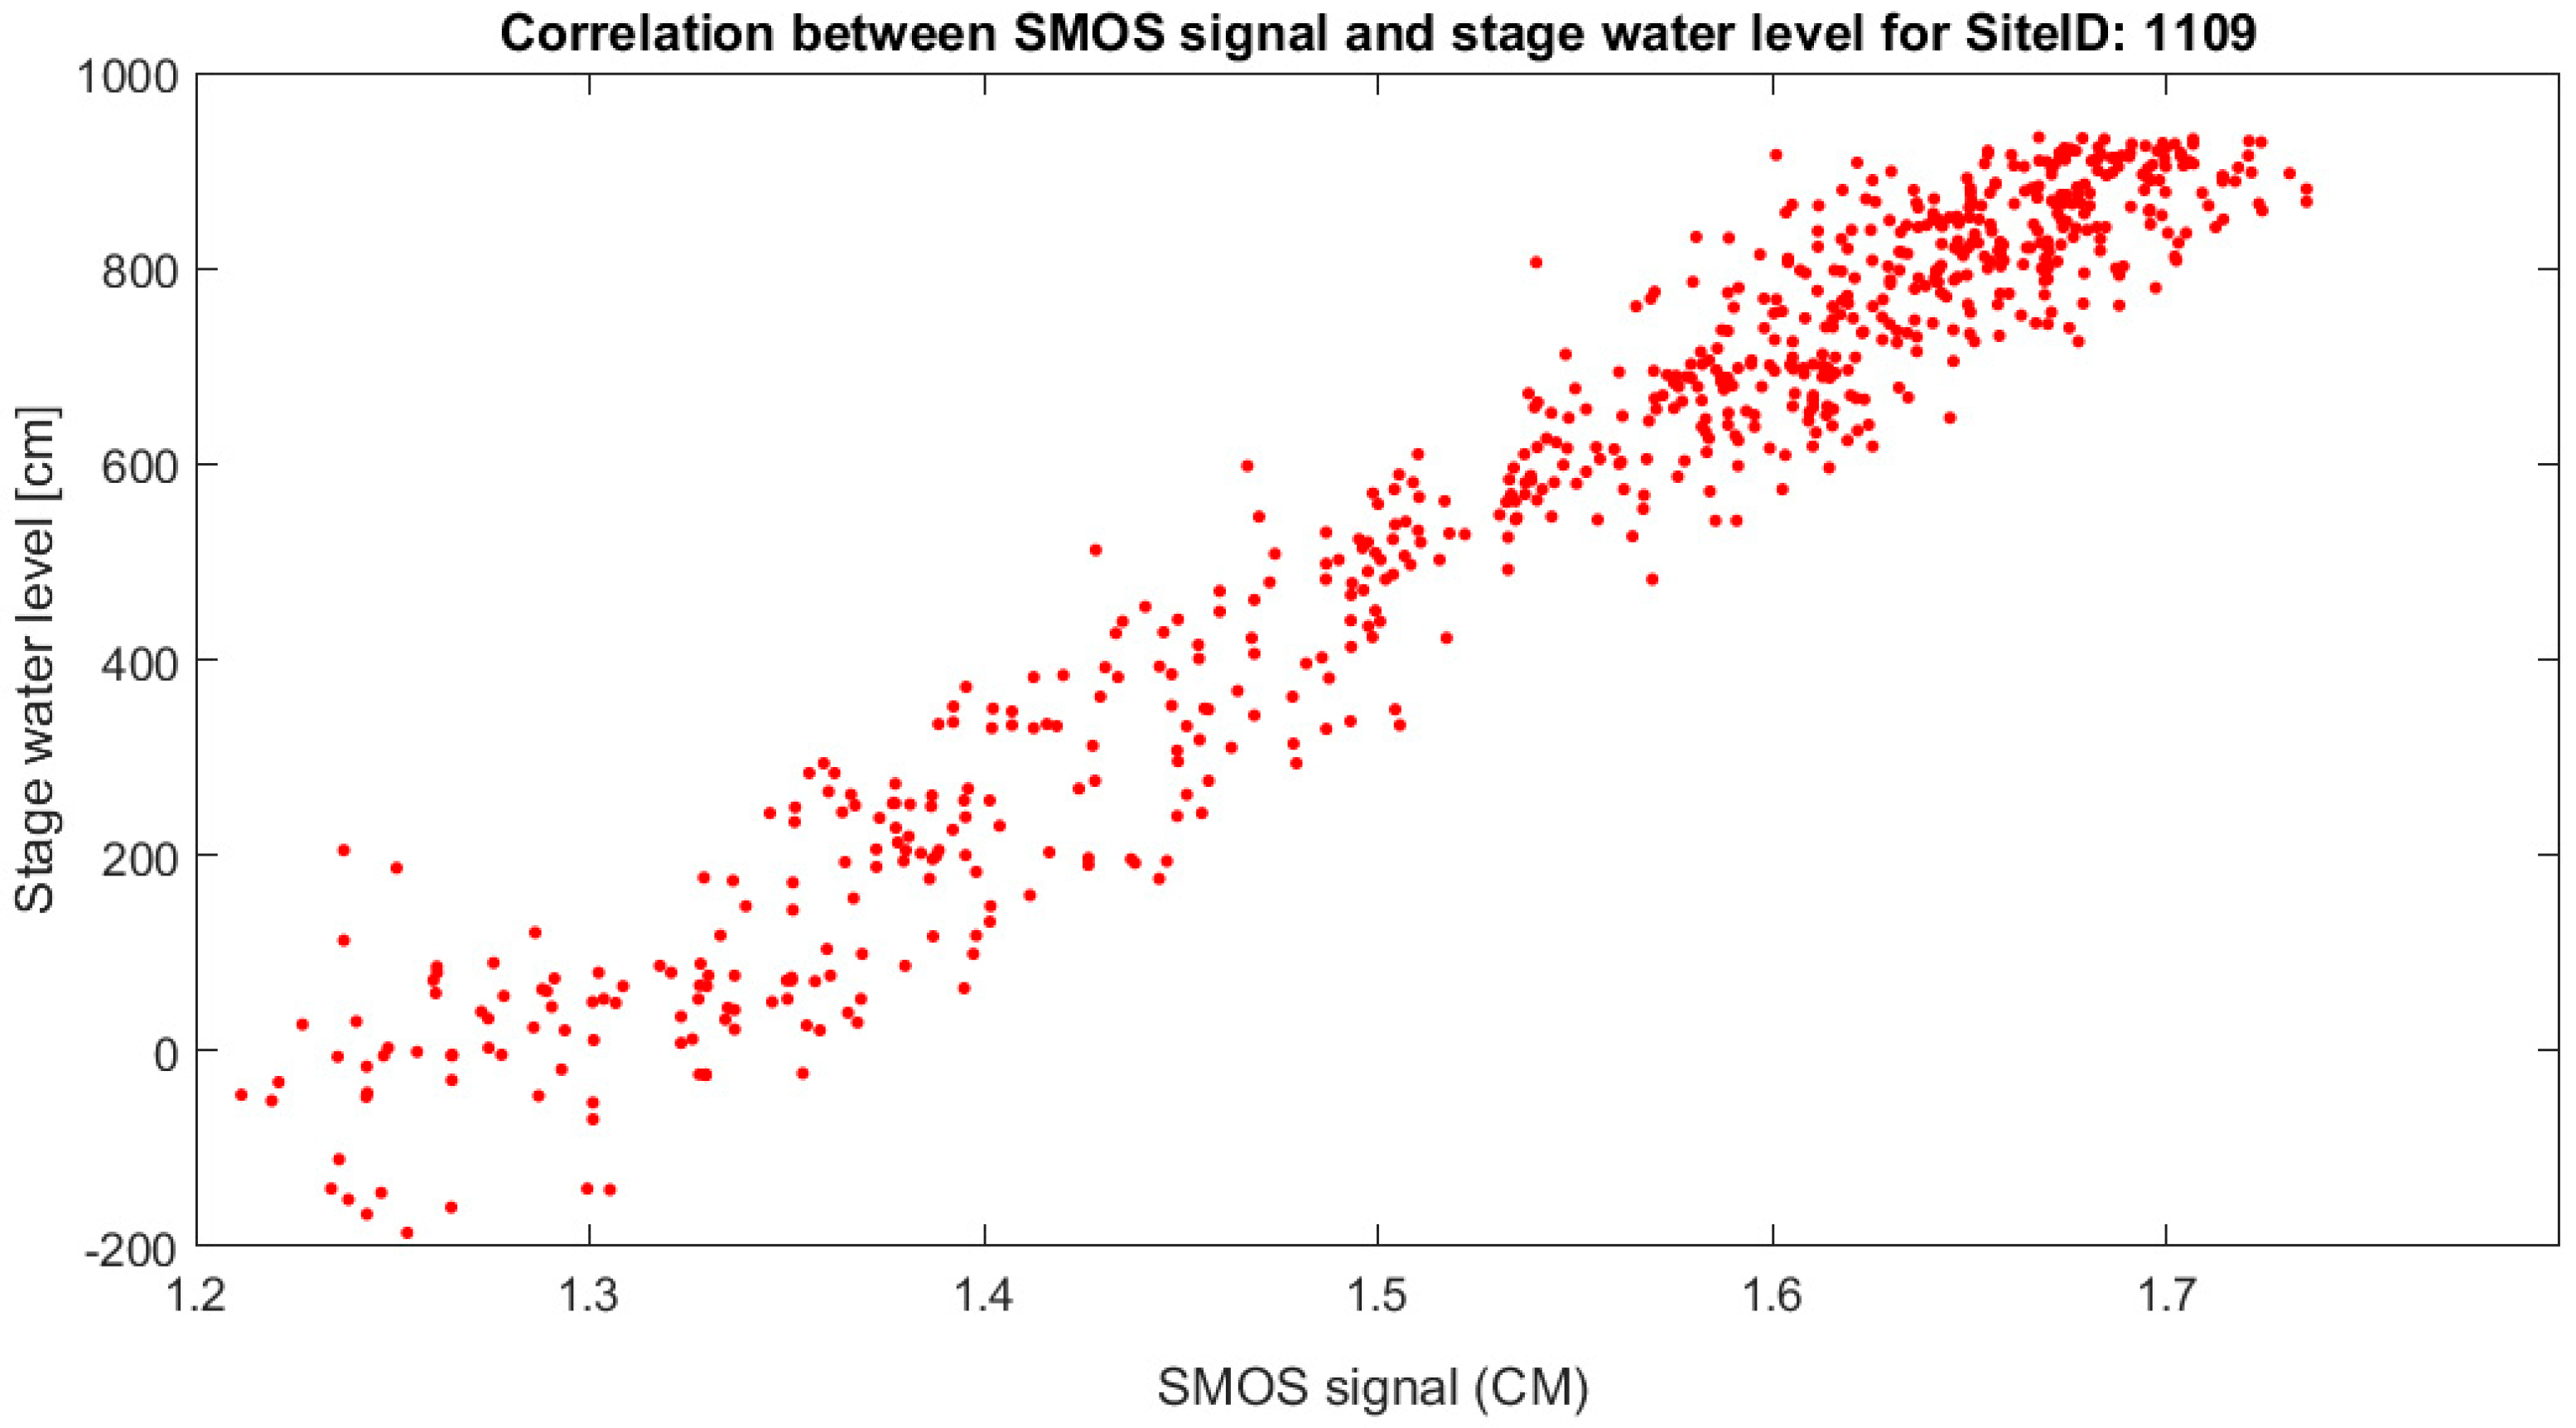
The relation of the SMOS signal data to in-situ stage information was calculated by linear-regression for each of the observed sites. The goodness of fit between the two measurements was quantified by the correlation coefficient r (Figure 12). Both low and peak flow values showed good agreement throughout the seasonal change for both dry and wet conditions. The correlation coefficient was found to be r = 0.97. NSE calculation resulted in 0.94, the highest from all of the studied sites, which suggested a very near match to in-situ stage water level. Both coefficients indicated that the water surface extent well replicated the water surface level over this location. Similar analyses are described by Brakenridge and others [27] for AMSR-E river watch in the USA when compared to in-situ measurements.
The same calculation was performed to evaluate the relation between GFDS (AMSR and TRMM sensors) and in-situ stage, and moreover between altimetry data and in situ stage. The three correlation coefficients and NSE calculations were compared over the same river location (Site ID 1109) to identify the best performing sensor type in each location. It was noted that the exact positions of the four data sources were not exactly the same in a spatial manner. The spatial deviation in the locations for each measurement was reduced as much as possible in order to represent the same or nearby area. Nevertheless, a distance up to 100 km had to be tolerated due to low density of in-situ hydrological observations, low resolution of microwave data, and the limited temporal sampling density of altimetry (such as from the Jason sensors presented later). Most hydrological stations registered in the Hybam database are operating in the Amazon catchment, and fewer stations are available in the Congo basin. Therefore, a higher tolerance had to be accepted for the Congo basin, which may have caused larger differences.
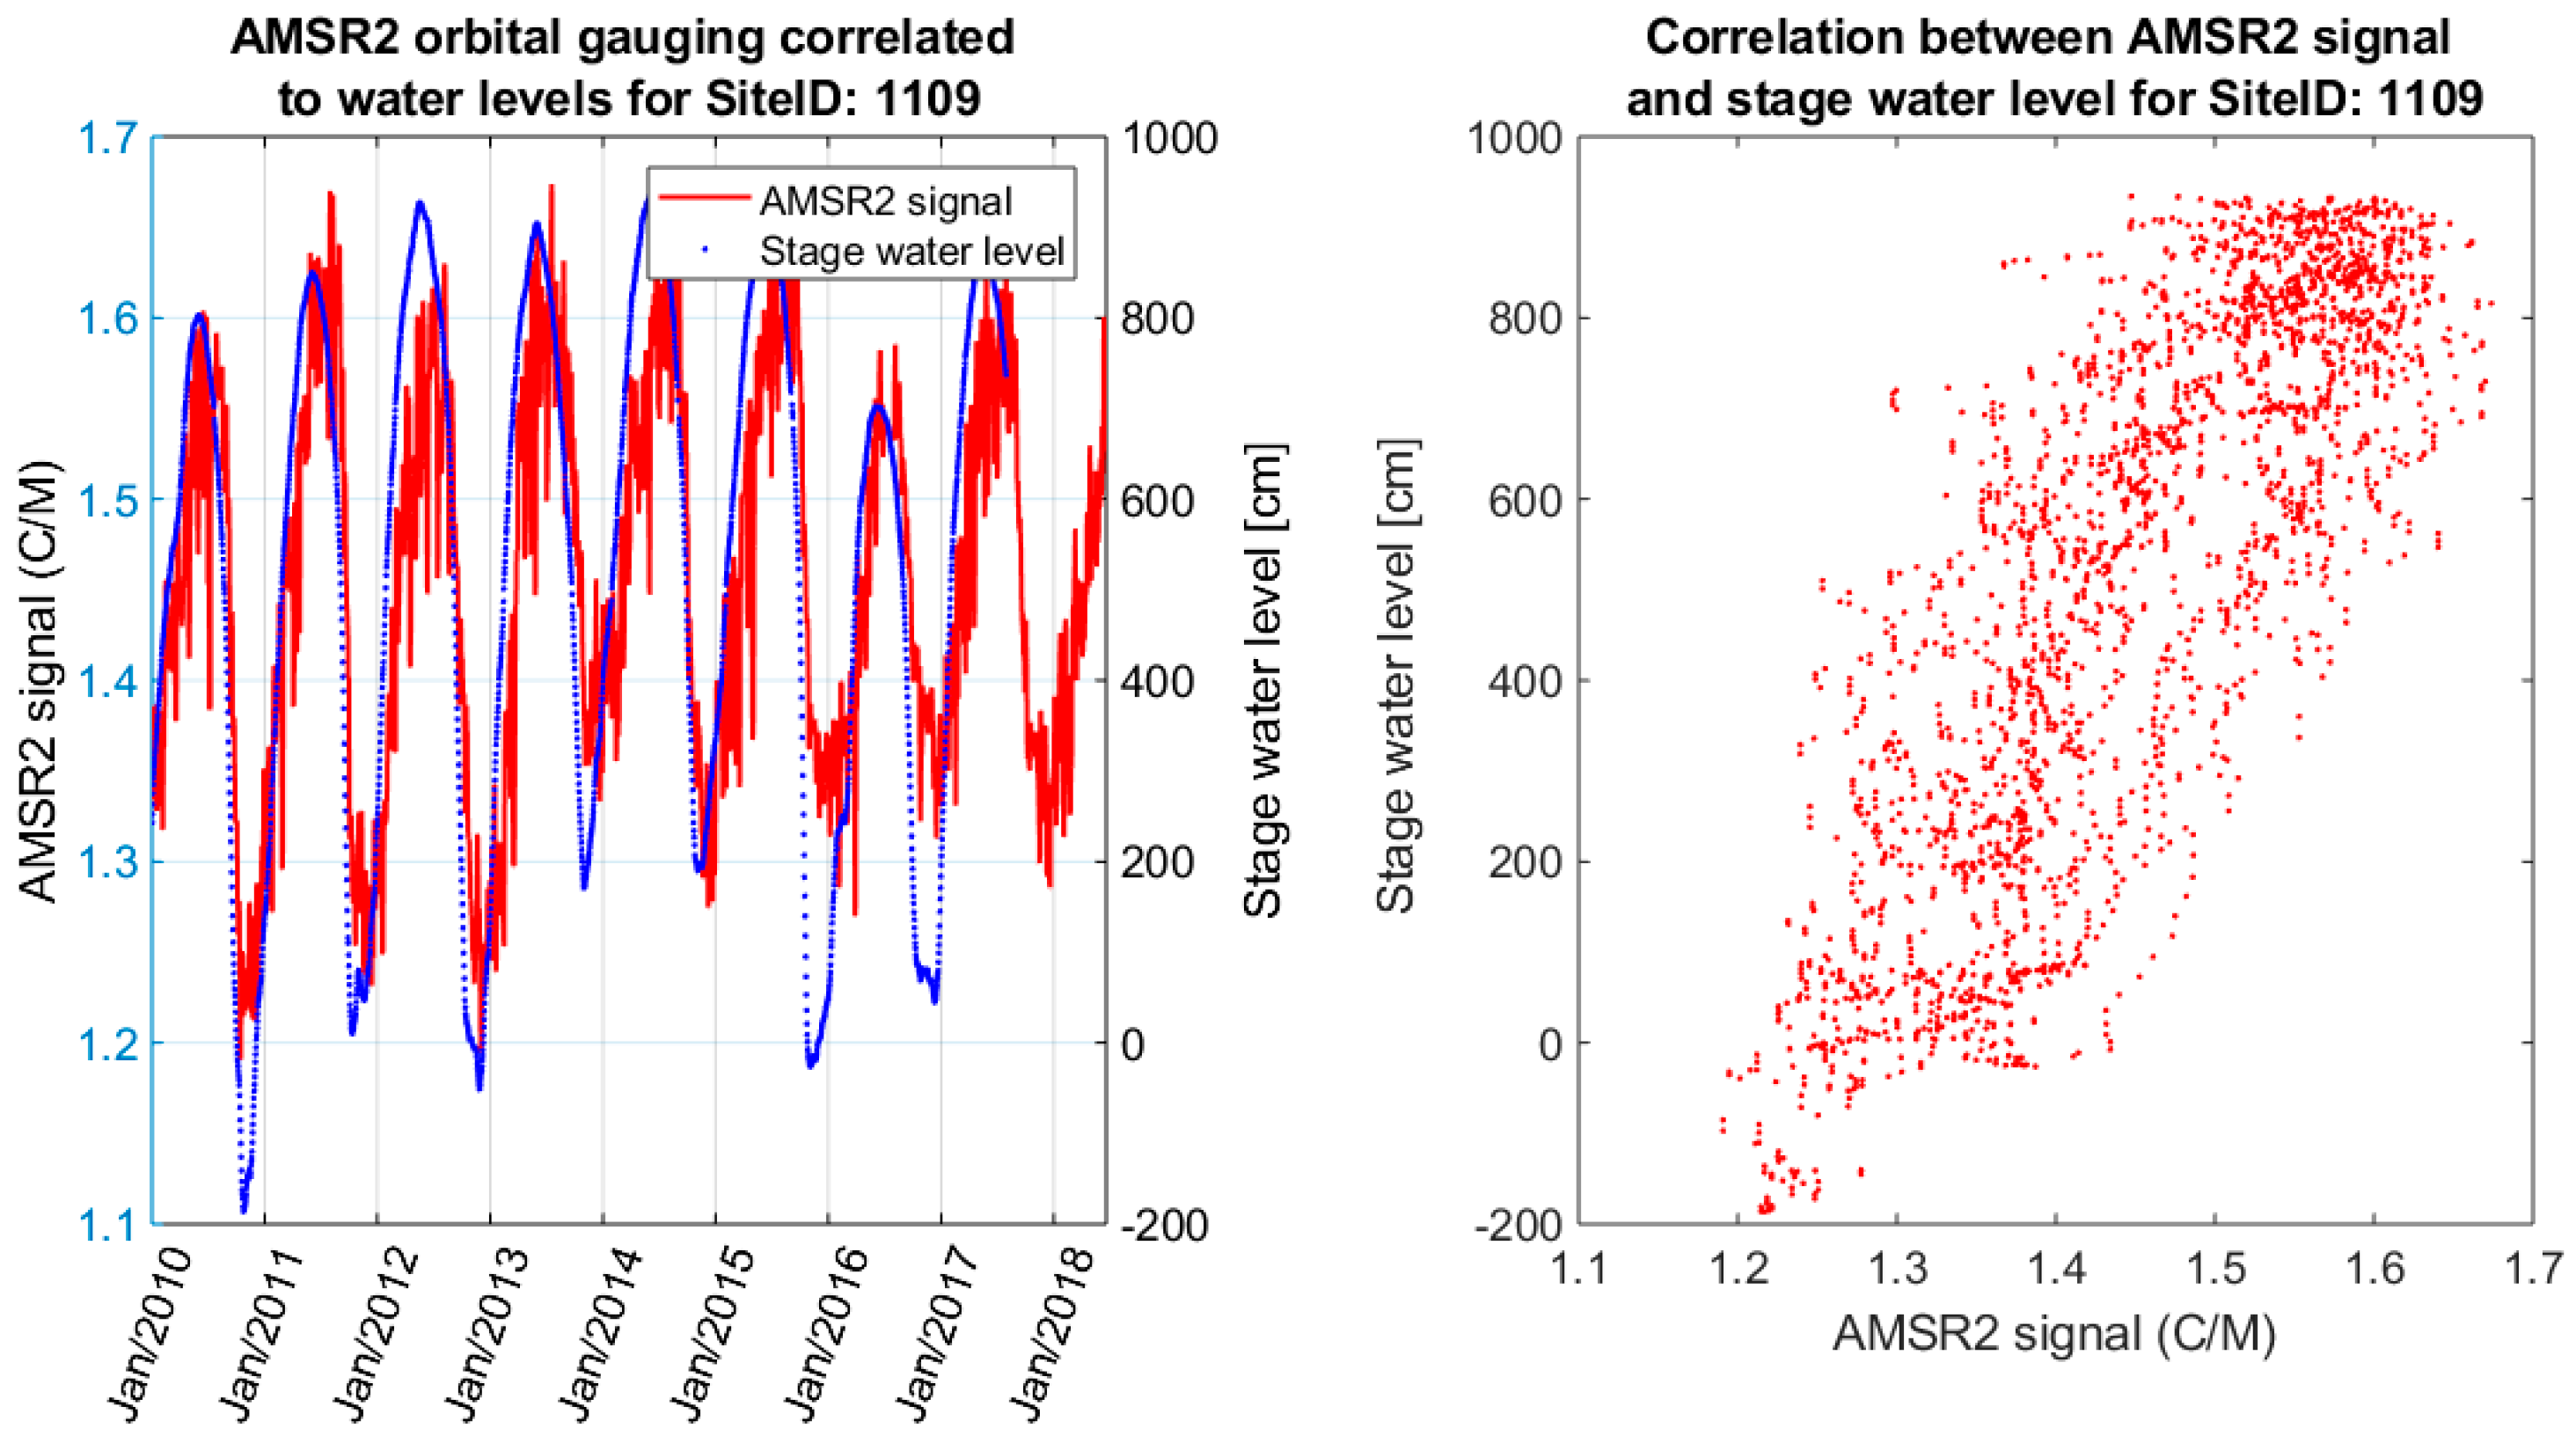
As examined earlier, the GFDS single-sensor time series was obtained for the same period and compared to river stage near the town Parintins, Amazon River, Brazil (Site ID 1109). Both GFDS and SMOS time series appeared to have similar trends in the study period (Figure 11 and Figure 13). However, due to higher noise in the C/M signal of the GFDS data, the correlation coefficient was found to be r = 0.82, lower than the SMOS result of r = 0.97 when both were compared to in-situ stage measurements. GFDS NSE calculation resulted in 0.63, which was also lower compared to the SMOS result of NSE = 0.94. The scatterplot (Figure 13, left panel) revealed that the number of GFDS observation points was higher. This was because the temporal resolution of AMSR and TRMM sensors was one to two days and was three to four days in the case of SMOS sensor. Nevertheless, the fewer SMOS observations seemed to reveal a generally higher match to in situ station data in the tropical area, indicating the SMOS sampling capacity was sufficient for this application.
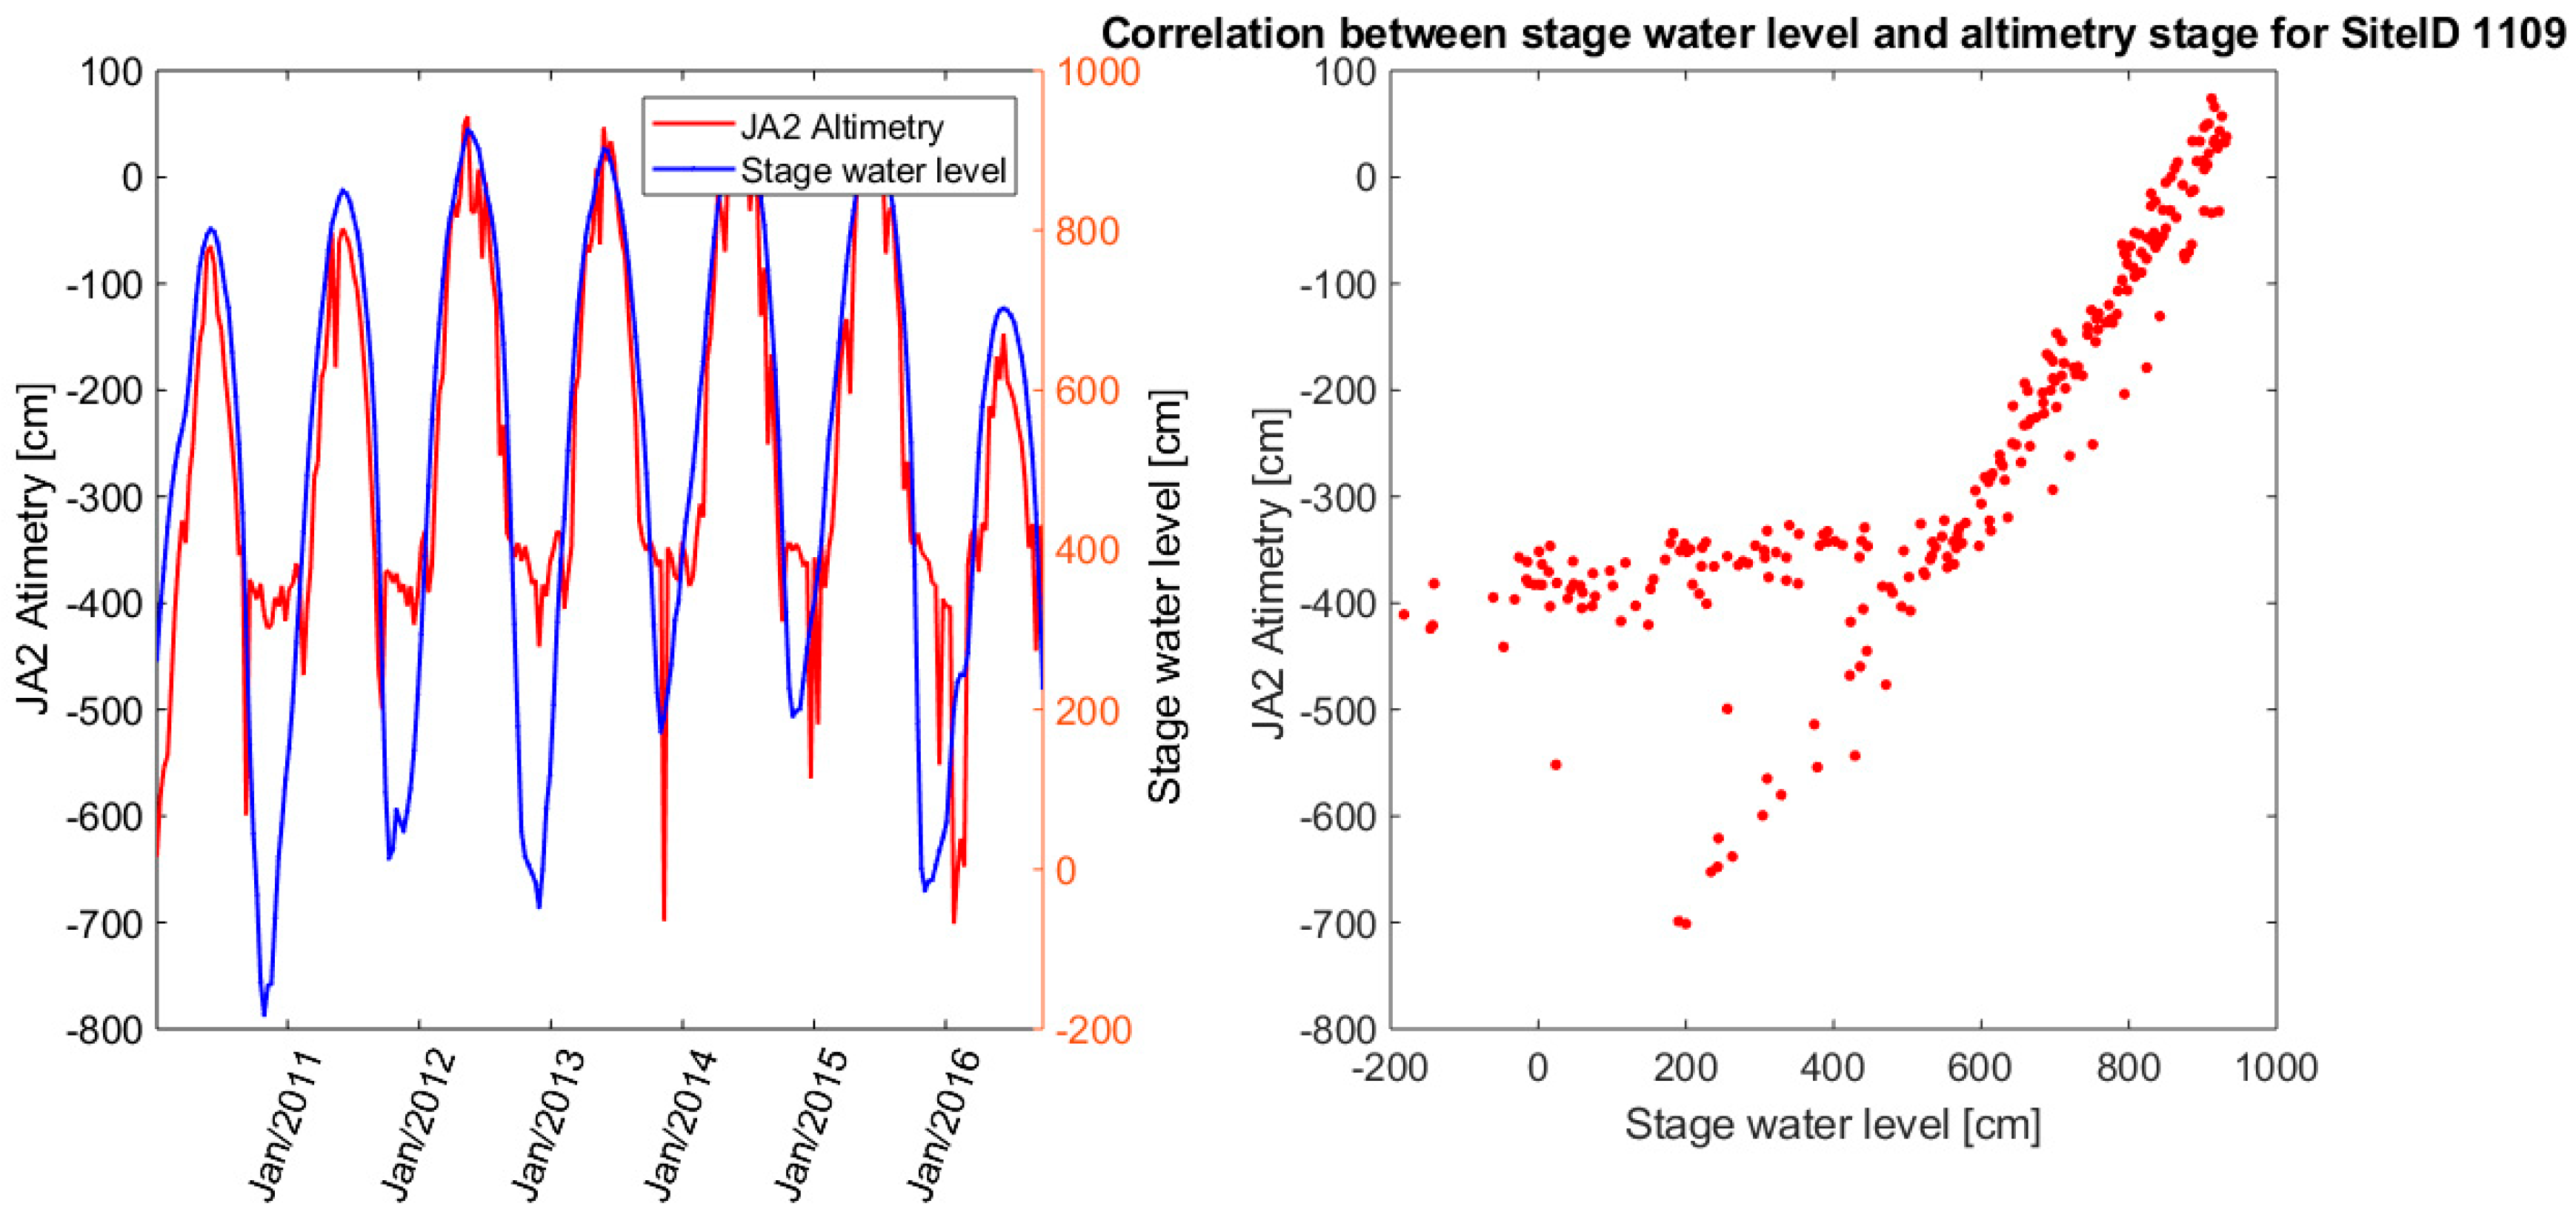
Moreover, in the last decades, many studies have been undertaken in the field of satellite altimetry for in-land water level estimations, especially in the tropical region. Such a data source was utilized to make a comparison with altimetry water levels in this study. Jason-2 and Jason-3 sensors cover the time span of SMOS sensor data, thereby allowing the correlation analysis with altimetry water levels from SO HYBAM database. For the Site ID 1109, there was good agreement with in-situ water level data during high flow periods; however, low water appeared to be measured less accurately from altimetry sensors (Figure 14). The scatterplot revealed both good agreement and overestimation of low water levels of around 500 cm. This type of overestimation was found over different locations such as Site 152 or Site 1098 in the Amazon basin as well. Therefore, linear regression resulted in a lower correlation r = 0.82 than SMOS r = 0.97 time series. Also, Jason NSE = 0.64 revealed a lower match to in situ stage data.
Altimetry data were not available in the Hybam database for all the studied locations. Besides the Jason-2 and Jason-3 datasets, Envisat water levels were included in the database; however, they did not overlap with the analyzed time period of SMOS. For this reason, altimetry comparisons were only possible in limited cases.
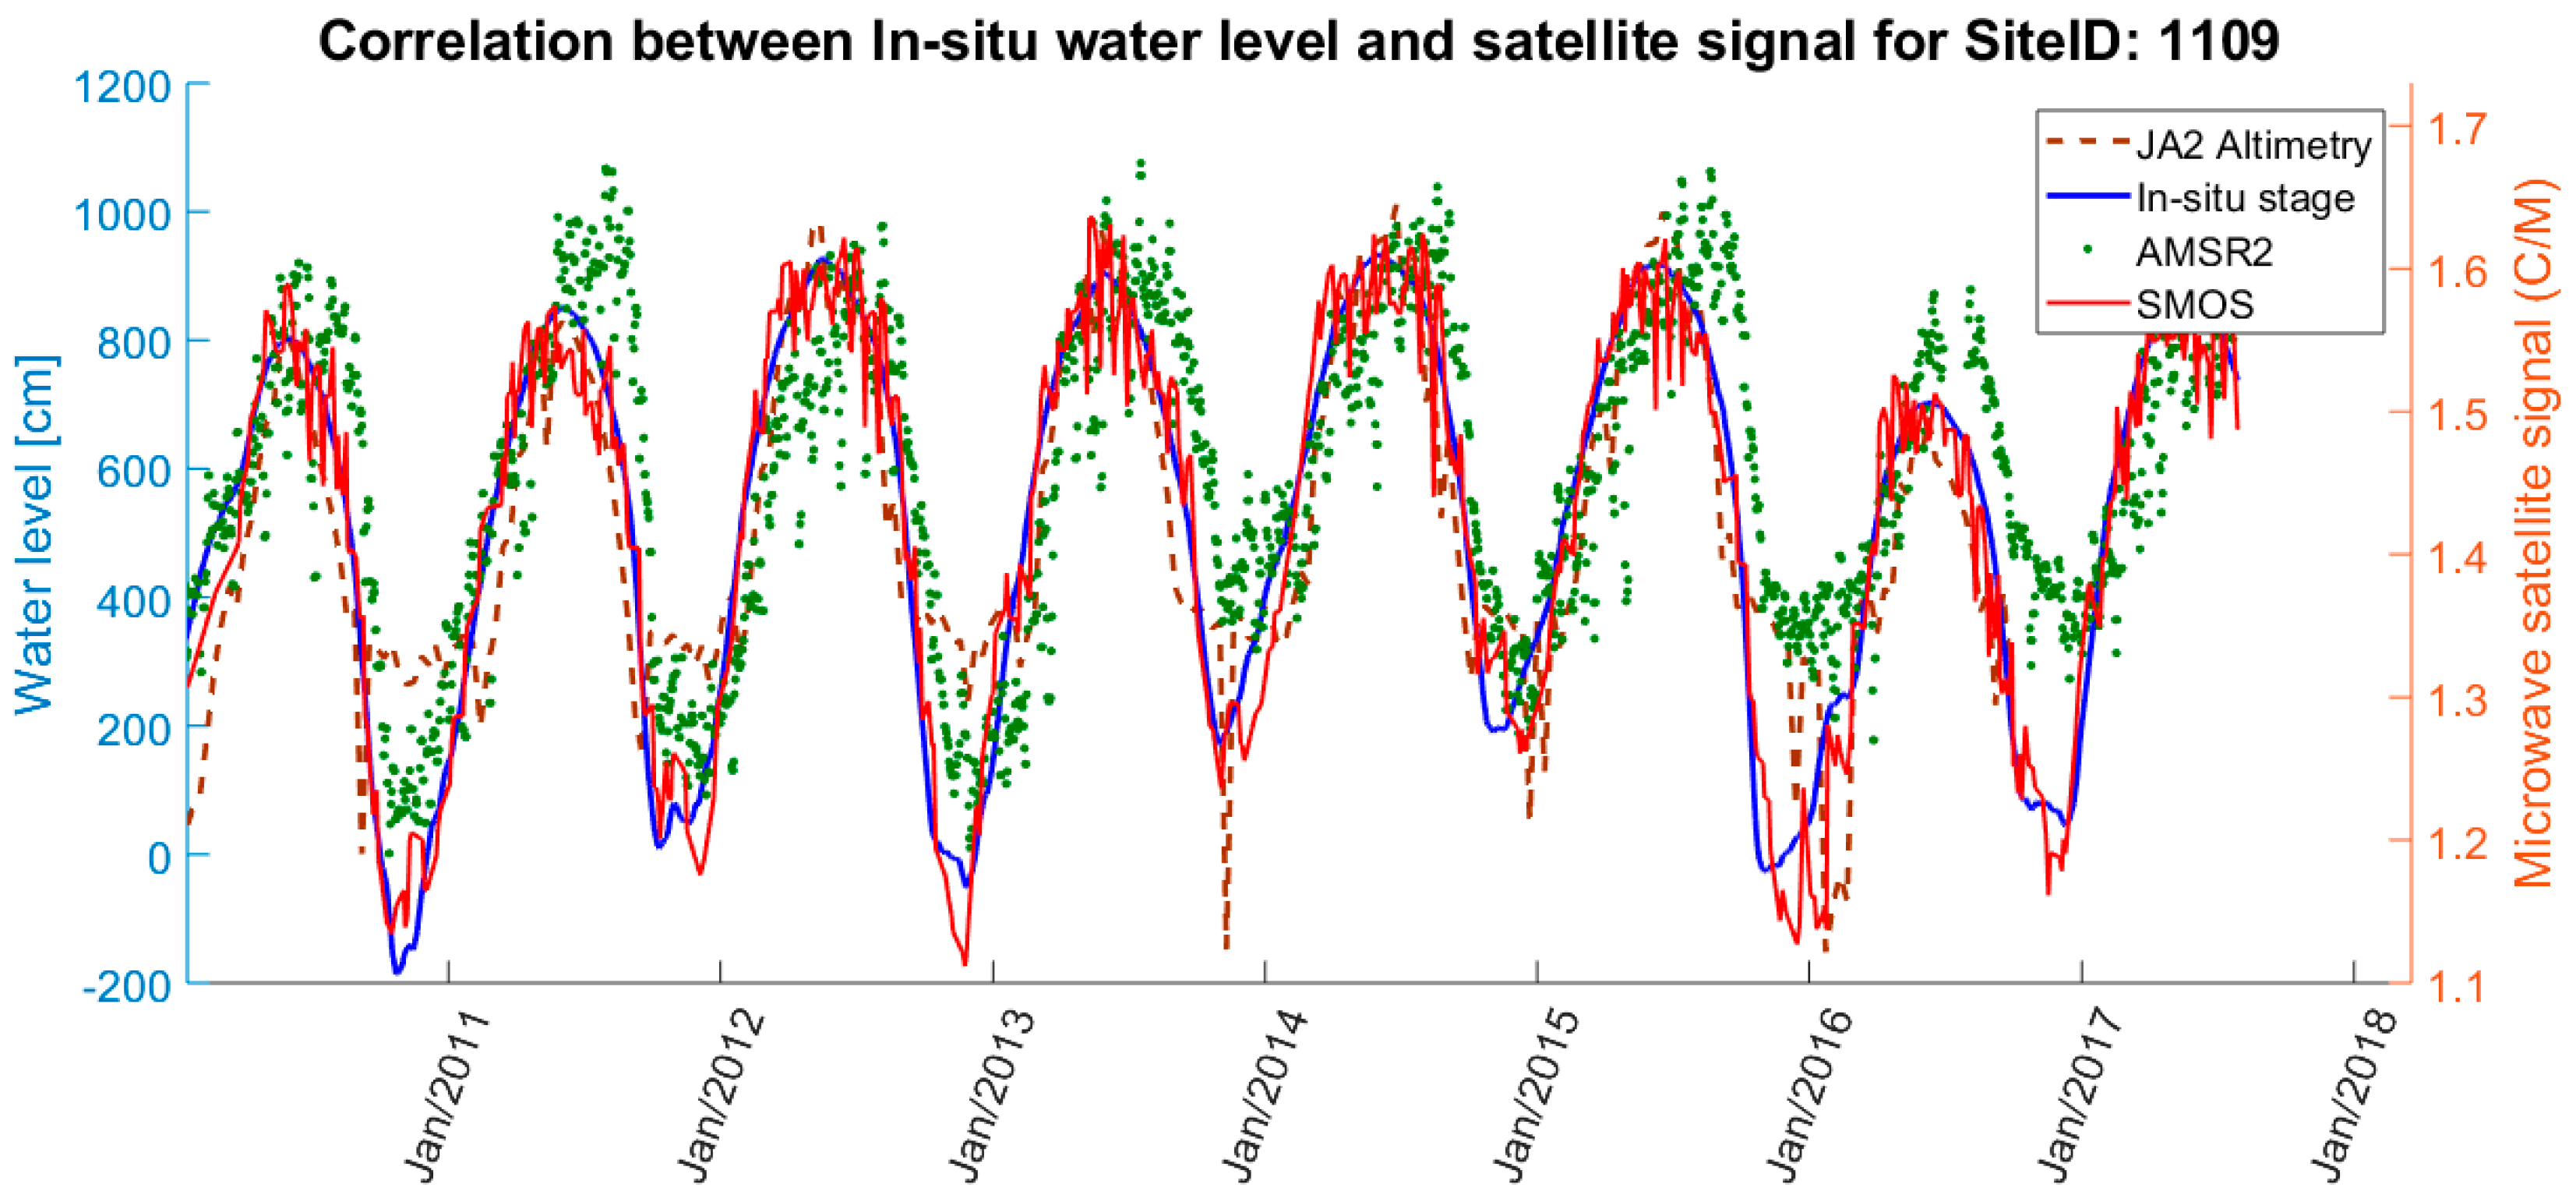
To present all results together in one place for the overall comparison, Figure 15 combines the three satellite based gauging and water level observations of SMOS, GFDS, and Jason with respect to in-situ stage at Parintins, Amazon River, Brazil (Site ID 1109). The graph illustrated a general good fit of all satellite resources at this site, while SMOS results were the most consistent with in-situ river stage in detail. For example, SMOS was the only one that could capture the low river stage in late 2016 to early 2017 compared to that measured by the in-situ river gauge, while AMSR2 had an apparent time delay (with respect to the in-situ data) due to vegetation cover effects causing the hysteresis as seen in the right panel of Figure 13.
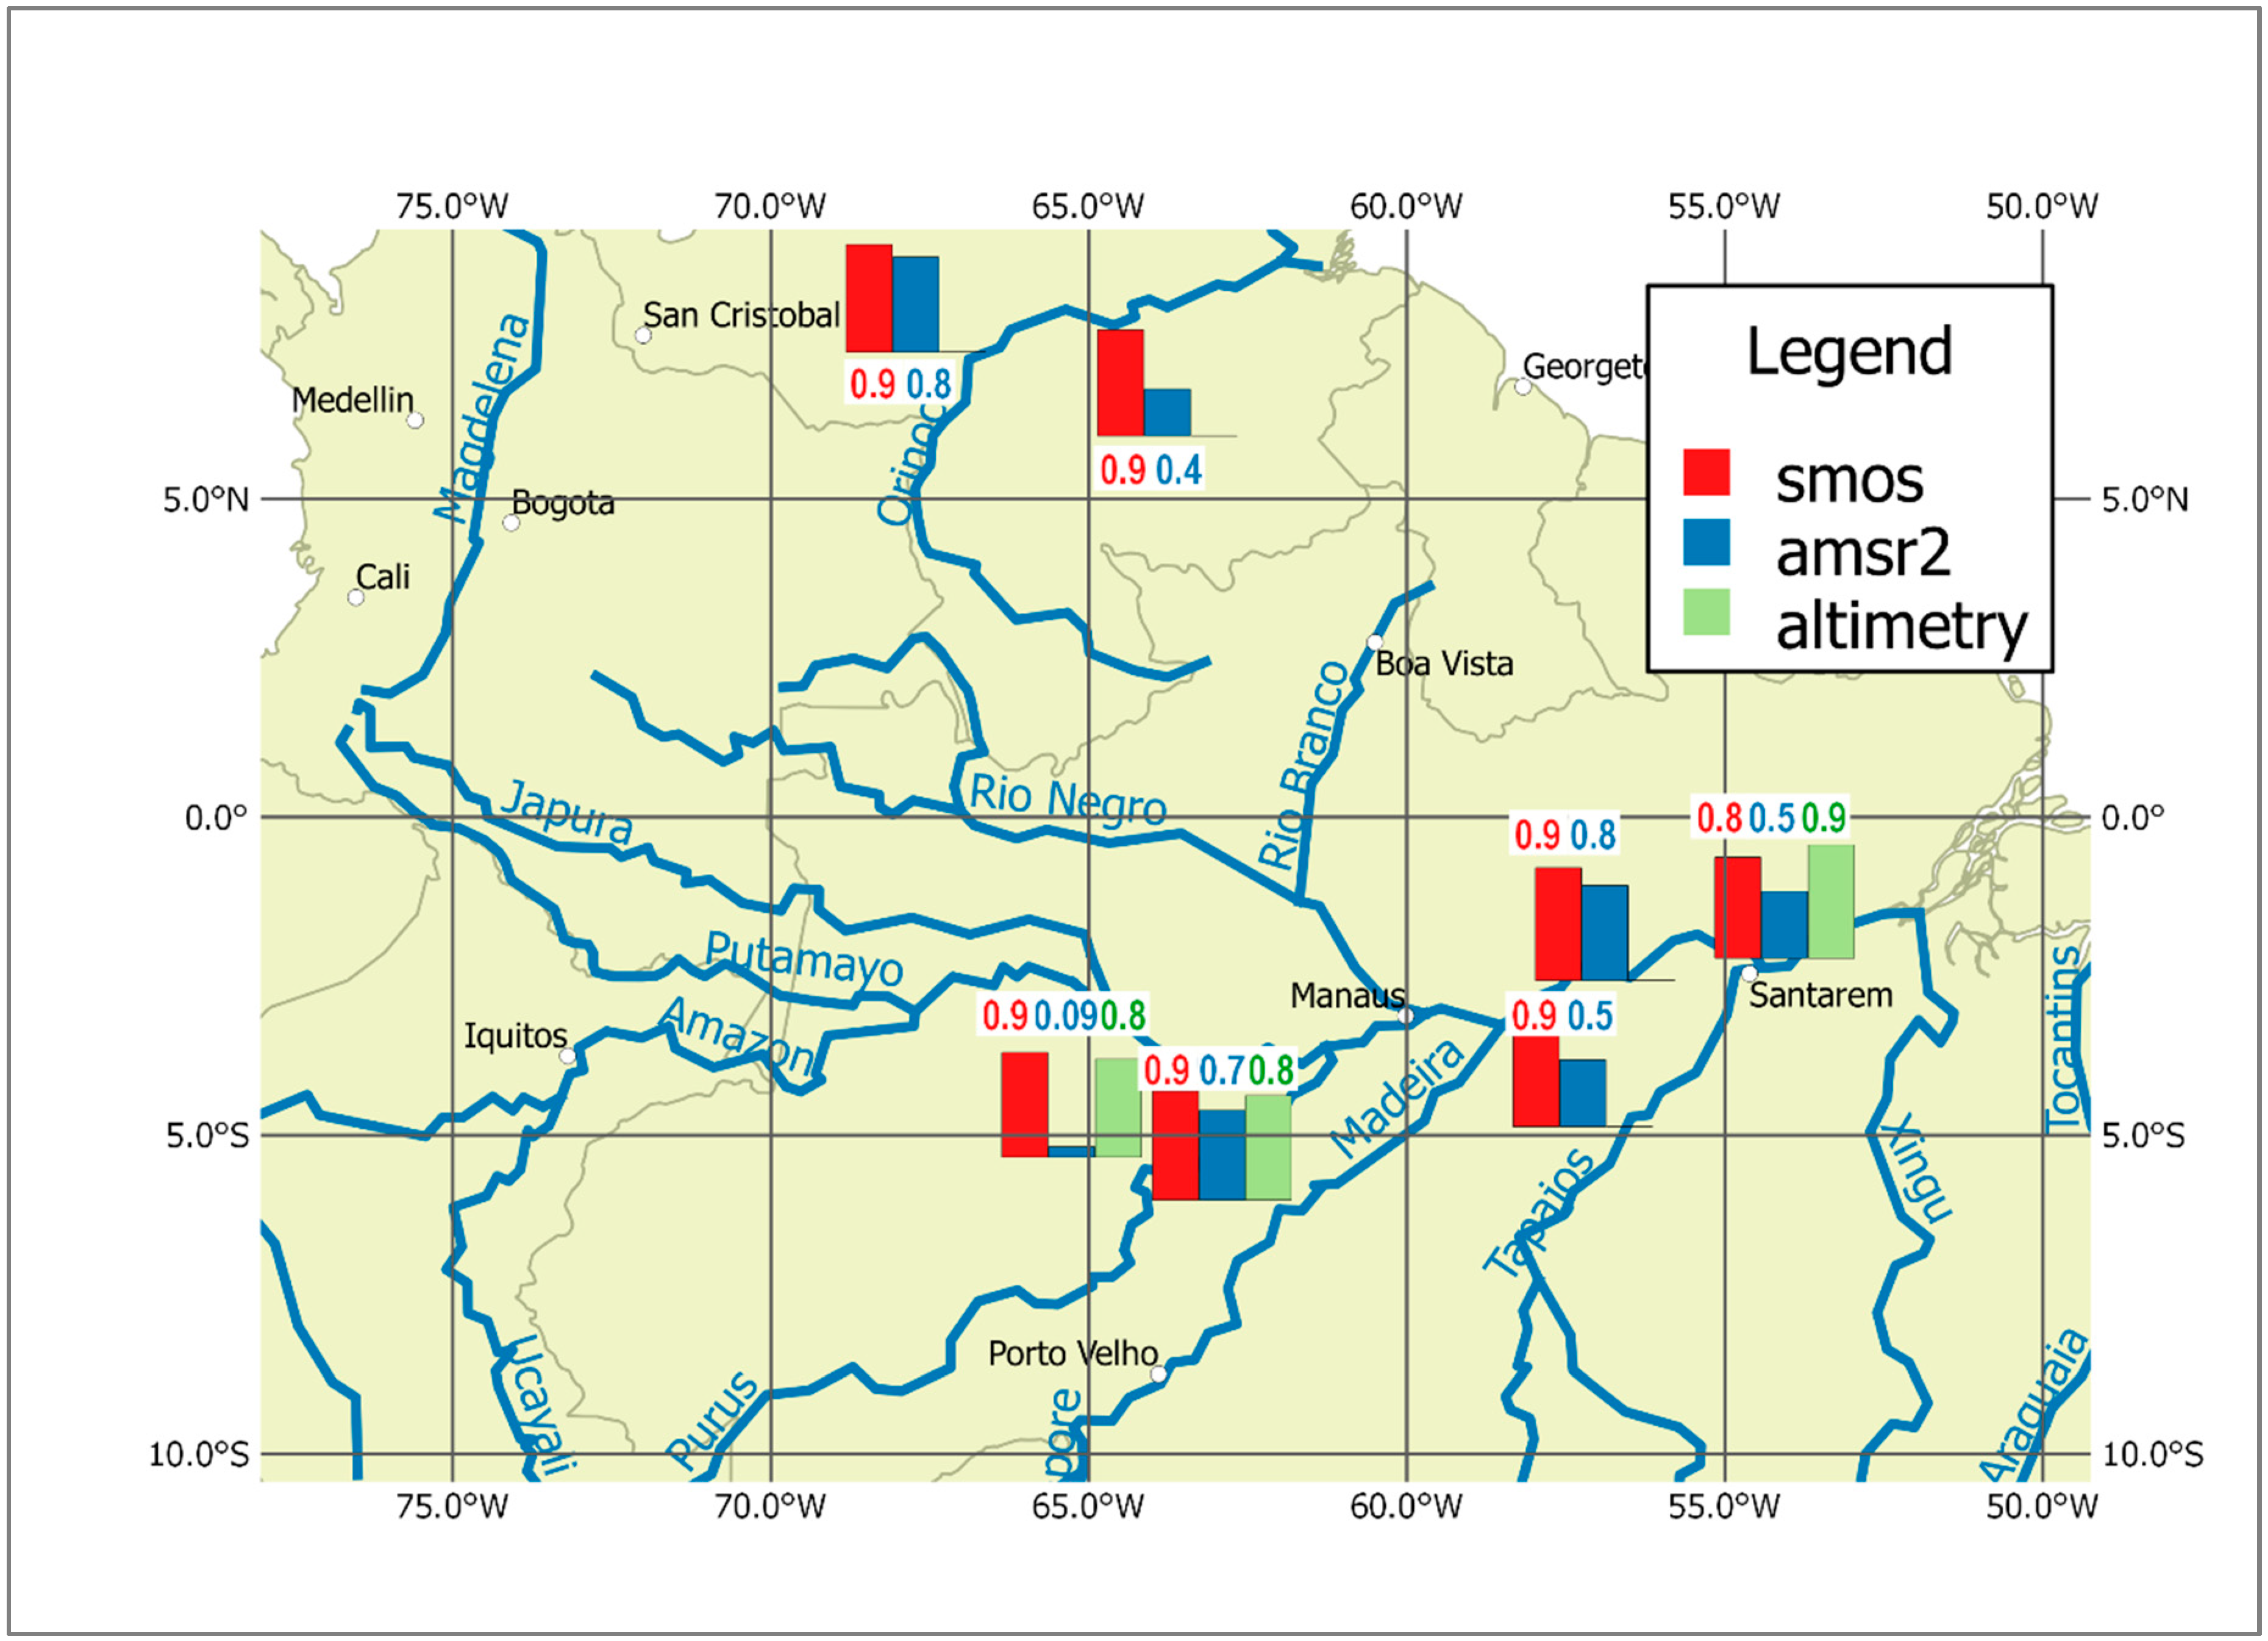
Correlation coefficients and NSE values were calculated for selected sites from each data source, resulting in three different correlation values for each satellite gauging site in the tropics: SMOS, GFDS, and one for altimetry. Figure 16 shows the correlation coefficient r when available for the selected observation sites, where different sensors are represented with different color bar charts with r values over/below the bars at the site. Table 2 summarizes the averaged correlation values by the three investigated river basins. Table 3 summarizes the averaged Nash–Sutcliffe model efficiency coefficient values by the three investigated river basins.
Table 2 summarizes the results for r, indicating that low-frequency SMOS data presented a new basis for improving satellite river discharge observations over densely vegetated areas in tropical regions. Correlation between SMOS data and in-situ stage was high at these locations of South America and Central Africa. GFDS data exhibited a lower correlation between 0.3 and 0.7. The altimetry data agreed with the with the gauging data, with a correlation above 0.9 for the Amazon basin. Table 2 also shows that the lowest standard deviations occurred for the SMOS data in all three catchments. These results confirm that there was an excellent consistency between the SMOS remote sensing hydrological measurements and in-situ gauging on all of the analyzed sites.
Table 3 summarizes the NSE values averaged on different tropical river basins. NSE values measuring the goodness of fit between SMOS satellite gauge and in-situ stage were significantly higher than zero in both the South America and the Central Africa study sites. The same results were found on altimetry data, however, the lack of nearby observations on the Orinoco or the Congo basin limited calculations to the Amazon basin only. GFDS appeared to be less accurate with NSE values below zero. The standard deviations of the NSE values also suggested that the SMOS observations on the Amazon and the Orinoco were the more stable sources of satellite gauging of tropical rivers.

4. Discussions

The low frequency L-band microwave data from SMOS sensor offered a much-improved capability to observe river stage and thus accompanying discharge changes in the tropics, where dense and extensive vegetation cover obscures the higher-frequency signals of other sensors. In particular, we observed a strong linear relationship between SMOS and in-situ stage at site 1109 on the Amazon River. In contrast, the higher-frequency GFDS data relation to river stage (Figure 13) exhibited significant hysteresis, apparently due to vegetation cover changes, and the signal was less sensitive to known water level changes. Similar hysteresis effects were observed in the relationship between TRMM polarization ratio data versus soil moisture [58], see Figure 9, upper panel.
The hysteresis in the seasonal observations at high frequencies (including X-, K-, and Ka-band data) was apparently caused by a greater attenuation of the microwaves leaving the ground surface and propagating though tropical dense forest canopies. A difference in seasonal attenuations gave rise to different C/M values for the same river stage observed in different seasonal vegetation conditions. In the tropics with dense forests, the hysteresis effects were significant in high-frequency data, consequently inducing large errors in river stage retrievals from the satellite high-frequency data (Figure 13). In the case of SMOS data, however, the linear relationship had no notable hysteresis (Figure 12). This was because the vegetation attenuation at the L-band frequency was weak, and the signal was responding to surface water change without significant effects of the dense vegetation canopy.
Although low-frequency SMOS data are sensitive to river change under a dense forest canopy, we caution that there can be some remaining uncertainties caused by: (1) residual effects from physical temperatures that are not fully cancelled out in the C/M ratio because the low resolution of SMOS demands a large calibration area C; (2) trans-ionospheric effects such as amplitude scintillations and polarization fluctuations can be larger for L-band SMOS compared to the Ka-band data used in GFDS; and (3) residual error is present even after radio-frequency-interference reduction is applied in the L-band passive data processing procedures. These effects may not be fully removable, and river discharge status measured by SMOS must be used carefully depending on specific purposes with different accuracy requirements.
An interesting signature separation in low and high flow conditions was found in the altimetry data series as compared to in situ data (Figure 14, right panel). In this case, it could have been that, during low flow conditions (e.g., <500 cm), surface area of the water became much smaller than at high flow conditions. Thus for low flow, a high pointing accuracy of the altimetry sensor is required to pinpoint the footprint on the open water surface and not on the river banks, sand bars, or shallow channel bathymetry exposed at low flow, or the in-stream vegetation (trees and aquatic herbaceous plants [59]), which makes the river stage appear higher than it actually is. For high flow (e.g., >500 cm), an intermittently large amount of humidity in the atmosphere during the wet rainy season can induce some propagation delay, which may cause the altimeter-estimated water surface elevation to be intermittently lower than the actual water level in the hydrological monomodal cycle of the Amazon [59].
Lastly, the analysis and comparisons were carried out at selected locations where SMOS data showed a strong response to water level changes. The validation of these sites was hindered by restricted access to in-situ gauging data in the study areas. For the Congo basin, only three stage locations were provided in the SO Hybam database, and stage measurements of the Amazon River tributaries outside Brazil, such as on the Ucayali River in Peru, were not publicly available. Along the Orinoco basin, only Venezuelan datasets were accessible. For Colombia, no data were available for determining the relation to in-situ stage measurements. Regarding the comparison to altimetry data, many locations in the dataset did not have a sufficient time series, or in other cases, only ENVISAT data were available but without the necessary temporal match to the SMOS time series (2010–2018) [60].

5. Conclusions

The comparison of the satellite gauging observations to in-situ river stage shows strong agreement despite the fact that SMOS and GFDS data are measuring water surface extent variations and not directly measuring water levels, which are measured by in-situ stage and satellite altimetry measurements. In particular, the low frequency microwave SMOS time series are strongly correlated with in-situ gauge, even in densely vegetated areas. GFDS time series has a weaker correlation to independently observed stages in tropical regions.
This analysis of SMOS data compared to these related satellite and ground-based data underlines the relevance of low-frequency passive-microwave data for hydrological observations. Seasonal water surface extent variations are well captured in the data series with a strong response to water area changes in a river reach, even given the relatively large pixel areas. The quality of the observations is dependent on the location of the pixel along the river. The low resolution of SMOS data may inflict difficulties in locating the monitoring sites for both wet (river measurement) and dry (calibration) pixels. This is also confirmed in the study by De Groeve [61] on GFDS applications to Namibian floods. Nevertheless, the benefit of using passive microwave data at low microwave frequency in tropical regions with a better penetration through dense vegetation and regardless of cloud cover has clear advantages compared to optical sensors and high-frequency microwave radiometer. Filtering the raw time series data also improves the performance of the methodology and the quality of the output products.

Author Contributions

Z.K. collected and analyzed the satellite data drafting the first version of the manuscript. All three authors collaborated on further analysis including the identification of hysteresis and explanation of microwave signatures responses and preparation of the final manuscript.

Funding

The work in Hungary was funded by the Higher Education Excellence Program of the Ministry of Human Capacities, Hungary in the frame of the Water sciences & Disaster Prevention research area of the Budapest University of Technology and Economics (BME FIKP-VÍZ).

Acknowledgments

The research carried out at the Jet Propulsion Laboratory, California Institute of Technology, was supported by the NASA Land Cover and Land Use Change Program and in part by the NASA Earth Science Research and Analysis (R&A) Program. The work at the University of Colorado was supported by the NASA Applied Sciences Program.

Conflicts of Interest

The authors declare no conflict of interest.

References

  1. Alsdorf, D.E.; Rodríguez, E.; Lettenmaier, D.P. Measuring surface water from space. Rev. Geophys. 2007, 45, RG2002. [Google Scholar] [CrossRef]
  2. Hollyday, E.F. Improving estimates of streamflow characteristics by using Landsat-1 imagery. J. Res. US Geol. Surv. 1976, 4, 517–531. [Google Scholar]
  3. Rango, A.; Salomonson, V.V. Regional food mapping from space. Water Resour. Res. 1974, 10, 473–484. [Google Scholar] [CrossRef]
  4. Blasco, F.; Bellan, M.F.; Chaudhury, M.U. Estimating the extent of floods in Bangladesh using SPOT data. Remote Sens. Environ. 1992, 39, 167–178. [Google Scholar] [CrossRef]
  5. Hansen, M.C.; DeFries, R.S.; Townshend, J.R.G.; Sohlberg, R.; Dimiceli, C.; Carroll, M. Towards an operational MODIS continuous field of percent tree cover algorithm: Examples using AVHRR and MODIS data. Remote Sens. Environ. 2002, 83, 303–319. [Google Scholar] [CrossRef]
  6. Kugler, Z. The Use of GIS and Remote Sensing in Flood Disaster Management in Mozambique. In II. PhD CivilExpo Symposium Proceedings: BUTE Dept. of Highway and Railway Engineering; Barna, Z., Fenyős, D., Eds.; BME: Budapest, Hungary, 2004; pp. 84–88. ISBN 963-421-600-5. [Google Scholar]
  7. Brakenridge, G.R.; Nghiem, S.V.; Anderson, E.; Chien, S. Space-based measurement of river runoff. EOS Trans. Am. Geophys. Union 2005, 86, 185–188. [Google Scholar] [CrossRef]
  8. Nigro, J.; Slayback, D.; Policelli, F.; Brakenridge, G.R. NASA/DFO MODIS Near Real-Time (NRT) Global Flood Mapping Product-Evaluation of Flood and Permanent Water Detection; Technical Report; NASA GSFC: Greenbelt, MD, USA, 2014.
  9. O’Grady, D.; Leblanc, M.; Gillieson, D. Use of ENVISAT ASAR Global Monitoring Mode to complement optical data in the mapping of rapid broad-scale flooding in Pakistan. Hydrol. Earth Syst. Sci. 2011, 15, 3475–3494. [Google Scholar] [CrossRef]
  10. Horritt, M.S.; Mason, D.C.; Luckman, A.J. Flood boundary delineation from Synthetic Aperture Radar imagery using a statistical active contour model. Int. J. Remote Sens. 2001, 22, 2489–2507. [Google Scholar] [CrossRef]
  11. Henry, J.B.; Chastanet, P.; Fellah, K.; Desnos, Y.L. Envisat multi-polarized ASAR data for flood mapping. Int. J. Remote Sens. 2006, 27, 1921–1929. [Google Scholar] [CrossRef]
  12. Cossu, R.; Schoepfer, E.; Bally, P.; Fusco, L. Near real-time SAR-based processing to support flood monitoring. J. Real-Time Image Process. 2009, 4, 205–218. [Google Scholar] [CrossRef]
  13. Martinis, S.; Twele, A.; Voigt, S. Towards operational near real-time flood detection using a split-based automatic thresh-olding procedure on high resolution TerraSAR-X data. Nat. Hazards Earth Syst. Sci. 2009, 9, 303–314. [Google Scholar] [CrossRef]
  14. Pierdicca, N.; Pulvirenti, L.; Chini, M.; Guerriero, L.; Candela, L. Observing floods from space: Experience gained from COSMO-SkyMed observations. Acta Astronaut. 2013, 84, 122–133. [Google Scholar] [CrossRef]
  15. Alsdorf, D.E.; Smith, L.C.; Melack, J.M. Amazon floodplain water level changes measured with interferometric SIR-C radar. IEEE Trans. Geosci. Remote Sens. 2001, 39, 423–431. [Google Scholar] [CrossRef]
  16. Birkett, C.M.; Mertes, L.; Dunne, T.; Costa, M.; Jasinski, J. Altimetric remote sensing of the Amazon: Application of satellite radar altimetry. J. Geophys. Res. Atmos. 2002, 107, 8059. [Google Scholar] [CrossRef]
  17. Kouraev, A.; Zakharova, E.A.; Samain, O.; Mognard-Campbell, N.; Cazenave, A. Ob’river discharge from Topex/Poseidon satellite altimetry. Remote Sens. Environ. 2004, 93, 238–245. [Google Scholar] [CrossRef]
  18. Seyler, F.; Calmant, S.; da Silva, J.S.; Moreira, D.; Mercier, F.; Shum, C.K. From TOPEX/Poseidon to Jason-2/OSTM in the Amazon basin. Adv. Space Res. 2013, 51, 1542–1550. [Google Scholar] [CrossRef]
  19. Crétaux, J.-F.; Jelinski, W.; Calmant, S.; Kouraev, A.; Vuglinski, V.; Bergé-Nguyen, M.; Gennero, M.-C.; Nino, F.; Abarca Del Rio, R.; Cazenave, A.; et al. SOLS: A Lake database to monitor in Near Real Time water level and storage variations from remote sensing data. J. Adv. Space Res. 2011, 5. [Google Scholar] [CrossRef]
  20. Campos, I.; Mercier, F.; Maheu, C.; Cochonneau, G.; Kosuth, P.; Blitzkow, D.; Cazenave, A. Temporal variations of river basin waters from Topex/Poseidon satellite altimetry. Application to the Amazon basin. C. R. l’Acad. Sci. Ser. IIA Earth Planet. Sci. 2001, 333, 633–643. [Google Scholar] [CrossRef]
  21. Birkett, C.; Reynolds, C.; Beckley, B.; Doorn, B. From Research to Operations: The USDA Global Reservoir and Lake Monitor. In Coastal Altimetry; Vignudelli, S., Kostianoy, A., Cipollini, P., Benveniste, J., Eds.; Springer: Berlin/Heidelberg, Germany, 2011; pp. 19–50. [Google Scholar] [CrossRef]
  22. Stippel, S.J.; Hamilton, S.K.; Melack, J.M.; Choudhury, B.J. Determination of inundation area in the Amazon River floodplain using SMMR 37 GHz polarization difference. Remote Sens. Environ. 1994, 48, 70–76. [Google Scholar] [CrossRef]
  23. Harris, A.; Rahman, S.; Faisal, H.; Lance, Y.; Amvrossios, B.; Greg, E. Satellite-based Flood Modeling Using TRMM-based Rainfall Products. Sensors 2007, 7, 3416. [Google Scholar] [CrossRef] [PubMed]
  24. Ferrazzoli, P.; Rahmoune, R.; Grings, F.; Douna, V.; Parmuchi, G.; Salvia, M.; Karszenbaum, H. AMSR-E observations of rain and flood events over vegetated areas of LA Plata basin. In Proceedings of the 2010 11th Specialist Meeting on Microwave Radiometry and Remote Sensing of the Environment, New Brunswick, NJ, USA, 1–4 March 2010; pp. 63–66. [Google Scholar] [CrossRef]
  25. Lacava, T.; Cuomo, V.; Di Leo, E.V.; Pergola, N.; Romano, F.; Tramutoli, V. Improving soil wetness variations monitoring from passive microwave satellite data: The case of April 2000 Hungary flood. Remote Sens. Environ. 2005, 96, 135–148. [Google Scholar] [CrossRef]
  26. Temimi, M.; Leconte, R.; Brissette, F.; Chaouch, N. Flood and soil wetness monitoring over the Mackenzie River Basin using AMSR-E 37GHz brightness temperature. J. Hydrol. 2007, 333, 317–328. [Google Scholar] [CrossRef]
  27. Brakenridge, G.R.; Nghiem, S.V.; Anderson, E.; Mic, R. Orbital microwave measurement of river discharge and ice status. Water Resour. Res. 2007, 43. [Google Scholar] [CrossRef] [Green Version]
  28. Kugler, Z.; De Groeve, T.; Brakenridge, G.R.; Anderson, E. Towards Near-real Time Global Flood Detection System. Int. Arch. Photogramm. Remote Sens. 2007, XXXVI Pt 7, 1–8. [Google Scholar]
  29. Brakenridge, G.R.; Cohen, S.; Kettner, A.J.; De Groeve, T.; Nghiem, S.V.; Syvitski, J.P.M.; Fekete, B.M. Calibration of orbital microwave measurements of river discharge using a global hydrology model. J. Hydrol. 2012, 475, 123–136. [Google Scholar] [CrossRef]
  30. Kugler, Z. Remote sensing for natural hazard mitigation and climate change impact assessment. Időjárás/Q. J. Hung. Meteorol. Serv. 2012, 116, 21–39. [Google Scholar]
  31. Amarnath, G.; Ameer, M.; Aggarwal, P.; Smakhtin, V. Detecting spatio-temporal changes in the extent of seasonal and annual flooding in South Asia using multi-resolution satellite data. Proc. SPIE Int. Soc. Opt. Eng. 2012, 8538, 853818. [Google Scholar]
  32. Zhang, Y.; Hong, Y.; Wang, X.; Gourley, J.J.; Gao, J.; Vergara, H.J.; Yong, B. Assimilation of Passive Microwave Streamflow Signals for Improving Flood Forecasting: A First Study in Cubango River Basin, Africa. IEEE J. Sel. Top. Appl. Earth Obs. Remote Sens. 2013, 6, 2375–2390. [Google Scholar] [CrossRef]
  33. D’Andrimont, R.; Defourny, P. Monitoring African water bodies from twice-daily MODIS observation. Gisci. Remote Sens. 2017, 55, 130–153. [Google Scholar]
  34. Zaji, A.; Bonakdari, H.; Gharabaghi, B. Remote Sensing Satellite Data Preparation for Simulating and Forecasting River Discharge. IEEE Trans. Geosci. Remote Sens. 2018, 56, 3432–3441. [Google Scholar] [CrossRef]
  35. Shi, Z.; Huang, C. Evaluation of Discharge Estimation Using Global Flood Detection System. In Proceedings of the 2018 7th International Conference on Agro-geoinformatics (Agro-geoinformatics), Hangzhou, China, 6–9 August 2018; pp. 1–4. [Google Scholar] [CrossRef]
  36. Revilla-Romero, B.; Thielen, J.; Salamon, P.; De Groeve, T.; Brakenridge, G.R. Evaluation of the satellite-based Global Flood Detection System for measuring river discharge: Influence of local factors. Hydrol. Earth Syst. Sci. 2014, 18, 4467–4484. [Google Scholar] [CrossRef]
  37. Hirpa, F.A.; Hopson, T.M.; De Groeve, T.; Brakenridge, G.R.; Gebremichael, M.; Restrepo, P.J. Upstream satellite remote sensing for river discharge forecasting: Application to major rivers in South Asia. Remote Sens. Environ. 2013, 131, 140–151. [Google Scholar] [CrossRef]
  38. Syvitski, J.P.M.; Brakenridge, G.R. Causation and avoidance of catastrophic flooding along the Indus River, Pakistan. GSA Today 2013, 23, 4–10. [Google Scholar] [CrossRef]
  39. Brakenridge, G.R.; Syvitski, J.P.M.; Niebuhr, E.; Overeem, I.; Higgins, S.A.; Kettner, A.J.; Prades, L. Design with Nature: Causation and avoidance of catastrophic floods in Myanmar. Earth-Sci. Rev. 2016, 165, 81–109. [Google Scholar] [CrossRef]
  40. Brakenridge, G.R. Flood risk mapping from orbital remote sensing. In Global Flood Hazard: Applications in Modeling, Mapping and Forecasting; AGU Monograph Series; Schumann, G.J., Bates, P.D., Apel, H., Aronica, G.T., Eds.; John Wiley & Sons: Hoboken, NJ, USA, 2018; pp. 43–54. [Google Scholar]
  41. De Groeve, T.; Brakenridge, G.R.; Paris, S. Global Flood Detection System Data Product Specifications. JRC Technical Report. 2015. Available online: http://www.gdacs.org/flooddetection/Download/Technical_Note_GFDS_Data_Products_v1.pdf (accessed on 6 February 2019).
  42. Revilla-Romero, B.; Wanders, N.; Burek, P.; Salamon, P.; de Roo, A. Integrating remotely sensed surface water extent into continental scale hydrology. J. Hydrol. 2016, 543, 659–670. [Google Scholar] [CrossRef] [Green Version]
  43. Van Dijk, A.I.J.M.; Brakenridge, G.R.; Kettner, A.J.; Beck, J.E.; De Groeve, T. River gauging at global scale using optical and passive microwave remote sensing. Water Resour. Res. 2016, 52, 6404–6418. [Google Scholar] [CrossRef]
  44. Mertes, L.A.K.; Daniel, D.L.; Melack, J.M.; Nelson, B.; Martinelli, L.A.; Forsberg, B.R. Spatial patterns of hydrology, geomorphology, and vegetation on the floodplain of the Amazon river in Brazil from a remote sensing perspective. Geomorphology 1995, 13, 215–232. [Google Scholar] [CrossRef]
  45. Munier, S.; Carrer, D.; Planque, C.; Camacho, F.; Albergel, C.; Calvet, J. Satellite Leaf Area Index: Global Scale Analysis of the Tendencies Per Vegetation Type over the Last 17 Years. Remote Sens. 2018, 10, 424. [Google Scholar] [CrossRef]
  46. Kerr, Y.H.; Waldteufel, P.; Wigneron, J.; Delwart, S.; Cabot, F.; Boutin, J.; Escorihuela, M.; Font, J.; Reul, N.; Gruhier, C.; et al. The SMOS Mission: New Tool for Monitoring Key Elements of the Global Water Cycle. Proc. IEEE 2010, 98, 666–687. [Google Scholar] [CrossRef]
  47. Van der Schalie, R.; Kerr, Y.; Wigneron, J.-P.; Rodríguez-Fernández, N.J.; Al-Yaari, A.; de Jeu, R. Global SMOS Soil Moisture Retrievals from The Land Parameter Retrieval Mode. Int. J. Appl. Earth Obs. Geoinf. 2016, 45, 125–134. [Google Scholar] [CrossRef]
  48. Boutin, J.; Martin, N.; Kolodziejczyk, N.; Reverdin, G. Interannual anomalies of SMOS sea surface salinity. Remote Sens. Environ. 2016, 180, 128–136. [Google Scholar] [CrossRef]
  49. Vittucci, C.; Guerriero, L.; Ferrazzoli, P.; Rahmoune, R.; Barraza, V.; Grings, F. River Water Level Prediction Using Passive Microwave Signatures—A Case Study: The Bermejo Basin. IEEE J. Sel. Top. Appl. Earth Obs. Remote Sens. 2014, 7, 3903–3914. [Google Scholar] [CrossRef]
  50. Parrens, M.; Al Bitar, A.; Frappart, F.; Papa, F.; Calmant, S.; Crétaux, J.-F.; Wigneron, J.-P.; Kerr, Y. Mapping Dynamic Water Fraction under the Tropical Rain Forests of the Amazonian Basin from SMOS Brightness Temperatures. Water 2017, 9, 350. [Google Scholar] [CrossRef]
  51. Jacquette, E.; Al Bitar, A.; Mialon, A.; Kerr, Y.; Quesney, A.; Cabot, F.; Richaume, P. SMOS CATDS level 3 global products over land. Proc. SPIE 2010, 7824. [Google Scholar] [CrossRef]
  52. Al Bitar, A.; Mialon, A.; Kerr, Y.H.; Cabot, F.; Richaume, P.; Jacquette, E.; Quesney, A.; Mahmoodi, A.; Tarot, S.; Parrens, M.; et al. The global SMOS Level 3 daily soil moisture and brightness temperature maps. Earth Syst. Sci. Data 2017, 9, 293–315. [Google Scholar] [CrossRef] [Green Version]
  53. Quesney, A.; Berthon, L. Function to convert lat/lon to row/col on the EASE grid (EASE 2.0). Available online: http://www.cesbio.ups-tlse.fr/SMOS_blog/?page_id=749 (accessed on 6 February 2019).
  54. De Groeve, T.; Brakenridge, R.G.; Paris, S. Global Flood Detection System: Data Product Specifications, Technical Report, European Commission. Joint Research Centre, 2015, JRC97421. Available online: https://ec.europa.eu/jrc (accessed on 6 February 2019).
  55. Kendall, M.G.; Stuart, A.; Ord, J.K. The Advanced Theory of Statistics, Vol. 3: Design and Analysis, and Time-Series, 4th ed.; Macmillan: London, UK, 1983. [Google Scholar]
  56. Nghiem, S.V.; Zuffada, C.; Shah, R.; Chew, C.; Lowe, S.T.; Mannucci, A.J.; Cardellach, E.; Brakenridge, G.R.; Geller, G.; Rosenqvist, A. Wetland Dynamics Monitoring with Global Navigation Satellite System Reflectometry. Earth Space Sci. 2017, 4, 16–39. [Google Scholar] [CrossRef]
  57. Nash, J.E.; Sutcliffe, J.V. River flow forecasting through conceptual models part I—A discussion of principles. J. Hydrol. 1970, 10, 282–290. [Google Scholar] [CrossRef]
  58. Nghiem, S.V.; Wardlow, D.B.; Allured, D.; Svoboda, M.D.; LeComte, D.; Rosencrans, M.; Chan, K.S.; Neumann, G. Microwave Remote Sensing of Soil Moisture—Science and Applications. In Remote Sensing of Drought—Innovative Monitoring Approaches; Drought and Water Crises Book Series; CRC Press, Taylor and Francis: Boca Raton, FL, USA, 2012; Chapter 9, Part III; pp. 197–226. ISBN 978-1-4398-3557-9. [Google Scholar]
  59. Piedade, M.T.; Junk, W.; Agra D’Ângelo, S.; Wittmann, F.; Schöngart, J.; Mara Do Nascimento Barbosa, K.; Lopes, A. Aquatic herbaceous plants of the Amazon floodplains: State of the art and research needed. Acta Limnol. Bras. 2010, 22, 165–178. [Google Scholar] [CrossRef]
  60. Juhász, A. Managing temporal data in military historical GIS. In Proceedings of the 31th Symposium of the European Association of Remote Sensing Laboratories, Prague, Czech Republic, 30 May–2 June 2011; pp. 43–53. [Google Scholar]
  61. De Groeve, T. Flood monitoring and mapping using passive microwave remote sensing in Namibia. Geomat. Nat. Hazards Risk 2010, 1, 19–35. [Google Scholar] [CrossRef] [Green Version]
Figure 1. Map of Global Food Detection Systems (GFDS) satellite gauging locations using passive microwave satellite data.
Remotesensing 11 00835 g001
Figure 2. Location of analyzed SMOS-satellite gauging observations in the Orinoco and the Amazon basins are shown on the left figure. Upper right figure shows the monthly average precipitation for the Amazon River at Parintins, Brazil (near Site ID 1109), and lower right figure shows the monthly average precipitation for the Orinoco River at Puerto Carreno, Colombia (near Site ID 1076) source: allmetsat.com.
Remotesensing 11 00835 g002
Figure 3. Filtering of raw SMOS gauging observation time series on the Congo River. The median filter appeared to perform best for hygrograph smoothing.
Remotesensing 11 00835 g003
Figure 4. SMOS based river gauging time series of the Tb(m) and Tb(c) pixel at the town Parintins, Amazon River, Brazil (Site ID 1109). The series show a strong seasonal variation of the wet signal and a relatively constant value of the dry signal not influenced by water coverage.
Remotesensing 11 00835 g004
Figure 5. SMOS based time series of C/M satellite gauging signal at the town Parintins, Amazon River, Brazil (Site ID 1109). C/M signal is in proportional monotonic relationship with water level variations. Low C/M values (~1.2) refer to low river flow conditions, while high values (~1.5) indicate high flow conditions.
Remotesensing 11 00835 g005
Figure 6. SMOS based river time series of C/M river gauging signal near the town Requena, along the Ucayali River, Peru (Site ID 1095). Slight variation of the high flow periods arises from the regional differences in the rainy season in the Amazon catchment. GFDS Ka-band gauging time series show higher noise and less dynamic range than those of L-band SMOS satellite gauging. The figure illustrates the more robust response of the SMOS data to river discharge changes.
Remotesensing 11 00835 g006
Figure 7. Performance of SMOS gauging signal downstream from Puerto Carenno (Colombia) along the Orinoco River in Colombia (Site ID 1076). The site presents a strong response to water extent changes in time.
Remotesensing 11 00835 g007
Figure 8. Strong seasonal periodicity is found in Central African tropical region from SMOS gauging data at Site ID 1492, Congo River near Lucolela upstream Brazzaville. Lower left graph shows Tb(m) and Tb(c) pixel time series, upper left graph illustrates derived C/M signal. Upper right graph shows the difference between the signal from L-band SMOS and GFDS Ka-band data. Lower right graph shows monthly averaged precipitation measured nearby (source: allmetsat).
Remotesensing 11 00835 g008
Figure 9. Comparison between SMOS and GFDS data series from Advanced Microwave Scanning Radiometer—Earth Observing System (AMSR-E) (January 2010–September 2011) and Tropical Rainfall Measuring Mission (TRMM) (September 2011–March 2013) and AMSR2 (from September 2013 to present) sensors. Upper satellite hydrograph is observed on the Amazon River near Tefe, and lower hydrograph is obtained along the Orinoco River near Ciudad Bolivar.
Remotesensing 11 00835 g009aRemotesensing 11 00835 g009b
Figure 10. Comparison between SMOS based time series in the Amazon Basin. Upper figure shows upstream water extent variations of Site ID 152 on the Amazon River near Tefe. Lower figure shows downstream Site ID 153 on the Amazon River near the town Itaquariara. Low C/M signal values filtered with smoothing spline method in the downstream case reveals that inundation stays longer on the floodplain after precipitation declines.
Remotesensing 11 00835 g010aRemotesensing 11 00835 g010b
Figure 11. Comparison of SMOS and in-situ stage data for the Amazon River upstream Parintins (Site ID 1109) during 2010–2018.
Remotesensing 11 00835 g011
Figure 12. Scatter plot of SMOS and in-situ stage water level dataset on the Amazon River upstream Parintins (Site ID 1109) during 2010–2018. Correlation coefficient r = 0.97, NSE = 0.94 reveals high correlation.
Remotesensing 11 00835 g012
Figure 13. Comparison between GFDS and in-situ stage data on the Amazon River upstream Parintins (Site ID 1109) during 2010–2018. Correlation coefficient is r = 0.82, NSE = 0.63.
Remotesensing 11 00835 g013
Figure 14. Comparison between Jason-2 altimetry water levels and in-situ stage on the Amazon River upstream Parintins (Site ID 1109) during 2010–2018. Correlation coefficient is r = 0.82, NSE = 0.64.
Remotesensing 11 00835 g014
Figure 15. Comparison between SMOS, GFDS satellite based gauging, Jason-2 altimetry, and in-situ stage on the Amazon River upstream Parintins (Site ID 1109) during 2010–2018.
Remotesensing 11 00835 g015
Figure 16. Bar chart map of correlation coefficient r of three different satellite-based gauging measures (SMOS, AMSR2, altimetry) compared to in-situ stage at the studied tropical river locations. Correlation r values are added over/below the bars with corresponding colors (red, blue, green).
Remotesensing 11 00835 g016
Table 1. Data sources of validation procedure of different measurements and temporal coverage.
SourceSensorMeasurementTemporal Coverage
CATDSSMOSwater extent2010/01–2018/12
GFDSTRMMwater extent2011/09–2013/03
AMSR-E2010/01–2011/09
AMSR2 2013/04–2018/12
SO HybamRiver Stagewater level2010/01–2018/12 inconstant for different stations
SO Hybam AltimetryJason 2, Jason 3water level2010/01–2018/12 inconstant for different stations
Table 2. Correlation coefficient r between different satellite sensors and in-situ stage measurements averaged over the three tropical river basins with calculated standard deviations.
SMOSAMSR2Altimetry
River basinave.std.ave.std.ave.std.
Amazon0.920.040.690.120.910.07
Orinoco0.920.010.610.29
Congo0.800.010.360.08
Table 3. Nash–Sutcliffe model efficiency coefficient (NSE) between different satellite sensors and in-situ stage data averaged over the three studied tropical river basins with calculated standard deviations.
SMOSAMSR2Altimetry
River basinave.std.ave.std.ave.std.
Amazon0.840.08−1.481.280.770.14
Orinoco0.830.01−2.230.59
Congo0.380.33−1.790.05