Abstract
In past research, the problem of maritime targets detection and motion parameter estimation has been tackled. This new research aims to contribute by estimating the micro-motion of ships while they are anchored in port or stationed at the roadstead for logistic operations. The problem of motion detection of targets is solved using along-track interferometry (ATI) which is observed using two radars spatially distanced by a baseline extended in the azimuth direction. In the case of spaceborne missions, the performing of ATI requests using at least two real-time SAR observations spatially distanced by an along-track baseline. For spotlight spaceborne SAR re-synthesizing two ATI observations from one raw data is a problem because the received electromagnetic bursts are not oversampled for onboard memory space saving and data appears like a white random process. This problem makes appearing interlaced Doppler bands completely disjointed. This phenomenon, after the range-Doppler focusing process, causes decorrelation when considering the ATI interferometric phase information retransmitted by distributed targets. Only small and very coherent targets located within the same radar resolution cell are considered. This paper is proposing a new approach where the micro-motion estimation of ships, occupying thousands of pixels, is measured processing the information given by sub-pixel tracking generated during the coregistration process of two re-synthesized time-domain and partially overlapped sub-apertures generated splitting the raw data observed by a single wide Doppler band staring spotlight (ST) SAR map. The inclination of ships is calculated by low-rank plus sparse decomposition and Radon transform of some region of interest. Experiments are performed processing one set of COSMO-SkyMed ST SAR data.
1. Introduction
Synthetic aperture radar (SAR) is highly indicated for maritime surveillance because targets are very visible with respect to the background. This effect is due to the fact that ships are made of metallic materials while the sea, although formed by non-penetrating water, reflects away and out from the receiver line of sight (LOS) most of the transmitted electromagnetic energy. Relevant works in the field of staring-spotlight (ST) SAR focusing, maritime surveillance and ship detection, motion and micro-motion estimation and sub-pixel Offset Tracking (sPOT) are now reviewed.
1.1. Introduction to Staring-Spotlight SAR Acquisition Modes
Spotlight modes in SAR are characterized by an azimuth steering that points the antenna pattern to a rotation center. ST is the classical spotlight mode with steering to a rotation center within the observed scene. For a determined steering angle span, which is the equivalent of a fixed acquisition length, ST provides the best azimuth resolution. Research [1] showed that spotlight-mode SAR can be interpreted as a tomographic reconstruction problem and focused using the projection-slice theorem from computer-aided tomography (CAT). This paradigm has been extended in [2] where a new three-dimensional tomographic formulation of SAR spotlight mode has been developed. The paper reported in [3] investigated the possibility to enhance the TerraSAR-X (TSX) azimuth resolution by means of ST imaging in combination with an extended azimuth pattern steering. Authors reviewed also the current TSX spotlight modes and the actual physical steering limitations. The paper presented some experimental TSX ST high-resolution images demonstrating and verifying the envisaged performance estimation. The benefits of ST acquisitions has been applied in [4] exploiting some long orbital SAR observations of a single TSX ST to derive absolute heights. The work analyzed the slight azimuth defocusing effect due to height mismatch between the true height and the height assumed in SAR focusing for single image absolute height retrieval of very coherent points. The authors found that measurement accuracy depended on incidence angle, orbit type, and mainly on the signal-to-clutter ratio. In [5] the authors described the potential and limitations of repeat-pass synthetic aperture radar interferometry (InSAR) in order to retrieve the biophysical parameters of intensively managed pastures using series of eight acquisitions from the TSX ST mode.
1.2. Introduction to Maritime Surveillance and Ship Detection
In [6], an automatic ship and ship wake detection system for spaceborne SAR has been assessed. The system, designed for coastal regions surveillance, used the European remote sensing satellite system (ERS-SAR-1) images getting excellent results in term of detection capabilities. In [7] authors processed the COSMO-SkyMed (CSK) data which provides high-resolution images with reasonably short revisiting time, allowing efficient maritime surveillance. Moving targets indicator (MTI) imaging represents a challenge for SAR systems as the complex target motions produce evident image defocusing. In [8], authors combined the advantages offered by the bistatic configuration and the use of the micro-Doppler signature given by radars in order to characterize the Doppler signature of targets. In past research, compressed sensing (CS) combined to matrix completion for low-rank plus sparse decomposition (LRSD) was applied in [9] also to separate the paths generated by any kind of targets in motion from the SAR coherent change detection (CCD) background (in the image and RT domains), useful for anti-immigration. The results showed excellent separation of the terrain paths from the background, permitting the successful application of the Radon transform (RT) and the automatic estimation of the paths parameters like its consistency and inclination. Another application of the LRSD algorithm was developed in [10] demonstrating that the filtered InSAR phase stacks can improve the accuracy of geophysical parameters estimated via conventional multipass InSAR techniques, e.g., persistent scatterers interferometry (PSI).
1.3. Introduction to Micro-Motion
In [11] A detector based on the generalized likelihood ratio test (GLRT) was proposed to detect such targets using SAR raw signals instead of SAR imagery. The author used algorithms described in [12,13,14]. The performance showed favorable detection ability under low signal-to-noise/clutter ratios. In [15] an improved micro-motion jamming method was proposed where theoretical analyses and simulation results verified the validity of the proposed method. In [16] the vibration signal modeling was deduced and the micro-motion signature of vibrating target was estimated, based on the short-term shift-orthogonal waveform in multiple-input-multiple-output (MIMO) SAR The results demonstrated the potential of MIMO-SAR for 3D micro-motion estimation. Once the micro-motion of ships was estimated, the research described also a single-stage LRSD algorithm implemented by convex programming (CP) [17] for the precise estimation of their inclination on the range-azimuth plane, respect to the azimuth direction. The procedure consisted of segmenting the complex SAR velocity maps into specific regions of interest (MTI-ROIs) in which the micro-motion of ships is previously estimated. Series of RT MTI-ROIs (RT-MTI-ROIs) showed also in the pattern the inclination of ships. In most cases, residual clutter can be still present in the RT-MTI-ROIs and could be difficult to extrapolate the principal components of the Radon map. To overcome this problem, the LRSD algorithm was also applied to the RT-MTI-ROIs results, making it easier to observe only the principal components of the RT-MTI-ROIs (SC-RT-MTI-ROIs). This method was successfully applied in [18] where a complete procedure for the automatic estimation of maritime target motion parameters by evaluating the generated Kelvin waves detected in SAR images has been proposed. The robust principal component analysis (RPCA) and RT applied to SAR surveillance permitted fast detection and enhanced motion parameter estimation of maritime targets.
1.4. Introduction to Sub-Pixel-Tracking
Image alignment is a crucial step for InSAR. Interferogram formation requires images to be coregistered with an accuracy of better than a few tenths of a resolution cell to avoid significant loss of phase coherence. In conventional interferometric precise coregistration methods for full-resolution SAR data, a 2-D polynomial of low degree is usually chosen as warp function, and the polynomial parameters are estimated through least squares fit from the shifts measured on image windows [19]. The sPOT technique has previously been applied to monitor glacier movements, volcanic activities and co-seismic tears in the solid earth resulting from severe earthquakes to address the technical defects and limitations of conventional differential interferometric SAR (DInSAR) techniques, particularly their sparse coverage and the impact of dense vegetative cover [20]. In the past, studies on offset tracking techniques to measure slope movements were dominated by using optically sensed imagery from spaceborne or airborne platforms. For low-resolution SAR sensors, offset tracking is used for measuring very large deformation (meters to tens of meters) [21,22,23].
1.5. Organization of the Paper
In this paper, the author is proposing for the first time a method for estimating the motion parameters of ships stationing in port or at sea but still at the anchor using sPOT. The applications of this technique will be very important for civilian naval engineering and military applications. The information which the present paper is estimating is very important and can be exploited by machine learning systems like deep-learning, in order to design robust algorithms having strong ship recognition capabilities using SAR. The inclination of ships is calculated using the RT assisted by LRSD in order to detect the principal components of the RT. The proposed algorithm gives excellent results in terms of ship detection, motion and micro-motion estimation including the ship inclination estimation. The author used the information generated by the sub-pixel shifts estimated by processing very fine coregistration of two-time domain sub-apertures of a single CSK ST SAR image. The author found the proposed sPOT facility reaching more powerful results because the algorithm is able to estimate velocities in all directions compared to the ATI technique which allows the velocity estimation only along the LOS direction. For the experimental results author used SAR data observed from only one sensor transmitting a large Doppler band in the ST acquisition geometry. The received wide-band data was divided into two sub-bands, designed having different time centers. The multi-temporal sub-apertures are SAR images, one to each other, differently, time delayed. This multi-temporal delay phenomenon was used to estimate a precise MTI map of anchored maritime targets. Details of the signal processing techniques are described in the methodology Section 2, constituted by the paragraphs concerning the sPOT and LRSD algorithms presentation and the solution of the LRSD problem. The last paragraph shows all about the Radon transform. The experimental results are estimated processing staring-spotlight of the COSMO-SkyMed satellite system reporting detailed results in Section 3. The computational scheme used for estimating all results is described in the Section 4. The paper considered three study cases where details are reported over the Section 5, Section 6 and Section 7.
2. Methodology
2.1. Sub-Pixel Offset Tracking Algorithm Presentation
sPOT is a relevant technique to measure large-scale ground displacements in both range and azimuth directions. The technique is complementary to differential interferometric SAR (DInSAR) and persistent scatterers interferometry (PSInSAR) when the radar phase information is unstable. In this work, the author estimates the offset fields which are generated with a normalized cross-correlation of image patches of detected real-valued SAR intensity images. The successful estimation of a reliable two-dimensional local image offsets field depends on the presence of nearly identical features in the multi-temporal SAR images stack under test. This technique is based principally on the maximization of the normalized cross-correlation existing between two couples of registered SAR intensity image patches. In order to give an operative start-up of this sPOT estimation, the author used the software SARPROZ [24,25] developed by Prof. D. Perissin in order to process the temporal SAR sub-apertures. The accuracy of this sPOT method depends on the coregistration settings parameters and the topographic relief. For this work, the author set the cross-correlation window size at pixels and the oversampling factor at 64 in both the range and azimuth directions. All the coregistration parameters are reported in Table 1. The offset components of the sub-pixel normalized cross-correlation, according to [19] is described by the complex parameter which is estimated by the following equation:

Table 1.
Coregistrator parameters summary.
In Equation (1) the parameter is the offset component generated by the earth displacement, the parameter is the offset component generated by the earth displacement when located on highly sloped terrain, the parameter is the offset caused by residual errors of the satellite orbits, The parameter is the offset component generated by general attitude and control errors of the flying satellite trajectory. The last two parameters and are the contributions generated by the electromagnetic aberrations due to atmosphere parameters space and time variations and general disturbances due to thermal and quantization noise. The atmospheric time-variation during the very short time interval of this SAR image acquisition has little influence on the temporal component of the last displacement parameters because of its low accuracy. All errors are compensated choosing only high energy and stable points and subtracting the initial offsets in order to retrieve the shifts contributions only generated by the target displacement.
2.2. LRSD Model Presentation
In this section the autor is presenting the LRSD SP method described in [26] which was previously applied in the SAR field in [9,18]. A SAR sensor, after performing range-azimuth focusing and after having processed the motion compensation computational stage, the result is a picture consisting of a matrix . In this specific case of this study, the ROI is constituted by the RT and so the matrix and it is decomposed in the following low-rank component (LRC) and sparse component (SC):
In Equation (2) is a low-rank matrix and is a sparse matrix. The LRC low-dimensional columns and its row-space are unknown. The SC number, locations and the magnitudes of its non-zero elements are unknown. Considering one real RT-ROI image patch, it is of great interest to identify activities that stand out from the background. This image can be considered as a two-dimensional matrix in the range-azimuth dimensions. The LRSD generates the , low-dimensional component which easily corresponds to the stationary background. The SC is a perturbation generated by the sparse objects which appears like sprites over the background. Given a complex SAR image, having and range azimuth dimensions, for both I, Q components, the following convex optimization problem is considered:
Algorithm Equation (3) is also called principal component pursuit (PCP) where in Equation (3), the parameter balances the contribution of the -norm term. The parameter is the nuclear norm of the matrix defined as the sum of its singular values. The parameter is the -norm of , defined as the vector in To implement an efficient algorithm that effectuates the LRSD of the unique matrix, it is necessary to suppose that the matrix is non-sparse and incoherent with the standard base. In each row and column the sparse matrix should not contain a great number of non-zero elements [26,27].
2.3. Solution of the LRSD Problem
The solution to the main problem can be summarized in the first instance considering the following singular value decomposition (SVD) formula [9,26,27]:
In Equation (4), the parameter r is the rank of the matrix , the parameters are the singular values and the matrices and are the left and right singular vectors. The problem (3) is ill-posed and the author is proposing a convex optimization solution. The application of LRSD will produce the matrix which represents the back-scattered image and the matrix. The matrix represents the pixel variation that occurs from column to column. The author defines the following incoherent condition, having parameter :
In Equation (5) the -norm parameter term is a long vector and the parameters and are the orthogonal projections and in the U and V column spaces respectively. For small values of the parameter , the singular vectors are not sparse. A typical value of the parameter is . A non negligible problem emerges when the SC is also the LR and the algorithm presents difficulty in defining sparsity or incoherence. This condition will occur if all the non-zero entries of are located in a few columns. To avoid these indetermination issues, the algorithm will assume that the sparsity pattern is uniformly and randomly selected. However, where the matrix has dimensionality, obeying (4), and its SCs has a support set uniformly distributed along all cardinal sets, a constant parameter c exists, such that, with probability , the PCP separation algorithm will exactly recover and with . It is also assumed that
In Equation (6), the parameters and , are positive numerical constants. In case of a rectangular matrix, where the dimensionality of is , the algorithm provides exact recovery for [26,27].
2.4. Localized Radon Transform
The RT over the two-dimensional Euclidean space is defined as:
In Equation (7) the function is the RT of the two-dimensional function which is defined on the plane D. The function is the Dirac delta function, the parameter is the radius coordinate of a straight line (usually is the image diagonal) and the parameter is the angle coordinate of the same straight line respect to the axis. The RT has the characteristic to accentuate all the linear futures existing on an image along all possible lines [28].
3. Experimental Results
The results are based on three study cases in which the ROI consists of a series of SAR patches representing ships which are anchored at the roadstead for logistic operations. The resolution of the staring spotlight product which has been used is approximately equal to 0.7 m in the range and in the azimuth directions. Considering that the author is refocusing Doppler sub-apertures which are partially overlapped in the azimuth direction, the new degraded resolution is approximately equal to 1 m in the azimuth direction and 0.7 m in the range direction. Figure 1 is the geometry of the SAR acquisition which lasted approximately 11 s along with an orbital length of approximately 82,533 m. This wide-band Doppler ST observation was divided into two temporal epochs where the SAR image was range-compressed using the entire chirp band and designing an azimuth-filter matching only the first time portion which was approximately 7 s wide. The slave was compressed in the same configuration of the master (which is symmetrical with respect to the full azimuth-band zero-Doppler raw data) but using the last 7 s of orbital time in the opposite squinted zero-Doppler angle. The images were focused following the theory described in [1] in a squinted zero-Doppler configuration. The temporal baseline existing between master and slave images is equal to 3.5 s. During this period the satellite has orbited along 29,533 m. This such wide spatial baseline, unfortunately, reaches the so-called critical baseline for which the ATI interferometric coherence undergoes a drastically decrease. This is not the unique problem, for spotlight spaceborne SAR when re-synthesizing two ATI observations from one raw data, the global loss information is dramatically high. This phenomenon occurs because the received electromagnetic bursts are not oversampled. This procedure is not respected for onboard memory space saving and in most of the cases, raw data appears to be like a white random process. This problem makes appearing any Doppler sub-aperture completely disjointed. This statistical unwanted phenomenon causes decorrelation when considering the ATI interferometric phase information given by distributed targets. It could be taken into consideration only small and very coherent targets located within the same radar range-azimuth resolution cell. In order to clarify this concept the author is proposing in Figure 2a a time domain white random process and in Figure 2b a portion of the CSK raw data having the same length of the simulated random process. Observing Figure 2 is possible to appreciate that the CSK raw data is very similar to the simulated white random process. Figure 3a,b shows a particular of the simulated random process (visible in Figure 3a) versus the CSK raw data (visible in Figure 3b) where it is possible to observe the random nature of the CSK result with respect to the simulated white random process. The functions are grabbed from the slow-time span located inside the black box visible in Figure 2a,b). The average values of both spectrum depicted in Figure 2 are showed in Figure 4a for the simulated white random process and in Figure 4b for the CSK results which are very similar. These set of results demonstrates that observing ATI interferograms of two Doppler sub-apertures, also is they are overlapped, the phase information will decorrelate with high probability on targets extended in more than one resolution cell.
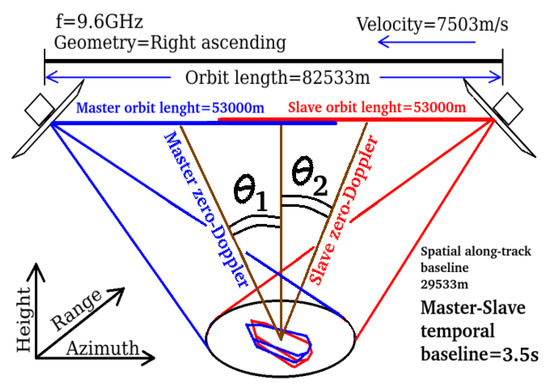
Figure 1.
SAR acquisition geometry.
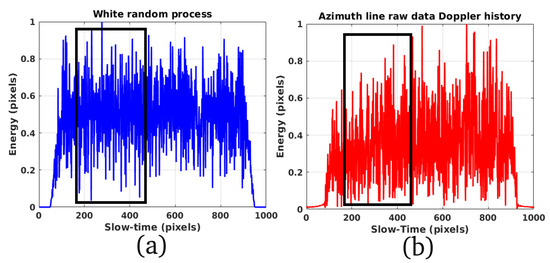
Figure 2.
(a): White random process. (b): CSK raw data of a Doppler line.
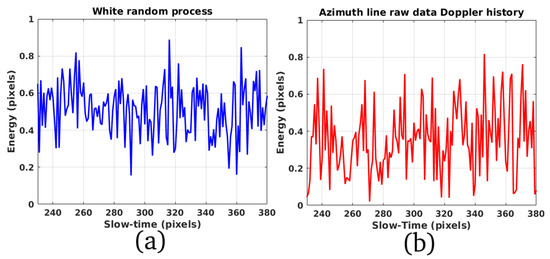
Figure 3.
(a): Particular of the white random process. (b): CSK raw data of a raw Doppler line.
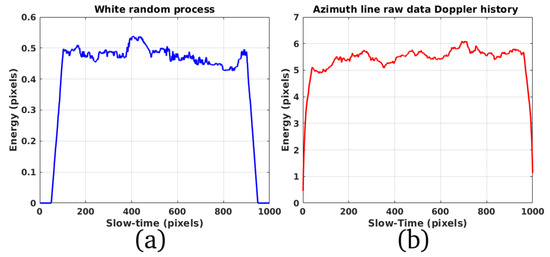
Figure 4.
(a): Spectrum of the white random process. (b): spectrum of the CSK raw Doppler line.
The characteristics of the ST acquisition are reported in the following Table 2:

Table 2.
SAR acquisition characteristics summary.
4. Computational Scheme Description
Figure 5 shows the computational scheme used to estimate velocities and inclination of ships. The general data flow begins from the computational stage number one which is considered the principal data-input. The outputs are a collection of the motion parameters of targets constituting the physical features extraction (computational stages number 11 and 16). A single raw ST SAR data is divided into two Doppler sub-apertures by computational blocks number 2 and 3, according to the geometry scheme showed in Figure 1. Computational blocks number 4 and 5 are designed to perform the master and slave SAR focusing and multi-temporal raw data sub-aperture synthesis. The master and slave sub-apertures SAR raw data, according to Figure 1, are focused respect two opposite and squinted zero-Doppler angles, given by the parameters and [1]. Computational block number 7 performs the sub-pixel coregistration process. This processing stage is piloted by setting the sPOT parameters which are contained by the block number 6. In order to perform all the experiments reported in this paper, the coregistration parameters of the software SARPROZ [24] were optimized according to data edited in Table 2. The accuracy of this computational process is very high because the images which are being coregistrated are synthesized from a single acquisition orbit. According to Equation (1), all the errors due to the classical multi-temporal geometry are nulled. This process gives the opportunity to estimate the sub-pixel shifts occurred on each range-azimuth resolution cell which has been nominated as the best candidate according to an optimum pixel-searching strategy based on the master-slave reflectivity magnitude stability. The coregistration process designed in block 7 reported in Figure 5 used the algorithms described in [19] and estimates two different sub-pixel shifts: the first component is extended in the range direction (samples) and the second component is extended in the azimuth direction (lines). The sub-pixel shifts estimated in both the range direction and the azimuth direction will constitute two different images having the same dimensionality of the focused SAR image but constituting the real and the imaginary components of the micro-motion velocities respectively. This complex velocity field is saved into the computational block number 10 which has the task of extracting the ROIs and estimating the motion features (computational stages number 11 and 12). The RT process is performed by the computational stage number 13 and the LRSD process of the RT is performed by the computational stage number 14. The ship inclination estimator is performed by the processor-block number 15, the inclination is estimated applying a GLRT and finally the physical features are extracted by the last computational block number 16. The experimental results proposed in this paper are consisting of three study cases. The first one is the motion and inclination estimation of a large ship and the second one is consisting of a smaller ship motion analysis. Both vessels are anchored in the low-level sea and near the harbor. The experimental results of this paper demonstrate the feasibility to estimate the micro-motion of ships but are not validated to any other alternative measurement method based on differential global positioning system (D-GPS) due to construction difficulties and excessive costs.
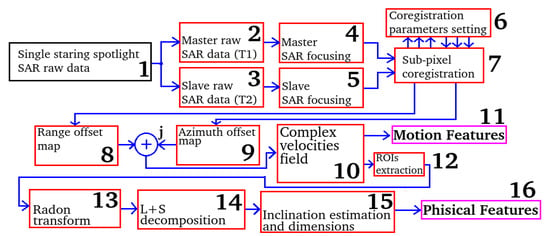
Figure 5.
Computational scheme for features extraction.
5. Study-Case Number One Results and Discussion
Figure 6a is the magnitude of the SLC ROI observing the ship and consisting in the study case number one. Figure 7a,b are the magnitude and phase of the infra-chromatic coherence. The author is proposing these results to demonstrate that the phase information for this type of SAR acquisition is useful because of the not oversampled characteristic characterizing the CSK raw data. Figure 8a,b are the magnitude and phase information of the complex velocity field held by the ship observed by Figure 6a. Figure 6b is the first study case average displacement estimated along the keel line of the vessel. The red line is the estimated displacement magnitude and the blue line is representing the displacement phase. Figure 9a,b depicts the RT-MTI-ROIs and the SC-RT-MTI-ROIs respectively. Data are estimated from the complex velocity field. Most of the principal components constituting the estimated features are contained inside the red circles depicted in both the figures. It is possible to view an enlargement of these parameters by analyzing what is present inside the red boxes number 1 and 2. Features of the SC-RT-MTI-ROIs result are better separated with respect to the normal RT result. Figure 10a,b represents the particulars reported inside the red boxes number 1 and 2 depicted in Figure 9a,b. Figure 10a represents the RT of the displacement ROI and Figure 10b is the sparse component RT of the same displacement ROI. The reflectivity profiles are estimated along the red arrows depicted in the pictures which are reported in Figure 11a,b. The blue plot represents the energy profile estimated without applying the LRSD algorithm and the red function is the reflectivity profile estimated applying the LRSD method. Deeper signal to noise ratio of the LRSD RT result allows more precise detection of the target orientation angles. Figure 11b is the receiver operating characteristic curve (ROC) of the orientation angle detection system where the blue plot represents the energy profile without applying the LRSD algorithm and the red function is the reflectivity profile estimated applying the LRSD method. The red function exhibits lower false-alarm and increasing detection probability for a given alarm energy-threshold. Figure 12a,b represents the particulars reported inside the red boxes number 4 and 3 respectively depicted in Figure 9a,b. Figure 12a is the displacement RT ROI and Figure 12b is the sparse component RT of the same displacement ROI. The reflectivity profiles are estimated along the red arrows depicted in the pictures are reported in Figure 12a,b. The blue plot represents the energy profile without applying the LRSD algorithm and the red function is the reflectivity profile estimated applying the LRSD method. Also, in this case, a deeper signal to noise ratio of the LRSD RT result allows a more precise detection of the target orientation angles. Figure 13b is the ROC of the orientation angle detection system where the blue plot represents the energy profile without applying the LRSD algorithm and the red function is the reflectivity profile estimated applying the LRSD method. The red function exhibits lower false-alarm and increasing detection probability for a given alarm energy threshold. Figure 14 shows the displacement field performed by the target between the temporal baseline. The estimated maximum value in magnitude is approximately equal to 1.5 cm and the minimum value is approximately equal to half a millimeter. The maximum displacement values in magnitude are present on the bow and on the stern parts which are present in the opposite direction. Minimum displacement values are estimated at about half a millimeter, forces are present at the center part of the ship. The ST temporal displacement designed for this study was set at approximately 3.5 s. The maximum velocity in magnitude is so equal to cm/s and the minimum velocity in magnitude is equal to mm/s. Figure 6b represents some average values estimated along a keel line of the boat. The red line is the estimated displacement in magnitude and the red line represents the phase of the displacement.
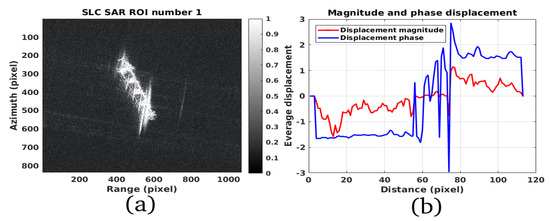
Figure 6.
(a): SLC ROI. (b): Magnitude and phase displacement profile.
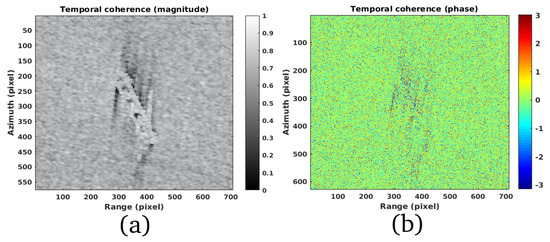
Figure 7.
(a): Infra-chromatic coherence ROI (magnitude). (b): Infra-chromatic coherence ROI (phase).
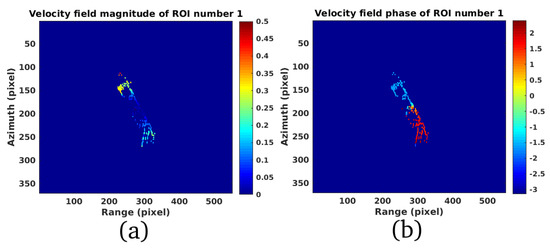
Figure 8.
(a): Magnitude of the range-azimuth displacement. (b): Phase of the range-azimuth displacement.
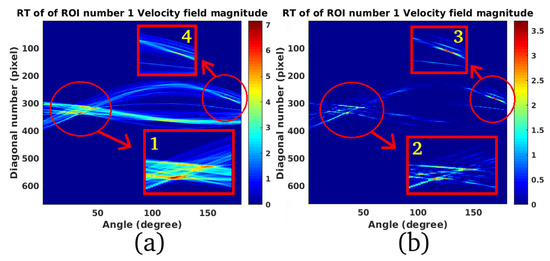
Figure 9.
(a): RT of the displacement ROI. (b): Sparse component of the RT of the displacement ROI.
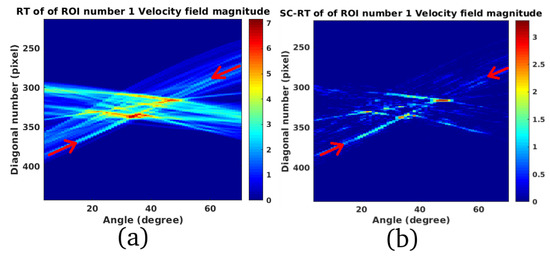
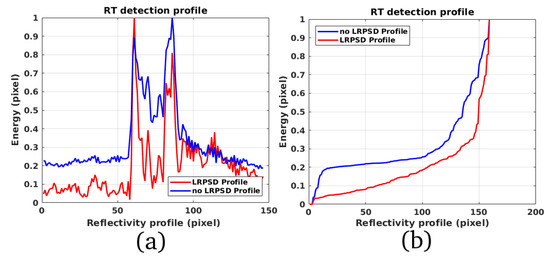
Figure 11.
(a): Reflectivity profiles. (b): Receiving operating characteristic (ROC) curve.
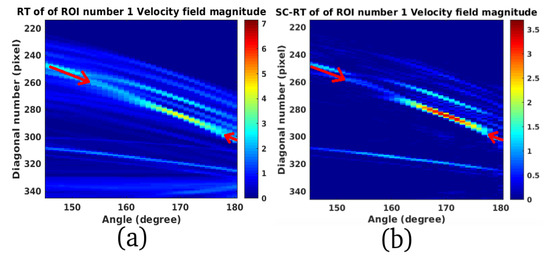
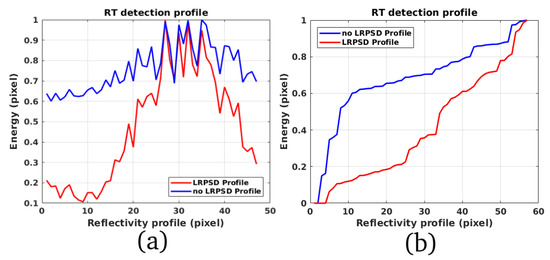
Figure 13.
(a): Reflectivity profiles. (b): Receiving operating characteristic (ROC) curve.
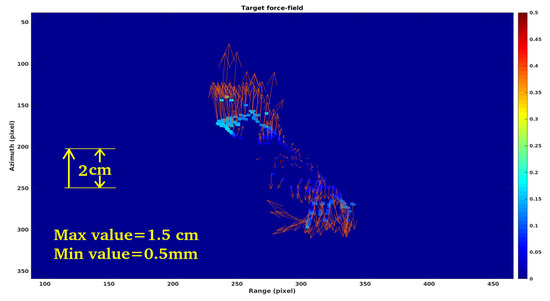
Figure 14.
Complex velocity field.
6. Study-Case Number Two Results
Figure 15a is the magnitude of the SLC ROI of the ship consisting in the study case number two. Figure 15b and Figure 16a are the magnitude and phase of the complex velocity field held by the ship depicted in Figure 15a. Figure 17a,b represents the RT-MTI-ROIs and the SC-RT-MTI-ROIs respectively, estimated from the complex velocity field. Most of the principal components constituting the estimated features are contained inside two red circles depicted in the figures. Considering this second case of study it is also possible to view an enlargement of the motion parameters by analyzing the principal components of data which is present inside the red boxes number 1 and 2. Features of the SC-RT-MTI-ROIs result are better separated (red box number 4) with respect to the normal RT-MTI-ROIs result (red box number 1). A principal component is detected in the SC-RT-MTI-ROIs result which details are plotted inside the red box number 3. The same area is plotted inside the red box number 2 which represents the RT-MTI-ROIs result and where the feature is not detected. Figure 18a,b represents the particulars reported inside the red boxes number 4 and 3 respectively depicted in Figure 17a,b. Figure 18a represents the RT of the displacement ROI and Figure 18b is the sparse component RT of the same displacement ROI. The reflectivity profiles are estimated along the red arrows depicted in the pictures are reported in Figure 19a,b and depicted in Figure 19a. The blue plot represents the energy profile without applying the LRSD algorithm and the red function is the reflectivity profile estimated applying the LRSD method. Deeper signal to noise ratio of the LRSD RT result allows more precise detection of the target orientation angles. Figure 19b is the receiver operating characteristic curve (ROC) of the orientation angle detection system where the blue plot represents the energy profile without applying the LRSD algorithm and the red function is the reflectivity profile estimated applying the LRSD method. The red function exhibits lower false-alarm and increasing detection probability for a given alarm energy threshold. Figure 20a,b represents the particulars reported inside the red boxes number 4 and 3 respectively depicted in Figure 17a,b. Figure 12a is the displacement RT ROI and Figure 20b is the sparse component RT of the same displacement ROI. The reflectivity profiles are estimated along the red arrows depicted in the pictures are reported in Figure 20a,b and depicted in Figure 21a. The blue plot represents the energy profile without applying the LRSD algorithm and the red function is the reflectivity profile estimated applying the LRSD method. Also, in this case, a deeper signal to noise ratio of the LRSD RT result allows a more precise detection of the target orientation angles. Figure 21b is the ROC of the orientation angle detection system where the blue plot represents the energy profile without applying the LRSD algorithm and the red function is the reflectivity profile estimated applying the LRSD method. The red function exhibits lower false-alarm and increasing detection probability for a given alarm energy threshold. Figure 22 shows the displacement field performed by the target between the temporal baseline set to 3.5 s. The estimated maximum value in magnitude is approximately equal to 1.2 cm and also for this second study case, the minimum value is approximately equal to half a millimeter. The maximum displacements in magnitude also, in this case, are present on the bow and on the stern parts which are present in a different direction. Minimum displacements are estimated at about half a millimeter, forces are present at the center part of the ship. The maximum velocity in magnitude is so equal to cm/s and the minimum velocity in magnitude is equal to mm/s. Figure 16b represents the second study case average values estimated along the keel line of the boat. The red line is the estimated displacement in magnitude and the blue line represents the phase of the displacement. The last Figure 23a,b represents the estimated inclination angles with respect to the north of both the ships referring the study case number one and two respectively. The author reported in Figure 23a the precise estimation of the keel inclination which was approximate of 30 and another principal component inclination of the boat stern which was estimated at 170. For study case number two, the author reported in Figure 23b the precise inclination of the keel estimating approximately 32 and the inclination of the boat stern which was estimated at 98.
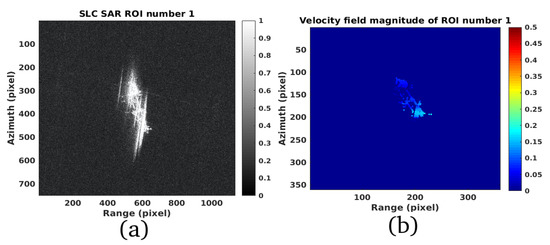
Figure 15.
(a): Magnitude of the SLC ROI. (b): ROI velocity field (magnitude).
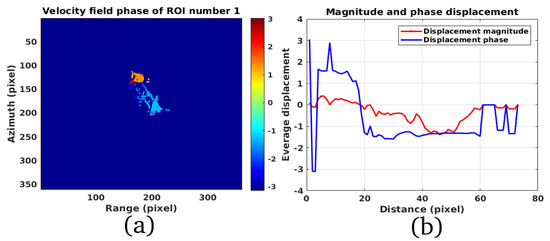
Figure 16.
(a): Phase component of the range-azimuth displacement. (b): Magnitude and phase displacement profile.
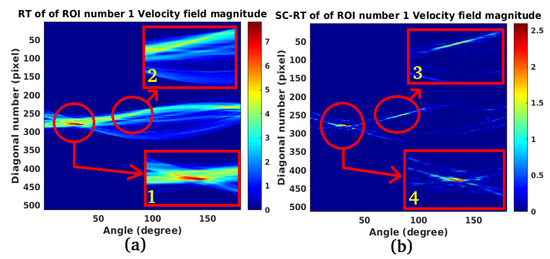
Figure 17.
(a): RT of the displacement ROI. (b): Sparse component of the RT of the displacement ROI.
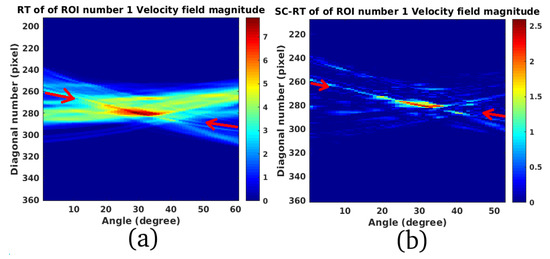
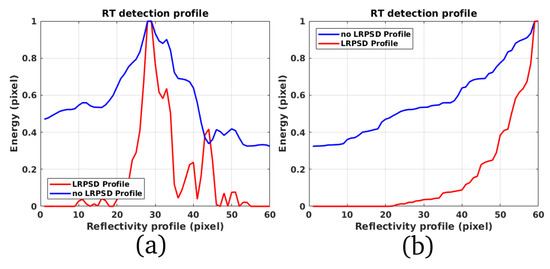
Figure 19.
(a): Reflectivity profiles. (b): Receiving operating characteristic (ROC) curve.
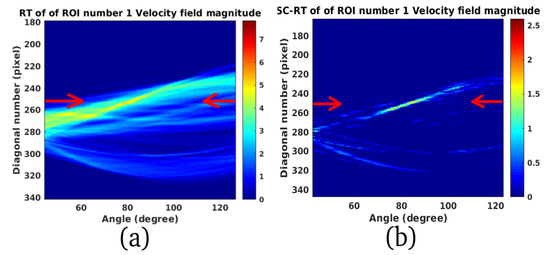
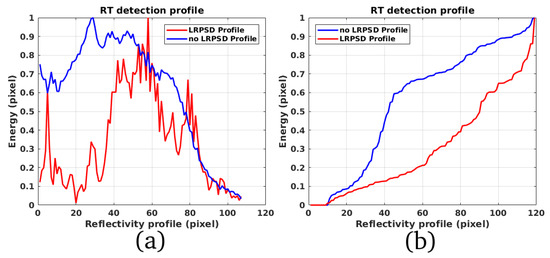
Figure 21.
(a): Reflectivity profiles. (b): Receiving operating characteristic (ROC) curve.
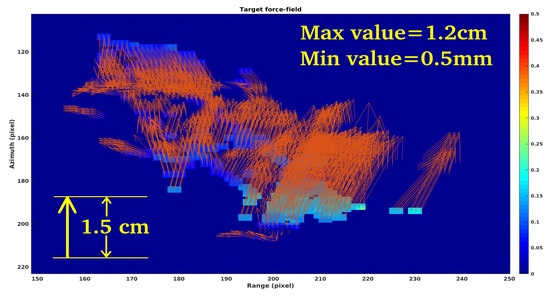
Figure 22.
Complex velocity field.
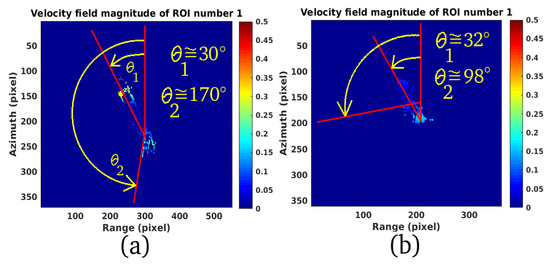
Figure 23.
(a): Study case number 1 target angles estimation. (b):Study case number 2 target angles estimation.
7. Study-Case Number Three for Side-Lobes Suppression Performance
In this section, the author is proposing the performance of the micro-motion estimation algorithm of ships versus the side-lobes suppression capabilities. The study is performed considering a set of one large maritime target and a second ship which is smaller with respect to the first one. Figure 24a,b shows the magnitude of the SLC SAR ROI of a large and a smaller ship respectively where heavy side-lobes are detected due to the target motion existing during the staring spotlight SAR acquisition. Figure 25a,b shows the displacement magnitude and phase of the large ship respectively and Figure 26a,b represents the displacement magnitude and phase of the small ship respectively. These pictures are confirming that the coregistration computational stage 7 depicted in Figure 5 performs also an efficient side-lobes suppression. In order to obtain these results, the coregistration parameters settings contained into the computational box number 6 of Figure 5 are compliant to the data reported in Table 1 where the efficient side-lobe suppression performance is reached setting the coregistration sparse point selection strategy to “local-maximum”. According to this strategy, the system will select only the main backscattering point sources avoiding all other side-lobes retransmissions.
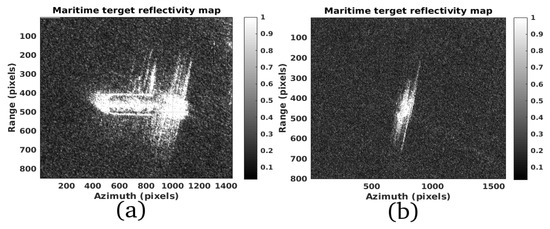
Figure 24.
(a): Large ship SAR image. (b): Small ship SAR image.
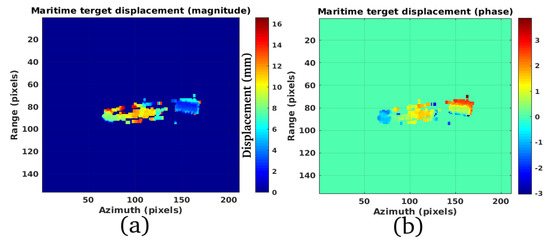
Figure 25.
(a): Large ship displacement map (magnitude). (b): Large ship displacement map (phase).
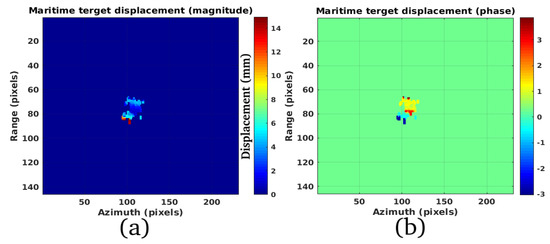
Figure 26.
(a): Small ship displacement map (magnitude). (b): Small ship displacement map (phase).
8. Conclusions
This research aimed to contribute in estimating the micro-motion of ships which are anchored in port or ships stationed at the roadstead for logistic operations. The problem of motion detection of targets was solved using along-track interferometry (ATI) which is observed using two radars spatially distanced by a baseline extended in the azimuth direction. In the case of space-borne missions, the performing of ATI requests the use of at least two real-time SAR observations spatially distanced by an along-track spatial baseline. This paper proposed a new approach where the micro-motion estimation of ships, occupying thousands of pixels, is estimated processing the information given by sPOT generated by the coregistration process of two re-synthesized SAR images from two time-domain partially overlapped sub-apertures. The inclination of ships was calculated by low-rank plus sparse decomposition and RT of some ROI. Experiments used one COSMO-SkyMed ST SAR data. Results showed that the proposed sPOT approach mixed to LRSD and RT are suitable methods for estimating precise physical and micro-motion of ships.
9. Materials and Methods
In this section, will be described the all materials used and the methods which has been applied and useful for replicating the experiments. The author used a laptop configured with a core i7 and 16 GB RAM. The author used the software SARPROZ: https://www.sarproz.com/. This software has a too, that is able to estimate the coregistration shifts. The author used also MATLAB, using his own codes to generate the Doppler sub-apertures.
Funding
This research received no external funding.
Acknowledgments
I thank Emmanuel J. Candés for providing the L + S decomposition Matlab scripts, and Danilo Orlando for comments that greatly improved the manuscript and for providing detection algorithms.
Conflicts of Interest
The author declare no conflict of interest. The author whose names is listed immediately below the tittle certify that they have NO affiliations with or involvement in any organization or entity with any financial interest (such as honoraria; educational grants; participation in speakers’ bureaus; membership, employment, consultancies, stock ownership, or other equity interest; and expert testimony or patent-licensing arrangements), or non-financial interest (such as personal or professional relationships, affiliations, knowledge or beliefs) in the subject matter or materials discussed in this manuscript. No founders are involved during the designation and the life of this projects.
Abbreviations
The following abbreviations are used in this manuscript:
| SS | Staring Spotlight |
| ROI | Region of Interest |
| MTI | Moving Target Indicator |
| LRSD | Low-Rank plus Sparse Decomposition |
| RT | Radon transform |
| MIMO | Multiple Input Multiple Output |
| sPOT | Pixel Offset Tracking |
| GLRT | Generalized Likelihood Ratio Test |
| LOS | Line of Sight |
| ERS | European remote sensing satellite system |
| CSK | COSMO-SkyMed |
| ATI | Along-Track-Interferometry |
| SAR | Synthetic Aperture Radar |
| InSAR | Interferometric SAR |
| PSInSAR | Persistent Scatterers Interferometric SAR |
References
- Munson, D.C.; O’brien, J.D.; Jenkins, W.K. A tomographic formulation of spotlight-mode synthetic aperture radar. Proc. IEEE 1983, 71, 917–925. [Google Scholar] [CrossRef]
- Jakowatz, C.V.; Thompson, P. A new look at spotlight mode synthetic aperture radar as tomography: Imaging 3-D targets. IEEE Trans. Image Process. 1995, 4, 699–703. [Google Scholar] [CrossRef]
- Mittermayer, J.; Wollstadt, S.; Prats-Iraola, P.; Scheiber, R. The TerraSAR-X staring spotlight mode concept. IEEE Trans. Geosci. Remote Sens. 2014, 52, 3695–3706. [Google Scholar] [CrossRef]
- Duque, S.; Breit, H.; Balss, U.; Parizzi, A. Absolute height estimation using a single TerraSAR-X staring spotlight acquisition. IEEE Geosci. Remote Sens. Lett. 2015, 12, 1735–1739. [Google Scholar] [CrossRef]
- Ali, I.; Barrett, B.; Cawkwell, F.; Green, S.; Dwyer, E.; Neumann, M. Application of Repeat-Pass TerraSAR-X Staring Spotlight Interferometric Coherence to Monitor Pasture Biophysical Parameters: Limitations and Sensitivity Analysis. IEEE J. Sel. Top. Appl. Earth Obs. Remote Sens. 2017, 10, 3225–3231. [Google Scholar] [CrossRef]
- Eldhuset, K. An automatic ship and ship wake detection system for spaceborne SAR images in coastal regions. IEEE Trans. Geosci. Remote Sens. 1996, 34, 1010–1019. [Google Scholar] [CrossRef]
- Martorella, M.; Pastina, D.; Berizzi, F.; Lombardo, P. Spaceborne radar imaging of maritime moving targets with the Cosmo-SkyMed SAR system. IEEE J. Sel. Top. Appl. Earth Obs. Remote Sens. 2014, 7, 2797–2810. [Google Scholar] [CrossRef]
- Clemente, C.; Soraghan, J.J. Vibrating target micro-Doppler signature in bistatic SAR with a fixed receiver. IEEE Trans. Geosci. Remote Sens. 2012, 50, 3219–3227. [Google Scholar] [CrossRef]
- Biondi, F. Low-rank plus sparse decomposition and localized radon transform for ship-wake detection in synthetic aperture radar images. IEEE Geosci. Remote Sens. Lett. 2018, 15, 117–121. [Google Scholar] [CrossRef]
- Kang, J.; Wang, Y.; Schmitt, M.; Zhu, X.X. Object-Based Multipass InSAR via Robust Low-Rank Tensor Decomposition. IEEE Trans. Geosci. Remote Sens. 2018, 56, 3062–3077. [Google Scholar] [CrossRef]
- Deng, B.; Wang, H.Q.; Li, X.; Qin, Y.L.; Wang, J.T. Generalised likelihood ratio test detector for micro motion targets in synthetic aperture radar raw signals. IET Radar Sonar Navig. 2011, 5, 528–535. [Google Scholar] [CrossRef]
- Conte, E.; Ricci, G. Sensitivity study of GLRT detection in compound-Gaussian clutter. IEEE Trans. Aerosp. Electron. Syst. 1998, 34, 308–316. [Google Scholar] [CrossRef]
- Bandiera, F.; Besson, O.; Orlando, D.; Ricci, G.; Scharf, L.L. GLRT-based direction detectors in homogeneous noise and subspace interference. IEEE Trans. Signal Process. 2007, 55, 2386–2394. [Google Scholar] [CrossRef]
- De Maio, A.; Orlando, D.; Pallotta, L.; Clemente, C. A multifamily GLRT for oil spill detection. IEEE Trans. Geosci. Remote Sens. 2017, 55, 63–79. [Google Scholar] [CrossRef]
- Zhao, G.; Fu, Y.; Nie, L.; Zhuang, Z. Imaging and micro-Doppler analysis of vibrating target in multi-input–multi-output synthetic aperture radar. IET Radar Sonar Navig. 2015, 9, 1360–1365. [Google Scholar] [CrossRef]
- Xu, L.; Feng, D.; Wang, X. Improved synthetic aperture radar micro-Doppler jamming method based on phase-switched screen. IET Radar Sonar Navig. 2016, 10, 525–534. [Google Scholar] [CrossRef]
- Bouwmans, T.; Zahzah, E.H. Robust PCA via principal component pursuit: A review for a comparative evaluation in video surveillance. Comp. Vis. Image Underst. 2014, 122, 22–34. [Google Scholar] [CrossRef]
- Biondi, F. Low rank plus sparse decomposition of synthetic aperture radar data for maritime surveillance. In Proceedings of the 2016 4th International Workshop on Compressed Sensing Theory and Its Applications to Radar, Sonar and Remote Sensing (CoSeRa), Aachen, Germany, 19–22 September 2016; pp. 75–79. [Google Scholar]
- Nitti, D.O.; Hanssen, R.F.; Refice, A.; Bovenga, F.; Nutricato, R. Impact of DEM-assisted coregistration on high-resolution SAR interferometry. IEEE Trans. Geosci. Remote Sens. 2011, 49, 1127–1143. [Google Scholar] [CrossRef]
- Michel, R.; Avouac, J.P.; Taboury, J. Measuring ground displacements from SAR amplitude images: Application to the Landers earthquake. Geophys. Res. Lett. 1999, 26, 875–878. [Google Scholar] [CrossRef]
- Strozzi, T.; Luckman, A.; Murray, T.; Wegmuller, U.; Werner, C.L. Glacier motion estimation using SAR offset-tracking procedures. IEEE Trans. Geosci. Remote Sens. 2002, 40, 2384–2391. [Google Scholar] [CrossRef]
- Casu, F.; Manconi, A.; Pepe, A.; Lanari, R. Deformation time-series generation in areas characterized by large displacement dynamics: The SAR amplitude pixel-offset SBAS technique. IEEE Trans. Geosci. Remote Sens. 2011, 49, 2752–2763. [Google Scholar] [CrossRef]
- Casu, F.; Manconi, A. Four-dimensional surface evolution of active rifting from spaceborne SAR data. Geosphere 2016, 12, 697–705. [Google Scholar] [CrossRef]
- Wang, Z.; Perissin, D.; Lin, H. Subway tunnels identification through Cosmo-SkyMed PSInSAR analysis in Shanghai. In Proceedings of the 2011 IEEE International Geoscience and Remote Sensing Symposium (IGARSS), Vancouver, BC, Canada, 24–29 July 2011; pp. 1267–1270. [Google Scholar]
- Perissin, D.; Wang, T. Repeat-pass SAR interferometry with partially coherent targets. IEEE Trans. Geosci. Remote Sens. 2012, 50, 271–280. [Google Scholar] [CrossRef]
- Candes, E.J.; Plan, Y. Tight Oracle Inequalities for Low-Rank Matrix Recovery. IEEE Trans. Inf. Theory 2011, 57, 2342–2359. [Google Scholar] [CrossRef]
- Otazo, R.; Candès, E.; Sodickson, D.K. Low-rank plus sparse matrix decomposition for accelerated dynamic MRI with separation of background and dynamic components. Magn. Reson. Med. 2015, 73, 1125–1136. [Google Scholar] [CrossRef] [PubMed]
- Rey, M.T.; Tunaley, J.K.; Folinsbee, J.T.; Jahans, P.A.; Dixon, J.A.; Vant, M.R. Application of Radon transform techniques to wake detection in Seasat-A SAR images. IEEE Trans. Geosci. Remote Sens. 1990, 28, 553–560. [Google Scholar] [CrossRef]
© 2019 by the author. Licensee MDPI, Basel, Switzerland. This article is an open access article distributed under the terms and conditions of the Creative Commons Attribution (CC BY) license (http://creativecommons.org/licenses/by/4.0/).