1. Introduction
Earth’s climate is determined by the Earth Radiation Budget (ERB). For a climate in equilibrium the gain of energy from Absorbed Solar Radiation (ASR) is in balance with the loss of energy through Outgoing Longwave Radiation (OLR). Any perturbation of this radiative energy balance at the Top of Earth’s Atmosphere (TOA) is known as a radiative forcing, and is a driver of climate change [
1]. Compared to the pre-industrial period, the increase of Greenhouse Gasses (GHG) primarily CO
2 but also e.g., NH
4 reduces the OLR; this represents a positive (heating) radiative forcing [
2]. This positive GHG radiative forcing is partially compensated by a negative (cooling) radiative forcing of aerosols, which increase the amount of Reflected Solar Radiation (RSR) and hence decrease the ASR [
3]. Variations of the incoming solar radiation also create a radiative forcing [
4].
For understanding current and past climate change, and for increasing the confidence with which future climate change can be predicted, the analysis of long term changes of the ERB is essential. The measurement of the ERB from space has a long history [
5], but the availability of long term homogeneous ERB Climate Data Records (CDR’s) is relatively recent.
In this paper we analyse the long term variation of the RSR and its role in the complete ERB. We use the broadband scanner measurements from the Clouds and the Earth’s Radiant Energy System (CERES) [
6] instruments. We use the CERES EBAF Ed4.0 following [
7] from 2000 to 2018. In
Section 2 we describe the main features of the RSR. In
Section 3 we analyse the regional changes of the RSR over the period 2000–2018. In
Section 4 we analyse the stability of the CERES RSR measurements. In
Section 5 we analyse the link between variations of the RSR and the Sea Ice Extent (SIE) in the polar regions. In
Section 6 we analyse the decadal variation of the Total Outgoing Radiation (TOR) and the Earth Energy Imbalance (EEI) over the period 2000–2018, and we compare with the Ocean Heat Content Time Derivative (OHCTD) for the period 1960–2015. In
Section 7 we discuss our results.
2. Reflected Solar Radiation
The earth surface and the constituents of the earth’s atmosphere reflect a part of the incoming solar radiation. The RSR is defined as the reflected radiation that is radiated back to space at the TOA.
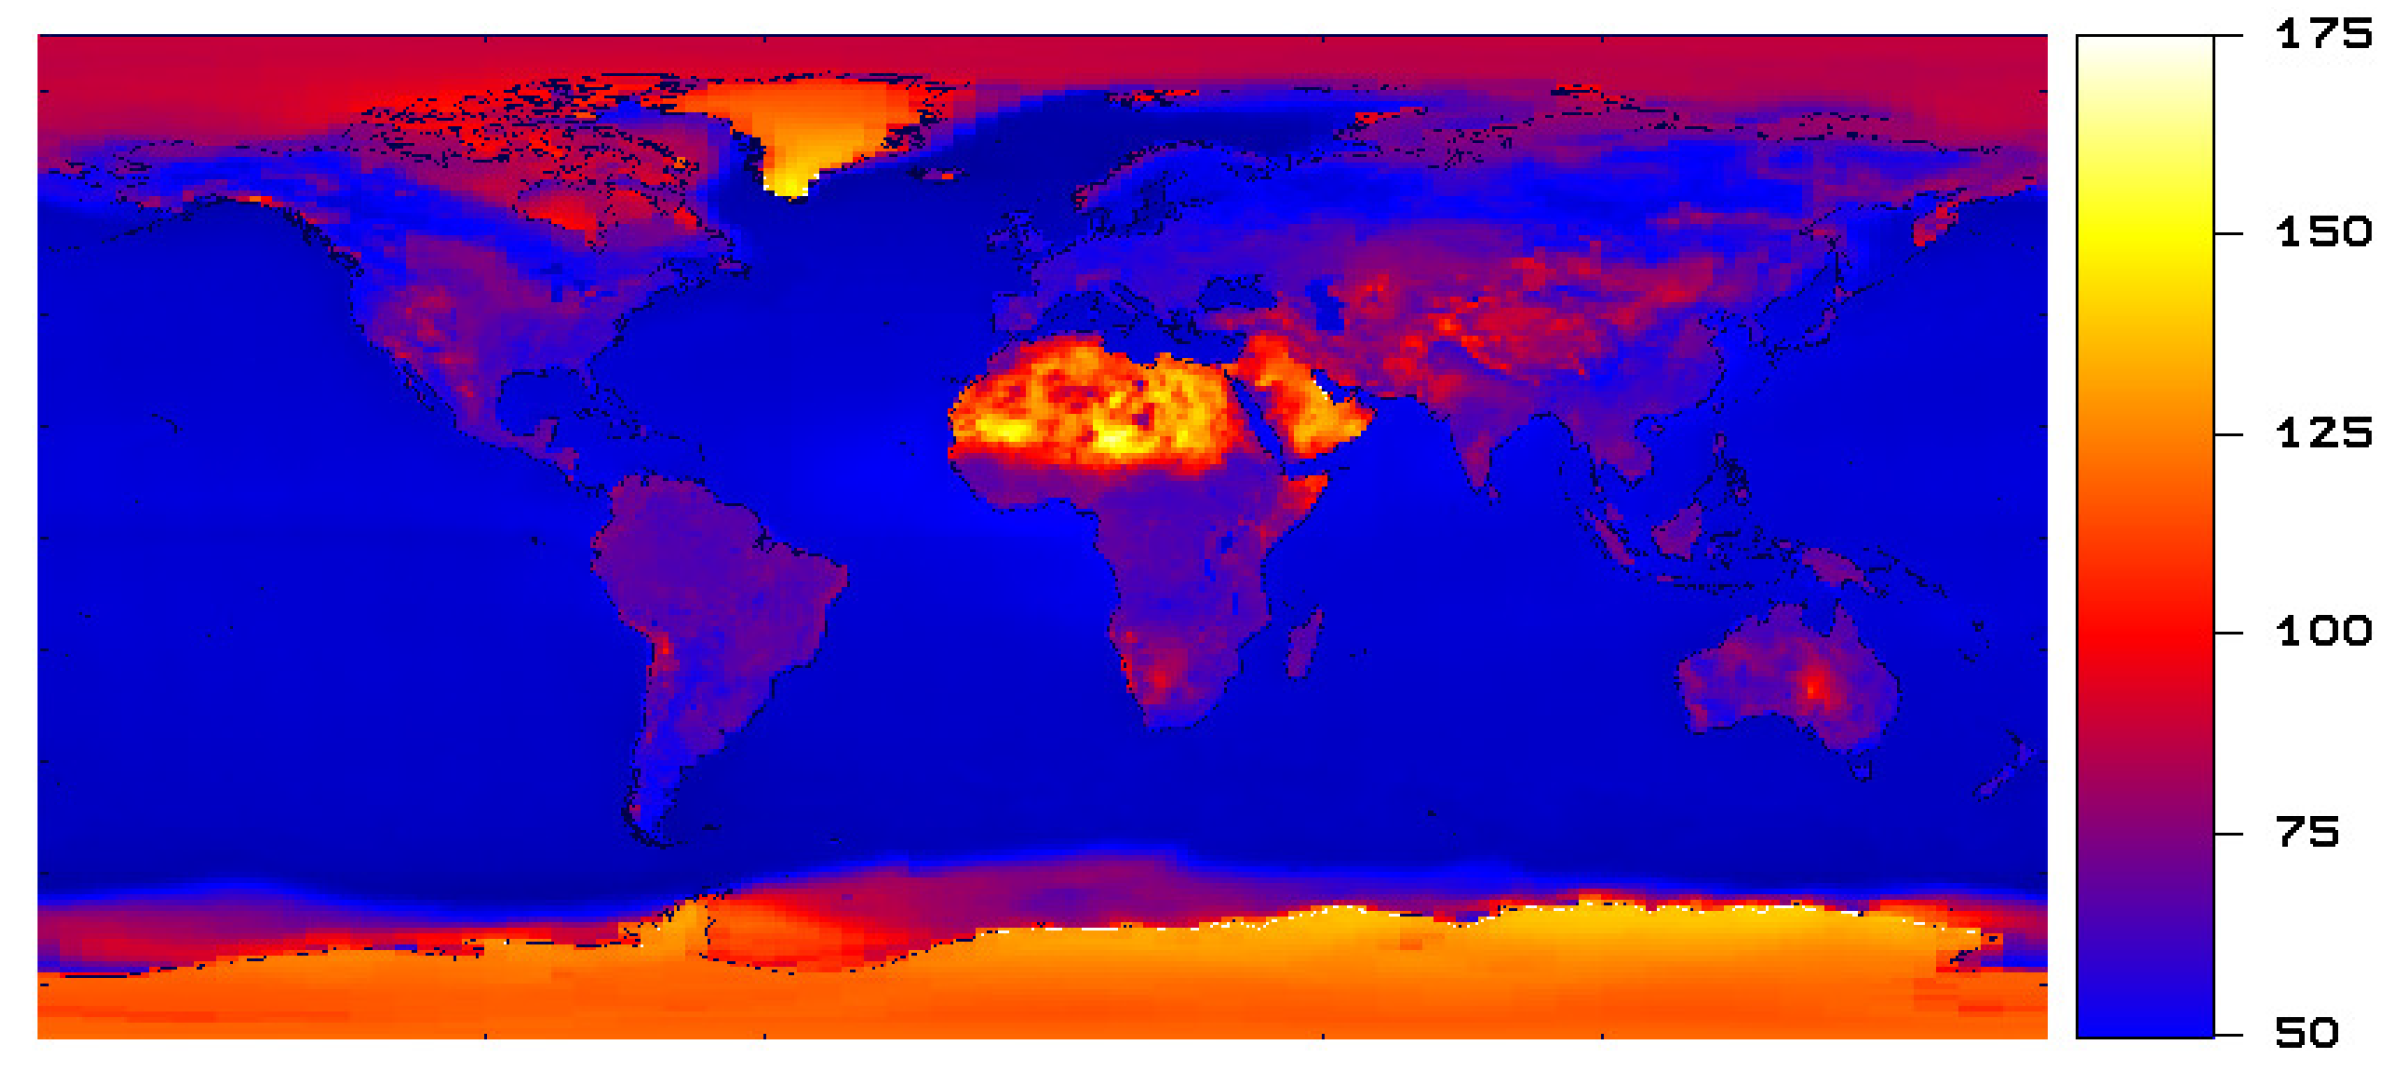
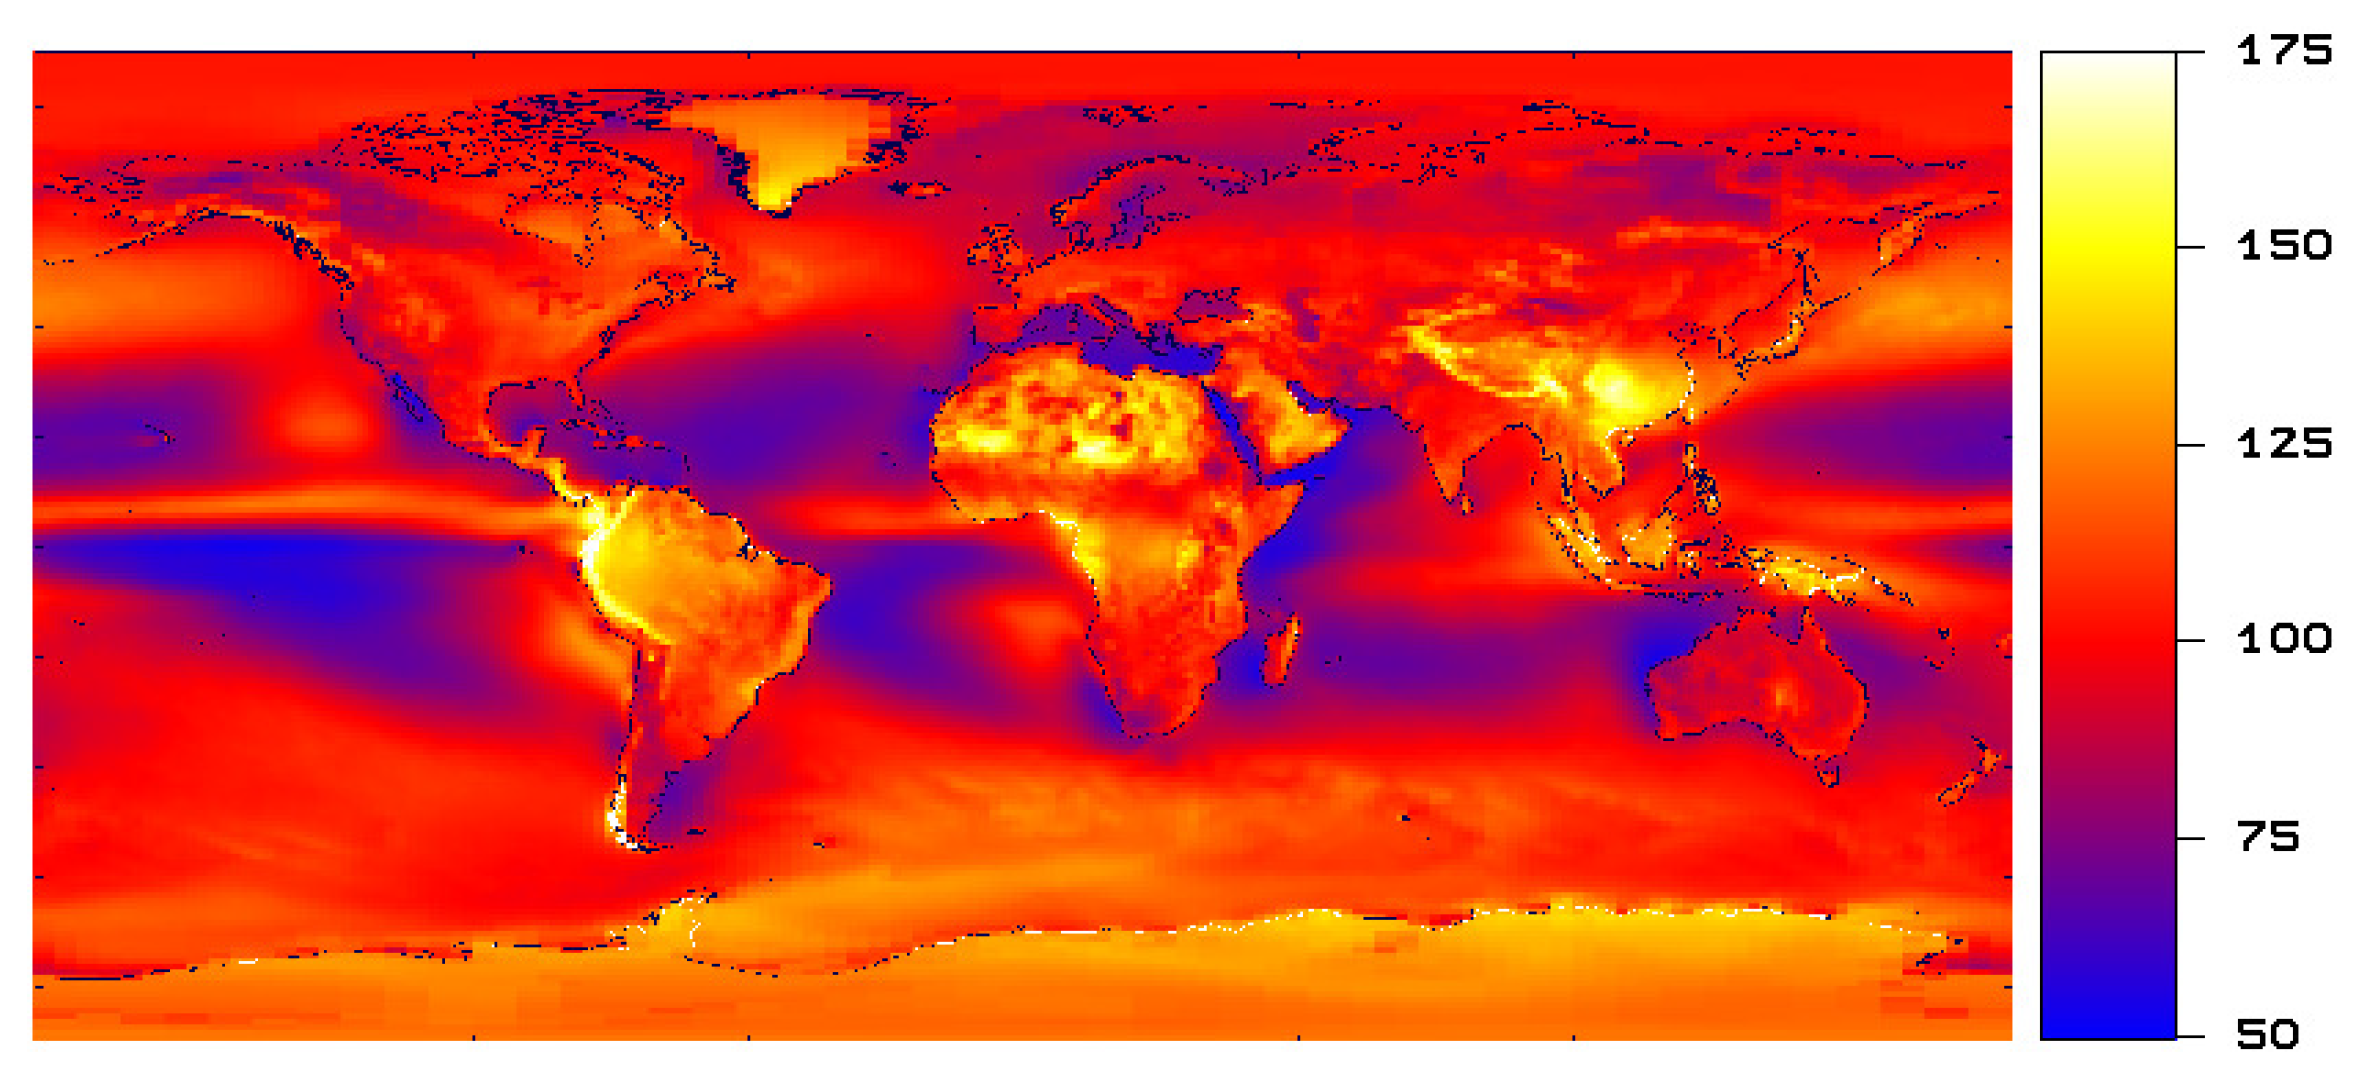
Figure 1 shows the 18 year CERES mean ’all-sky’ RSR from 2000 to 2018.
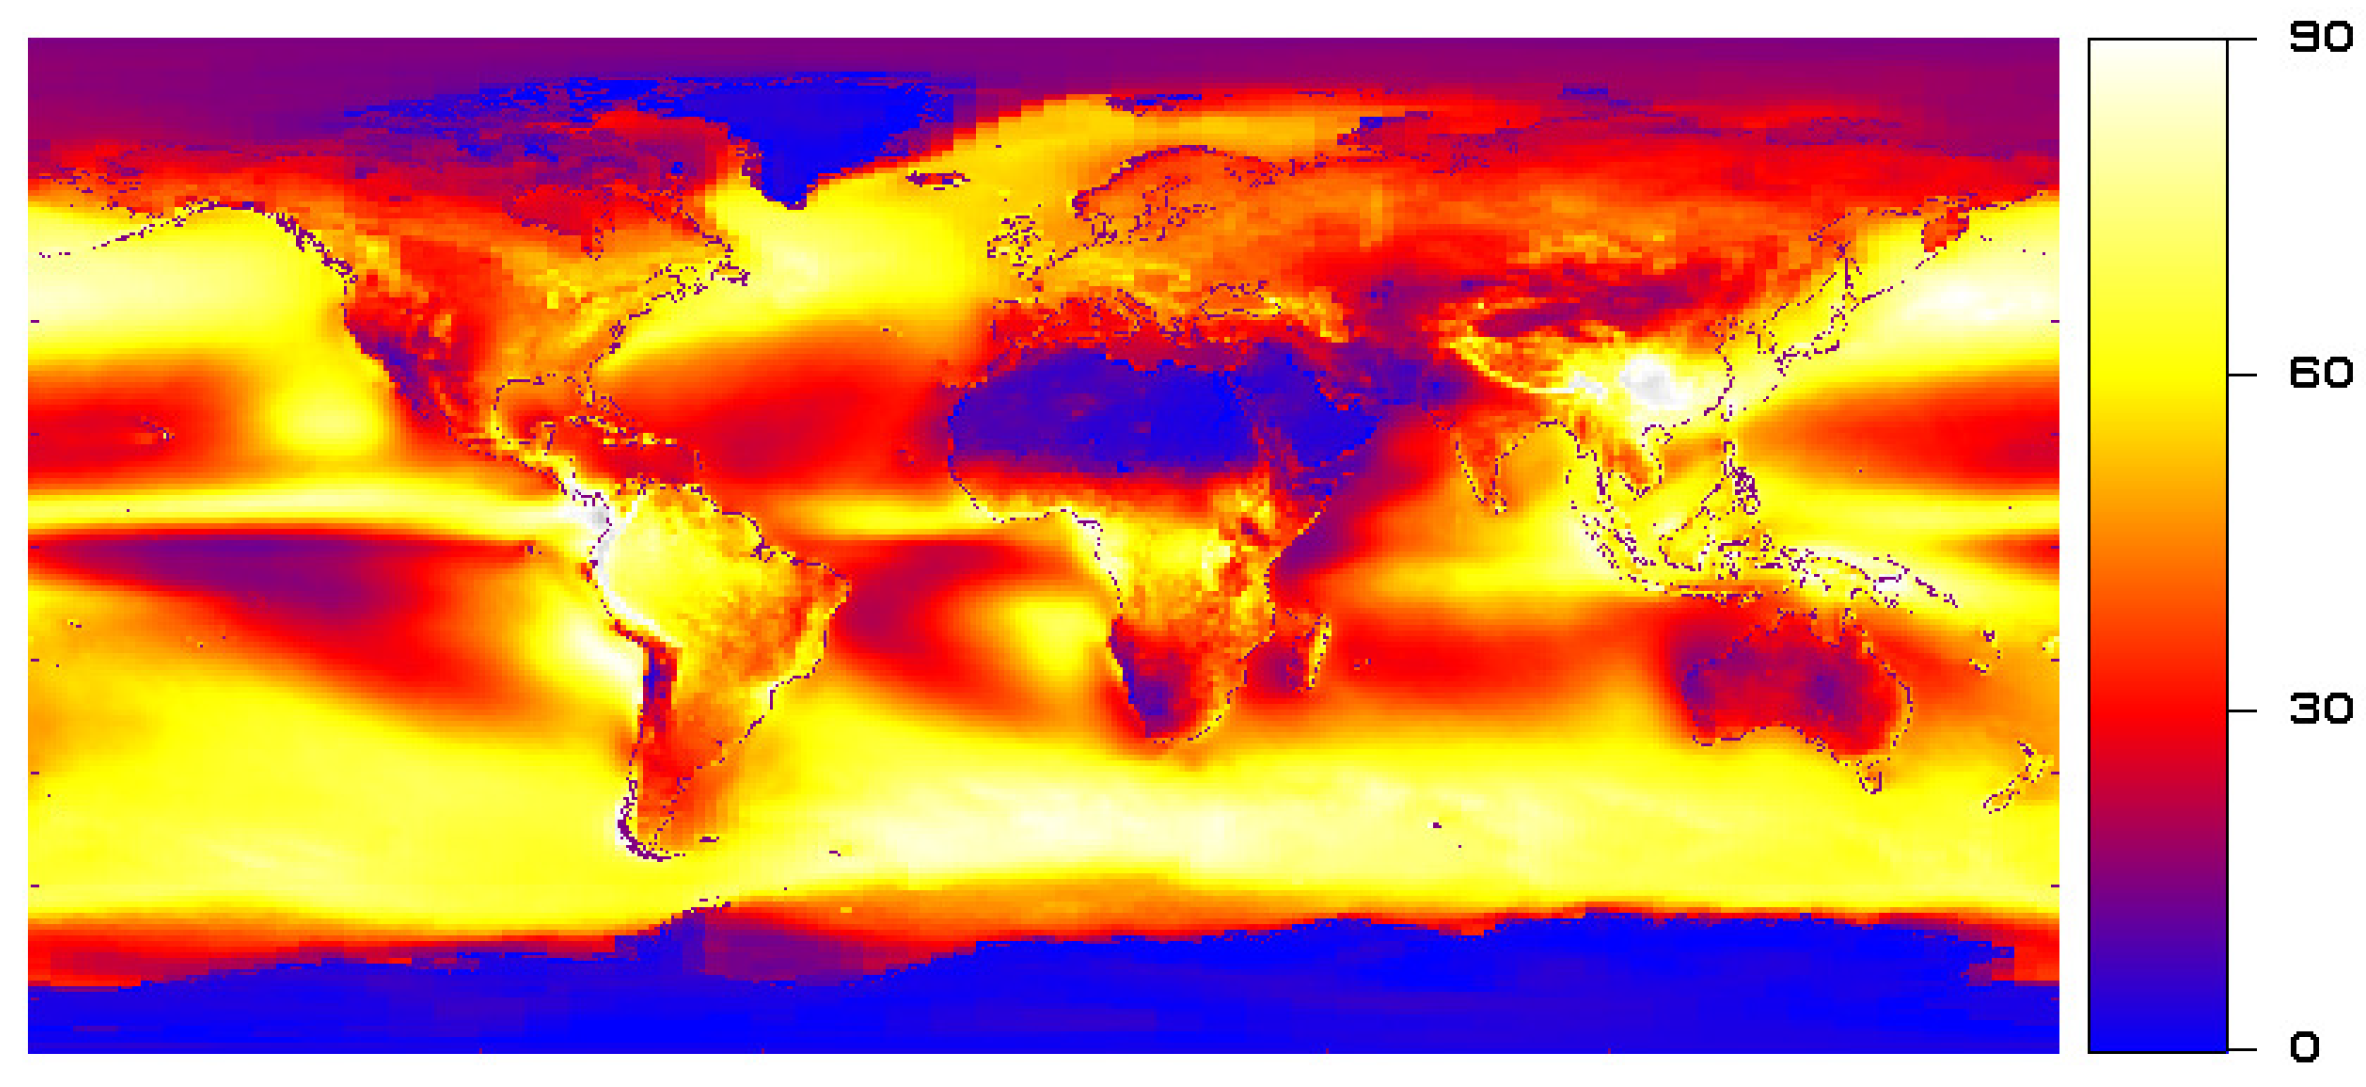
Figure 2 shows the corresponding clear-sky RSR, and
Figure 3 shows the RSR cloud effect defined as the all-sky RSR minus the clear-sky RSR.
Regions of high clear-sky RSR (see
Figure 2) are the Sahara desert, the ice covered land regions of Antarctica and Greenland, and the sea ice regions in the Arctic and near Antartica. The all-sky RSR (
Figure 1) is also high in regions of thick clouds, shown in
Figure 3.
3. Reflected Solar Radiation Change 2000–2018
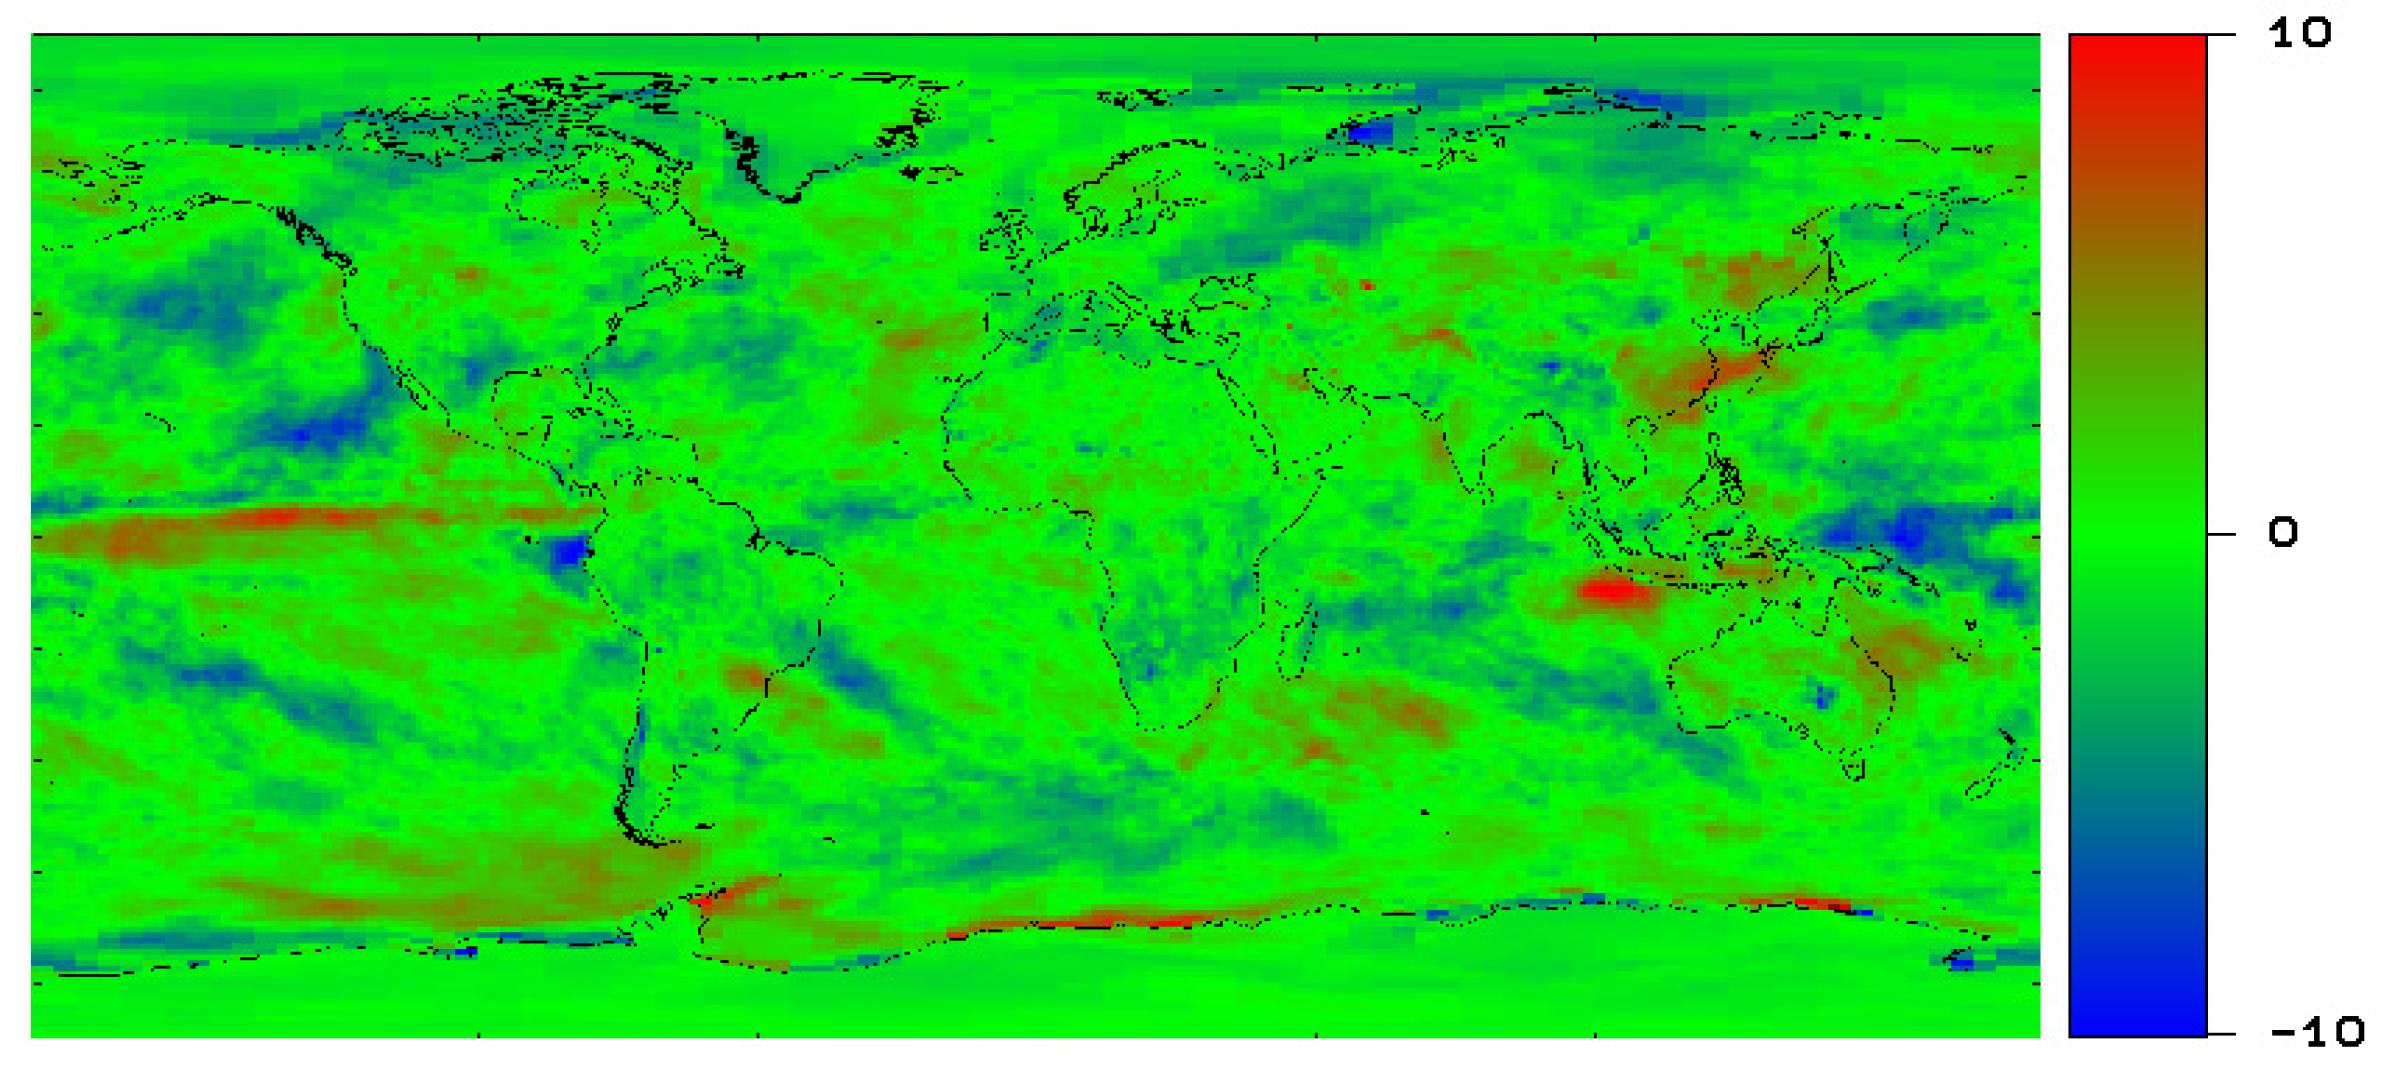
Figure 4 shows the mean Ceres RSR over the period 08/2009–07/2018 minus the period 08/2000–07/2009.
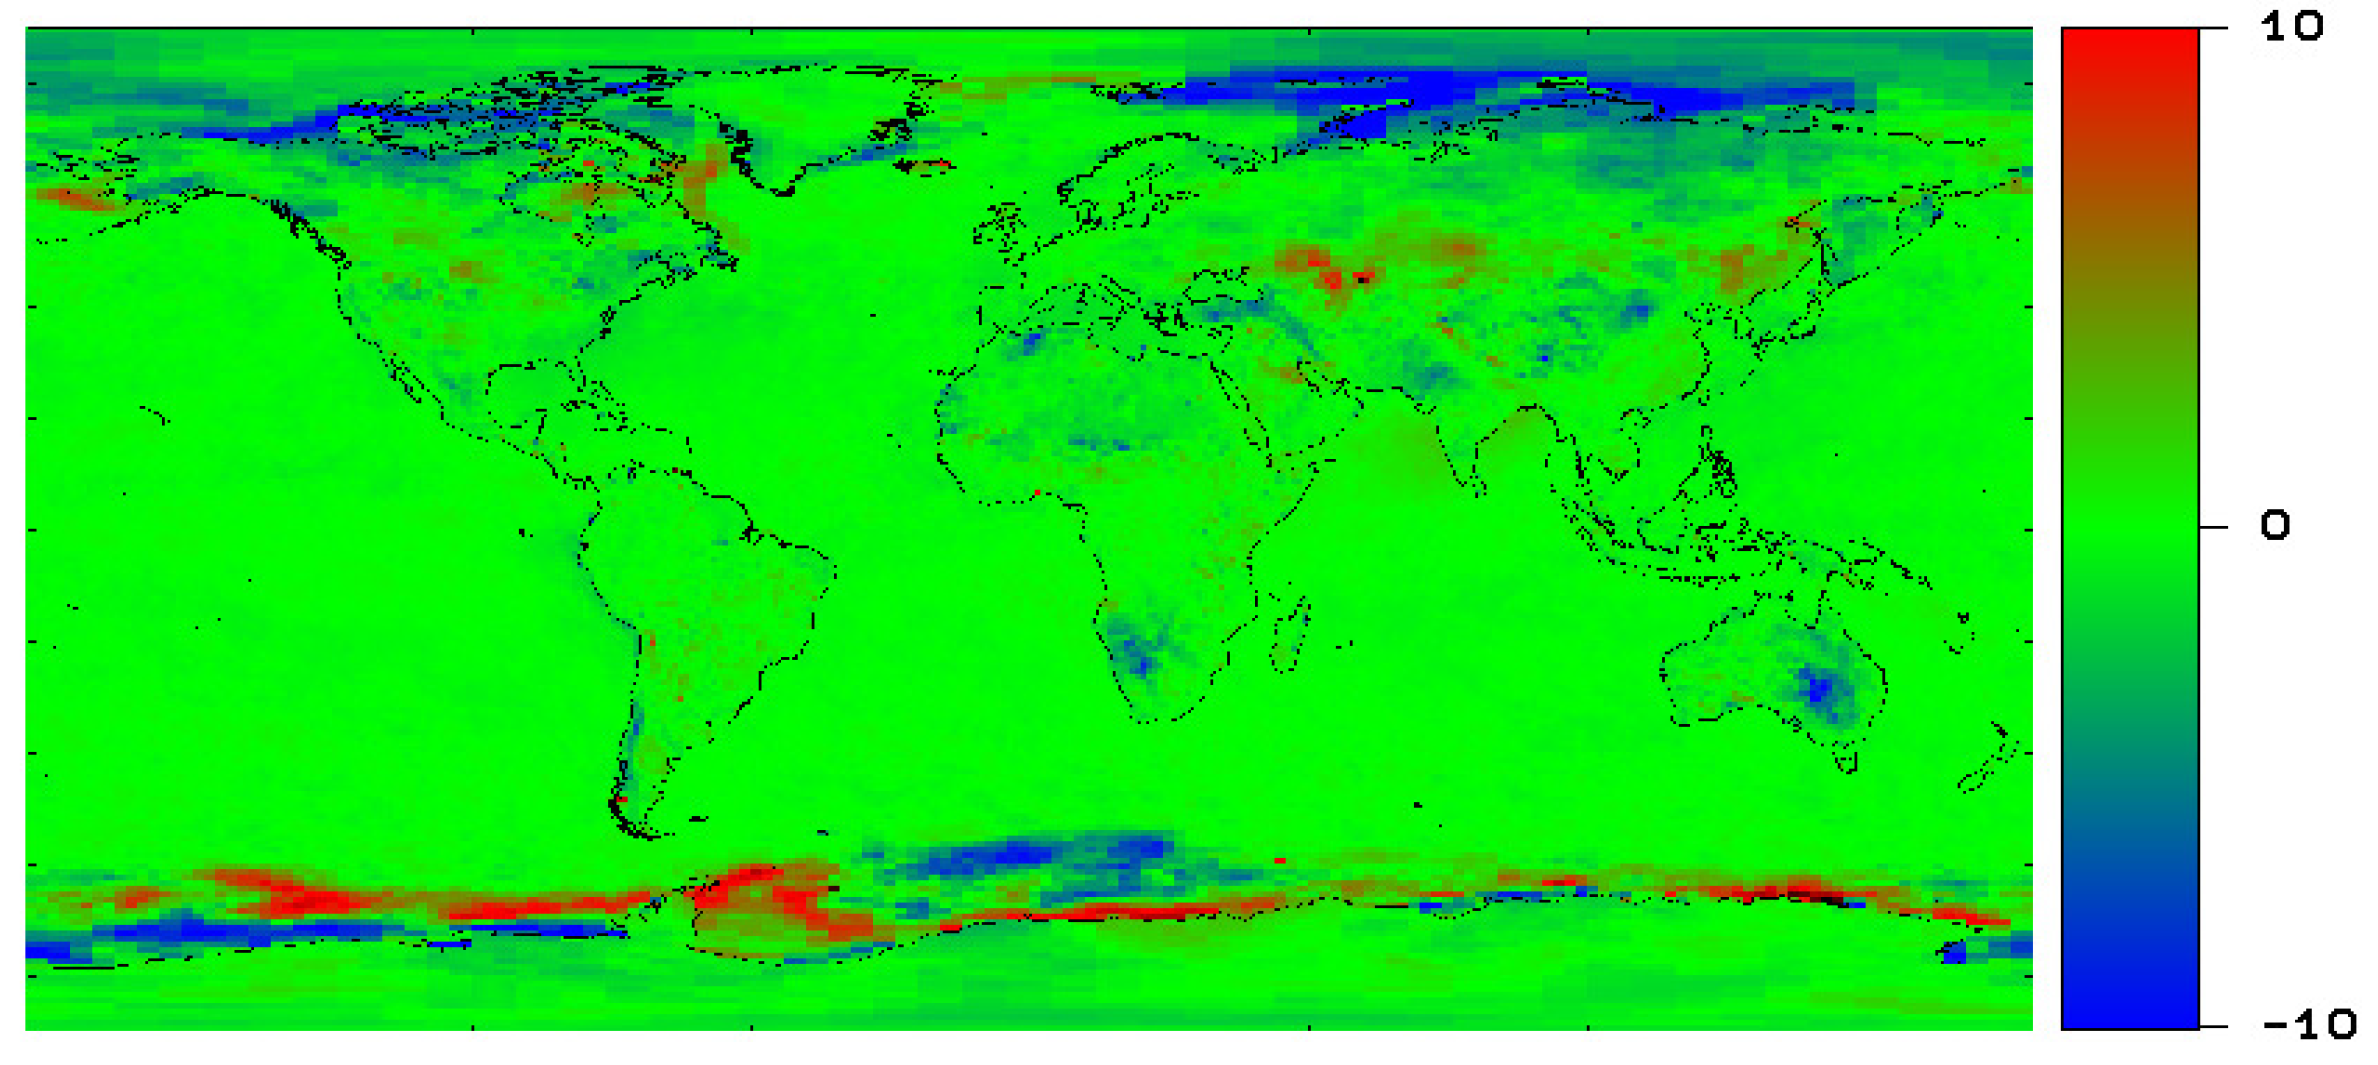
Figure 5 shows the corresponding clear-sky RSR change.
The most prominent clear-sky RSR changes (
Figure 5) appear to be linked to the melting/growing of sea ice. In the Arctic, darkening (blue color) due to melting is occuring North of Russia and Canada, while around Antarctica both brightening (red color) due to the growth of sea ice and darkening (blue color) is occuring.
For the all-sky case (
Figure 4) the spatial structure of the darkening/brigthening appears to be more random than for the clear sky case (
Figure 5), although most of the clear sky change features are preserved.
4. Apparent Residual CERES RSR Ageing
In
Figure 4 and
Figure 5 the dominant color is green; this means that small RSR changes occur more frequently than large RSR changes. Physcially, if small changes are driven by random processes only, it is expected that the change with the largest occurence will be zero.
However, close inspection of the histograms of the all-sky and clear-sky regional changes of the RSR shown in
Figure 4 and
Figure 5 shows that they are not centred around a mode equal to zero.
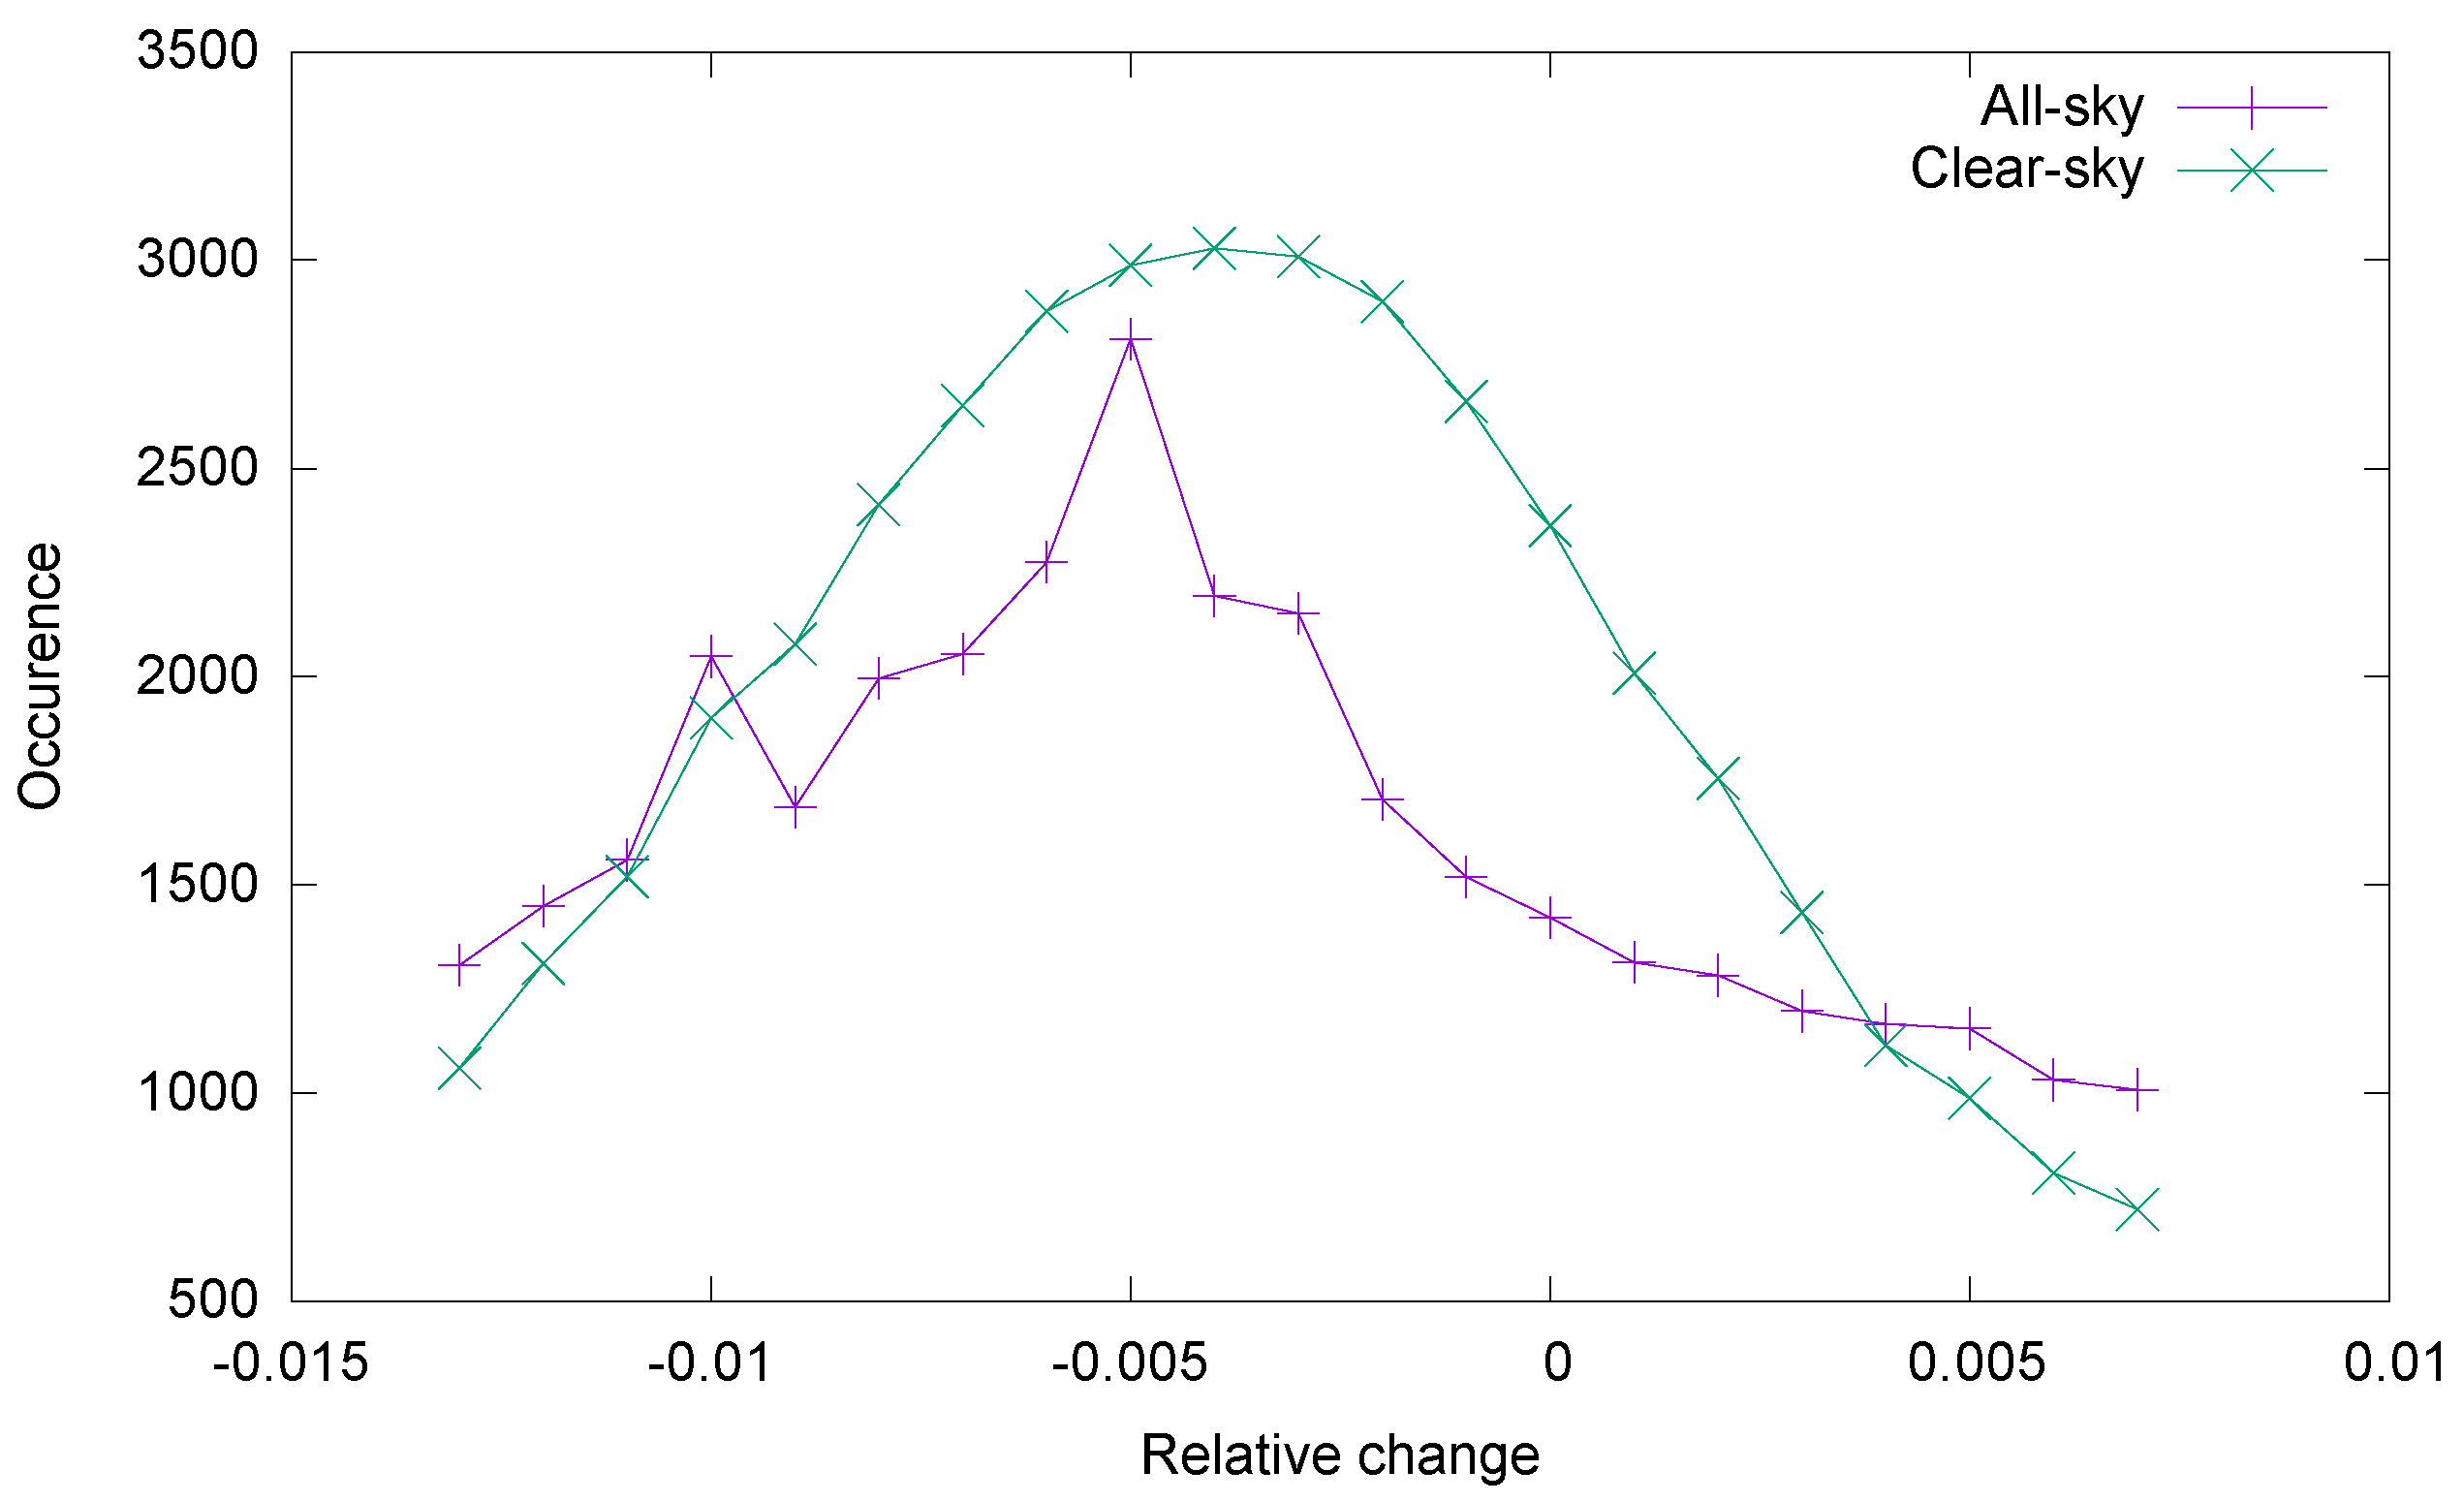
Figure 6 shows the histograms of the relative change value of the RSR over the 9 year period from 08/2009–07/2018 with respect to 08/2000–07/2009. The modes of the all-sky histogram (purple curve) and of the clear-sky histogram (green curve) agree within 0.001 and deviate significantly from zero. A physical process must be driving the changes to a non zero mode. Since the mode for the all-sky changes is close to the mode of the clear-sky changes, most likely this physical process does not occur on earth, but rather in the CERES measurement system.
We assume the measured non zero change mode is due to a residual ageing of the CERES measurement system. The mode of the all-sky relative changes (purple curve in
Figure 6) is −0.005 ± 0.001 over 9 years, the mode of the clear-sky relative changes (green curve in
Figure 6) is −0.004 ± 0.001 over 9 years. We will take −0.0045 ± 0.001 over 9 years as the best estimate of the residual CERES ageing. It corresponds to a residual CERES RSR ageing of −0.5 ± 0.11 %/dec. This value is not inconsistent with the CERES stability estimates from lunar calibrations [
8] and comparison with other sensors [
9]. Further on we apply a linear drift correction to remove this residual ageing.
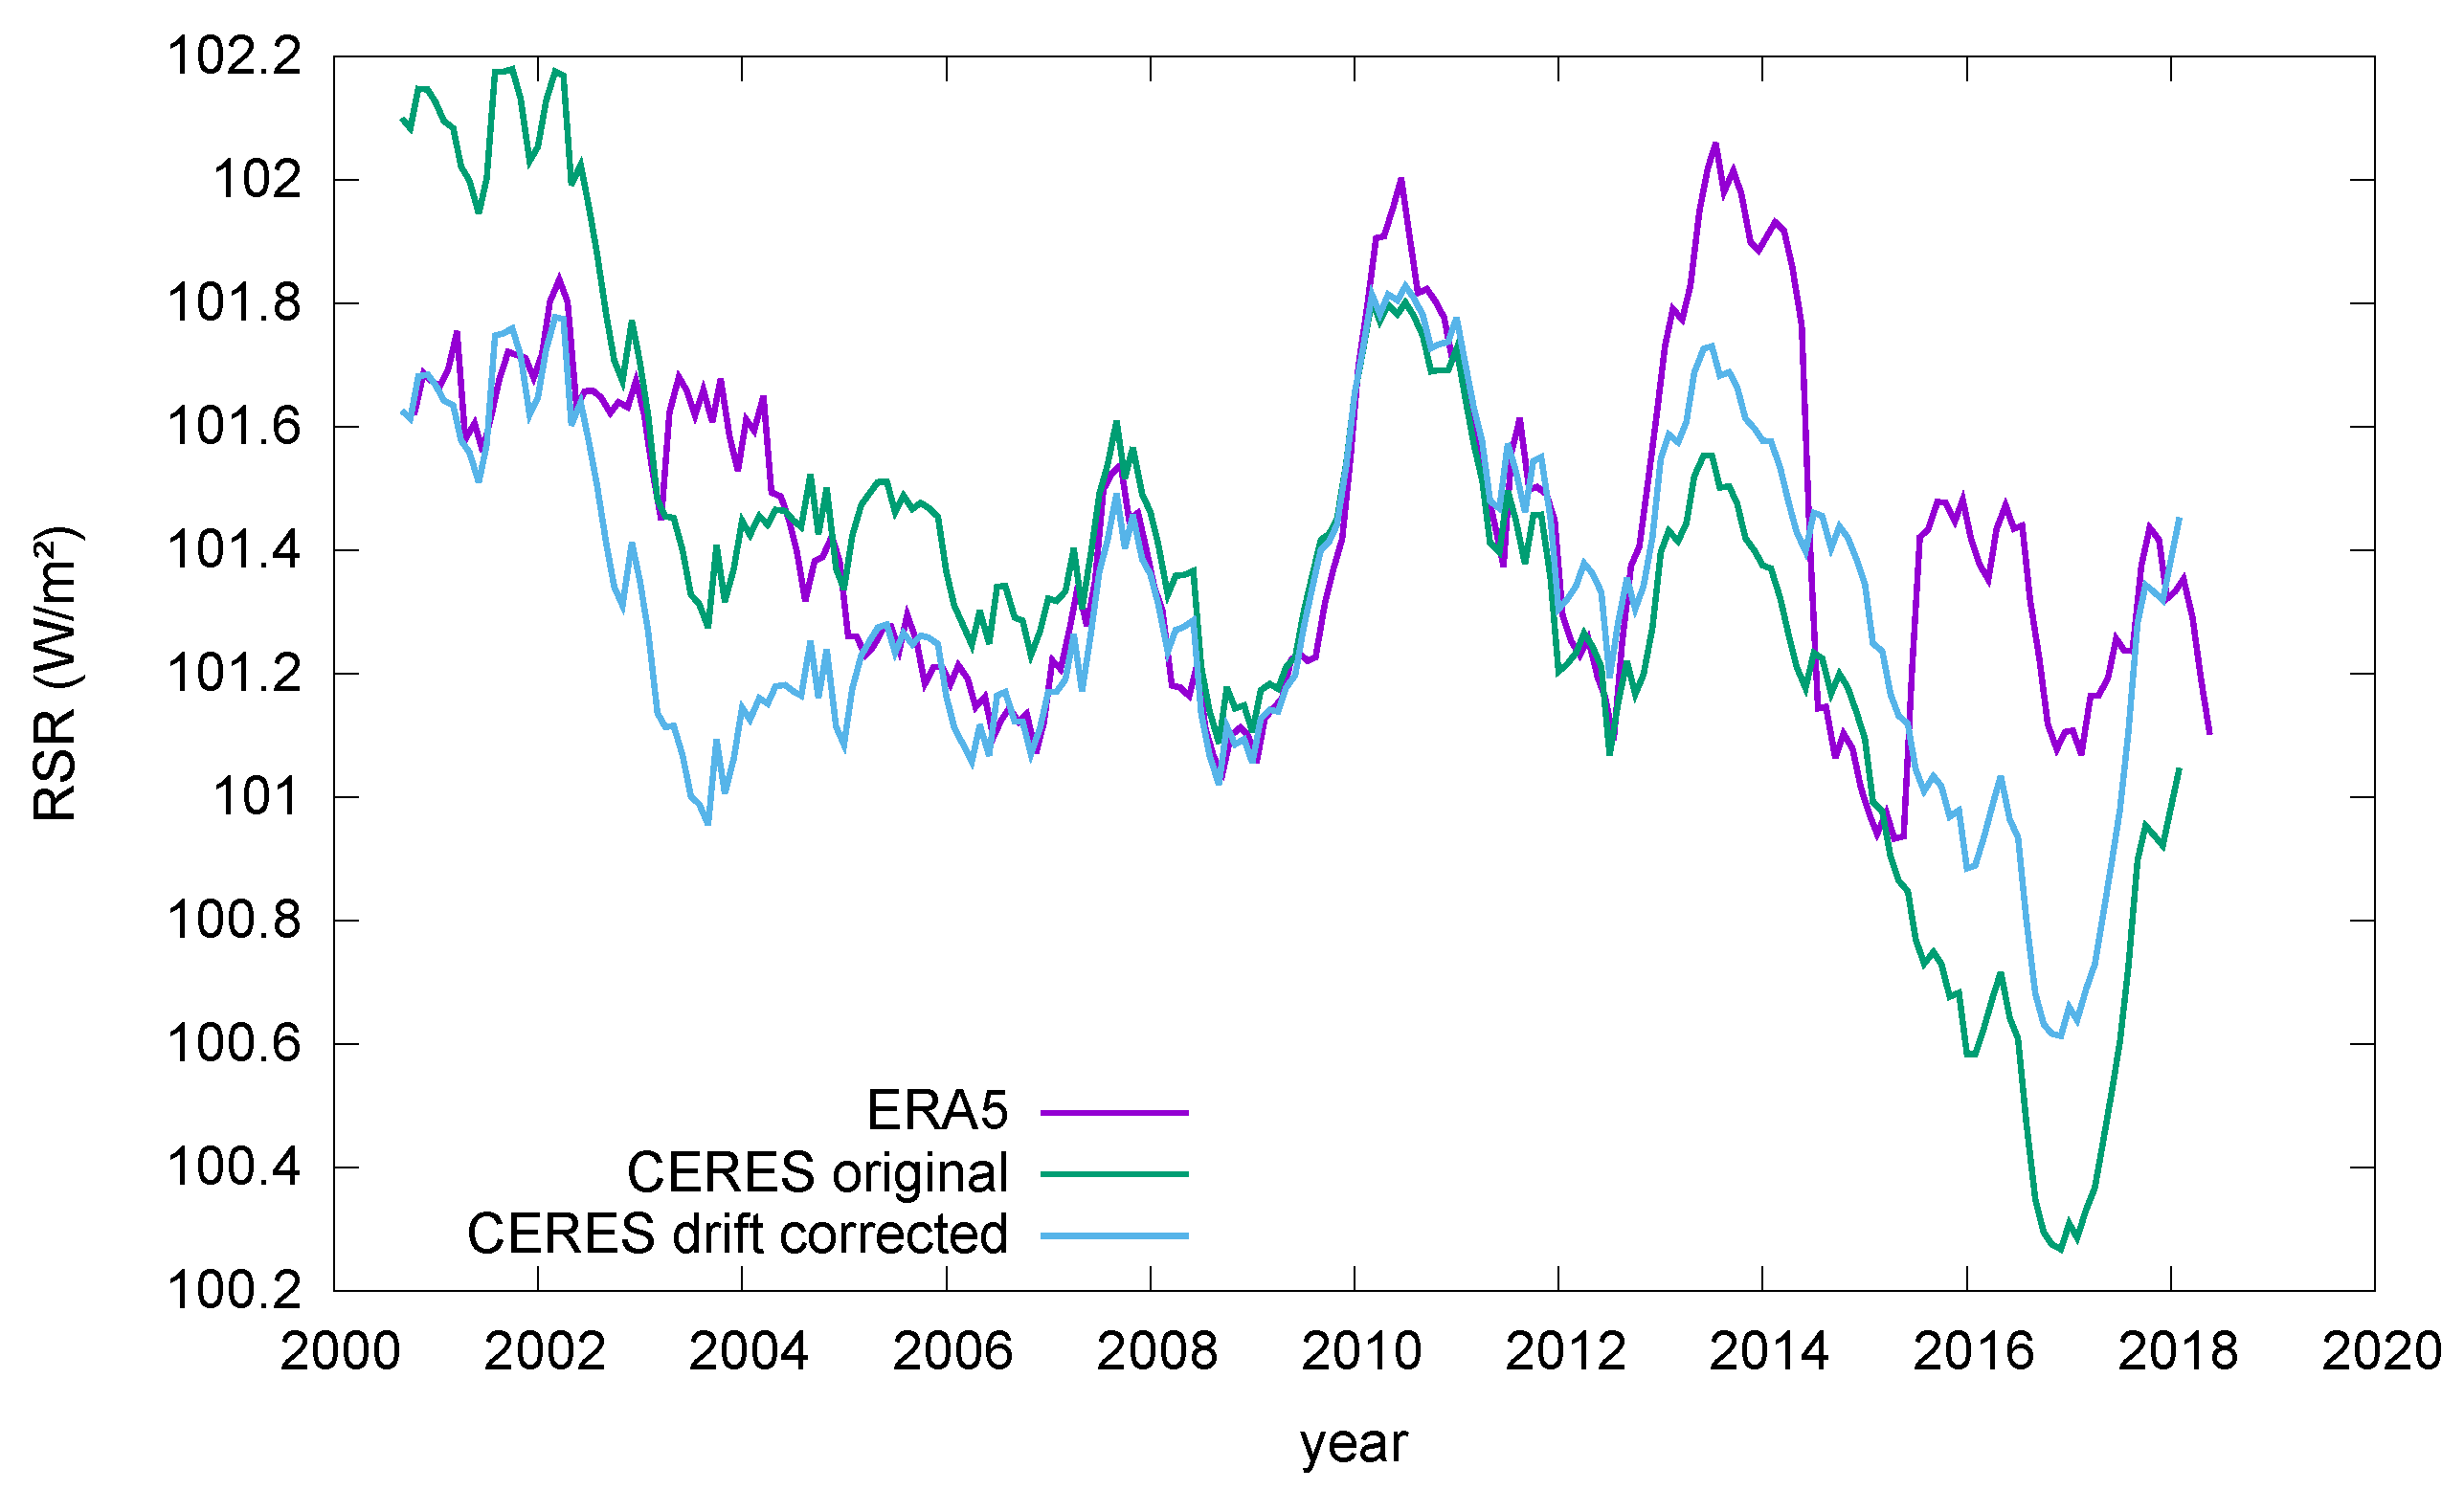
Figure 7 shows the global average RSR without (green curve) and with the drift correction (blue curve). For comparison also the independent ERA 5 RSR [
10] is shown (purple curve). In all cases the measurements are anchored to a global average RSR value of 101.4 W/m
2 over the period 2005–2014 following [
5]. This makes the Earth Energy Imbalance equal to 0.9 W/m
2 following [
11].
The trend of the original CERES RSR relative to the ERA5 RSR is −0.5 ± 0.03 (1 ) W/m2 /dec. The trend of our ageing corrected CERES RSR relative to the ERA5 RSR is −0.03 ± 0.03 (1 ) W/m2 /dec. Thus after our CERES RSR ageing corection there is no more signifcant trend compared to ERA5, while before our ageing corrrection there is a significant trend. This increases the confidence in our ageing correction.
5. Link to Sea Ice Extent
Based on
Figure 5, there seems to be a link between the RSR and the Sea Ice Extent (SIE) in the polar regions. This was also noted in [
12].
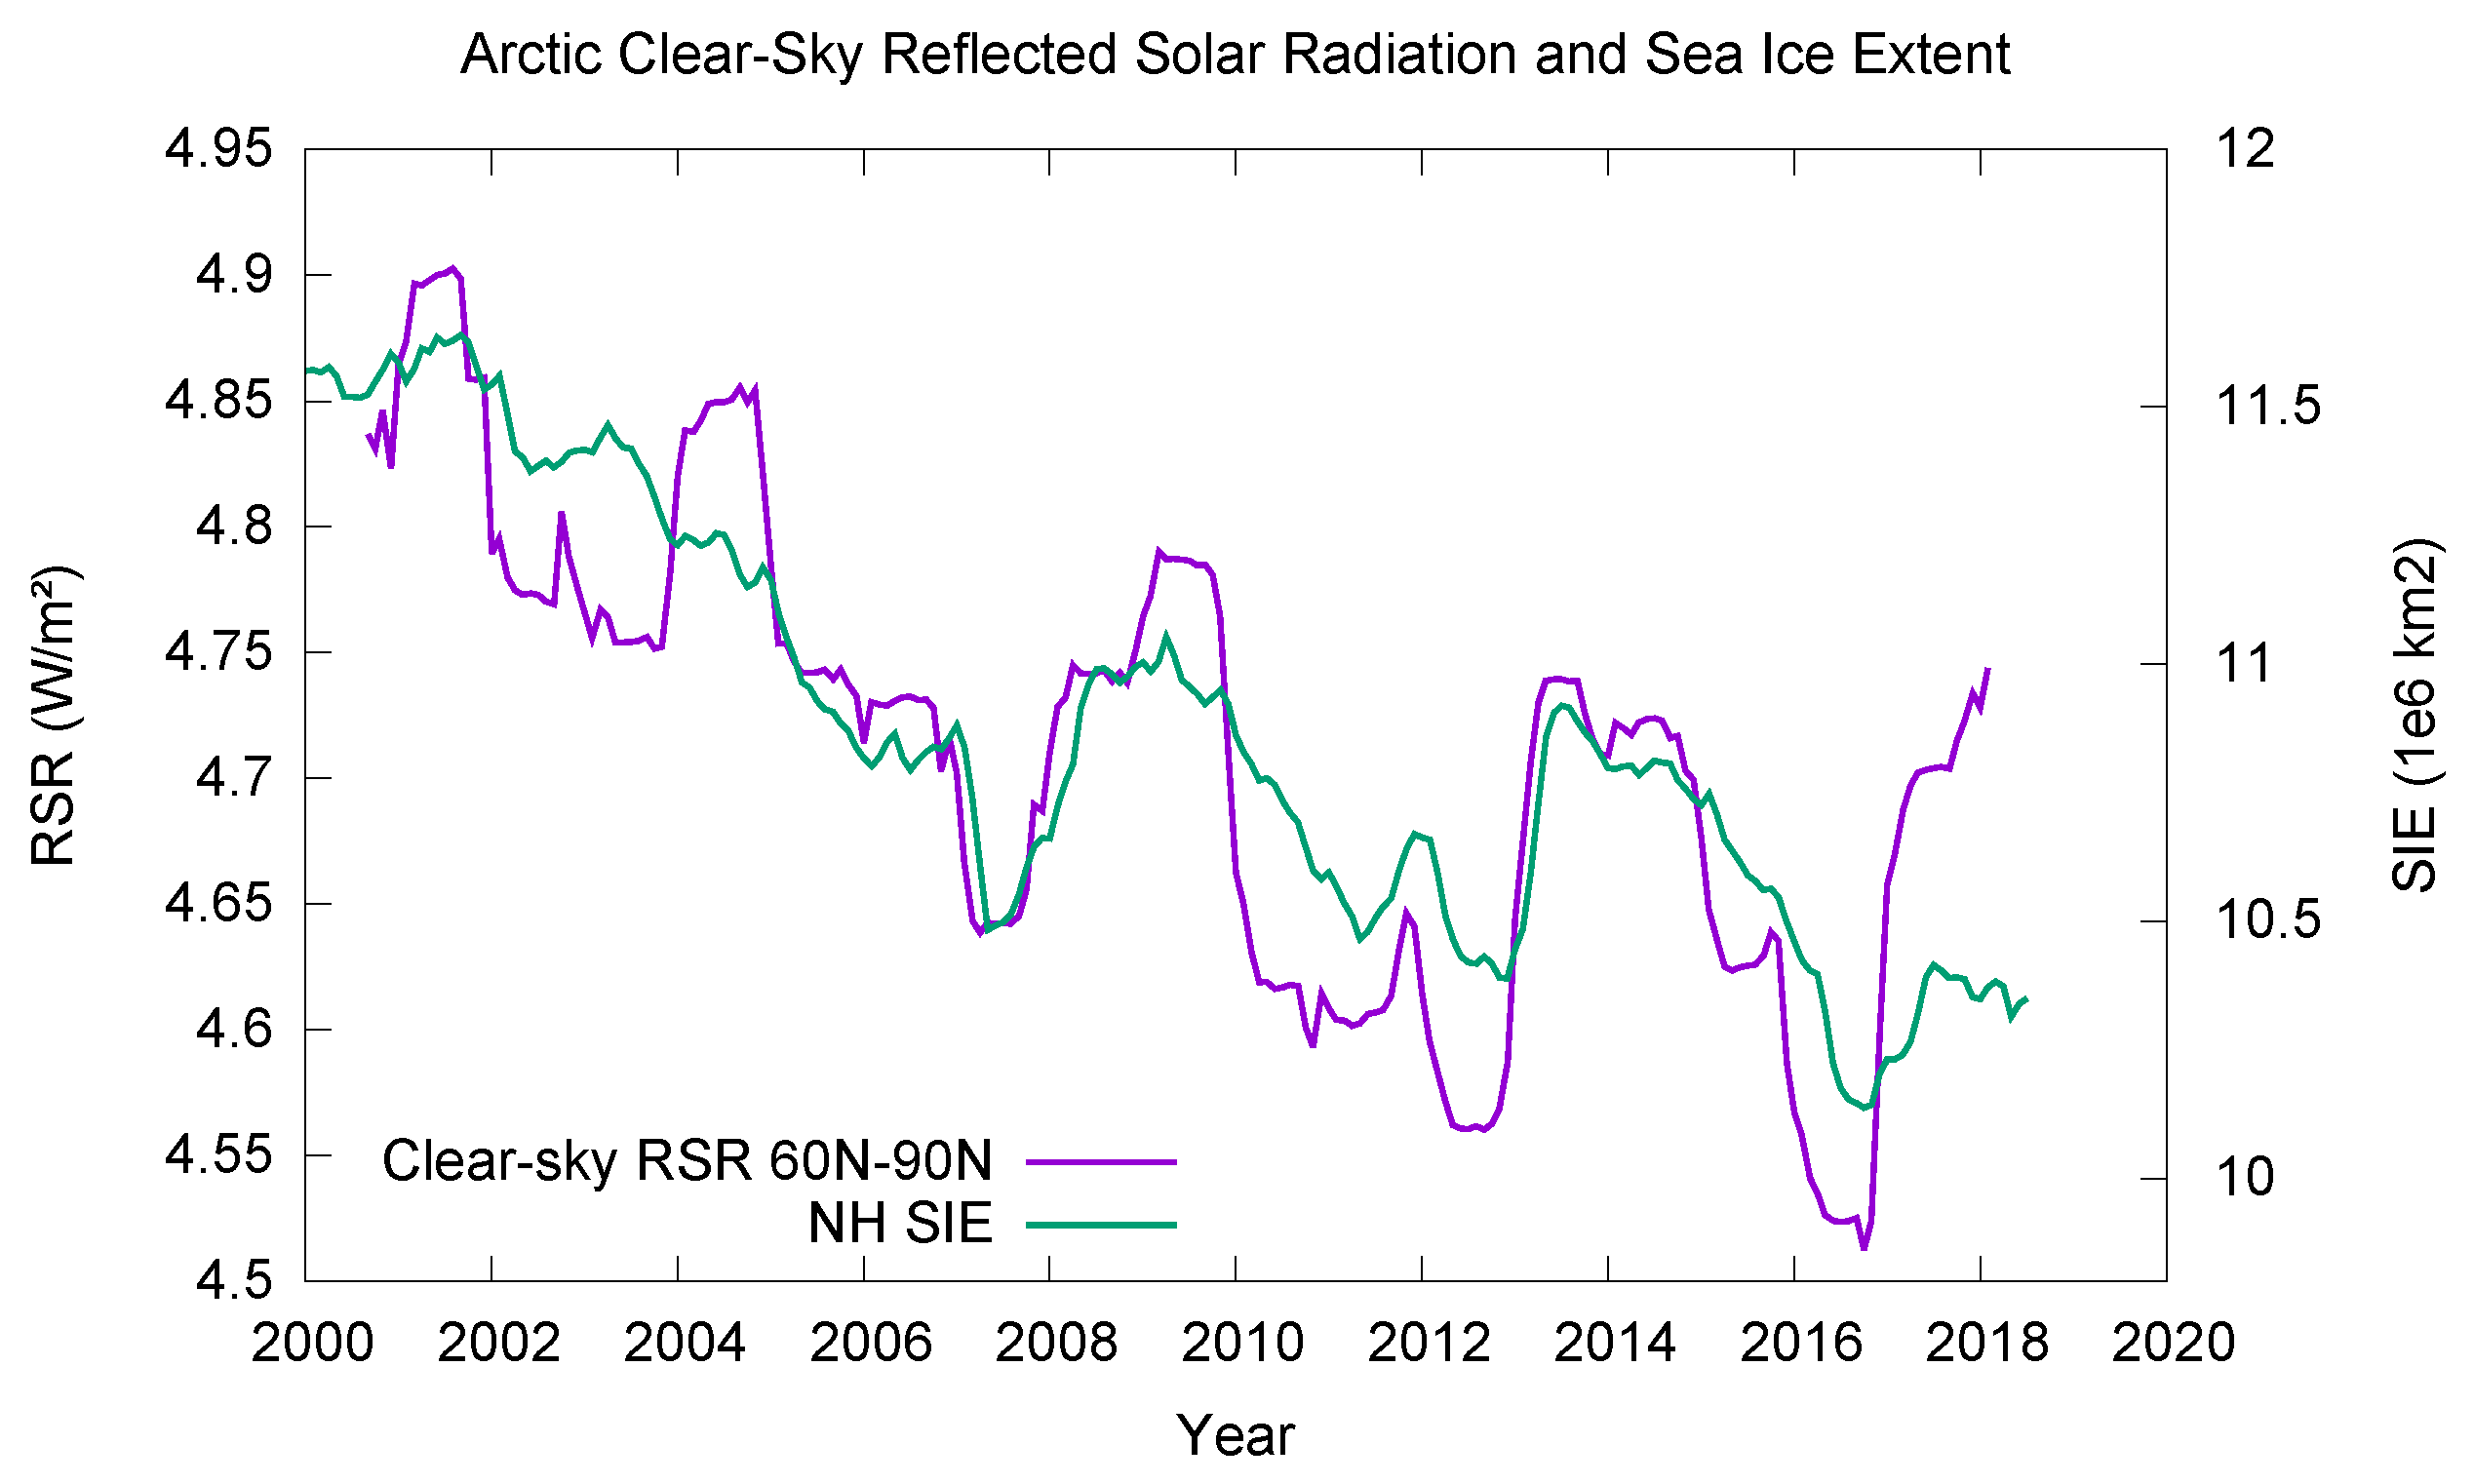
Figure 8 shows the clear-sky RSR contribution for the Arctic zone defined as 60
N to 90
N (purple curve, left scale) compared to the Arctic SIE (green curve, right scale). We use the yearly running mean of the SIE obtained from the National Snow and Ice Data Centre (NSIDC) [
13].
The correlation between the Arctic clear-sky RSR and the Arctic SIE is 85%. The ratio between the variations of the two quantities is 0.199 ± 0.009 (1 ) W/m2 /M km2.
Over the 2000–2018 period the Arctic clear-sky RSR shows a decreasing trend of −0.13 W/m2dec.
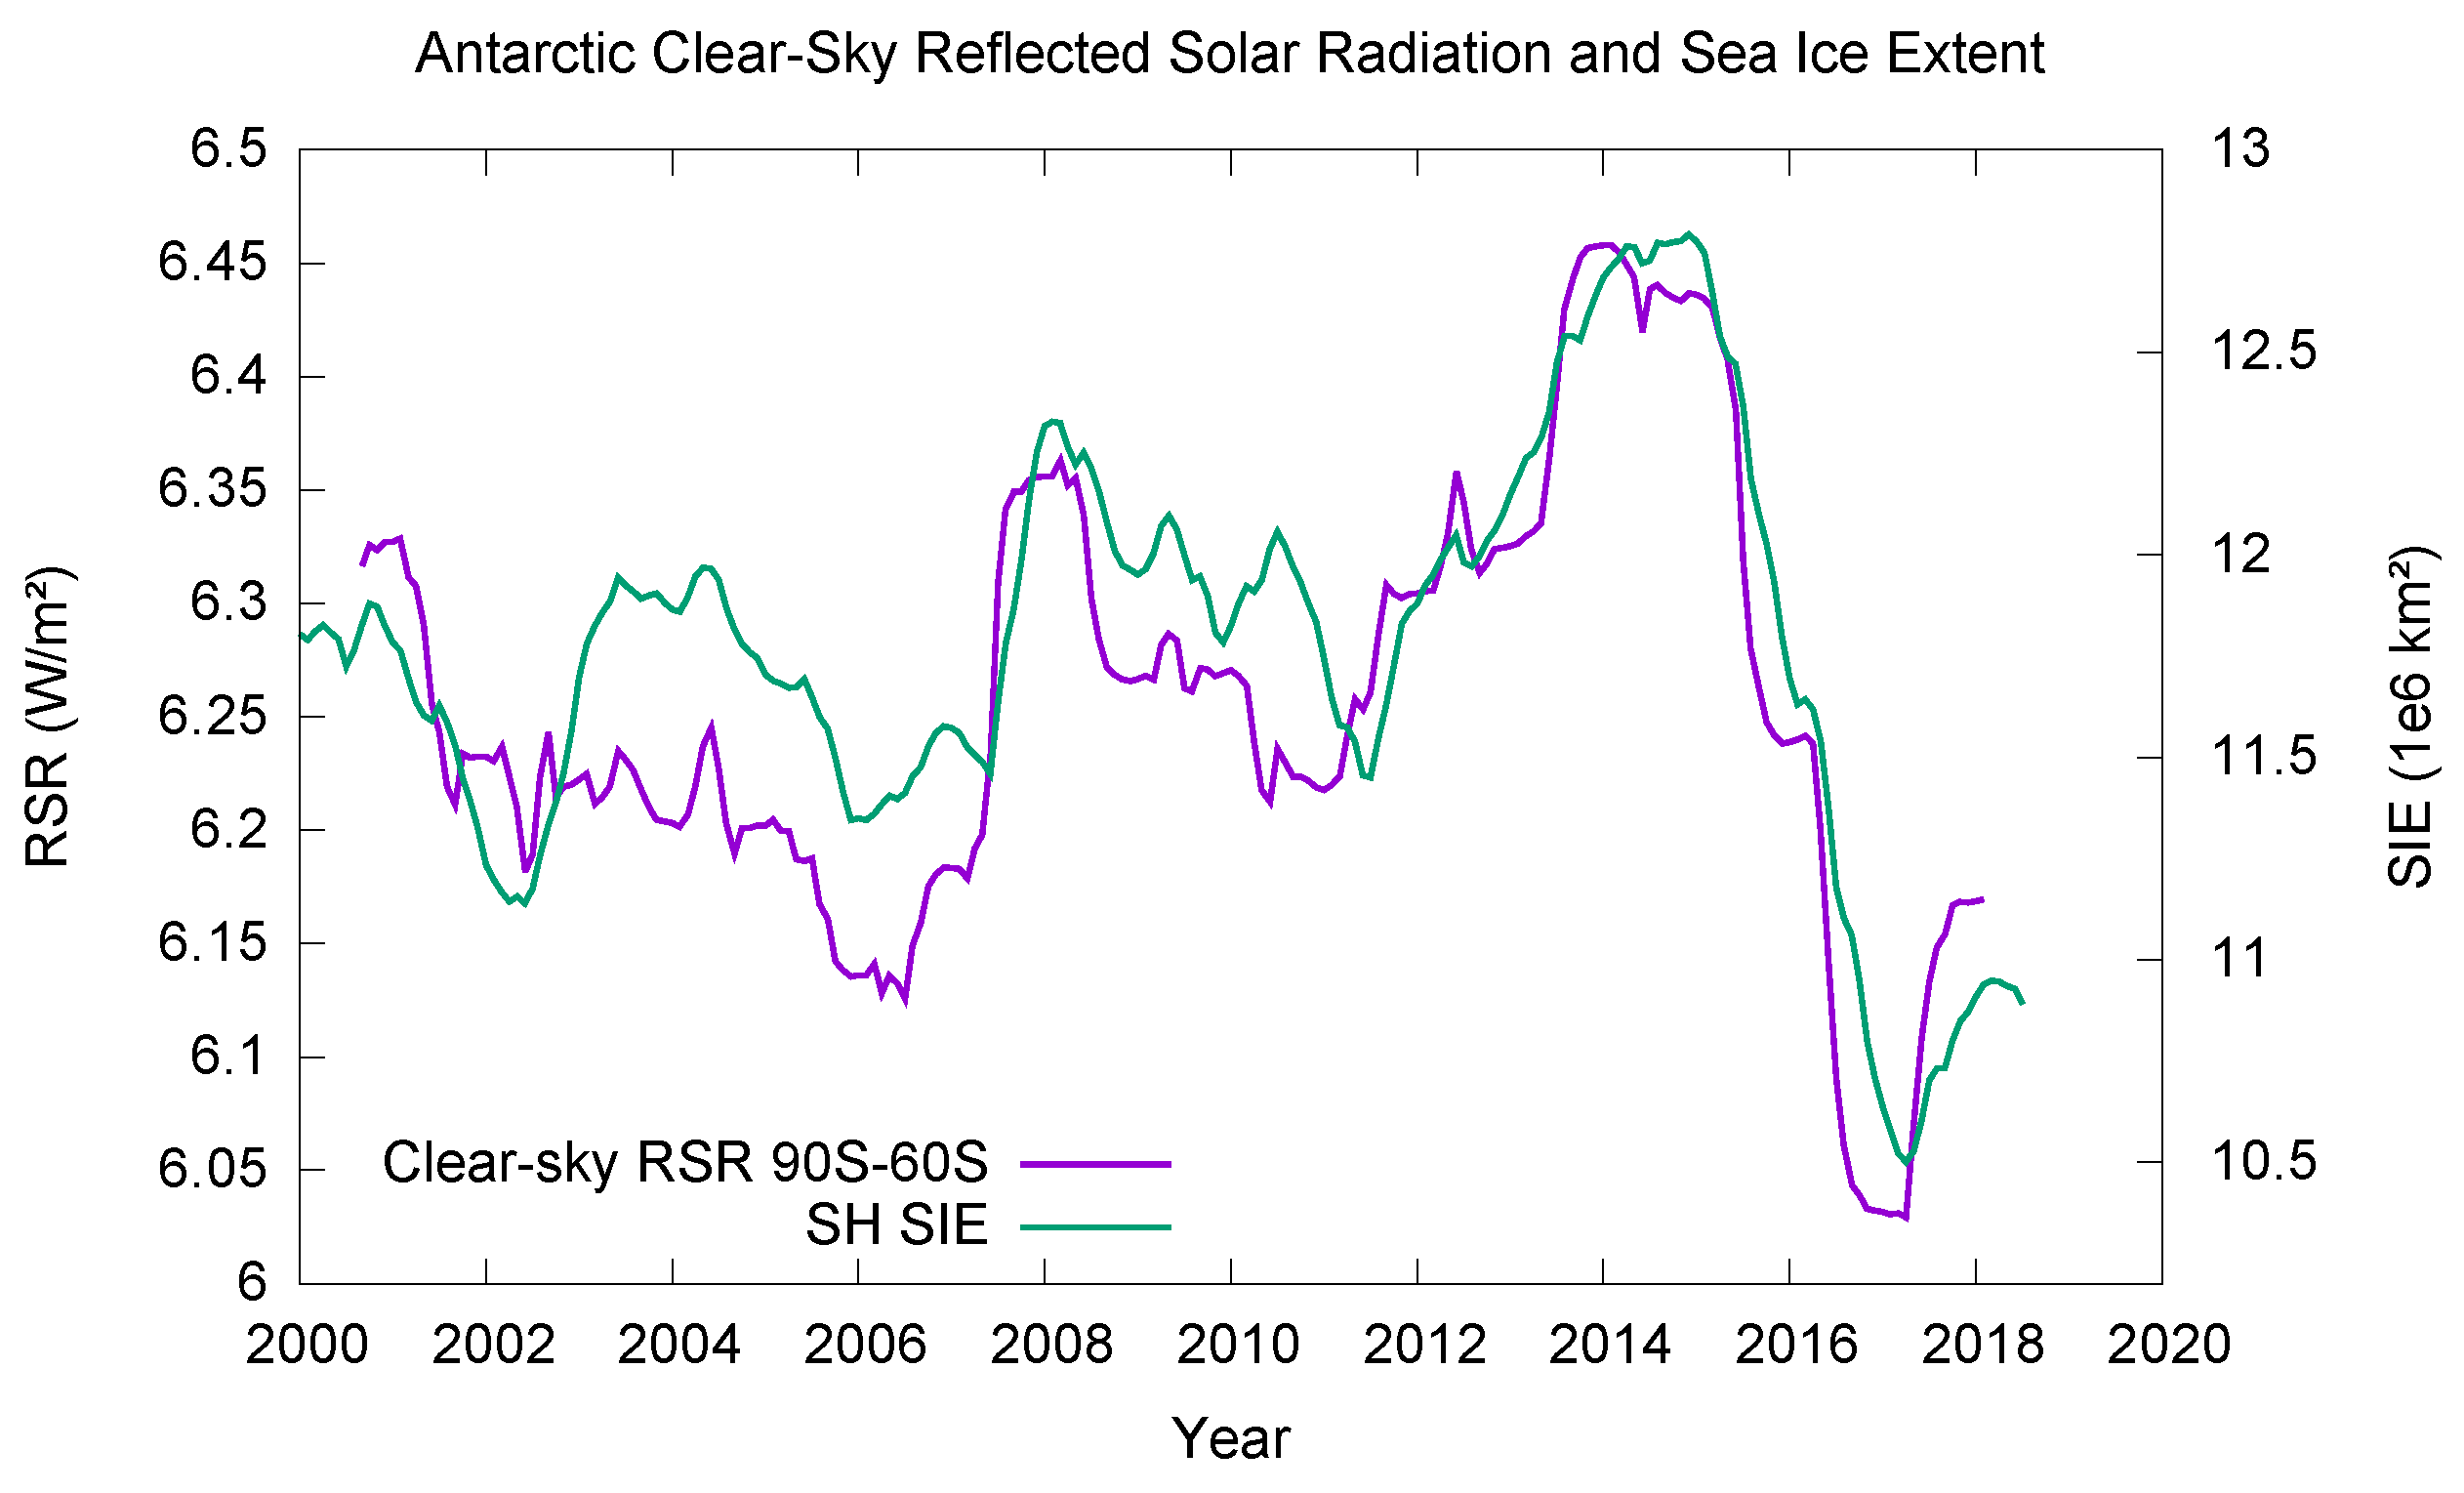
Figure 9 shows the RSR contribution for the Antarctic zone defined as 90
S to 60
S (purple curve, left scale) compared to the Antarctic SIE (green curve, right scale). We use the yearly running mean of the NSIDC SIE.
The correlation between the Antarctic clear-sky RSR and the Antarctic SIE is 88%. The ratio between the variations of the two quantities is 0.17 ± 0.006 (1 ) W/m2/M km.
Over the 2000–2014 period the Antarctic clear-sky RSR shows an increasing trend of 0.08 W/m2dec, followed by a sharp decrease of around −0.4 W/m2 in the 2014–2017 period.
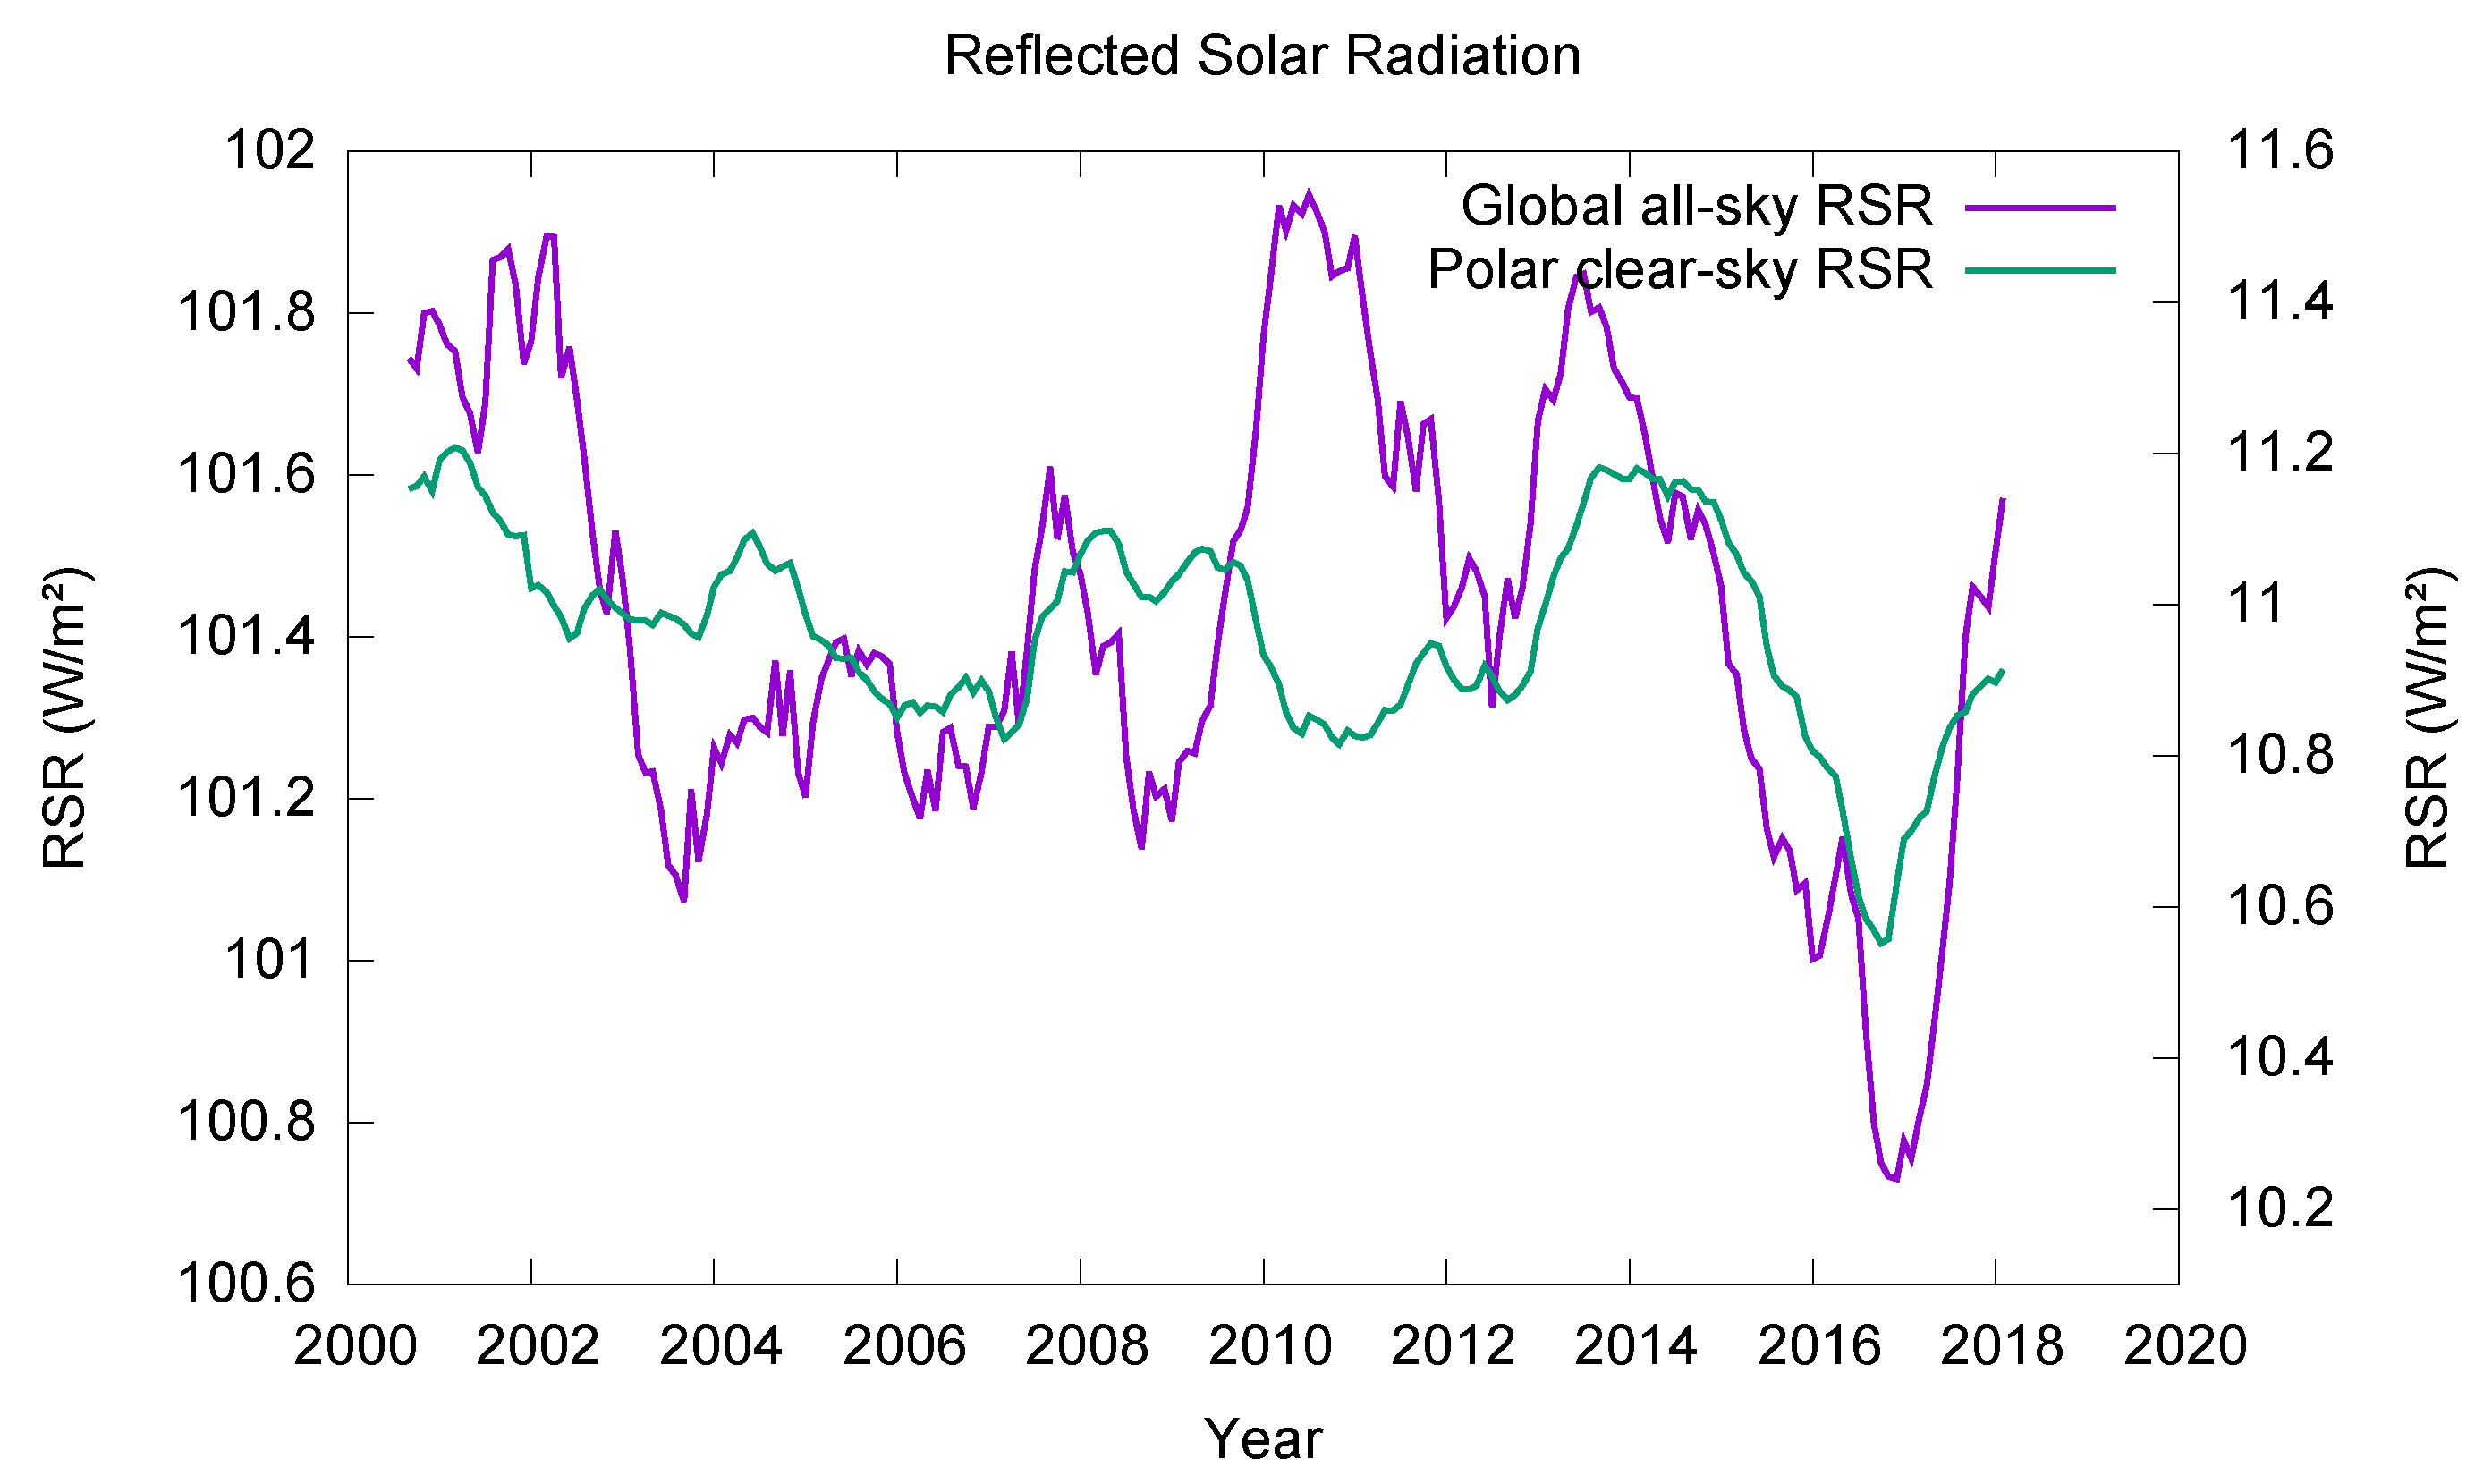
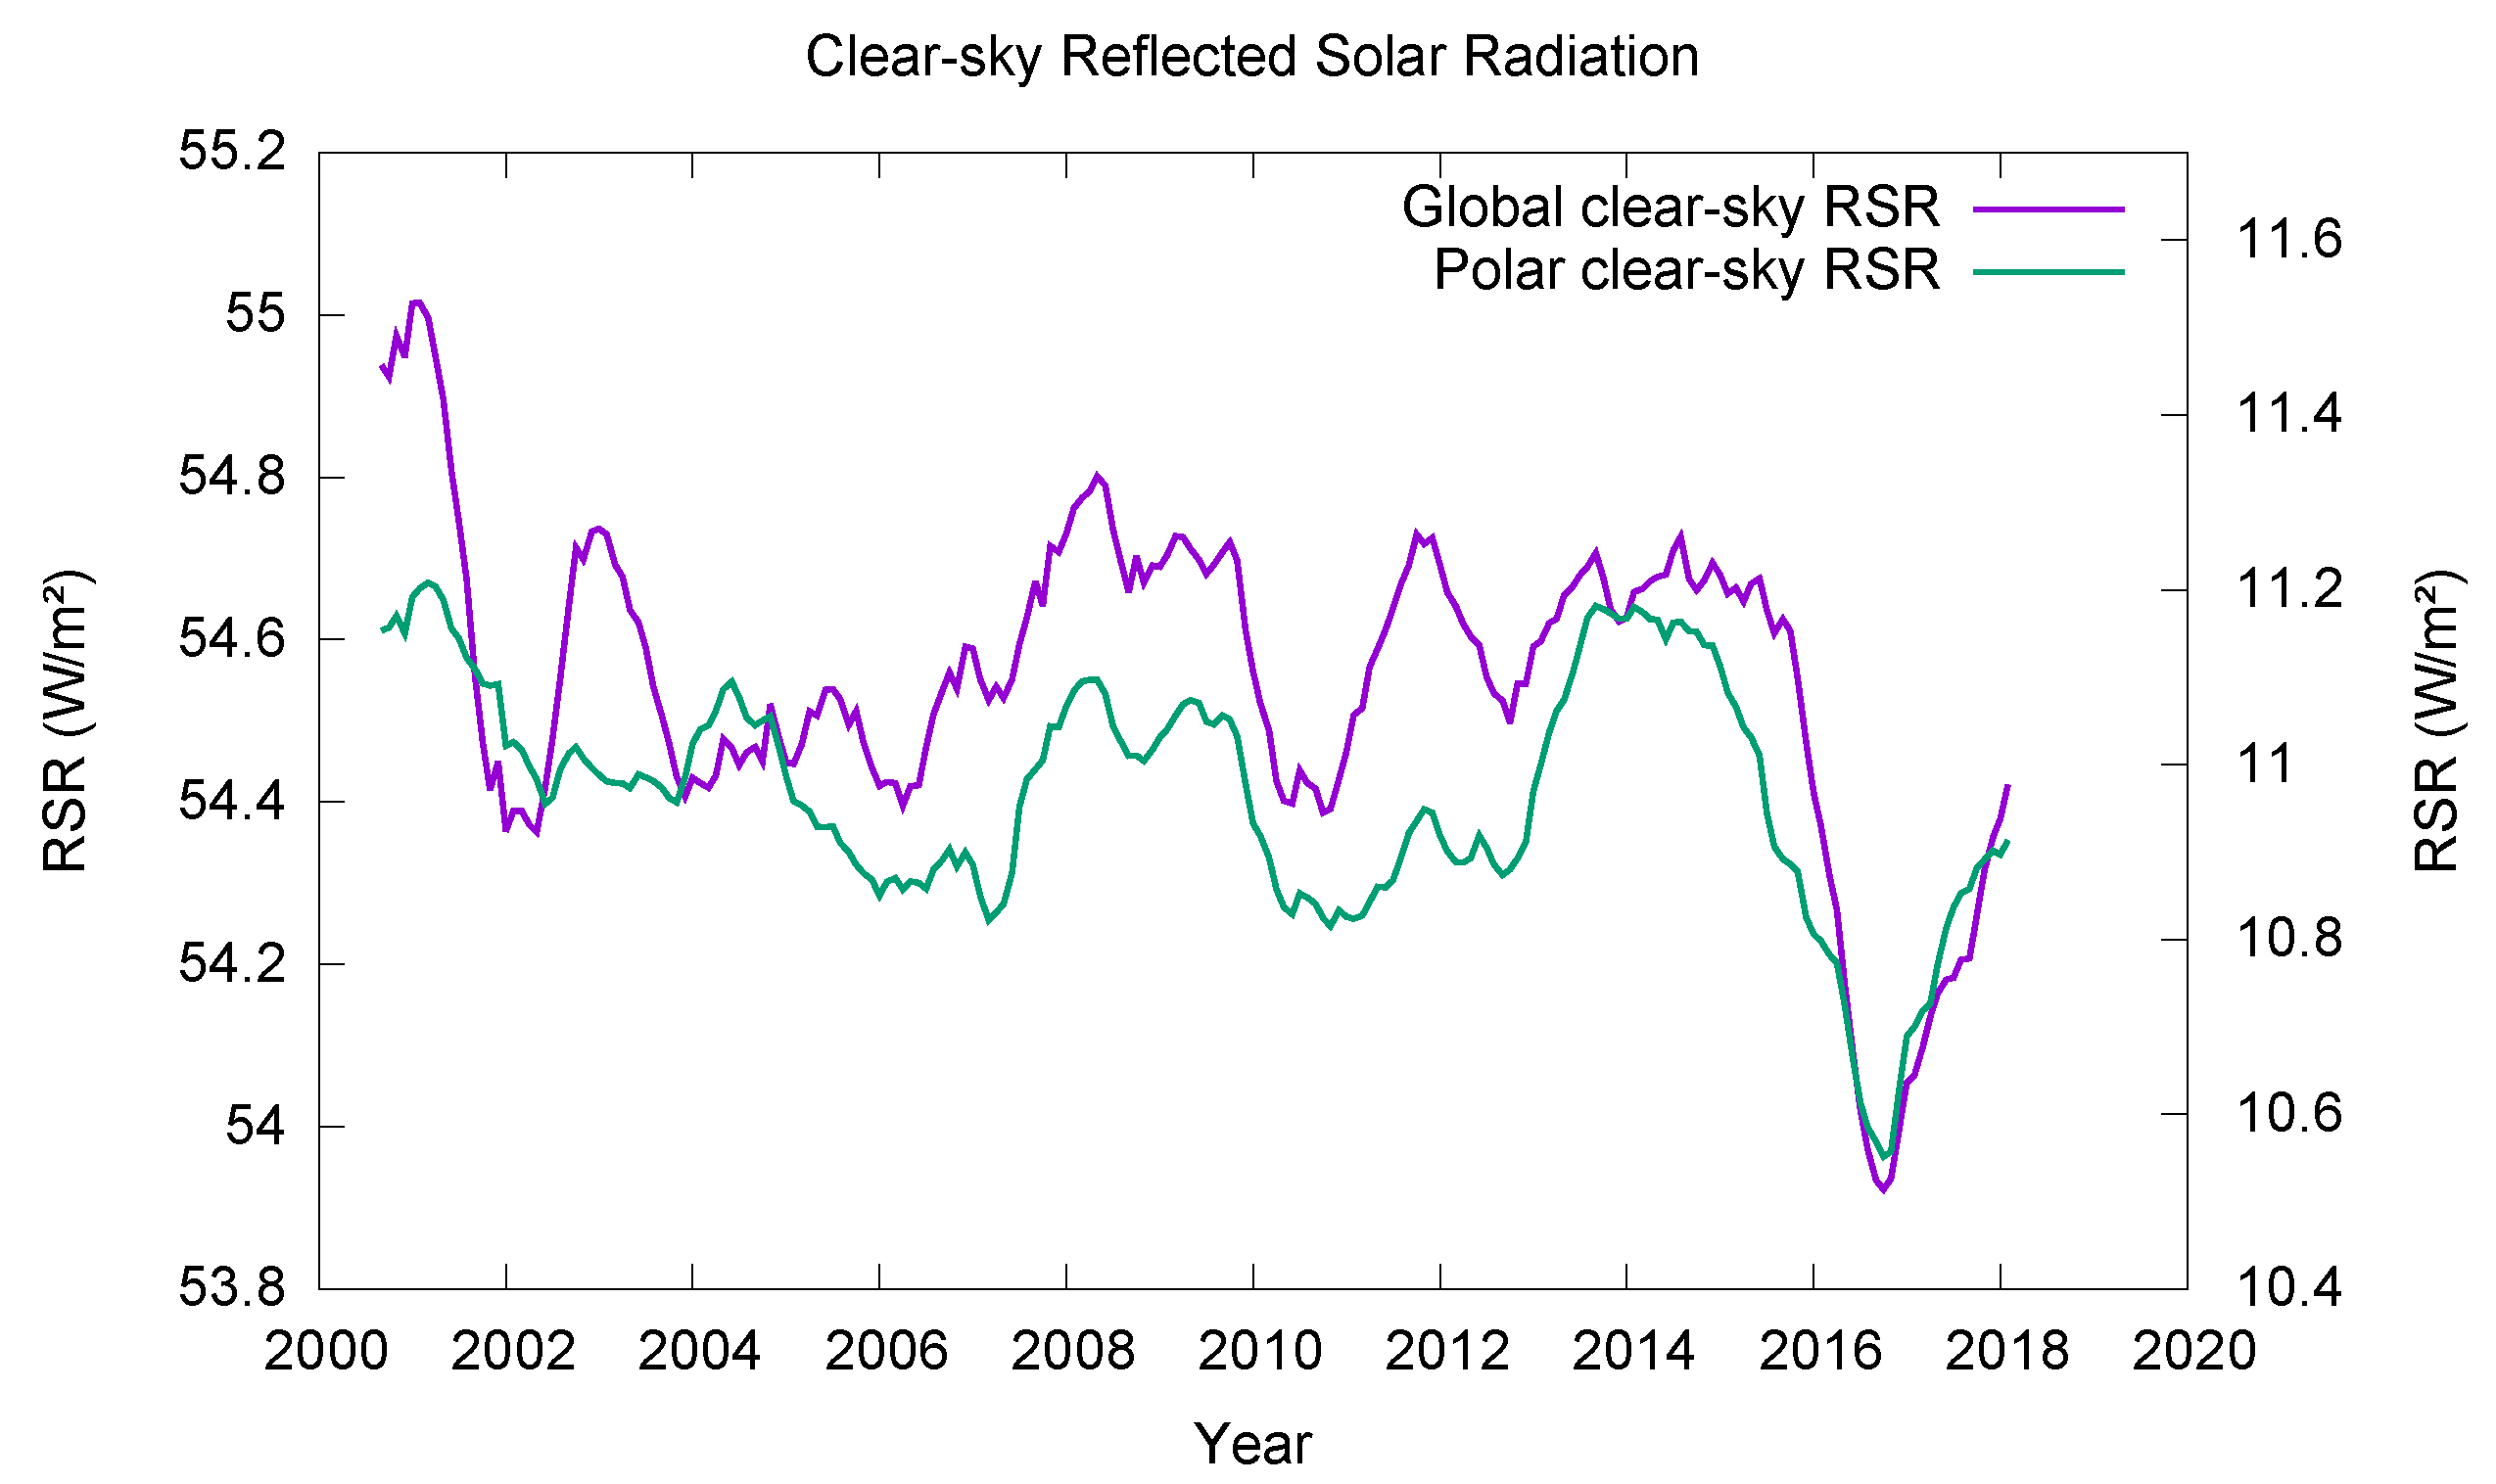
Figure 10 shows the global clear-sky RSR (purple curve, left scale) compared to the polar clear-sky RSR (green curve, right scale). The Polar clear-sky RSR is defined as the sum of the Arctic and the Antarctic clear-sky RSR.
The correlation between the global and the polar clear-sky RSR is 80%. This confirms our previous impression (see
Figure 5) that the dominant clear-sky RSR changes occur in the polar regions.
Prior to 2014, the polar clear-sky RSR is relatively flat due to a partial compensation of the Arctic decrease (see
Figure 8) and the Antarctic increase (see
Figure 9).
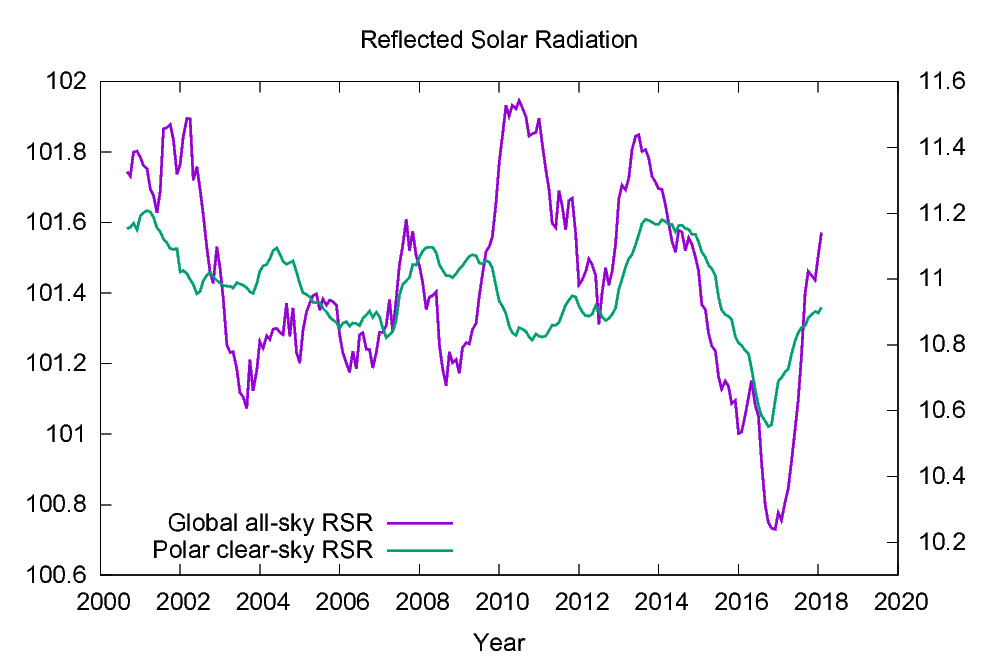
Figure 11 shows the global all-sky RSR (purple curve, left scale) compared to the polar clear-sky RSR (green curve, right scale).
The correlation between the global all-sky and the polar clear-sky RSR is 55%. This indicates that the influence of the polar SIE changes on the global all-sky RSR is low.
6. Total Outgoing Radiation and Earth Energy Imbalance Change 2000–2018
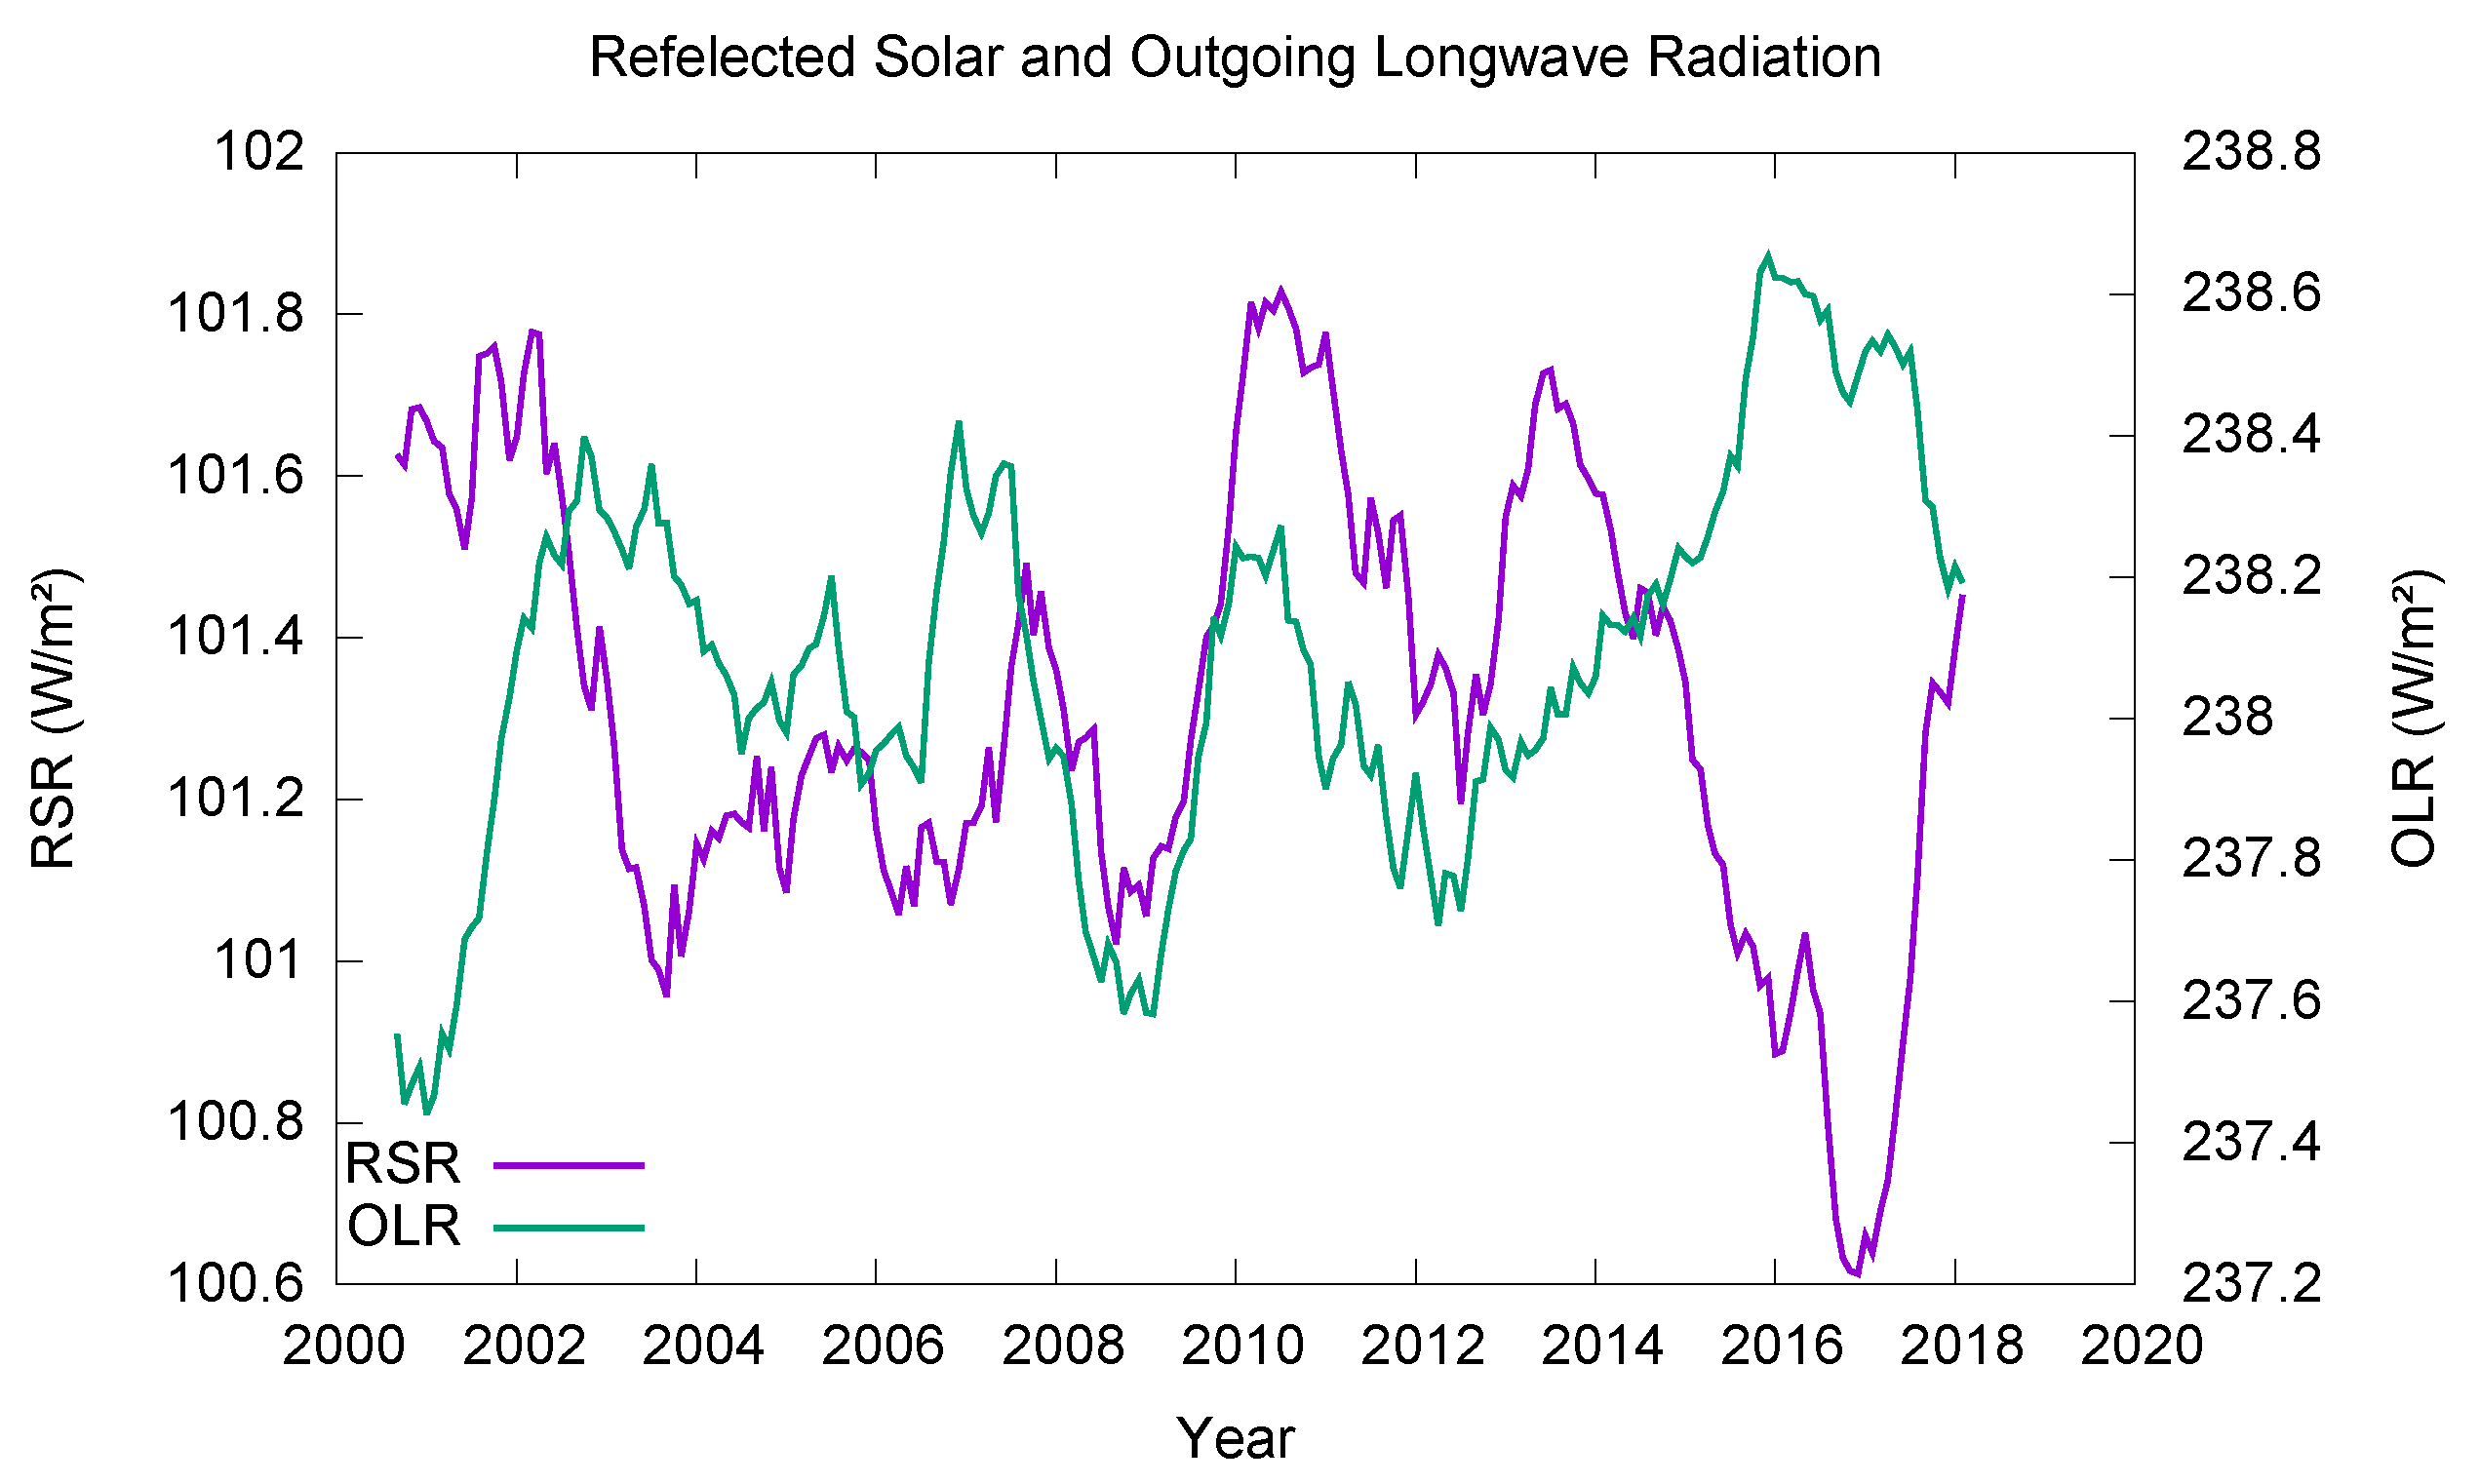
Figure 12 shows the yearly running means of the outgoing earth radiation terms, namely the RSR (purple curve) and the OLR (green curve) as measured by CERES for the period 2000–2018. Following [
14], the OLR is anchored to a value of 238 W/m
2 over the period 2005–2014.
The OLR and RSR are anti-correlated, with a correlation coefficient of −43%.
The OLR shows an increasing trend of 0.23 ± 0.03 (1 ) W/m2dec.
The RSR shows a decreasing trend of −0.14 ± 0.04 (1
) W/m
2dec. If the RSR ageing correction uncertainty (
Section 4) is taken into account the uncertainty becomes ± 0.11 W/m
2dec.
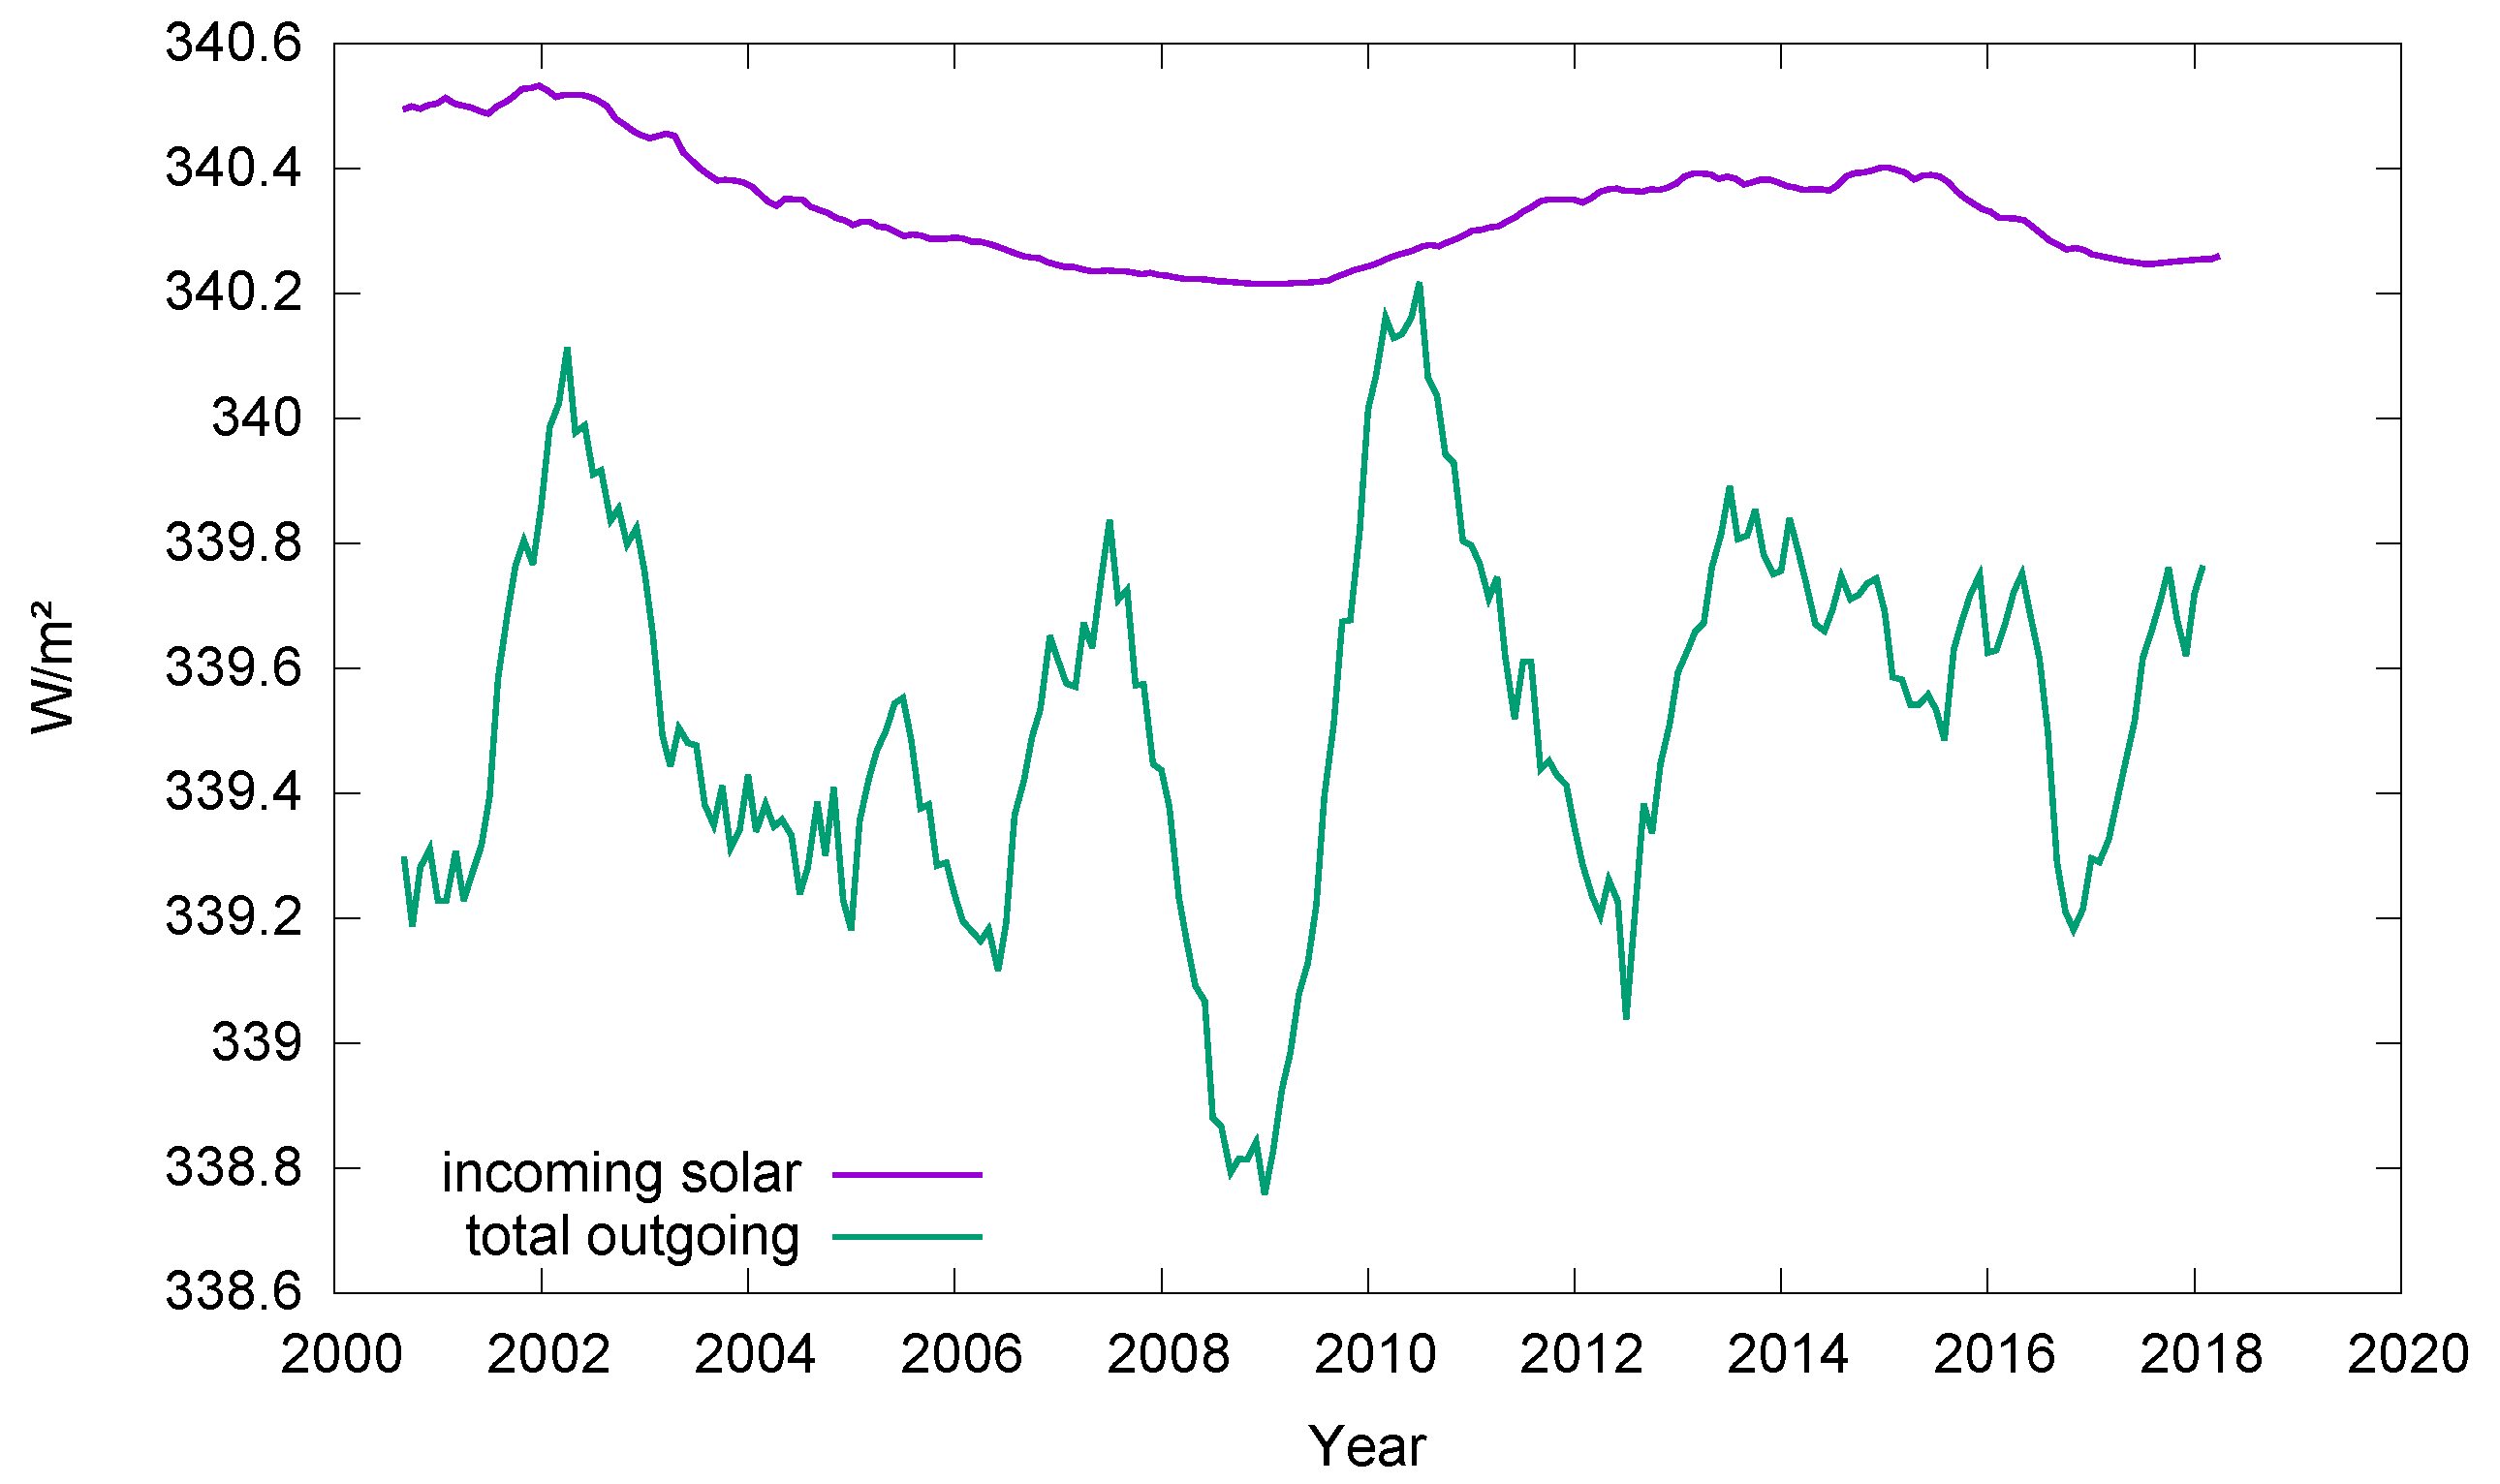
Figure 13 shows the monthly running annual mean incoming solar radiation following [
5] (purple curve) and the global mean TOR (green curve) for the period 2000–2018. The TOR is obtained as the sum of the OLR and the RSR.
The incoming solar radiation shows a trend of −0.07 ± 0.01 (1 ) W/m2dec.
The TOR shows a trend of 0.08 ± 0.04 (1
) W/m
2dec. If the RSR ageing correction uncertainty (
Section 4) is taken into account the uncertainty becomes ± 0.11 W/m
2dec. This means that due to a partial cancellation of the opposing trends of the OLR and the RSR, the TOR does not have a significant trend.
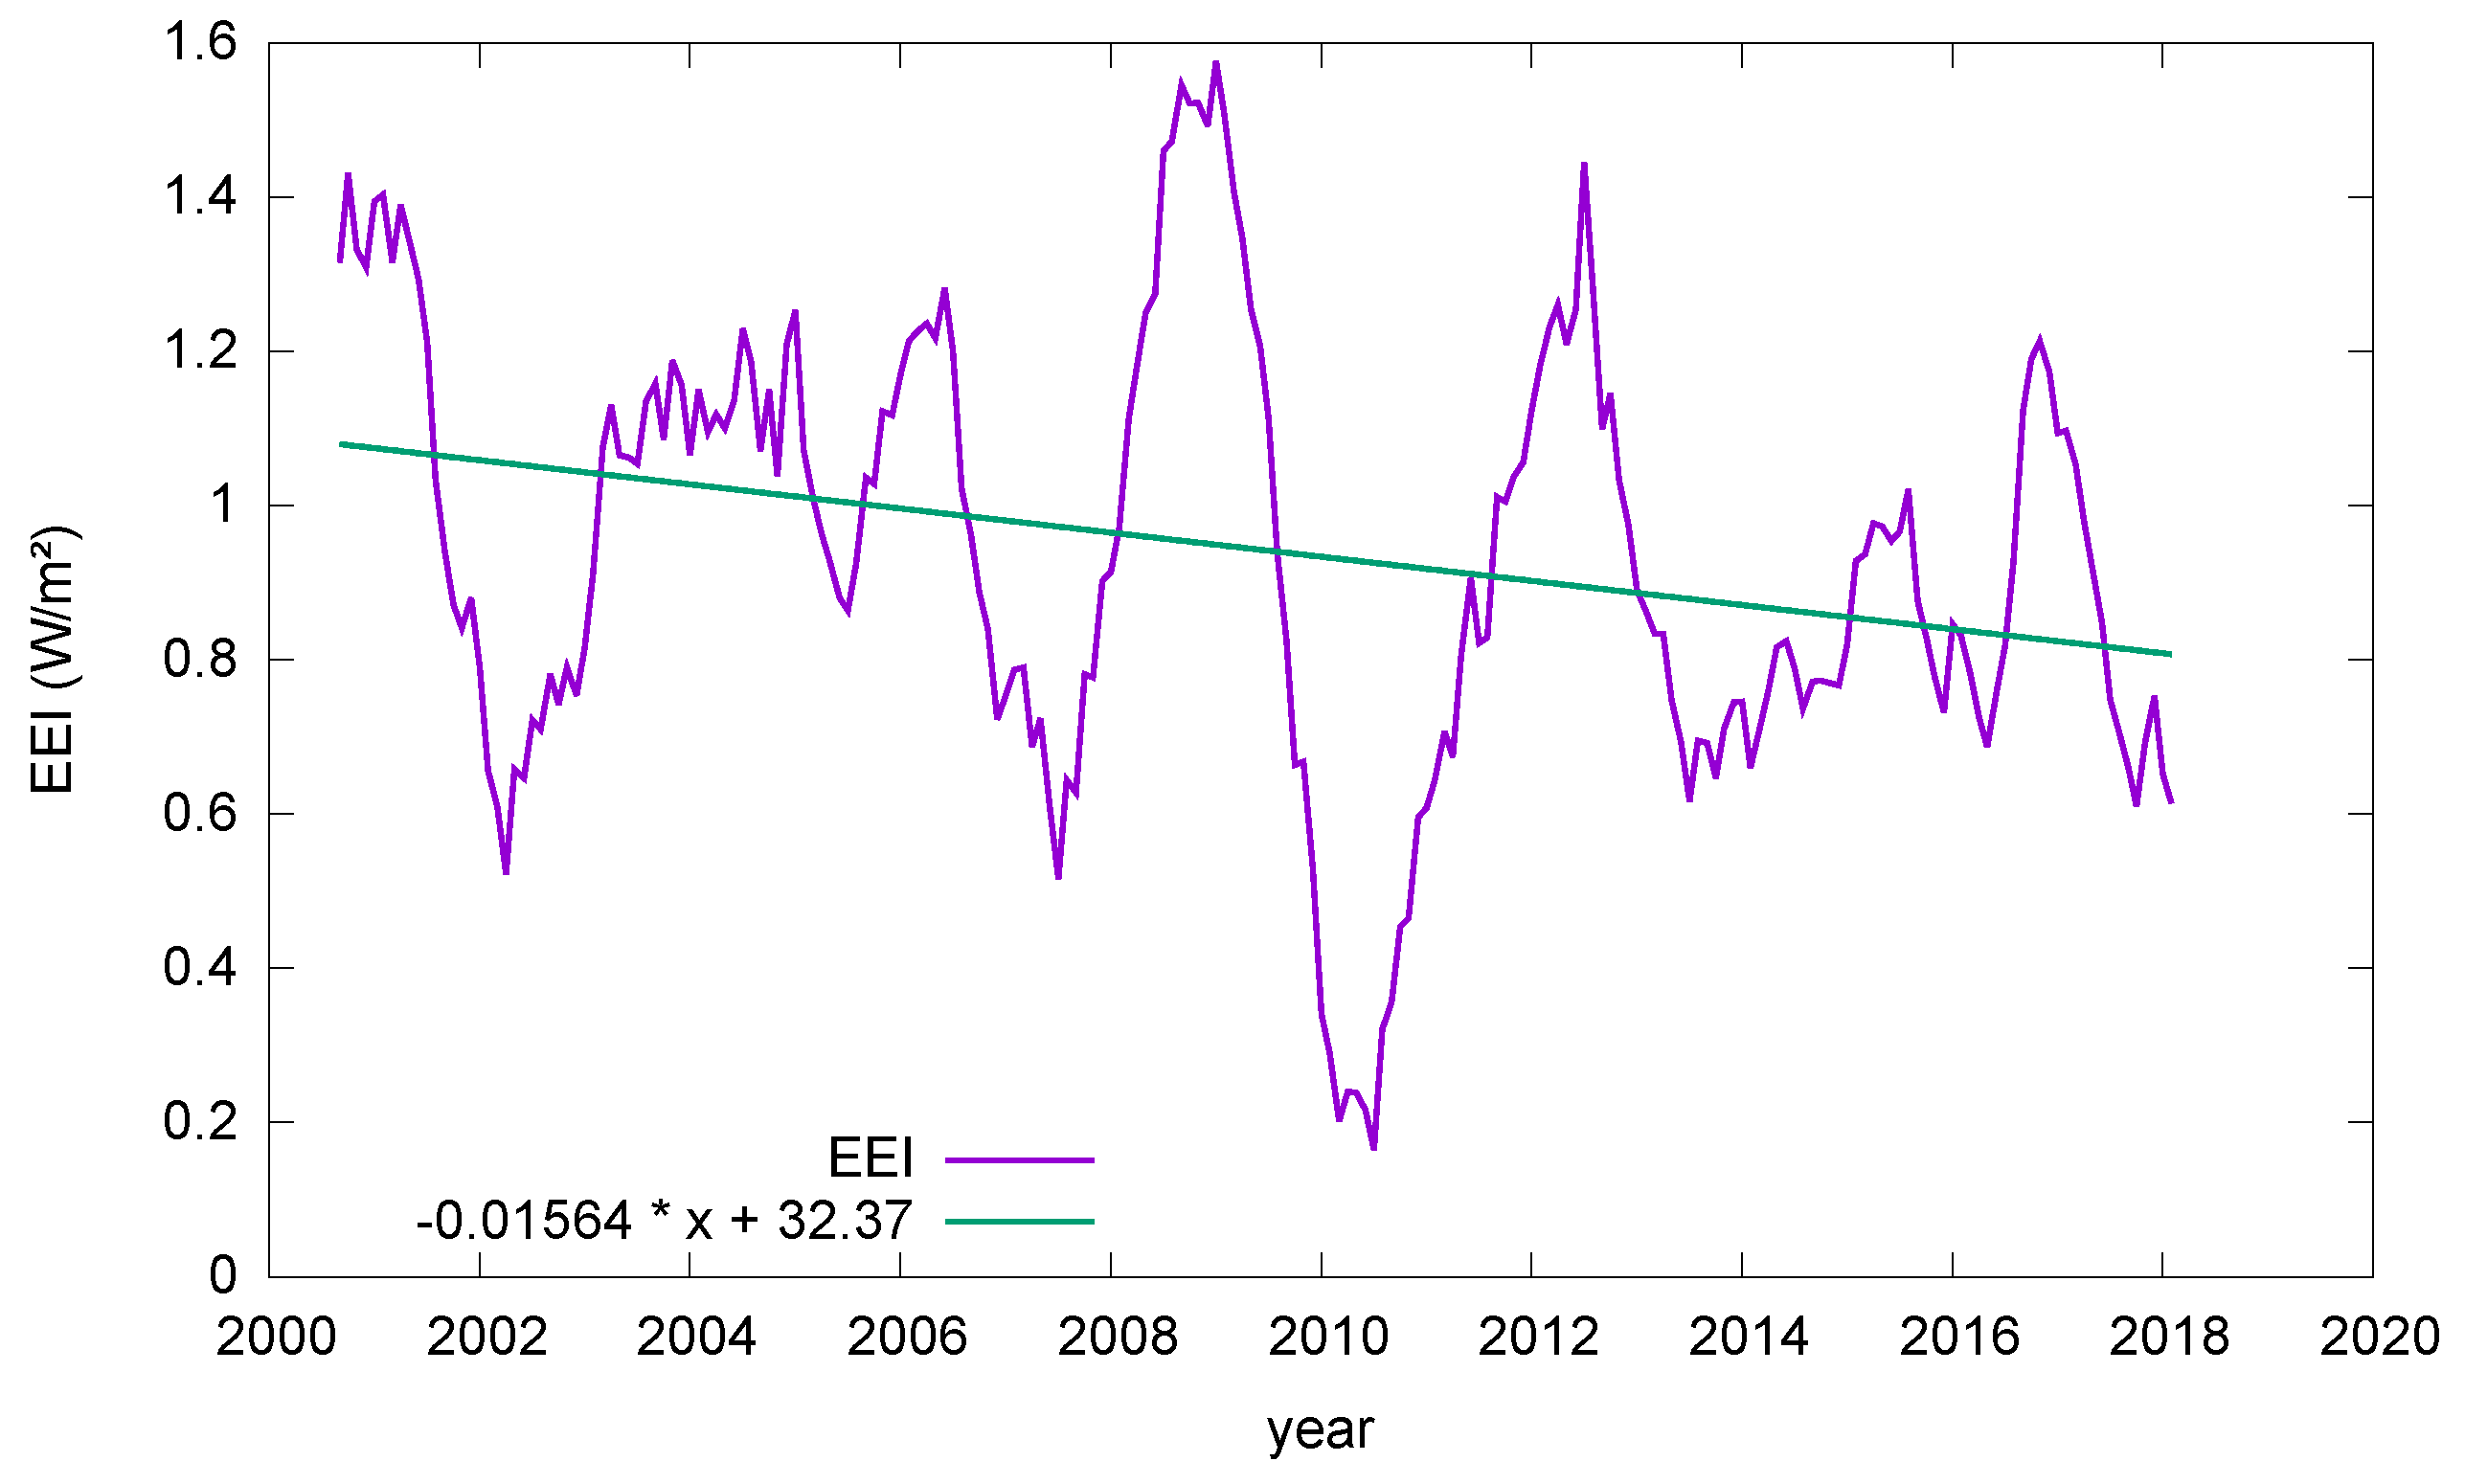
Figure 14 shows the monthly running annual mean EEI for the period 2000–2018. The EEI is obtained as the difference between the incoming solar radiation and the TOR.
The EEI shows a trend of −0.16 ± 0.03 (1
) W/m
2dec. If the RSR ageing correction uncertainty (
Section 4) is taken into account the uncertainty becomes ±0.11 W/m
2dec. This means that the EEI seems to have a decreasing trend.
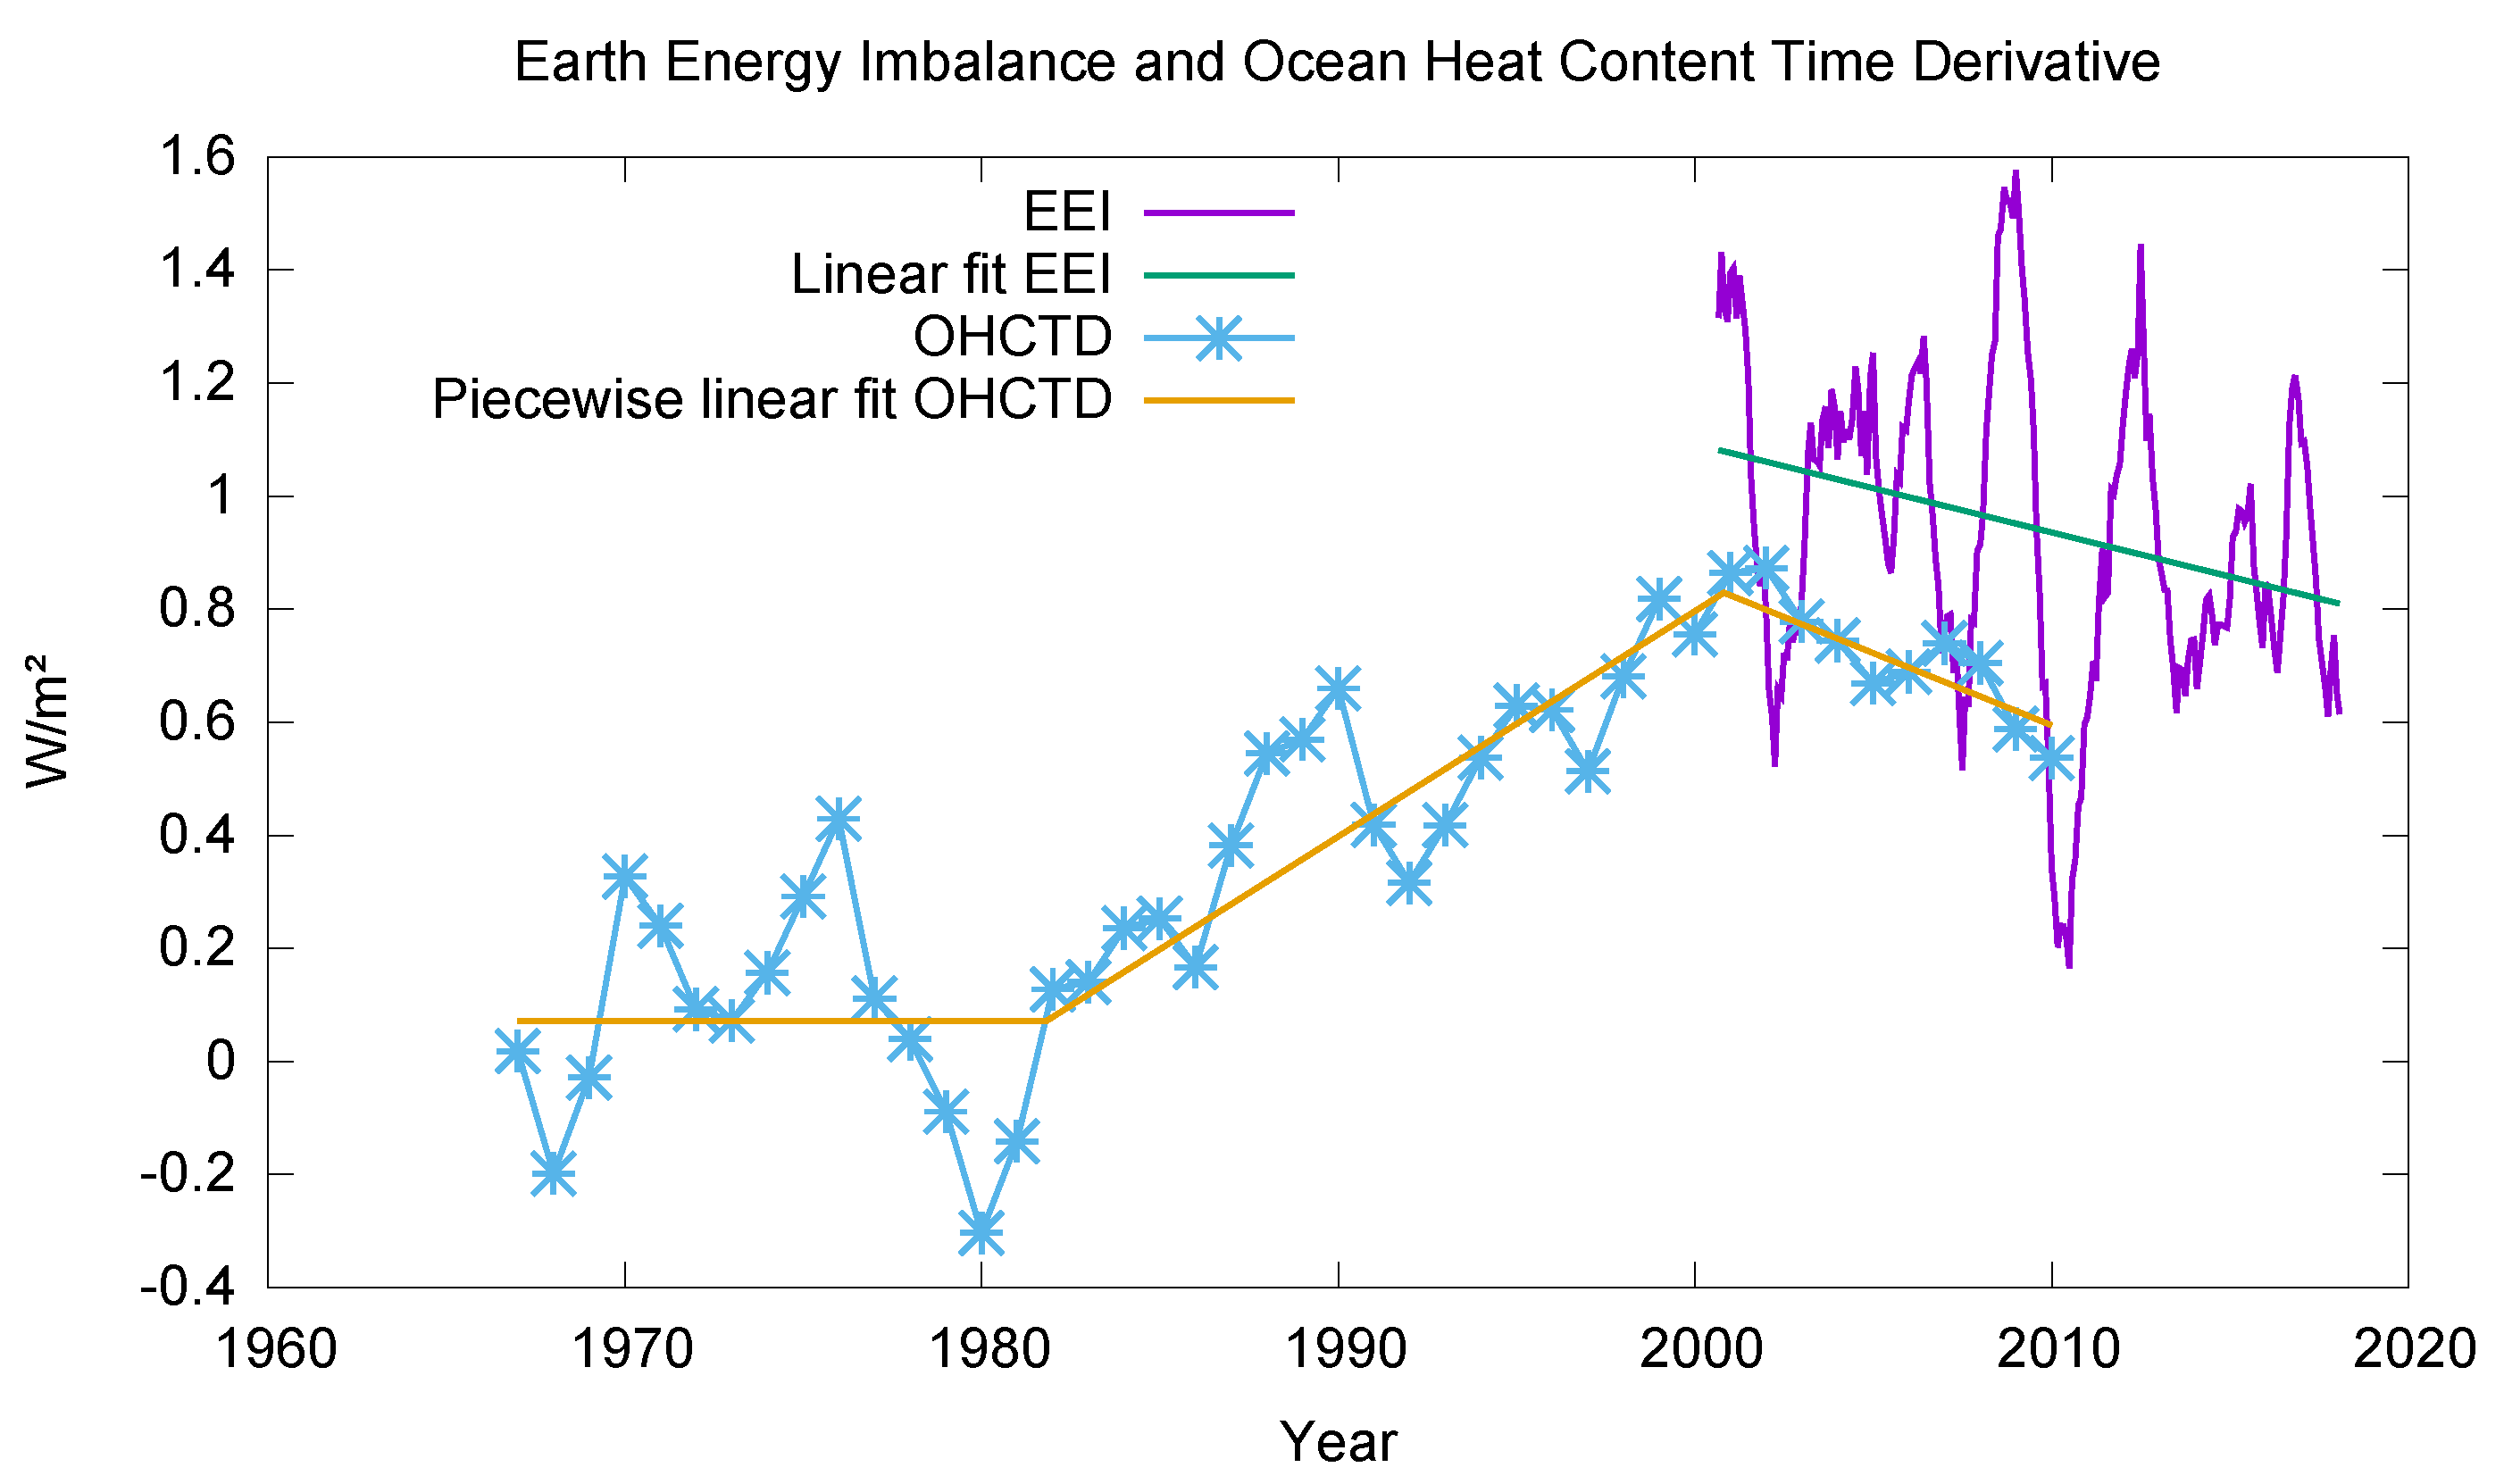
At first sight it seems surprising that the EEI is decreasing during a period of continued greenhouse gas emission. As an extra validation of our results, in
Figure 15 we compare the EEI (purple curve) with the OHCTD (blue curve). The Ocean Heat Content (OHC) from 1960 to 2015 is obtained from [
15], from this the OHCTD from 1967 to 2010 is computed as the yearly increase of the 10 year running mean of the OHC. A linear fit to the EEI is shown as the green line. A piecewise linear fit to the OHCTD is shown as the orange curve.
Due to the high ocean heat content, it is expected that the EEI and the OHCTD are nearly equal. From
Figure 15, we can discriminate three phases in the OHCTD from 1967 to 2010:
Prior to 1982, the mean value of the OHCTD is 0.071 ± 0.05 (1 ) W/m2, the trend is −0.07 ± 0.1 (1 ) W/m2dec.
From 1982 to 2000, the OHCTD is increasing with a trend of 0.32 ± 0.05 (1 ) W/m2dec.
After 2000, the OHCTD is decreasing with a trend of −0.26 ± 0.06 (1 ) W/m2dec.
Within their uncertainties, the trends after 2000 of the EEI (−0.16 ± 0.11 W/m2dec) and of the OHCTD (−0.26 ± 0.06 (1 ) W/m2dec), agree. This again adds extra confidence to our results.
7. Discussion and Conclusions
We have analysed the long term RSR change as measured in the CERES EBAF Edition 4.0 product over the period 2000–2018.
We have analysed the changes of the all-sky and the clear-sky regional RSR from the period 08/2000–07/2009 to the period 08/2009–07/2018. For the clear-sky case, see
Figure 2, the dominant changes are a darkening (blue color in the Arctic on
Figure 2) due to Arctic sea ice melting and a regional darkening/brightening (blue/red colors near Antarctica in
Figure 2) due to regional melting/growing of sea ice.
An examination of the histogram of regional relative changes of the RSR (
Figure 6), reveals a non zero change mode for both the all-sky and the clear-sky cases. We argue that the most likely interpretation is a residual ageing of the CERES RSR measurement, which is estimated to be −0.5 ± 0.11%/dec.
In the polar regions, the variations of the clear-sky RSR are well correlated with the variations of the SIE. Over the 2000–2018 period the Arctic clear-sky RSR shows a decreasing trend of −0.13 W/m
2dec. Over the 2000–2014 period the Antarctic clear-sky RSR shows an increasing trend of 0.08 W/m
2dec, followed by a sharp decrease of around −0.4 W/m
2 in the 2014–2017 period. Prior to 2014, the polar clear-sky RSR is relatively flat due to a partial compensation of the Arctic decrease (see
Figure 8) and the Antarctic increase (see
Figure 9). The correlation of the polar clear-sky RSR with the global clear-sky RSR is relatively high (80%), indicating that the SIE changes are an important feature for the global clear-sky RSR variations. The correlation of the polar clear-sky RSR with the global all-sky RSR is relatively low (55%), indicating that the clear-sky changes are not dominant over the cloud effect changes.
The OLR and RSR variations are anticorrelated, and have opposing trends. The OLR is rising with a trend of 0.23 W/m
2dec, in agreement with global temperature rise. The rise of temperature and OLR was relatively modest in the 2000-2018 period, compared to the preceding period [
14,
16]. This appears to be linked to an increased uptake of energy in the deep ocean [
15]. The RSR is decreasing with a trend of −0.14 ± 0.11 W/m
2dec. The TOR shows an insignificant trend of 0.08 ± 0.11 W/m
2dec. The EEI shows a trend of −0.16 ± 0.11 W/m
2dec. The decreasing trend in EEI is in agreement with a decreasing trend of −0.26 ± 0.06 W/m
2dec in the OHCTD after 2000.
The OHCTD over the period 1960–2015 shows three different regimes, with low OHCTD prior to 1982, rising OHCTD from 1982 to 2000, and decreasing OHCTD since 2000. These OHCTD periods correspond to periods of slow/rapid/slow surface temperature rise [
16,
17], to periods of strong La Ninas/El Ninos/La Ninas [
14,
18], and to periods of increasing/decreasing/increasing aerosol loading [
19,
20]. A better understanding of these past and ongoing climate changes is a necessary condition for our ability to make a skillfull prediction of future climate change.
Author Contributions
Conceptualization, S.D.; methodology, S.D.; software, S.D.; validation, S.D. and N.C.; formal analysis, S.D.; investigation, S.D.; resources, S.D.; data curation, S.D.; writing–original draft preparation, S.D.; writing–review and editing, S.D. and J.C.; visualization, S.D.; supervision, S.D.; project administration, S.D.; funding acquisition, S.D.
Funding
This research received no external funding.
Acknowledgments
This paper was written in the context of projects funded by the Belgian Science Policy Office Belspo, Eumetsat, ESA and the European Commission. Data was provided by NASA.
Conflicts of Interest
The authors declare no conflict of interest.
References
- IPCC. The Physical Science Basis; IPCC: Geneva, Switzerland, 2013. [Google Scholar] [CrossRef]
- Arhenius, S. On the influence of carbonic acid in the air upon the temperature of the ground. Phil. Mag. J. Sci. 1896, 541, 237–276. [Google Scholar] [CrossRef]
- Hansen, J.; Sato, M.; Kharecha, P.; von Schuckmann, K. Earth’s energy imbalance and implications. ACP 2011, 11, 13421–13449. [Google Scholar] [CrossRef]
- Dewitte, S.; Nevens, S. The total solar irradiance climate data record. ApJ 2016, 830, 25. [Google Scholar] [CrossRef]
- Dewitte, S.; Clerbaux, N. Measurement of the Earth Radiation Budget at the top of atmosphere—A review. Rem. Sens. 2017, 9, 1143. [Google Scholar] [CrossRef]
- Wielicki, B.; Barkstrom, B.; Harrison, E.; Lee, R.; Smith, G.; Cooper, J. Clouds and the Earth’s Radiant Energy System (CERES): An earth observing experiment. BAMS 1996, 77, 853–868. [Google Scholar] [CrossRef]
- Loeb, N.; Doelling, D.; Wang, H.; Su, W.; Nguyen, C.; Corbett, J.; Liang, L.; Mitrescu, C.; Rose, F.; Kato, S. Clouds and the Earth’s Radiant Energy System (CERES) Energy Balanced and Filled (EBAF) Top-of-Atmosphere (TOA) edition-4.0 data product. J. Clim. 2018, 31, 895–918. [Google Scholar] [CrossRef]
- Daniels, J.; Smith, G.; Priestley, K.; Thomas, S. Using lunar observations to validate in-flight calibration of the Clouds and Eaerth’s Radiant Energy System instruments. IEEE TGARS 2015, 53, 5110–5116. [Google Scholar]
- Corbett, J.; Loeb, N. On the relative stability of CERES reflected shortwave anbd MISR and MODIS visible radiance measurements during the Terra satellite mission. JGR 2015, 120, 11608–11616. [Google Scholar] [CrossRef]
- Herschbach, H. Operational Global Reanalysis: Progress, Future Directions and Synergies with NWP; ERA Report 27; European Centre for Medium Range Weather Forecasts: Reading, UK, 2018. [Google Scholar] [CrossRef]
- Trenberth, K.; Fasullo, J.; Von Schuckmann, K.; Cheng, L. Insights into earth’s energy imbalance from multiple sources. J. Clim. 2016, 29, 7495–7505. [Google Scholar] [CrossRef]
- Hartmann, D.; Ceppi, P. Trends in the CERES dataset, 2000–2013: The effects of sea ice and jet shifts and comparison to climate models. J. Clim. 2014, 27, 2444–2456. [Google Scholar] [CrossRef]
- Cavalieri, D.; Parkinson, C.; Vinnikov, K. 30-year satellite record reveals contrasting Arctic and Antarctic decadal sea ice variability. GRL 2003, 18, 1970. [Google Scholar] [CrossRef]
- Dewitte, S.; Clerbaux, N. Decadal changes of Earth’s Outgoing Longwave Radiation. Remote Sens. 2018, 10, 1539. [Google Scholar] [CrossRef]
- Cheng, L.; Trenberth, K.; Fasullo, J.; Boyer, T.; Abraham, J.; Zhu, J. Improved estimates of ocean heat content from 1960 to 2015. Sci. Adv. 2017, 3, e1601545. [Google Scholar] [CrossRef] [PubMed]
- Trenberth, K.; Fasullo, J. An apparant hiatus in global warming? Earth’s Future 2013, 1, 19–32. [Google Scholar] [CrossRef]
- Folland, C.; Boucher, O.; Colman, A.; Parker, D. Causes of irregularities in trends of global mean surface temperature since the late 19th century. Sci. Adv. 2018, 4, eaao5297. [Google Scholar] [CrossRef] [PubMed] [Green Version]
- Kosaka, Y.; Xie, S. Recent global warming hiatus tied to equatorial Pacific surface cooling. Nature 2013, 501, 403–407. [Google Scholar] [CrossRef] [PubMed]
- Boucher, O. Clouds and Aerosols. Climate Change 2013: The Physical Science Basis; Cambridge University Press: Cambridge, UK, 2013; pp. 571–657. [Google Scholar]
- Stevens, B. Rethinking the lower bound on aerosol radiative forcing. J. Clim. 2015, 28, 4794–4819. [Google Scholar] [CrossRef]
Figure 1.
2000–2018 mean all-sky CERES RSR. The scale is in W/m2.
Figure 1.
2000–2018 mean all-sky CERES RSR. The scale is in W/m2.
Figure 2.
2000–2018 mean clear-sky CERES RSR. The scale is in W/m2.
Figure 2.
2000–2018 mean clear-sky CERES RSR. The scale is in W/m2.
Figure 3.
2000–2018 mean cloud effect CERES RSR. The scale is in W/m2.
Figure 3.
2000–2018 mean cloud effect CERES RSR. The scale is in W/m2.
Figure 4.
All-sky RSR for period 08/2009–07/2018 minus 08/2000–07/2009. The scale is in W/m2.
Figure 4.
All-sky RSR for period 08/2009–07/2018 minus 08/2000–07/2009. The scale is in W/m2.
Figure 5.
Clear-sky RSR for period 08/2009–07/2018 minus 08/2000–07/2009. The scale is in W/m2.
Figure 5.
Clear-sky RSR for period 08/2009–07/2018 minus 08/2000–07/2009. The scale is in W/m2.
Figure 6.
Histogram of relative changes from 08/2000–07/2009 to 08/2009–07/2018 of the all-sky (green curve) and clear-sky (purple curve) regional 1× 1 Ceres Ebaf 4.0 RSR.
Figure 6.
Histogram of relative changes from 08/2000–07/2009 to 08/2009–07/2018 of the all-sky (green curve) and clear-sky (purple curve) regional 1× 1 Ceres Ebaf 4.0 RSR.
Figure 7.
2000–2018 variation in RSR. Purple curve: ERA 5 estimates. Green curve: actual CERES measurements. Blue curve: drift corrected CERES version.
Figure 7.
2000–2018 variation in RSR. Purple curve: ERA 5 estimates. Green curve: actual CERES measurements. Blue curve: drift corrected CERES version.
Figure 8.
Arctic clear-sky RSR compared to Arctic SIE. Purple curve, left scale: Clear-sky RSR contribution of zone from 60 N to 90 N. Green curve, right scale: Arctic SIE.
Figure 8.
Arctic clear-sky RSR compared to Arctic SIE. Purple curve, left scale: Clear-sky RSR contribution of zone from 60 N to 90 N. Green curve, right scale: Arctic SIE.
Figure 9.
Antarctic clear-sky RSR compared to Antarctic SIE. Purple curve, left scale: Clear-sky RSR contribution of zone from 90 S to 60 S. Green curve, right scale: Antarctic SIE.
Figure 9.
Antarctic clear-sky RSR compared to Antarctic SIE. Purple curve, left scale: Clear-sky RSR contribution of zone from 90 S to 60 S. Green curve, right scale: Antarctic SIE.
Figure 10.
Purple curve, left scale: Global clear-sky RSR. Green curve, right scale: Polar clear-sky RSR.
Figure 10.
Purple curve, left scale: Global clear-sky RSR. Green curve, right scale: Polar clear-sky RSR.
Figure 11.
Purple curve, left scale: Global all-sky RSR. Green curve, right scale: Polar clear-sky RSR.
Figure 11.
Purple curve, left scale: Global all-sky RSR. Green curve, right scale: Polar clear-sky RSR.
Figure 12.
Purple curve: RSR. Green curve: OLR.
Figure 12.
Purple curve: RSR. Green curve: OLR.
Figure 13.
2000–2018 variation in incoming solar (purple curve) and total outgoing (green curve) radiation.
Figure 13.
2000–2018 variation in incoming solar (purple curve) and total outgoing (green curve) radiation.
Figure 14.
2000–2018 variation of Earth Energy Imbalance.
Figure 14.
2000–2018 variation of Earth Energy Imbalance.
Figure 15.
Purple curve: running yearly mean EEI. Green line: linear fit to running yearly mean EEI. Blue curve: 10 year running mean OHCTD. Orange curve: piecewise linear fit to OHCTD.
Figure 15.
Purple curve: running yearly mean EEI. Green line: linear fit to running yearly mean EEI. Blue curve: 10 year running mean OHCTD. Orange curve: piecewise linear fit to OHCTD.
© 2019 by the authors. Licensee MDPI, Basel, Switzerland. This article is an open access article distributed under the terms and conditions of the Creative Commons Attribution (CC BY) license (http://creativecommons.org/licenses/by/4.0/).


