1. Introduction
Fire is an important disturbance factor in ecosystems that induce land-cover modification and change [
1]. Under climate change conditions, drought severity may trigger tough fire regimes, in terms of the number and dimension of fire events [
2]. Fire represents a significant source of gas and aerosols worldwide [
3]. The large amounts of smoke emitted from fires impact air quality and affect global warming due to rising trace gas emissions [
4].
Satellite data play a major role in supporting knowledge about fire severity by delivering rapid information to map fire-damaged areas in a precise and prompt way. Accurate and rapid mapping of fire-damaged areas is fundamental to support fire management, account for environmental loss, define planning strategies, and interpret cause–effect relations of post-hazard wildfire dynamics, as the specific case of vegetation restoration dynamics [
5]. From a forest management perspective, emergency maps help forest stakeholders to minimize the potentially harmful effects of excessive post-fire erosion [
6], while estimating burn severity may help to identify areas that need to be recovered [
7]. Fire severity is a qualitative measure of the immediate effects of fire on the non-anthropic ecosystem, related to the extent of mortality and survival of plant and animal life both aboveground and belowground and to the loss of organic matter [
8].
Optical remote sensing tools have proven to be useful in the development of procedures to accurately estimate fire-affected areas and burn severity, in support of forest fire prevention, assessment, and monitoring on global, regional, and local scales [
4]. These techniques have been mainly employed to address three different temporal fire-related phases: pre-fire conditions, burn severity, and post-fire ecosystem responses [
9,
10].
The present research study focuses on rapid post-fire mapping, which represents an indispensable requirement to support fire management, with the scope of identifying the spatial extent of areas affected by wildfires. In general, information about post-fire mapping can be inferred from satellite remotely sensed spectra by applying one of two different approaches: (i) using a single satellite image or (ii) using multitemporal satellite images, usually adopting a combination of pre-fire and post-fire satellite acquisitions.
Several methods have been developed for mapping fire-affected areas, typically defined as burned areas and known as burn scars, from multitemporal or single post-fire satellite images [
11,
12,
13]: supervised classifications (i.e. maximum likelihood, decision tree, and neural network [
14,
15,
16]), linear transformations (i.e., tasseled cap and principal component analysis [
17,
18]), spectral unmixing techniques [
19], object-based classification models [
20,
21], and logistic regression models [
22]. Techniques based on thresholding the spectral indices are widely applied, because they are computationally fast and efficient for detecting fire-affected areas with both medium and high resolution optical satellite data [
19,
23]. Furthermore, normalized spectral indices are efficient in normalizing reflectance values related to specific acquisition conditions. An improvement to the empirical thresholding is the use of multiple spectral indices, which exploit complementary information brought by many different spectral responses. Dealing with multiple spectral indices, the adoption of a synthetic fuzzy score could reduce the effort involved in adapting thresholds from scene to scene, improving reliability when applied to different geographical areas [
11,
24]. More recently a two-phase algorithm [
25,
26], which first identifies clearly burned pixels and then applies a region-growing algorithm, was introduced to reduce pixel misclassification by balancing omission and commission errors. Although fire severity is a measure of fuel consumption [
27], it has been typically identified with the values of fire-related spectral indices. Threshold-based classification of the normalized burn ratio difference (dNBR) [
28] has turned into a methodological reference to obtain burn severity maps [
29]. The adoption of such difference indices from multitemporal observations has been demonstrated to gather better results when compared to a single temporal observation because they rely on the estimation of changing vegetation cover [
2]. The burned area index for Sentinel-2 (BAIS2) [
2], the relative differenced normalized burn ratio (RdNBR) [
30], and the relativized burn ratio (RBR) [
31] have been developed and compared using pre-fire and post-fire satellite acquisitions [
2,
32]. However, no agreement exists so far on which index performs best in the detection of fire-affected areas or in the estimation of fire severity, and no clear standards have been provided to indicate which methodologies can be followed in consideration of specific conditions [
33].
Operational services based on the methodological references for burned area mapping have been developed to provide near-real-time information on wildland fires. Through an activation request, the Copernicus Emergency Management Service (EMS) delivers high spatial resolution wildfire maps generated from satellite data to determine the perimeter of the fires and the distribution of four fire severity levels [
34,
35,
36]. In addition, the EFFIS (European Forest Fire Information System) [
37] supports the services in charge of the protection of forests against fires in the European Union countries with updated and reliable near-real-time information on wildland fires at mid-low spatial resolution based on optical and thermal satellite data.
The high availability of optical satellite data, using, for example, the MultiSpectral Instrument (MSI) sensor aboard Sentinel-2 (S2) satellites, acquiring information at medium-high spatial resolution, should enable the development of more detailed post-fire mapping. The advent of the S2 MSI sensor, equipped with specific spectral bands to record data in the vegetation red-edge spectral domain, which is one of the best radiance-based descriptors of chlorophyll content [
38], allowed for the development and application of new spectral indices to discriminate burn severity. Recent studies have successfully assessed burn severity using S2 data through the comparison of pre-fire and post-fire satellite acquisitions [
2,
32,
34,
39,
40,
41,
42]. Other contributions also showed the suitability of already existing red-edge spectral indices for discriminating burn severity [
39] and highlighted the added value of the S2 MSI spectral band configuration [
41,
43] for burned area detection. Such novel features suggest the potential and need for further research to develop a systematic S2 MSI burned area mapping capability. Furthermore, the fire remote sensing research community has encouraged the exploitation of Earth Observation data available under the Copernicus program for forest fire management [
44]. Despite the high availability of freely available satellite data, there are still very few examples of operational services for medium-high resolution wildfire mapping at the national level based on new satellite sensors.
Key prerequisites to map areas disturbed by wildfires in an accurate and prompt way comprise, in addition to the exploitation of the entire satellite time series, the development of an automated and transferable procedure that is feasible without any a priori information, which leads to the delivery of rapid and updated information about fire-affected areas.
This research study presents a novel procedure for identifying burned areas from dense multitemporal series of S2 data. The procedure has been designed on the basis of state-of-the-art algorithms for burned area detection and tries to cope with issues related to the misclassification of burned pixels, as reported in recent scientific literature. The main purpose of this paper is to introduce a multitemporal approach that could exploit the entire Sentinel-2 time series for the identification of burned areas, and to provide suggestions to address the future development of the procedure in order to refine it with additional methods. To test the effectiveness of the proposed procedure, the 2017 Italy wildfires were considered as a case study. Three spectral indices were used to identify burned areas, and results were compared to Copernicus EMS products.
3. Methods
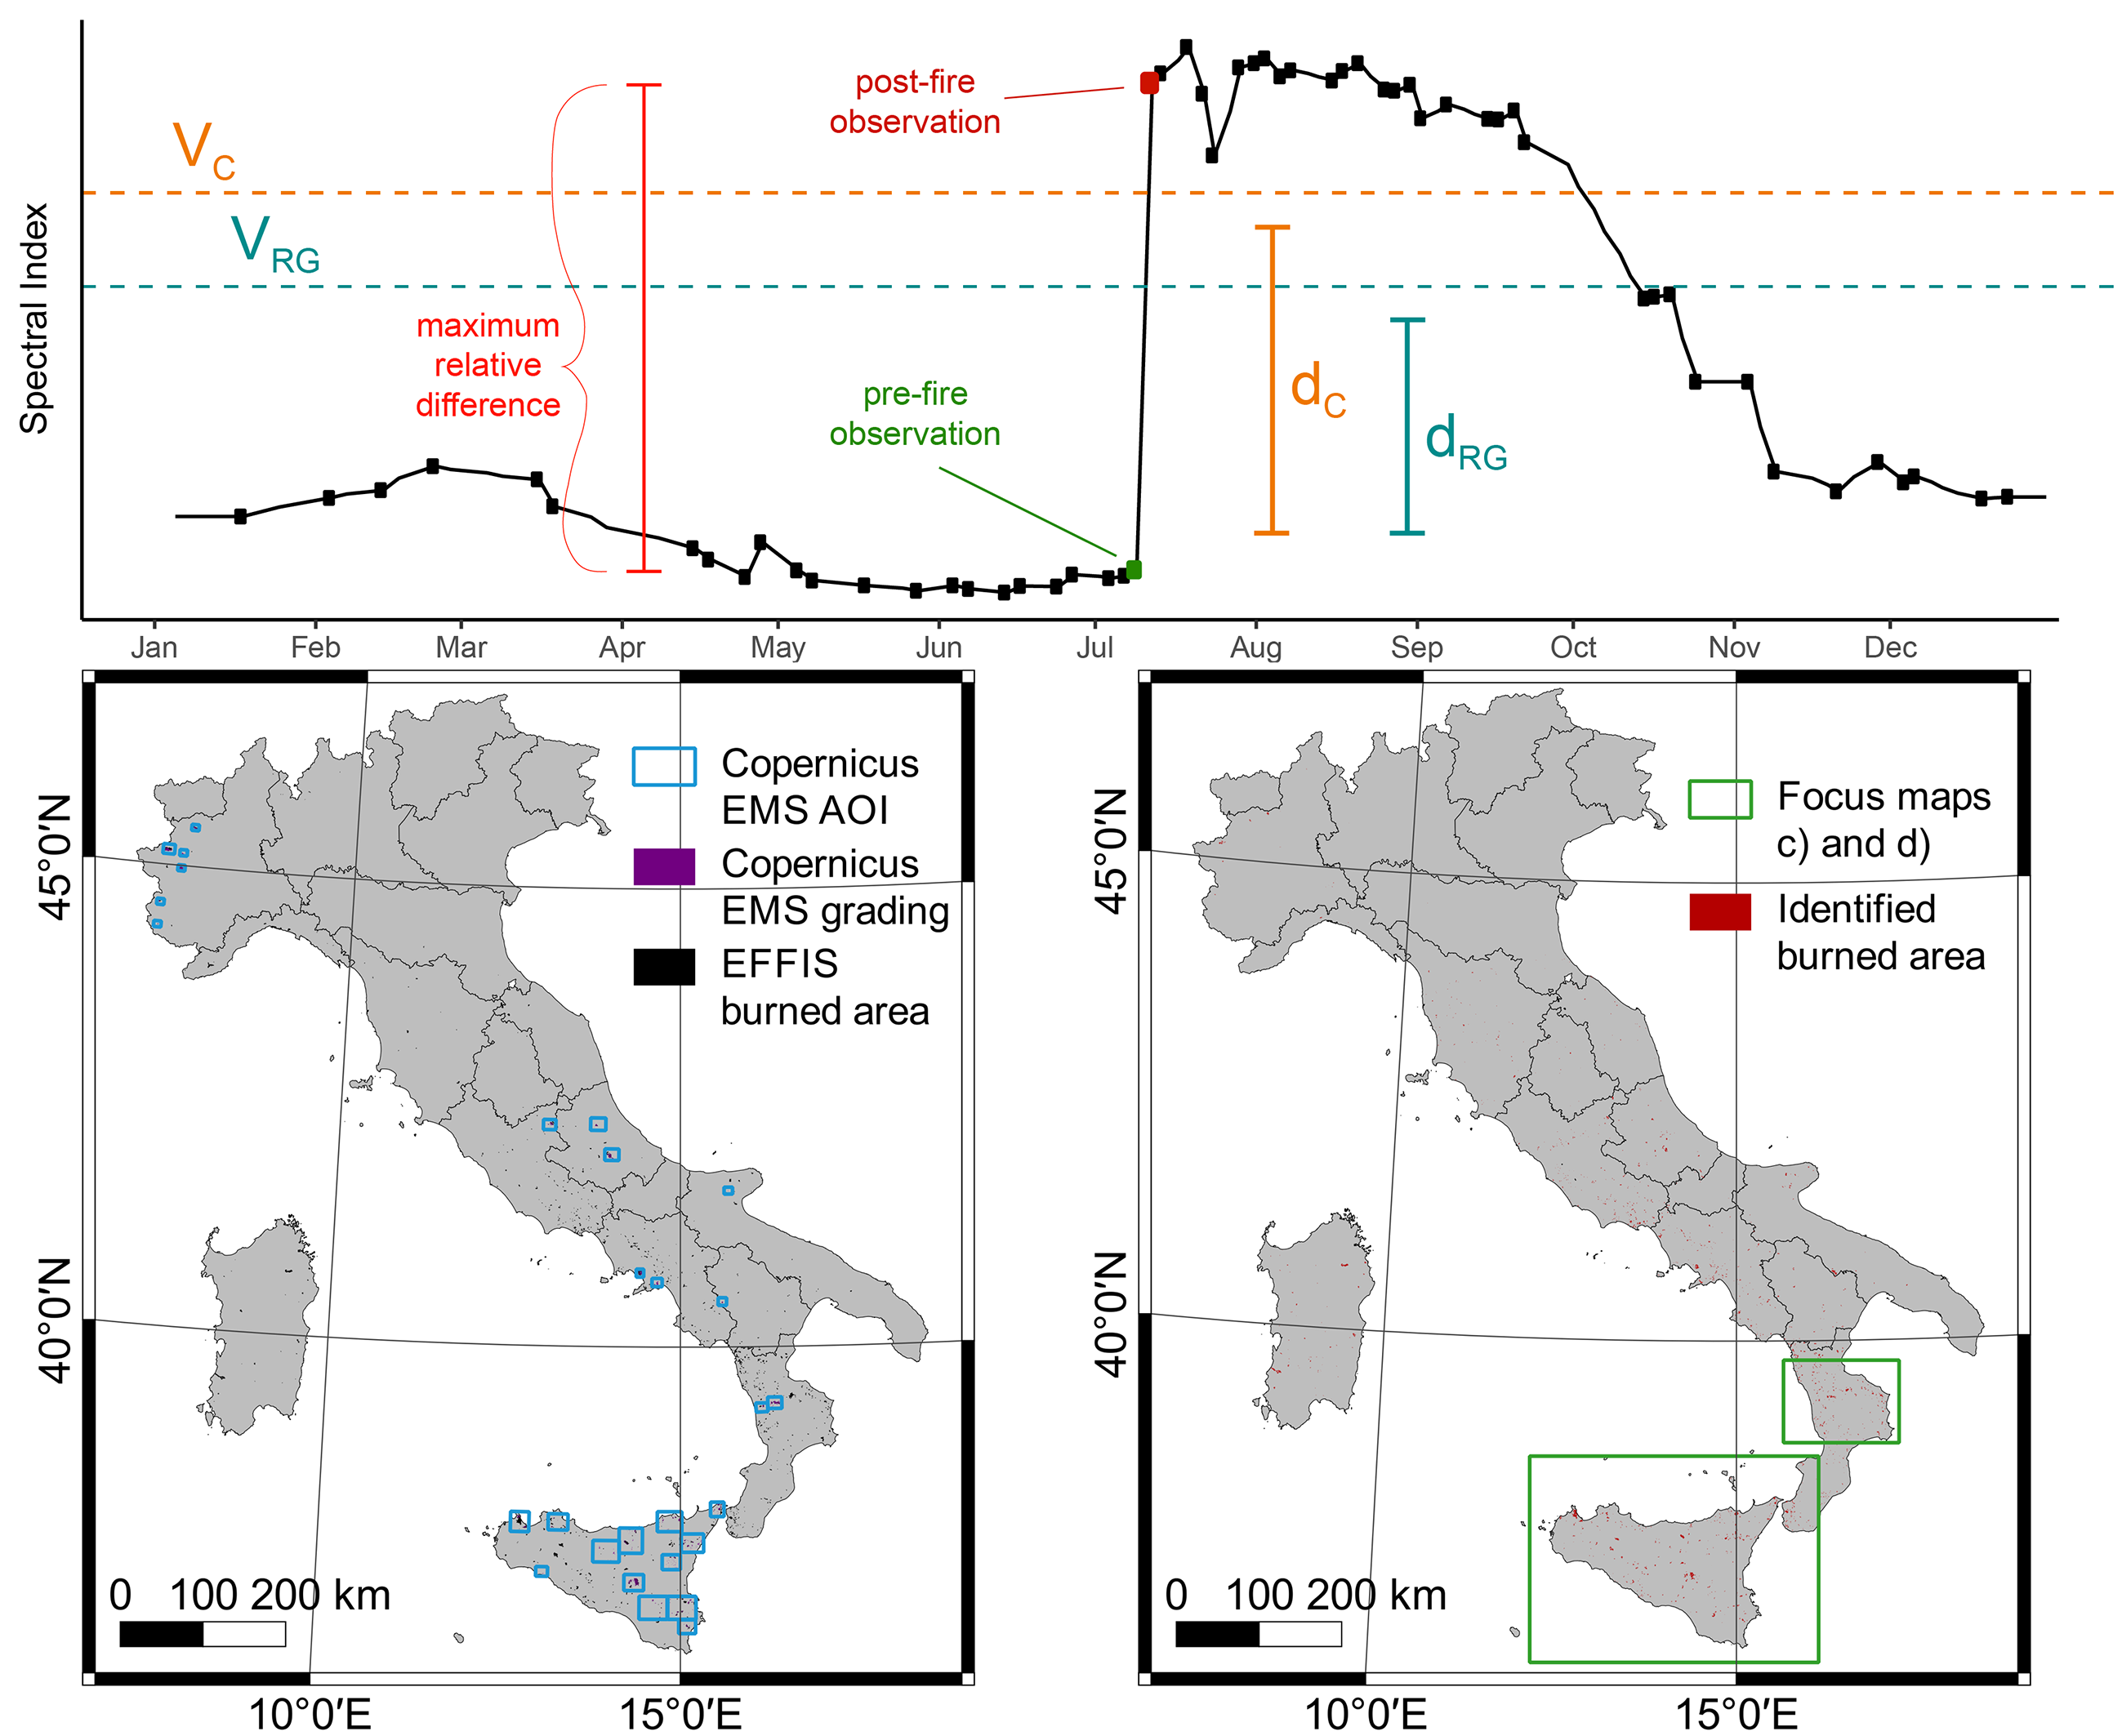
The processing chain (
Figure 1) designed to analyze the S2 data is composed of three main phases: (1) preprocessing; (2) burned area detection procedure; (3) validation.
All the analyses were done using the following free software: SNAP, R-cran (and the libraries “raster,” “ncdf4,” igraph,” Hmisc,” “parallel,” and “doParallel”), GRASS GIS, and Quantum GIS.
3.1. Preprocessing
All the spectral bands contained in the S2 L2A product (
Table S1) were first resampled to a 20 m spatial resolution. In order to mask out pixels from further processing and therefore reduce the impact of commission errors in the classification of burned pixels, a raster mask was generated for each single S2 scene using both the S2 L2A MUSCATE Quality Flags and S2 spectral bands (
Table S2). Pixels corresponding to water areas were masked out using both the “water_mask” quality flag and a modified version of the water pixel formula [
2].
Resampled and masked S2 L2A data were later used to compute spectral indices used for the identification of burned areas, specifically normalized burn ratio (NBR) [
28], BAIS2 (burned area index for Sentinel-2) [
2], and BAIS2α (albedo-weighted burned area index for Sentinel-2) indices. NBR is a spectral index largely adopted for the identification of burned areas and calculated according to Equation (1). Here a slightly different formulation scaled by the value 1 is used in order to make it comparable to the other considered spectral indices.
The BAIS2 index, calculated according to Equation (2), has already been demonstrated to be adequate for the detection of fire-affected areas [
2]. It combines a band ratio in the red-edge spectral domain and aims to describe vegetation properties, with a band ratio similar to NBR, to detect the radiometric response of the short wave infrared (SWIR) spectral domain.
The BAIS2α index, presented in this research study and calculated according to Equation (3), is a modification of the BAIS2 index that uses the surface albedo as scaling information.
Surface albedo α is computed from bottom-of-atmosphere S2 reflectances using a set of pre-computed band weighting coefficients (reported in
Table S1) [
52] determined according to the spectral response function of the MSI sensor. Similar to spectral indices, surface albedo has been seen to lead to discrimination capability for burned areas [
33].
The biophysical processor [
53,
54] was used to compute leaf area index (LAI) from L2A atmospherically corrected data after resampling and masking. Difference in pre-fire and post-fire LAI was later compared to fire severity estimated from spectral indices.
Multitemporal observations of the NBR, BAIS2, BAIS2α, and LAI were finally stacked in a multi-dimensional datacube, generated for each granule.
Since S2 data acquired during the year 2017 belong to different processing baselines, exhibiting variable geolocation spatial accuracy, each pixel revealed a shaky multitemporal profile as a result of the weak spatial coherence [
55]. For this reason, an image co-registration step, performed separately for each S2 granule, was included in the processing chain in order to identify the horizontal linear shift for each observation date and to co-register the multitemporal S2 observations. First, a master S2 image was selected from all the available observations in 2017 according to the following criteria: (i) be acquired by the Sentinel-2A satellite; (ii) belong to the baseline 02.05 (since changes in the processing baseline could modify image geolocation, and baseline 02.05 includes all the S2 data acquired in 2017 from 27 April to 22 October 2017 [
56]); (iii) exhibit the highest number of unmasked pixels. Later, for each single S2 observation, nine combinations of horizontal linear shifts, from 0 to 1 pixel (20 m resolution) in both X and Y axes, were applied in order to generate nine slave images. A high-pass filter was then applied to the master image and the nine slave images, and the Spearman’s rank correlation coefficients between the master image and each slave image were computed. The slave image displaying the highest coefficient was selected as a co-registered image and only used as a reference to identify the horizontal linear shifts. Finally, identified horizontal linear shifts were applied to the stacked products for each corresponding observation date.
3.2. Burned Area Detection Procedure
The procedure for identifying burned areas was designed taking inspiration from a two-phase methodology [
25,
26]. The procedure explores the entire multitemporal profile of the spectral indices to detect abrupt changes produced by wildfire disturbance. It is based on a set of empirical thresholds of spectral indices applied to the multitemporal profiles, mainly performed on a pixel base and then refined using object-based image analysis (OBIA). Each of the three considered spectral indices (NBR, BAIS2, and BAIS2α) is used in combination with its respective difference spectral index (i.e., dNBR, dBAIS2, and dBAIS2α), in order to retrieve burned pixels and a set of
supplementary information (
Table 1).
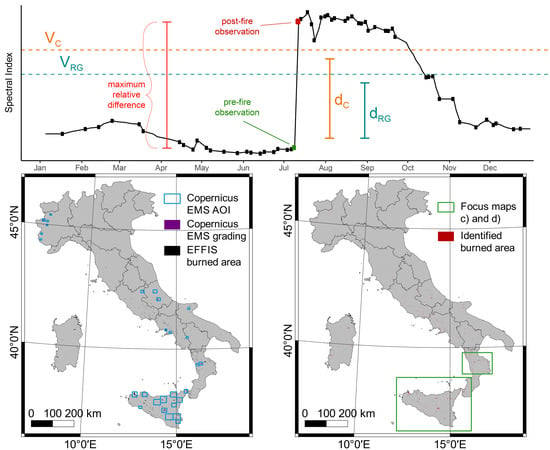
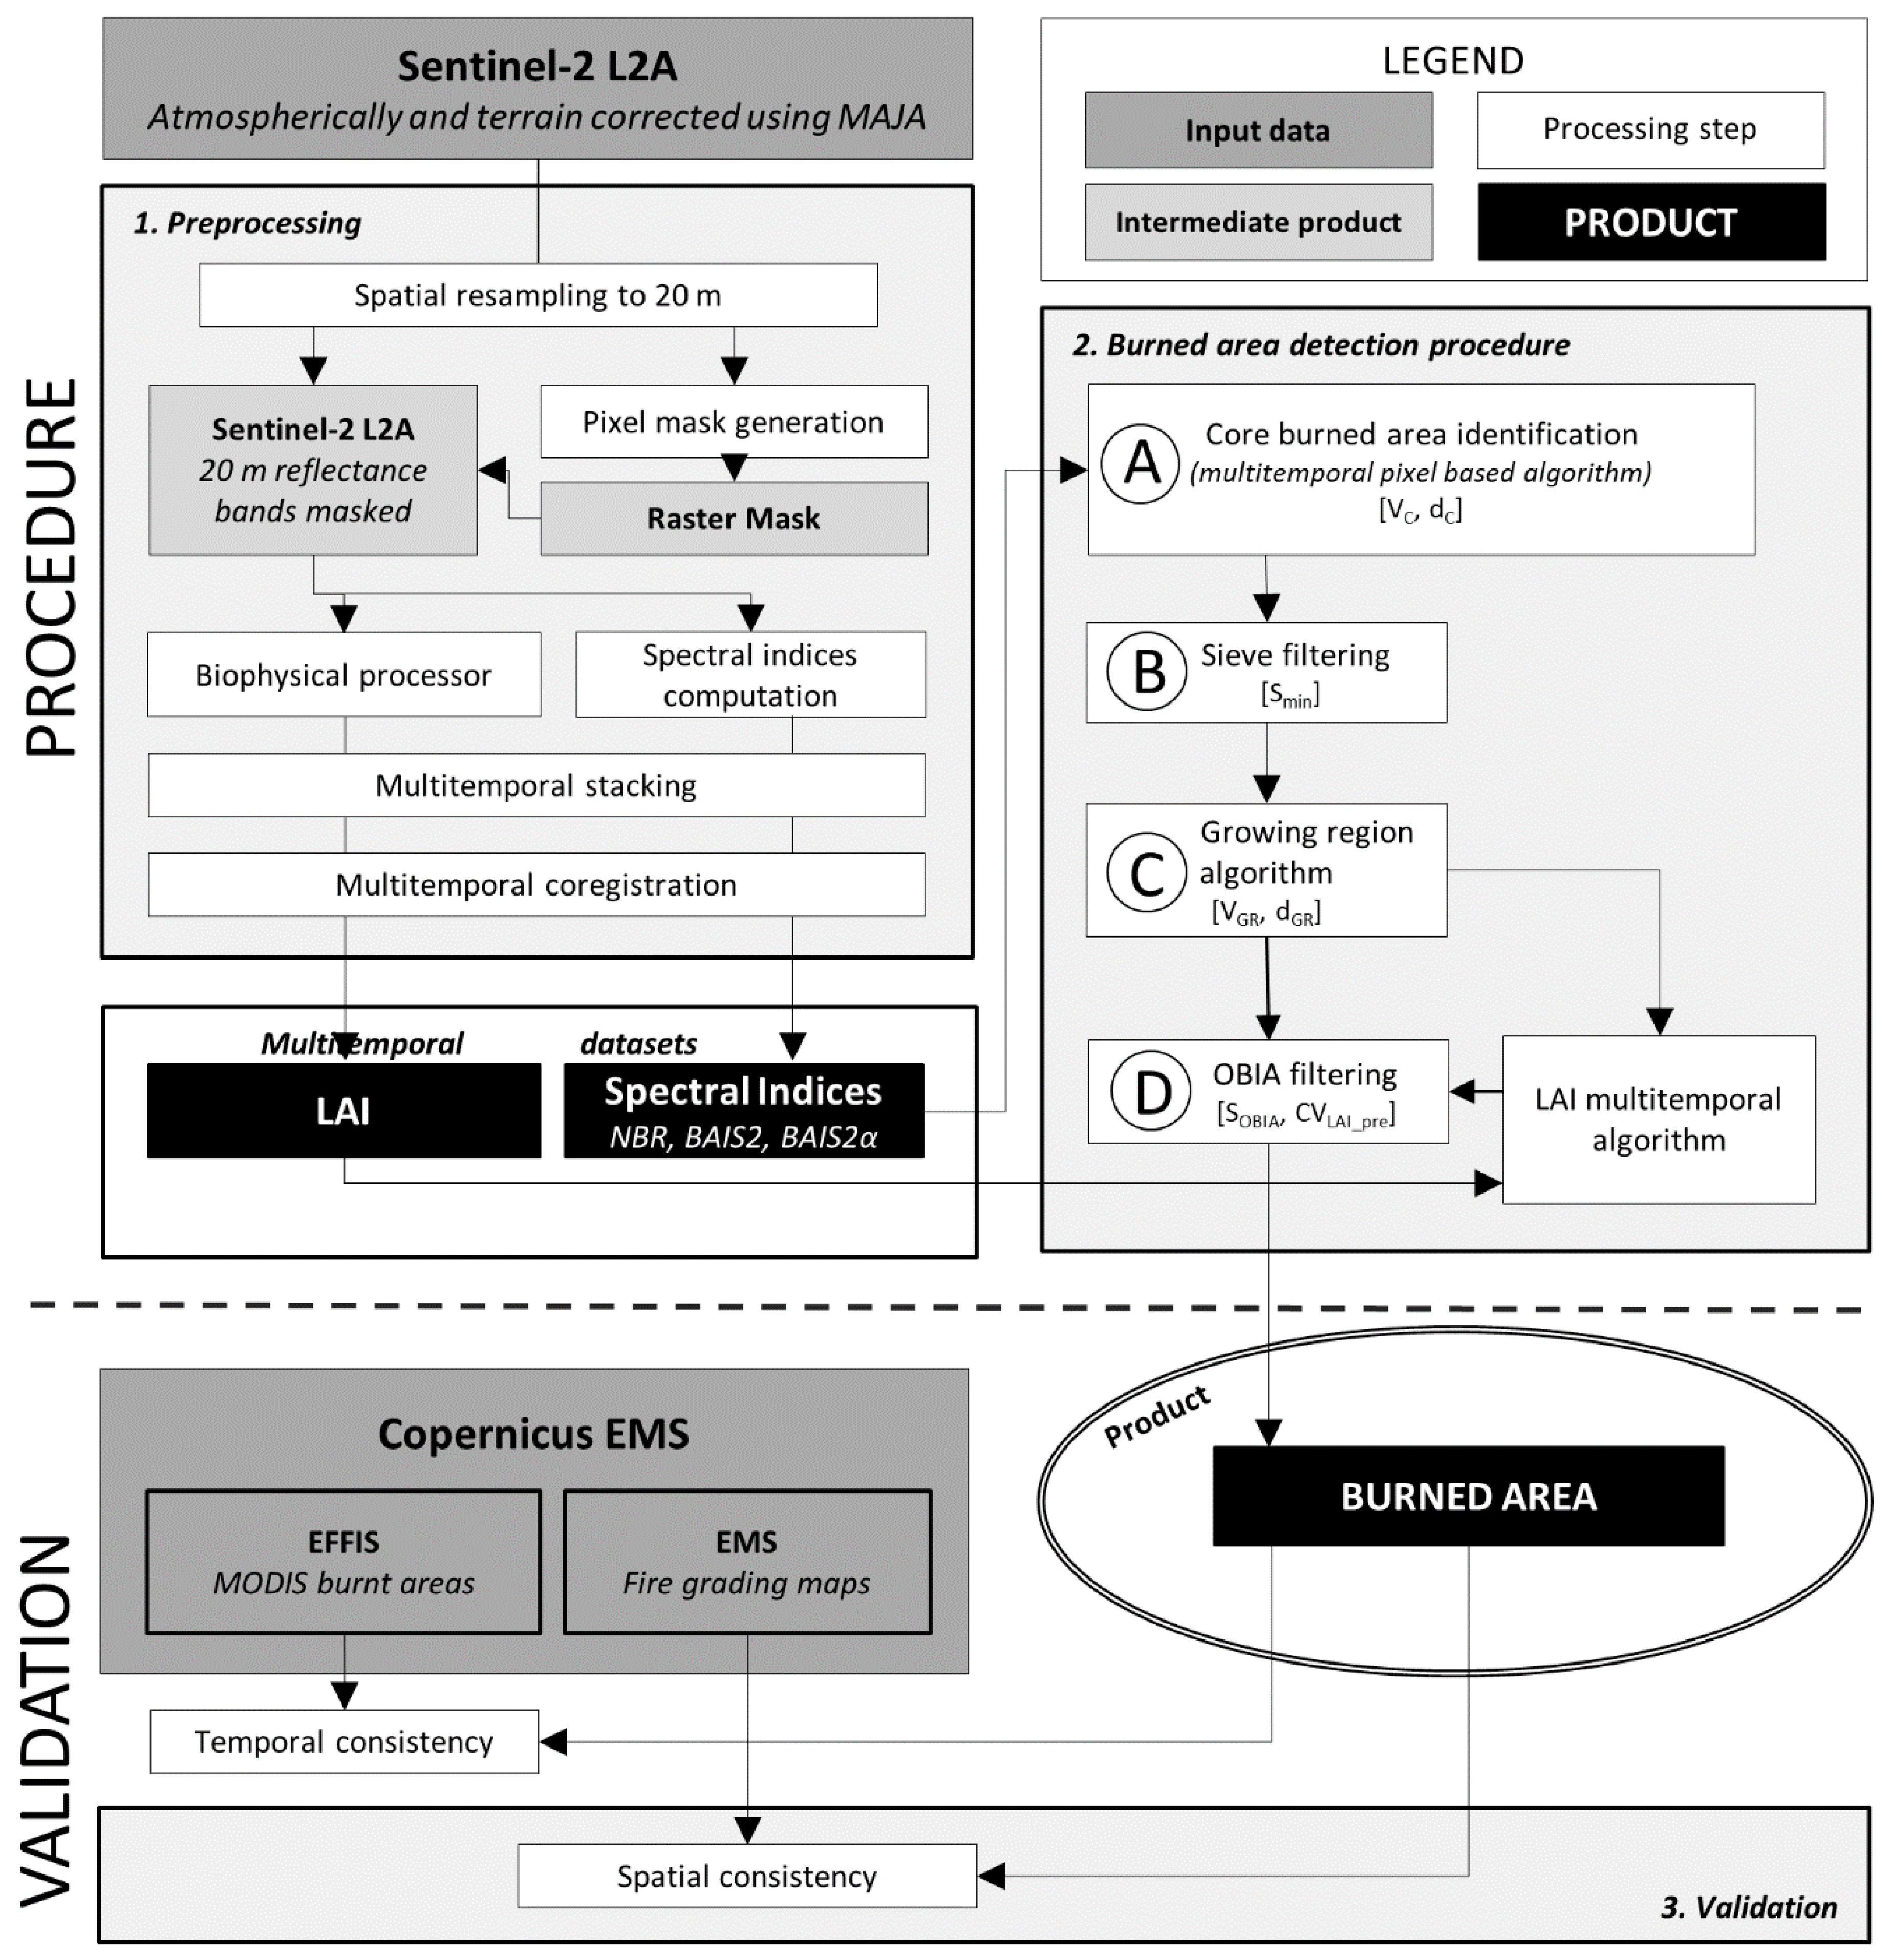
The first procedure step (Step A) identifies core burned areas using a multitemporal pixel-based algorithm founded on spectral-temporal rule combination analysis. The algorithm first computes the difference in spectral indices from each pair of consecutive observations and later detects the temporal occurrence of the maximum relative difference within the multitemporal profile. If the found maximum relative difference, likely corresponding to the difference in spectral index value between pre-fire and post-fire observations, exceeds the threshold value d
C (difference index value for the core area), and the corresponding post-fire observation in the time of the spectral index exceeds the threshold value V
C (index value for the core area) (
Figure 2), the pixel is classified as a burned area. In the second step (Step B), the pixels identified as burned areas were clustered together to form clumps of adjacent pixels. Afterward, sieve filtering is applied to the classified product in order to remove clumps smaller than the predefined threshold S
min (minimum clump size) (
Figure 3), providing a set of seed regions representing core burned areas. The threshold values applied for the three different spectral indices are reported in
Table 2. Threshold values were defined based on a preliminary analysis of sample images. To ensure consistency among the three spectral indices, threshold values were equalized by means of linear regression.
The third step (Step C) concerns the use of a region-growing algorithm to identify whether the pixels adjacent to previously identified burned area clumps (seed regions) exhibit similar spectral characteristics. During this iterative procedure, if both the spectral index difference value d
RG (difference index value for region growing) and the spectral index value V
RG (index value for region growing) (
Figure 2) exceed the defined similarity threshold values, the pixel is classified as a burned area. The maximum number of iterations was set to 75, after performing a sensitivity analysis reported in
Figure S1.
Arable land use areas were an important source of commission error during the detection procedure of burned areas, mainly because they exhibit similar spectral characteristics. In order to remove arable land pixels misclassified as burned pixels, an OBIA approach based on the variability of the vegetation status before wildfire occurrence was conceived. For this purpose, the fourth step (Step D) of the procedure first involves clustering the single burned area clumps from the classified image on the base of their spatial and temporal features and then computing parameter CVLAI_pre (coefficient of variation of pre-fire LAI) for each burned area clump from the pre-fire date LAI. Burned area clumps smaller than the SOBIA (size object-based image analysis) threshold and exhibiting a LAI coefficient of variation smaller than the CVLAI_pre threshold were discarded.
3.3. Validation
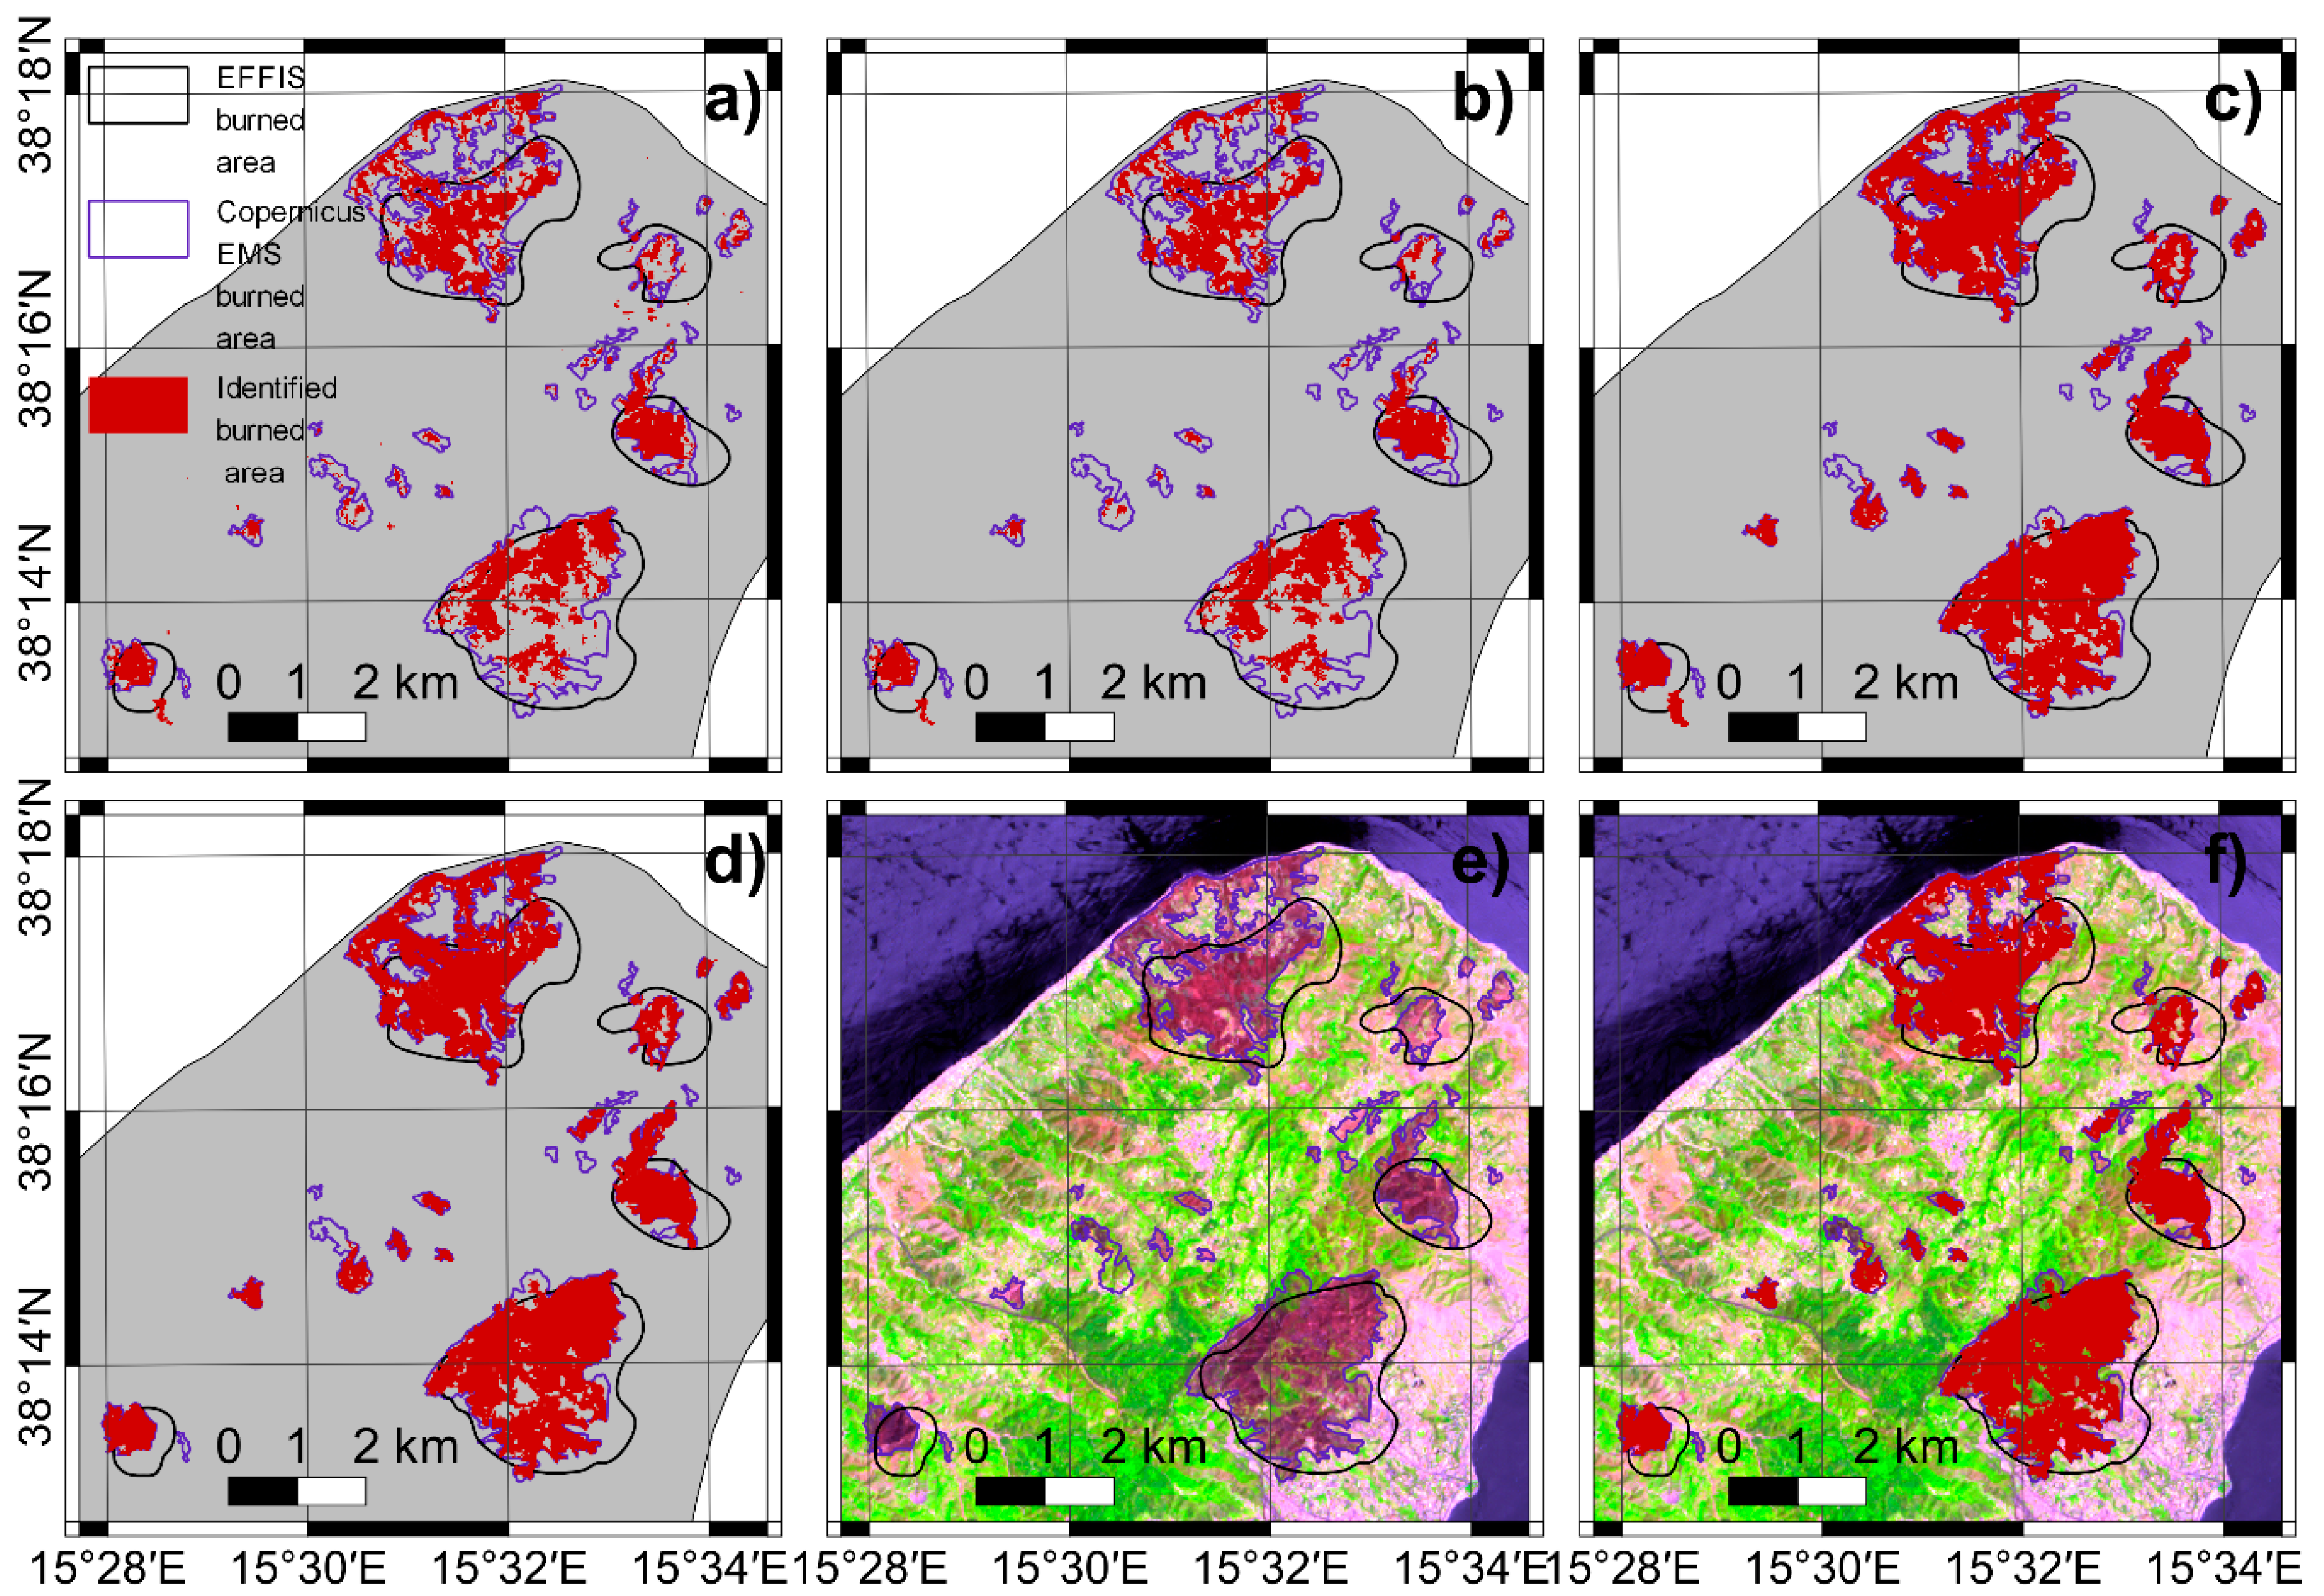
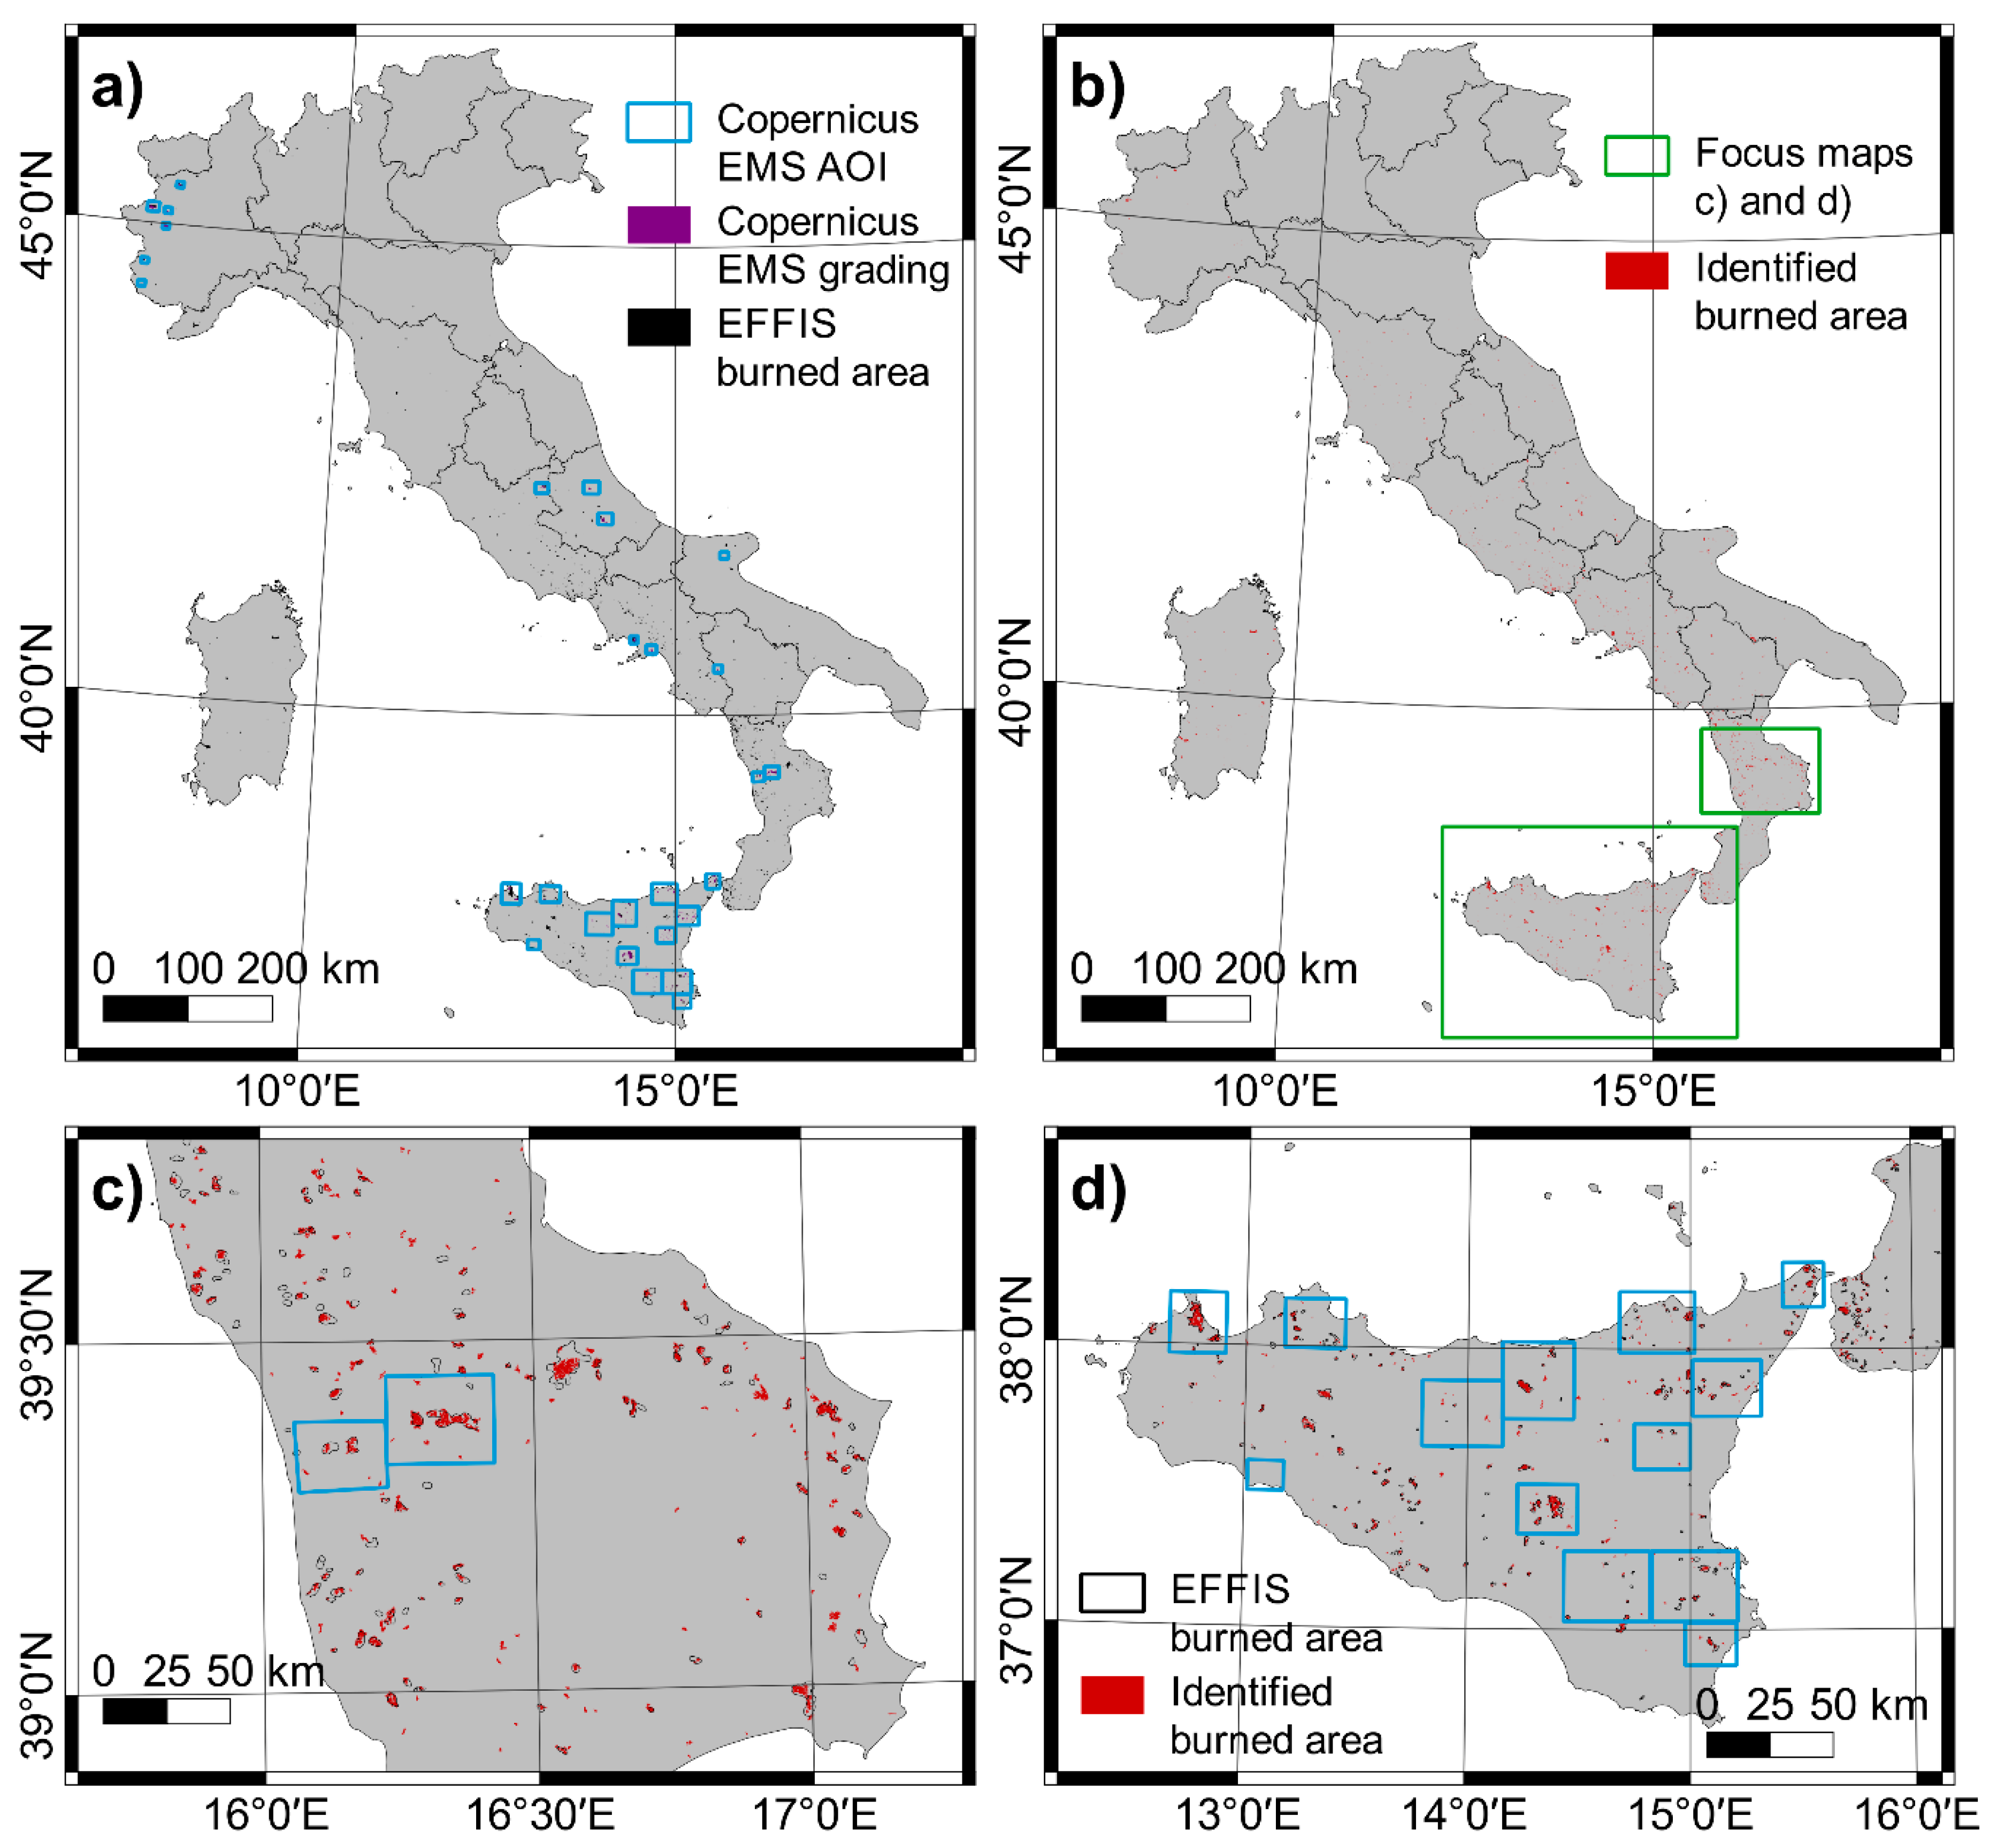
The identified burned areas were compared against Copernicus EMS fire grading maps in order to validate the generated burned area product. Reference fire grading maps were available for 28 areas of interest covering around 9558 km2 (around 3.1% of the Italian territory). In order to make the identified burned areas consistent with Copernicus EMS fire grading map products, areas falling outside the analyzed polygons, or representing burned areas corresponding to fires occurred before the pre-fire image or after the post-fire image, were removed prior to the comparison. The accuracy assessment was performed by means of omission and commission error estimation. An assessment of classification results was performed by comparing the products generated from the three spectral indices against the reference product for each of the four processing steps (A–D) of the burned area detection procedure. Accuracy assessment was calculated following a pixel-based approach, creating a single confusion matrix encompassing all 28 areas of interest.
In addition, the identified burned areas were compared against Copernicus EMS and EFFIS products in order to evaluate the temporal consistency for the generated map products.
Temporal consistency of post-fire dates was calculated for each burned area clump by comparing the S2 acquisition dates, corresponding to the post-fire observations, and the post-fire dates used to produce the EFFIS “MODIS burnt areas” products. Temporal consistency was also evaluated by comparing the post-fire dates of the generated product against the post-fire image dates of the Copernicus EMS rapid mapping activations.
Finally, Copernicus EMS fire grading maps were used to evaluate the pixel value distribution for spectral indices and LAI under four different fire severity levels in order to compare the effectiveness of their separability.
5. Discussion
The high availability of medium and high spatial resolution optical satellite data, from the MSI sensor aboard the Sentinel-2A and Sentinel-2B satellites, has enabled the development of more detailed post-fire mapping. While many research studies focus on the development and comparison of spectral indices for burned area detection [
2,
34,
39], there is still a lack of investigation over the development of proper procedures that take advantage of newly available optical satellite sensors. Scientific investigations concerning burned area mapping from optical satellite data commonly rely on analysis of known wildfire events using two satellite acquisitions, collecting spectrally derived information about cover conditions before and after the wildfire took place. S2 satellites provide superior advantages due to the high revisit frequency and improved spatial and spectral resolution of the MSI sensor, which effectively produces medium-high spatial resolution burned area mapping using dense multitemporal series.
The present research study presented a novel procedure for mapping burned areas using S2 data, benefiting from all of the multitemporal observations and defining a new paradigm that goes beyond the standard method of combining one pair of pre- and post-fire satellite acquisitions. Though the use of bi-temporal difference spectral indices, based on spectral indices and arithmetic differences between pre-fire and post-fire values, have been shown to provide better results compared to the methods based on a single temporal observation [
2], the availability of dense multitemporal series of satellite observations for the identification of burned areas could play a key role in improving the accuracy of wildfire-affected area identification. In fact, quick post-fire vegetation restoration has been seen to be a major source of omission errors in the burned area detection [
57]. The exploitation of the entire S2 time series could therefore reduce omission errors, considering that fire-induced variations in reflectance as a consequence of changes in vegetation cover can be captured for a few months, depending on the pace of vegetation regrowth [
58].
5.1. Critical Issues in the Preprocessing Phase: Dark Pixels
The preprocessing phase of S2 data highlighted critical issues, in particular those related to the presence of extremely dark pixels, also highlighted in previous research studies [
2,
25,
26,
59], that can be misclassified as burned areas while the procedure generates commission errors. In the present work, data preprocessing accounted for all those issues in order to reduce the generation of false positives as much as possible. Specifically, a raster mask was generated for each satellite observation in order to mask out pixels corresponding to several other land cover types that are also relatively dark in this spectral domain, such as bare soil in arable land or dark areas that are due to water spectrum absorption or that are affected by topographic shadow (
Table S2). In addition, the use of multitemporal series of optical satellite data requires spectral reflectances normalized for the BRDF effect to avoid the temporal spectral variability originating from the varying sun zenith angle throughout the solar year. To deal with all the above-mentioned requirements, the S2A L2A MUSCATE product has been selected as a data source in consideration of its major improvements when compared to the standard S2 L1C and L2A products. Thanks to a multitemporal cloud identification approach [
46], these products provide more precise information about cloud and cloud shadow pixels. Moreover, products are terrain-corrected for areas affected by topographical shadow, including topographic mask and low sun mask, the latter considering pixel aspect, slope, and sun zenith angle. During the preprocessing phase, a proper masking of extremely dark pixels not representing burned areas plays a key role in decreasing the generation of false positives, besides reducing the computational effort.
The S2 weak geolocation spatial accuracy, determined in a recent study to be around 12 m [
55], currently requires an additional preprocessing step in order to improve the consistency of multitemporal pixel profiles. The new S2 archive release from the forthcoming S2 reprocessing campaign, foreseeing a geometric refinement making use of a large set of global ground control points obtained via automatic matching, should overcome this limitation and allow for improved geolocation spatial accuracy.
5.2. Comparison of Spectral Indices for Burned Area Mapping
Among the three spectral indices used in this research study, the NBR reported the best classification performance based on the accuracy assessment statistics. Nevertheless, it should be noted that the comparison was done against Copernicus EMS reference products that likely use NBR-based approaches for mapping burned areas. For this reason, a proper comparison of the spectral indices performances (and other spectral indices not considered in this research study) should be done with a reference map produced with different methodologies, and in consideration of the small differences among the classification performances of the three indices.
Distribution of spectral index values in the identified burned areas with respect to the Copernicus EMS fire grading classes gives an overview of the indices’ spectral separability (
Figure S3). Estimation of spectral separability of NBR against BAIS2 was similar to that of the two spectral indices in a previous work [
2]. Density plots show that BAIS2α has a higher spectral separability than the other indices. Higher spectral separability of the BAIS2 compared with the NBR was also estimated [
2], and a weak separability at low fire severity levels was highlighted. The comparison of difference indices against the fire grading classes shows a lower separability (
Figure S3)—likewise for the dLAI (
Figure S4).
From a comparison with a 2012 Corine Land Cover (CLC) map, the NBR index misclassified around 10% more pixels belonging to the “non-irrigated arable land” class (
Figure S5) than the other spectral indices, suggesting that the BAIS2 and BAIS2α could generate fewer commission errors in arable lands.
The S2 MSI sensor (see
Table S1 for details) records data in the vegetation red-edge spectral domain, which is one of the best radiance-based descriptors of chlorophyll content [
38]. Such spectral characteristics make S2 a valuable instrument for post-fire monitoring [
34], with a great potential for discriminating burn severity levels in a fire [
39]. Further, the adoption of the narrowband NIR (B8A) instead of broadband NIR (B8) in the calculation of spectral indices for post-fire has been already demonstrated not to lead to significant differences [
39].
The BAIS2 [
2] and BAIS2α spectral indices used for the identification of burned areas benefit from both vegetation properties described in the red-edge spectral domains and the radiometric response in the SWIR spectral domain, largely recognized to be efficient in the determination of burned areas. The use of a SWIR band positively increasing the BAIS2 index reduces errors due to the saturation of a radiometric signal, found at shortwave wavelengths for pixels corresponding to active fires at the time of image acquisition. In addition, red-edge spectral bands can reduce errors due to the SWIR variability resulting from charcoal removal [
39], especially when the first available post-fire satellite acquisition is distant in time from the pre-fire acquisition. In this research study, the average time span between the pre-fire and post-fire satellite observations was 11 days. The spectral indices combine bands from spectral regions with different sensitivities to factors including the vegetation type and condition, the soil background, atmospheric contamination, and the degree of char and ash deposition [
43]. The introduction of spectral bands representing portions of the electromagnetic spectrum related to the vegetation properties could reduce errors related to the background or environment. In addition, the adoption of surface albedo as scaling information applied to the BAIS2 index should reduce the ambiguity with the spectral response of ploughed land and contributed to decreasing commission errors for arable lands, even if it did not strengthen the detection at low fire severity levels. Even though each index contributes to the spectral discrimination of burned areas while introducing some spectral confusion with other surface classes [
59], one can say that the BAIS2 and BAIS2α spectral indices consider vegetation more than the NBR index does. Nevertheless, this new feature has been demonstrated to be suitable for the Mediterranean ecosystem and should be verified for different biomes. Comparison of further spectral indices for burned area detection was not performed in this study and requires further investigations.
The design of an algorithm to combine multiple spectral indices and information is beyond the scope of this study, but this is a recommended subject for future research studies, following previous attempts for the soft integration of different spectral indices [
11,
59] and the combination with SAR data [
24,
58,
60].
5.3. Burned Area Detection Procedure
In order to ensure the robustness to the results, a two-phase procedure [
25,
26] was adopted in order to generate low commission errors when finding core burned areas in the first phase while reducing the omission errors using a region-growing algorithm in the second phase. In fact, Step A was able to generate around a 21% omission error, while Step C decreased the commission error by around 25%. A similar approach has been implemented as a service on the Geohazard Exploitation Platform of the European Space Agency and makes use of Sentinel-1 SAR data [
40]. Main differences in the two-phase algorithms described in literature [
25,
26] are the use of multitemporal threshold-based classification criteria for the seed region detection, without the need of a large database of burned and unburned reference pixels, a sieve filtering step, or an OBIA step to further refine mapped pixels and to reduce commission errors.
Step B, the sieve filtering, was more critical in the data analysis, since there were many small patches of misclassified pixels identified at Step A that needed to be removed. While removing around only 2% of the correctly classified pixels, Step B helped to remove around 45% of core burned area patches, most of them not representing burned areas. Though the sieve filtering helps to largely reduce false positives identified in Step A, the following procedure step could not apply the region-growing algorithm to those burned areas that resulted in a small number of core burned area pixels in the first phase, as shown in previous studies [
57]. Step D, the OBIA filtering, was not able to significantly reduce the commission errors and in some cases removed correctly classified patches, highlighting the need for further investigation in order to identify new procedures for improving the classification results.
Based on a comparison with performance results obtained in previous research studies [
24,
25], which reported an omission error of around 10–15%, it should be said that the present work did not use any training set and made use of the entire time series of S2, including large temporal periods characterized by ploughed land cover. Further investigations are needed to improve the procedure and reduce the omission error by integrating, for example, various spectral indices and by performing an optimal tuning of the threshold values for the required parameters.
The comparison of the identified post-fire dates with respect to the reference products showed that the procedure could provide burned area maps on average one day before the products generated by Copernicus EMS rapid mapping activations could. Moreover, results suggest that an operational service based on the developed procedure could provide medium-high resolution burned area maps on average five days after the post-fire dates reported in the EFFIS product, which is a relatively small time span if one considers that the S2 revisit time is five days with a two-satellite constellation.
The proposed procedure is composed of four steps and mainly relies on expert-derived rules and thresholds. While this practice ensures the robustness of results, it might limit the exportability of the procedure to other geographical areas and ecosystems. On the one hand, threshold adaptation to different regions requires extra effort [
11]; on the other hand, empirical thresholding provides more generalization than other methodologies and does not require a large set of training areas. Expert-derived rules and thresholds adopted in this research study therefore should be considered applicable to the Mediterranean ecosystem, while their reliability should be evaluated when applied to different geographical areas and a variety of ecosystems. Further development of the methodology may investigate the use of dynamic adaptive thresholding procedures, as already attempted by previous studies [
11,
59], taking also into account the plant functional types existing in different geographic regions.
5.4. Burned Area Misclassification
The use of dense multitemporal series of S2 products should provide post-fire observation close to the wildfire occurrence date and consequently reduce errors due to the SWIR variability resulting from charcoal removal [
39] and to vegetation restoration [
2]. Nevertheless, the numerical results exhibit a commission error of around 25% and a high omission error of around 40%.
There are two main reasons that explain the large omission errors: i) the overdone removal of small areas by sieve filtering and ii) understated threshold values. Many small areas corresponding to burned areas were removed by sieve filtering and consequently were not used as seed regions when region growing was later applied, slightly increasing the omission error. Such drawback highlights the need for defining a better tuning of threshold values to handle the number of small areas, often representing small crop parcels that could significantly slow down the region-growing algorithm performances (which is computationally demanding).
The comparison of the generated product against the reference products, created using different methodologies and scopes, highlighted some inconsistencies. In fact, numerical results demonstrate that the reference products could be useful for the evaluation of procedure performances, but they may not always be consistent with the generated product due to the different spatial resolution or the examined time spawns. Indeed, the EFFIS “MODIS burnt areas” product represents only a fraction (about 75–80%) of the total area burned [
37] and contains only areas with a surface equal or larger than approximately 30 hectares in size. Rather, the Copernicus EMS fire grading product provides maps at finer spatial resolution with good geolocation accuracy but does not give a precise indication about the single wildfire occurrence dates; since it is generated from a single pair of pre-fire and post-fire observations, it represents only a small portion of the total burned areas in the European continent, and the methodology used to produce it does not allow a reasonable processing of large spatial extents. The Copernicus EMS and MODIS products represent in some cases the only available datasets to be used as references for the validation of burned area detection algorithm performances, although they may not ensure the objective information standards required for proper product accuracy reported in [
61].
The use of S2 spectral information allows one to map burned areas at a 20 m spatial resolution and to identify small burned areas to large spatial extents. Nevertheless, the drawback of fine scale mapping is the generation of a considerable number of false positives, especially in ploughed lands that exhibit relatively high spectral index values. Misclassification problems at low severity pixels are common and have been reported by various studies [
7,
25,
26,
32,
59]. Unsown fields show very similar spectral and temporal behavior to burned areas, especially the dark soils. Previous works report that more than half of the commission error was concentrated in agricultural lands due to the presence of unsown fields which are misclassified as burned pixels [
25,
26,
59]. Here, the comparison of the misclassified pixels (here only misclassified pixels with respect to the EFFIS product are used) with a 2012 CLC map revealed that around 40% of the misclassified pixels correspond to the agricultural land classes and around 20% of the pixels belong to mixed and broad-leaved forest (
Figure S5). Such results indicate that there could be pixels corresponding to burned areas in forests regions that were not mapped in the EFFIS product and have rather been correctly classified by the procedure.
The OBIA filtering procedure, introduced in this work and used to remove arable land pixels misclassified as burned pixels, is based on the assumption that each crop in agricultural areas (the object) covers a relatively small surface and has a low pixel value variability, due to the homogeneous vegetated cover through time resulting from agricultural practices. This procedure may reduce commission error but may also remove small natural homogeneous patches from the identified burned areas, increasing the omission error. Additionally, the procedure could remove arable pixels that have been affected by fire disturbance as a consequence of stubble burning practice. Since the commission error has only been marginally reduced by OBIA filtering (around 1%), new strategies should be adopted to reduce it, such as the identification of the soil line spectral signature [
62]. In order to decrease commission errors in arable lands, the synthetic aperture radar (SAR) backscatter temporal difference between pre-fire and post-fire satellite observations has been integrated with optical spectral indices to reduce confusion between burned areas and low albedo surfaces [
24,
58,
60]. Even if the integration of SAR and optical data allows one to reduce local commission errors, it exhibits low separability values for bare soil and sparse vegetation classes [
24]. In fact, Sentinel-1 SAR has been found to detect changes related to wildfires in areas where the vegetation structure was more affected [
58]. Moreover, the occurrence of precipitation events, and consequently the change in soil moisture, can significantly affect the backscattering signature [
24], requiring a higher threshold for the detection of burned areas [
58]. Even the use of fully polarimetric SAR data with large time differences between SAR data acquisitions increases the probability of the removal of vegetation due to causes other than burns, such as harvesting or deforestation, resulting in a misclassification of burned areas [
63].
5.5. Operational Services
This research study deals with the use of S2 optical satellite data to map burned areas with no a priori knowledge about wildfire occurrence or burned area spatial distribution. The proposed methodology explores the entire multitemporal series, discovering wildfire fingerprints on vegetation cover by means of an abrupt change detection procedure. Such a novel procedure is founded on a threshold-based classification that relies on empirical observations of spectral indices time series, describing wildfire disturbance.
To provide updated, detailed, and reliable information on wildfires, there is a need to integrate existing operational services (i.e., Copernicus EMS and EFFIS) with new procedures for national level mapping, exploiting the large amount of new Copernicus Sentinel data and possibly using no ancillary data but available near-real-time information. The presented methodology, based on an automatic detection procedure, should stimulate the development of operational services for mapping burned areas at the national level in support of decision support systems. There are success stories about national services delivering fire-related products and services produced from satellite data. For example, the Greek National Observatory of Forest Fires (NOFFi) makes use of S2 data to routinely provide three main products: (i) fuel type mapping, (ii) semi-automatic burned area mapping service, and (iii) a fire danger index providing mid-term predictions [
64].
Concerning the Italian territory, a geographic database of burned areas in Italian National Parks for the 2001–2005 period was built using ASTER and SPOT images, processed with photo-interpretation, multiple thresholds of spectral indices (NBR and BAI), and maximum likelihood [
65]. Despite the success of this pilot project, promoted by the Ministry for Environment Land and Sea Protection of Italy, the mapping activity was not taken up. Since the Italian territory is plagued by arsonists, precise knowledge about wildfire-affected regions plays a key role for the identification of areas that need to be recovered. Moreover, Italy is the European Union country facing the highest landslide hazard. In recent years, the combination of droughts, wildfires, and heavy rainfall, as a result of climate change, significantly strengthens soil erosion. In fact, deposition of fire hash and altered soil permeability could cause intense surface water flow during heavy rainfall and, together with the reduction of vegetated surface, may strengthen landslide activation.
This research study used the presented procedure to successfully map wildfire events in Italy during the year 2017, comparing the performances of three different fire-related spectral indices. The procedure could also be adapted to deal with near-real-time burned area identification, since it does not use any information after the post-fire image acquisition. Further investigations are needed in order to improve the developed procedure by addressing the following issues:
comparison of the performance using other spectral indices used for burned area identification;
integration of spectral indices in order to increase the robustness of the detection;
perform the tuning of the threshold values for the required parameters;
identify further strategies to reduce the commission error, especially for arable lands.
Besides the identification of burned areas, dense multitemporal series of optical satellite observations can be used to extract much more wildfire-related information that can rarely be measured after a wildfire takes place, information regarding, for example, the active fires and the pre-fire land cover type affected by the wildfires. Such thematic data play a major role in supporting knowledge about wildfires since they can be exploited to derive information related to fire fuel load [
66] and therefore used to estimate other components of the fire regime and the amount of smoke emitted, and consequently the wildfire impact on air quality. Finally, the comparison of pre-fire and post-fire conditions can be used to monitor ecosystem responses through the restoration of vegetation and to account for environmental losses, such as habitat loss or changes in ecosystem services. Since no in situ information related to pre-fire conditions can be collected after the wildfires take place, the development of procedures to generate land cover maps and habitat maps using exclusively remote sensing data and ancillary information is recommended.
The designed procedure can be further improved in order to be implemented as downstreaming operational service that, taking advantages from Sentinel-2 medium-high spatial resolution and revisit time, could support knowledge about wildfire occurrences with medium-high resolution maps of burned areas.
6. Conclusions
This research study presents a novel procedure for medium-high resolution burned areas mapping, taking advantage of the spectral and temporal characteristics of S2 MSI data, and adopts a four-step procedure based on expert-derived rules and thresholds. The selected advanced image analysis techniques were used to develop an automated and transferable procedure that relies on a change detection approach, based on the identification of structural changes in vegetation cover, and exploits complementary information through a region-growing algorithm.
The case study of Italy wildfires in the year 2017 exhibits a burned area of around 1400 km2, with the proposed methodology generating a commission error of around 25% and an omission error of around 40%. The NBR spectral index reported the best classification performances, but BAIS2 and BAIS2α showed similar performances.
Even though the proposed procedure was applied to the Italian territory only, the algorithm provides opportunities for extending the medium-high resolution mapping of burned areas at wider scales, offering a benchmark for the development of new operational downstreaming services at national and continental levels based on Copernicus data, with the aim of providing reliable information for the systematic monitoring of wildfires, which is of interest to a wide range of communities.


