Article

Modelling of Wine Production Using Land Surface Temperature and FAPAR—The Case of the Douro Wine Region

by
Clarisse Magarreiro
1,2,*,
Célia M. Gouveia
1,2,
Carla M. Barroso
1 and
Isabel F. Trigo
1,2
1
Instituto Português do Mar e da Atmosfera, I.P., Rua C do Aeroporto, 1749-077 Lisboa, Portugal
2
Instituto Dom Luiz, Faculdade de Ciências, Universidade de Lisboa, 1749-016 Lisboa, Portugal
*
Author to whom correspondence should be addressed.
Remote Sens. 2019, 11(6), 604; https://doi.org/10.3390/rs11060604
Submission received: 20 February 2019 / Revised: 27 February 2019 / Accepted: 28 February 2019 / Published: 13 March 2019

Abstract

:
The vegetative development of grapevines is orchestrated by very specific meteorological conditions. In the wine industry vineyards demand diligent monitoring, since quality and productivity are the backbone of the economic potential. Regional climate indicators and meteorological information are essential to winemakers to assure proper vineyard management. Satellite data are very useful in this process since they imply low costs and are easily accessible. This work proposes a statistical modelling approach based on parameters obtained exclusively from satellite data to simulate annual wine production. The study has been developed for the Douro Demarcated Region (DDR) due to its relevance in the winemaking industry. It is the oldest demarcated and controlled winemaking region of the world and listed as one of UNESCO’s World Heritage regions. Monthly variables associated with Land Surface Temperatures (LST) and Fraction of Absorbed Photosynthetic Active Radiation (FAPAR), which is representative of vegetation canopy health, were analysed for a 15-year period (2004 to 2018), to assess their relation to wine production. Results showed that high wine production years are associated with higher than normal FAPAR values during approximately the entire growing season and higher than normal values of surface temperature from April to August. A robust linear model was obtained using the most significant predictors, that includes FAPAR in December and maximum and mean LST values in March and July, respectively. The model explains 90% of the total variance of wine production and presents a correlation coefficient of 0.90 (after cross validation). The retained predictors’ anomalies for the investigated vegetative year (October to July) from 2017/2018 satellite data indicate that the ensuing wine production for the DDR is likely to be below normal, i.e., to be lower than what is considered a high-production year. This work highlights that is possible to estimate wine production at regional scale based solely on low-resolution remotely sensed observations that are easily accessible, free and available for numerous grapevines regions worldwide, providing a useful and easy tool to estimate wine production and agricultural monitoring.

Graphical Abstract

1. Introduction

Remotely sensed data provided by Earth Observation from satellites has been a key enabler of the analysis and monitoring of vegetation dynamics on a global scale. The vegetation information that is obtained from satellite data are used as input in models to assess hydrological patterns (precipitation, runoff and soil moisture), climate effects and vegetation productivity and crop yields estimation.
In recent years, the potential of satellite products has sparked the interest of vineyards managers. The geographical distribution and density of vineyards is predominantly determined by climate conditions [1,2]. The temperature and precipitation seasonality determines whether a region has adequate weather characteristics for grape growing. The balance of these variables throughout the vines growing season determines the wine type, quality and production [3,4]. Occurrences of particularly low winter minimum temperatures, spring and fall frosts and short growing seasons will definitely be an influential factor in the growth and productivity of wine grapes [5]. To preserve the quality of the grapes, particularly under adverse meteorological conditions, wine producers invest in methodological and technological adaptations. In this context, it becomes necessary to gather information on the regional climate which can prove to be a difficult task as meteorological station data are often unavailable. Using satellite data one can overcome this limitation, obtaining near real time data (NRT) and a synoptic view of an entire vineyard region. Besides, by relying in satellite images it is possible to generate a map of the vineyard health using the information of a vegetation product.
The Normalized Difference Vegetation Index (NDVI) is nowadays one of the most known vegetation products obtained from satellite images [6]. Considering that the index is retrieved from a multispectral image, it is based on the principle that the satellite sensor will detect less reflected red light from vigorous vegetation (e.g., vines) which are photosynthetically more active, and therefore greener and healthier. Generally speaking, NDVI is an indicator of the greenness of the vegetation. However, satellite observations may also be used to derive variables which are more directly related with vegetation health, such as the Fraction of Absorbed Photosynthetically Active Radiation (FAPAR). FAPAR represents the fraction of photosynthetically active radiation absorbed by the green parts of the canopy, and it is therefore an indicator of the status of the vegetation canopy, since the absorption of the photosynthetically active radiation is related to leaf chlorophyll content [7]. Although the NDVI has been frequently used to address vineyards conditions [8,9] and therefore wine production/productivity [10,11,12,13], the availability of FAPAR estimates from satellite data opens the possibility to assess the state of the vineyard health via a variable closer to photosynthesis processes. It is needless to say that FAPAR and NDVI are highly correlated as pointed by previous studies, e.g., [14]. Currently FAPAR is often used to model terrestrial ecosystems for estimations of how much carbon is assimilated by plants and how much water is released due to evapotranspiration [15,16,17]. Considering their definition, parameters such as NDVI and FAPAR express strong correlations with soil moisture and precipitation [4] and can therefore be regarded as proxies of the soil water reserves.
In the wine industry, Portugal is one of the top 5 producers in European Union and is currently 11th worldwide [18]. The Portuguese Douro region is the oldest demarcated (XVIII century) and controlled winemaking region of the world and is known worldwide as the source of the so acclaimed port wine [12,13]. At the beginning of the century, the Douro Wine Region was added to UNESCO’s World Heritage List. In this region grapes grow on steep hills with tough schist soils in vines laid out in wired terraces built row upon row with retaining walls [13]. Due to these extreme terrain conditions, the region is sparsely vegetated, although by well-adapted vegetation. It also endures a consistent post-flowering water and thermal stress [19]. Budburst for grapevines in such climatic Mediterranean conditions occurs typically in March, bloom in May, veraison in July and ripening to full maturation in September [20,21]. During the growing season (April–September), the mean air temperature in the Douro region is 18–21 °C and the precipitation during this period represents around 30% of the annual total [5,19,21]. At the end of the ripening period the available water reserve is lower than 20% [19].
Given the significance of the Douro Wine region and its climate conditions, the wine production variability of the region has been already addressed in several studies [1,5,12,19,21,22,23], although these have mostly targeted the impact of the interannual variability of atmospheric circulation and climate change on wine production. The impact of climate change on Douro Valley wine production has also been assessed by Jones et al. [5] and Santos et al. [21,23] using projections from climate models. The results indicate that the Douro Wine region will be exposed to higher and more frequent heat stress events, a lower diurnal temperature range and higher temperatures during the growing season.
Gouveia et al. [12] have analysed the vegetative cycle of vineyards and the vulnerability of Douro wine production to climate variability and change using NDVI data obtained from satellite and meteorological parameters from the Climatic Research Unit data sets. The results showed that the production variability is linked to late winter-early spring precipitation and spring temperatures. The statistical modelling of wine production for the Douro region was also performed by Gouveia et al. [12], Santos et al. [21,23] and Fraga et al. [1], all leading to consistent results, namely: warmer than normal conditions during flowering and berry development (May) tend to favour higher wine production. Additionally, Gouveia et al. [12] highlighted the importance of the dormancy stage of the vineyard (October to December) since it was found that the NDVI was a significant predictor for wine productivity during this stage. The result gives an indication that it is important that grapevines are in their best health condition during this period.
The purpose of the present work is to analyse the suitability of FAPAR as a representative index of the vegetative cycle of vineyards and to develop a statistical model for wine production by combining parameters exclusively obtained from satellite data, in this case FAPAR and Land Surface Temperature (LST). In this way, we aim to highlight that remotely sensed observations and products alone constitute a pertinent source of data for analysing vineyards conditions and to simulate their wine productivity. The added value of the present work is to present a method for wine production estimation using data that are easily accessible, free and available for numerous grapevines regions in alternative to in situ measurements, which in turn are scarce, difficult to access and often associated with extra costs. The study is focused on the Douro Demarcated Region (DDR) due to its being a controlled winemaking region and to its high economic relevance in the wine industry sector.

2. Materials and Methods
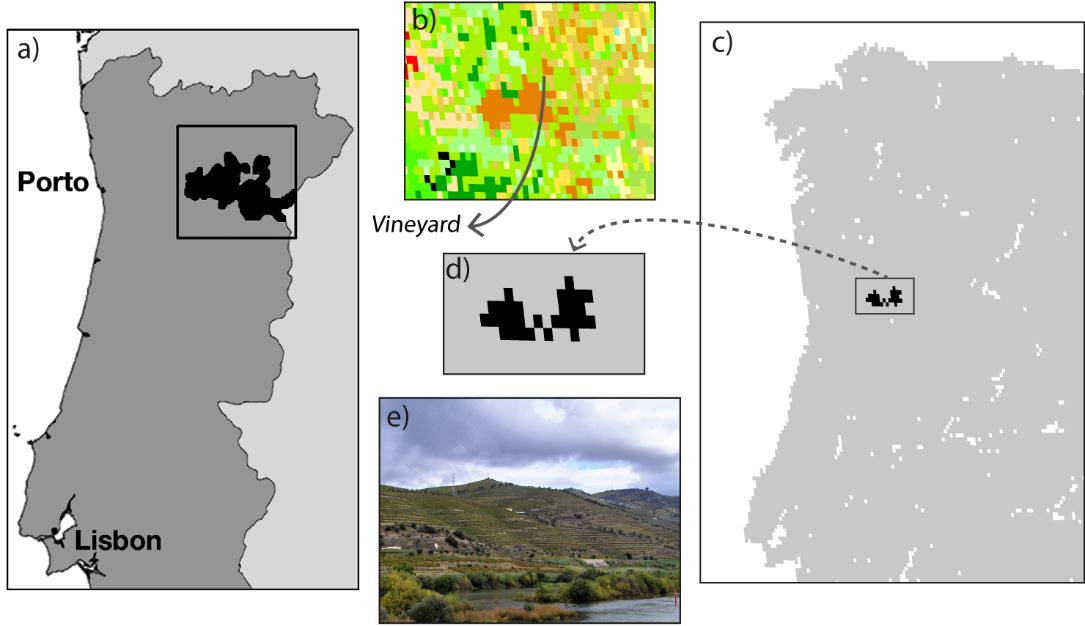
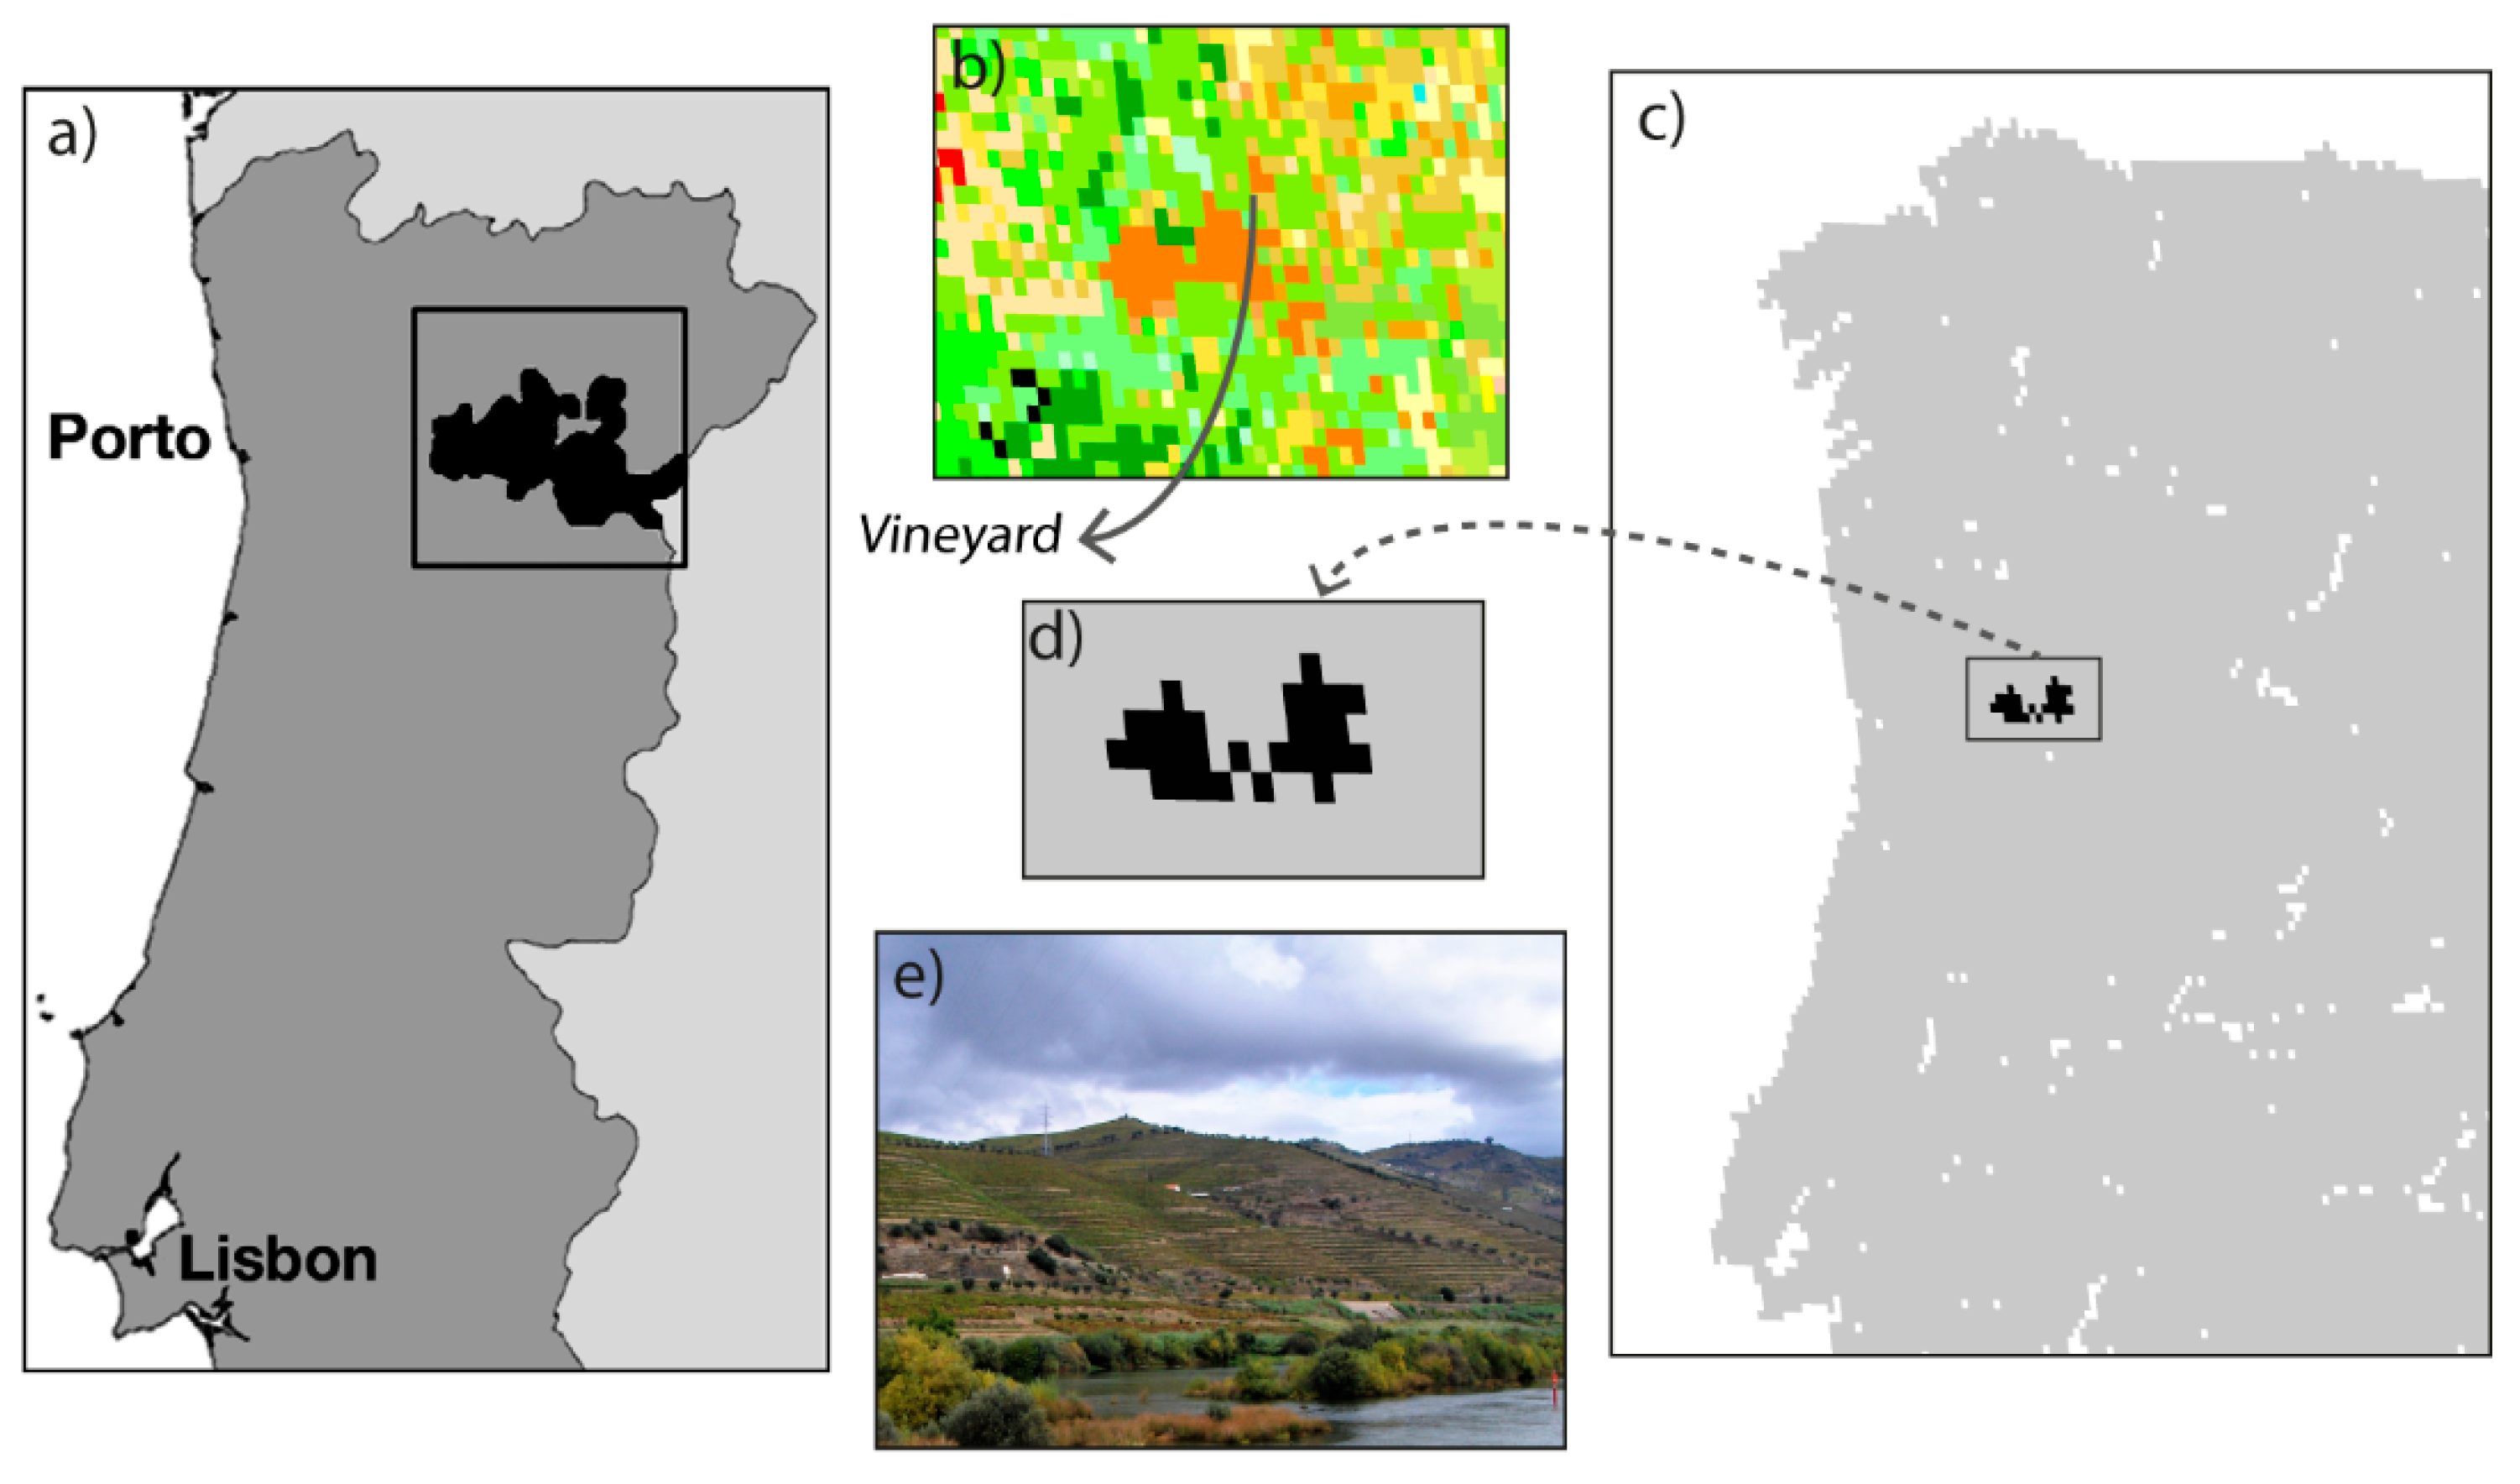
2.1. Study Area

The study area of the present work is DDR (Figure 1a) in Northeast Portugal. The region is very mountainous and is located along the hydrographic basin of Douro River with an extension of around 250,000 ha. Spreading along deep valleys and protected by the surrounding mountains, the region typically experiences cold winters and hot and dry summers. The mean annual precipitation usually varies from 400 to 900 mm with higher values in December and January and lower in July or August [5,24]. Mean monthly air temperatures range from 5 to 8 °C in January up to 24 °C in July [19,23].
The typical vegetative cycle of the grapevines in the studied region is presented in Figure 2.

2.2. Corine Land Cover Map

To identify the land cover which is related to vineyards within the studied area, the CORINE Land Cover (CLC) maps were used (https://land.copernicus.eu/pan-european/corine-land-cover). The CLC is an inventory of land cover comprising 44 classes and is freely available in both raster and vector formats with 100- and 250-meter resolution.
In this study, we consider CLC maps versions of 2000 (CLC00), 2006 (CLC06) and 2012 (CLC12). By combining the three versions, we aimed to select the land cover that had been consistently classified as vineyards through the 2000–2012 version maps (dark orange pixels in Figure 1b). This approach guarantees that the vineyards are being kept in the same locations throughout the period of study, therefore providing an indication of persistence in the land use.
The CLC maps were re-projected from its inherent coordinate reference (EPSG:3035) to the geostationary satellite projection of the MSG images to enable the identification of the pixels that relate to the vineyards land cover classification. The resolution of the CLC maps was also processed to match that of MSG products (Figure 1c,d). The mode rule was applied in the resampling method of the CLC maps. The pixels that were retained as vineyard and, therefore, used in this analysis are represented in Figure 1d.

2.3. Remotely Sensed Data

As mentioned previously, the data used in this work were exclusively obtained from satellite observations. In the present case, FAPAR and LST were obtained from the Satellite Application Facility on Land Surface Analysis (LSA-SAF) project that is part of the distributed EUMETSAT (European Organization for the Exploitation of Meteorological Satellites) Application Ground Segment [25]. LSA-SAF is focused on the development and processing of satellite products that characterize the continental surfaces (radiation products, surface temperature, vegetation, evapotranspiration and wild fires). The data are freely available at https://lsa-saf.eumetsat.int. Here we will consider products derived from SEVIRI on-board the geostationary satellite MSG, with a maximum spatial resolution (at sub-satellite point) of about 3 km. Within the vegetation suite, besides FAPAR, also Leaf Area Index (LAI) and Fraction of Vegetation Cover (FVC) are available.
MSG 10-daily FAPAR (LSA-408) and 15-minute LST products (LSA-001) are operationally generated and distributed by the LSA SAF in near real time and/or off-line since 2005. However, the need for providing homogeneous time-series of Climate Data Records (CDR) suitable for climate variability and change detection studies justified the generation of a long-term datasets with the most recent algorithm version used for Near Real Time (NRT) operational products. The corresponding LST and FAPAR CDRs (LSA-050 and LSA-452, respectively) have been available since 2017, covering the period 2004–2015. The validation exercises highlighted the stability and consistency of the above-mentioned products [12,26,27] with those generated in NRT. Therefore, the available datasets, including reprocessed and operation NRT products, resulted in almost 15 years of satellite information, i.e., data for the period from 2004 until now.

2.3.1. LST

The LST is controlled by the surface energy balance which depends on the thermal properties of the surface and the atmospheric state. Although LST and air temperature result from different conceptual concepts, there is a strong relationship between the two [28], and LST can be used as a proxy of air temperature. Satellite-based LST products also add the advantage of being available with high spatial resolution and coverage in comparison with meteorological in situ measurements.
The retrieval of LST from the satellite observations within the LSA-SAF relies on the generalised split-window algorithm, which uses top-of-atmosphere brightness temperatures from the two adjacent infrared channels at 10.8 and 12.0 μm. Further details on the algorithm can be found in Trigo et al. [25] and Freitas et al. [29]. In 2017 LST was reprocessed for the entire period from 2004 to 2015 by LSA-SAF with a temporal sampling of 15 minutes (product identifier LSA-050), using the version 7.14.0 for the NRT product, LSA-001. The LST are freely available at http://lsa-saf.eumetsat.int.
The available LST dataset, considered here for the total 2004–2018 period, was post-processed to obtain monthly mean values from the original 15-minute values, taking into account the representativeness of the LST diurnal cycle. A spatial average of the pixels selected for analysis (Figure 1d) was used in the statistical modelling of the wine production from the DDR.

2.3.2. FAPAR

FAPAR corresponds to the fraction of photosynthetically active radiation (i.e., within 400 to 700 nm), which is absorbed by vegetation, therefore quantifying the canopy’s ability to absorb radiation for photosynthesis. The FAPAR product considered here is derived from SEVIRI red and NIR channels, using as input information on the surface bi-directional reflectance distribution function (BRDF), following the methodology first proposed by Roujean et al. [30]. A detailed description of the LSA SAF FAPAR algorithm (MTFAPAR, LSA-426) is available in [16] and its validation in [27]. FAPAR (LSA-452) was also reprocessed for the period from 2004 to 2015 using the most recent version VEGAv3.0 algorithm and data are available from LSA-SAF with daily and 10-day temporal resolution. As performed for LST, a time series of monthly mean FAPAR values from 2004 to 2018 is built using a spatial average of the pixels previously identified as vineyards in the DDR (Figure 2d).

2.4. Wine Production

A wine production time series (Figure 3) was obtained from the Portuguese IVV—Instituto do Vinho e da Vinha (www.ivv.gov.pt). Only the overlapping period between available LSA-SAF data and wine production records was considered, i.e., production years between 2005/2006 and 2017/2018. Since the wine year is defined as beginning in August of the current year and ending at the end of July of the following year, the data gathered from IVV are in fact compared with the remotely sensed data corresponding to the previous year. This means that a wine production record of a given period, year i/year i+1, is related to temperature or vegetation index from year i-1/year i. Henceforth, all figures related to wine production are labelled using the correspondence to the period of satellite data.
For the purposes of this work, only Protected Denomination of Origin (PDO) wine production dataset was used, excluding liqueurs and port wines. The PDO wine is compliant with the requirement that its quality and characteristics are essentially or exclusively due to a particular geographical environment with its inherent natural and human factors and that the grapes from which it is produced come exclusively from the defined geographical area as well as its production place [31]. By using this dataset, it is assured a direct relation of the phenology information used from the remotely sensed data to the natural canopy of the vines in the studied location.
Two classes of years, characterised by high and low wine production, respectively above the 3rd and below the 1st quartiles, were identified. These two classes, respectively denoted by Wine+ and Wine−, are represented by red and green circles in Figure 3.

2.5. Statistical Modelling

The relationship of monthly mean normalized values of LST and FAPAR with PDO wine production on the DDR was assessed using a stepwise regression with both forward selection and backward elimination. The PDO wine production data comprises 13 years of yearly production values. The best set of predictors was selected from statistically significant variables (5% level) considering the p-value for an F-test of the change in the sum of squared errors by removing or adding a term to the regression model.
The resulting model was also evaluated using the cross validation leave-one-out approach. The data are divided into learning (12 yearly wine production values) and validation data sets (here ‘validation’ refers to the year of data left out) and the model is fitted to the learning data and tested on the validation subset [32]. The test datum value is selected in chronological order and the learning data subsets are the remaining values. The resulting estimated values (i.e., the estimated test data subset) are then used to obtain the correlation coefficient of the cross validation.

3. Results and Discussion

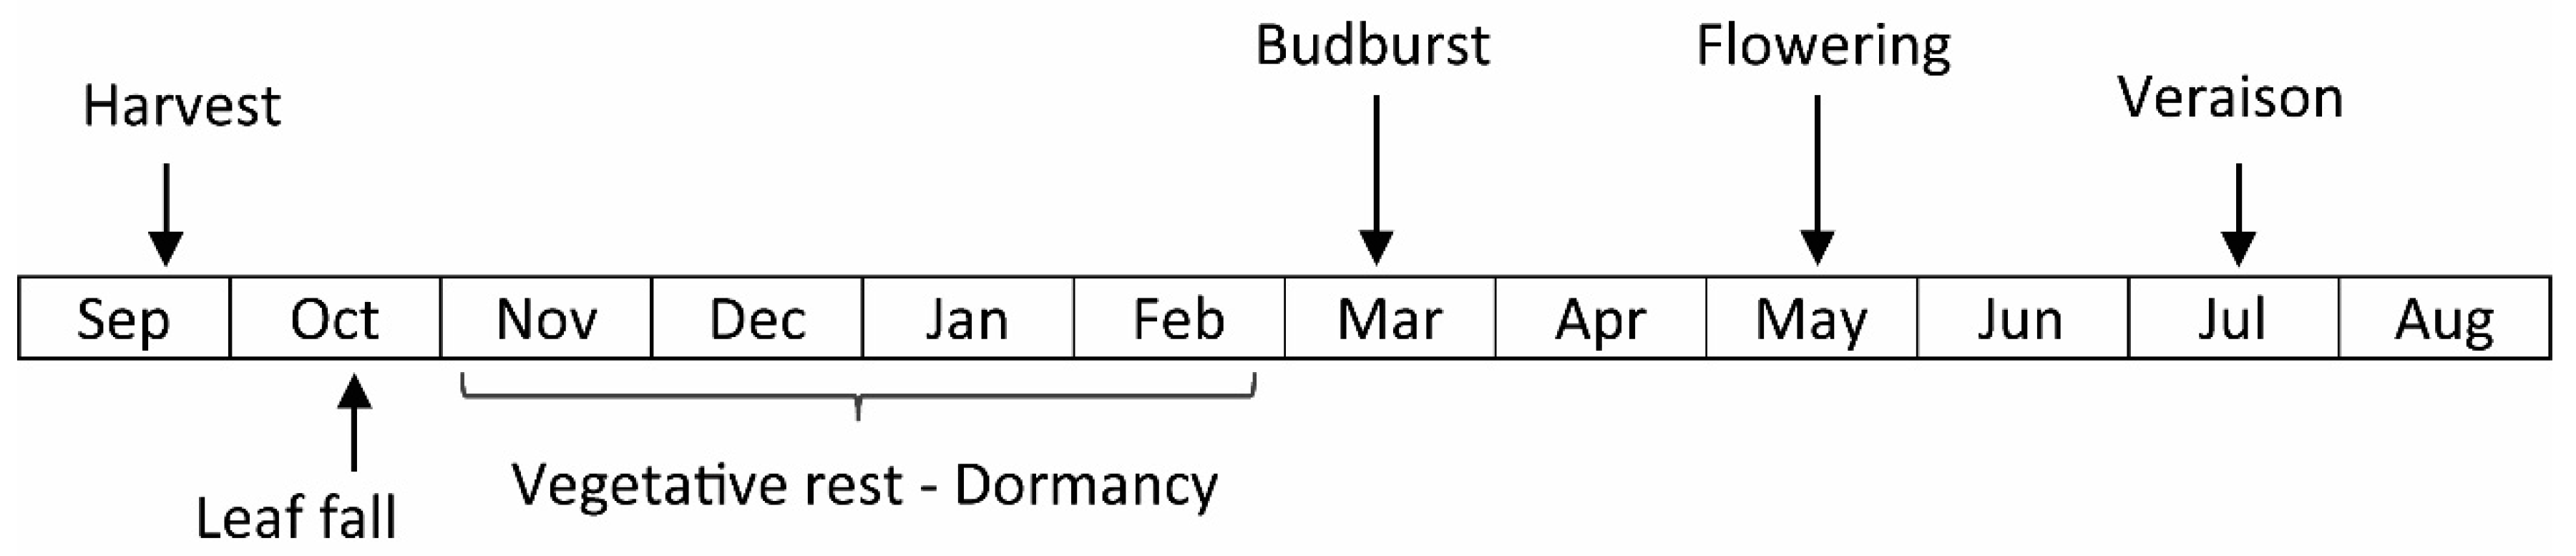
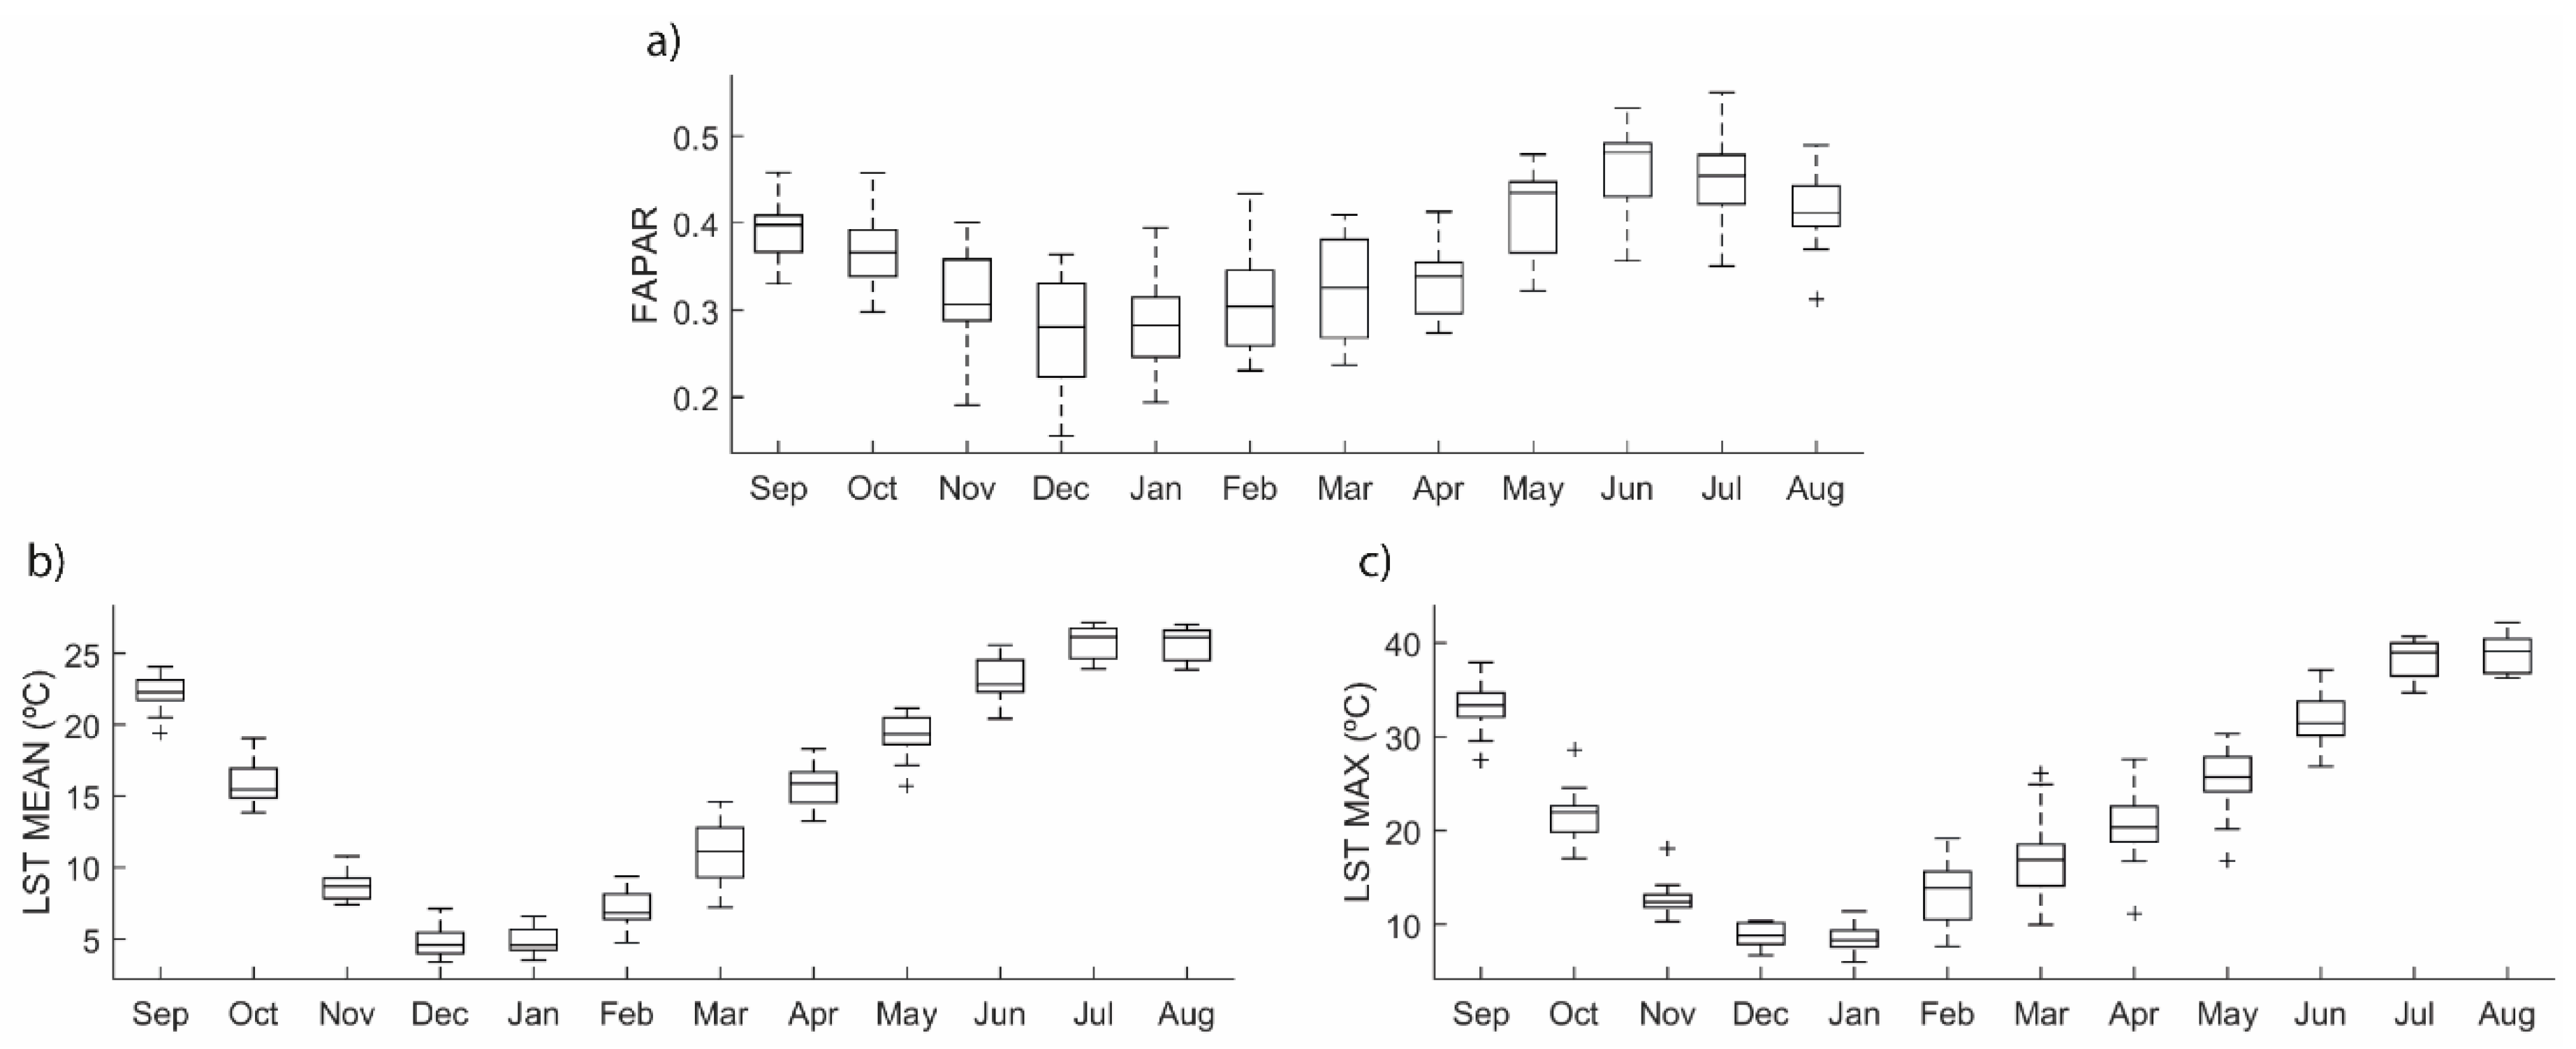
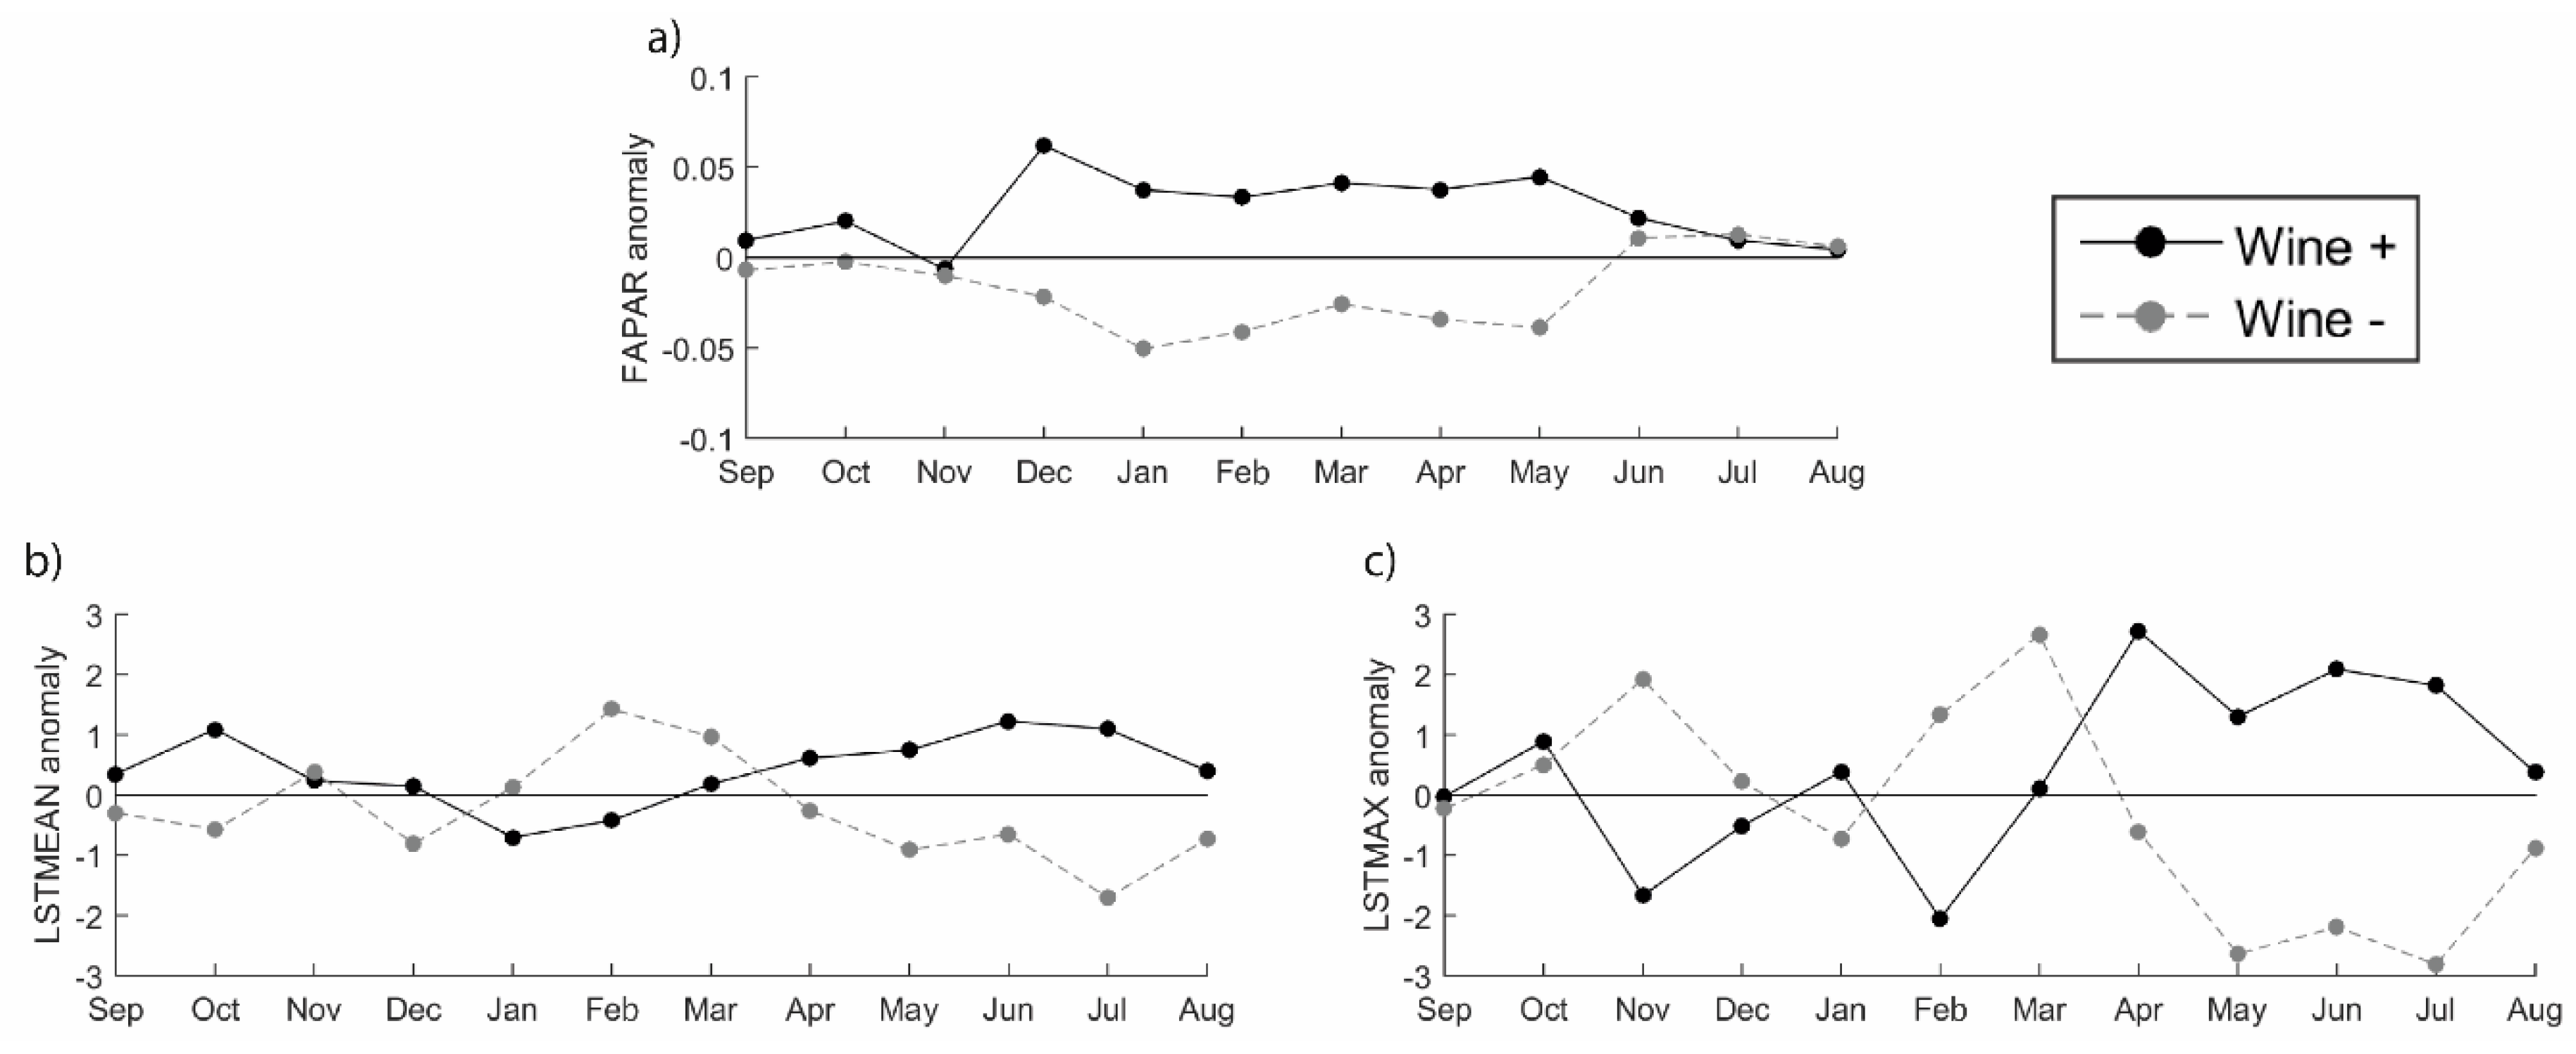
3.1. Douro Vineyards Phenological Cycle and Climate

The annual cycle of satellite data for the selected pixels from the DDR were evaluated to weigh the representativeness of these parameters in a vineyard setting. In a first exploratory study, FAPAR, LST monthly mean, maximum, minimum and amplitude were considered as possible predictors for the PDO wine data but only mean LST (LST MEAN), maximum LST (LST MAX) and FAPAR presented statistically significant correlations with wine production (95% confidence level). As such, only the annual cycles for these parameters are presented here (Figure 4).
The FAPAR annual cycle (Figure 4a) shows a clear alignment with the vegetative evolution of the vineyards in the DDR. Lower (higher) values were observed in December (June and July), and higher variability is also found for December, March and May. The dormancy stage during winter is evident in the low FAPAR values between November to February. Although dormant vines do not photosynthesize, they still have to maintain basic metabolic functions. This stage is supported by the energy stored in the roots and trunk of the vine, which are naturally related to local soil conditions [33,34]. Good state soil conditions also potentiate the development of herbaceous elements (e.g., grass) throughout the vineyard even during the dormancy stage, which are then reflected in relatively high FAPAR anomalies during that period.
The photosynthetic activity increases substantially in May and continues throughout June. This is the blooming stage of vineyards which is naturally marked by the development of new leaves. In July FAPAR exhibits a slight decrease that is accentuated latter on in August. This behaviour is consonant with the veraison stage, which typically begins in July and lasts until the full maturation of the grapes and the consequent ripening stage in September. Overall, the FAPAR annual cycle is also in agreement with the ones found for NDVI in the works developed for the same region by other authors [12,22,35]. These findings corroborate that FAPAR can be used as an indicator of the health state of the vineyards in the DDR.
The LST MEAN (Figure 4b) and MAX (Figure 4c) annual cycles are typical of a Mediterranean climate: high values in the months of peak summer time, July and August, and lower ones during winter months, namely December and January. Low variability is also observed along the entire year for selected pixels, namely for LST MEAN. Late winter and early spring months exhibit higher variability for both LST variables. Given the implications of the physical definition and natural differences between LST and air temperature it is expected that the LST values presented in this work to be slightly higher than the ones obtained from air temperature by other authors [5,12,23]. It is still legitimate to consider the profiles of the annual cycles of these parameters to be in agreement with those obtained for air temperature in the previously mentioned studies conducted in the Douro wine region.
Although several factors may influence grapevine vegetative development, such as precipitation, radiation, cultural practices, use of growth regulators, and grapevine variety, the temperature is paramount, especially in the budburst stage [36,37]. The start of this stage may happen prematurely as a consequence of an event of unusual warm weather, leaving the newly bursting buds under the threat of still-to-come low temperatures [37,38].
Composites for FAPAR and LST (MEAN and MAX) during years characterized by high and low Douro wine production were obtained with the aim to analyse the corresponding annual cycles of monthly anomalies (Figure 5). This assessment is driven by the connection established in previous works between the different stages of growth of the vineyards may also be reflected in the contrasting behaviour during high or low production years [5,12].
The results show that high wine production years are associated with higher than normal FAPAR values during approximately the entire growing season of grapevines (Figure 5a). In contrast, the low wine production years are associated with lower than normal FAPAR values. It should be noted that from June to November, the FAPAR anomaly values for high and low wine production years are very close. A clear distinction between high and low years is observed between December and May, with a sharp increase in FAPAR anomaly in December.
The anomalies of the LST MEAN (Figure 5b) and LST MAX (Figure 5c) indicate that high wine production years are linked to higher than normal values of both parameters from April to August. The vegetative stages of the grapevines, soon after the budburst stage (March) are favoured by higher than normal surface temperatures. This stage needs wet conditions and sunshine with temperatures above 10 °C for vineyard growth [12]. Grape phenology and berry composition are strongly driven by air temperature during the growth cycle [39]. Frozen temperatures and hail in growing vegetative cycle may damage and prevent vineyard development [40]. Accordingly, our results show that from budburst until veraison, lower than average surface temperatures are representative of low wine production years.
The wine production is also not favoured when surface temperatures are higher than normal during January to March. This fact might be related to the already mentioned premature budburst as a consequence of out-of-season warm weather, which expose the grapevine to eventual stressful conditions later on, such as damaging low temperatures to the newly bursting buds, therefore leading to a lower than average wine production year [12]. A negative/positive anomaly in November is also associated with higher/lower than average wine production years. Therefore, lower than normal maximum temperatures in the beginning of the grapevines dormancy stage (starts in November) are important for triggering and setting this vegetative stage. As also mentioned by Gouveia et al. [12] the dormancy stage is an important period of the vineyard vegetative cycle, when high values of soil moisture are desirable.

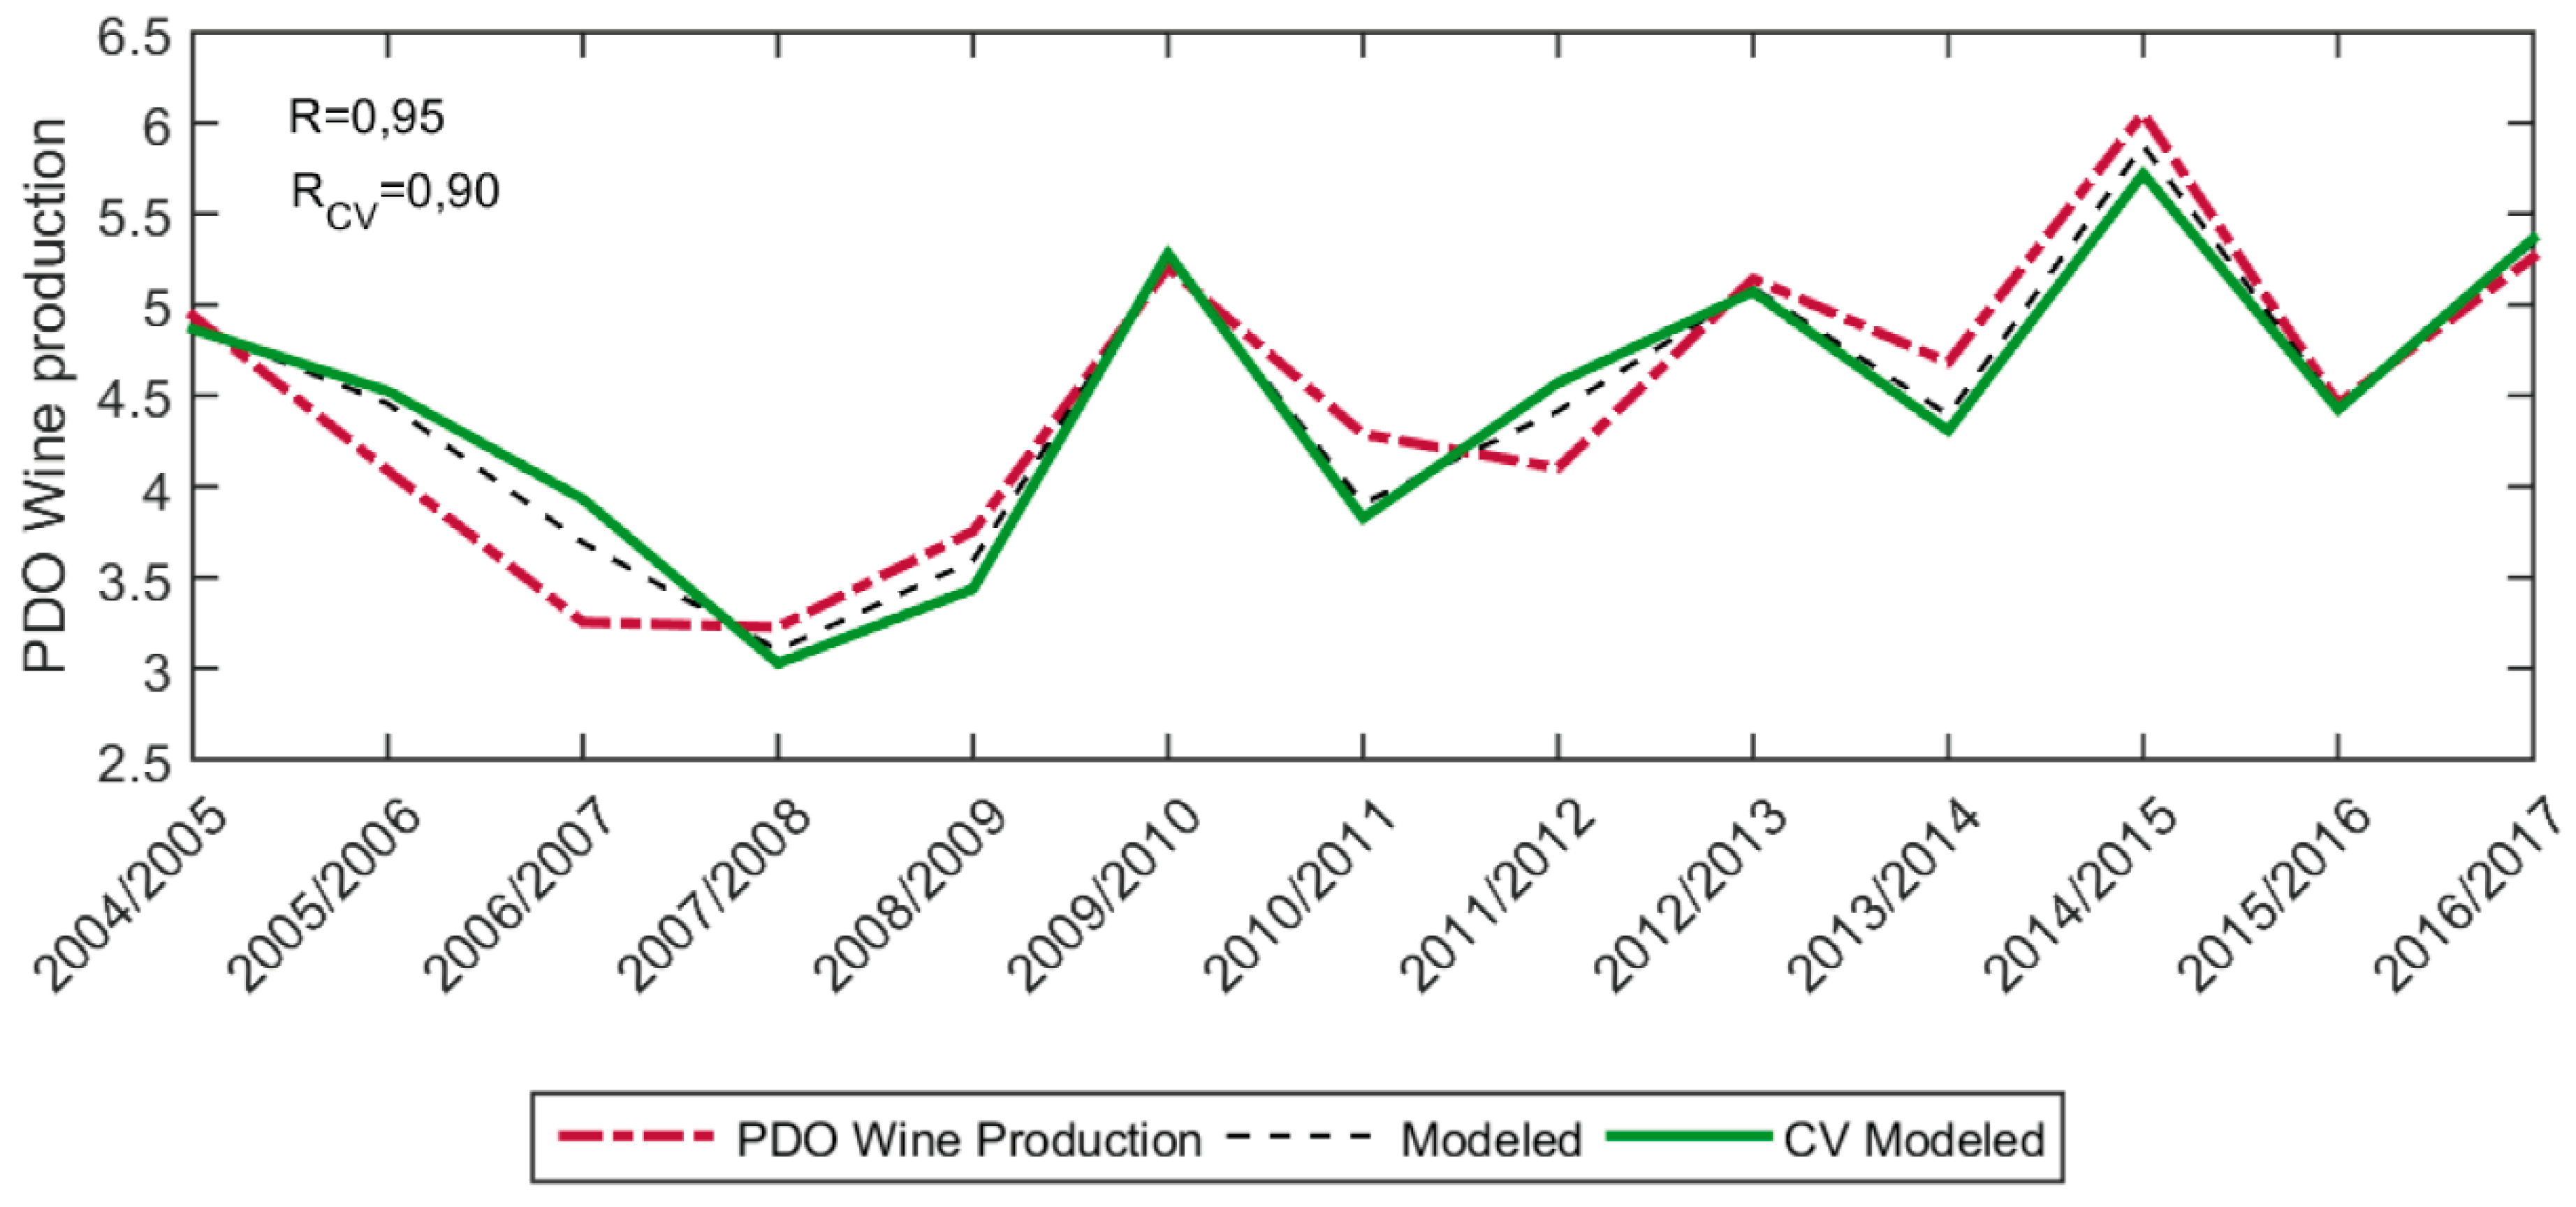
3.2. Modelling Douro Wine Production using Remotely Sensed CDRs

The results obtained in the previous section highlighted the strong power of remotely sensed datasets, namely FAPAR and MEAN and LST MAX, to monitor production of table wine in Douro region, suggesting therefore to develop a simple model of wine production based on CDRs covering the period from 2004 until 2017.
The stepwise regression used in the statistical modelling of the DDR PDO wine production selected the most significant predictors (at 95% confidence level): December FAPAR, July LST MEAN and March LST MAX. Table 1 presents the p-values and the F-statistics p-value of the selected predictors.
As mentioned before, March LST MAX may be seen as a proxy for the absence of frost, and therefore be related with March-LST MIN. An exercise replacing March LST MAX by March LST MIN was performed, and the quality of the obtained model was lower than the model presented in this section. Another important feature is related the addition of extra predictors to the model does not necessary lead to a better performance of the model, especially when the best and more representative predictors are already included and especially if they are correlated between them. Moreover, the inclusion of additional predictors may lead to overfitting that is usually detected by leave-one-out cross-validation and therefore should be avoid.
It should be noted that, although not shown, the inclusion of other combinations of those predictors (e.g., seasonal instead of monthly averages of the LST diurnal cycle or FAPAR, or spring-to-summer LST increase) do not lead to better models. Indeed, morphological change and leaf appearance occurs every 3–7 days [41] and often agricultural systems are very sensitive to thermal/dryness conditions at specific moments of their vegetative cycle, since those conditions could enable or disable the onset of the next growth stage.
The resulting model is expressed below and represented in Figure 6.
P D O   w i n e   p r o d u c t i o n = 4.50 + 0.30   F A P A R D e c + 0.79   L S T _ M E A N J u l + 0.26   L S T _ M A X M a r
Results for the considered period are presented in Figure 6, showing a very good agreement between observed and modelled time series of wine production. The linear model is able to explain 90% of the total variance of Douro wine production and the strength of the model is supported by the small p-value (p < 0.01%) of the F-test. Furthermore, the application of the leave-one-out cross-validation scheme supports the robustness of the regression model, leading to a slight decrease of the correlation coefficient obtained between the PDO wine production data and the modelled data: from 0.95 without to 0.90 when using the leave-one-out procedure.
The inclusion of LST in the retained predictors in the modelling process is an indication of the crucial role of temperature in the budburst (March LST MAX) and veraison stages (July LST MEAN) of vineyard growth cycle [39].
The December FAPAR predictor, although not representing the vegetative stage of higher photosynthetic activity of the grapevines, points out that the soil conditions of the vineyards are likely in their optimum during the dormancy stage. The high anomaly of FAPAR in December for the years of high wine production confirms the significance of the selected predictor in the modelling process. As already mentioned, this parameter also reflects the vegetative conditions of the soil cover that separates the rows of grapevines. One should mention that the practice of growth of green manure crops is often used and advised as a cost-effective measure of vineyard soil maintenance to increase soil organic matter, improve soil structure or even prevent erosion. In the DDR, such measures are of utmost importance due to terrain conditions that have high slopes, rocky shallow soils with low organic matter and moderate to high risk of erosion in more than half of the DDR area [1]. As stated previously, Gouveia et al. [12] also highlighted in their work the importance of the dormancy stage of the vineyard since it was found that the NDVI was a significance predictor for wine productivity during this stage. The findings of the present study are therefore also in agreement with the ones of these latter authors.
To anticipate the PDO wine production class (Wine-, Wine+, or intermediate) in the DDR for the 2018/2019 year (not know at the time of writing this article), an analysis was made considering the values of the retained predictors’ anomalies (December FAPAR; July LST MEAN and March LST MAX), throughout the DDR wine production years (Figure 7).
As can be seen in Figure 7, the years classified as high-production years (PDO wine production above the 3rd quartile-diamond symbols) are associated with positive December FAPAR anomalies. On the other hand, years classified as low production years (PDO wine production below the 1st quartile-squared symbols) are associated mainly to negative December FAPAR anomalies (with exception for 2006/2007). This fact confirms the significance of the December FAPAR as predictor in the modelling process. The analysis puts forward to consideration that high production years benefit from values of close to normal March LST MAX. However, higher (lower) than normal LST MEAN in July is preeminent for high (low) production years. These conclusions are also validated in light of the characteristics of the predictors’ anomalies in the low wine production years: the lack of synchronism in occurrence of higher than normal December FAPAR; July LST MEAN and close to normal March LST MAX. It should be stressed that the most marked difference between high- and low-production years is associated with the LST Mean in July, which is in accordance with the highest coefficient of this predictor in the multi-regression equation (1). High (low) production years are corresponding to clearly positive (negative) anomalies.
Given this and interpreting the selected predictors’ anomalies from the current vegetative year, i.e., October to July from 2017/2018 satellite data (star symbol in Figure 7) it is expected that the ensuing PDO wine production for the DDR will be inferior, at least, to what is being considered a high production year in the present study. At the time of writing this article, the International Organisation of Vine and Wine [42] released a statement indicating that in Portugal, considering data from the grapes harvested, the national production for the 2018/2019 year is associated with a drop in production of 22% compared to the previous year setting the record to be the lowest in the last 6 years. This new information therefore corroborates the results inferred in this work.

4. Conclusions

The vegetative development of grapevines is orchestrated by very specific meteorological conditions. The supply of water and mineral nutrients affects the progress of vine development and consequently the quality of the grapes and the quantity of the later produced wine. Another strong influencer is temperature: not only it affects directly the quality of the grapes, but its balance is crucial for defining all vegetative stages kick-off, namely dormancy, budburst, flowering, veraison and maturation. Vineyards demand attentive monitoring especially in the wine industry where quality, productivity and economic potential go hand in hand. Considering this, winemakers rely on meteorological forecasts and regional climate indicators to support the vineyards management. For this task, satellite data are very convenient, since they are available, nowadays, from several sources free of charge with a good spatial resolution and time sampling.
In the present work, a set of parameters obtained exclusively from satellite data were tested for the statistical modelling of wine production. The study has been developed for the Douro wine region in northern part of Portugal. The region is of outmost cultural and economic importance: it is the oldest demarcated and controlled winemaking region of the world; as a demarcated region, the implementation of new technologies, agricultural practices and soil fertilization, is highly regulated, making the Douro wine strongly dependent on climate variability. The wine production time series used here represent only PDO wine produced in the region.
The FAPAR parameter derived from satellite images is also evaluated in terms of its suitability as a representative index of the vegetative health of the vineyards throughout the yearly growing cycle of the grapevines. NDVI is a widely used index to assess vegetation state, and in particular to monitor vineyards. However, FAPAR is directly linked to the plants’ photosynthesis capacity, and therefore closer to plant health. This study confirms that FAPAR is indeed suited to addressing the canopy vigour, in line with previous works. The annual cycle of FAPAR is showed to be in agreement with the expected photosynthetic activity pattern considering the development stages of the vineyards.
The statistical modelling of PDO wine production was performed using stepwise regression with monthly mean values of FAPAR and LST as predictors. FCV and LAI were tested, but not chosen by stepwise regression, as they are highly correlated with FAPAR. The predictors retained from the selection at 95% confidence level were December-FAPAR, July LST MEAN and March-LST MAX and the regression model obtained explained 90% of the total variance of PDO wine production. The robustness of the model is reflected in the 0.90 correlation coefficient obtained using a leave-one-out cross validation scheme. Since FAPAR also reflects the vegetative conditions of the soil coverage between rows of grapevines, the selection of the December FAPAR predictor points out the importance of the vineyard soil conditions during the dormancy stage. The results hint that the soil conditions are likely at their optimum during this vegetative stage. The significant influence of temperature in the budburst and veraison stages was also substantiated by the remaining retained predictors: March LST MAX and July LST MEAN.
The strength of the relationship between the wine production data and the retained predictors was also investigated through an anomaly analysis of their link with years with high and low wine production. High wine production years are associated with higher than normal FAPAR values during almost the entire growing season, and higher than normal values of both LST MEAN and LST MAX from April to August. Low wine production years are associated with higher than normal surface temperatures during January to March. It is considered that these unseasonal higher than normal winter surface temperatures likely lead to premature budburst which followed by exposure of the newly bursting buds to lower temperatures at a later stage, leading to stress and possibly to irreversible damage.
The results obtained in this work indicate that using parameters obtained exclusively by remotely sensed data can provide useful information about wine yield and to represent the vegetative stages of the grapevines development. This work highlights that is possible to estimate wine production at regional scale-based solely on low resolution remotely sensed observations that are easily and freely accessible. Therefore, the approach presented in this study is a useful and easy tool for estimating wine production and agricultural monitoring.

Author Contributions

C.M. organized the data, produced the results and wrote the paper. I.F.T., C.M.G. and C.M.B. provided helpful insight in the discussion of the results, read the paper and contributed to its organization.

Acknowledgments

Research by Clarisse Magarreiro was funded by the Portuguese Foundation for Science and Technology (FCT) under project CLIMALERT (ERA4CS/0004/2016).

Conflicts of Interest

The authors declare no conflict of interest.

References

  1. Fraga, H.; Malheiro, A.C.; Moutinho-Pereira, J.; Santos, J.A. An overview of climate change impacts on European viticulture. Food Energy Secur. 2012, 1, 94–110. [Google Scholar] [CrossRef]
  2. Malheiro, A.C.; Santos, J.A.; Fraga, H.; Pinto, J.G. Climate change scenarios applied to viticultural zoning in Europe. Clim. Res. 2010, 43, 163–177. [Google Scholar] [CrossRef] [Green Version]
  3. Sun, L.; Gao, F.; Anderson, M.C.; Kustas, W.P.; Alsina, M.M.; Sanchez, L.; Alfieri, J.G. Daily mapping of 30 m LAI and NDVI for Grape Yield Prediction in California Vineyards. Remote Sens. 2017, 9, 317. [Google Scholar] [CrossRef]
  4. Tatem, A.J. Global climate matching: Satellite imagery as a tool for mapping vineyard suitability. J. Wine Res. 2005, 16, 19–32. [Google Scholar] [CrossRef]
  5. Jones, G.V.; Alves, F. Impact of climate change on wine production: A global overview and regional assessment in the Douro Valley of Portugal. Int. J. Glob. Warm. 2012, 4, 383–406. [Google Scholar] [CrossRef]
  6. Pettorelli, N.; Vik, J.O.; Mysterud, A.; Gaillard, J.M.; Tucker, C.J.; Stenseth, N.C. Using the satellite derived NDVI to assess ecological responses to environmental change. Trends Ecol. Evol. 2005, 20, 503–510. [Google Scholar] [CrossRef] [PubMed]
  7. Pickett-Heaps, C.A.; Canadell, J.G.; Briggs, P.R.; Gobron, N.; Haverd, V.; Paget, M.J.; Raupach, M.R. Evaluation of six satellite derived Fraction of Absorbed Photosynthetic Active Radiation (FAPAR) products across the Australian continent. Remote Sens. Environ. 2014, 140, 241–256. [Google Scholar] [CrossRef]
  8. Johnson, L.F. Temporal stability of an NDVI-LAI relationship in a Napa Valley vineyard. Aust. J. Grape Wine Res. 2003, 9, 96–101. [Google Scholar] [CrossRef] [Green Version]
  9. Matese, A.; Toscano, P.; Di Gennaro, S.F.; Genesio, L.; Vaccari, F.P.; Primicerio, J.; Gioli, B. Intercomparison of UAV, aircraft and satellite remote sensing platforms for precision viticulture. Remote Sens. 2015, 7, 2971–2990. [Google Scholar] [CrossRef]
  10. Anastasiou, E.; Balafoutis, A.; Darra, N.; Psiroukis, V.; Biniari, A.; Xanthopoulos, G.; Fountas, S. Satellite and Proximal Sensing to Estimate the Yield and Quality of Table Grapes. Agriculture 2018, 8, 94. [Google Scholar] [CrossRef]
  11. Cunha, M.; Marçal, A.R.; Silva, L. Very early prediction of wine yield based on satellite data from VEGETATION. Int. J. Remote Sens. 2010, 31, 3125–3142. [Google Scholar] [CrossRef]
  12. Gouveia, C.; Liberato, M.L.R.; DaCamara, C.C.; Trigo, R.M.; Ramos, A.M. Modelling past and future wine production in the Portuguese Douro Valley. Clim. Res. 2011, 48, 349–362. [Google Scholar] [CrossRef] [Green Version]
  13. Andresen, T.; De Aguiar, F.B.; Curado, M.J. The Alto Douro wine region greenway. Landsc. Urban Plan. 2004, 68, 289–303. [Google Scholar] [CrossRef]
  14. Fensholt, R.; Sandholt, I.; Rasmussen, M.S. Evaluation of MODIS LAI, fAPAR and the relation between fAPAR and NDVI in a semi-arid environment using in situ measurements. Remote Sens. Environ. 2004, 91, 490–507. [Google Scholar] [CrossRef]
  15. García-Haro, F.J.; Camacho, F.; Verger, A.; Meliá, J. Current status and potential applications of the LSA-SAF suite of vegetation products. In Proceedings of the 29th EARSeL Symposium, Chania, Greece, 15–18 June 2009. [Google Scholar]
  16. LSA-SAF (2016). Algorithm Theoretical Basis Document for Vegetation parameters (VEGA). Ref: SAF/LAND/UV/ATBD_VEGA/2.0. Available online: https://landsaf.ipma.pt (accessed on 1 February 2019).
  17. Martínez, B.; Camacho, F.; Verger, A.; García-Haro, F.J.; Gilabert, M.A. Intercomparison and quality assessment of MERIS, MODIS and SEVIRI FAPAR products over the Iberian Peninsula. Int. J. Appl. Earth Obs. Geoinf. 2013, 21, 463–476. [Google Scholar] [CrossRef]
  18. OIV—International Organisation of Vine and Wine. State of the Vitiviniculture World Market—April 2018. Available online: http://www.oiv.int (accessed on 1 February 2019).
  19. Cunha, M.; Richter, C. Impact of Climate Dynamics on Cyclical Properties of Wine Production in Douro Region Using a Time-Frequency Approach (No. 47); Faculty of Management Technology, German University in Cairo: New Cairo, Egypt, 2018. [Google Scholar]
  20. Real, A.C.; Borges, J.; Cabral, J.S.; Jones, G.V. Partitioning the grapevine growing season in the Douro Valley of Portugal: Accumulated heat better than calendar dates. Int. J. Biometeorol. 2015, 59, 1045–1059. [Google Scholar] [CrossRef]
  21. Santos, J.A.; Grätsch, S.D.; Karremann, M.K.; Jones, G.V.; Pinto, J.G. Ensemble projections for wine production in the Douro Valley of Portugal. Clim. Chang. 2013, 117, 211–225. [Google Scholar] [CrossRef]
  22. Cunha, M.; Marçal, A.R.; Rodrigues, A. A comparative study of satellite and ground based vineyard phenology. In Proceedings of the 29th EARSeL Symposium, Chania, Greece, 15–18 June 2009; pp. 68–77. [Google Scholar]
  23. Santos, J.A.; Malheiro, A.C.; Karremann, M.K.; Pinto, J.G. Statistical modelling of grapevine yield in the Port Wine region under present and future climate conditions. Int. J. Biometeorol. 2011, 55, 119–131. [Google Scholar] [CrossRef]
  24. IVV—Instituto do Vinho e da Vinha. Available online: http://www.ivv.gov.pt (accessed on 1 February 2019).
  25. Trigo, I.F.; Dacamara, C.C.; Viterbo, P.; Roujean, J.L.; Olesen, F.; Barroso, C.; Camacho-de-Coca, F.; Carrer, D.; Freitas, S.C.; Garcia-Haro, J.; et al. The Satellite Application Facility on Land Surface Analysis. Int. J. Remote Sens. 2011, 32, 2725–2744. [Google Scholar] [CrossRef]
  26. LSA-SAF (2009). Validation Report for Land Surface Temperature (LST). Ref: SAF/LAND/IM/VR_LST/I_09. Available online: https://landsaf.ipma.pt (accessed on 1 February 2019).
  27. LSA-SAF (2018). Validation Report for Vegetation parameters (VEGA). Ref: SAF/LAND/UV/VR_VEGA_MSG/3.1.. Available online: https://landsaf.ipma.pt (accessed on 1 February 2019).
  28. Jin, M.; Dickinson, R.E. Land surface skin temperature climatology: Benefitting from the strengths of satellite observations. Environ. Res. Lett. 2010, 5, 044004. [Google Scholar] [CrossRef]
  29. Freitas, S.C.; Trigo, I.F.; Bioucas-Dias, J.M.; Gottsche, F.M. Quantifying the uncertainty of land surface temperature retrievals from SEVIRI/Meteosat. IEEE Trans. Geosci. Remote Sens. 2010, 48, 523–534. [Google Scholar] [CrossRef]
  30. Roujean, J.L.; Breon, F.M. Estimating PAR absorbed by vegetation from bidirectional reflectance measurements. Remote Sens. Environ. 1995, 51, 375–384. [Google Scholar] [CrossRef]
  31. European Commission regulation (EC). No 607/2009 (2009). Laying down certain detailed rules for the implementation of Council Regulation (EC) No 479/2008 as regards protected designations of origin and geographical indications, traditional terms, labelling and presentation of certain wine sector products. Off. J. Eur. Union 2009, 193, 60–139. [Google Scholar]
  32. Wilks, D.S. Statistical Methods in the Atmospheric Sciences; Academic Press: Cambridge, MA, USA, 2006. [Google Scholar]
  33. Field, S.K.; Smith, J.P.; Holzapfel, B.P.; Hardie, W.J.; Emery, R.N. Grapevine response to soil temperature: Xylem cytokinins and carbohydrate reserve mobilization from budbreak to anthesis. Am. J. Enol. Vitic. 2009, 60, 164–172. [Google Scholar]
  34. Mullins, M.G.; Bouquet, A.; Williams, L.E. Biology of the Grapevine; Cambridge University Press: Cambridge, UK, 1992. [Google Scholar]
  35. Marçal, A.R.; Gonçalves, J.A.; Gonçalves, H.; Cunha, M. Analysis of the temporal signature of vineyards in Portugal using VEGETATION. In Proceedings of the 26th EARSeL Symposium, New Developments and Challenges in Remote Sensing, Warsaw, Poland, 29 May–2 June 2006; Millpress: Rotterdam, The Netherlands, 2007; pp. 377–384. [Google Scholar]
  36. Malheiro, A.C.; Campos, R.; Fraga, H.; Eiras-Dias, J.; Silvestre, J.; Santos, J.A. Winegrape phenology and temperature relationships in the Lisbon Wine Region, Portugal. J. Int. Des. Sci. De La Vigne Et Du Vin 2013, 47, 287–299. [Google Scholar] [CrossRef]
  37. Wolf, T.K.; Boyer, J.D. Vineyard Site SelectionVirginia Tech; Virginia State University: Blacksburg, VA, USA, 2003. [Google Scholar]
  38. Ferguson, J.C.; Moyer, M.M.; Mills, L.J.; Hoogenboom, G.; Keller, M. Modeling dormant bud cold hardiness and budbreak in twenty-three Vitis genotypes reveals variation by region of origin. Am. J. Enol. Vitic. 2014, 65, 59–71. [Google Scholar] [CrossRef]
  39. Keller, M. The Science of Grapevines: Anatomy and Physiology; Academic Press: Cambridge, MA, USA, 2015. [Google Scholar]
  40. ADVID—Associação para o Desenvolvimento da Viticultura Duriense. Available online: http://www.advid.pt/imagens/comunicacoes/14585596628243.pdf (accessed on 20 February 2019).
  41. Kogan, F.N. Global drought watch from space. Bull. Am. Meteorol. Soc. 1997, 78, 621–636. [Google Scholar] [CrossRef]
  42. OIV—International Organisation of Vine and Wine. Global Economic Vitiviniculture Data—October, 26th 2018. Available online: http://www.oiv.int/en/oiv-life/press-releasenbspglobal-vitiviniculture-data (accessed on 1 February 2019).
Figure 1. (a) Douro region and its typical vineyards landscape (e), (b) pixels classified as vineyards from the CLC map after resolution and projection matching to MSG images (example of the CLC06), (c) location of the selected pixels after vineyard persistence analysis, and (d) zoomed identification of the selected pixels used in this study.
Remotesensing 11 00604 g001
Figure 2. Typical annual cycle of grapevine growth in the DDR.
Remotesensing 11 00604 g002
Figure 3. PDO wine production in the DDR for the period 2004/2005 – 2016/2017. Red (green) circles indicate years characterised by Douro Wine Production above (below) the 3rd (1st) quartile, i.e., Wine + (Wine -).
Remotesensing 11 00604 g003
Figure 4. Annual cycle of the satellite data from the pixels selected as vineyards in the DDR: (a) FAPAR; (b) LST MEAN and (c) LST MAX. Boxes represent upper and lower quartiles, including median as central line. The whiskers stating the lowest and highest observed value within 1.5 of the interquartile range. The outliers represented by + correspond to the values beyond the ends of the whiskers.
Remotesensing 11 00604 g004
Figure 5. Annual cycles of monthly composites of anomalies for the selected predictors in the modelling process of the PDO wine production for the DDR: (a) FAPAR; (b) LST MEAN and (c) LST MAX. Wine + ( − ) class represents the anomalies associated with PDO wine production years above the 3rd quartile (below the 1st quartile).
Remotesensing 11 00604 g005
Figure 6. Modelled values obtained from the leave-one-out cross validation (CV) procedure (green) of PDO wine production for the DDR and correspondent observed values (red). Modelled values without cross validation are also shown by the dashed black line. All values in 107 L.
Remotesensing 11 00604 g006
Figure 7. Anomalies of the retained predictors—December FAPAR; July LST MEAN and March LST MAX—throughout the DDR wine production years. Squared symbols represent the Wine - class (PDO wine production above the 3rd quartile) and diamond symbols represent the Wine + class (PDO wine production below the 1st quartile). Star symbol represents the conditions of the current year and circles the remaining wine production years.
Remotesensing 11 00604 g007
Table 1. p-values and F-statistics of the predictors selected with the stepwise regression modelling approach.
Predictorsp-Value
FAPARDec0.0005
LST MEANJul< 0.0001
LST MAXMar0.0017
F-statistic< 0.0001

