Article

Extending Nighttime Combustion Source Detection Limits with Short Wavelength VIIRS Data

1
Earth Observation Group, NOAA National Centers for Environmental Information, Boulder, CO 80305, USA
2
Cooperative Institute for Research in Environmental Sciences, 216 UCB, University of Colorado Boulder, Boulder, CO 80309, USA
3
Space Dynamics and Mathematical Information Processing, Space Research Institute of the Russian Academy of Sciences, Moscow 117997, Russia
*
Author to whom correspondence should be addressed.
Remote Sens. 2019, 11(4), 395; https://doi.org/10.3390/rs11040395
Submission received: 17 October 2018 / Revised: 29 January 2019 / Accepted: 4 February 2019 / Published: 15 February 2019
(This article belongs to the Special Issue Remote Sensing of Night Lights – Beyond DMSP)

Abstract

:
The Visible Infrared Imaging Radiometer Suite (VIIRS) collects low light imaging data at night in five spectral bands. The best known of these is the day/night band (DNB) which uses light intensification for imaging of moonlit clouds in the visible and near-infrared (VNIR). The other four low light imaging bands are in the NIR and short-wave infrared (SWIR), designed for daytime imaging, which continue to collect data at night. VIIRS nightfire (VNF) tests each nighttime pixel for the presence of sub-pixel IR emitters across six spectral bands with two bands each in three spectral ranges: NIR, SWIR, and MWIR. In pixels with detection in two or more bands, Planck curve fitting leads to the calculation of temperature, source area, and radiant heat using physical laws. An analysis of January 2018 global VNF found that inclusion of the NIR and SWIR channels results in a doubling of the VNF pixels with temperature fits over the detection numbers involving the MWIR. The addition of the short wavelength channels extends detection limits to smaller source areas across a broad range of temperatures. The VIIRS DNB has even lower detection limits for combustion sources, reaching 0.001 m2 at 1800 K, a typical temperature for a natural gas flare. Comparison of VNF tallies and DNB fire detections in a 2015 study area in India found the DNB had 15 times more detections than VNF. The primary VNF error sources are false detections from high energy particle detections (HEPD) in space and radiance saturation on some of the most intense events. The HEPD false detections are largely eliminated in the VNF output by requiring multiband detections for the calculation of temperature and source size. Radiance saturation occurs in about 1% of the VNF detections and occurs primarily in the M12 spectral band. Inclusion of the radiances affected by saturation results in temperature and source area calculation errors. Saturation is addressed by identifying the presence of saturation and excluding those radiances from the Planck curve fitting. The extremely low detection limits for the DNB indicates that a DNB fire detection algorithm could reveal vast numbers of combustion sources that are undetectable in longer wavelength VIIRS data. The caveats with the DNB combustion source detection capability is that it should be restricted to pixels that are outside the zone of known VIIRS detected electric lighting.

Graphical Abstract

1. Introduction

Satellite based fire detection products trace their roots back to the National Oceanic and Atmospheric Administration (NOAA) Advanced Very High Resolution Radiometer (AVHRR), first launched in 1978. One of the phenomena observed in early AVHRR data were sub-pixel infrared emitters, such as biomass burning. In 1981, two papers were published [1,2] reporting on a multispectral method to extract temperature and source size for sub-pixel IR emitters with mid-wave infrared (MWIR) and long-wave infrared (LWIR) data. Referred to as the “Dozier method”, this only works for pixels with IR emitter detection in both spectral ranges. This vastly reduced the number of pixels for which the Dozier method could be successfully applied. Following that burst of innovation, satellite fire remote sensing settled in to MWIR hotspot detection. The second generation algorithms operated by comparing the brightness temperatures (BT) in the mid-wave infrared (~4 μm) with the long-wave infrared (11 μm) [3,4,5,6]. If the MWIR BT exceeded the LWIR by a certain amount, the pixel was marked as a hot spot. The basis for the MWIR algorithms comes from Planck’s Law, which states that hot objects have their peak radiant emissions at shorter wavelengths than cooler objects. It should be noted that the BTs calculated for fire pixels do not represent true temperature of subpixel IR emitters, such as fires. This is because the single band BT is only a valid representation where the object fills the pixel entirely [1,7]. With detection in a single spectral band, it is not possible to apply Planck’s Law to derive temperature, source area and radiant output using physical laws. In place, for the MWIR fire product output, an empirical “Fire Radiative Power” (FRP) function was developed empirically [8,9,10] using radiative output measurements from known quantities of burning biomass. One of the shortcomings of FRP is that it is only valid over a narrow range of temperatures. The standard FRP is calibrated for range of 700 to 1300 K, the temperature range of flaming phase biomass burning. The contextual AVHRR fire detection algorithm was the heritage for both the operational MODIS (Moderate Resolution Imaging Spectrometer) and VIIRS (Visible Infrared Imaging Radiometer Suite) fire product algorithms [10,11]. More recently, a higher spatial resolution VIIRS MWIR fire product based on the VIIRS imaging bands has been introduced [12,13].
There are currently two VIIRS instruments collecting daily global data. The original VIIRS instrument was launched in 2011 on the NASA/NOAA Suomi National Polar Partnership (SNPP) satellite. The second VIIRS was launched in 2017 on the Joint Polar Satellite System (JPSS) NOAA-20 satellite. There are three additional VIIRS instruments planned, to be launched on nominal five year increments.
The VIIRS is unusual in that it continues to collect data in two near infrared (NIR) and shortwave infrared (SWIR) channels at night. Originally, the SNPP VIIRS only collected one SWIR band at night, the M10 band at 1.6 μm. The authors requested data collection from the second SWIR band, M11 at 2.2 μm, and these began in January 2018. The J1 VIIRS has collected nighttime data from both SWIR bands from the start of collections. The NIR and SWIR VIIRS bands are designed as daytime imaging channels. In the absence of sunlight the images primarily record the sensor background noise, which is punctuated by small clusters of IR emitters, including biomass burning and gas flaring. This is a style of low light imaging in that the IR emitters are only obvious in the absence of sunlight. Similar spectral channels are found on many multispectral earth observing sensors, but the data collection is typically discontinued at night. This VIIRS capability led to the development of VIIRS Nightfire (VNF) [14], a multispectral IR emitter algorithm that uses Planck curve fitting and physical laws to derive temperature (K), source area (m2), and radiant heat (watts/m2). Using this multispectral approach it has been possible to solve for these terms for sources ranging from 600 to 6000 K using a combination of Planck’s Law, Wein’s Displacement Law, and the Stefan–Boltzmann’s Law. The nightfire algorithm was recently adapted for gas flare monitoring with data from Sea and Land Surface Temperature Radiometer (SLSTR) instrument aboard European Space Agency’s (ESA’s) Sentinel-3 satellite [15].
At night, VIIRS also collects low-light imaging data in a broad visible and NIR day/night band (DNB) [16]. One of the high demand VIIRS products is called nighttime lights, depicting the location and brightness of electric lighting. The forerunner for VIIRS nighttime lights are the Defense Meteorological Satellite Program (DMSP) nighttime lights, which extend from 1992 to 2013. One of the critical steps in producing nighttime lights is the removal of detections from biomass burning. In developing the VIIRS nighttime lights algorithm suite, our original plan was to use VIIRS nightfire data to filter out pixels contaminated by radiant emissions from IR emitters. What we discovered is that there are large numbers of VIIRS DNB biomass burning detections that are not detected by VIIRS nightfire [17]. In this paper, we examine the combustion source detection limits of the nighttime VIIRS bands (M7, 8, 10, 11, 12, 13, and DNB) both in terms of radiance and also temperature versus source area. In addition, we examine sources of error and how they are addressed in VNF.

2. VNF Methods

VNF runs detection algorithms on six spectral bands (M7, 8, 10, 11, 12, and 13). Detections in M10, M11, and M12&13 result in VNF records. That is to say, detections that occur in M7 and M8 that are not confirmed with SWIR or MWIR are dropped and not recorded. The DNB is not currently used in the VNF algorithm, though the DNB radiances of VNF local maximas are recorded in the VNF output. The DNB pixel selected as a VNF match is the one that contains the latitude/longitude from the VNF pixel center.
For the short wavelength M bands (7, 8, 10, and 11) the detection algorithm identifies pixels that exceed the mean plus four standard deviations. This algorithm is run on the four NIR and SWIR spectral bands separately. Essentially, the algorithm detects pixels with radiances that clearly exceed the sensor noise floor. One of the advantages of using the daytime channels at night is that the full detected radiance can be attributed to the IR emitter.
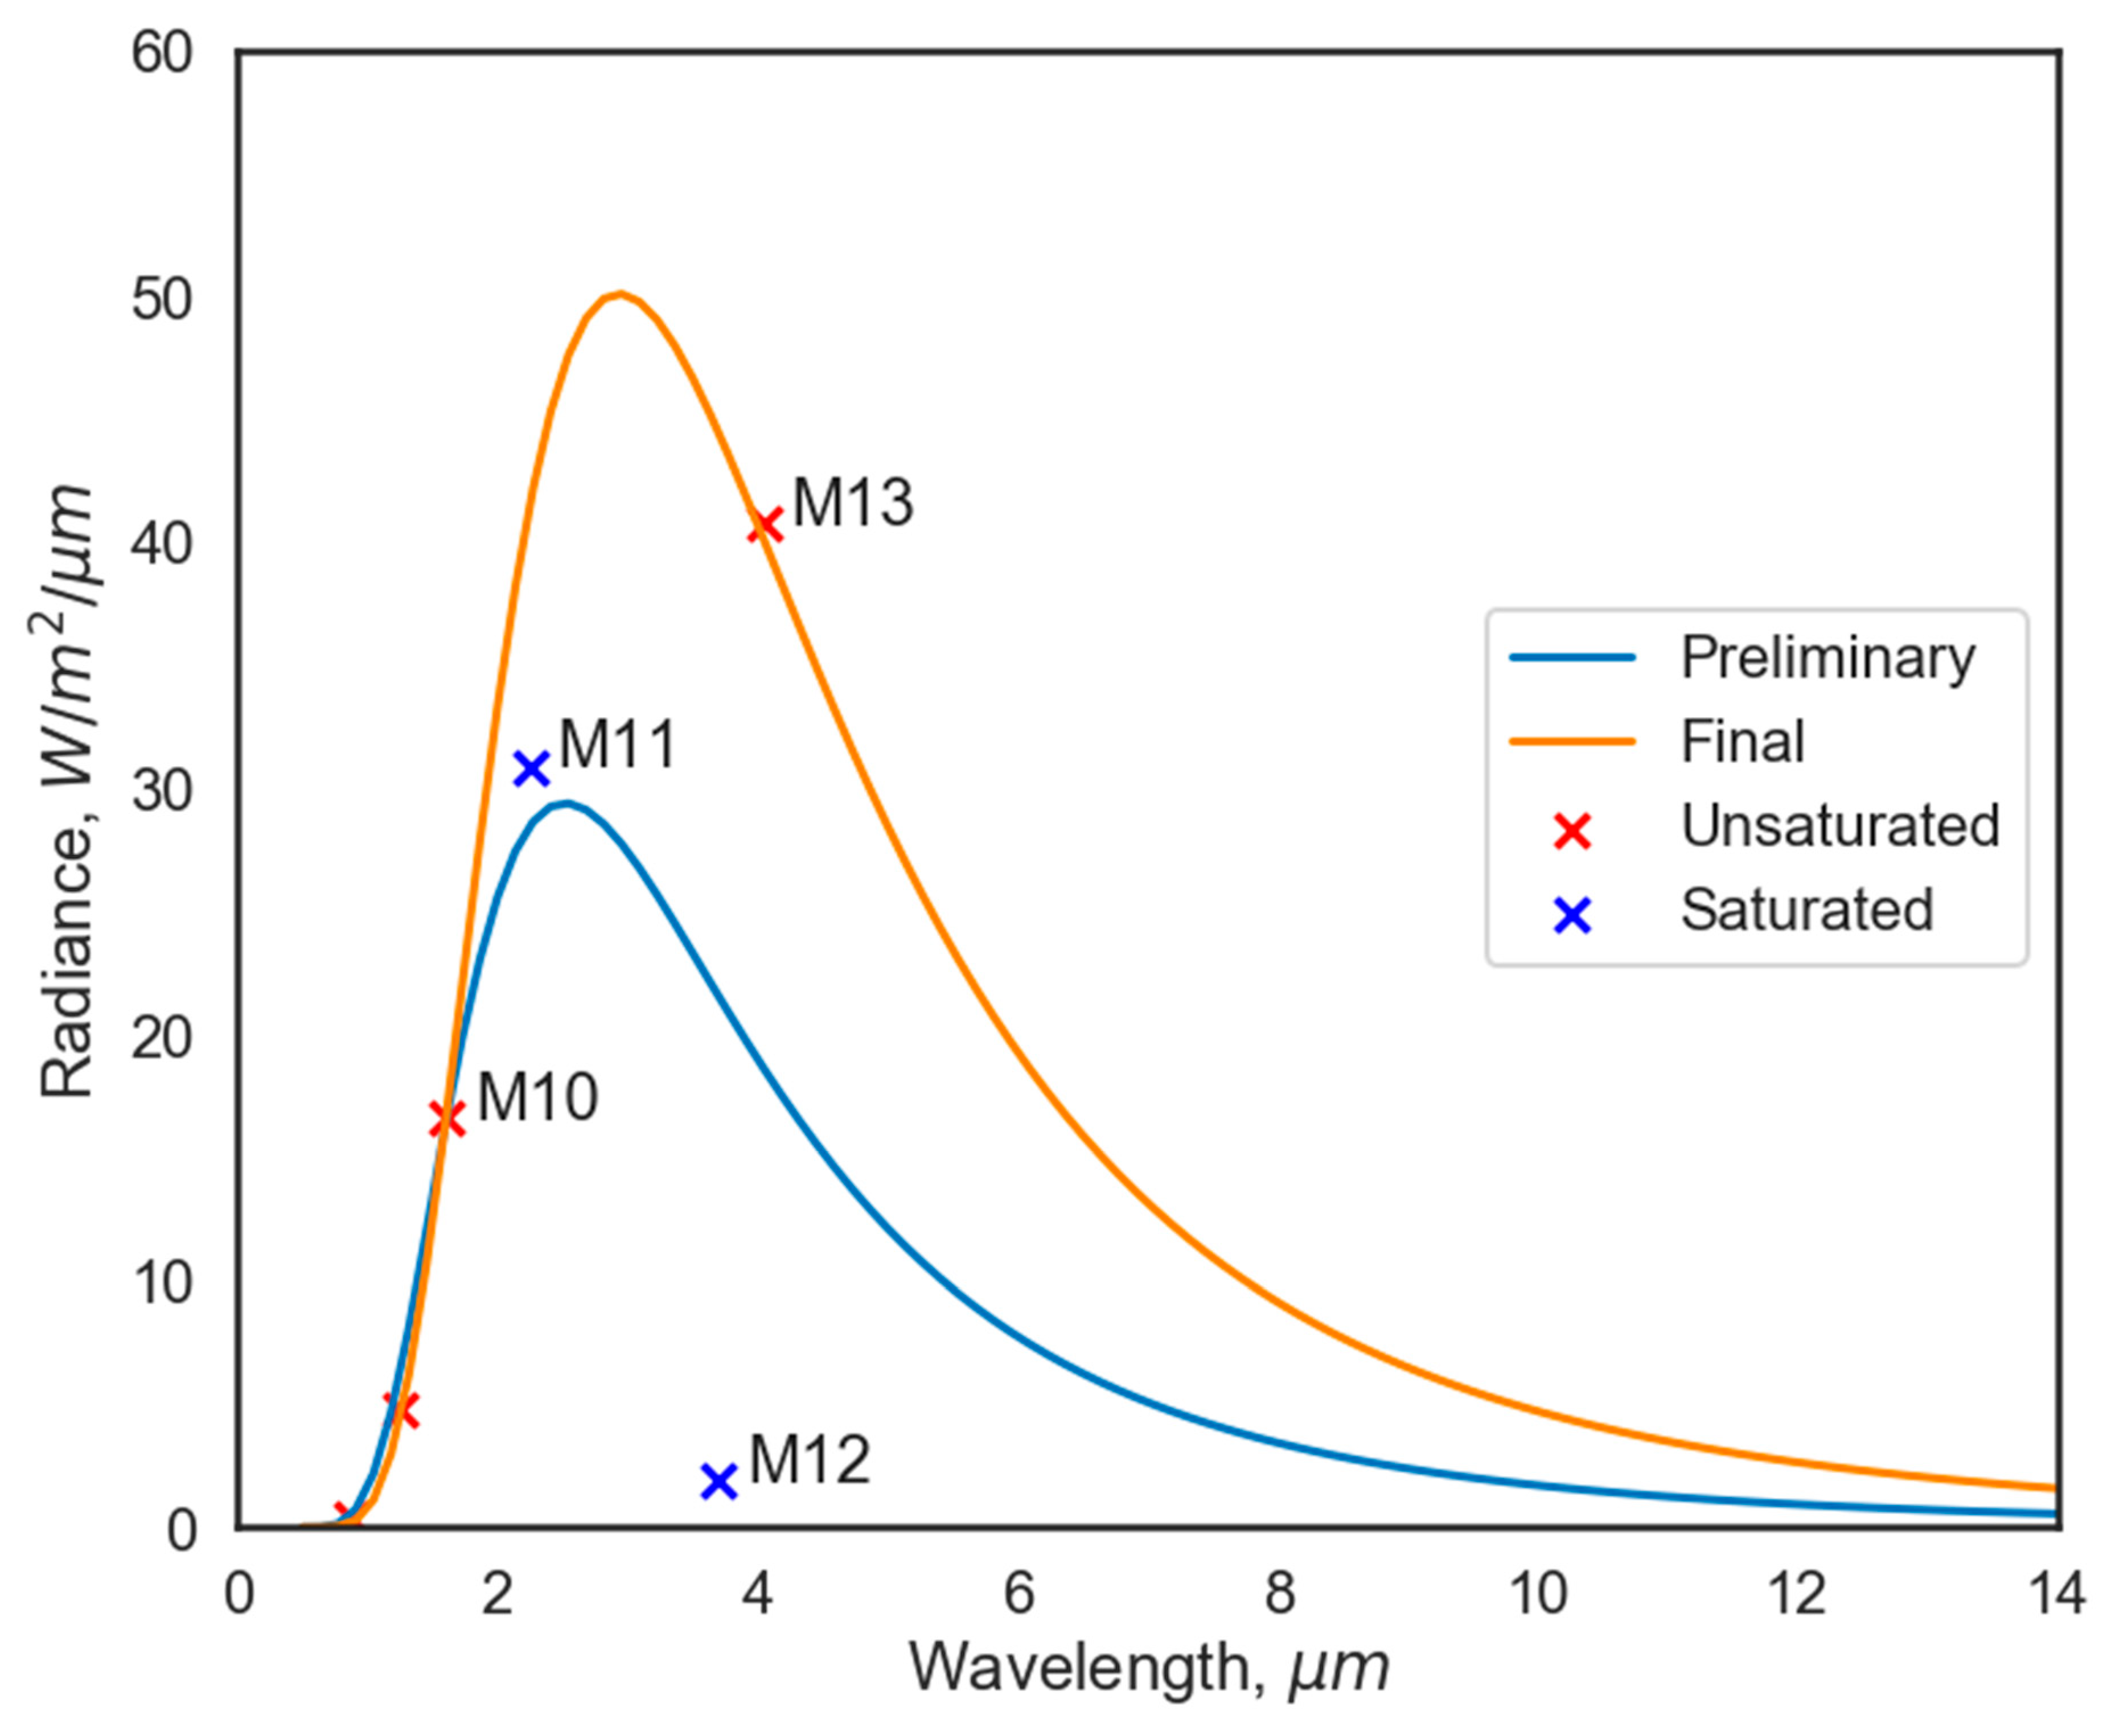
A second style of detection algorithm is run for the MWIR (bands M12 and M13), where the signal contains radiant emissions from the background and any IR emitter present in the pixel footprint. Because the MWIR channels are so close to each other in wavelength, the band specific emissivities of most background components (earth surface and clouds) are highly correlated. On top of this, the background temperatures fall in a narrow range with low values as compared to many combustion sources. The algorithm generates scattergrams of M12 and M13 radiances, which invariably contains a dense diagonal cluster of pixels corresponding to temperature variations of the background (Figure 1). Pixels containing IR emitters fall outside that diagonal data cloud. The MWIR detection algorithm operates on the scattergram images, identifying the dense diagonal, encasing the diagonal using a convex hull [18] and recording the outlier pixels as having IR emitters.
There are substantial numbers of low intensity detections surrounding both fire and flares arising from atmospheric scatter (glow). This is especially obvious in the daytime NIR and SWIR data collected at night. A top hat filter [19] is used to trim off glow surrounding pixels containing real IR emitters. Outside of the SNPP DNB, all the VIIRS bands have ground footprint overlap between adjacent lines, particularly pronounced in the outer third of the swaths. This is known as the bow-tie effect. VNF filters the detection duplicates associated with the bow-tie effect by requiring detections from adjacent scans be at least half a pixel apart.
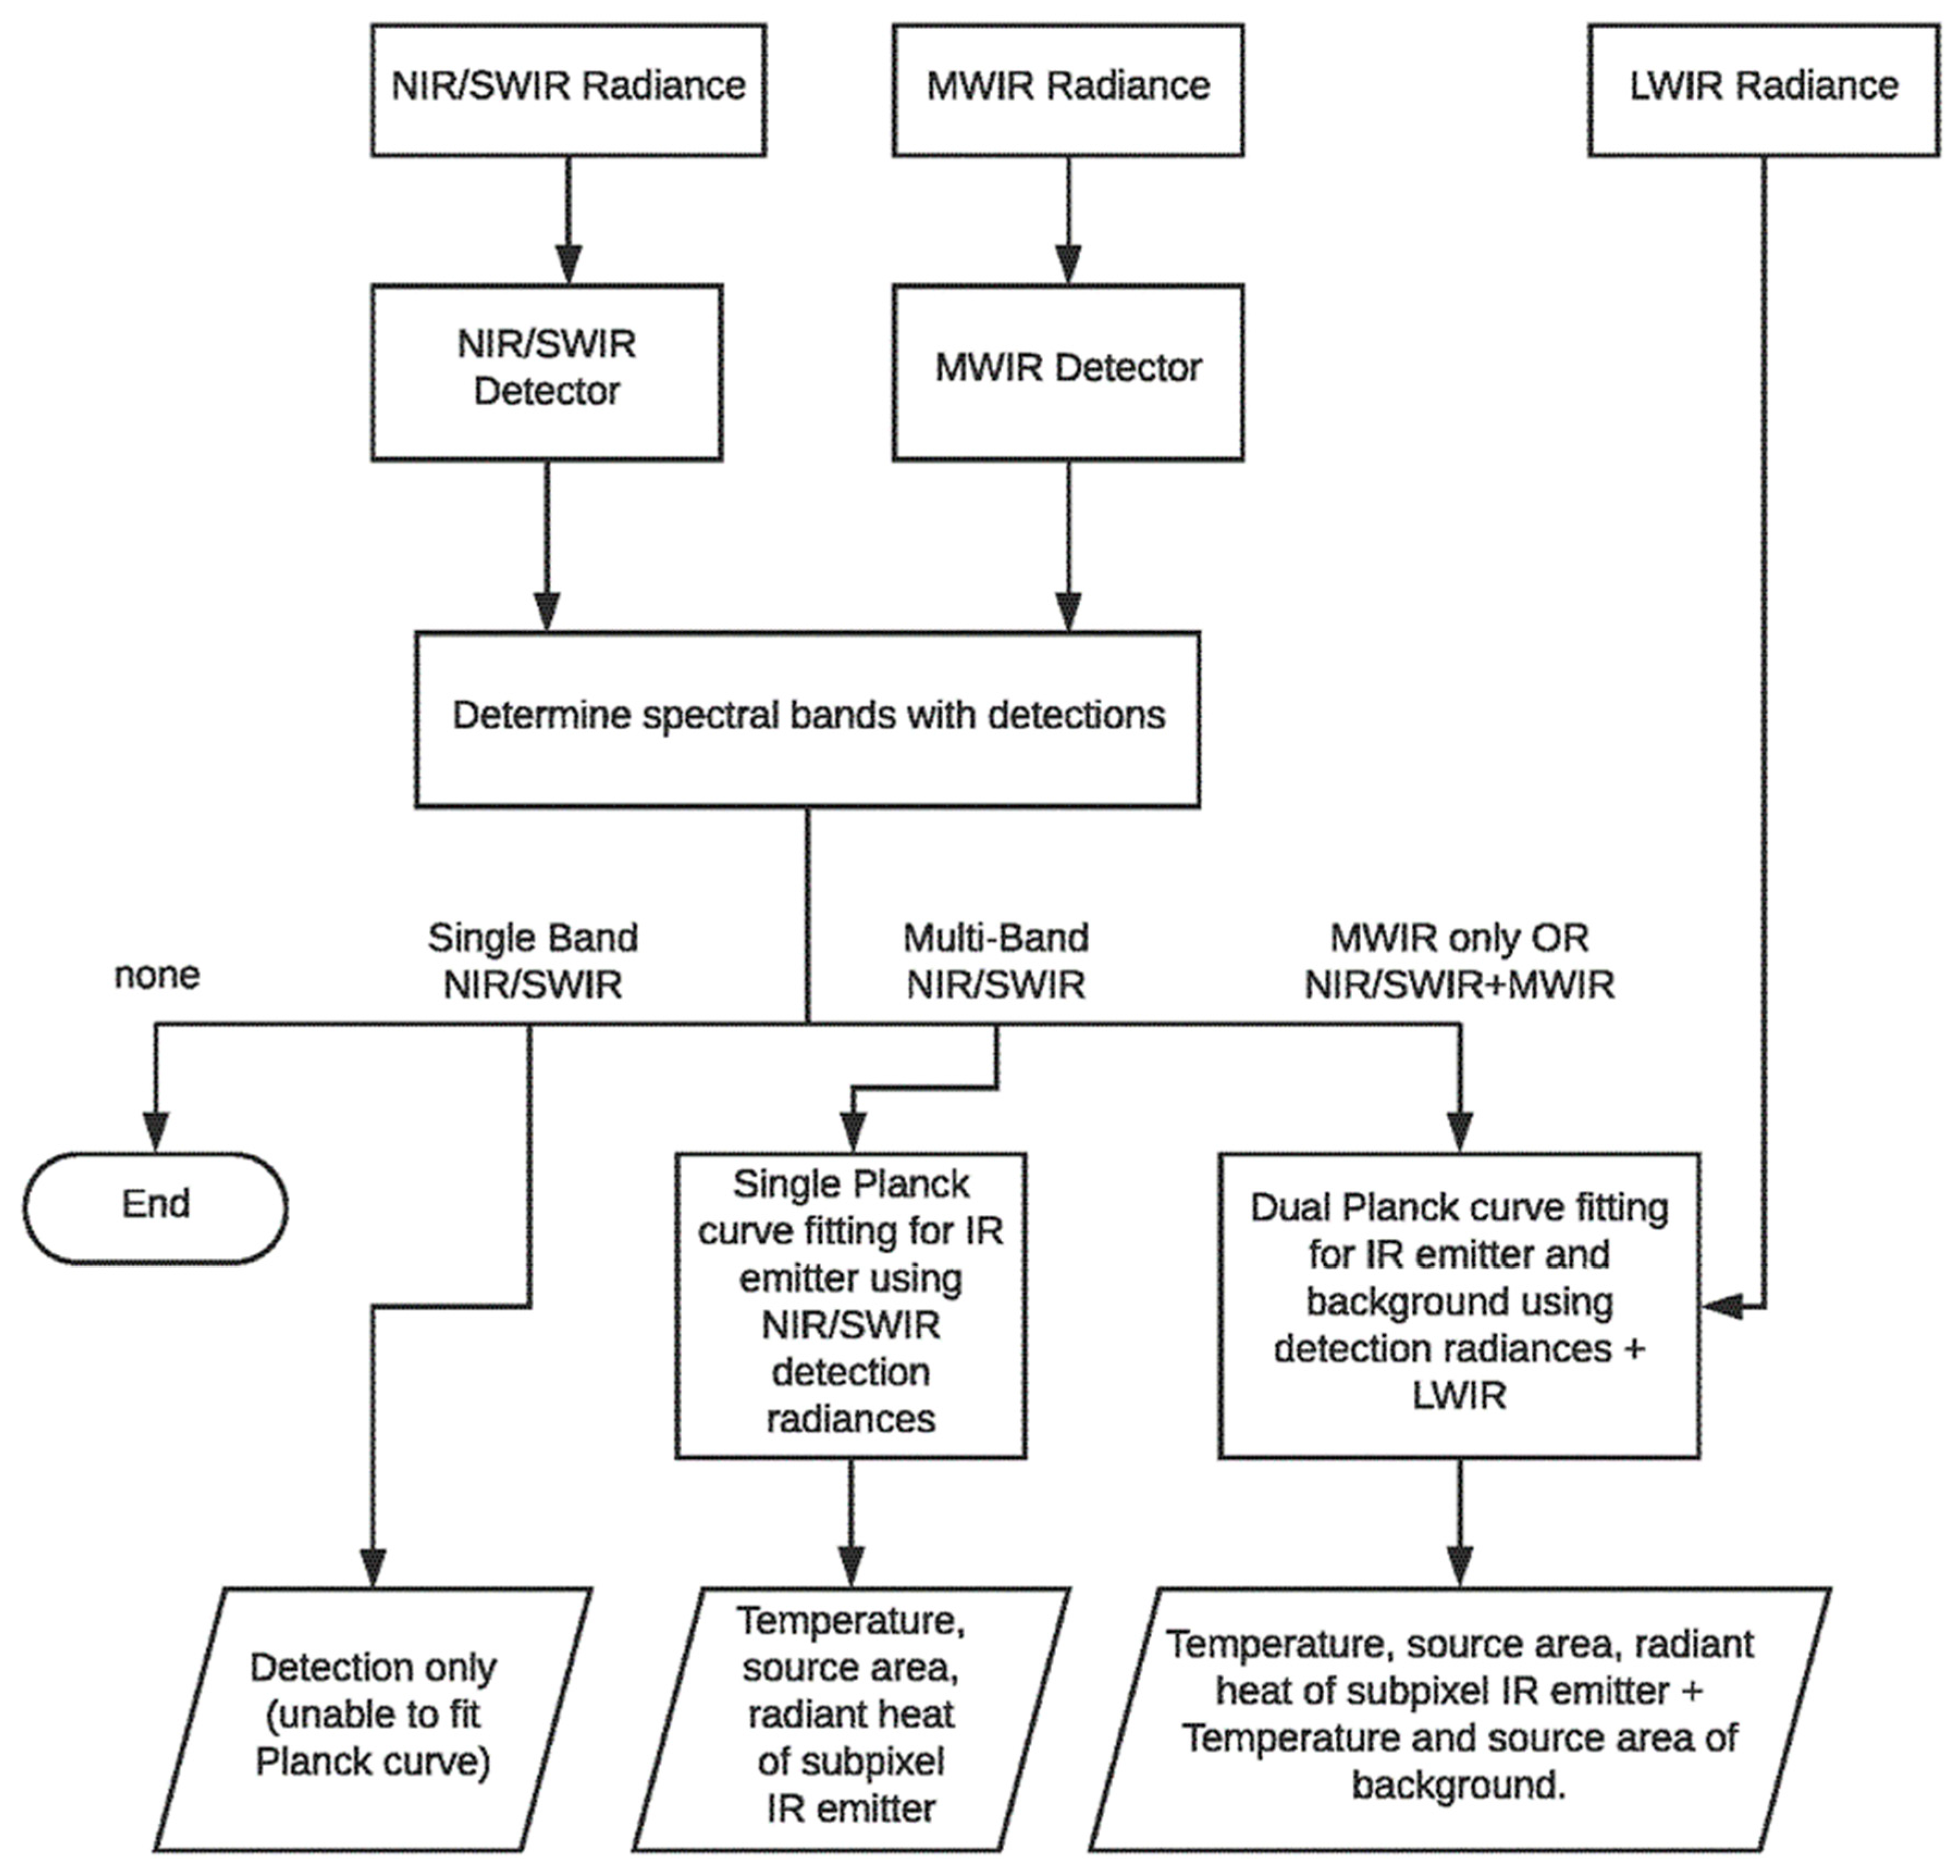
VNF includes two styles of Planck curve fitting, as shown in flowchart Figure 2. In both cases, there is an assumption that the IR emitter can be characterized by a single temperature. This constraint traces its roots back to the original Dozier subpixel IR emitter algorithm. While this is not strictly true, it simplifies the analysis to a tractable level. The first style of Planck curve fitting simply uses the radiance in the daytime channels in pixels that lack MWIR detection. The second case is where there is detection in the MWIR. This can be with or without detection in the daytime channels. Here, simultaneous dual Planck curve fitting is employed to separate the background versus subpixel IR emitter radiance in the two MWIR channels. The short wavelength radiances are used as-is in the IR emitter Planck curve fitting. The LWIR radiances are used as an initial representation of the background. A simplex fitting algorithm [20] adjust the temperature and source size to get a best fit to the observed radiances. The goodness of fit metric is the sum of the squared residuals (SSR).
The original VNF algorithm [13] identified subpixel saturation in the M12 spectral band based on unexpectedly low M12 radiances relative to the M13 radiance. VNF has been modified to test each pixel for the presence of saturation or other radiance irregularity using the SSR. Pixels exceeding the SSR threshold are analyzed in more detail to determine which spectral bands have anomalous radiances. Then the Planck curve fitting is run again excluding the irregular radiances.
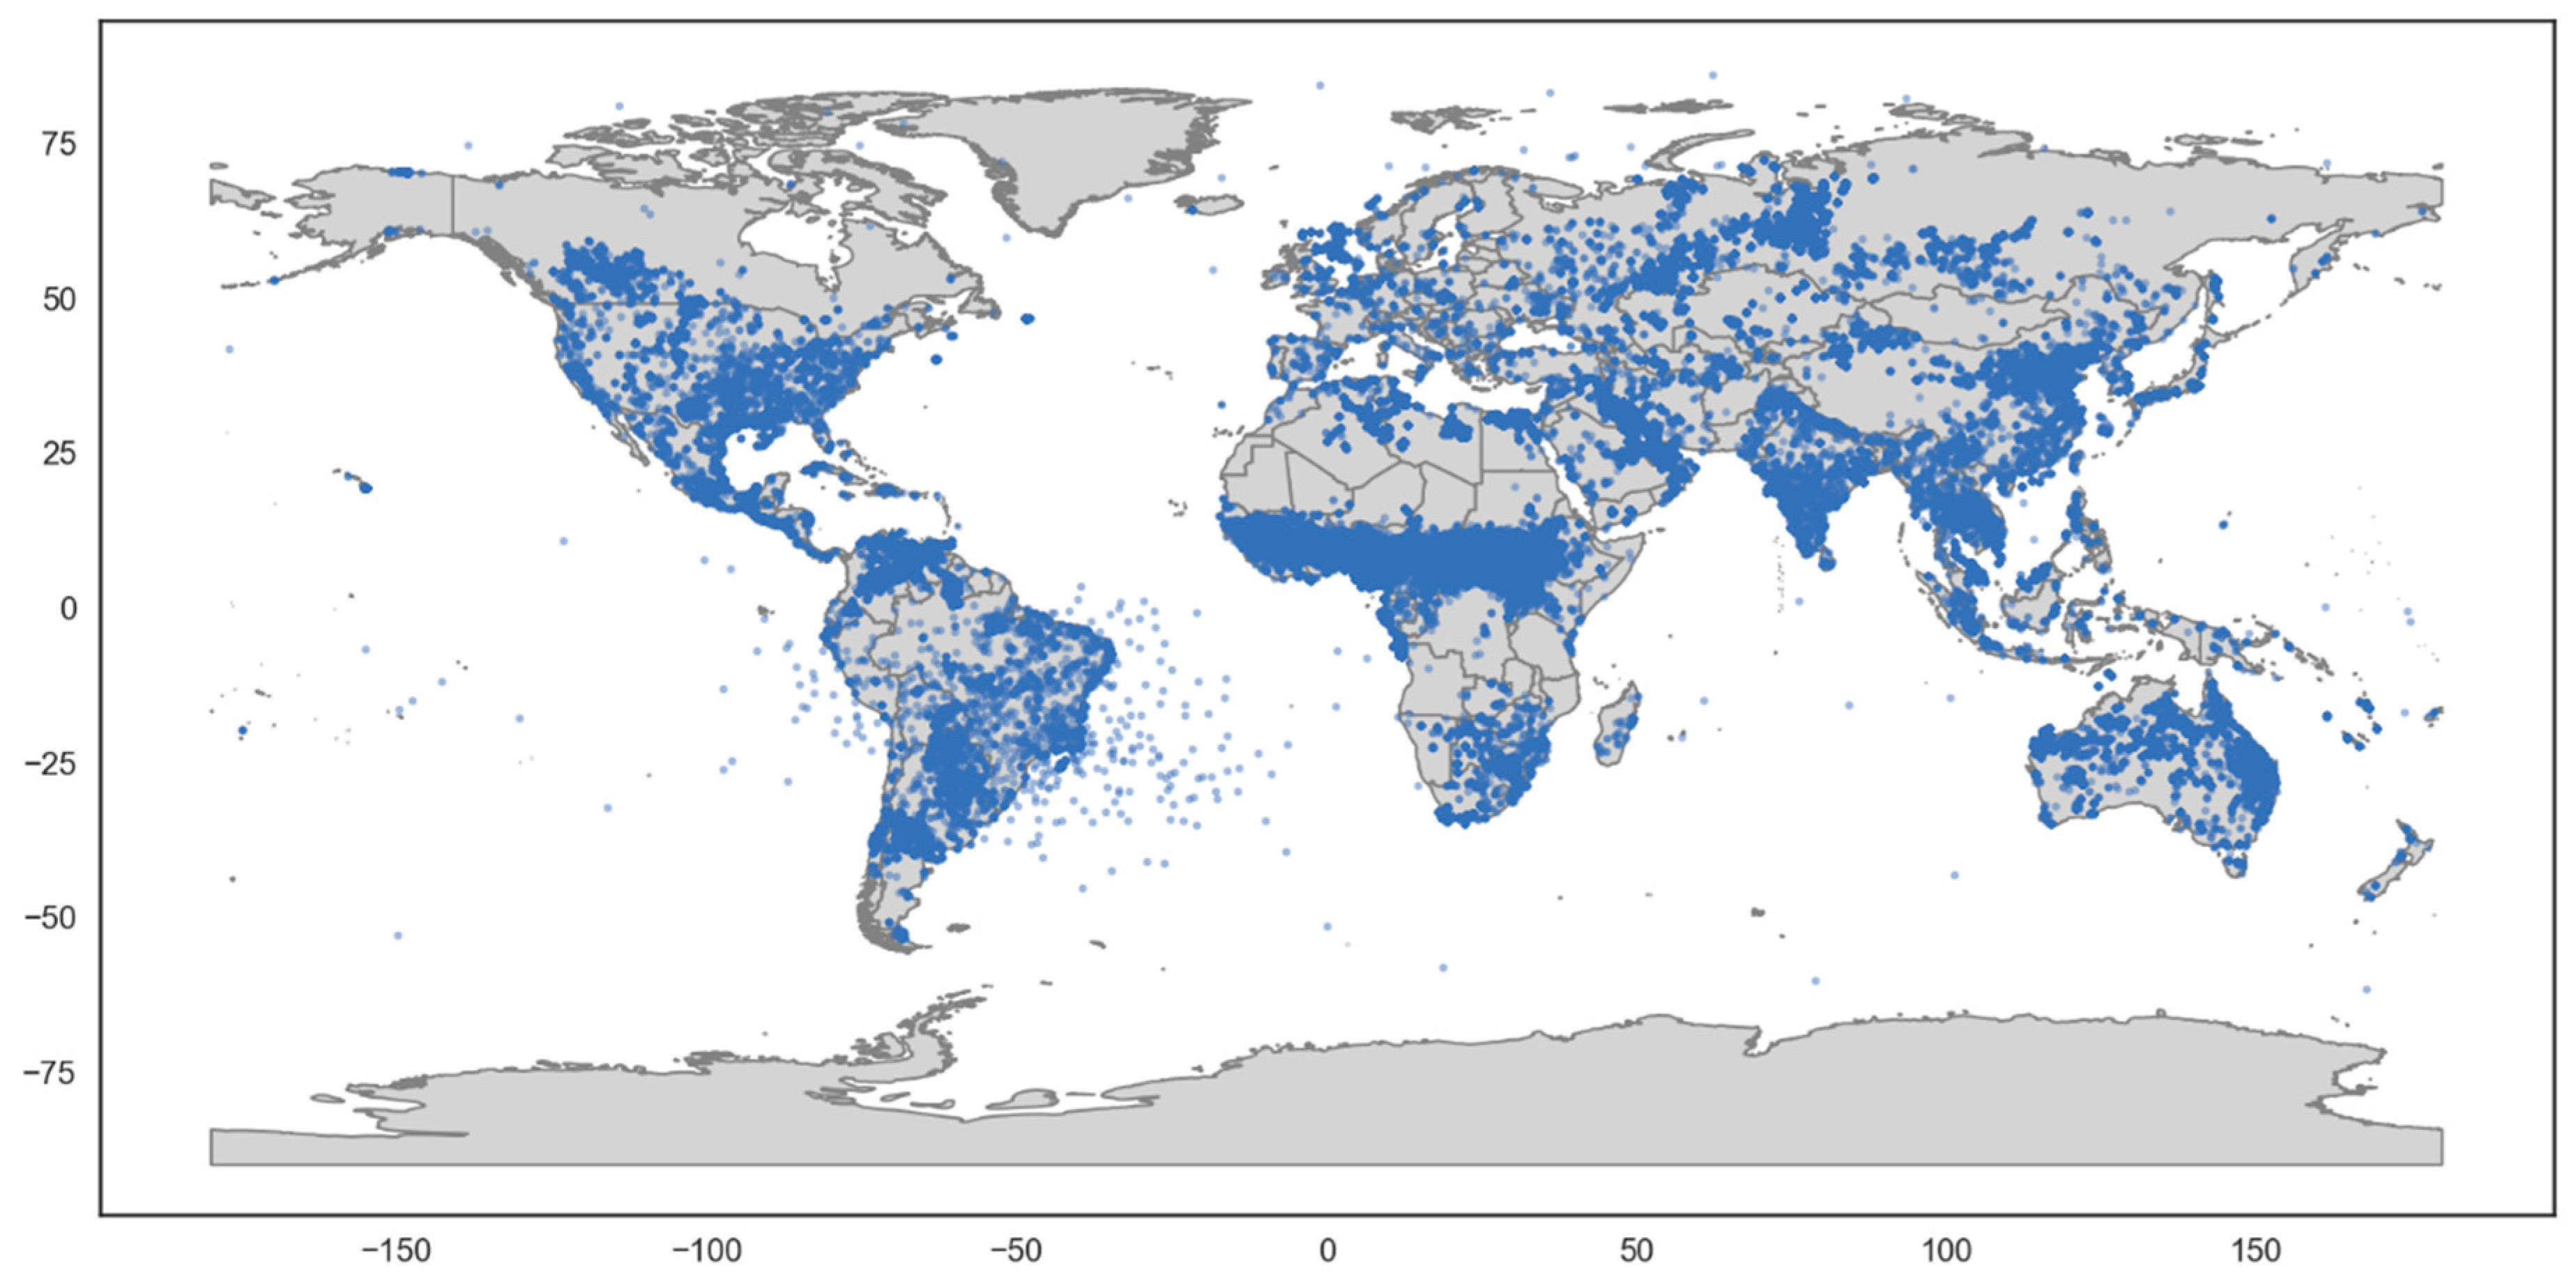
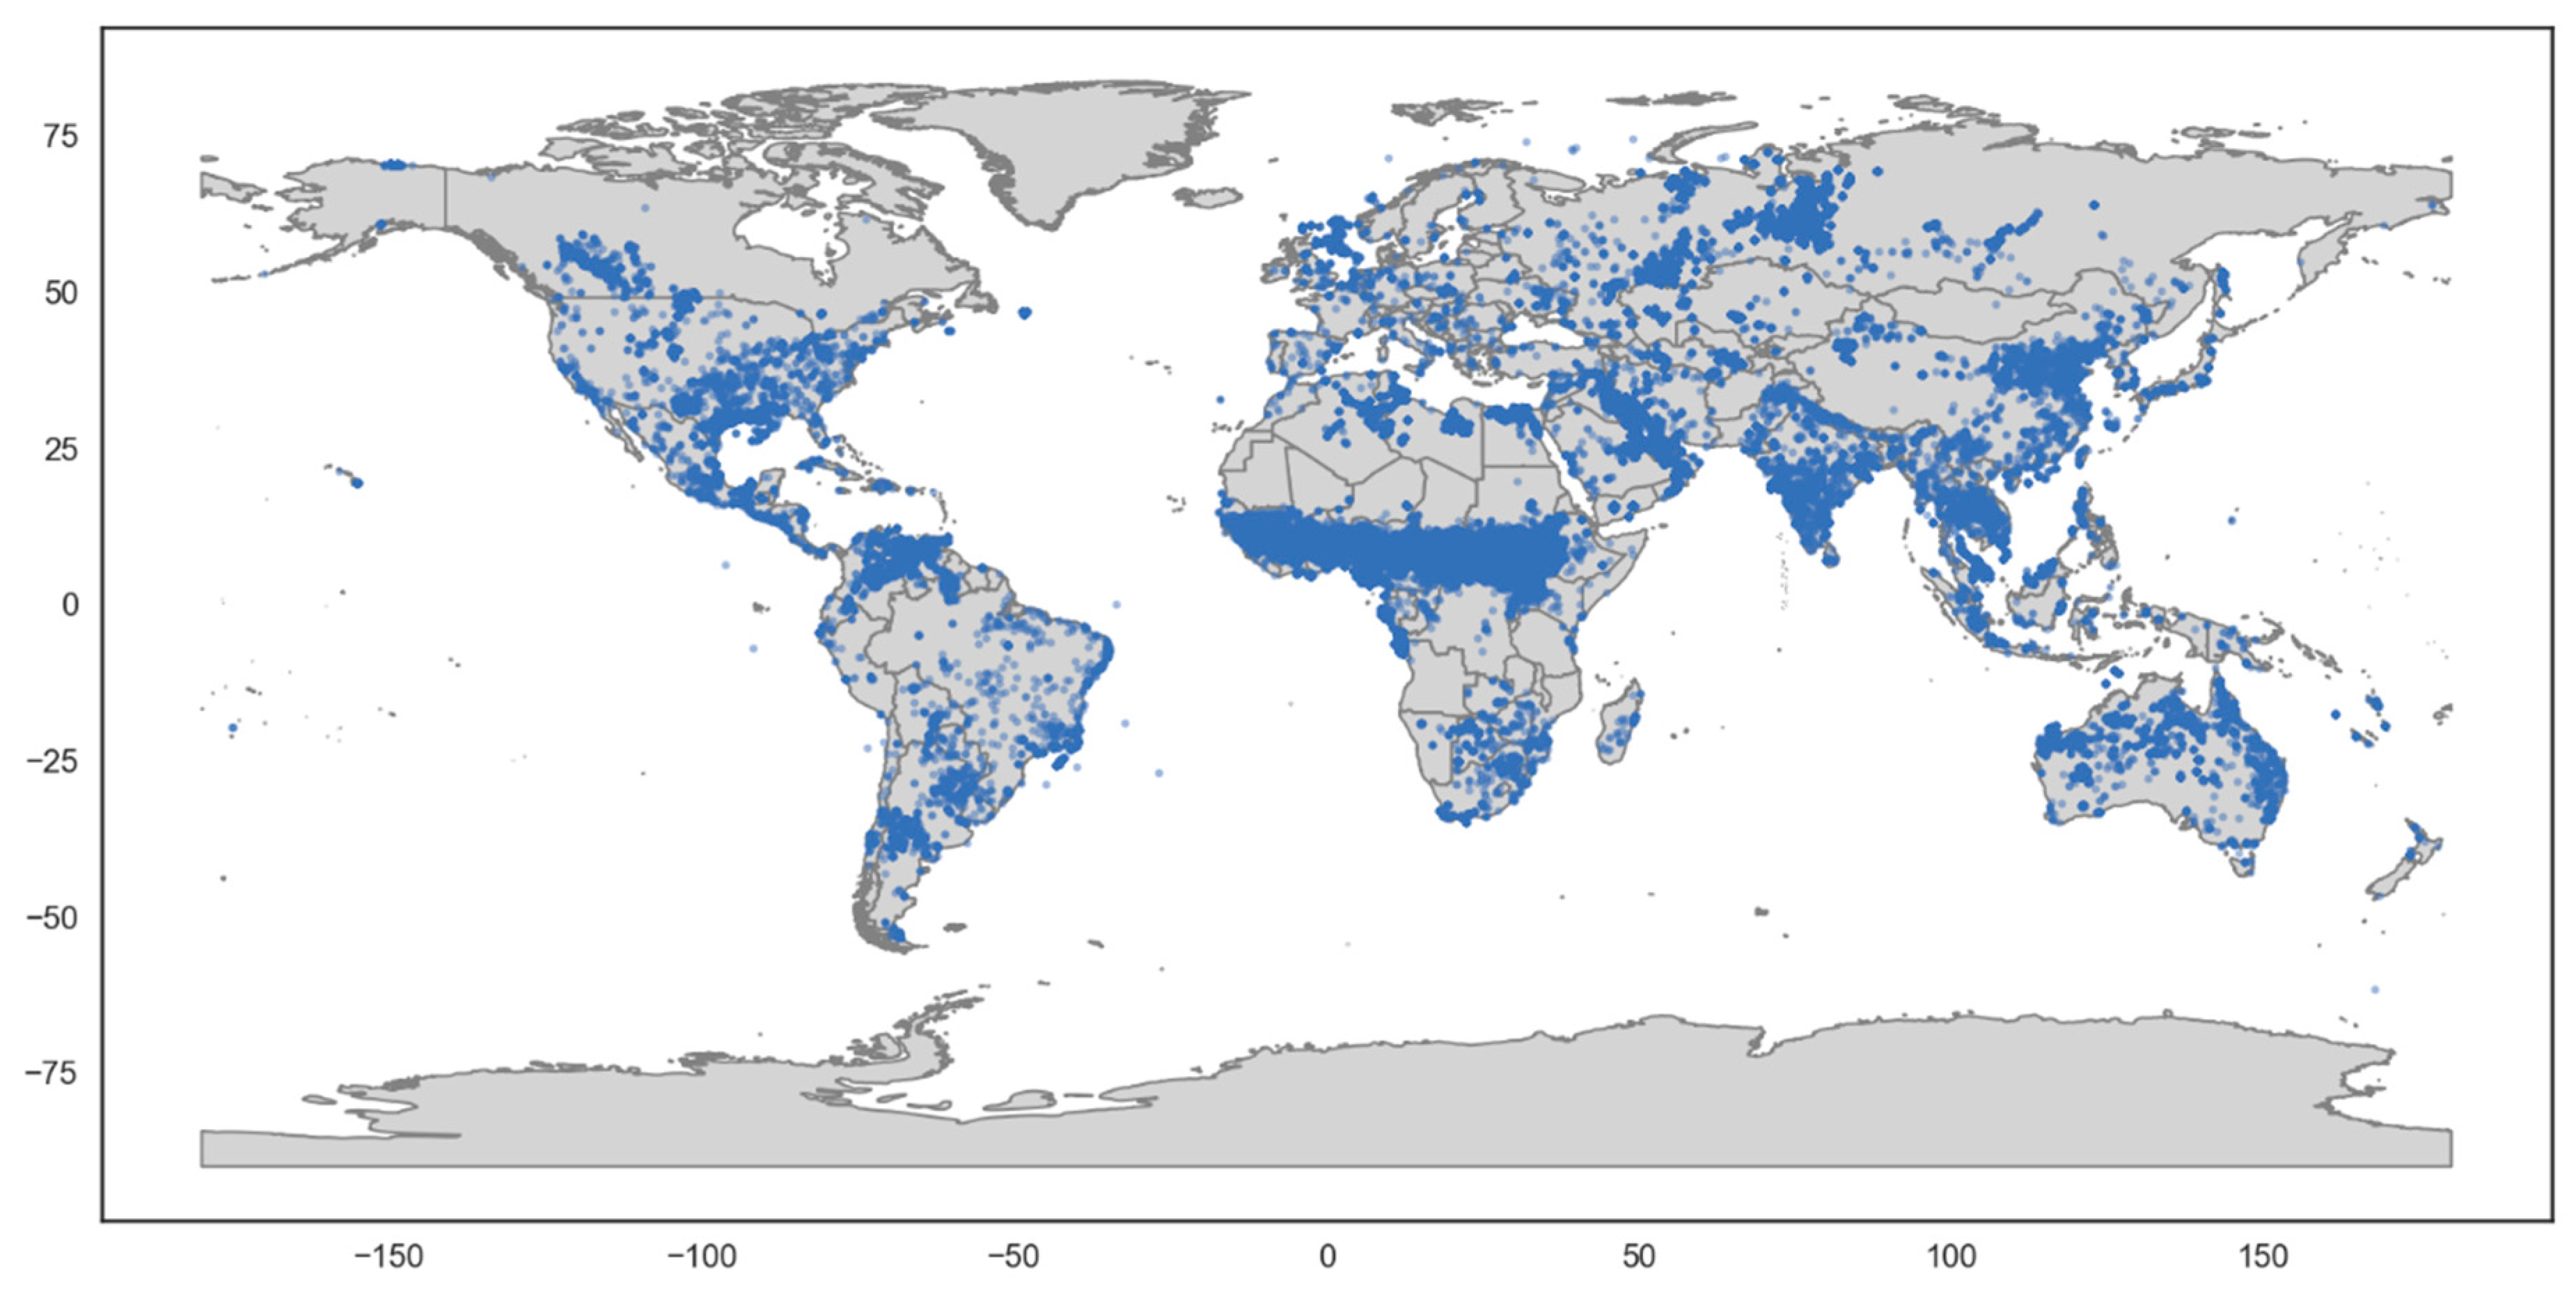
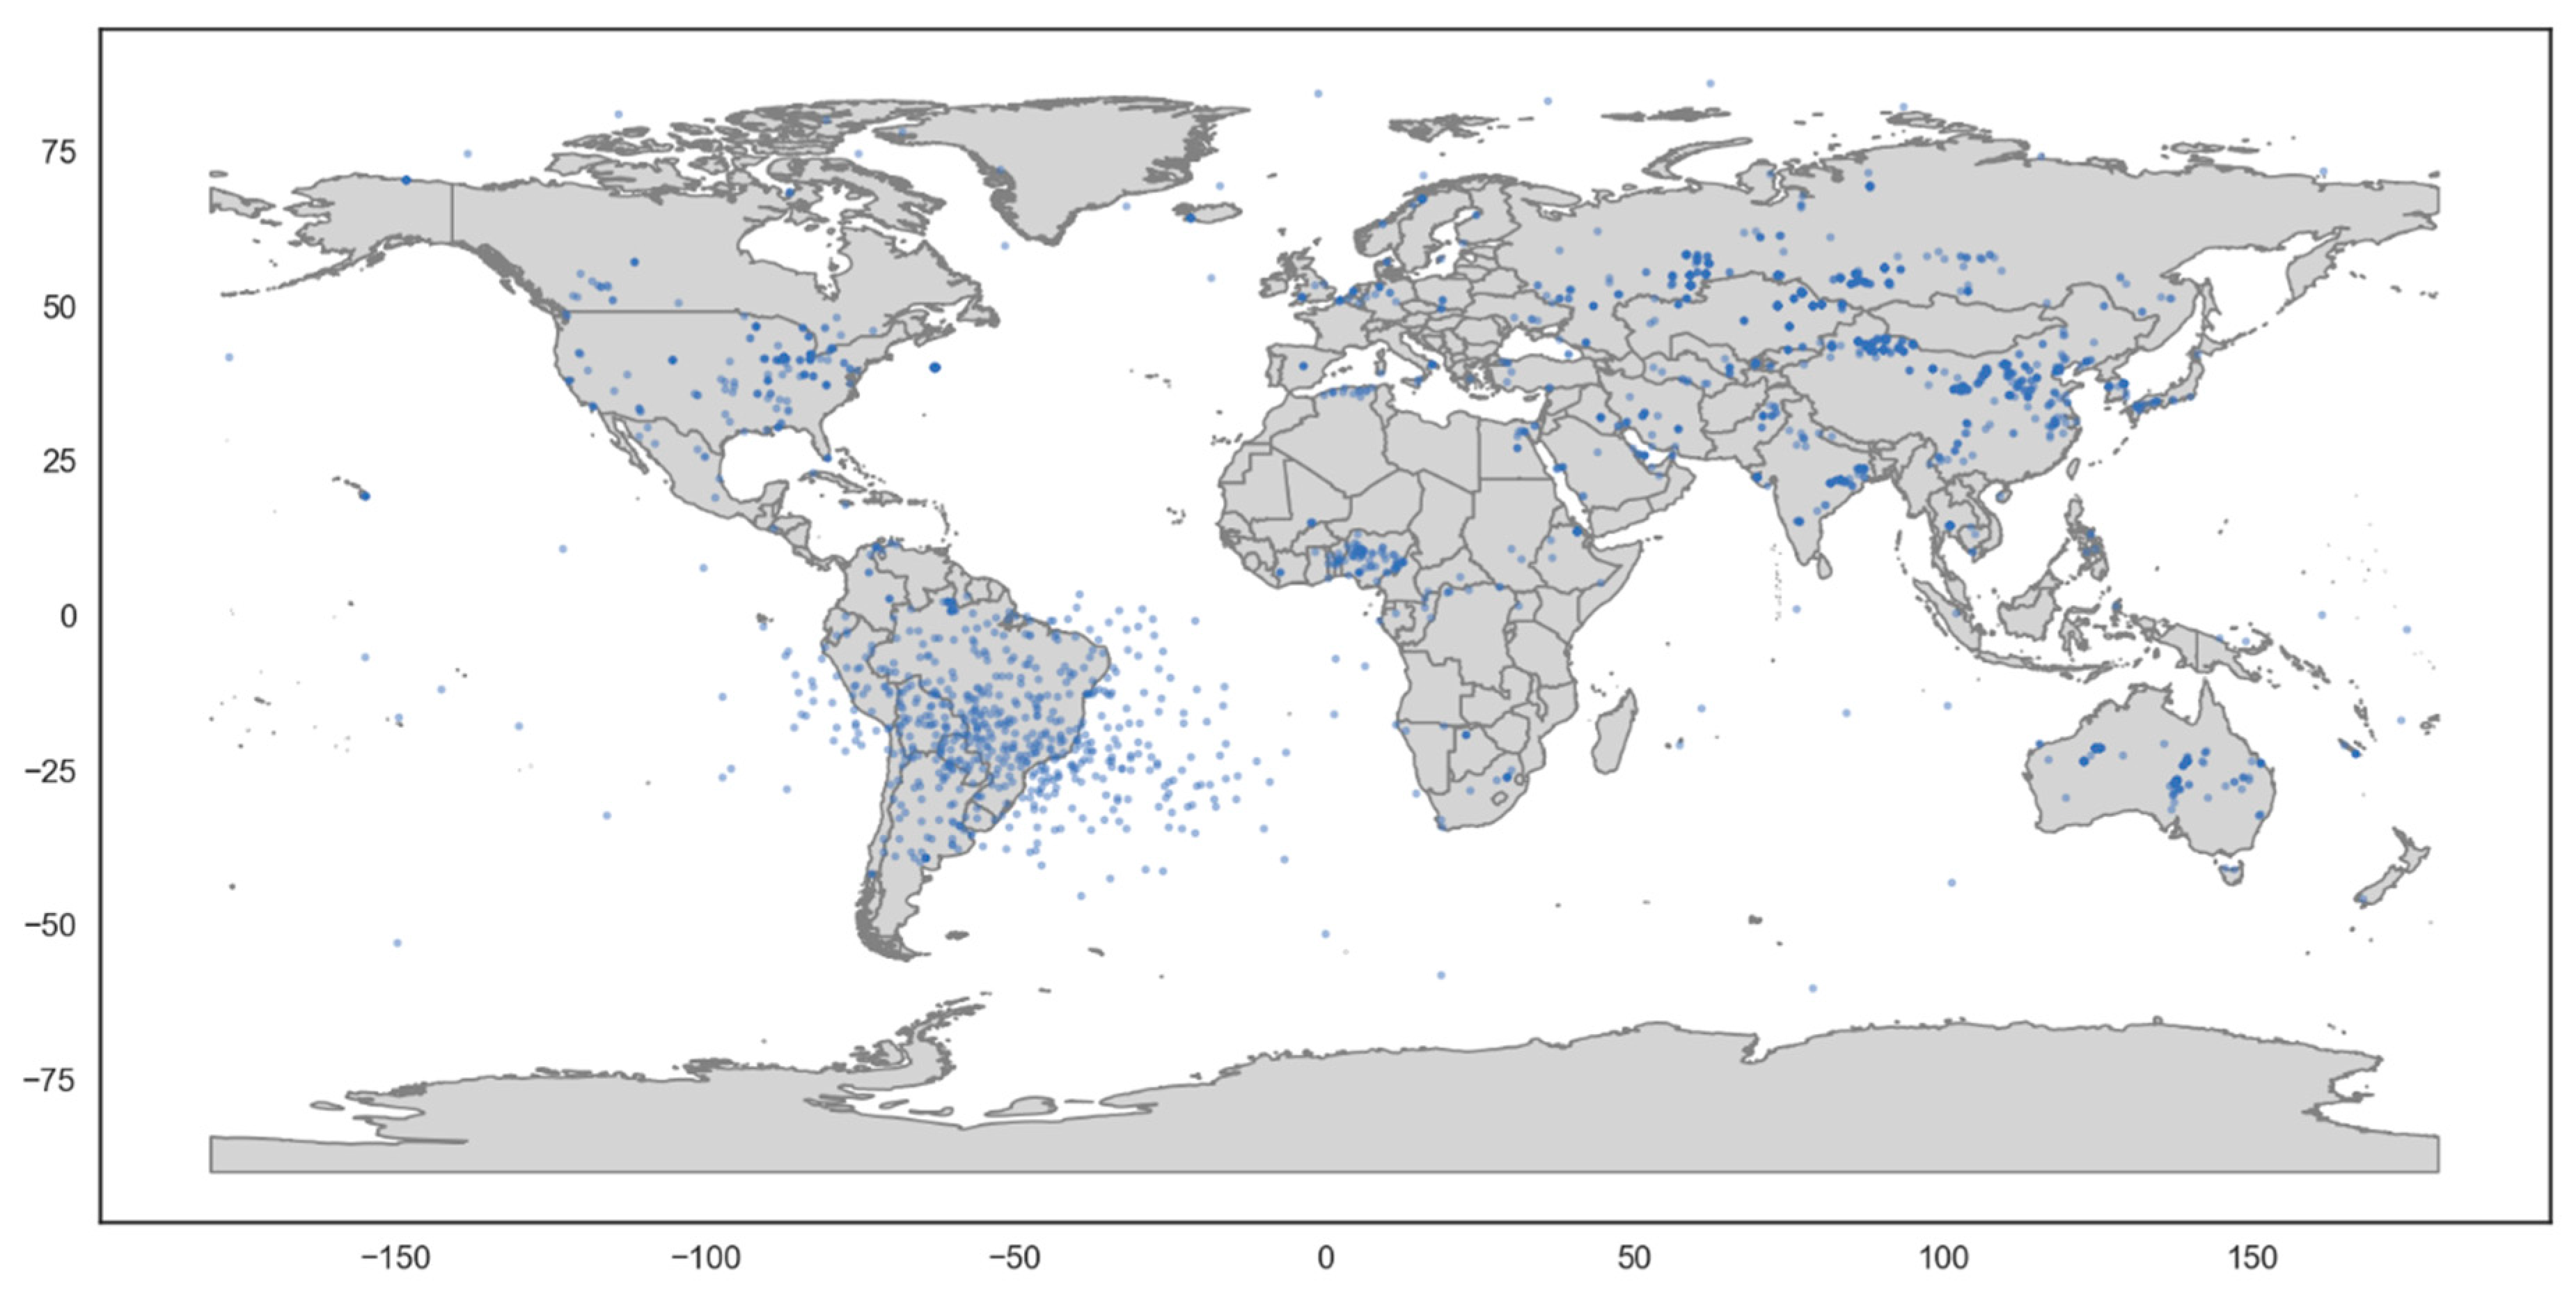
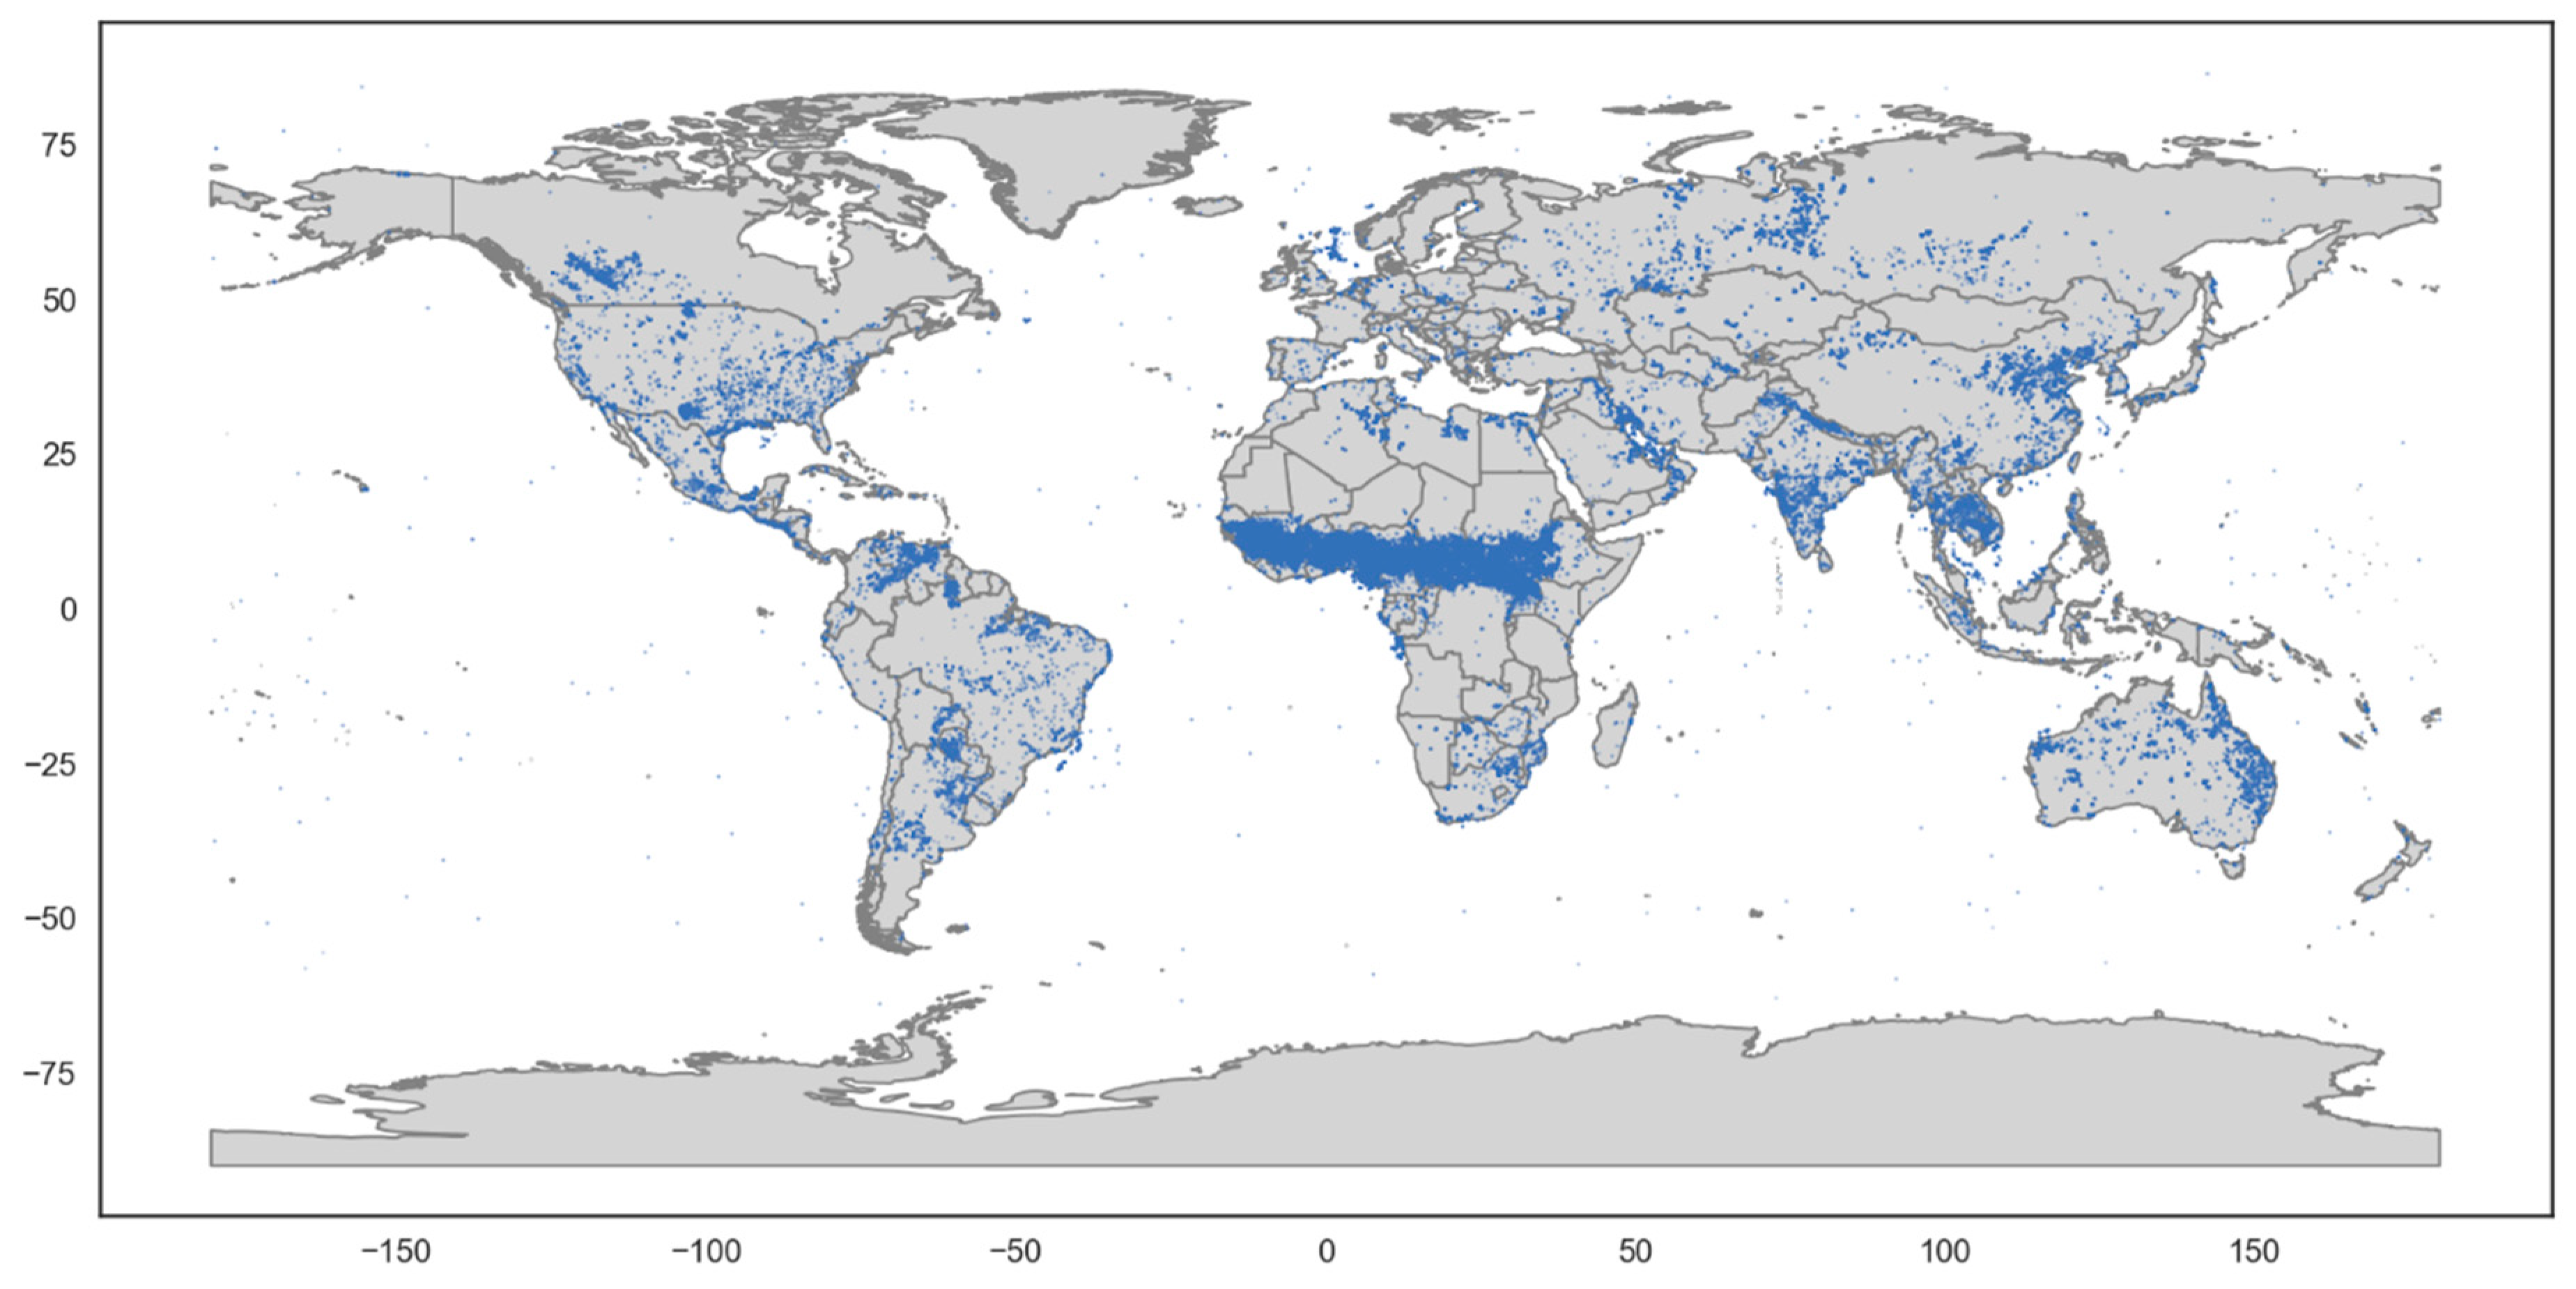
3. Data Sources

Global Suomi National Polar Partnership (SNPP) VIIRS nightfire data from January 2018 were extracted from the VNF database. This month was selected because it was the first month with the M11 spectral band collected at night by the SNPP VIIRS. The fields extracted indicate the spectral bands with detections, the radiances in the moderate resolution bands that collect at night (M7, 8, 10, 11, 12, 13, 14, 15, and 16), the day/night band (DNB) radiances, and the temperatures and source areas calculated using the M band radiances. For M12 and M13 the background radiance has been subtracted using the dual Planck curve fitting described in Section 2. The detection pixel tally for each of the M bands is listed in Table 1. The total number of VNF pixels included in the analysis is 456,954.
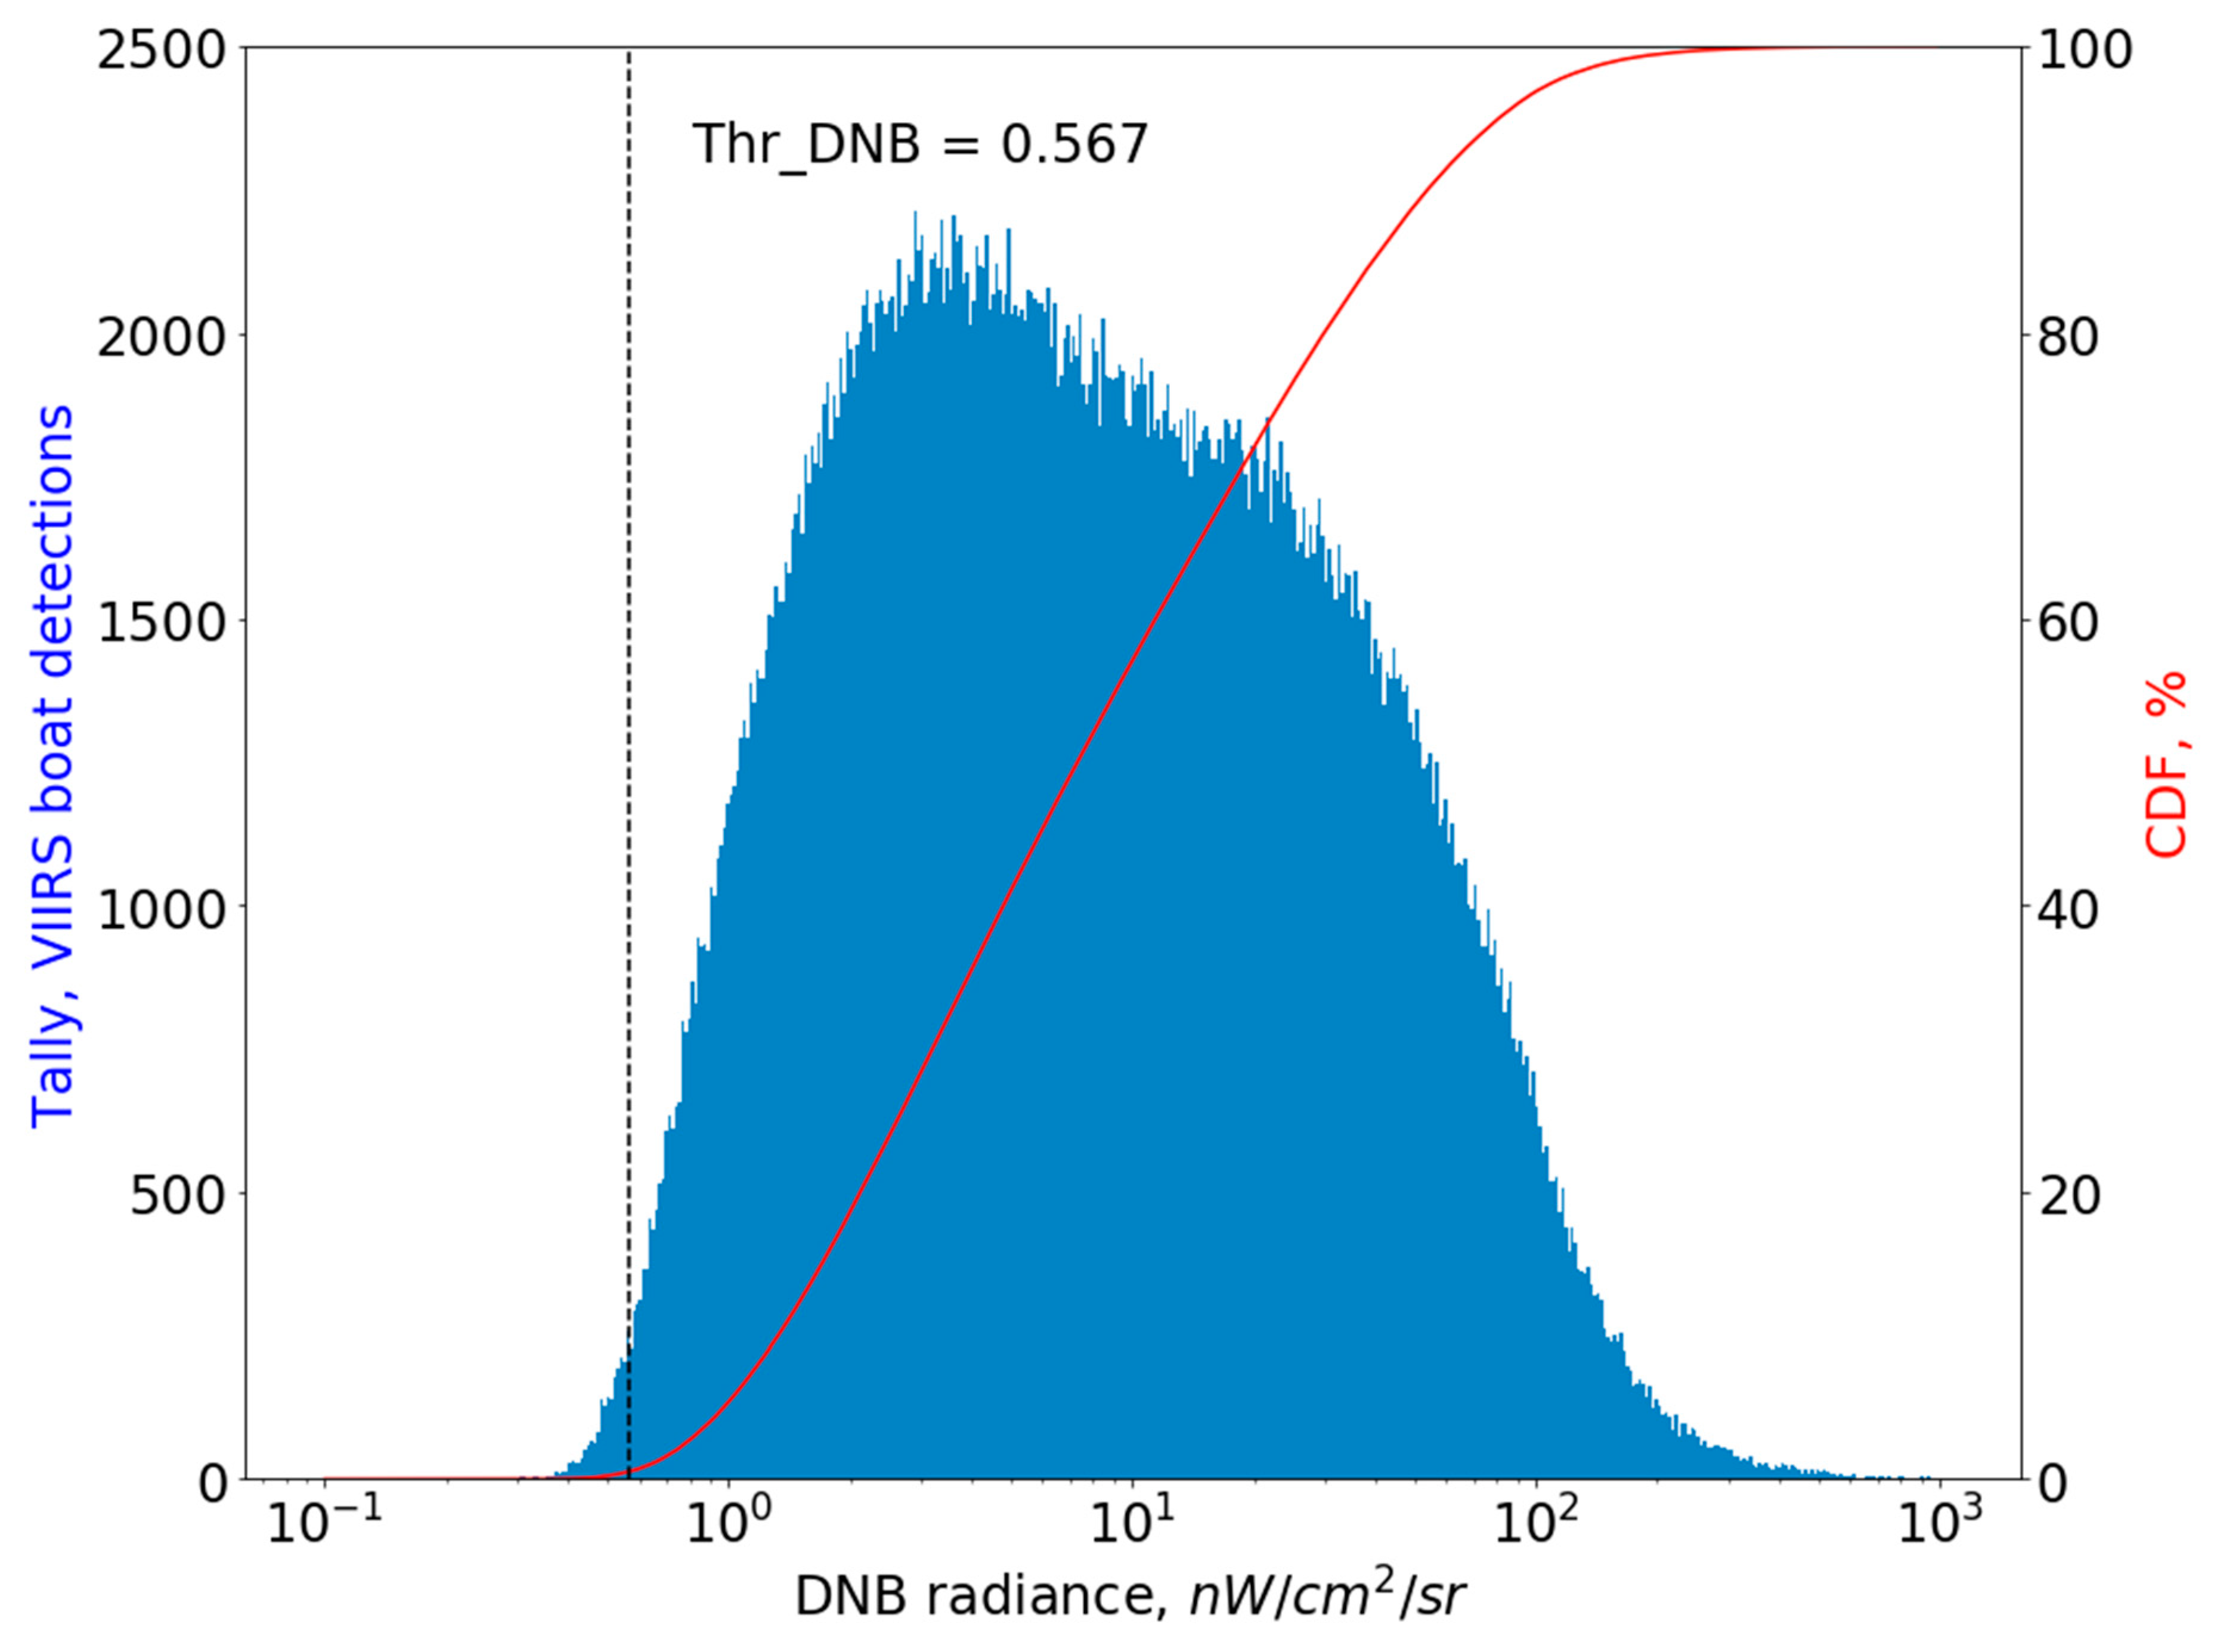
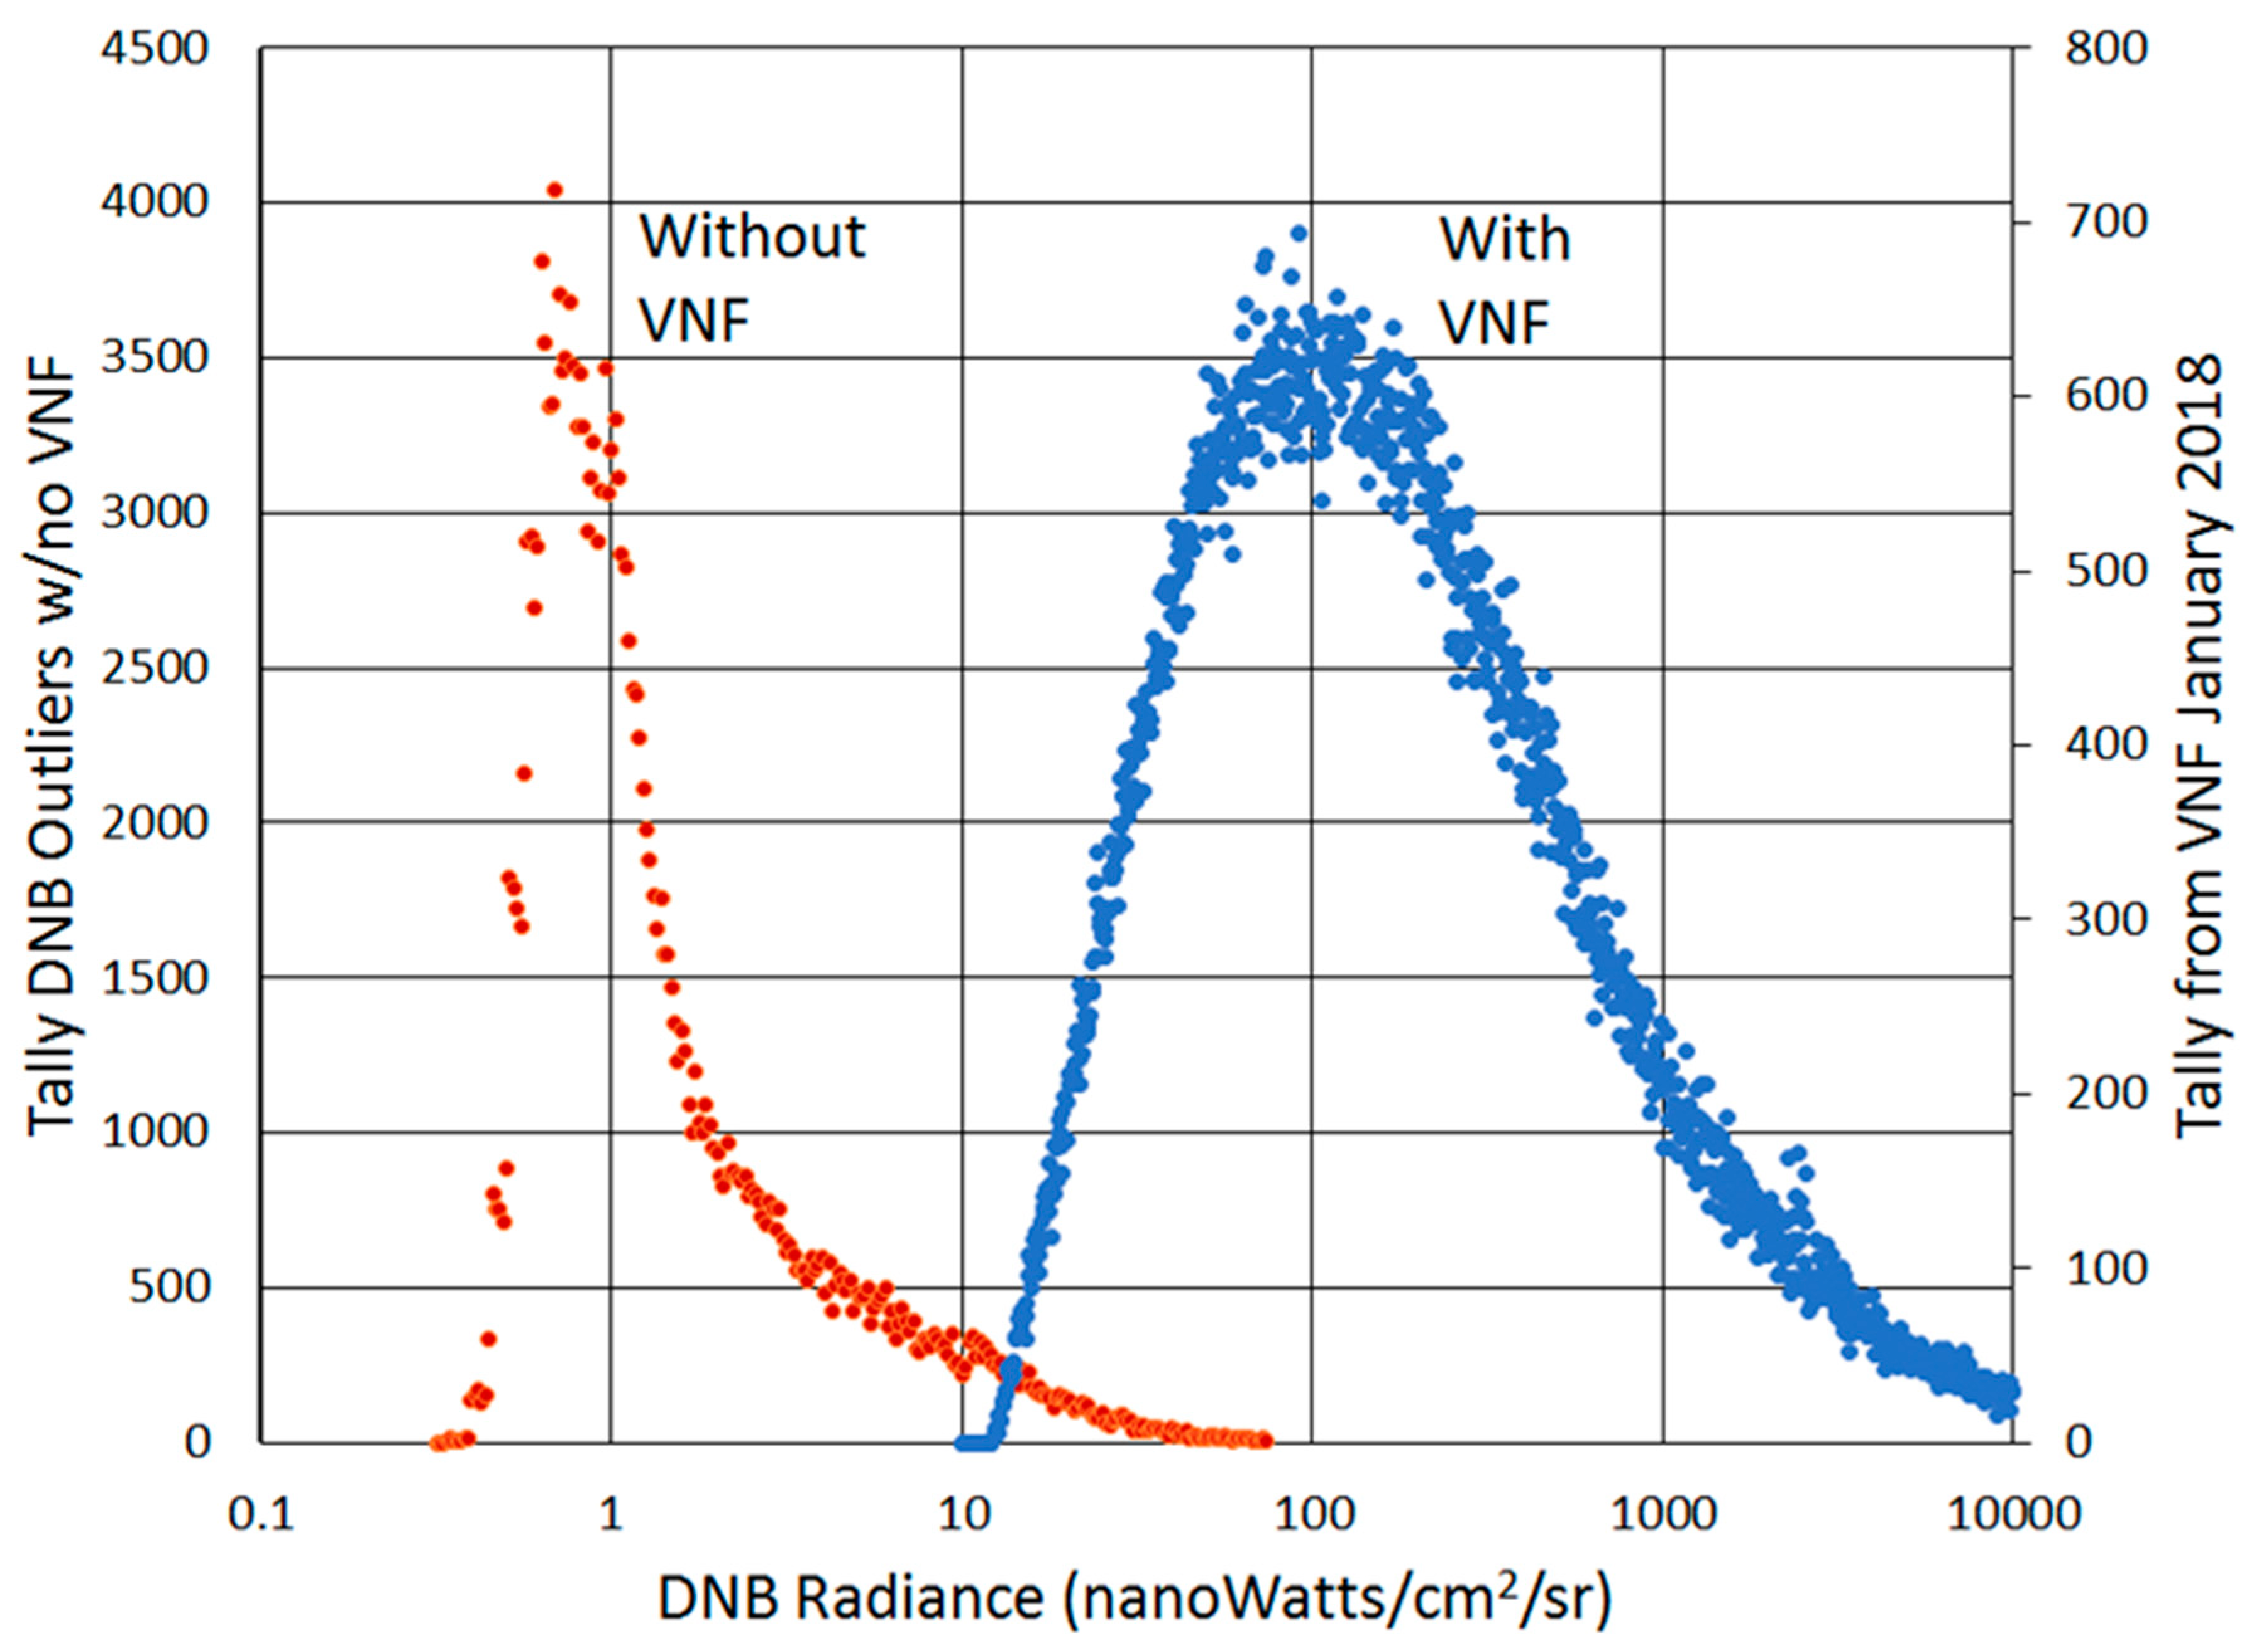
For the calculation of the DNB detection limit we extracted a radiance histogram from the VIIRS boat detection (VBD) database covering Indonesia for the months of January–August 2017. The VBD algorithm searches for spikes in the DNB data [21]. The extraction was for radiances from pixels rated as having the best quality flag (QF1) indicating the best quality boat detections. The tally of extracted VBD record is 318,921 pixel detections.
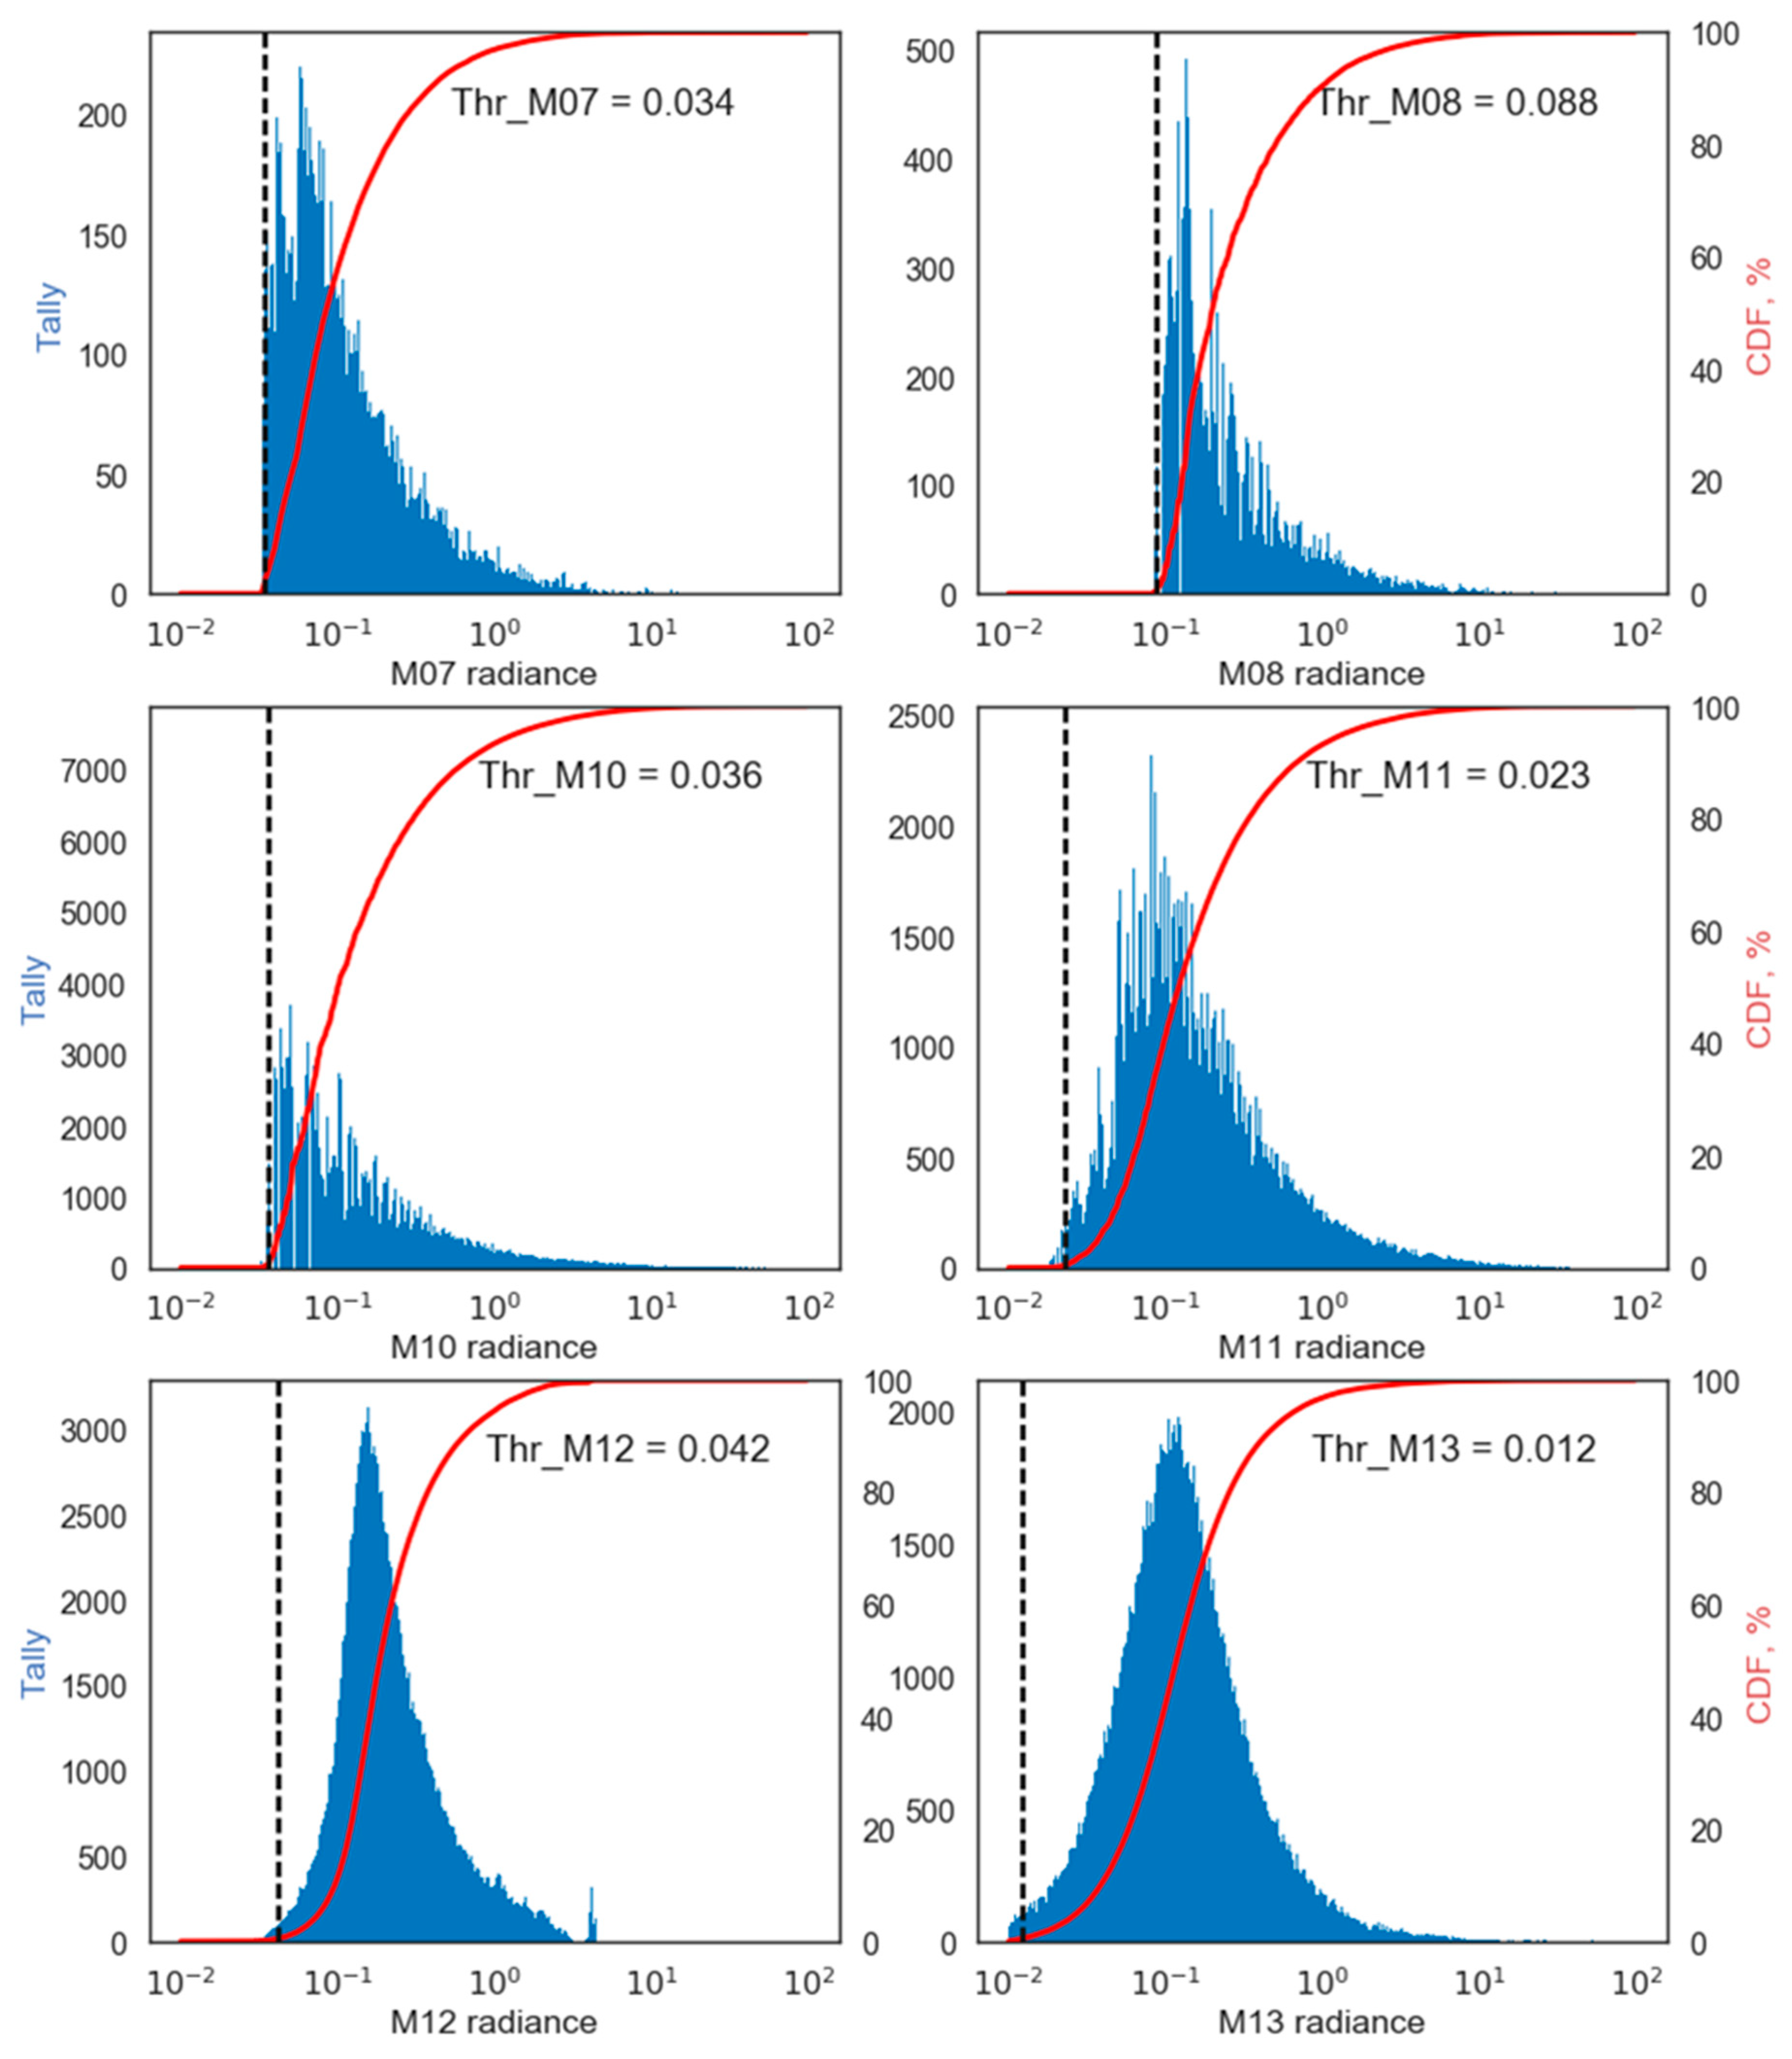
Radiance detection limits were taken as the 0.5% point on the cumulative distribution function (CDF) coming from the radiance histogram generated for each spectral band (Figure 3 and Figure 4). The detection limits are listed in Table 1. Planck’s Law was used to lay out the detection limits in terms of temperature and source area for each spectral band. For each spectral band, the central wavelength and radiance detection limit were used as input. By varying the temperature, curves were defined, indicating detection limits in terms of temperature and source area. Planck’s Law was also used to predict DNB radiances for the VNF test pixel set using the VNF temperatures and source areas.
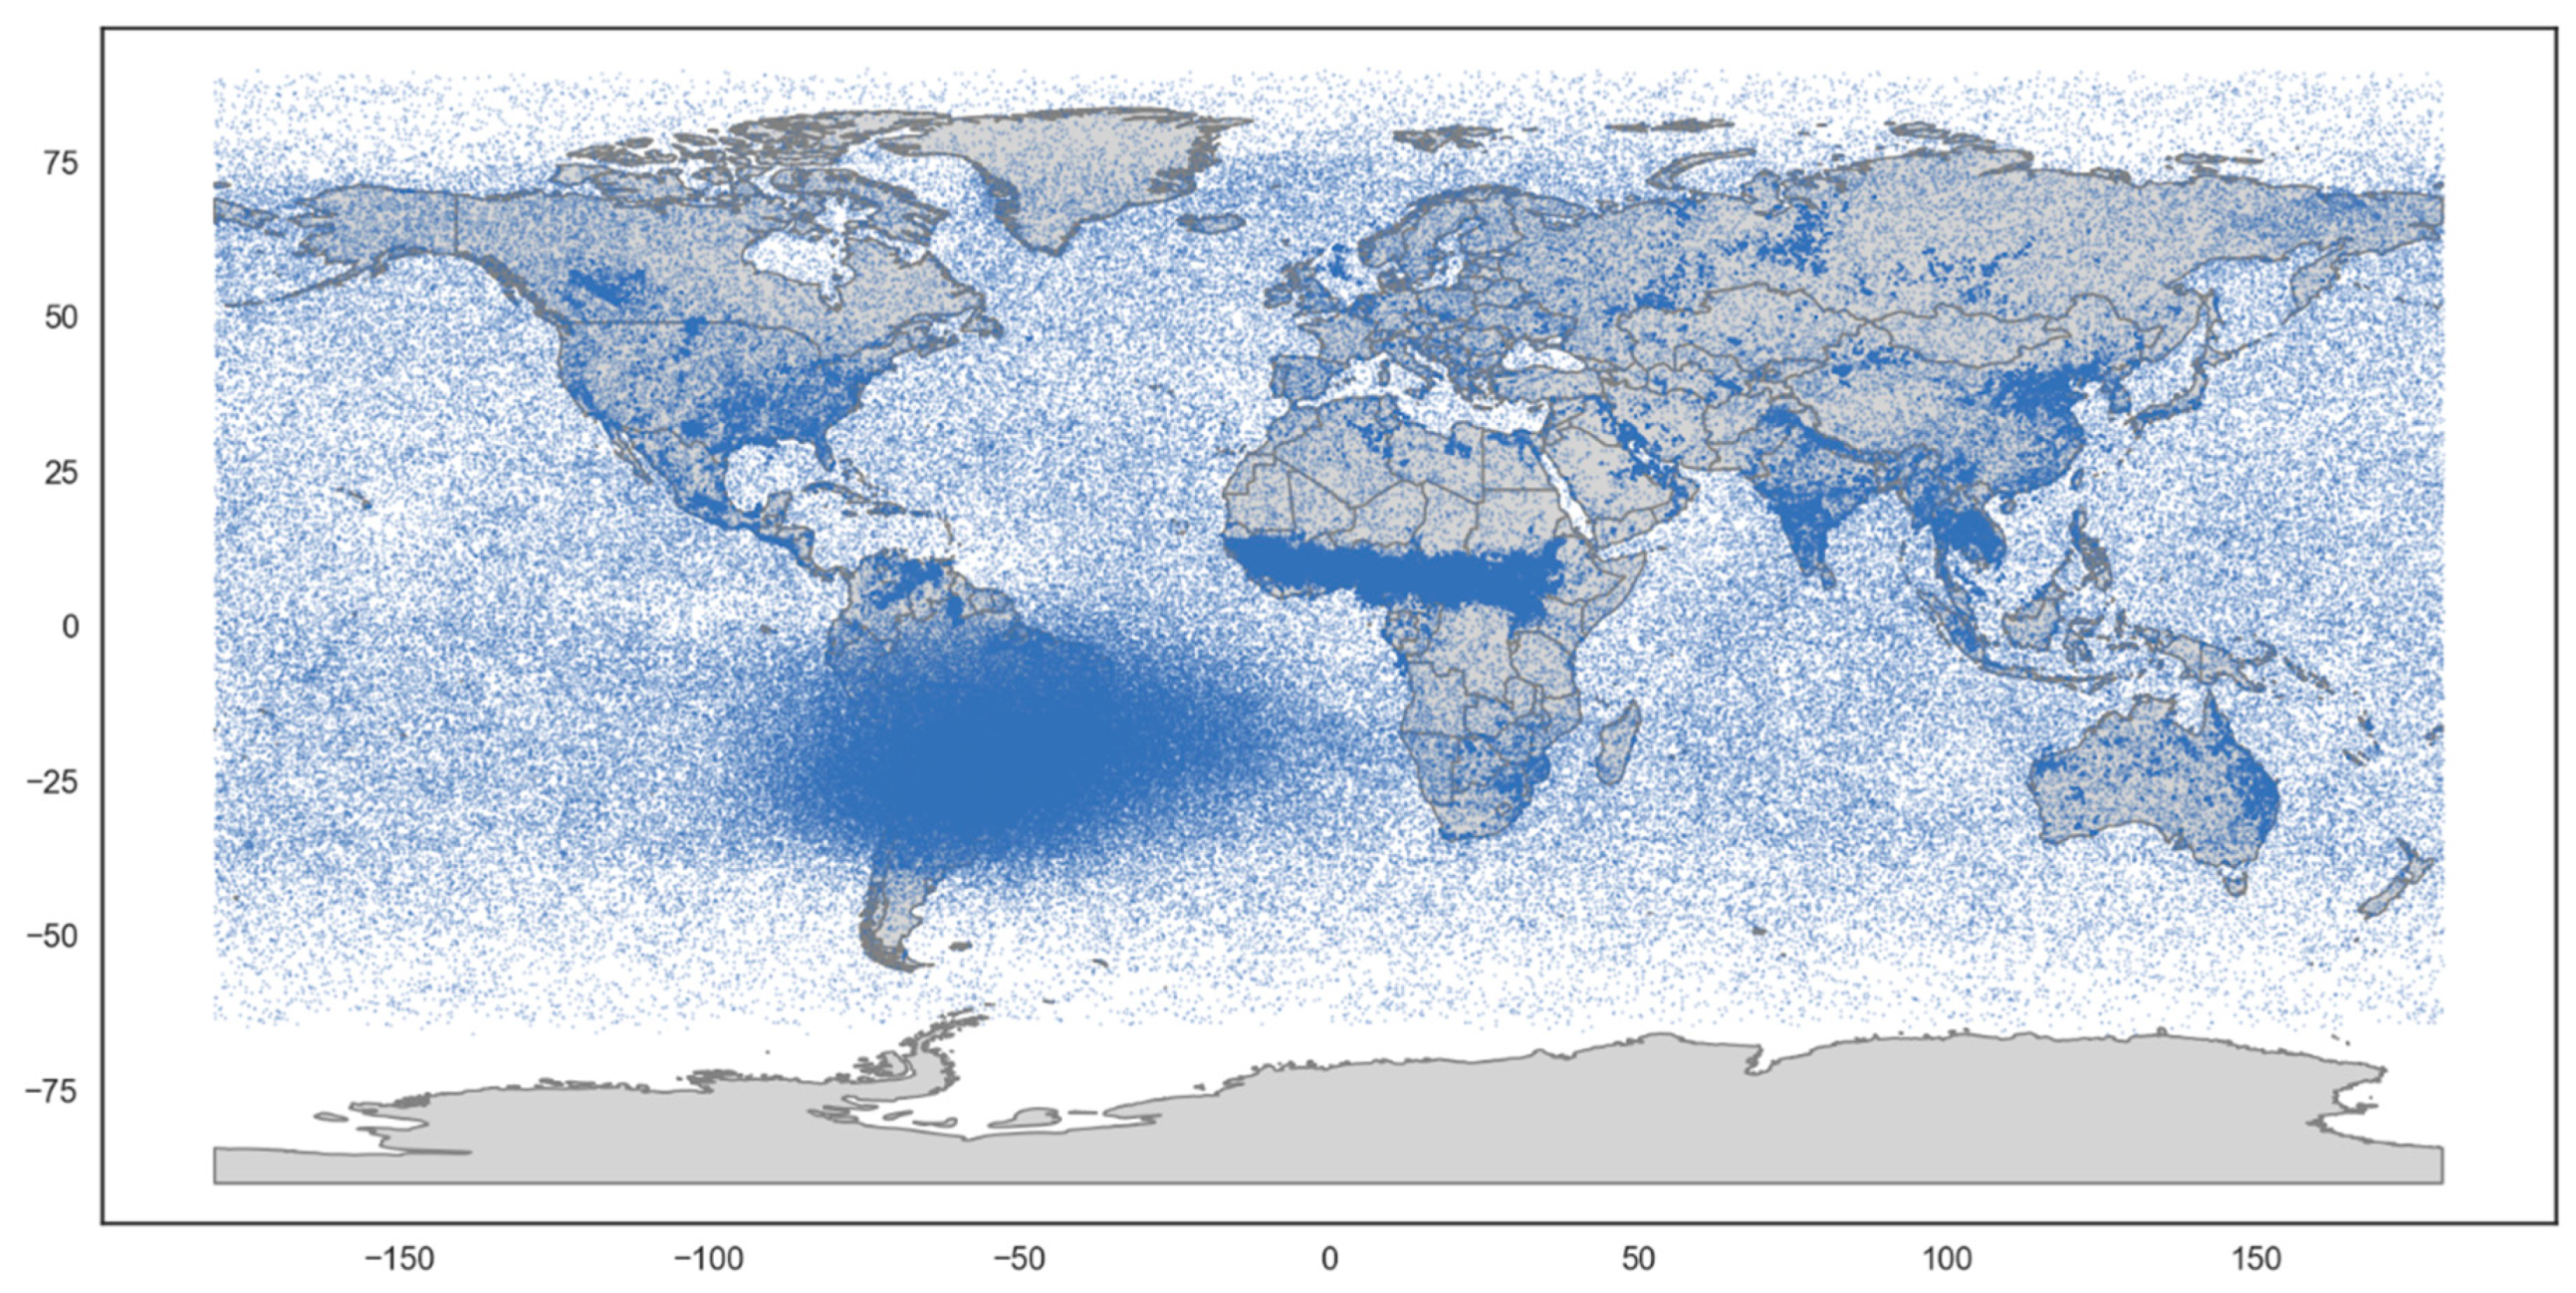
To obtain a sample set of DNB radiances for fires that are undetected by VNF we worked with data from the 2015 VIIRS nighttime lights (VNL) product suite [
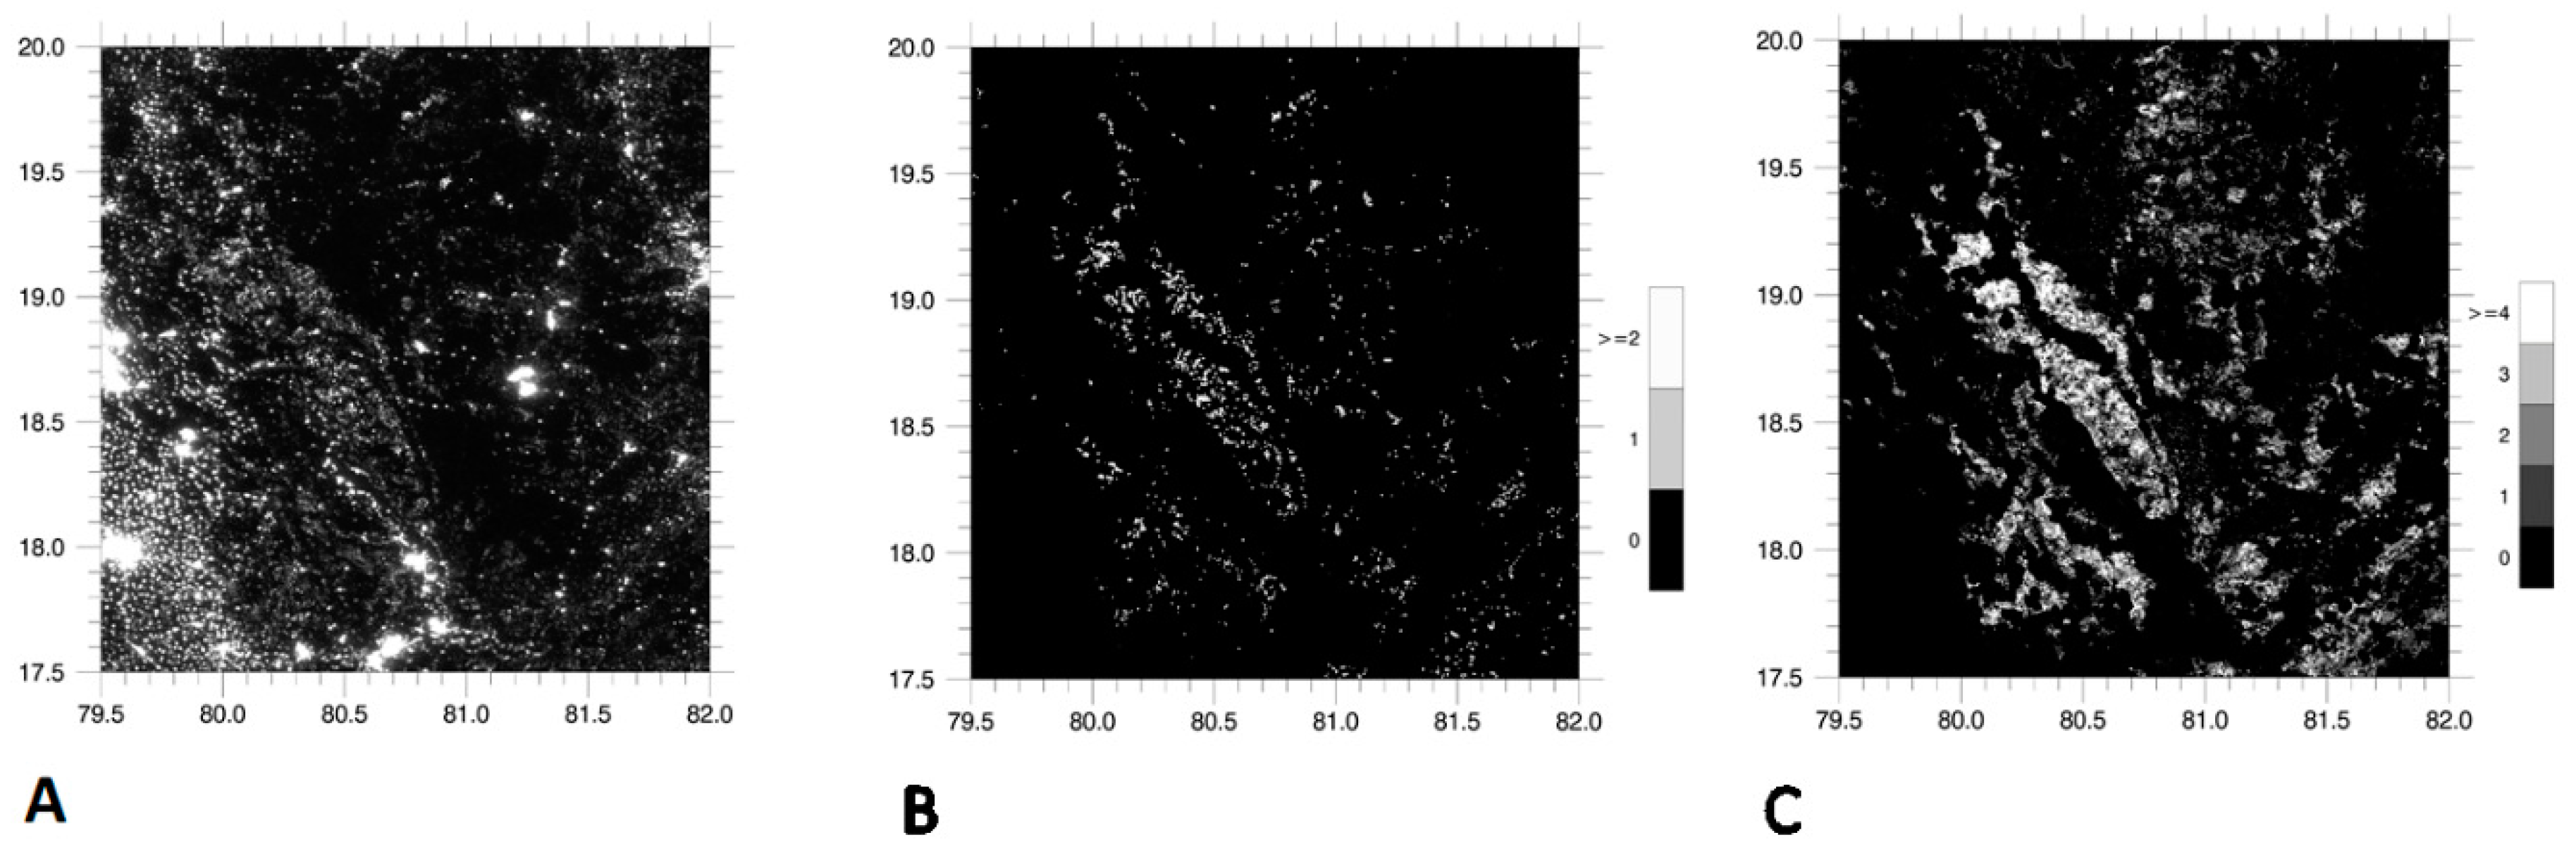
22] for a specific study area in Central India, centered on Chhattisgarh State. This is an area with an annual pattern of agricultural burning and numerous lights from cities and towns (Figure 5). This area was selected based on the presence of large numbers of DNB outlier removed from the nighttime lights product. The 2015 data were first filtered to remove moonlit and pixel labeled as cloudy in the VIIRS cloud mask. We generated a summary grid and radiance histogram for the fraction of DNB pixels that were culled as outliers from the nighttime lights processing that were outside the areas of electric lighting and lacked corresponding VNF detection. The preliminary results for this study area in India were previously reported in 2017 [16].

4. Results

4.1. VNF

Figure 6 shows a scattergram of the temperature versus source area for the VNF sample set overlain by the detection limit lines for the individual spectral bands. A second temperature versus source area scattergram was produced with the VNF pixels that had detection in M13 (Figure 7). The third scattergram shows temperature versus source area for VNF that lack M13 detection (Figure 8).

4.2. DNB

The detection limit line for the DNB is plotted on Figure 6, Figure 7 and Figure 8 and clearly extends to smaller source sizes as compared to the M bands. The predicted DNB radiance versus the observed radiance for the January 2018 VNF pixel set is shown in Figure 9. The dashed diagonal marks the line where the predicted radiance equals the observed. The dispersion to either side of the diagonal indicate that there is a substantial amount of non-linearity in DNB radiances relative to the VNF output.
The DNB histogram for the fire events detected by DNB but not VNF shown in Figure 5 alongside the observed DNB radiance from the VNF sample set in Figure 6 are shown in Figure 10. The two radiances distributions are offset, with the DNB fires that lacked VNF having lower radiances and very little overlap with the DNB radiances for pixel having matching VNF detections. The extremely low detection limits of the DNB make it possible to detect a vast number of fire pixels that are undetectable by VNF.
The study made on this topic with 2015 data in India (Figure 5) found the DNB detected 133,551 fire pixel lacking VNF as compared to 8516 VNF over the same time period. Thus the DNB detected 15 times more fire pixel pixels than VNF. It should be noted that this study site was selected based on the large number of DNB outlier pixels removed during the VIIRS nighttime lights product generation [22].

4.3. Error Sources

4.3.1. South Atlantic Anomaly

As several previous studies [12,23] have shown, there are false detections in MWIR fire detection products associated with high energy particle detections (HEPD), especially in the South Atlantic Anomaly (SAA) region. High energy particle hits on the VIIRS detectors result in radiances higher than the surrounding pixels, leading to false detections. By examining global maps of VNF detections for individual spectral bands and DNB it is clear that all of these spectral bands are subject to false detections from SAA and aurora. For example, Figure 11 shows M11 single band detections with no filtering to address HEPD false detections. There is a dense cloud of detections in the SAA region of South America. This is consistent with the finding of SAA false detection in the nighttime ATSR SWIR fire product [24]. The wider spread pattern of sparse detections in Figure 11 are attributable to random noise present in nighttime M11 images. The M11 detection threshold is set low to reduce errors or omission. The noise floor detection fail to have multiband detection required for Planck curve fitting.
How does VNF deal with NIR and SWIR SAA noise hits? Two methods are used to reduce the HEPD false detections. First, Planck curve fits are only performed for pixels with VNF detection in multiple spectral bands. The possibility that a given pixel has HEPD in multiple spectral bands is remote. Figure 12 shows all VNF detections having temperature estimates from January 2018. The presence of SAA false detections can be seen clearly as the cloud of pixels extending over the Atlantic and Pacific Oceans on either side of South America, though reduced from the false detection density shown in Figure 11. To isolate the spectral band(s) responsible for the HEPD in VNF with temperatures, a global map was produced of VNF with temperatures but lacking MWIR detection (Figure 13). The result shows a near complete elimination of HEPD false detections. Then we made a global map of the M12/M13 only detections and the SAA false detections are present (Figure 14). These results indicate the HEPD false detections are leaking into the VNF product through the M12/M13 only pixels. Because of the way the MWIR detection algorithm works (Figure 1), an HEPD on either M12 or M13 can trigger VNF detection.
The second method used to eliminate HEPD false detections is filter the affected VNF fractions (M11 only and M12/M13 only) to require adjacency. That is to say, filter to remove isolated detections. Figure 15 shows the M11 only detections filtered to remove isolated detections. When compared to Figure 11 it is clear that nearly all the false detections are removed. A similar filtering could be added for the M12/M13 only detections.

4.3.2. Saturation

The only two spectral band with saturation radiance (Table 1) low enough to be of concern for VNF are M11 and M12. The general effect of saturation is to reduce the pixel radiance relative to the unaffected bands. Saturation can occur anywhere in the swath. In the nadir aggregation zone three detectors are averaged to make a pixel. Thus if one of the three is saturated the result is a radiance less than full pixel saturation, corrupted by inclusion of a saturated detector radiance. This is also the case for the mid-swath aggregation zone where the signal from two detectors are averaged. Typically, only pixels from the outer aggregation zone reach the saturation radiances listed in Table 1. Thus there are two styles of saturation: “full pixel saturation” and “sub-pixel saturation”. Sub-pixel saturation does not occur in the outer aggregation zone. Figure 16 shows a VNF spectrum with sub-pixel saturation in M11 and M12. The M11 and M12 radiances are low in relation to the other spectral bands. The full pixel saturation cases are unambiguous because they have the saturation radiances (Table 1). To identify the presence of subpixel saturation VNF first runs the Planck curve fitting using the radiances in all the M bands, reporting out the sum of the squared residuals (SSR). The presence of saturation or other radiance irregularity is indicated by SSR values greater than 2. The SSR of the preliminary Planck curve fitting, including all M band radiances is 853.2. This triggers the stepwise elimination of the probable offending bands followed by Planck curve fitting. In this case, the second Planck curve fitting was run without the M12 radiance, based on its large negative residual. The second fit still had an SSR in excess of 2, so M11 was dropped based on its negative residual. The third and final Planck curve fitting was conducted skipping over the M11 and M12 radiances, affected by saturation.
A total of 2208 pixels were identified with M12 saturation or subpixel saturation from the January 2018 VNF test set, 1% of the total number of M13 detections. For M11, 146 pixels with saturation were identified, 0.35% of the total number of M11 detections. Figure 17 shows the final temperatures and source areas for the saturation pixel sets from M11 and M12. The saturation affected pixels are at the high end of source areas for any given temperature.

5. Discussion

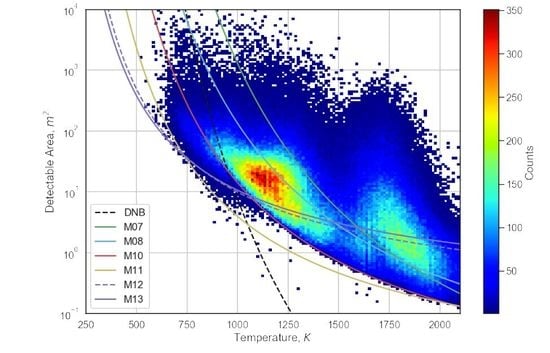
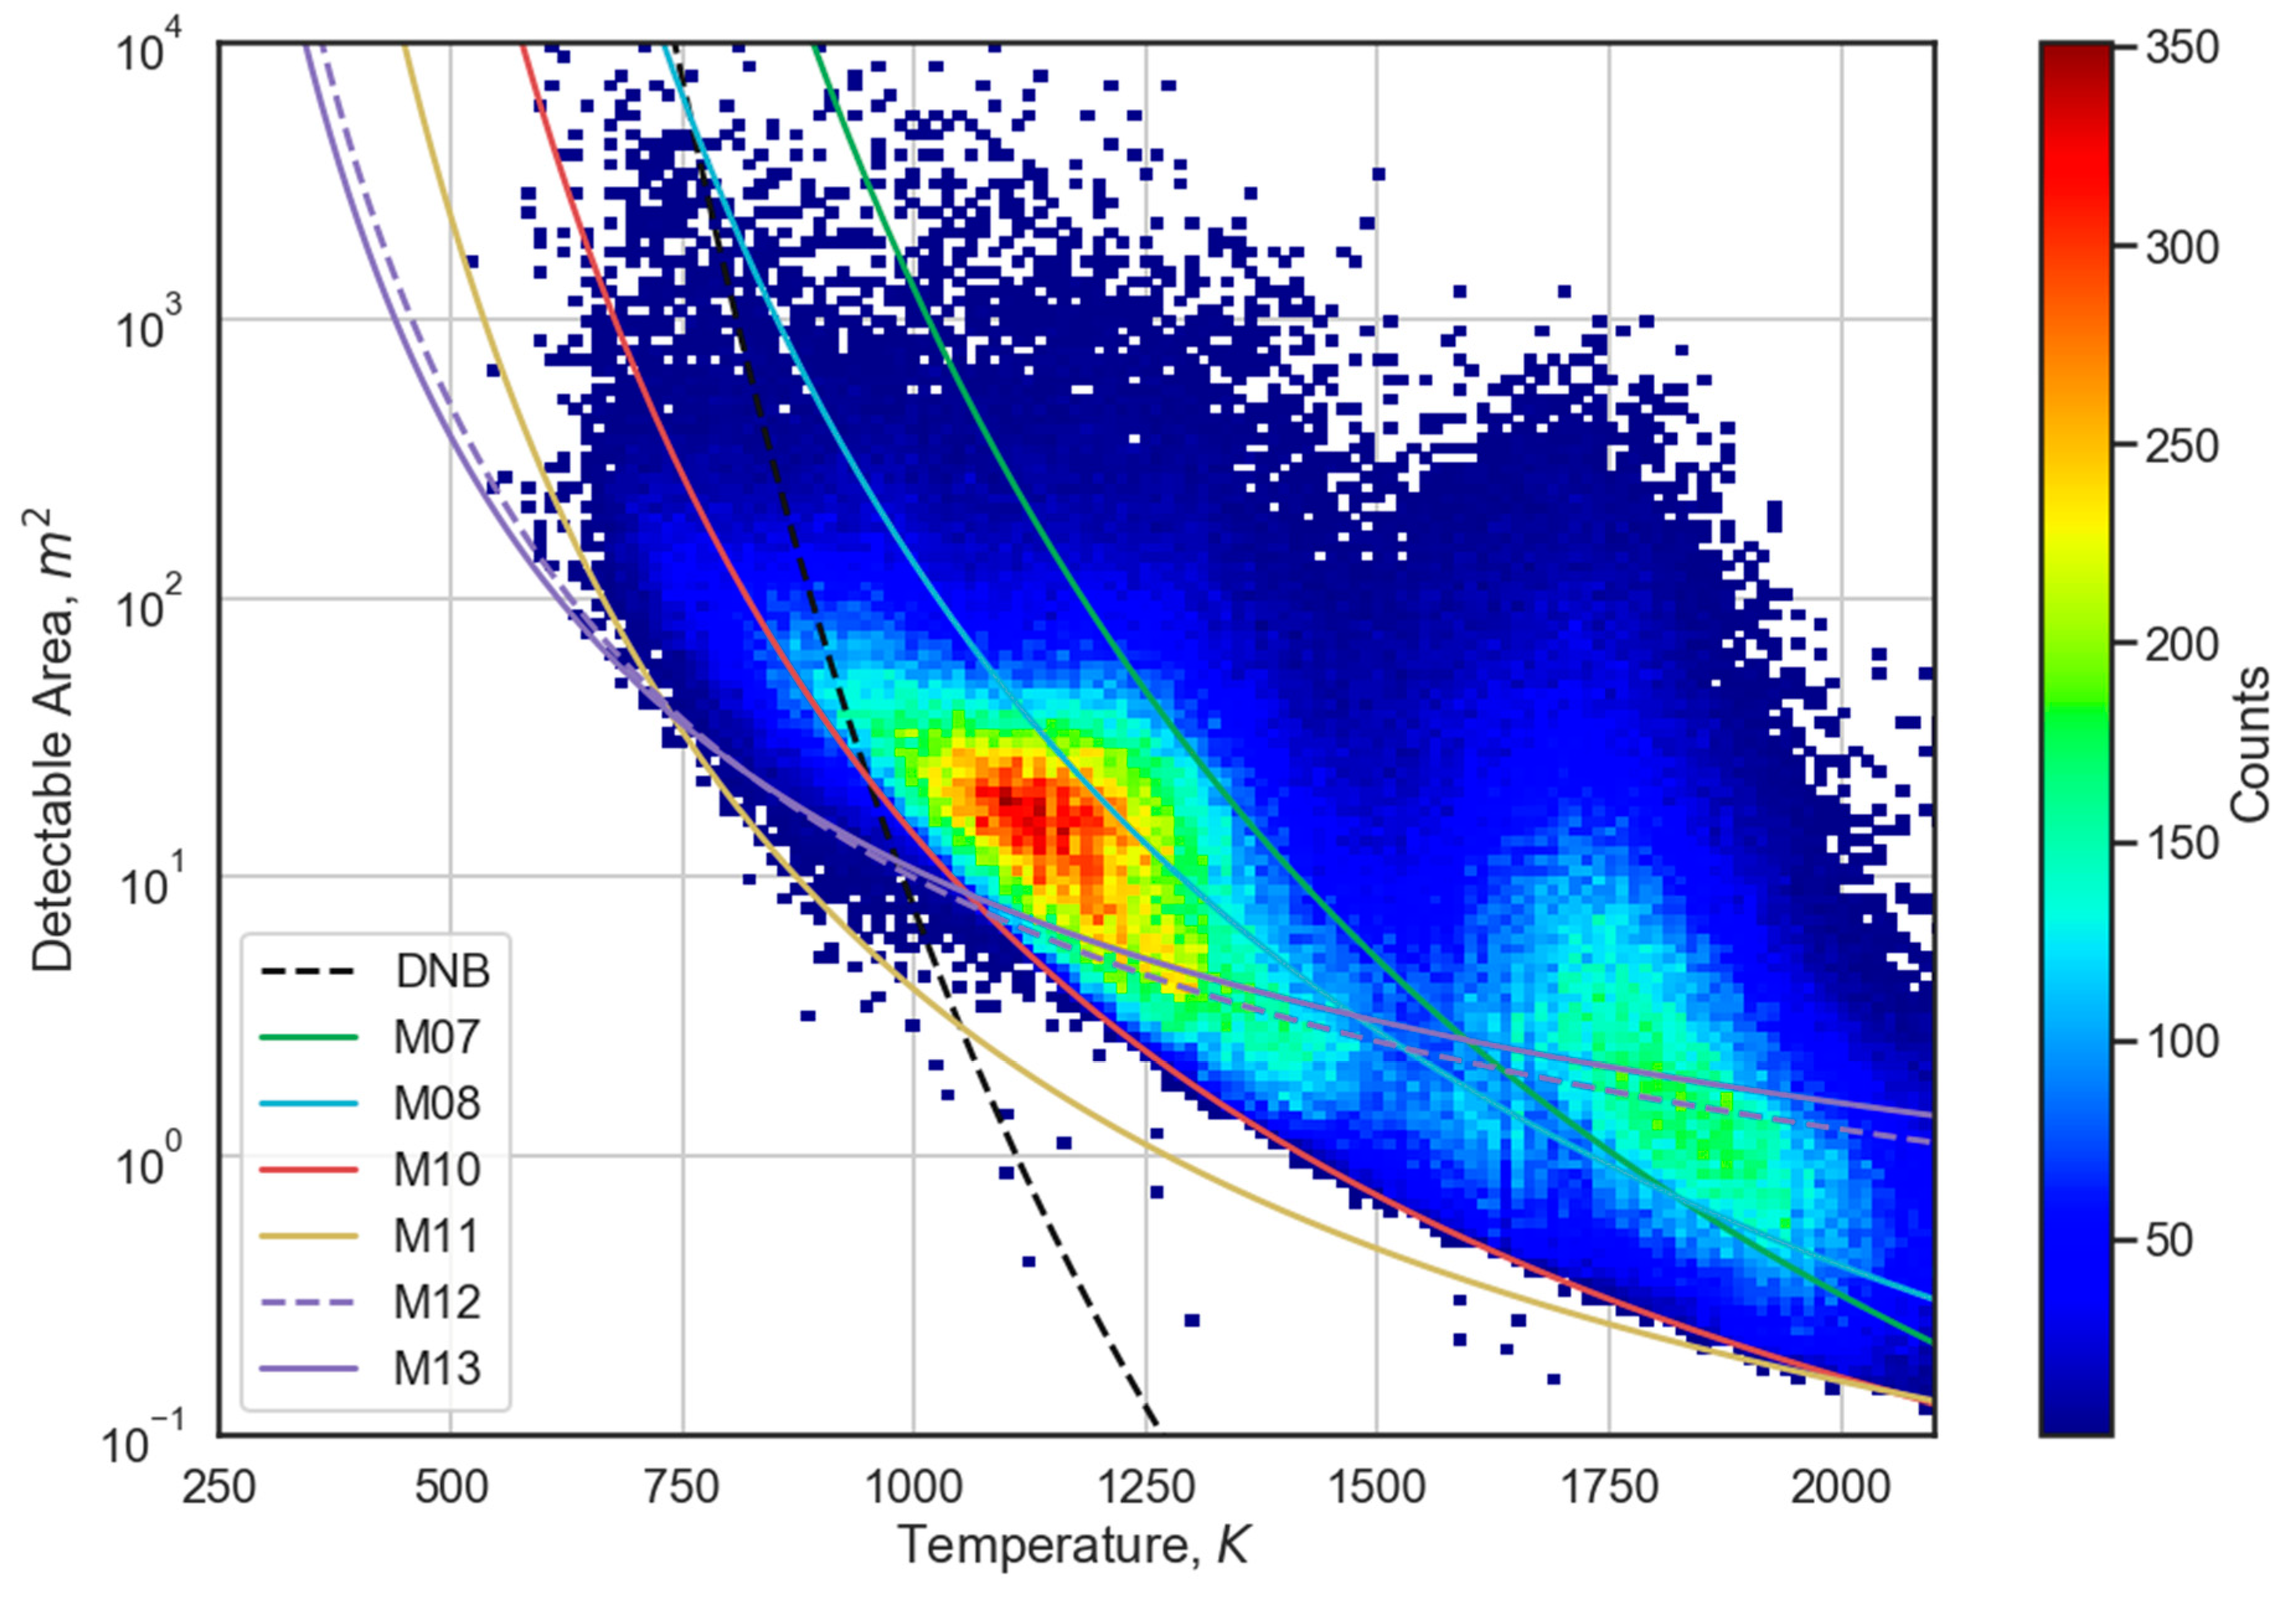
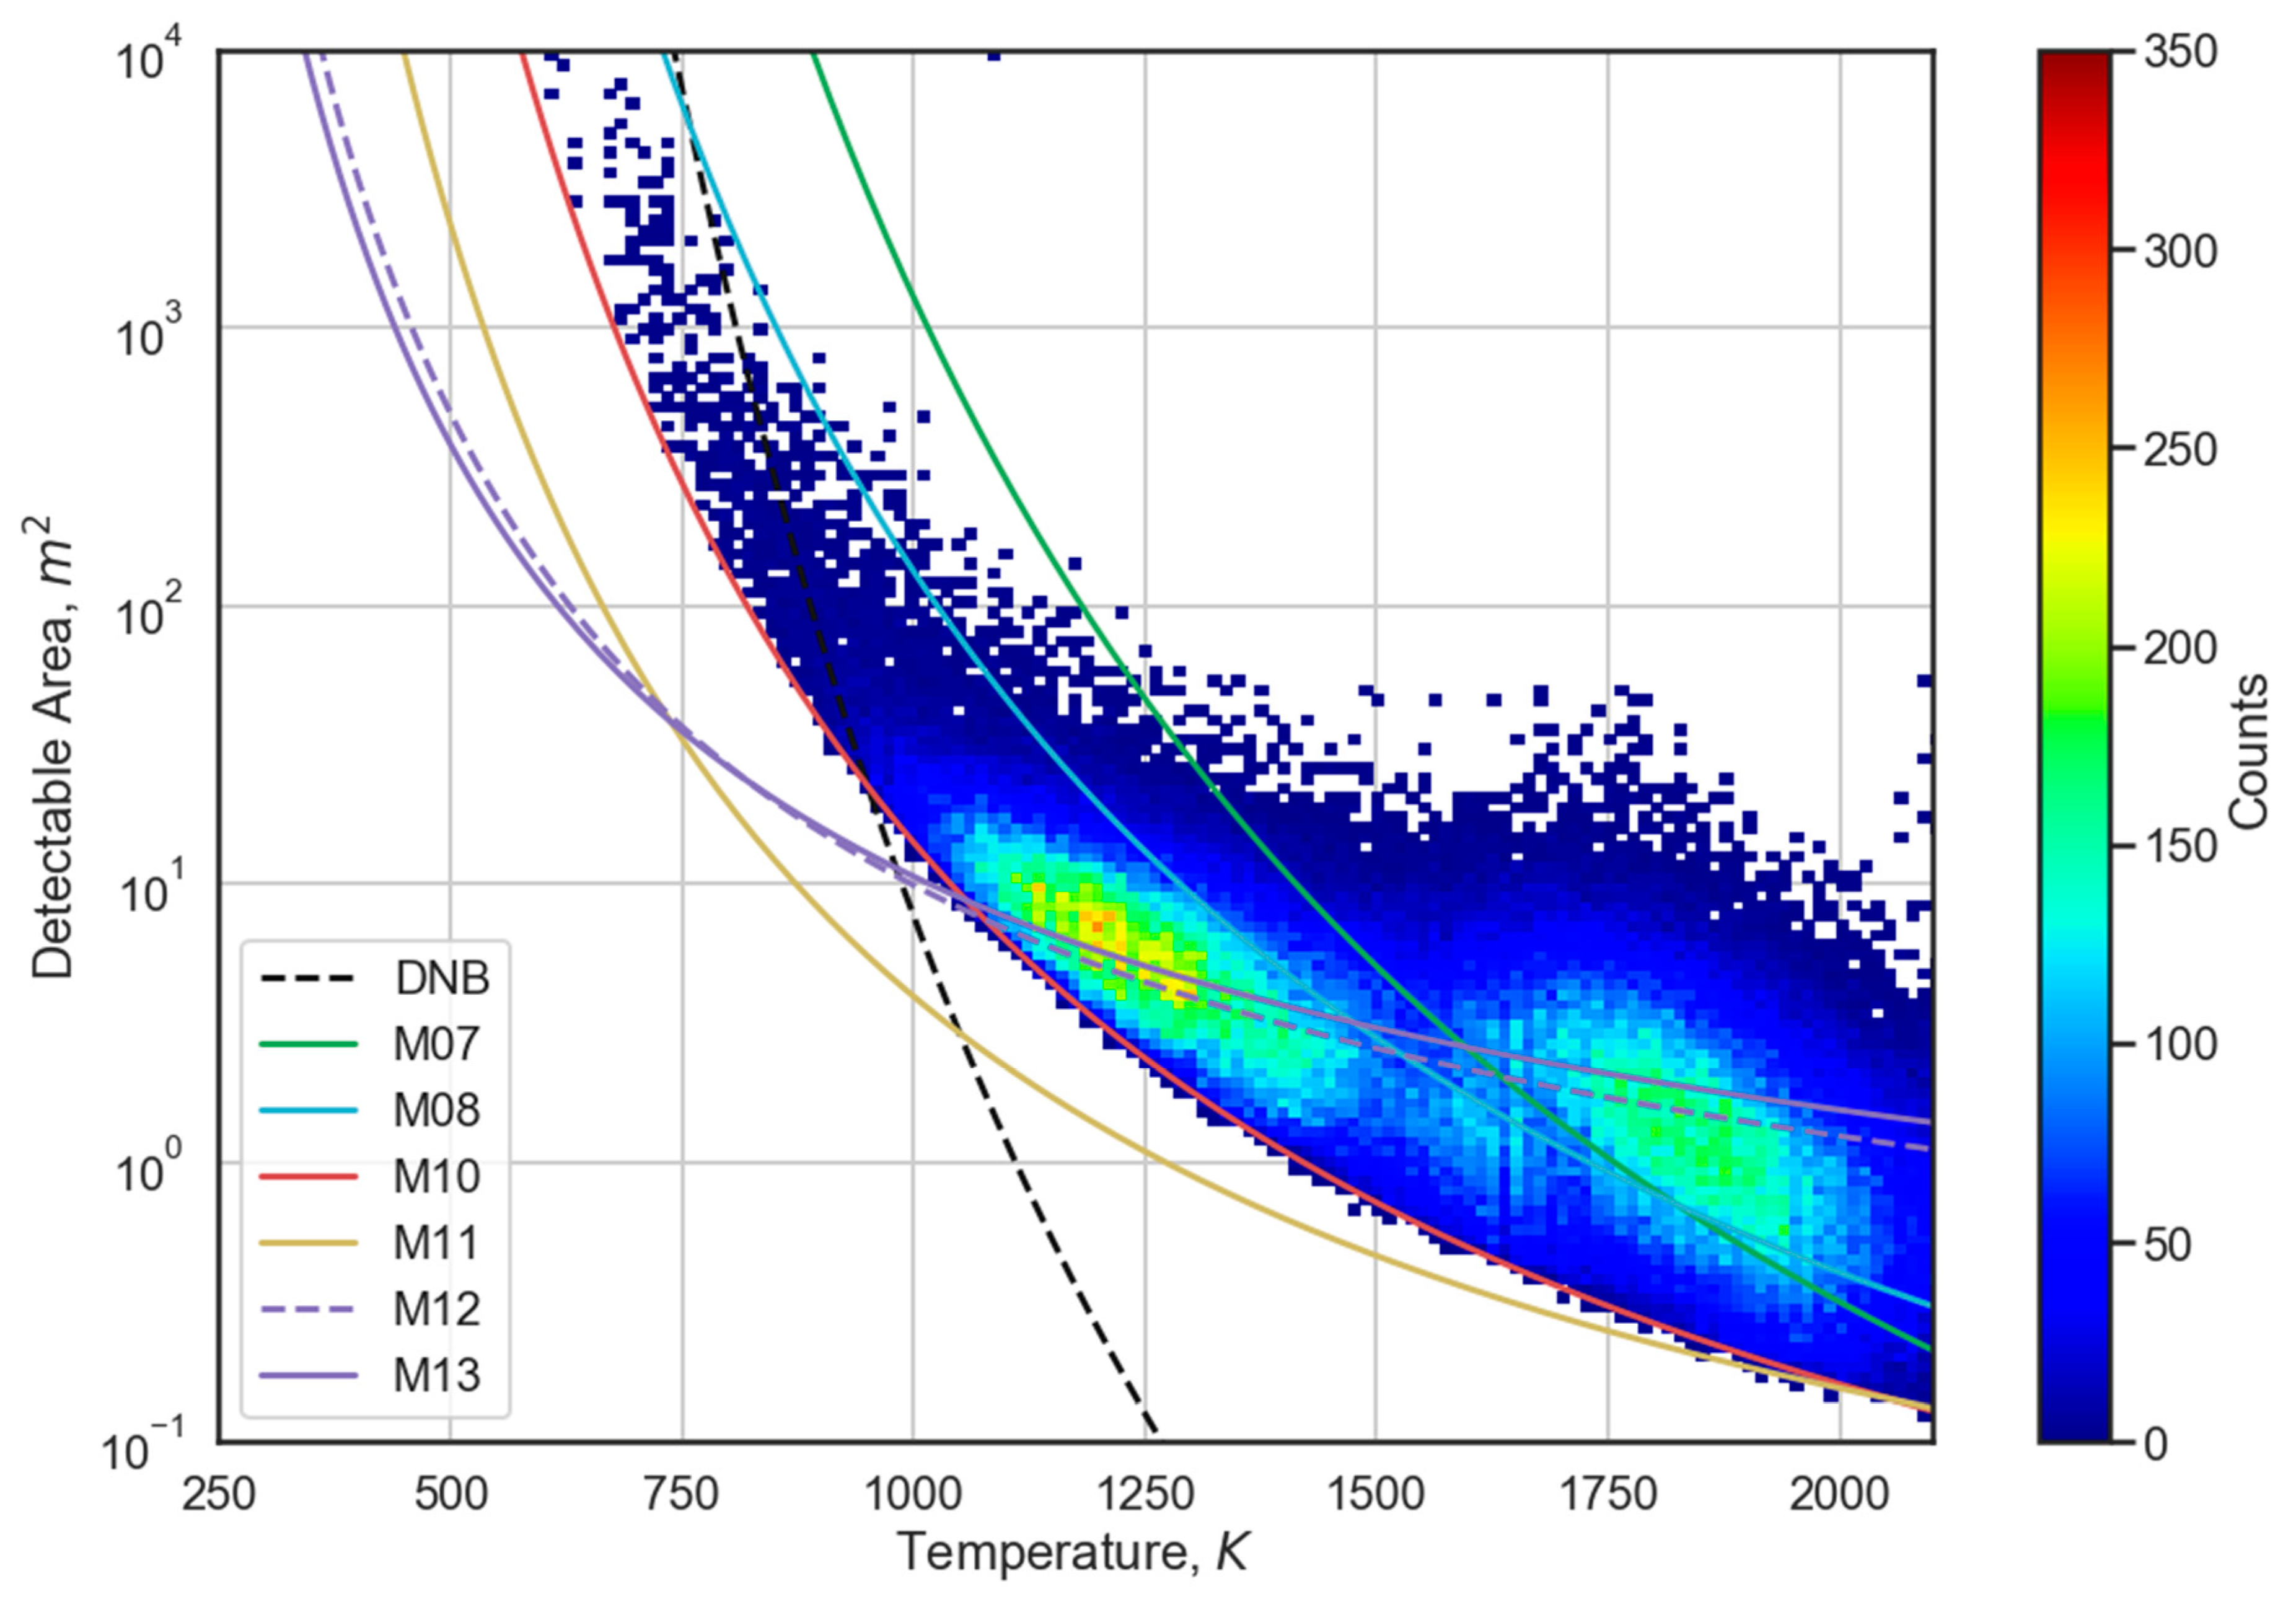
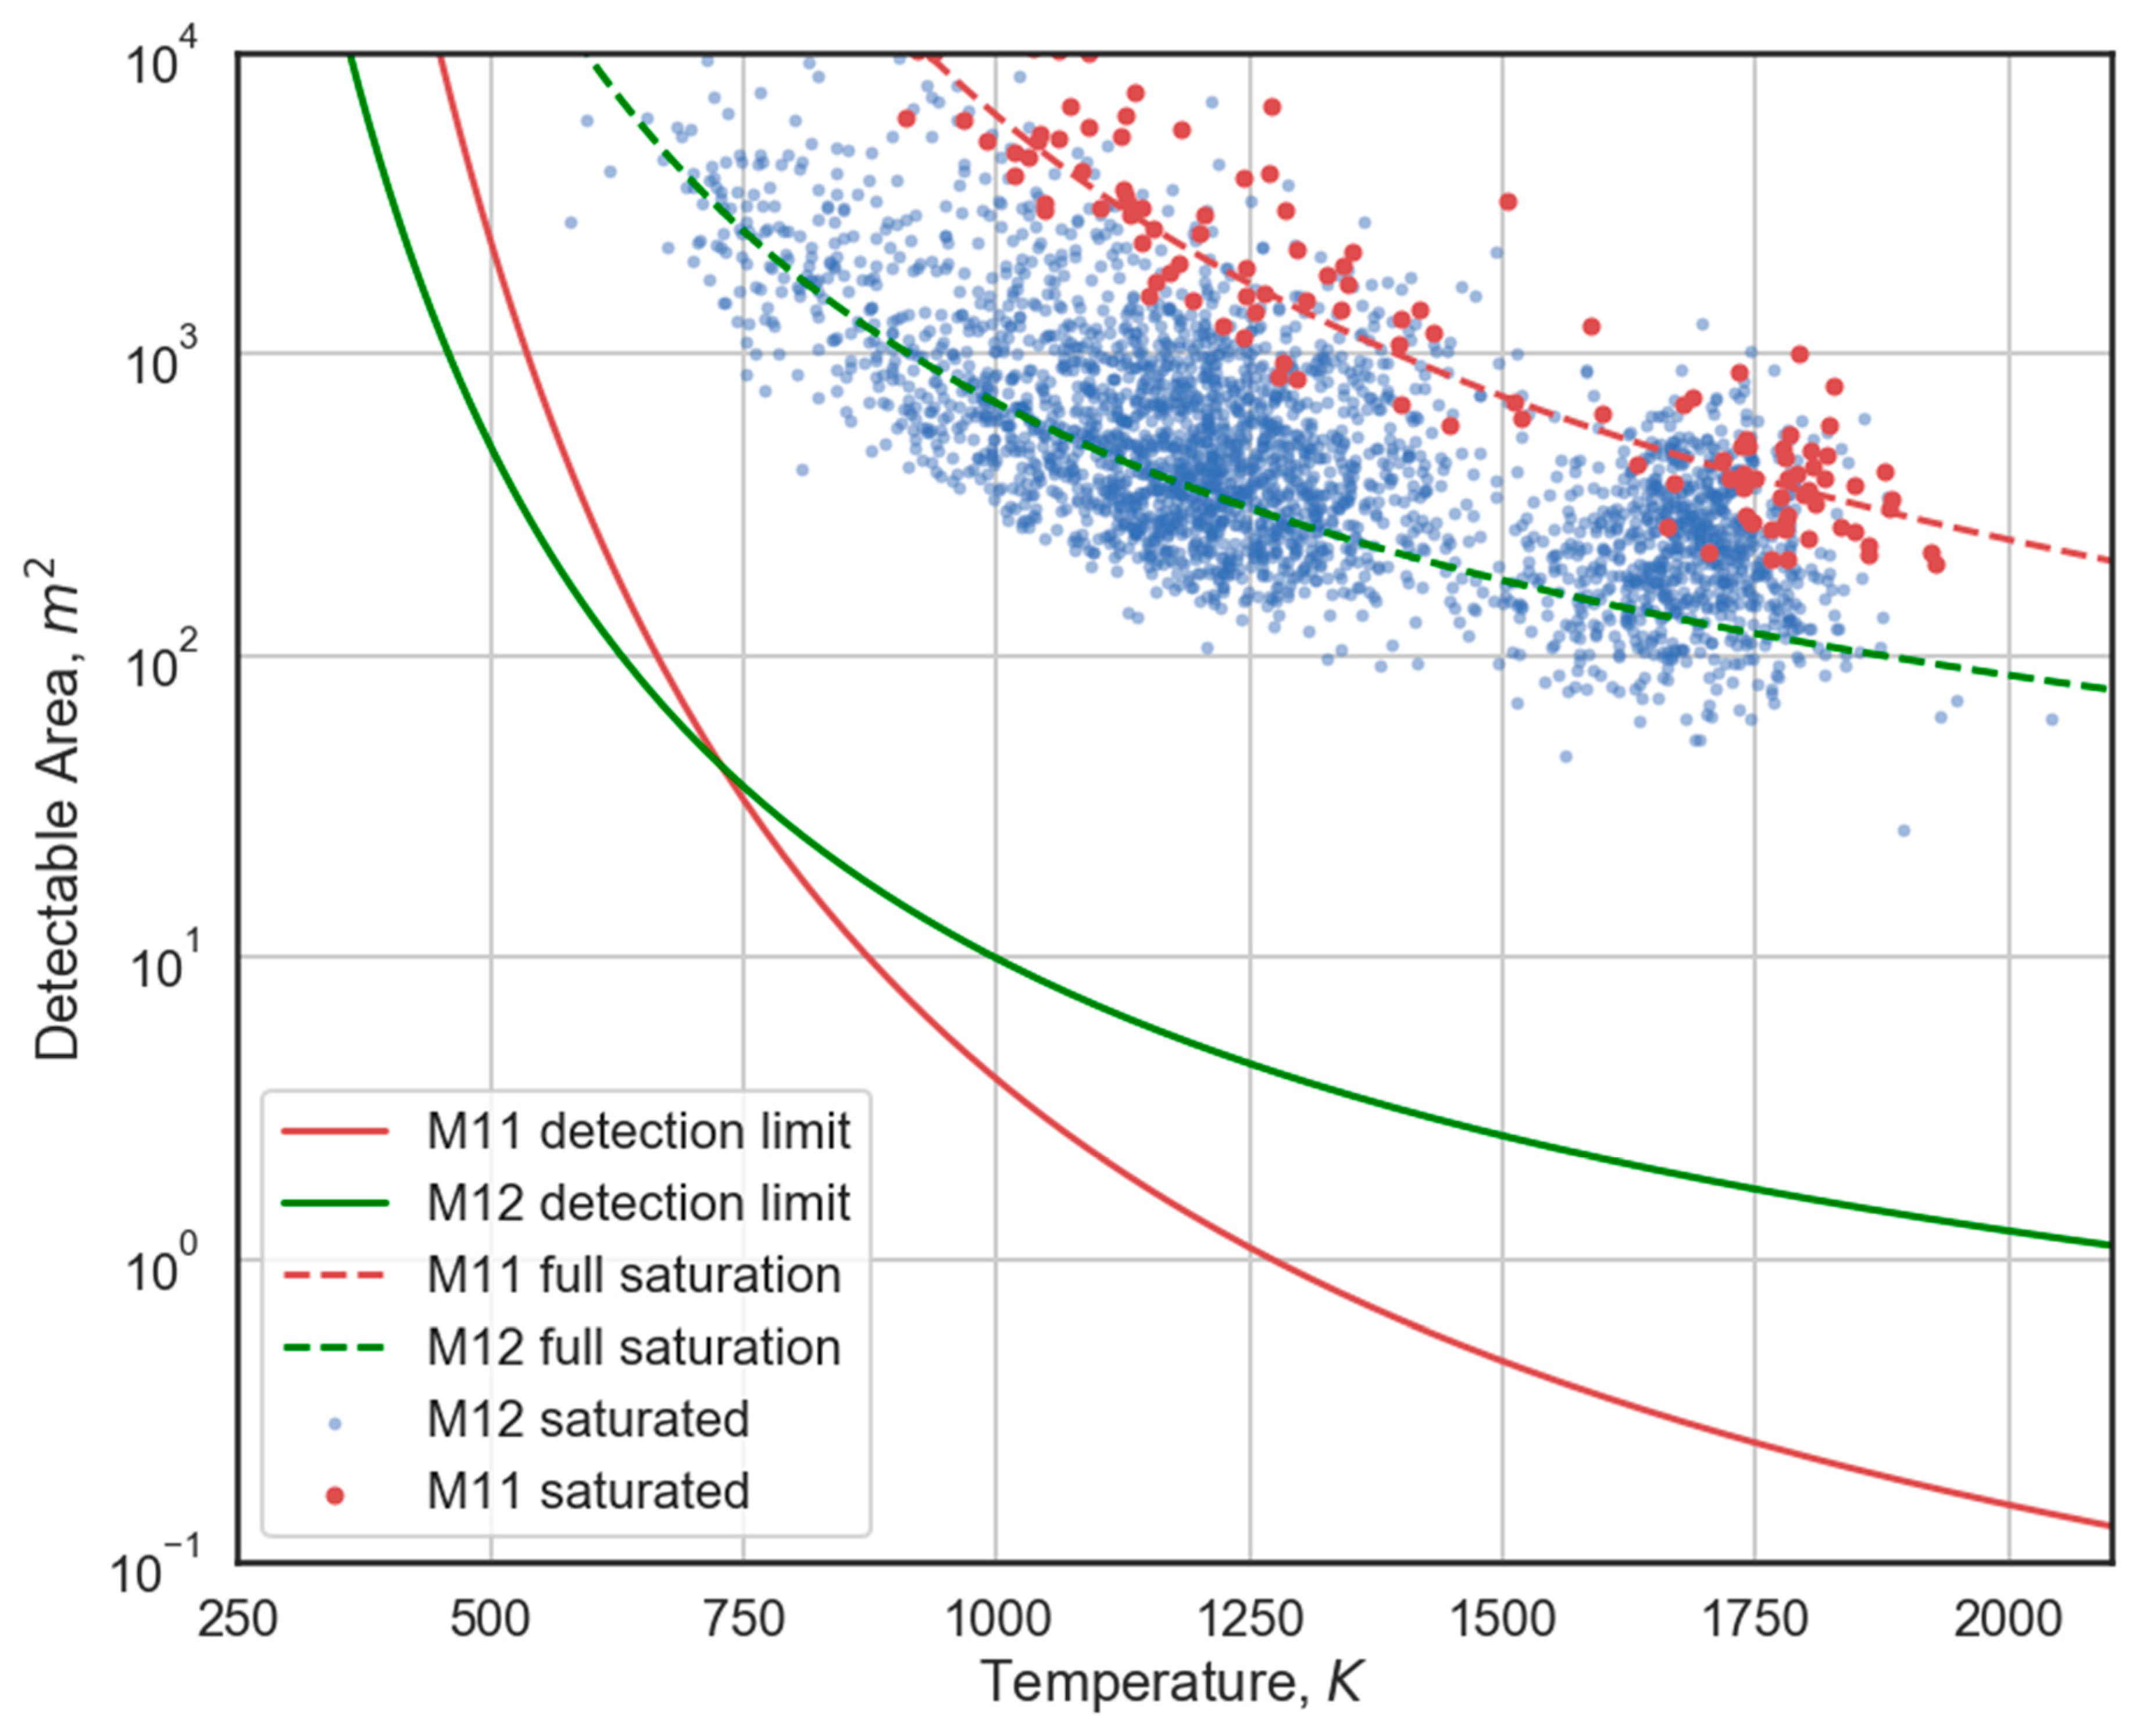
The temperature ranges calculated by VNF range from starts near 700 K and extends past 2000 K. VNF’s source area detection limits are highly dependent on temperature and range from 53 m2 at 700 K to the 0.26 m2 at 1800 K, the typical temperature of natural gas flaring. Source area detection limits decline as temperature increases, an expression of the T4 term present in the Stefan–Boltzmann Law. From Figure 6 it can be seen that there are two primary clusters of VNF detections. The low temperature VNF cluster runs from 700 to 1500 K and is dominated by biomass burning. There is a high temperature VNF cluster ranging from 1500 to 2100 K dominated by gas flaring. In contrast, the DNB has limited capabilities to detect low temperature biomass burning in the range below 750 K, but exceedingly low detection limits beyond 1000 K, reaching source areas of 0.01 m2 at 1500 K. At the typical temperature found for natural gas flaring (1800 K) the DNB detection limit is 0.001 m2, substantially smaller than the M10 detection limit of 0.26 m2.
The radiance detection limits derived for each spectral band translate into convex curves in terms of temperature versus source area (Figure 6). At the low temperature end, a larger source area is required to achieve the detection limit radiance. At the high temperature end, a smaller source area will suffice in achieving the radiance detection limit. This is an expression of the Stefan–Boltzmann Law, which contains a T4 term.
It is possible to interpret the band specific radiance detection limit charts from Figure 3 starting from the principal that with coarse spatial data such as VIIRS—there are always pixels containing combustion sources too small for detection. This “under-detection” is the combined result of the spectral band detection limits and inefficiencies in the detection algorithms at the low radiance end. The VNF radiance histograms for M11–13 (Figure 3) are largely symmetrical, trailing off relatively evenly on both the low and high ends of the radiance scale. At the low radiance end for M12–13, the ramp up in detection numbers could be due to the width of the background radiance diagonal. This width results in inefficiency in the detection algorithm at the low end of the radiance scale. The fall off at the high radiance range is due to the natural limits in the size and temperatures of combustion sources in nature. This is also the case for M11 and DNB (Figure 4). In contrast, the radiance histograms for the three of the short wavelength channels (M 7, 8, and 10) are truncated at the low radiance end. Our interpretation is that this is because the detection limits of M11 is in all cases lower. As a result, there are substantial numbers of M11 VNF detections on either side of the M7, 8, and 10 detection limit lines. There are large numbers of VNF pixels that are below the radiance detection limit for M7, 8, and 10 resulting in a truncation of the histogram at the detection limit line. The histogram truncation can be seen graphically on Figure 6 detection limit lines pass through the dense clouds of detections with substantial numbers of VNF pixels on either side of the M7, 8, and 10 detection limit lines. Once the M10 detection limit line dips below the M13 line, the VNF detections with temperatures run up to the M10 line and then stop. This behavior is a solid indication that radiance detection limit set for M10 (Figure 3) are well placed.
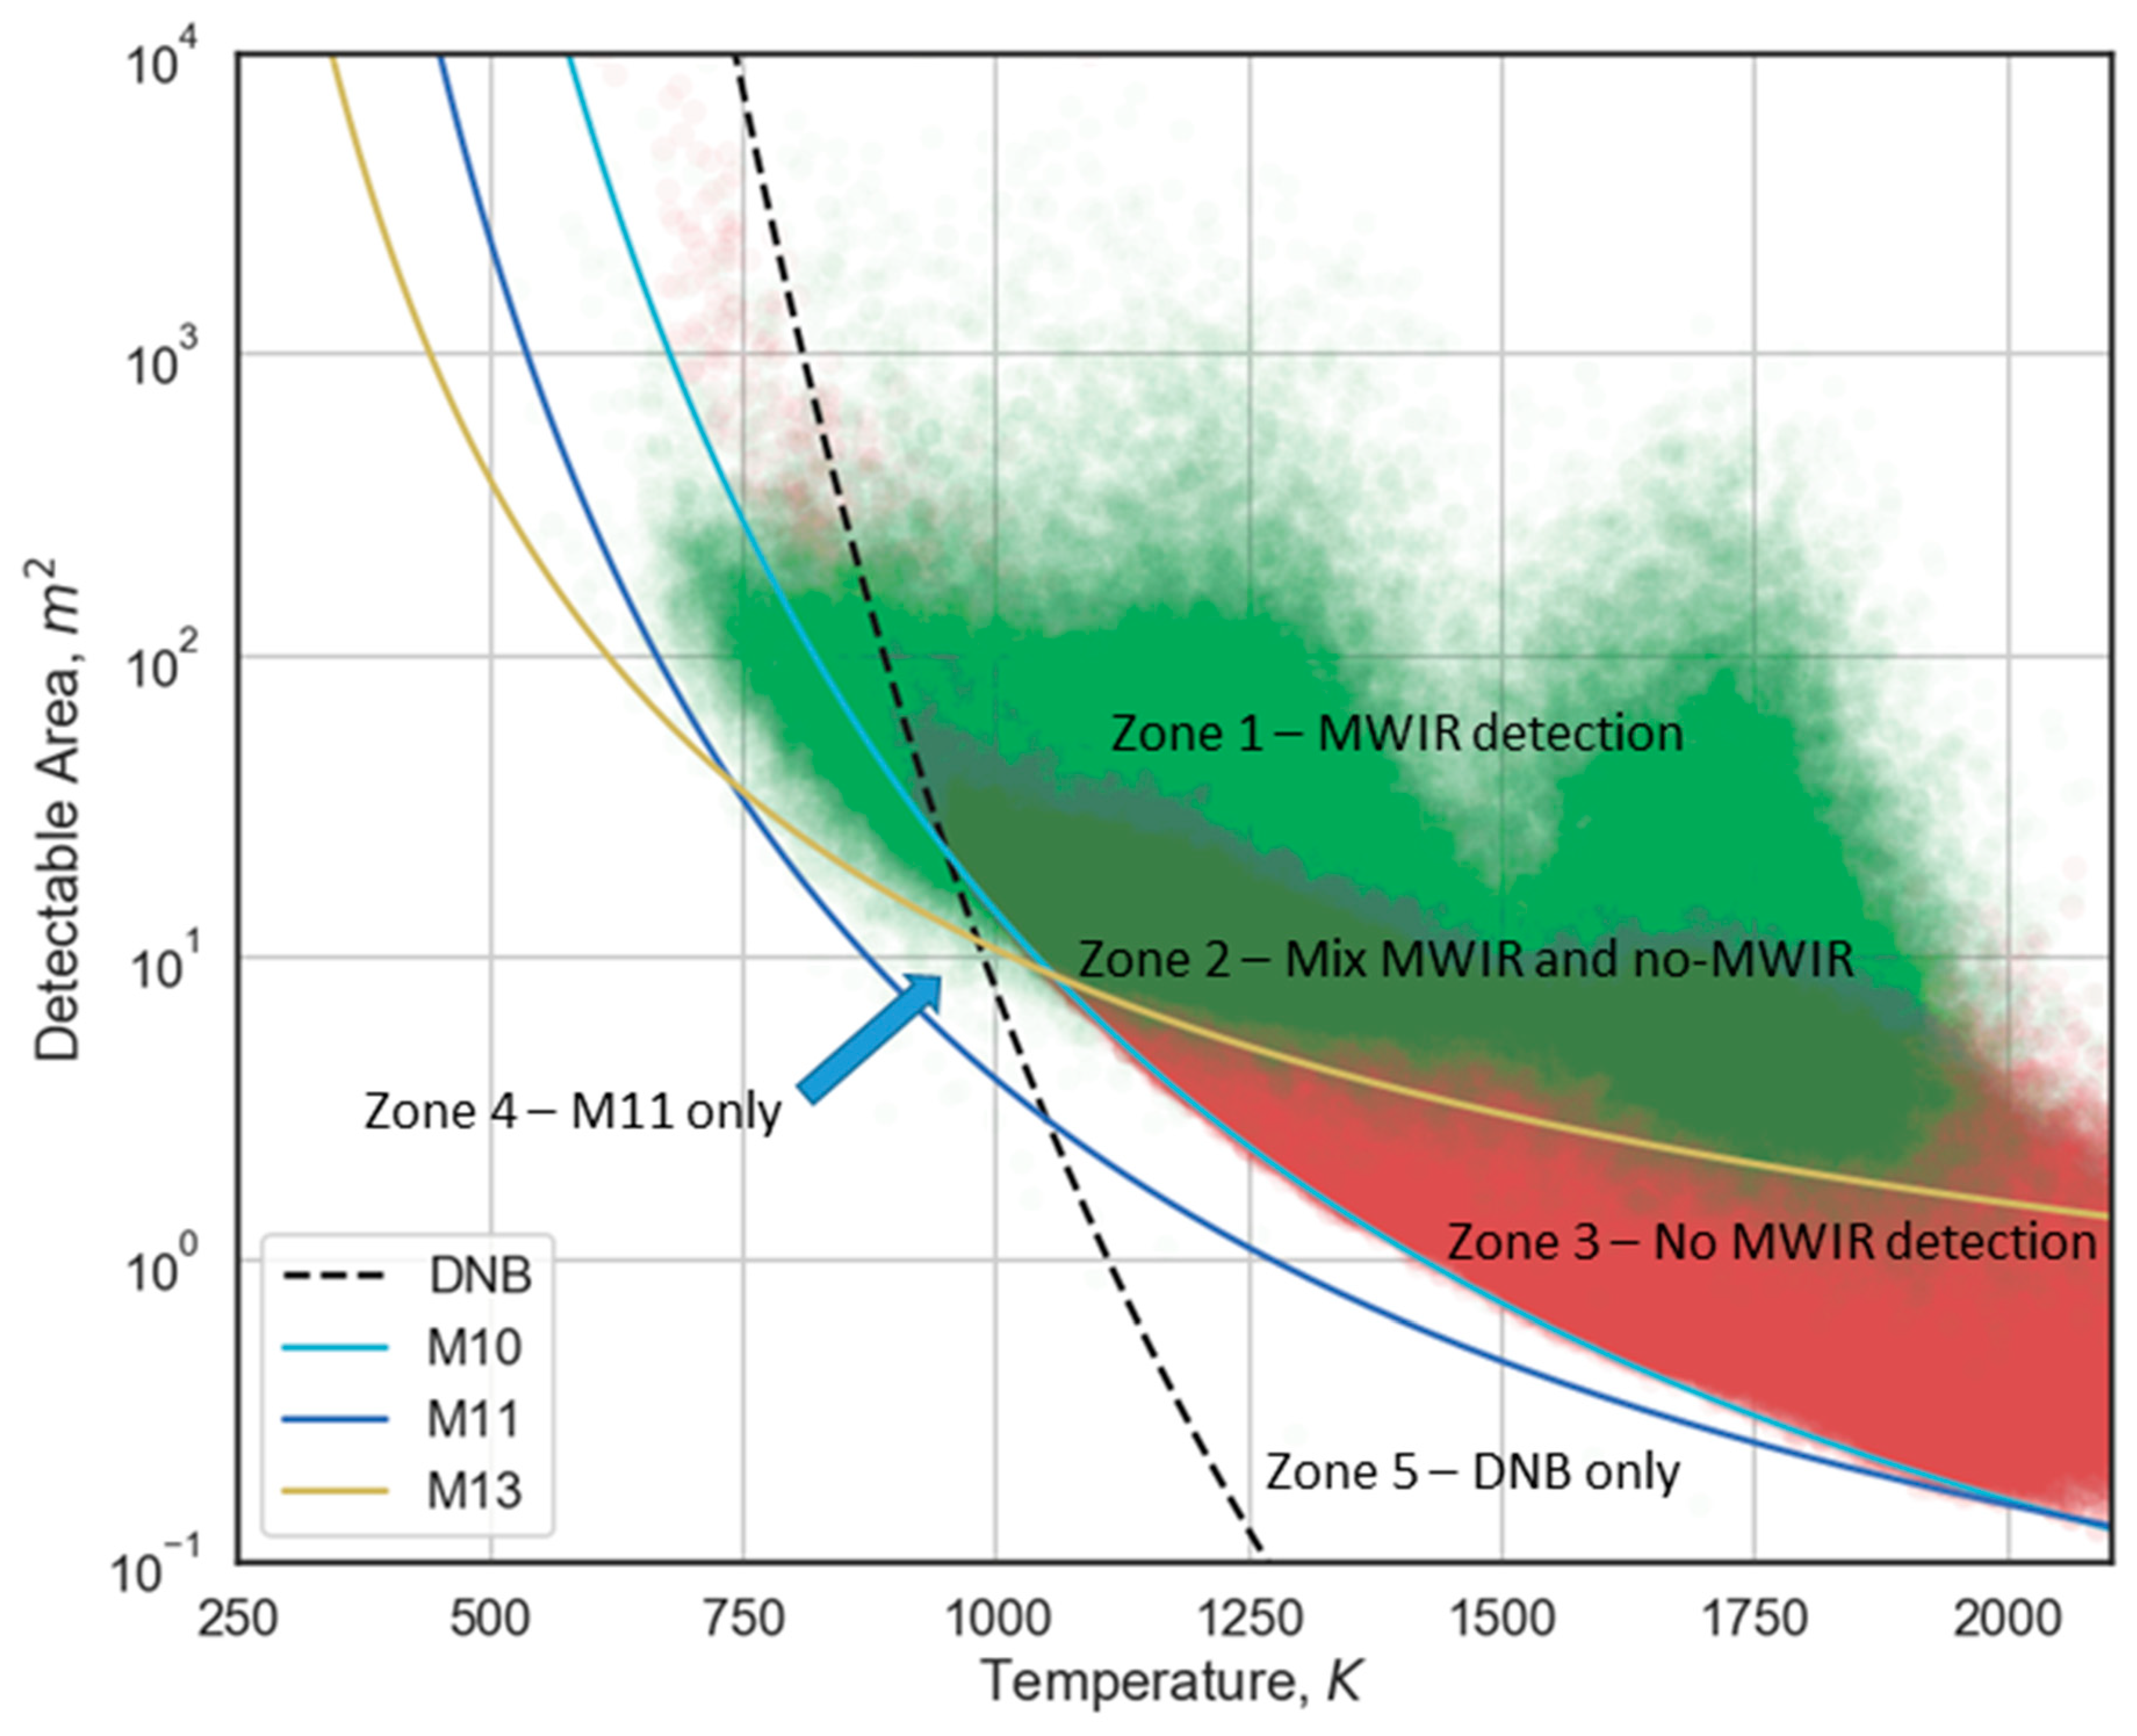
The VIIRS combustion source temperature versus source area space can be divided into five distinct zones (Figure 18). Four of these zones come from VNF and the fifth comes from the DNB. In the first zone, all the VNF pixels have MWIR detection, complemented in most cases by SWIR detection in M10–11 and in some cases NIR detection in M7–8. The second zone has a mix of detections involving the MWIR and those that lack MWIR. The third zone has no MWIR detection and extends down to the M10 detection limit line. The third zone is out of reach for the operational fire products based on single band MWIR detection. In the fourth zone the VNF detection is in the M11 channel only. It is located above the M11 detection limit line, below the MWIR channel detection limit from 700 to 1100 K and below the M10 line from 1100 to 2100 K. Because the detections are in a single spectral band, it is not possible to calculate temperature or source area, hence the zone is largely empty on Figure 6. The fifth zone is above the DNB detection limit and below the M11 line. In this zone combustion sources can only be detected by the DNB, but no temperature can be calculated.
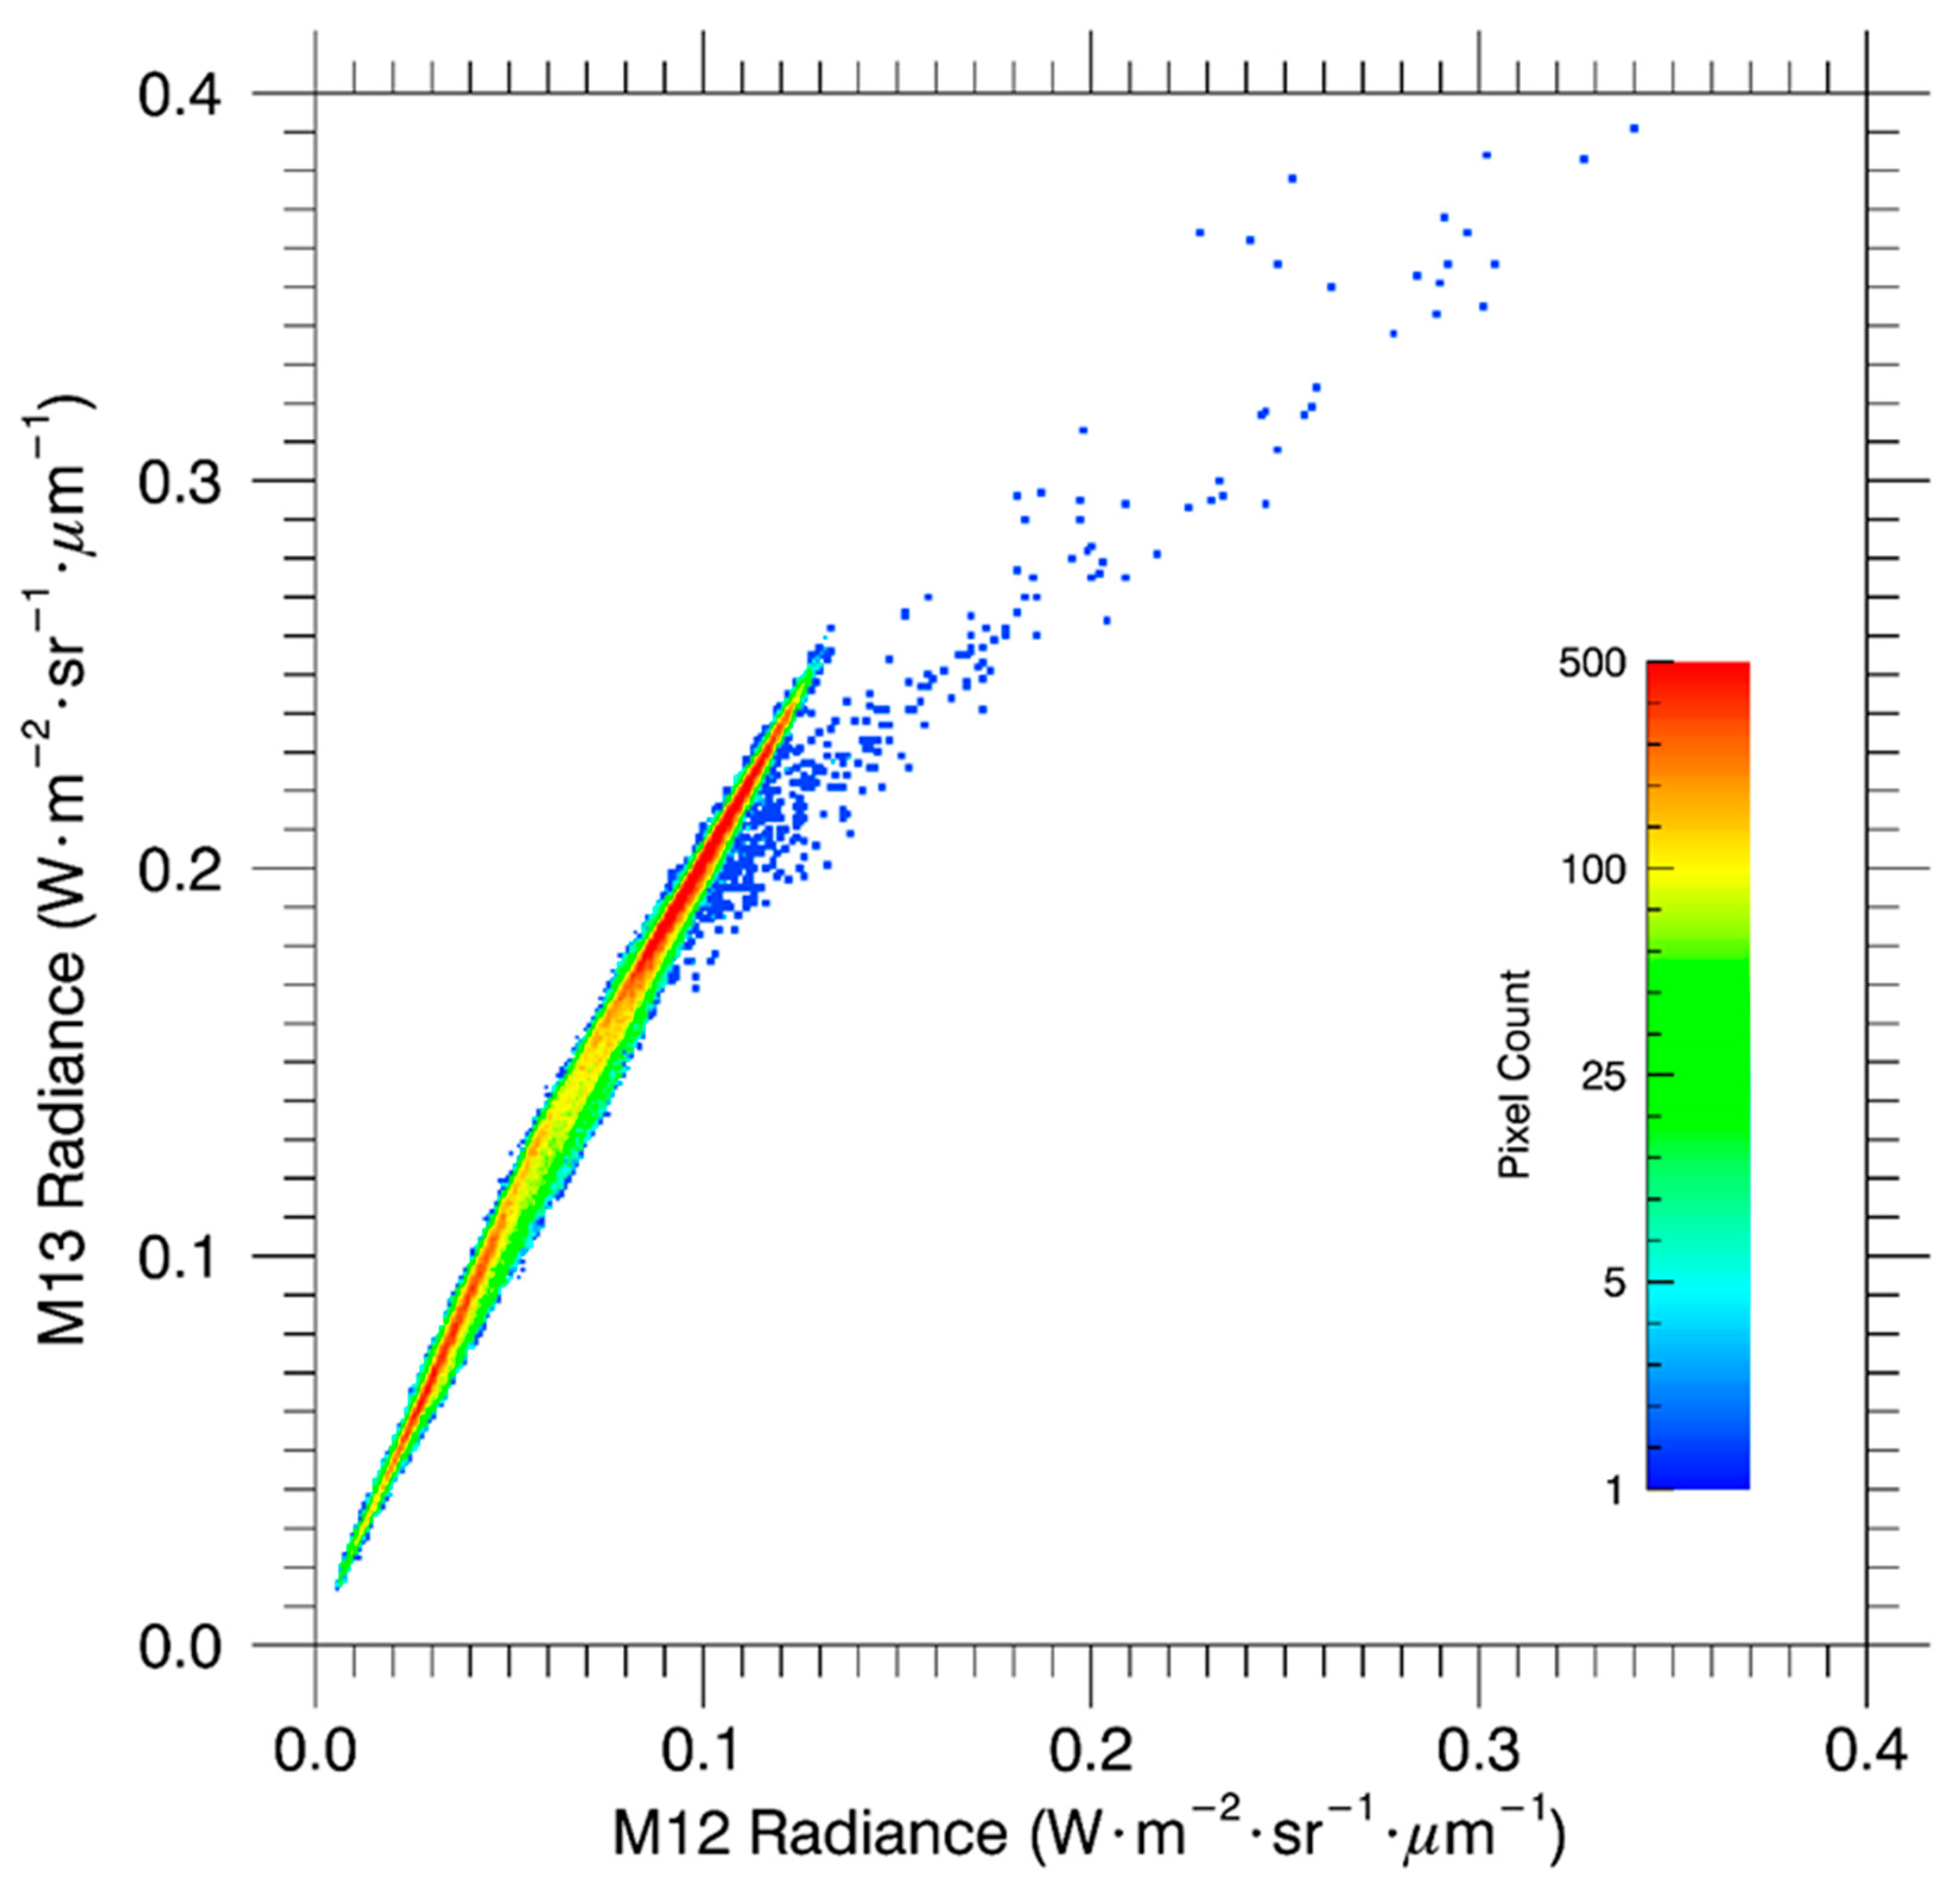
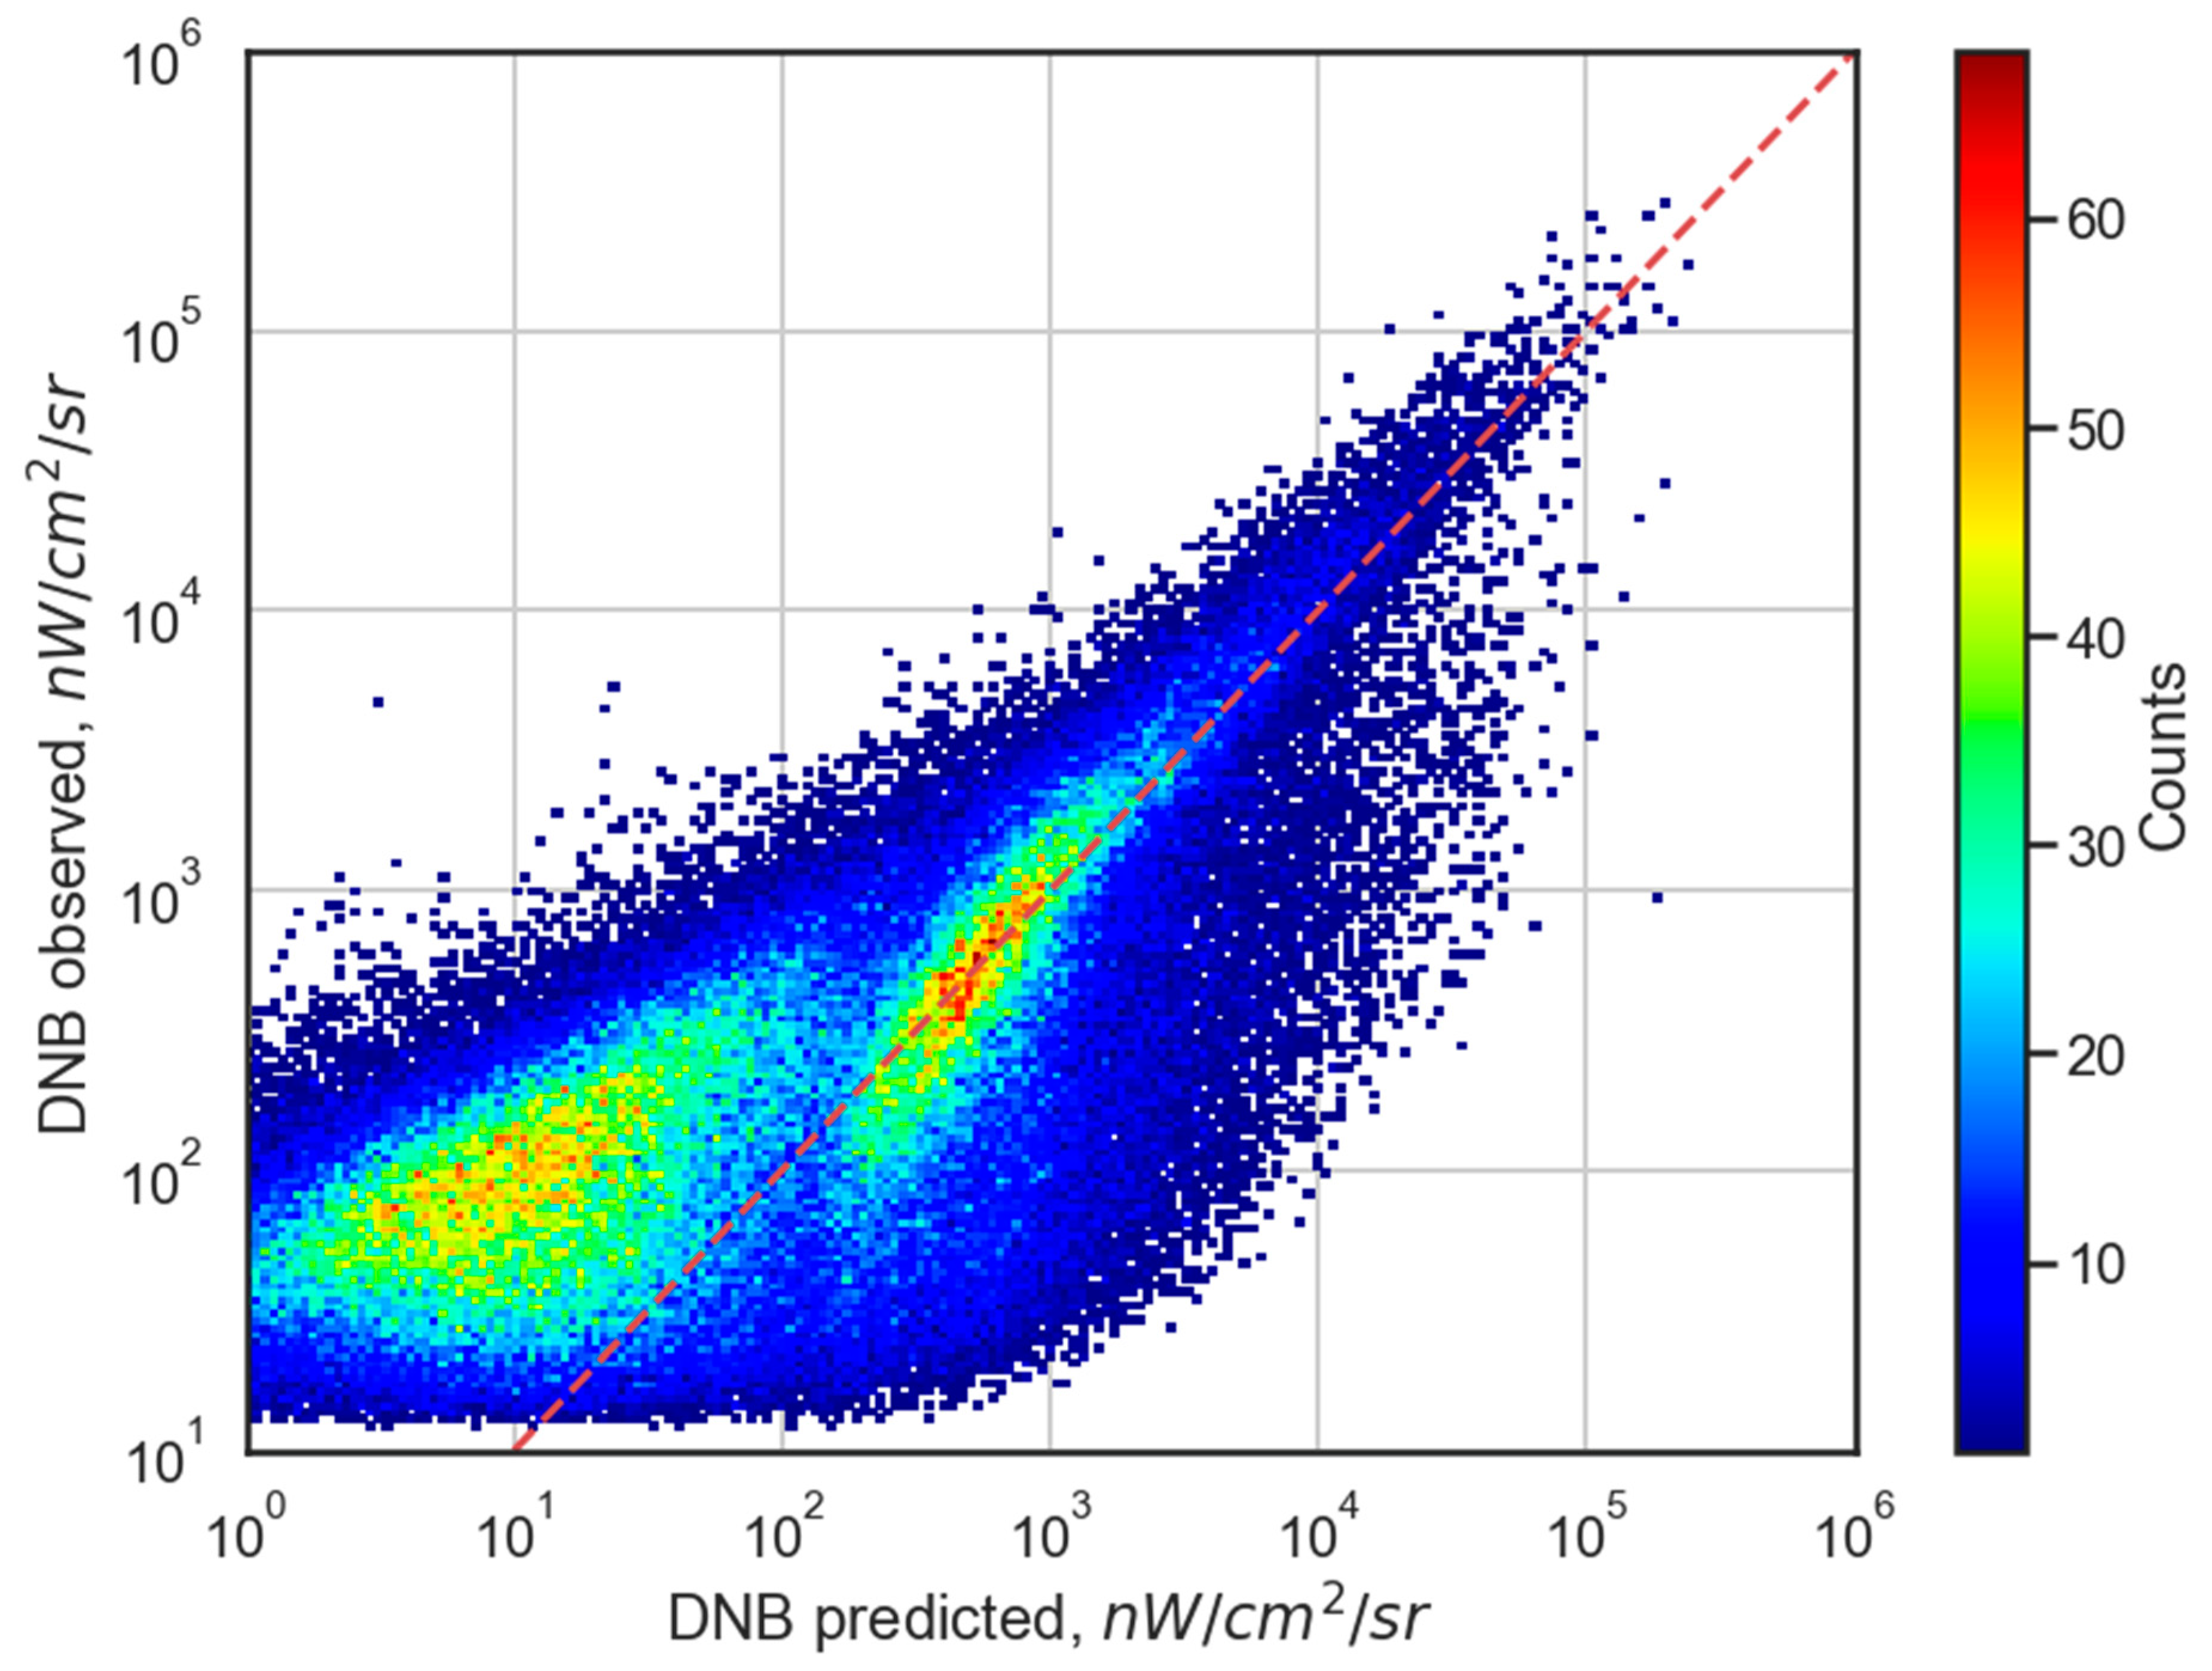
One of the questions that can now be addressed is whether the DNB radiance can be used with other M band radiances in Planck curve modeling. To date, the VNF Planck curve fitting has not included the DNB radiances. Figure 9 shows the observed versus the Planck curve predicted DNB radiances for the VNF pixel set shown in Figure 6. As with Figure 6, there are two clusters present on Figure 9. The high temperature cluster, corresponding to gas flares, is on the right side of Figure 9. The low temperature cluster is on the left side of Figure 9. A dashed diagonal line indicating a precise match between observed and predicted DNB radiances is marked on Figure 9. For gas flares the observed versus predicted are aligned moderately well with the diagonal line, indicating it may be reasonable to include the DNB radiance in Planck curve fitting in cases where the IR emitter is known to be a high temperature source. For biomass burning the observed DNB radiance is substantially greater than the predicted radiance, in some case by a factor of ten. Smoke obscuration likely impacts the DNB more that SWIR and MWIR. However, smoke obscuration in DNB would logically decrease the observed radiance [25], opposite to the pattern shown for biomass burning in Figure 9. It is known that biomass burning emission spectra contains a narrowly spaced set of strong potassium emission lines in the range of 0.76 to 0.77 μm [26]. The Potassium content of wood ashes are reported to be in the 5–7% range [27] and that there is substantial variation in this number across different plant materials [28]. However, it is not clear what portion of the enhanced radiance in the DNB from biomass burning pixels can be explained by the Potassium emission lines. It appears that additional research would be required to better understand the potential role the DNB radiances could play in the VNF product.
The vast majority of false detections, such as those from HEPD, are filtered out of the VNF pixel set with temperature calculation. The two pixel sets that retain HEPD false detections are the M11 single band and M12/M13 only detections. VNF removes nearly all the M11 HEPD false detections by filtering out isolated detections that lack adjacency. This filtering would likely remove most of the M12/M13 HEPD false detections, though this has not yet been implemented. Full pixel and subpixel saturation occurs in about 1% of the VNF detections, primarily affecting the M11 and M12 spectral bands. Inclusion of the saturated radiances results in errors in temperature and source area. These errors can be avoided by conducting the Planck curve fitting without the saturation affected radiances.

6. Conclusions

Traditional satellite fire detection algorithms that rely on a MWIR spectral channel for detection have the advantage of working under both day and night conditions. However, there are three known shortcomings. First, with detection in a single spectral band it is not possible to fit the Planck curve for the IR emitter, which would enable temperature, source area and radiant heat calculations with physical laws. That is why fire radiative power (FRP) is estimated for limited temperature range based on an empirical calibration rather than the Stephan–Boltzmann Law. Second, the MWIR channel data, designed for meteorological applications, can only detect the upper size range of pixels containing IR emitters. Combustion source detection limits can be extended to lower levels at night by including NIR and SWIR data. In the test data set, adding in the short wavelengths M band channels doubled the number of detections having temperature calculations. Adding in the M11 only detections (lacking temperatures) provides a 55% augmentation in the overall detection numbers.
Inclusion of the SWIR bands gives VNF an improved ability to detect gas flares [29], which are about twice as hot as biomass burning [13]. Gas flares burn at near 1800 K, which places their peak radiant emission near the central wavelength of the M10 spectral band which can detect flares as small as 0.26 m2. The DNB can detect even smaller flares, however without the VNF there is an ambiguity in that many flaring sites also have electric lighting, also detectable by the DNB.
The primary error sources affecting VNF are high energy particle detections (HEPD) and radiance saturation. The HEPD are present in all spectral bands and the vast majority of these are blocked from the VNF output by requiring detection in multiple spectral bands for the Planck curve fitting. The exception to this are the HEPD detections in the MWIR bands (M12 and M13). M11 has the lowest detection limits of all the M bands and VNF has a pixel class for M11 single band detections. Here, HEPD and residual background noise are filtered out by removing solitary M11 detections. Saturation primarily affects M12 and to a lesser extent M11. M12 saturation is present in about 1% of the VNF pixels worldwide. Inclusion of the saturation affected radiances would introduce errors in the temperature, source area and radiant heat calculations. VNF’s Planck curve fitting algorithm detects the presence of saturation and other radiance irregularities, making it possible to exclude affected radiances to avoid introducing errors in the output.
In cases where there is VNF detection in multiple spectral bands it may not make sense to include the DNB in the Planck curve fitting due to the wide range of phenomena detected (electric lights, fires, flares, aurora, and moonlit clouds). However, in M11 only detections, an argument could be made to include the DNB radiance in order to calculate the temperature, source area and radiant heat. Obviously, the error levels will rise, as shown with the non-linearity in Figure 9.
The extremely low detection limits of the DNB results in small source area IR emitter detections that are unseen by VNF. These fall into zone 5 on Figure 18. The density of IR emitter detections in zone 5 is likely highly variable. The study in India found the DNB had 15 times the number of VNF detections for the same set of nights. This is likely at the high end of the range. In a similar analysis, Polivka et al. [30] found less than a doubling of fire detections in the DNB over MWIR detections. Should it be surprising that is some case the zone 5 detections exceed all the other zones in Figure 18? It is well established that in nature, size distributions are skewed towards the small [31]. This points to the potential value of a DNB fire product to augment VNF and other satellite fire products.
A DNB fire detection algorithm could be developed, building on the methods developed to detect fire in DMSP-OLS low light imaging data in the mid-1990’s [31]. A recent publication alluded to this possibility with VIIRS data [32]. It is clear that the DNB has the capacity to substantially expand the number of detected subpixel combustion source detections. However, DNB fire detection is restricted to zones outside of electric lighting. The screening of electric lighting can be done using an up-to-date map of persistent DNB lighting. This was the basis of the DMSP fire detection algorithm developed two decades ago [32].

Supplementary Materials

The following are available online at https://www.mdpi.com/2072-4292/11/4/395/s1.

Author Contributions

Conceptualization, analysis, and writing:, C.D.E., VNF and VBD algorithm development: M.Z., VNL algorithm development: K.B.; VNF, VBD, and DNB processing: K.B. and T.G.; development of Planck’s Law calculator: F.C.H.

Funding

This research was funded by NOAA’s JPSS proving ground program and NASA’s carbon cycle program.

Acknowledgments

The authors acknowledge the large NASA and NOAA efforts that produce the highly calibrated VIIRS data on an operational basis.

Conflicts of Interest

The authors declare no conflict of interest.

References

  1. Dozier, J. A method for satellite identification of surface temperature fields of sub-pixel resolution. Remote Sens. Environ. 1981, 11, 221–229. [Google Scholar] [CrossRef]
  2. Matson, M.; Dozier, J. Identification of subresolution high temperature sources using a thermal IR sensor. Photogramm. Eng. Remote Sens. 1981, 47, 1311–1318. [Google Scholar]
  3. Flannigan, M.D.; Vonder Haar, T.H. Forest fire monitoring using NOAA satellite AVHRR. Can. J. For. Res. 1986, 16, 975–982. [Google Scholar] [CrossRef]
  4. Matson, M.; George, S.; Jennifer, R. Fire detection using data from the NOAA-N satellites. Int. J. Remote Sens. 1987, 8, 961–970. [Google Scholar] [CrossRef]
  5. Flasse, S.P.; Ceccato, P. A contextual algorithm for AVHRR fire detection. Int. J. Remote Sens. 1996, 17, 419–424. [Google Scholar] [CrossRef]
  6. Giglio, L.; Jacques, D.; Christopher, O.J.; Yoram, J.K. An enhanced contextual fire detection algorithm for MODIS. Remote Sens. Environ. 2003, 87, 273–282. [Google Scholar] [CrossRef]
  7. Weinreb, M.P.; Michael, L.H. Calculation of Atmospheric Radiances and Brightness Temperatures: In Infrared Window Channels of Satellite Radiometers. Available online: https://repository.library.noaa.gov/view/noaa/13444 (accessed on 7 February 2019).
  8. Wooster, M.J.; Roberts, G.; Perry, G.L.W.; Kaufman, Y.J. Retrieval of biomass combustion rates and totals from fire radiative power observations: FRP derivation and calibration relationships between biomass consumption and fire radiative energy release. J. Geophys. Res. Atmos. 2005, 110. [Google Scholar] [CrossRef] [Green Version]
  9. Peterson, D.; Wang, J. A sub-pixel-based calculation of fire radiative power from MODIS observations: 2. Sensitivity analysis and potential fire weather application. Remote Sens. Environ. 2013, 129, 231–249. [Google Scholar] [CrossRef]
  10. Peterson, D.; Wang, J.; Ichoku, C.; Hyer, E.; Ambrosia, V. A sub-pixel-based calculation of fire radiative power from MODIS observations: 1. Algorithm development and initial assessment. Remote Sens. Environ. 2013, 129, 262–279. [Google Scholar] [CrossRef]
  11. Giglio, L. MODIS Collection 5 Active Fire Product User’s Guide Version 2.4. Science Systems and Applications. Available online: http://www.fao.org/fileadmin/templates/gfims/docs/MODIS_Fire_Users_Guide_2.4.pdf (accessed on 7 February 2019).
  12. Joint Polar Satellite System (JPSS), Joint Polar Satellite System (JPSS) VIIRS Active Fires: Fire Mask Algorithm Theoretical Basis Document (ATDB), 474-00030, Released 07/19/2011, 2013. Available online: http://npp.gsfc.nasa.gov/science/documents.html (accessed on 7 February 2019).
  13. Schroeder, W.; Patricia, O.; Louis, G.; Ivan, A.C. The New VIIRS 375 m active fire detection data product: Algorithm description and initial assessment. Remote Sens. Environ. 2014, 143, 85–96. [Google Scholar] [CrossRef]
  14. Christopher, E.D.; Mikhail, Z.; Hsu, F.C.; Baugh, K.E. VIIRS nightfire: Satellite pyrometry at night. Remote Sens. 2013, 5, 4423–4449. [Google Scholar]
  15. Caseiro, A.; Gernot, R.; Joachim, T.; David, L.; Eckehard, L.; Olaf, F.; Johannes, W.K. A Methodology for Gas Flaring Detection and Characterisation Using SLSTR. Available online: https://www.researchgate.net/publication/324984568_A_Methodology_for_Gas_Flaring_Detection_and_Characterisation_Using_SLSTR (accessed on 7 February 2019).
  16. Miller, S.D.; Stephen, P.M.; Christopher, D.E.; Daniel, T.L.; Thomas, F.L.; Jeffrey, D.H. Suomi Satellite Brings to Light a Unique Frontier of Nighttime Environmental Sensing Capabilities. Proc. Natl. Acad. Sci. USA 2012, 109, 15706–15711. [Google Scholar] [CrossRef] [PubMed]
  17. Christopher, E.D.; Mikhail, Z.; Hsu, F.C.; Baugh, K.E. Discrimination of IR emitter types using nighttime VIIRS data. In Proceedings of the 38th Asian Conference on Remote Sensing, New Delhi, India, 23–27 October 2017; pp. 1211–2014. [Google Scholar]
  18. Barber, C.B.; David, P.D.; Hannu, H. The quickhull algorithm for convex hulls. ACM Trans. Math. Softw. (TOMS) 1996, 22, 469–483. [Google Scholar] [CrossRef] [Green Version]
  19. Ming, Z.; Li, J.; Zhang, P. The design of top-hat morphological filter and application to infrared target detection. Infrared Phys. Technol. 2006, 48, 67–76. [Google Scholar]
  20. Nelder, J.A.; Roger, M. A simplex method for function minimization. Comput. J. 1965, 7, 308–313. [Google Scholar] [CrossRef]
  21. Christopher, D.E.; Mikhail, Z.; Baugh, K.; Hsu, F.C. Automatic boat identification system for VIIRS low light imaging data. Remote Sens. 2015, 7, 3020–3036. [Google Scholar]
  22. Christopher, D.E.; Mikhail, Z.; Baugh, K.; Hsu, F.C.; Tilottama, G. VIIRS night-time lights. Int. J. Remote Sens. 2017, 38, 5860–5879. [Google Scholar] [Green Version]
  23. Polvika, T.N.; Hyer, E.J.; Wang, J.; Peterson, D.A. First global analysis of saturation artifacts in the VIIRS infrared channels and the effects of sample aggregation. IEEE Geosci. Remote Sens. Lett. 2015, 12, 1262–1266. [Google Scholar] [CrossRef]
  24. Casadio, S.; Arino, O. Monitoring the south atlantic anomaly using ATSR instrument series. Adv. Space Res. 2011, 48, 1056–1066. [Google Scholar] [CrossRef]
  25. Wang, J.; Clint, A.; Xu, X.X.; James, J.S. Potential application of VIIRS Day/Night Band for monitoring nighttime surface PM2. 5 air quality from space. Atmos. Environ. 2016, 124, 55–63. [Google Scholar] [CrossRef]
  26. Vodacek, A.; Kremens, R.L.; Fordham, A.J.; VanGorden, S.C.; Luisi, D.; Schott, J.R.; Latham, D.J. Remote optical detection of biomass burning using a potassium emission signature. Int. J. Remote Sens. 2002, 23, 2721–2726. [Google Scholar] [CrossRef]
  27. Perry, E. Wood Ashes as a Garden Fertilizer. Available online: https://vric.ucdavis.edu/pdf/fertilization_Woodashes.pdf (accessed on 7 February 2019).
  28. Olanders, B.; Britt-Marie, S. Characterization of ashes from wood and straw. Biomass Bioenerg. 1995, 8, 105–115. [Google Scholar] [CrossRef]
  29. Sharma, A.; Wang, J.; Elizabeth, M.L. Intercomparison of MODIS and VIIRS fire products in Khanty-Mansiysk Russia: Implications for characterizing gas flaring from space. Atmosphere 2017, 8, 95. [Google Scholar] [CrossRef]
  30. Polivka, T.N.; Wang, J.; Ellison, L.T.; Hyer, E.J.; Ichoku, C.M. Improving nocturnal fire detection with the VIIRS day–night band. IEEE T.Geosci. Remote. 2016, 54, 5503–5519. [Google Scholar] [CrossRef]
  31. Frank, S.A. The invariances of power law size distributions. F1000Research 2016, 5. Available online: https://f1000research.com/articles/5-2074/v3 (accessed on 7 February 2019). [CrossRef]
  32. Elvidge, C.D.; Kroehl, H.W.; Kihn, E.A.; Baugh, K.E.; David, E.R.; Hao, W.M. Algorithm for the retrieval of fire pixels from DMSP operational linescan system data. In Biomass Burning and Global Change: Remote Sensing, Modeling and Inventory Development, and Biomass Burning in Africa; Levin, J.S., Ed.; MIT Press: Cambridge, MA, USA, 1996; Volume 1, pp. 73–85. ISBN 9780262122016. [Google Scholar]
Figure 1. The VIIRS (Visible Infrared Imaging Radiometer Suite) Nightfire (VNF) algorithm for identifying pixels containing IR emitters in the mid-wave infrared (MWIR) spectral bands is based on pixel departures from the background diagonal. This analysis is performed on individual suborbits.
Remotesensing 11 00395 g001
Figure 2. VIIRS nightfire (VNF) processing flowchart.
Remotesensing 11 00395 g002
Figure 3. Detection limits for each M band is set to the 0.5% point on the cumulative distribution function (CDF) generated from the histogram of the radiance values from VNF pixels from January 2018. Radiance units are watts/m2/sr/um.
Remotesensing 11 00395 g003
Figure 4. The DNB detection limit is set to the 0.5% point on the CDF from the radiance histogram from January 2018 VIIRS boat detection data from Indonesian waters. Radiance units are nanowatts/cm2/sr.
Remotesensing 11 00395 g004
Figure 5. A direct comparison of VNF and DNB fire detections was conducted in Chhattisgarh State, India using the 2015 VIIRS nighttime lights data sets [13]. A = Raw cloud-free composite showing a mixture of lights from cities, villages and fires. B= VNF composite of the 8516 VNF detections from the same nights during 2015. C = DNB outliers that lacked VNF and were outside the areas lit by electric lighting. The tally of DNB fire pixels that lacked VNF and electric lights was 133,551(see Figure S1).
Remotesensing 11 00395 g005
Figure 6. Scattergram of the temperature versus source area for VNF pixels from January 2018. Overlaid are the detection limit lines for the VNF spectral bands and the DNB.
Remotesensing 11 00395 g006
Figure 7. Scattergram of the temperature versus source area for VNF pixels having detection in the M13 spectral band from January 2018 with the detection limit lines for the VNF spectral bands and the DNB.
Remotesensing 11 00395 g007
Figure 8. Scattergram of the temperature versus source area for VNF pixels lacking detection in the M13 spectral band from January 2018 with the detection limit lines for the VNF spectral bands and the DNB.
Remotesensing 11 00395 g008
Figure 9. Predicted DNB radiances versus observed DNB radiance for the VNF local maxima pixel set from Figure 6.
Remotesensing 11 00395 g009
Figure 10. DNB histograms for the fire detection missed by VNF shown in Figure 5 and the observed DNB radiances for VNF pixels shown in Figure 6.
Remotesensing 11 00395 g010
Figure 11. Global map of the distribution and density of M11 single band detections from the January 2018 VNF pixel set. The results indicate that the M11 detections are infiltrated by large numbers of false detections, with extensive high energy particle detections (HEPD) in the South Atlantic Anomaly (SAA) region.
Remotesensing 11 00395 g011
Figure 12. Spatial distribution of VNF detections with temperature estimates from January 2018. Note the cloud of false detections offshore to either side of South America, induced by high energy particle detections in the SAA region.
Remotesensing 11 00395 g012
Figure 13. Spatial distribution of VNF detections with temperature estimates but lacking M12 & M13 detection. Note the lack of SAA false detections.
Remotesensing 11 00395 g013
Figure 14. Spatial distribution of VNF detections with M12 and M13 only. Note the presence of SAA false detections.
Remotesensing 11 00395 g014
Figure 15. Global map of the M11 single band detections filtered to remove isolated pixels. Note the SAA and other false detections exhibited in Figure 12 are largely eliminated.
Remotesensing 11 00395 g015
Figure 16. VNF spectrum with M11 and M12 subpixel saturation. The sum of the squared residuals triggered the exclusion of the M11 and M12 radiances. The preliminary temperature was calculated as 1151 K with a source size of 2347 m2. The final temperature calculation was 988 K with a source area of 5338 m2.
Remotesensing 11 00395 g016
Figure 17. Scattergram showing the placement of the M11 and M12 saturation pixel set from the January 2018 VNF test set. These are the temperatures and source areas calculated from Planck curve fitting where the saturation affected radiances are excluded. The chart shows the M11 and M12 detection limit lines from Figure 6 and then the saturation lines based on the full pixel saturation radiances.
Remotesensing 11 00395 g017
Figure 18. Combustion source detection zones from nighttime VIIRS data.
Remotesensing 11 00395 g018
Table 1. Spectral bands, detection tallies and radiance detection limits from test sets. The M band test set is drawn from the full set of global detections from January 2018. The DNB test set is from the VIIRS boat detection data of Indonesia from January through August, 2017. The tallies represent pixels with temperature calculations, except the DNB and M11 alone. Tallies are limited to temperatures up to 2100 K. * indicates single band detections with no Planck curve fit (i.e., no temperature calculation).
Band DesignationRangeCentral Wavelength (um)Detection TallyDetection ThresholdSaturation Radiance
DNB *VNIR0.7318,921 (VBD)0.567 nW/cm2/sr2E+7 nW/cm2/sr
M7NIR0.865100,5310.034 watts/m2/sr/um349 watts/m2/sr/um
M08NIR1.24142,8780.088 “197.88 “
M10SWIR1.61404,7630.036 “85.44 “
M11SWIR2.25418,6870.023 “38.16 “
M11 only *SWIR2.25247,3410.023 “38.16 “
M12MWIR3.7211,5620.041 “4.41 “
M13MWIR4.05211,5620.012 “404.3 “
M12 & M13 onlyMWIR
No MWIRNIR/SWIR 229,902
VNF total 444,719

