High-Resolution Mapping of Redwood (Sequoia sempervirens) Distributions in Three Californian Forests


Abstract
1. Introduction
2. Materials and Methods
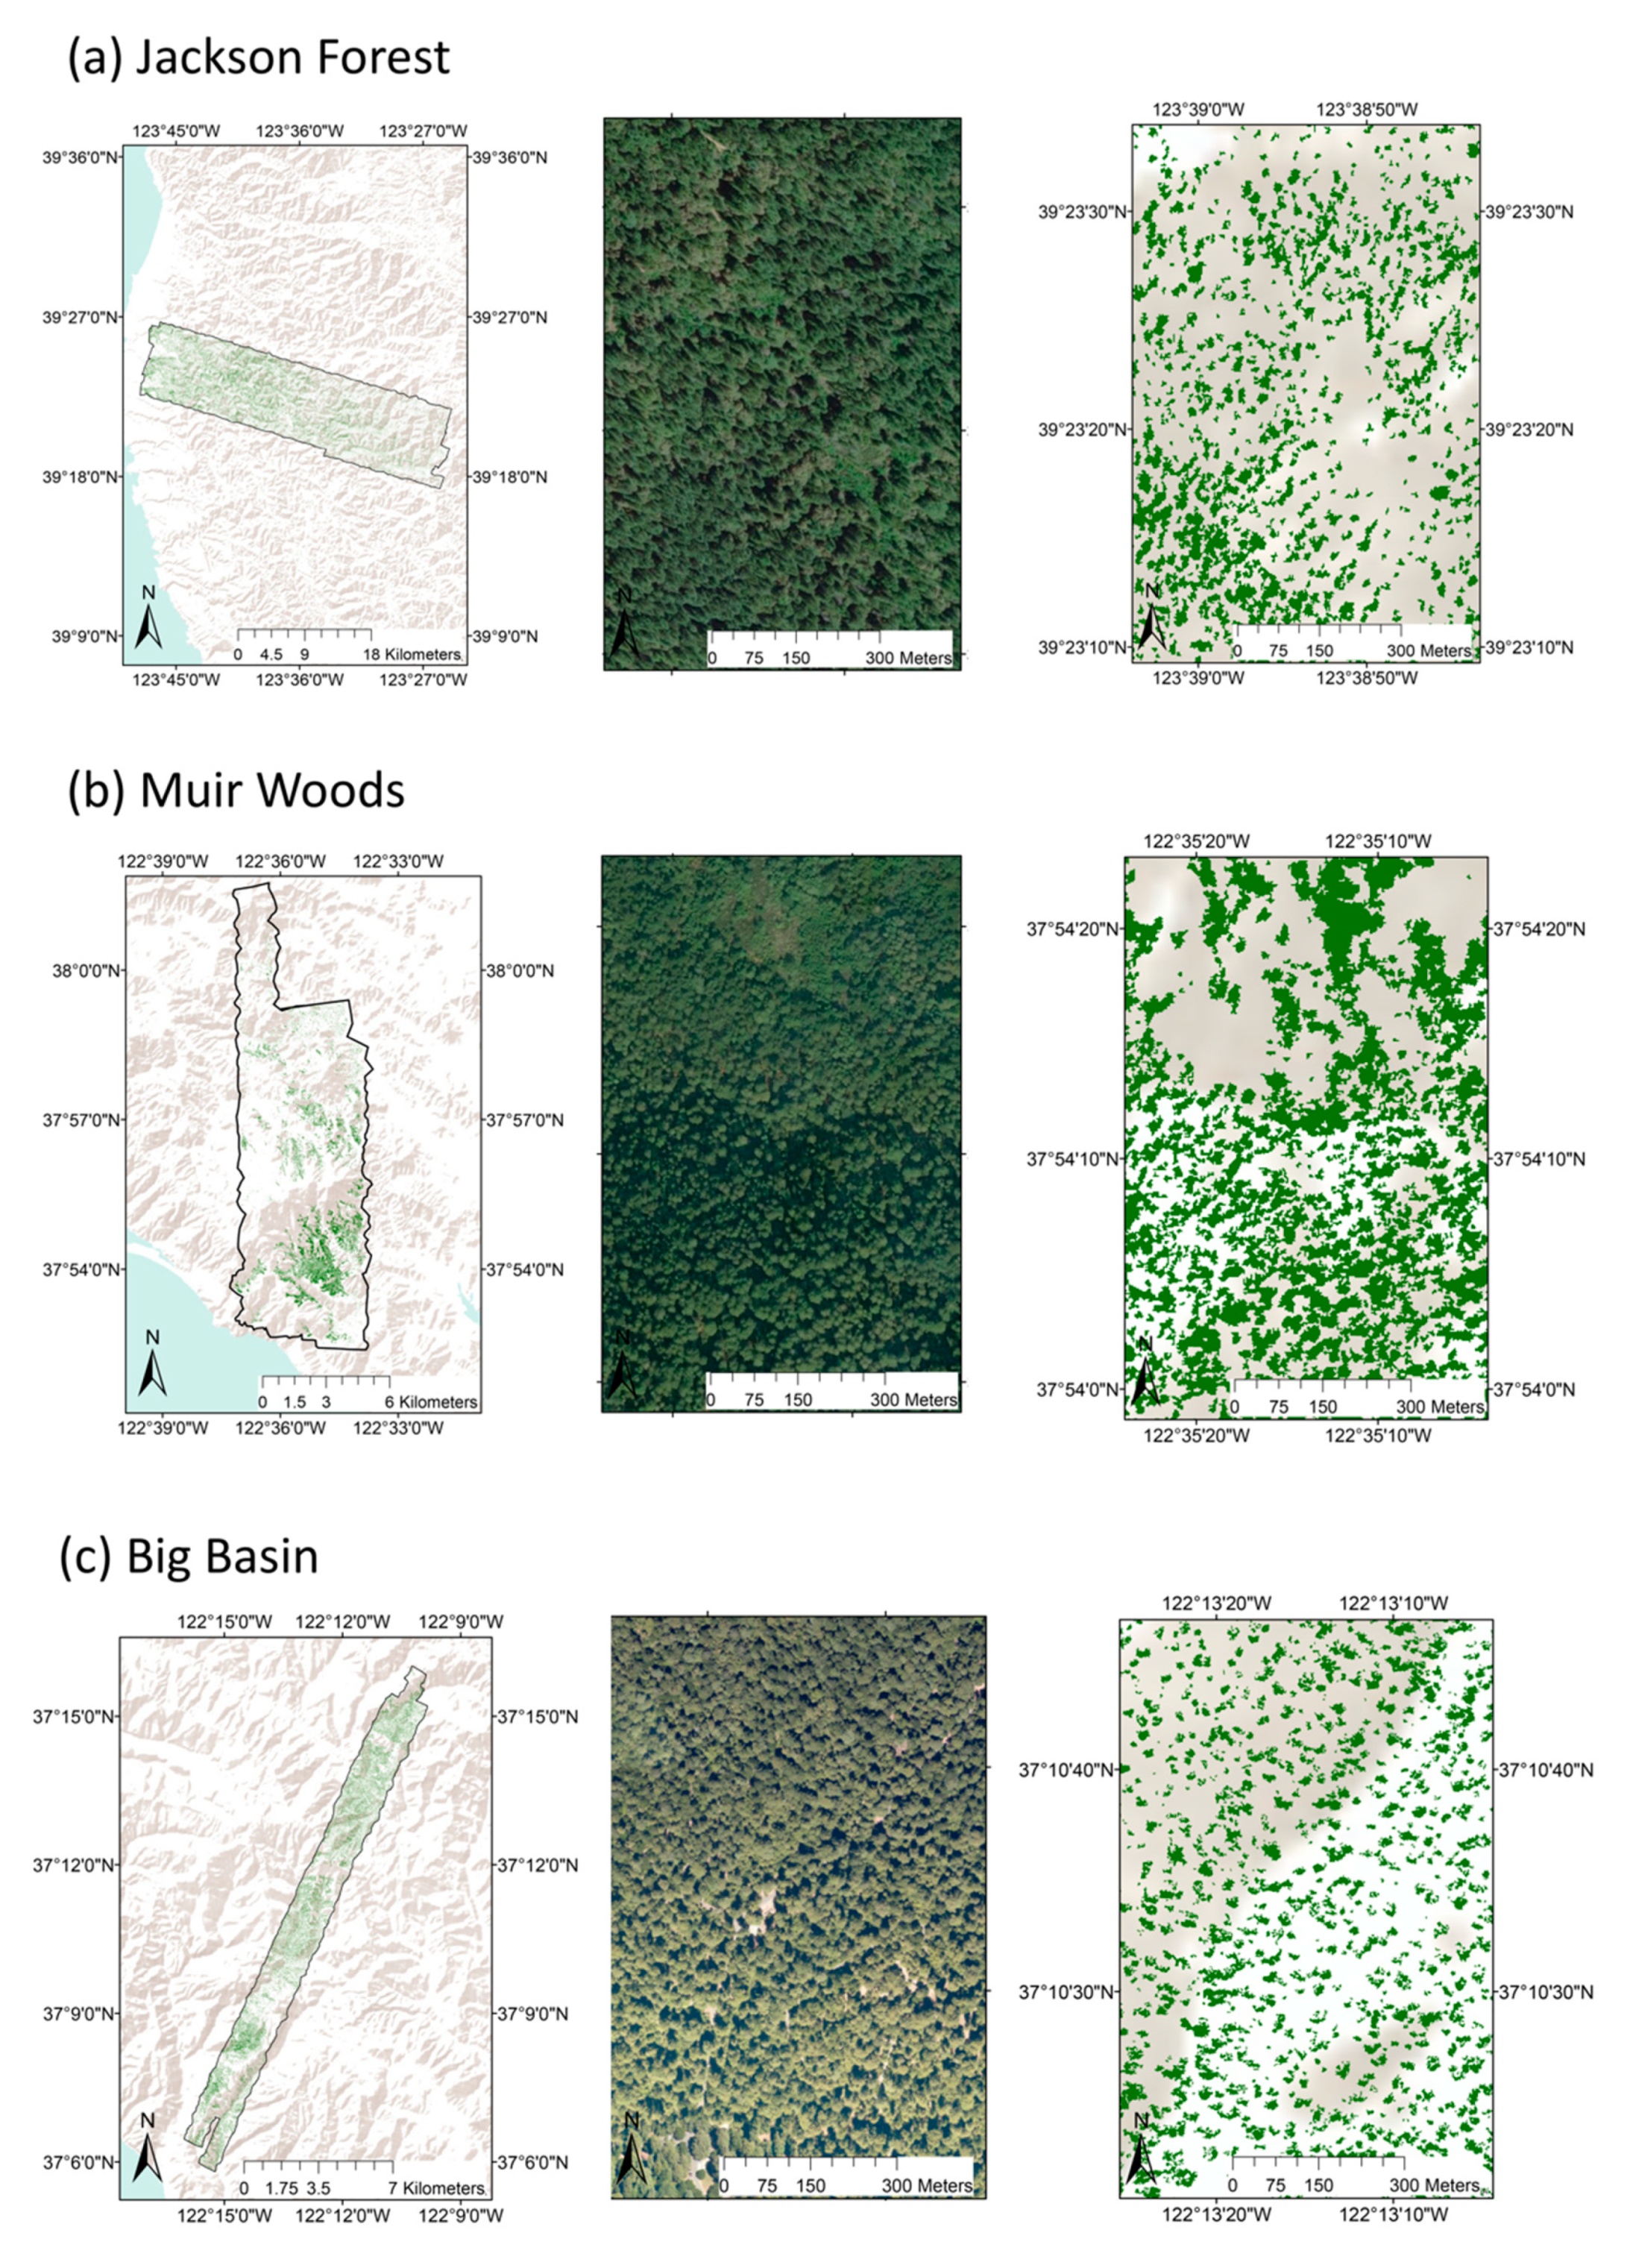
2.1. Study Sites
2.2. Airborne Data Acquisition
2.3. Imaging Spectrometer Data Processing
2.4. Field Training Data Collection
2.5. Gradient Boosted Regression Tree Modeling
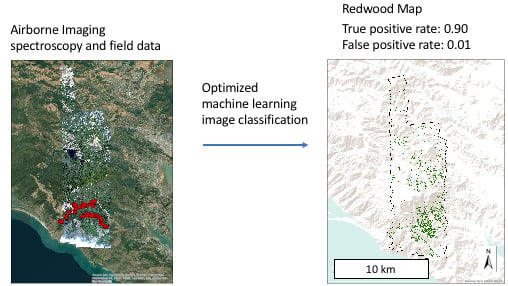
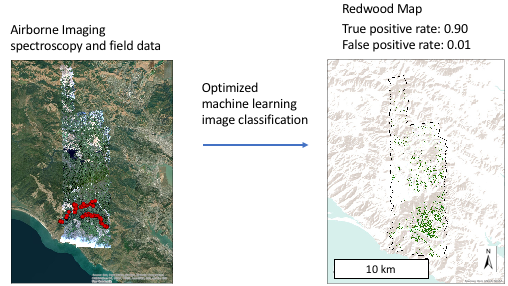
2.6. Model Application and Assessment
2.7. Calculation of Redwood Density and Redwood Height
3. Results
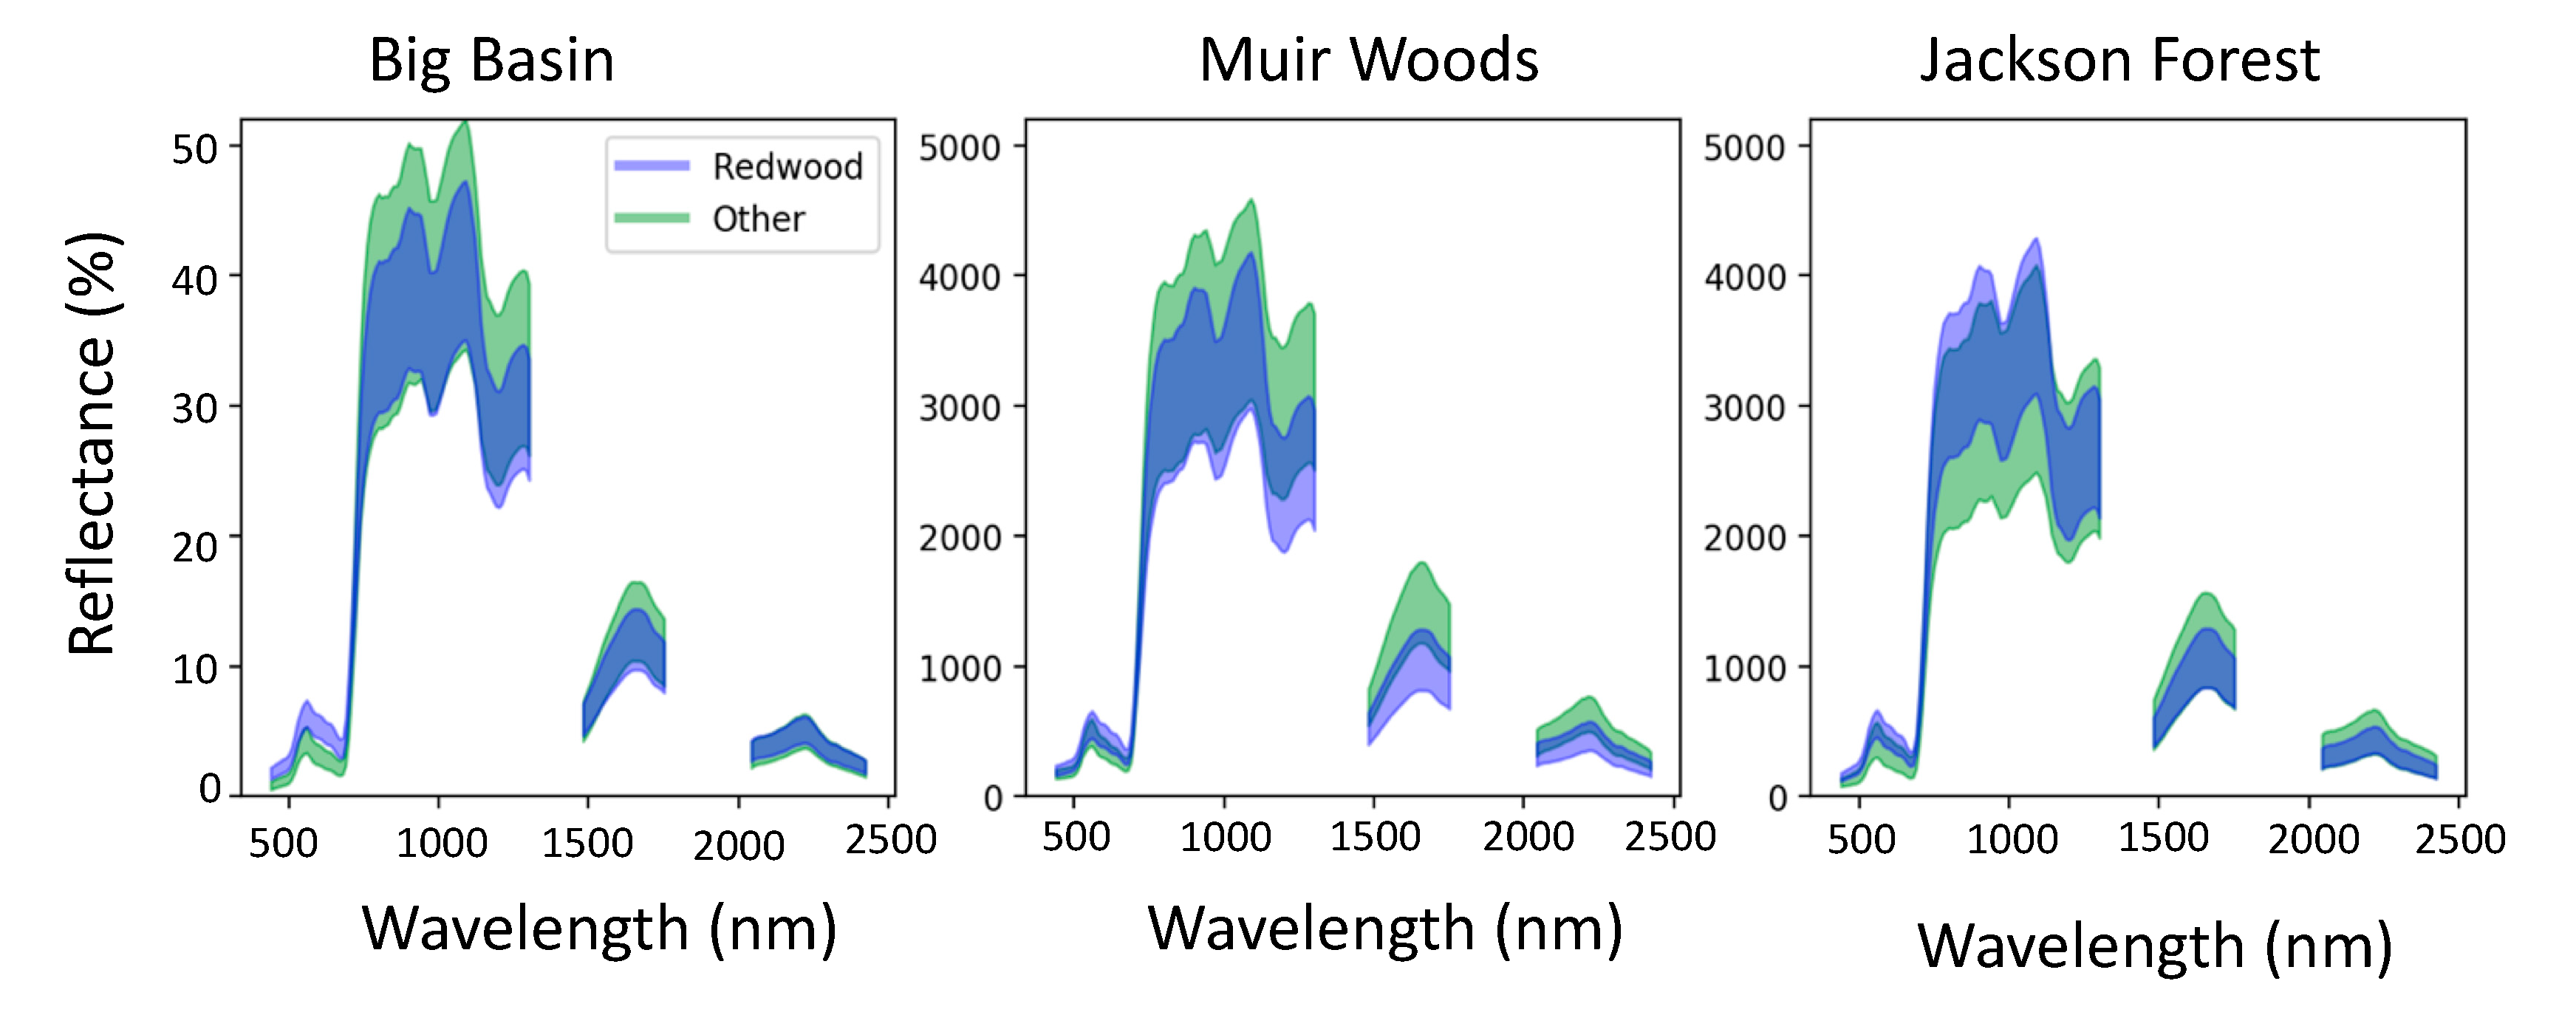
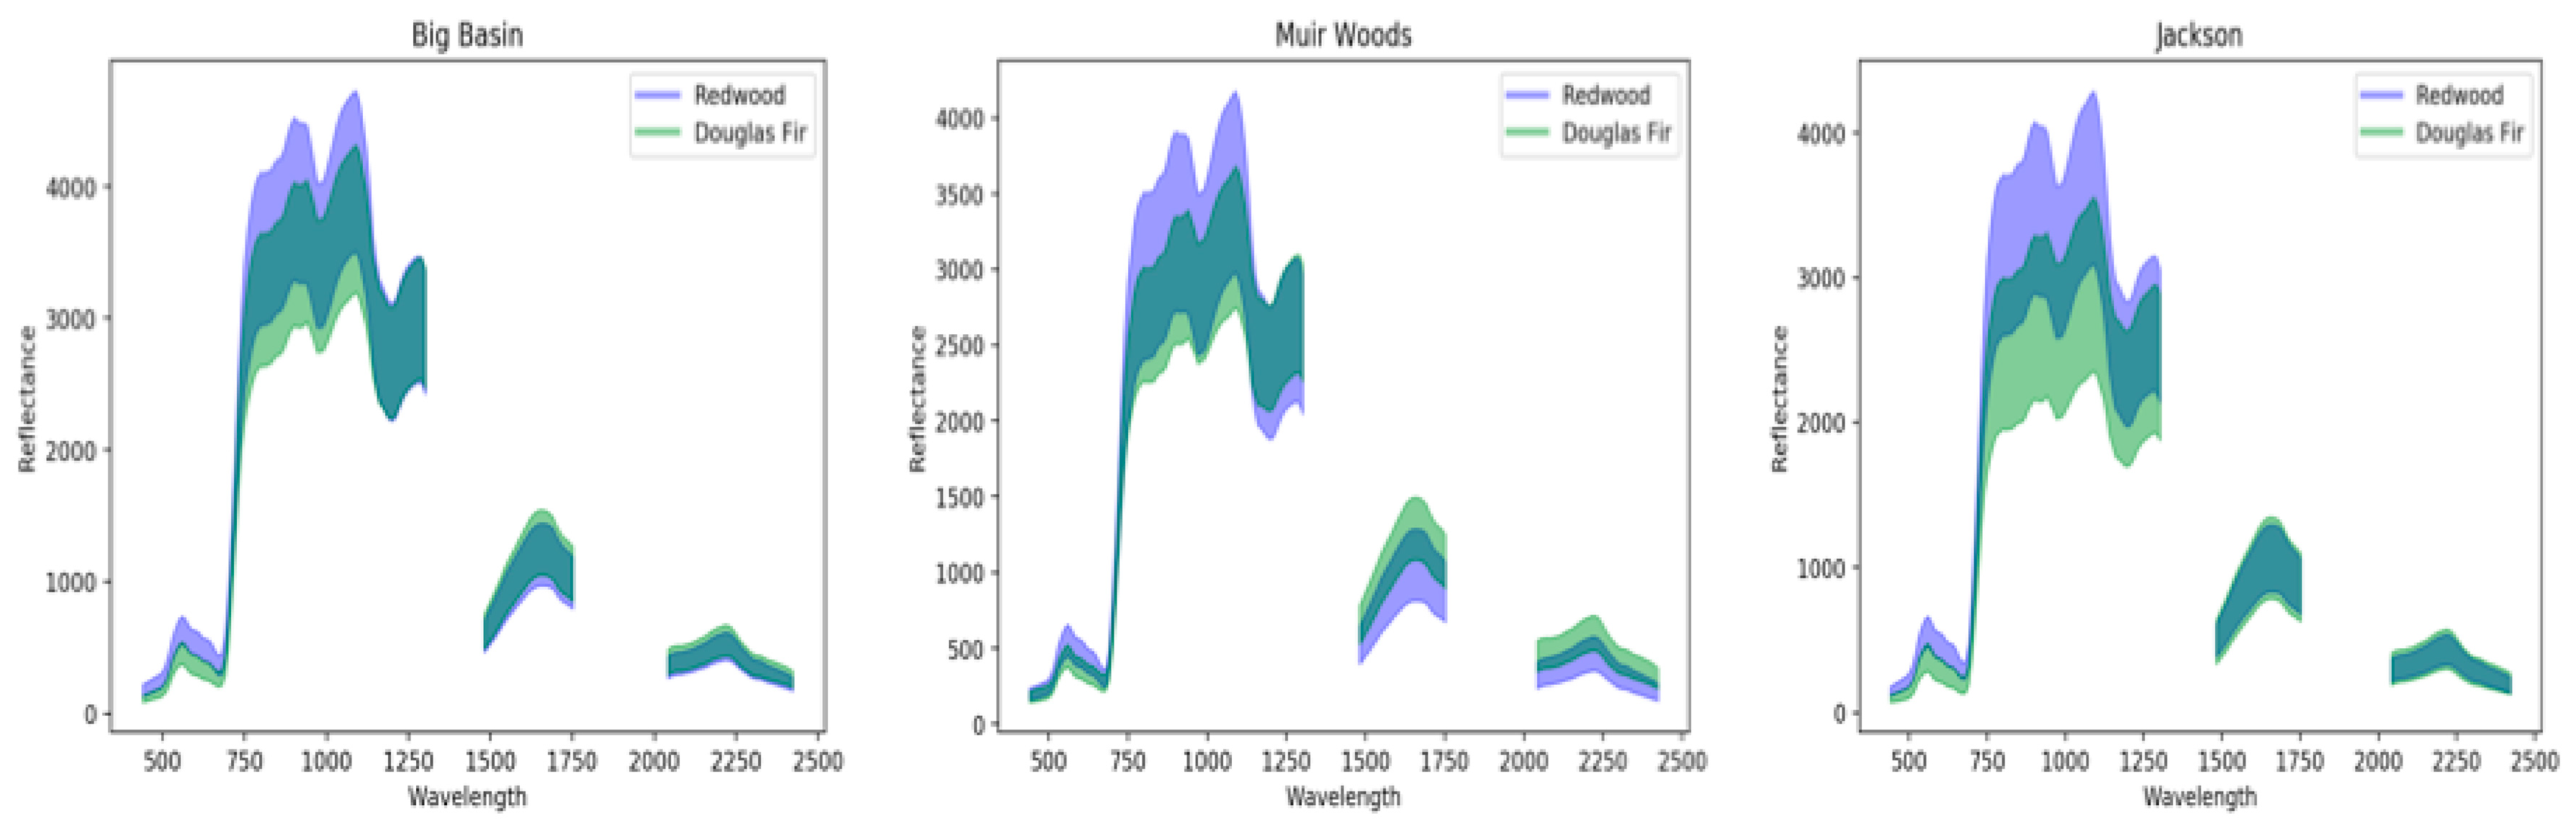
3.1. Spectral Signatures of Redwoods
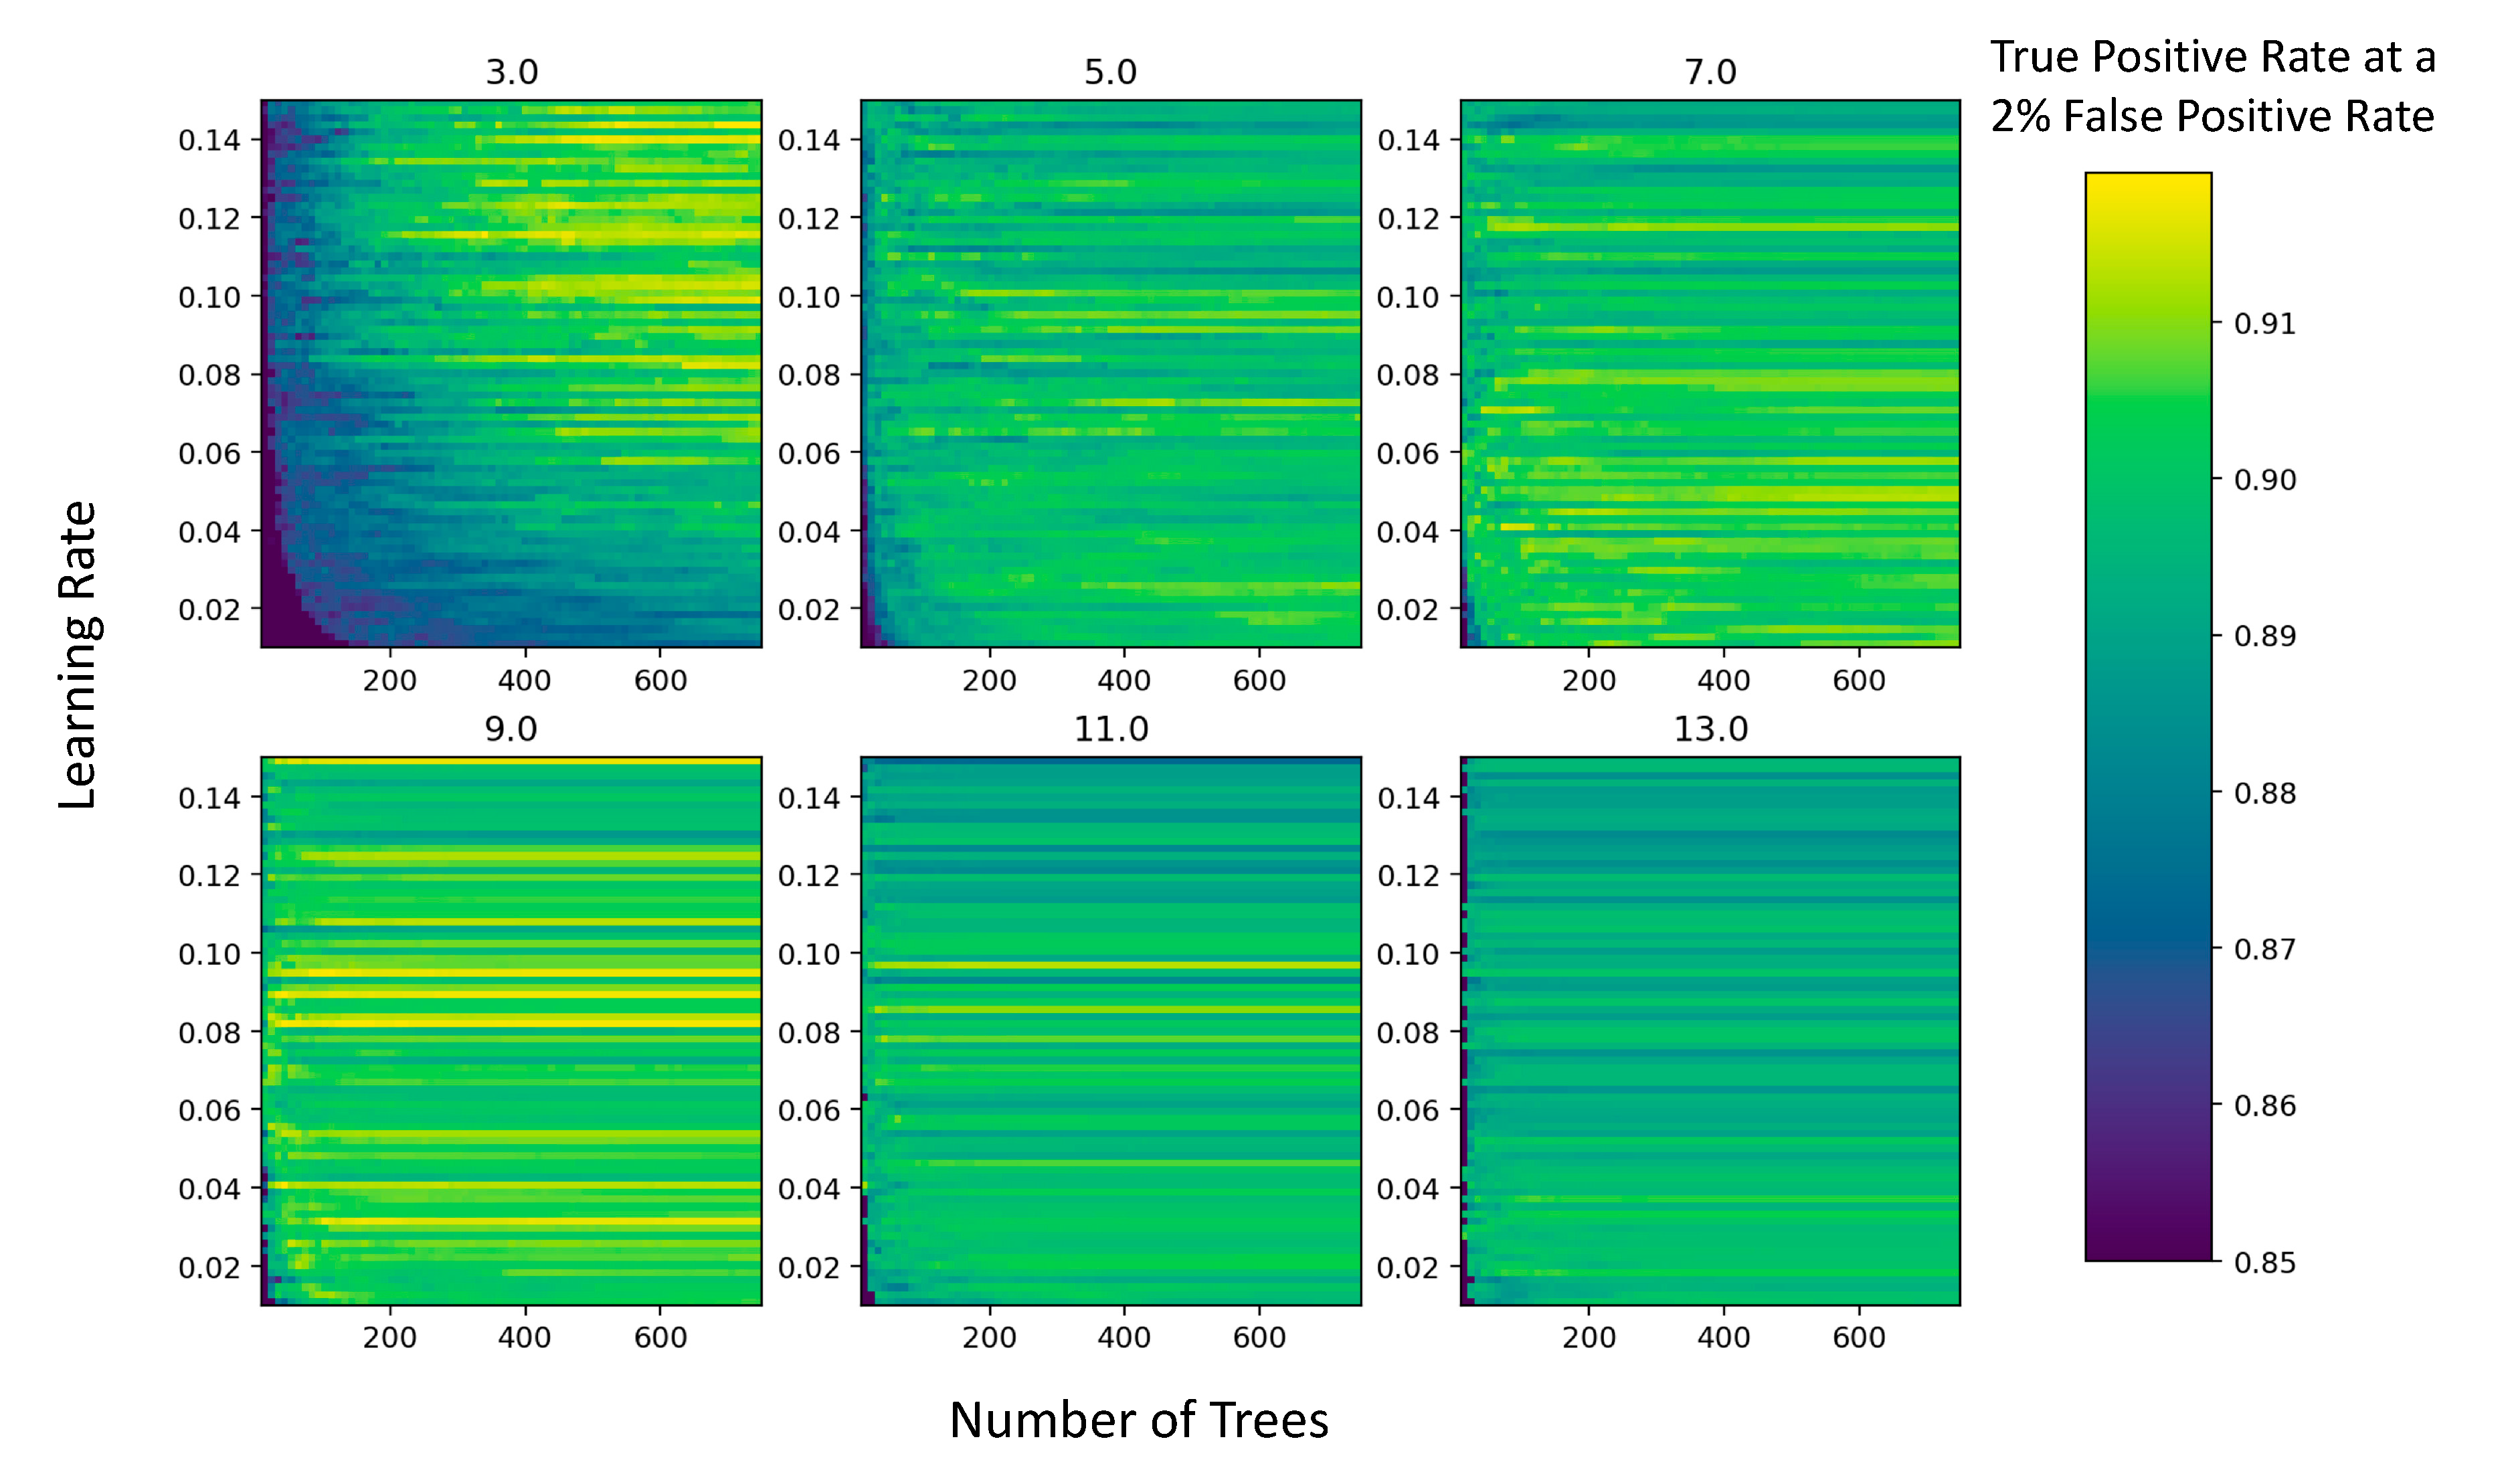
3.2. Model Optimization
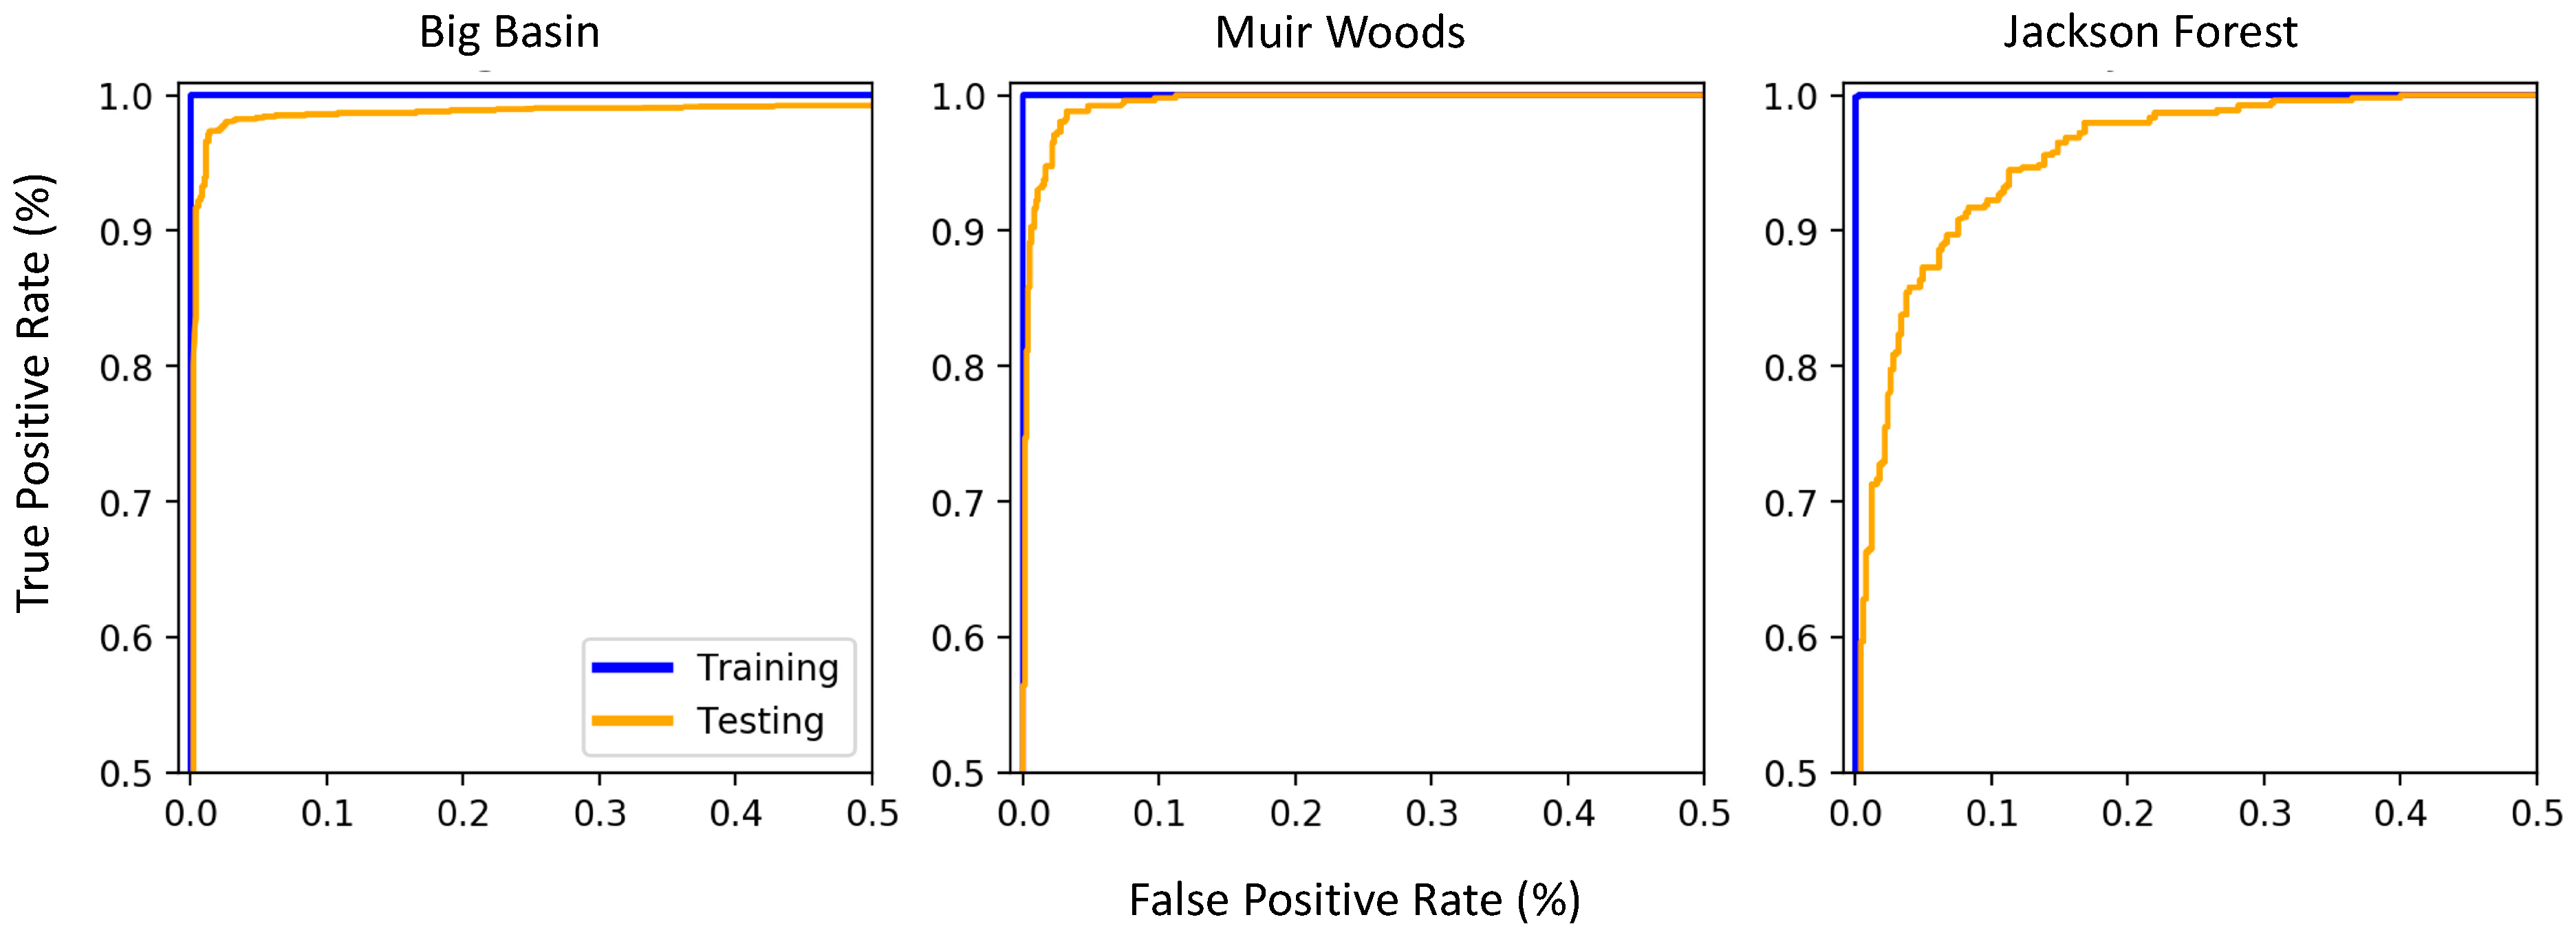
3.3. Variation in True Positive Rate and False Positive Rate across the Sites
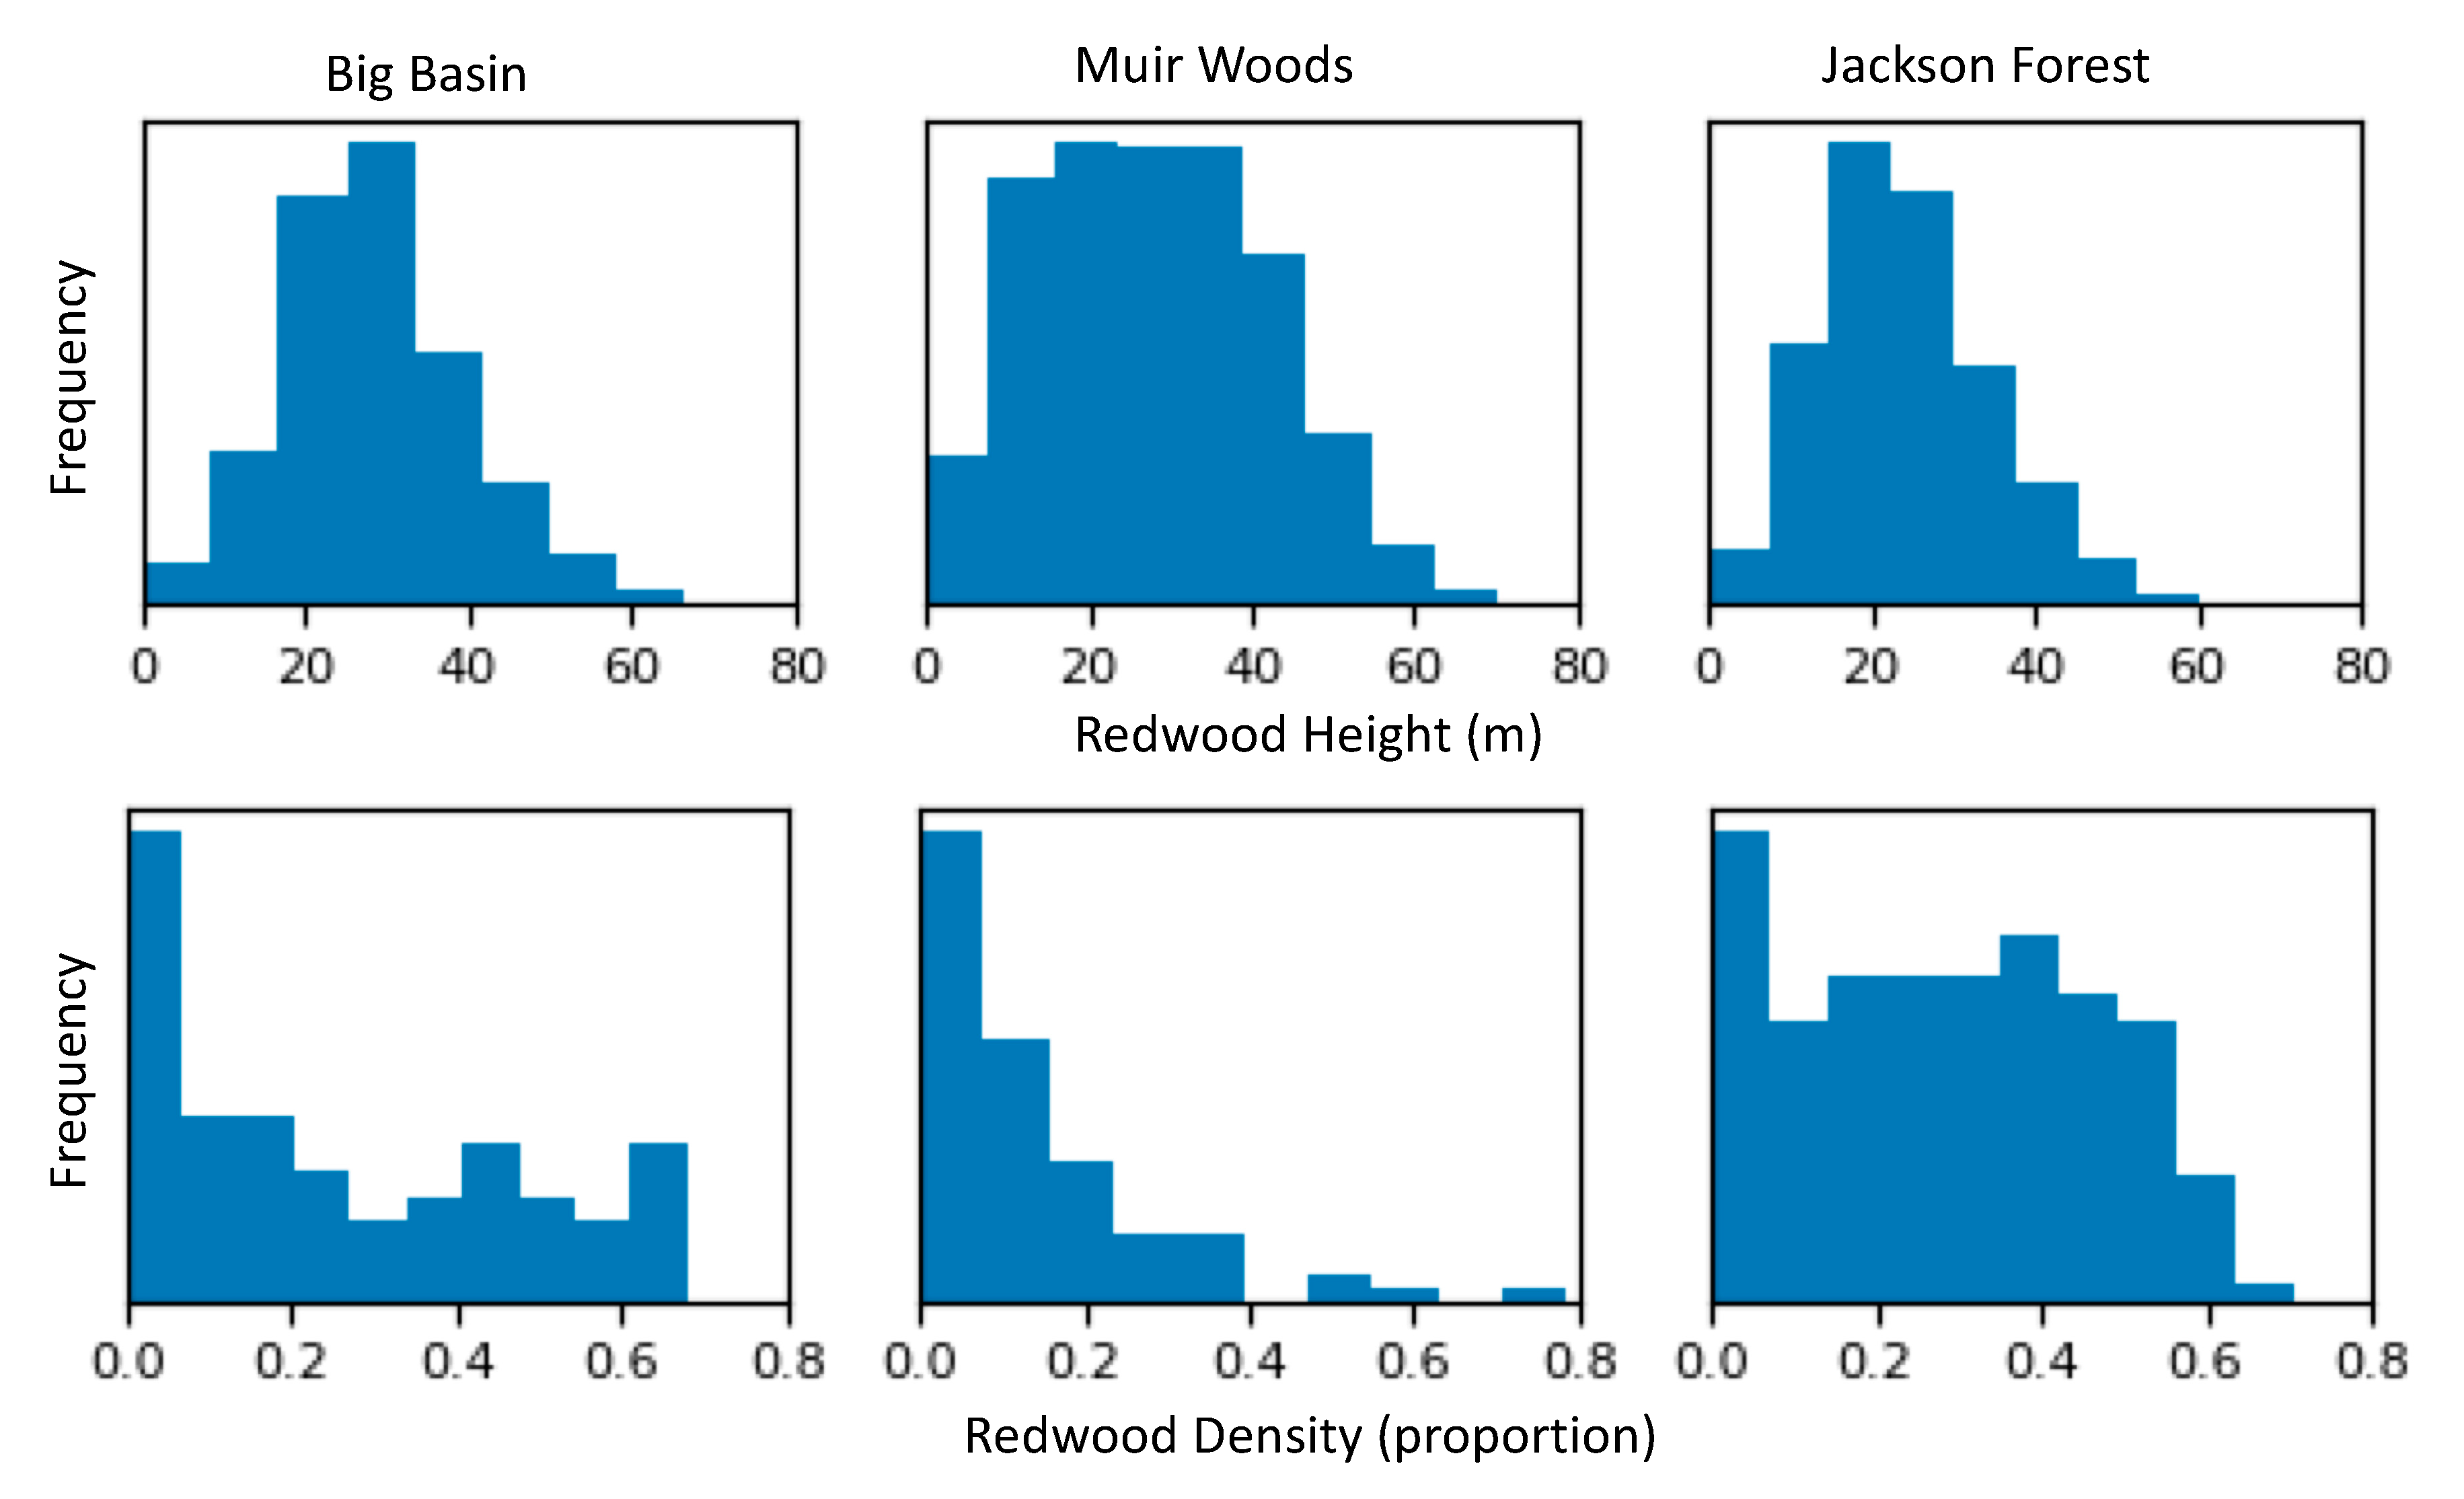
3.4. Distribution of Redwood Density and Redwood Height
4. Discussion
4.1. Redwood Reflectance Signatures
4.2. Model Selection and Parameterization
4.3. Model Performance
4.4. Redwood Density and Height Patterns
4.5. Applications to Research, Conservation, and Management
5. Conclusions
Author Contributions
Funding
Acknowledgments
Conflicts of Interest
Appendix A


| Site | Big Basin | Muir Woods | Jackson Forest |
|---|---|---|---|
| Threshold Value | 0.76 | 0.69 | 0.80 |
References
- Burns, E.B.; Campbell, R.; Cowan, P.D. State of Redwoods Conservation Report: A Tale of Two Forests; Save the Redwoods League: San Francisco, CA, USA, 2018. [Google Scholar]
- Cameron, D.R.; Marvin, D.C.; Remucal, J.M.; Passero, M.C. Ecosystem management and conservation can substantially contribute to California’s climate mitigation goals. Proc. Natl. Acad. Sci. USA 2017, 114, 12833–12838. [Google Scholar] [CrossRef] [PubMed]
- Van Pelt, R.; Sillett, S.C.; Kruse, W.A.; Freund, J.A.; Kramer, R.D. Emergent crowns and light-use complementarity lead to global maximum biomass and leaf area in Sequoia sempervirens forests. For. Ecol. Manag. 2016, 375, 279–308. [Google Scholar] [CrossRef]
- Noss, R.F. (Ed.) The Redwood Forest: History, Ecology, and Conservation of the Coast Redwoods; Island Press: Washington, DC, USA, 2000. [Google Scholar]
- Franklin, J. Predictive vegetation mapping: Geographic modelling of biospatial patterns in relation to environmental gradients. Prog. Phys. Geogr. 1995, 19, 474–499. [Google Scholar] [CrossRef]
- Xie, Y.; Sha, Z.; Yu, M. Remote sensing imagery in vegetation mapping: A review. J. Plant Ecol. 2008, 1, 9–23. [Google Scholar] [CrossRef]
- Pham, T.D.; Bui, D.T.; Yoshino, K.; Nhu Le, H. Optimized rule-based logistic model tree algorithm for mapping mangrove species using ALOS PALSAR imagery and GIS in the tropical region. Environ. Earth Sci. 2018, 77, 1–13. [Google Scholar] [CrossRef]
- Immitzer, M.; Francesco, V.; Atzberger, C. First Experience with Sentinel-2 Data for Crop and Tree Species Classifications in Central Europe. Remote Sens. 2016, 8, 166. [Google Scholar] [CrossRef]
- Lin, C.; Popescu, S.C.; Thomson, G.; Tsogt, K.; Chang, C. Classification of Tree Species in Overstory Canopy of Subtropical Forest Using Quickbird Images. PLoS ONE 2015, 10, e0125554. [Google Scholar]
- Immitzer, M.; Atzberger, C.; Koukal, T. Tree Species Classification with Random Forest Using Very High Spatial Resolution 8-Band WorldView-2 Satellite Data. Remote Sens. 2012, 4, 2661–2693. [Google Scholar] [CrossRef]
- Alonzo, M.; Roth, K.; Roberts, D. Identifying Santa Barbara’s urban tree species from AVIRIS imagery using canonical discriminant analysis. Remote Sens. Lett. 2013, 4, 513–521. [Google Scholar] [CrossRef]
- Baldeck, C.A.; Asner, G.P.; Martin, R.E.; Anderson, C.B.; Knapp, D.E.; Kellner, J.R.; Wright, S.J. Operational Tree Species Mapping in a Diverse Tropical Forest with Airborne Imaging Spectroscopy. PLoS ONE 2015, 10, e0118403. [Google Scholar] [CrossRef]
- Jones, T.G.; Coops, N.C.; Sharma, T. Assessing the utility of airborne hyperspectral and LiDAR data for species distribution mapping in the coastal Pacific Northwest. Remote Sens. Environ. 2010, 114, 2841–2852. [Google Scholar] [CrossRef]
- Fassnacht, F.E.; Latifi, H.; Stere´nczak, K.; Modzelewska, A.; Lefsky, M.; Waser, L.T.; Straub, C.; Ghosh, A. Review of studies on tree species classification from remotely sensed data. Remote Sens. Environ. 2016, 186, 64–87. [Google Scholar] [CrossRef]
- Maxwell, A.E.; Warner, T.A.; Fang, F. Implementation of machine-learning classification in remote sensing: An applied review. Int. J. Remote Sens. 2018, 39, 2784–2817. [Google Scholar] [CrossRef]
- Zhang, C.; Xie, Z. Combining object-based texture measures with a neural network for vegetation mapping in the Everglades from hyperspectral imagery. Remote Sens. Environ. 2012, 124, 310–320. [Google Scholar] [CrossRef]
- Belgiu, M.; Drăgut, L. Random forest in remote sensing: A review of applications and future directions. ISPRS J. Photogramm. Remote Sens. 2016, 114, 24–31. [Google Scholar] [CrossRef]
- Amini, S.; Homayouni, S.; Safari, A.; Darvishsefat, A.A. Object-based classification of hyperspectral data using Random Forest algorithm. Geo-Spat. Inf. Sci. 2018, 21, 127–138. [Google Scholar] [CrossRef]
- Vaughn, N.R.; Asner, G.P.; Brodrick, P.G.; Martin, R.E.; Heckler, J.W.; Knapp, D.E.; Hughes, R.F. An approach for High-Resolution Mapping of Hawaiian Metrosideros Forest Mortality Using Laser-Guided Imaging Spectroscopy. Remote Sens. 2018, 10, 502. [Google Scholar] [CrossRef]
- Ballanti, L.; Blesius, L.; Hines, E.; Kruse, B. Tree Species Classification Using Hyperspectral Imagery: A Comparison of Two Classifiers. Remote Sens. 2016, 8, 445. [Google Scholar] [CrossRef]
- Elith, J.; Leathwick, J.R.; Hastie, T. A working guide to boosted regression trees. J. Anim. Ecol. 2008, 77, 802–813. [Google Scholar] [CrossRef]
- Paz-Kagan, T.; Brodrick, P.G.; Vaughn, N.R.; Das, A.J.; Stephenson, N.L.; Nydick, K.R.; Asner, G.P. What mediates tree mortality during drought in the southern Sierra Nevada? Ecol. Appl. 2017, 27, 2443–2457. [Google Scholar] [CrossRef]
- Zhang, H.; Wang, T.; Liu, M.; Jia, M.; Lin, H.; Chu, L.; Devlin, A. Potential of combining optical and dual polarimetric sar data for improving mangrove species discrimination using rotation forest. Remote Sens. 2018, 10, 467. [Google Scholar] [CrossRef]
- Daly, C.; Taylor, G.H.; Gibson, W.P.; Parzybok, T.W.; Johnson, G.L.; Pasteris, P.A. High-Quality Spatial Climate Data Sets for the United States and Beyond; Group, P.C., Ed.; Oregon State University: Corvallis, OR, USA, 2017. [Google Scholar]
- Asner, G.P.; Knapp, D.E.; Boardman, J.; Green, R.O.; Kennedy-Bowdown, T.; Eastwood, M.; Martin, R.E.; Anderson, C.; Field, C.B. Carnegie Airborne Observatory-2: Increasing science data dimensionality via high-fidelity multi-sensor fusion. Remote Sens. Environ. 2012, 124, 454–465. [Google Scholar] [CrossRef]
- Asner, G.P.; Knapp, D.E.; Kennedy-Bowdown, T.; Jones, M.O.; Martin, R.E.; Boardman, J.; Field, C.B. Carnegie Airborne Observatory: In-flight fusion of hyperspectral imaging and waveform light detection and ranging for three-dimensional studies of ecosystems. J. Appl. Remote Sens. 2007. [Google Scholar] [CrossRef]
- Asner, G.; Martin, R. Spectral and chemical analysis of tropical forests: Scaling from leaf to canopy levels. Remote Sens. Environ. 2008, 112, 3958–3970. [Google Scholar] [CrossRef]
- Marvin, D.C.; Asner, G.P.; Schnitzer, S.A. Liana canopy cover mapped throughout a tropical forest with high-fidelity imaging spectroscopy. Remote Sens. Environ. 2016, 176. [Google Scholar] [CrossRef]
- Asner, G.P.; Martin, R.E.; Anderson, C.B.; Knapp, D.E. Quantifying forest canopy traits: Imaging spectroscopy versus field survey. Remote Sens. Environ. 2015, 158, 15–27. [Google Scholar] [CrossRef]
- Friedman, J.H. 1999 Reitz Lecture: Greedy Function Approximation: A Gradient Boosting Machine. Ann. Stat. 2001, 29, 1189–1232. [Google Scholar] [CrossRef]
- Paz-Kagan, T.; Vaughn, N.R.; Martin, R.E.; Brodrick, P.G.; Stephenson, N.L.; Das, A.J.; Nydick, K.R.; Asner, G.P. Landscape-scale variation in canopy water content of giant sequoias during drought. For. Ecol. Manag. 2018, 419–420, 291–304. [Google Scholar] [CrossRef]
- Niemiec, R.M.; Asner, G.P.; Brodrick, P.G.; Gaertner, J.A.; Ardoin, N.M. Scale-dependence of environmental and socioeconomic drivers of albizia invasion in Hawaii. Landsc. Urban Plan. 2018, 169, 70–80. [Google Scholar] [CrossRef]
- Pedregosa, F.; Varoquax, G. Scikit-learn: Machine learning in Python. J. Mach. Learn. Res. 2011, 12. [Google Scholar]
- Fawcett, T. An introduction to ROC analysis. Pattern Recognit. Lett. 2006, 27, 861–874. [Google Scholar] [CrossRef]
- Alatorre, L.C.; Sánchez-Andrés, R.; Cirujano, S.; Beguería, S.; Sánchez-Carrillo, S. Identification of Mangrove Areas by Remote Sensing: The ROC Curve Technique Applied to the Northwestern Mexico Coastal Zone Using Landsat Imagery. Remote Sens. 2011, 3, 1568–1583. [Google Scholar] [CrossRef]
- Koch, B.; Heyder, U.; Weinacker, H. Detection of individual tree crowns in airborne lidar data. Photogramm. Eng. Remote Sens. 2006, 72. [Google Scholar] [CrossRef]
- Vauhkonen, J.; Ene, L.; Gupta, S.; Heinzel, J.; Holmgren, J.; Pitkanen, J.; Solberg, S.; Wang, Y.; Weinacker, H.; Hauglin, K.M.; et al. Comparative testing of single-tree detection algorithms under different types of forest. Forestry 2012, 85, 27–40. [Google Scholar] [CrossRef]
- Asner, G.P. Hyperspectral Remote Sensing of Canopy Chemistry, Physiology, and Biodiversity in Tropical Rainforests. In Hyperspectral Remote Sensing of Tropical and Sub-Tropical Forests; Sanchez-Azofeifa, M.K.a.G.A., Ed.; Taylor & Francis Group: Boca Raton, FL, USA, 2008. [Google Scholar]
- Ishii, H.R.; Azuma, W.; Kuroda, K.; Sillett, S.C.; Watling, J. Pushing the limits to tree height: Could foliar water storage compensate for hydraulic constraints in Sequoia sempervirens? Funct. Ecol. 2014, 28, 1087–1093. [Google Scholar] [CrossRef]
- Woodruff, D.R.; Bond, B.J.; Meinzer, F.C. Does turgor limit growth in tall trees? Plant Cell Environ. 2004, 27, 229–236. [Google Scholar] [CrossRef]
- Alonzo, M.; Bookhagen, B.; Roberts, D.A. Urban tree species mapping using hyperspectral and lidar data fusion. Remote Sens. Environ. 2014, 148, 70–83. [Google Scholar] [CrossRef]
- Noi, P.T.; Kappas, M. Comparison of Random Forest, k-Nearest Neighbor, and Support Vector Machine Classifiers for Land Cover Classification Using Sentinel-2 Imagery. Sensors 2018, 18, 18. [Google Scholar]
- Jones, T.G.; Coops, N.C.; Sharma, T. Assessing the utility of airborne hyperspectral and LiDAR data for species distribution mapping in the coastal Pacific Northwest, Canada. Remote Sens. Environ. 2010, 114, 2841–2852. [Google Scholar] [CrossRef]
- Hsieh, P.F.; Lee, L.C.; Chen, N.Y. Effect of Spatial Resolution on Classification Errors of Pure and Mixed Pixels in Remote Sensing. IEEE Trans. Geosci. Remote Sens. 2001, 39, 2657–2663. [Google Scholar] [CrossRef]
- Myint, S.W.; Gober, P.; Brazel, A.; Grossman-Clarke, S.; Weng, Q. Per-pixel vs. object-based classification of urban land cover extraction using high spatial resolution imagery. Remote Sens. Environ. 2011, 115, 1145–1161. [Google Scholar] [CrossRef]
- Griffin, J.R.; Critchfield, W.B. The Distribution of Forest Trees in California; US Department of Agriculture: Berkeley, CA, USA, 1976; pp. 1–115.
- VanDerWal, J.; Shoo, L.P.; Johnson, C.N.; Williams, S.E. Abundance and the environmental niche: Environmental suitability estimated from niche models predicts the upper limit of local abundance. Am. Nat. 2009, 174, 282–291. [Google Scholar] [CrossRef] [PubMed]
- Gomes, V.H.F.; Raes, N.; Amaral, I.L.; Salomao, R.P.; de Souza Coelho, L.; de Almeida Matos, F.D.; Castilho, C.V.; de Andrade Lima Filho, D.; Lopez, D.C.; Guevara, J.E.; et al. Species Distribution Modelling: Contrasting presence-only models with plot abundance data. Sci. Rep. 2018, 8, 1003. [Google Scholar] [CrossRef] [PubMed]
- Fernandez, M.; Hamilton, H.H.; Kueppers, L.M. Back to the future: Using historical climate variation to project near-term shifts in habitat suitability for coast redwood. Glob. Change Biol. 2015, 21, 4141–4152. [Google Scholar] [CrossRef] [PubMed]
- Johnstone, J.A.; Dawson, T.E. Climatic context and ecological implications of summer fog decline in the coast redwood region. Proc. Natl. Acad. Sci. USA 2010, 107, 4533–4538. [Google Scholar] [CrossRef] [PubMed]
- Diffenbaugh, N.S.; Swain, D.L.; Touma, D. Anthropogenic warming has increased drought risk in California. Proc. Natl. Acad. Sci. USA 2015, 112, 3931–3932. [Google Scholar] [CrossRef] [PubMed]
- Wulder, W.A.; Hall, R.J.; Coops, N.C.; Franklin, S.E. High Spatial Resolution Remotely Sensed Data for Ecosystem Characterization. BioScience 2004, 54, 511–521. [Google Scholar] [CrossRef]
- O’Hara, K.L.; Cox, L.E.; Nikolaeva, S.; Bauer, J.J.; Hedges, R. Regeneration Dynamics of Coast Redwood, a Sprouting Conifer Species: A Review with Implications for Management and Restoration. Forests 2017, 8, 144. [Google Scholar]


| Site | Date | Time |
|---|---|---|
| Jackson Forest | 23 July 2016 | 12:00–15:30 |
| Muir Woods | 24 July 2016 | 11:00–12:00 |
| Big Basin | 1 August 2016 | 12:30–1:00 |
| Big Basin | Muir Woods | Jackson Forest | All sites | ||||||
|---|---|---|---|---|---|---|---|---|---|
| Redwood | Other | Redwood | Other | Redwood | Other | Redwood | Other | ||
| Training | Crowns | 109 | 37 | 51 | 47 | 72 | 76 | 232 | 160 |
| Pixels | 4899 | 1086 | 906 | 852 | 822 | 878 | 6627 | 2816 | |
| Testing | Crowns | 55 | 24 | 32 | 37 | 43 | 47 | 130 | 108 |
| Pixels | 2192 | 1078 | 514 | 839 | 543 | 505 | 3249 | 2422 | |
| Total | Crowns | 164 | 61 | 83 | 84 | 115 | 123 | 362 | 268 |
| Pixels | 7091 | 2164 | 1420 | 1691 | 1365 | 1383 | 9876 | 5283 | |
| Parameter | Range | Number |
|---|---|---|
| Number of trees | 10–750 | 75 |
| Maximum depth | 3–13 | 6 |
| Subsample | 0.9 | 1 |
| Learning rate | 0.01–0.15 | 75 |
| Minimum samples at each leaf | 1 | 1 |
| Loss Function | Least squares | n/a |
| Training | Testing | |||||||
|---|---|---|---|---|---|---|---|---|
| True Positive | False Positive | Overall Accuracy | Kappa Statistic | True Positive | False Positive | Overall Accuracy | Kappa Statistic | |
| Big Basin | 0.99 | 0 | 0.99 | 0.99 | 0.98 | 0.02 | 0.98 | 0.95 |
| Muir Woods | 1.0 | 0 | 1.0 | 1.0 | 0.90 | 0.01 | 0.96 | 0.90 |
| Jackson Forest | 0.96 | 0 | 0.98 | 0.95 | 0.81 | 0.03 | 0.90 | 0.81 |
© 2019 by the authors. Licensee MDPI, Basel, Switzerland. This article is an open access article distributed under the terms and conditions of the Creative Commons Attribution (CC BY) license (http://creativecommons.org/licenses/by/4.0/).
Share and Cite
Francis, E.J.; Asner, G.P. High-Resolution Mapping of Redwood (Sequoia sempervirens) Distributions in Three Californian Forests. Remote Sens. 2019, 11, 351. https://doi.org/10.3390/rs11030351
Francis EJ, Asner GP. High-Resolution Mapping of Redwood (Sequoia sempervirens) Distributions in Three Californian Forests. Remote Sensing. 2019; 11(3):351. https://doi.org/10.3390/rs11030351
Chicago/Turabian StyleFrancis, Emily J., and Gregory P. Asner. 2019. "High-Resolution Mapping of Redwood (Sequoia sempervirens) Distributions in Three Californian Forests" Remote Sensing 11, no. 3: 351. https://doi.org/10.3390/rs11030351
APA StyleFrancis, E. J., & Asner, G. P. (2019). High-Resolution Mapping of Redwood (Sequoia sempervirens) Distributions in Three Californian Forests. Remote Sensing, 11(3), 351. https://doi.org/10.3390/rs11030351