Article

Spatial–Temporal Variation of ANPP and Rain-Use Efficiency Along a Precipitation Gradient on Changtang Plateau, Tibet

1
Key Laboratory of Ecosystem Network Observation and Modeling, Institute of Geographic Sciences and Natural Resources Research, Chinese Academy of Sciences, Beijing 100101, China
2
China National Forestry-Grassland Economics and Development Research Center, National Forestry and Grassland Administration, Beijing 100714, China
3
College of Resources and Environment, University of Chinese Academy of Sciences, 100190 Beijing, China
4
Freie Universität Berlin, Institute of Biology, Biodiversity/Theoretical Ecology, 14195 Berlin, Germany
*
Author to whom correspondence should be addressed.
Remote Sens. 2019, 11(3), 325; https://doi.org/10.3390/rs11030325
Submission received: 28 November 2018 / Revised: 1 February 2019 / Accepted: 1 February 2019 / Published: 6 February 2019
(This article belongs to the Special Issue Remote Sensing for Biodiversity, Ecology and Conservation)

Abstract

:
Aboveground net primary productivity (ANPP) and rain-use efficiency (RUE) are important indicators in assessing the response of ecosystems to climate change. In this paper, the Changtang Plateau in the Tibetan Autonomous Region was selected as the study area to analyze the spatial and temporal changes of ANPP and RUE in grassland communities and their response to climate change. The results showed the following:(1) The spatial pattern of ANPP was closely related to rainfall on the Changtang Plateau. The average ANPP over the past 15 years increased gradually from the arid west to the humid east. A consistent pattern was exhibited in different grassland types and climate zones. (2) The RUE was higher at the east and west edges of the Changtang Plateau, especially in the arid west, but was lower in the center. From the perspective of different climatic zones, the average RUE in the southern Tibetan semiarid climate zone and the Ngari arid climate zone was significantly higher than that in other climate zones. However, the average RUE in different grassland types only varied from 0.07 to 0.09 g·m−2·mm−1. The spatial variation in RUE was more distinct in different climatic zones than in different grassland types. (3) Climate change influenced the interannual variation of ANPP and RUE, but the response of ANPP to rainfall showed a significant lag. The interannual change in RUE was negatively correlated with changes in precipitation. (4) In general, a greater area showed a significant increase rather than a decrease in ANPP on the Changtang Plateau, which meant that the grassland condition is improving. The temporal variation patterns of ANPP and RUE in different climate zones were consistent with the overall patterns on the Changtang Plateau, while the variation was not significant in different grassland types.

Graphical Abstract

1. Introduction

Aboveground net primary productivity (ANPP) is one of the key ecological properties of ecosystems, and it is closely related to precipitation in grassland ecosystems, both globally and regionally [1,2,3]. ANPP has a strong positive correlation with mean annual precipitation (MAP) over spatial precipitation gradient [4,5,6]. ANPP progressively increases from arid to humid regions, particularly within arid to semiarid ecosystems [7,8,9]. There are some disputes over the relationship between annual variation in ANPP and precipitation despite agreement on the overall findings of spatial patterns. Some researchers consider that the annual variation of ANPP is influenced by soil humidity as well as precipitation [7,10]. But the other studies have shown that the annual variation of ANPP is not related to changing precipitation [2,9]. It may not possible to interpret the variation of ANPP on the basis of precipitation because variations in precipitation are on a much larger scale than changes in ANPP overall [11,12].
The rain-use efficiency (RUE), or the ratio of ANPP to precipitation, can be effectively used to evaluate the responses of ANPP to the spatiotemporal variation of precipitation, especially in arid and semiarid ecosystems [13,14]. However, there are some debates over the spatiotemporal pattern of RUE. From the perspective of spatial pattern, RUE is generally considered to increase with MAP [13,15,16]. However, the long-term ecological research conducted by Huxman et al. [14] showed that RUE decreased with MAP. Plants in arid environments can improve RUE. Paruelo et al. [9] showed that RUE was lower at both the arid and humid regions and could be represented by a unimodal curve. In terms of temporal variation pattern, research has shown that RUE decreases with increasing interannual rainfall [9,10,13]. However, Hu et al. [15] and Lauenroth et al. [17] found that there was no significant correlation between RUE and the interannual variation of rainfall. These differences indicate there is still some disagreement on the spatiotemporal relationships between of ANPP and RUE.
Vegetation productivity is evidently responsive to climate change [18]. Global warming alters precipitation mechanisms and leads to more extreme precipitation and drought events [19], which affect grassland productivity [20]. The Qinghai–Tibetan Plateau, the third pole of the world, is experiencing accelerated changes in climatic conditions [21,22]. Previous studies have shown that there are differences in the spatiotemporal patterns of ANPP and RUE on the Qinghai–Tibetan Plateau. For example, Mi et al. [23] showed that the spatial RUE decreased with increasing precipitation. However, Qiu et al. [24] and Ye et al. [25] indicated that the spatial RUE increased with increasing precipitation. In addition, Yang et al. [26] showed that the spatial RUE presented unimodal distribution on the Qinghai–Tibet Plateau.
There are several reasons for the discrepancies of RUE patterns. First, different research scales lead to different results [13]. A 4500 km transect of grasslands in China in the Inner Mongolia–Qinghai–Tibet Plateau showed that RUE ranged from 0.13 to 0.64 g·m−2·mm−1 [15]. However, a global study showed a mean RUE value of 0.64 g·m−2·mm−1 [9]. The range of RUE for global arid and semiarid ecosystems was 0.05–1.81 g·m−2·mm−1 [27]. Second, the interactions between vegetation life history and biogeochemical limitations vary with precipitation gradients in different regions. ANPP and RUE increase with higher diversity of species [28,29]. In the Inner Mongolian grassland, ANPP had a linear relationship with increasing diversity of species [13], while on the Qinghai–Tibetan Plateau ANPP increased exponentially with increasing species diversity [26]. It is generally accepted that the density of vegetation, richness of species, and ANPP increase rapidly with higher MAP, leading to more nutrient requirements [9,14], although the mineralization capacity of nitrogen also increases with higher precipitation. Therefore, nutrient limitations may vary with precipitation gradients in different regions, and this may also be affected by other factors, such as soil texture, topography, temperature, etc. [13], especially in the alpine environments of the Changtang Plateau [26]. Third, the rainfall intervals in precipitation gradients vary from different studies. RUE was found to follow unimodal curve along the precipitation gradient [9,26]. However, almost no data were sampled from the regions with precipitation of less than 200 mm. Although Bai et al. [13] and Hu et al. [15] showed that RUE increased with higher MAP. Hu et al. [15] discovered that RUE experienced a slight increase at the most arid part of the region. Addtionally, their research did not include regions with MAP of more than 600 mm. Therefore, the different rainfall intervals in precipitation gradients may have an impact on the consistency of the results. Moreover, factors such as the long-term and short-term effects of climate on ANPP [7], hysteresis effects of precipitation [30], and the impacts of terrain [31] may also limit the response of ANPP to changes in precipitation.
There is consistent conclusion on the arguments around the temporal and spatial distribution characteristics of ANPP and RUE at present. It is still not known what the temporal and spatial patterns of ANPP and RUE are, and whether there are any changes of these patterns in response to changing climate on the grasslands of the Tibetan Changtang Plateau. Therefore, a research based on the relationship between grasslands and climate change is required. This can be found by identifying the dynamic changes in ANPP and RUE of the grassland as well as the response modes to changing climate [32]. To identify the temporal and spatial patterns of ANPP and RUE for the grasslands along a precipitation gradient on Changtang Plateau and to address the impact of the changing climate on the temporal and spatial patterns of ANPP and RUE, we hypothesize: (1) spatially, RUE is higher at the arid end of the Changtang Plateau although ANPP is lower, while RUE decreases continually with increasing precipitation despite ANPP increases continuously from west arid end to east humid end; (2) temporally, the interannual variation of RUE is positively correlated with ANPP; (3) the spatial and temporal patterns of ANPP and RUE can also apply to different types of grasslands and climate zones; (4) climate change will have an impact on the temporal and spatial patterns of ANPP and RUE. ANPP and RUE will increase with the increase of precipitation. ANPP and RUE will increase as temperature increases. To test these hypotheses, field samplings were first conducted to establish and validate the relationship between the normalized differential vegetation index (NDVI) integral of the entire year (NDVI-I) and ANPP. Then, the ANPP was calculated based on the NDVI-I data from 2000 to 2014. And RUE was calculated from ANPP and precipitation. Second, we analyzed the spatial and temporal patterns of ANPP and RUE on the ChangtangPlateau and compared these patterns in different grassland types and climatic zones. Third, we analyzed the relationships between spatial and temporal variations of ANPP, RUE, and climate change and explored the impact of climate change. This study is helpful to understand and evaluate the impacts of climate change on the grassland ecosystems on the Qinghai–Tibetan Plateau [13].

2. Materials and Methods
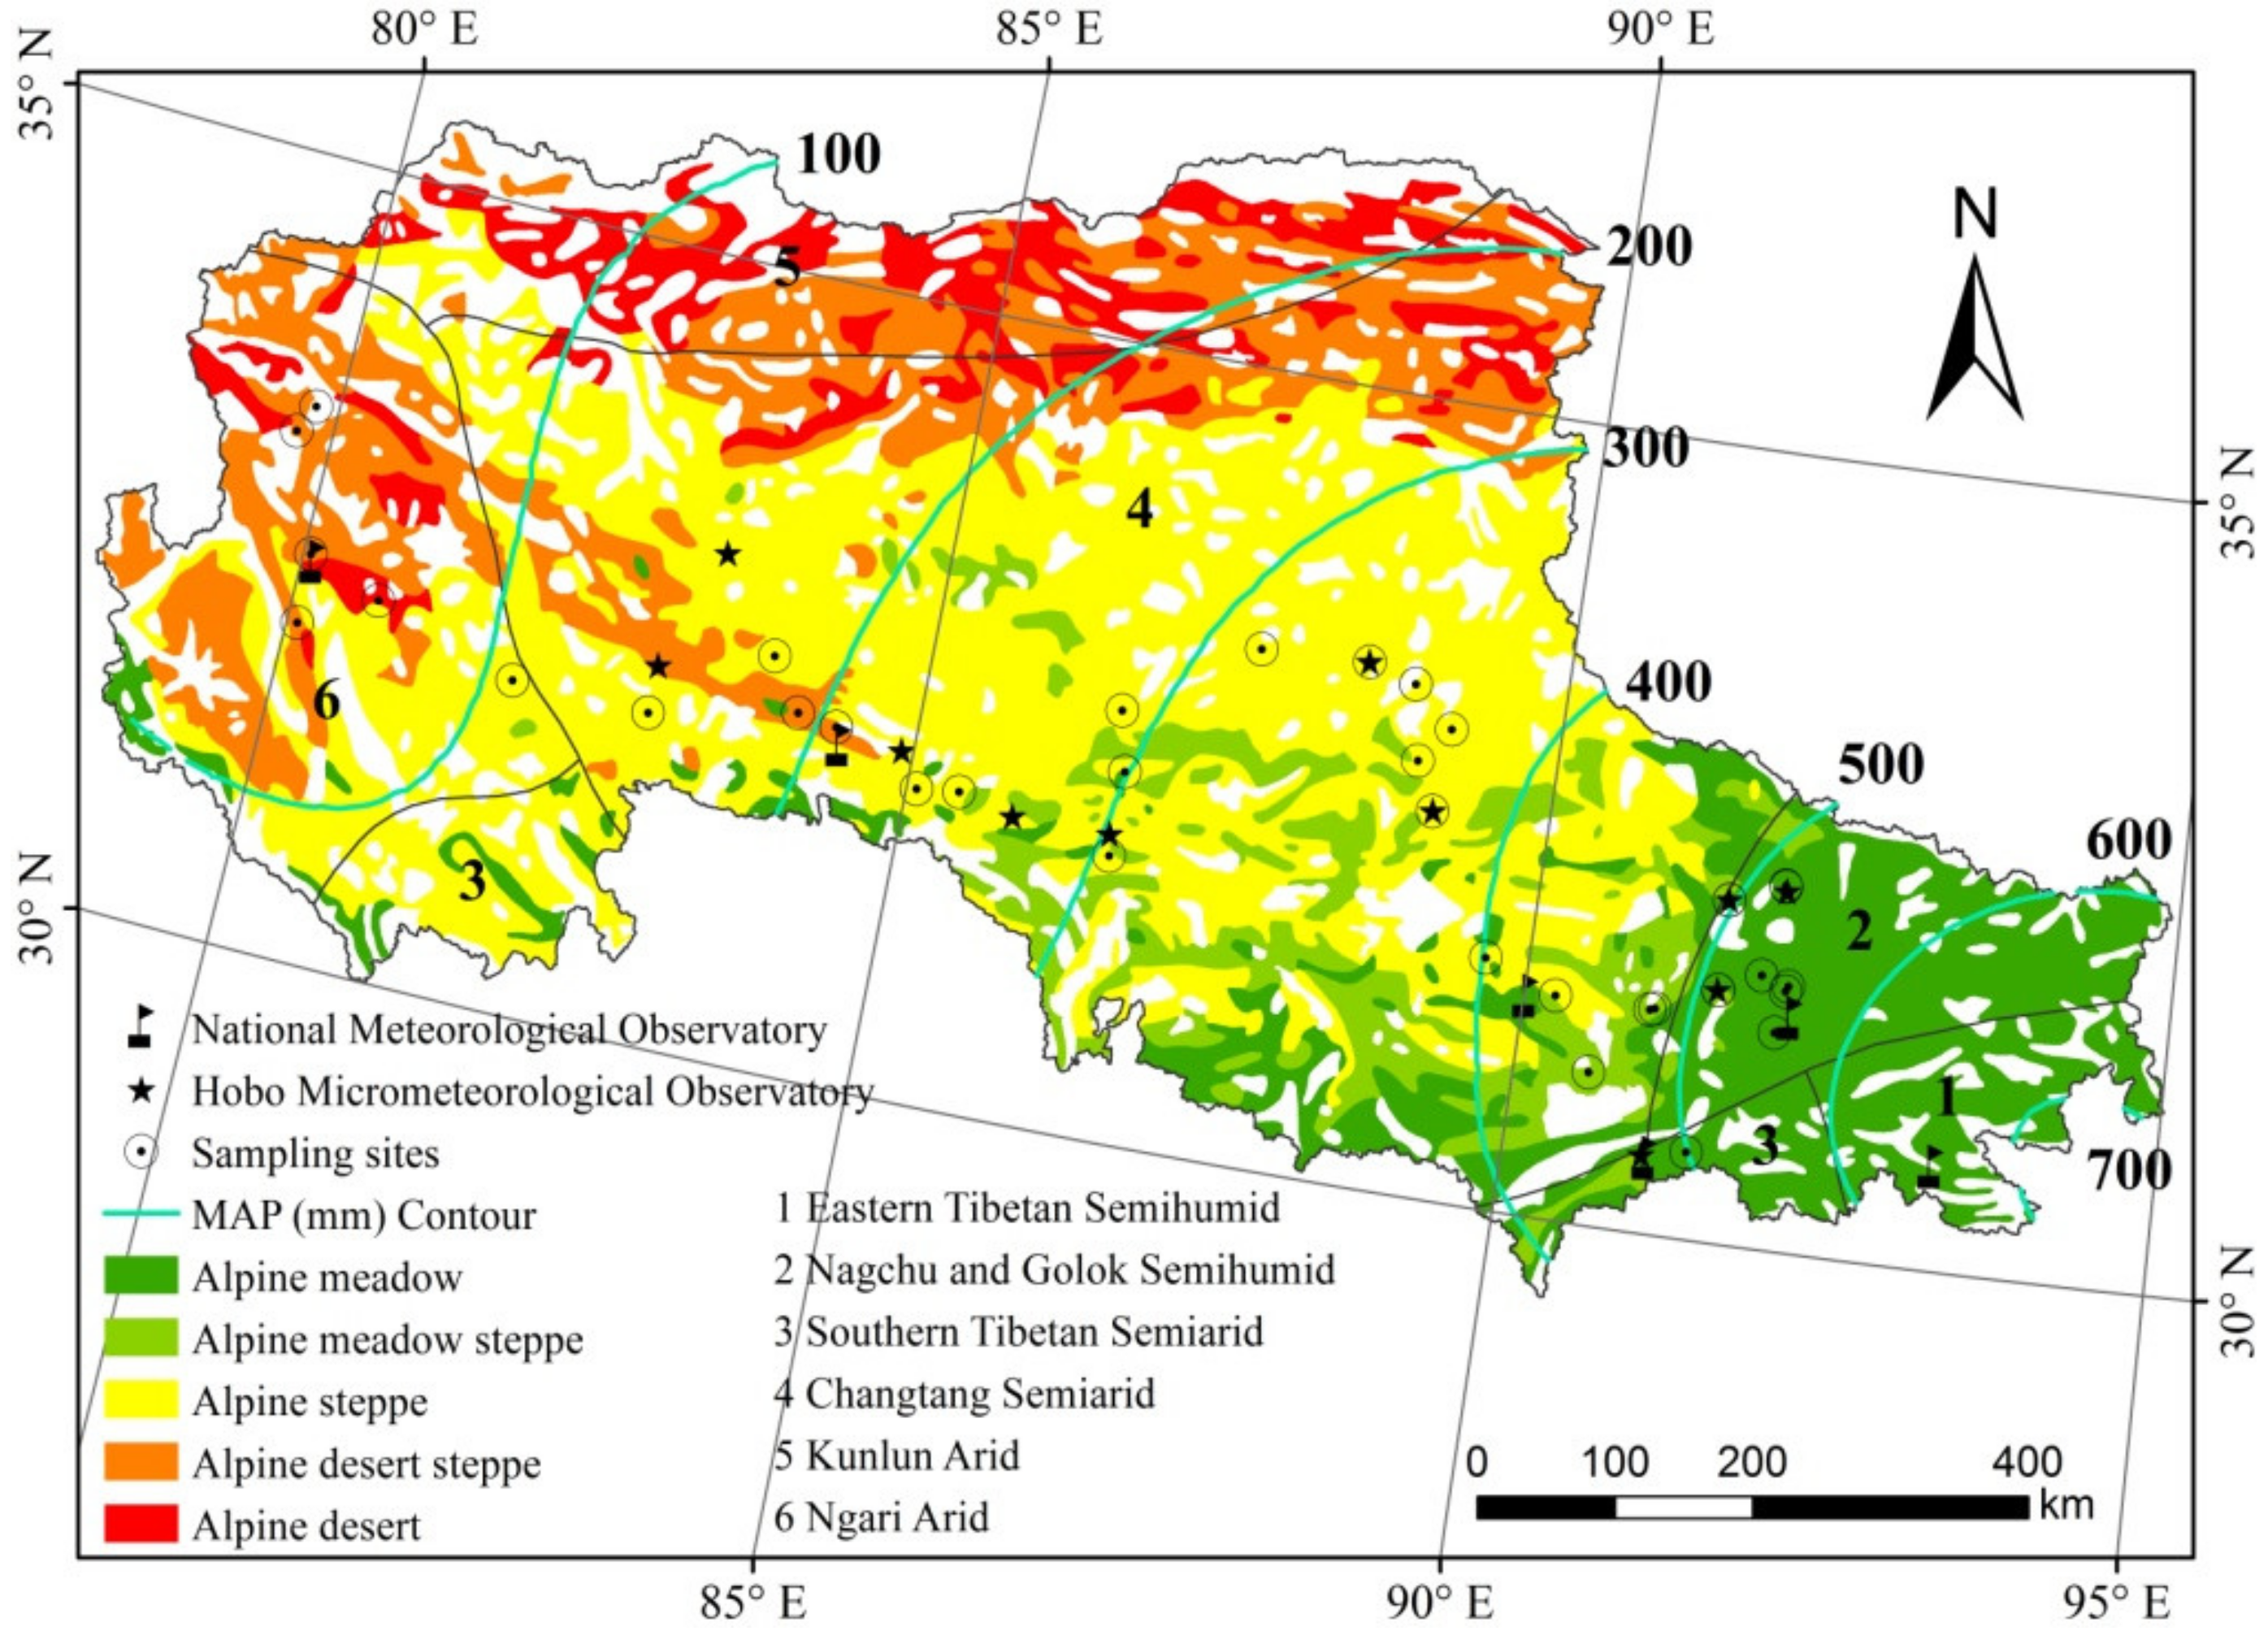
2.1. Study Area

The Changtang Plateau, which comprises a majority of the Tibetan Plateau, lies in the northwest area of the Tibetan Autonomous Region, China (29°53′–36°32′N; 78°41′–92°16′E), with an average altitude of more than 4400 m. There is a precipitation gradient ( < 100–700 mm) from west to east of the Plateau, where soil organic matter and total nitrogen increase from less than 1.0% to 4.0% and from 0.02% to 0.2%, respectively [33]. The Plateau features the most severe climates and the most vulnerable ecosystems in China, with a cold, arid, and windy climate and sparse vegetation. The general evaporation strength is larger than 1800 mm. The annual mean wind speed is more than 3 m·s−1. And the annual mean aridity index is in the range of 1.6 to 20. The Plateau is cold, with annual mean temperature of less than 0 °C, a mean temperature in the coldest month (January) of −10 °C to −18 °C, and an annual temperature in the warmest month (July) of less than 14 °C in most of the region. The vegetation is mainly composed of the following types of grasslands: alpine meadow, alpine meadow steppe, alpine steppe, alpine desert steppe, and alpine desert (Figure 1, Table 1). The grasslands are dominated by Stipapurpurea and Carexmoocroftii [34,35]. The climate zones of the Changtang Plateau can be divided into eastern Tibetan semihumid climate zone, southern Tibetan semiarid climate zone, Ngari arid climate zone, Nagchu–Golok semihumid climate zone, Changtang semiarid climate zone, and Kunlun arid climate zone (National Earth System Science Data Sharing Infrastructure: http://www.geodata.cn/) (Figure 1, Table 2).

2.2. Data Acquisition

2.2.1. ANPP Calculation

Both the NDVI-I for the entire year [8,36] and NDVI during the growing season [37,38] have been shown to be good predictors of vegetation biomass or ANPP. However, the growing season varies strongly across the Changtang Plateau, with some areas in the west (late April) greening up to two months earlier than the central or eastern regions (late June) [39], while withering periods range from less than 250 Julian day to more than 300 Julian day [40]. At the same time, the interannual variation of phenology is also very large across the Changtang Plateau [41,42]. Therefore, in order to reduce the dimensionality of our data, NDVI-I was adopted for the prediction of the ANPP of grasslands [43,44]. The NDVI-I can be used to predict photosynthetic active radiation and ANPP [43] and was calculated according to the procedure described by Paruelo et al. [8]. The Global MOD13Q1 V006 dataset from NASA’s Terra satellite was used [45]. This includes NDVI and quality control data at a resolution of 250 m and is generated using the maximum value composite method (MVC) every 16 days. Datasets were selected covering the period March 2000 to December 2014. Meanwhile, Moderate Resolution Imaging Spectroradiometer net primary production (MODIS NPP) product MOD17A3H V006 [46], was used to compare the results.The formula to calculate NDVI-I is as follow:
N D V I I = i = 1 n N D V I i * T i
where n represents the total number of composites for each year (23 composites), NDVIi represents the i-th composite, Ti represents the proportion of the year covered by the i-th composite (16 days, 0.045).

2.2.2. Sampling and Meteorological Data

To developthe relationship between actual calculations of ANPP and NDVI-I for the grasslands, we conducted a multisite survey (32 sites) during the peak growing season (late July to early August) in 2013 at non-grazed pastures across the Changtang Plateau. The specific sampling points are shown in Figure 1. All sites were located in zonal vegetation areas with flat terrain and good plant growth to reduce spatial heterogeneity and ensure the representativeness of the samples. We used a sample quadrat of 0.5×0.5 m with five replicates at 20 m intervals along one 100 m transect line to harvest aboveground biomass. Meanwhile, we used the sites as the center to do buffers with a radius of 1 km and the mean value of several contiguous pixels within the buffer as the corresponding NDVI for the site. Then, the NDVI-I values for the entire year of all sites were integrated.
All samples of the collected biomass were put into envelopes for drying and weighing in the lab. The field-measured ANPP was used to fit a functional relationship with the NDVI-I data. All of the abovementioned analyses were done using SPSS19 software (SPSS Inc., Chicago, IL, USA). Meteorological data for the analyses were mainly collected from the Plateau’s meteorological elements distribution datasets generated by the PRISM model with interpolation (http://www.geodata.cn/Portal/metadata/viewMetadata.jsp?id=100111-10043), referred meteorological data from the National Meteorological Observatory and Hobo Micrometeorological Observatory (Fig 1), and the ground-based meteorological and solar energy datasets from NASA (https://eosweb.larc.nasa.gov/cgi-bin/sse/grid.cgi).

2.2.3. RUE Calculation

The ratio of ANPP to MAP is generally defined by RUE [9,27]. The RUE can be determined by the following formula:
R U E = A N P P / M A P
where RUE (g·m−2·mm−1) is rain-use efficiency, ANPP (g·m−2) is aboveground net primary productivity, and MAP (mm) is the mean annual precipitation.

2.2.4. Calculation of the Spatial and Temporal Variation of ANPP and RUE

The mean ANPP and mean RUE during 2000–2014 on the Changtang Plateau were calculated by per-pixel for all years. The least-square method was used to calculate the temporal trends (Slope) of ANPP and RUE from 2000 to 2014, and the significance test (F test) was given before analyzing the temporal patterns of ANPP and RUE. The slope of the linear regression of each pixel is then used to indicate the temporal trends of ANPP and RUE across year 2000–2014.
S l o p e = n i = 1 n i V i i = 1 n i i = 1 n V i n i = 1 n i 2 ( i = 1 n i ) 2
where n is the number of study years (15 in this study), i is the serial number of the year, and Vi is the variable for year i. A positive grid slope corresponds to an increasing trend in Vi change, and a negative value corresponds to a decreasing trend in Vi change over the 15 years.
Analysis of the impacts of climate change on temporal changes of ANPP and RUE was mainly based on the spatial correlations between the variation of temperature and precipitation and the trends of ANPP and RUE over time. The spatial correlation analysis was mainly conducted by the Multivariate Band Collection Statistics model in the Spatial Analyst Tools of ArcGIS software. All the data and the data with significant changes were analyzed separately. ArcGIS 10 (ESRI Inc., Redlands Ca) was used for all of the abovementioned analyses.

3. Results

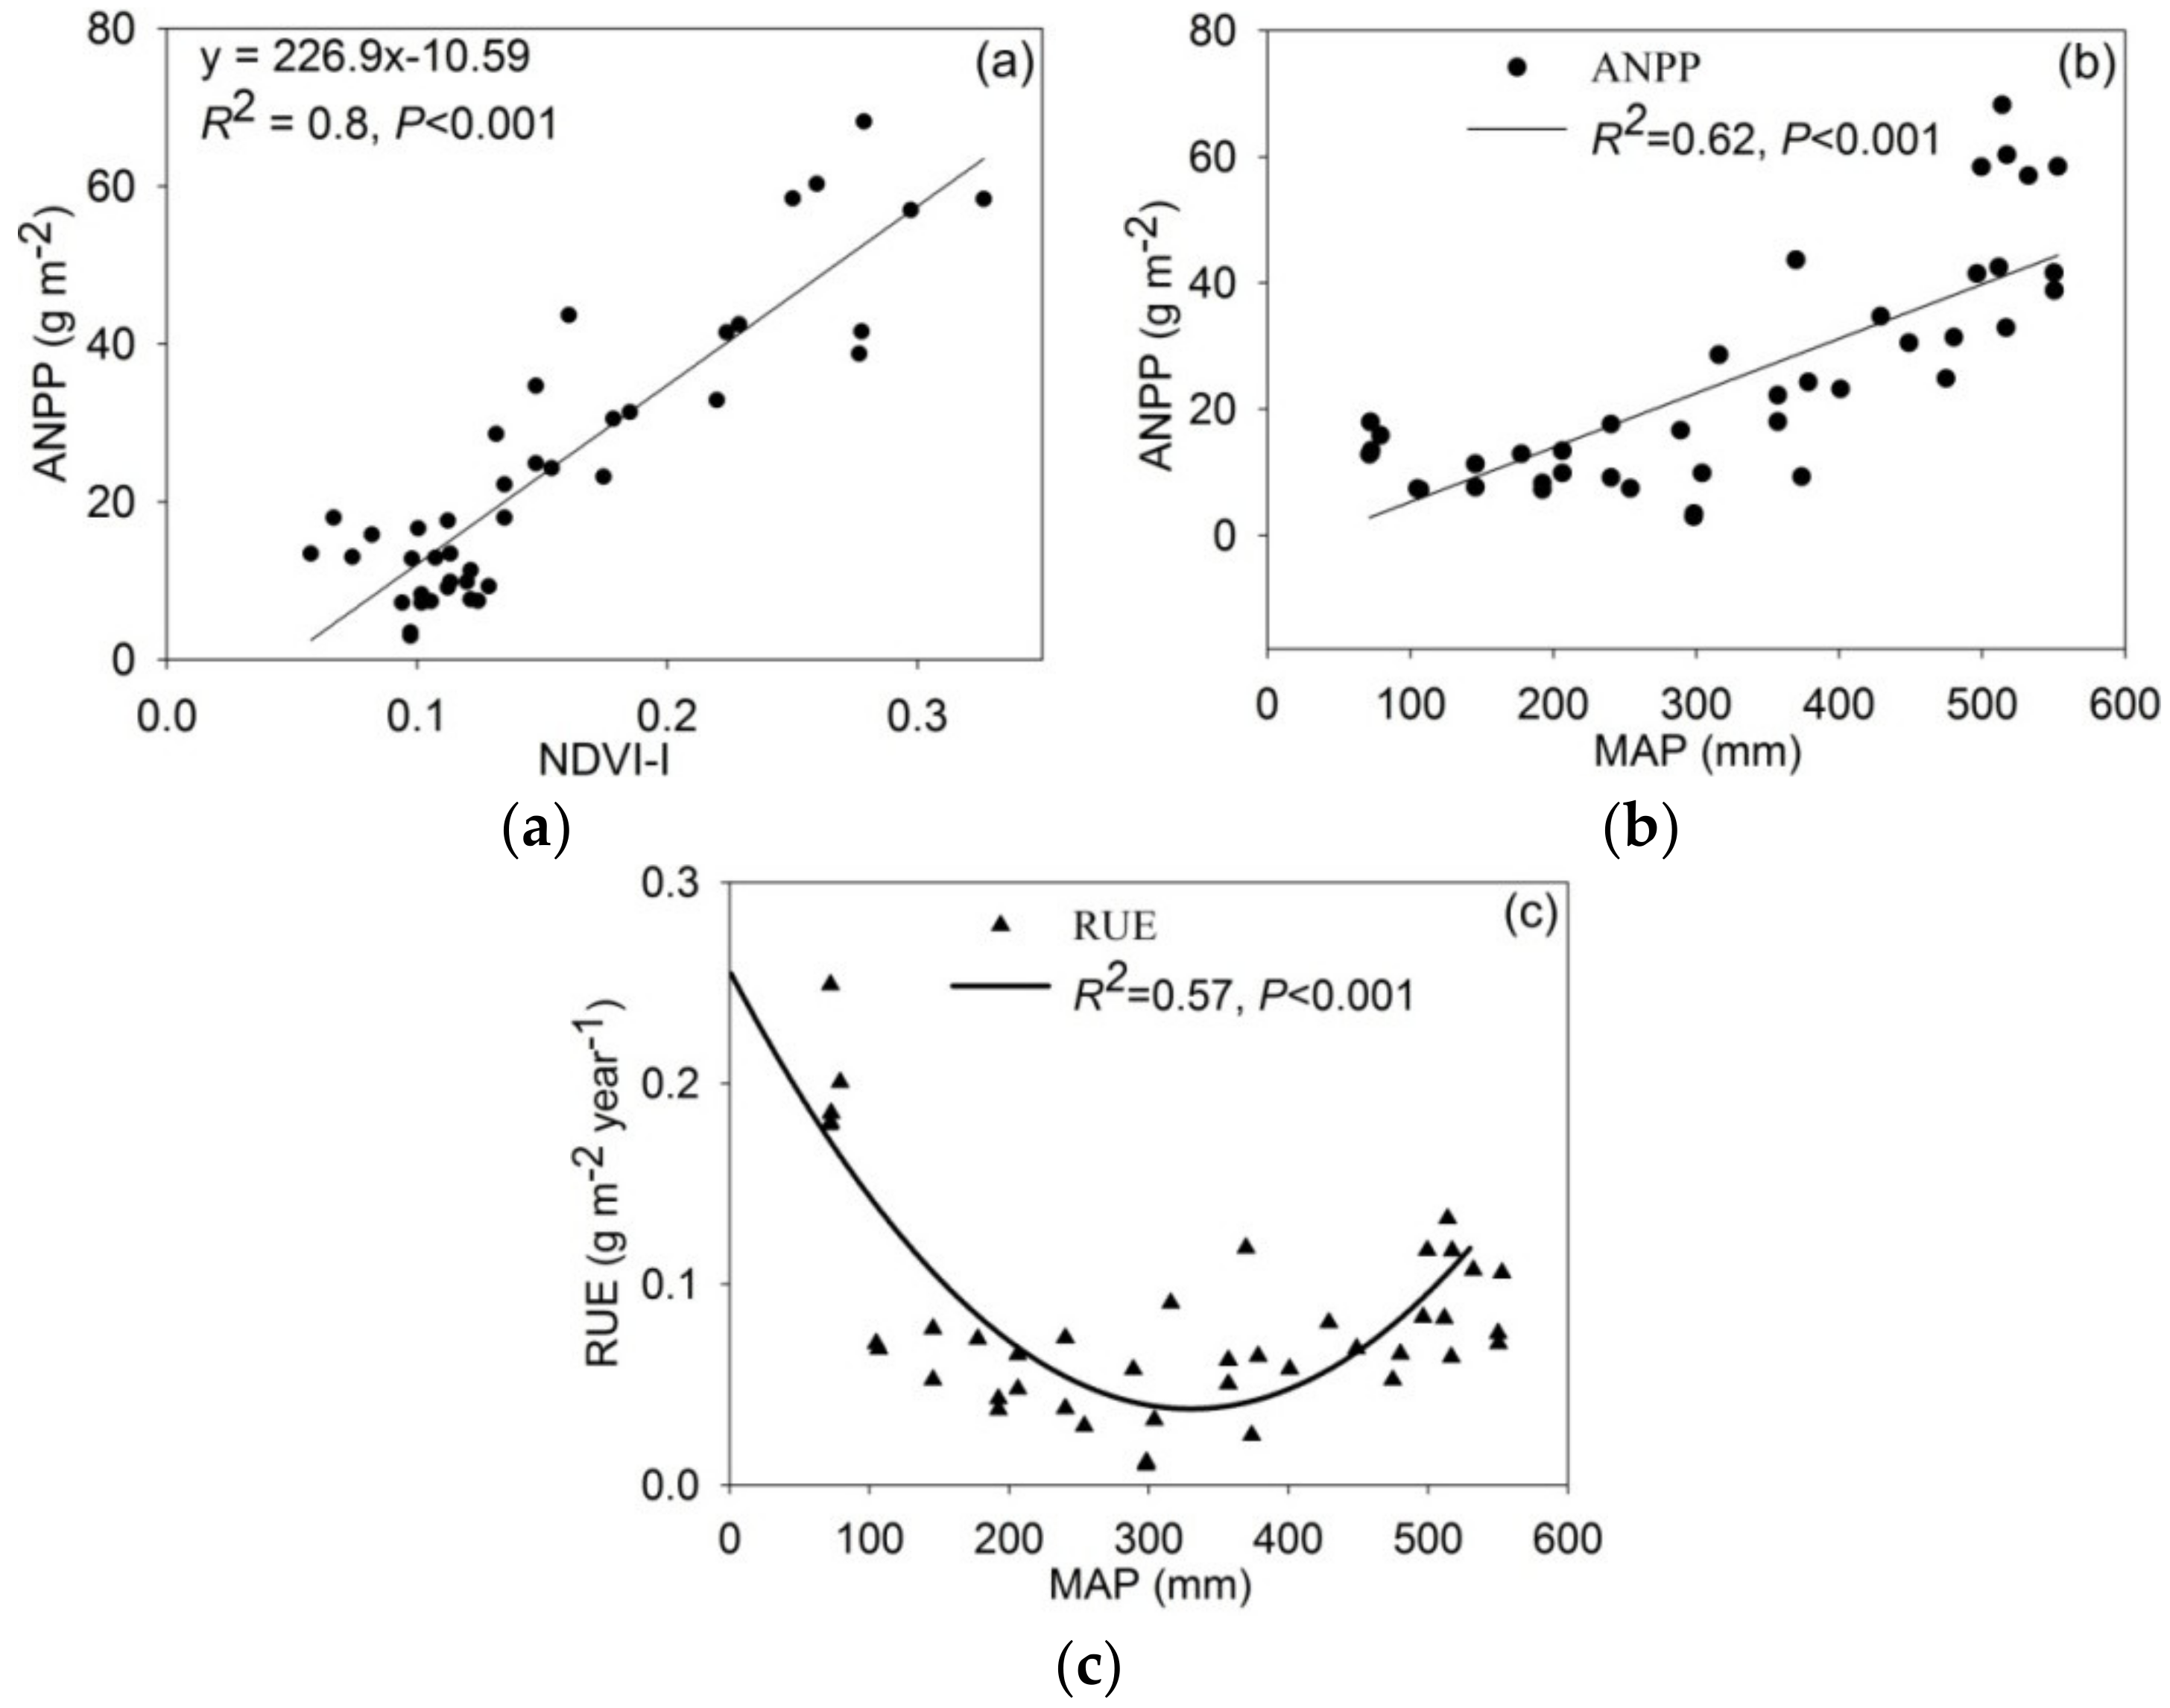
3.1. Relationship between Measured ANPP and NDVI-I

Various measures of fit were examined before determining if the functional relationships between ANPP and NDVI-I were linear (Figure 2a). The in-situ ANPP, calculated NDVI-I, and MODIS NPPhad a linear relationship withMAP (Table 3), while RUE had a quadratic equation in relation to MAP (Figure 2c). The linear relationship between ANPP and NDVI-I supported the use of NDVI-I for predictions of grassland ANPP in other years. This also allowed grassland RUE to be calculated.

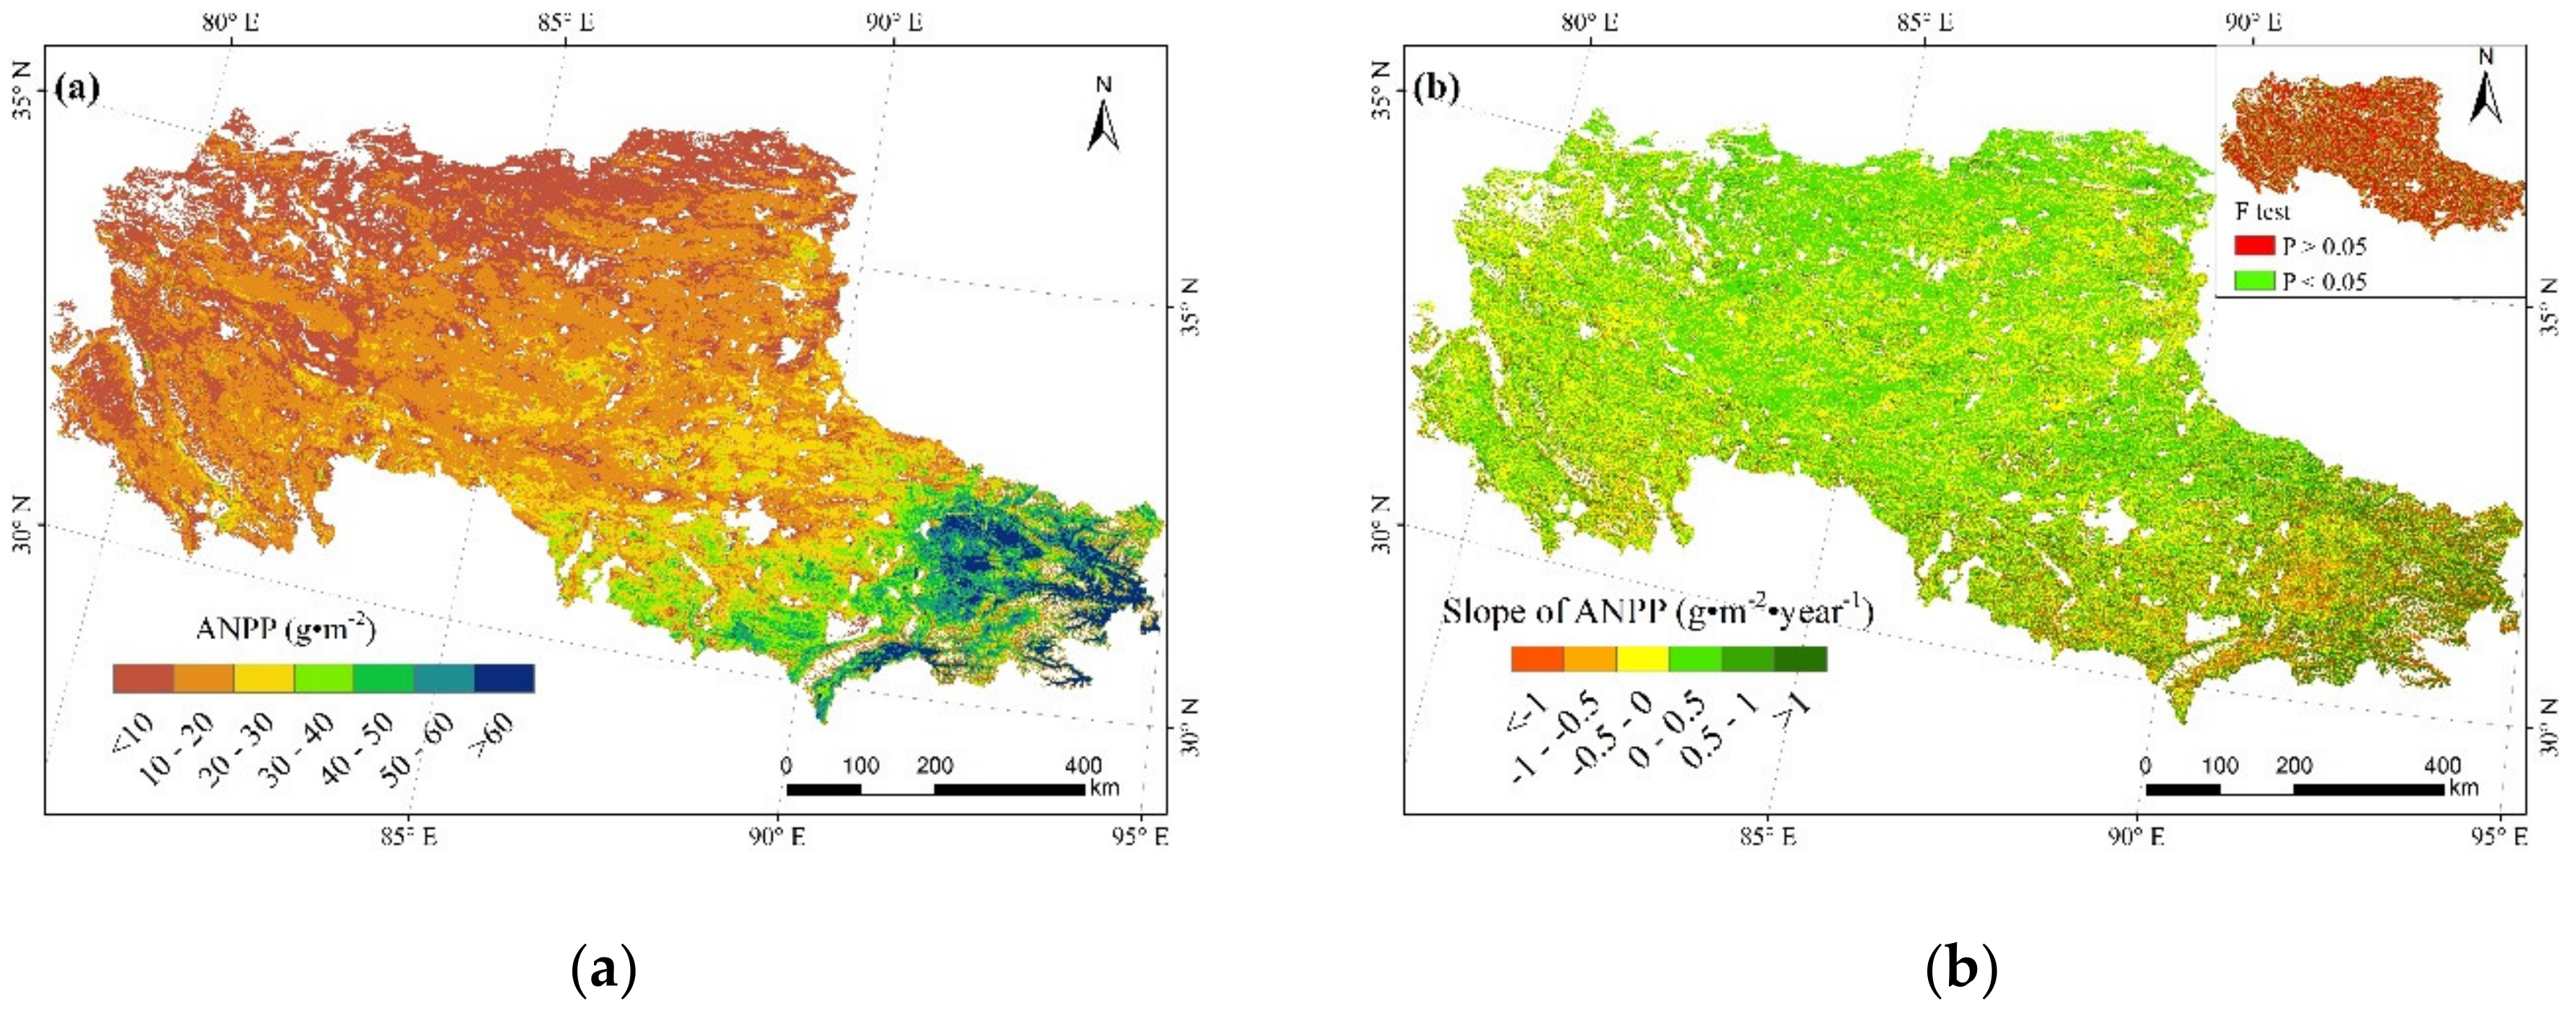
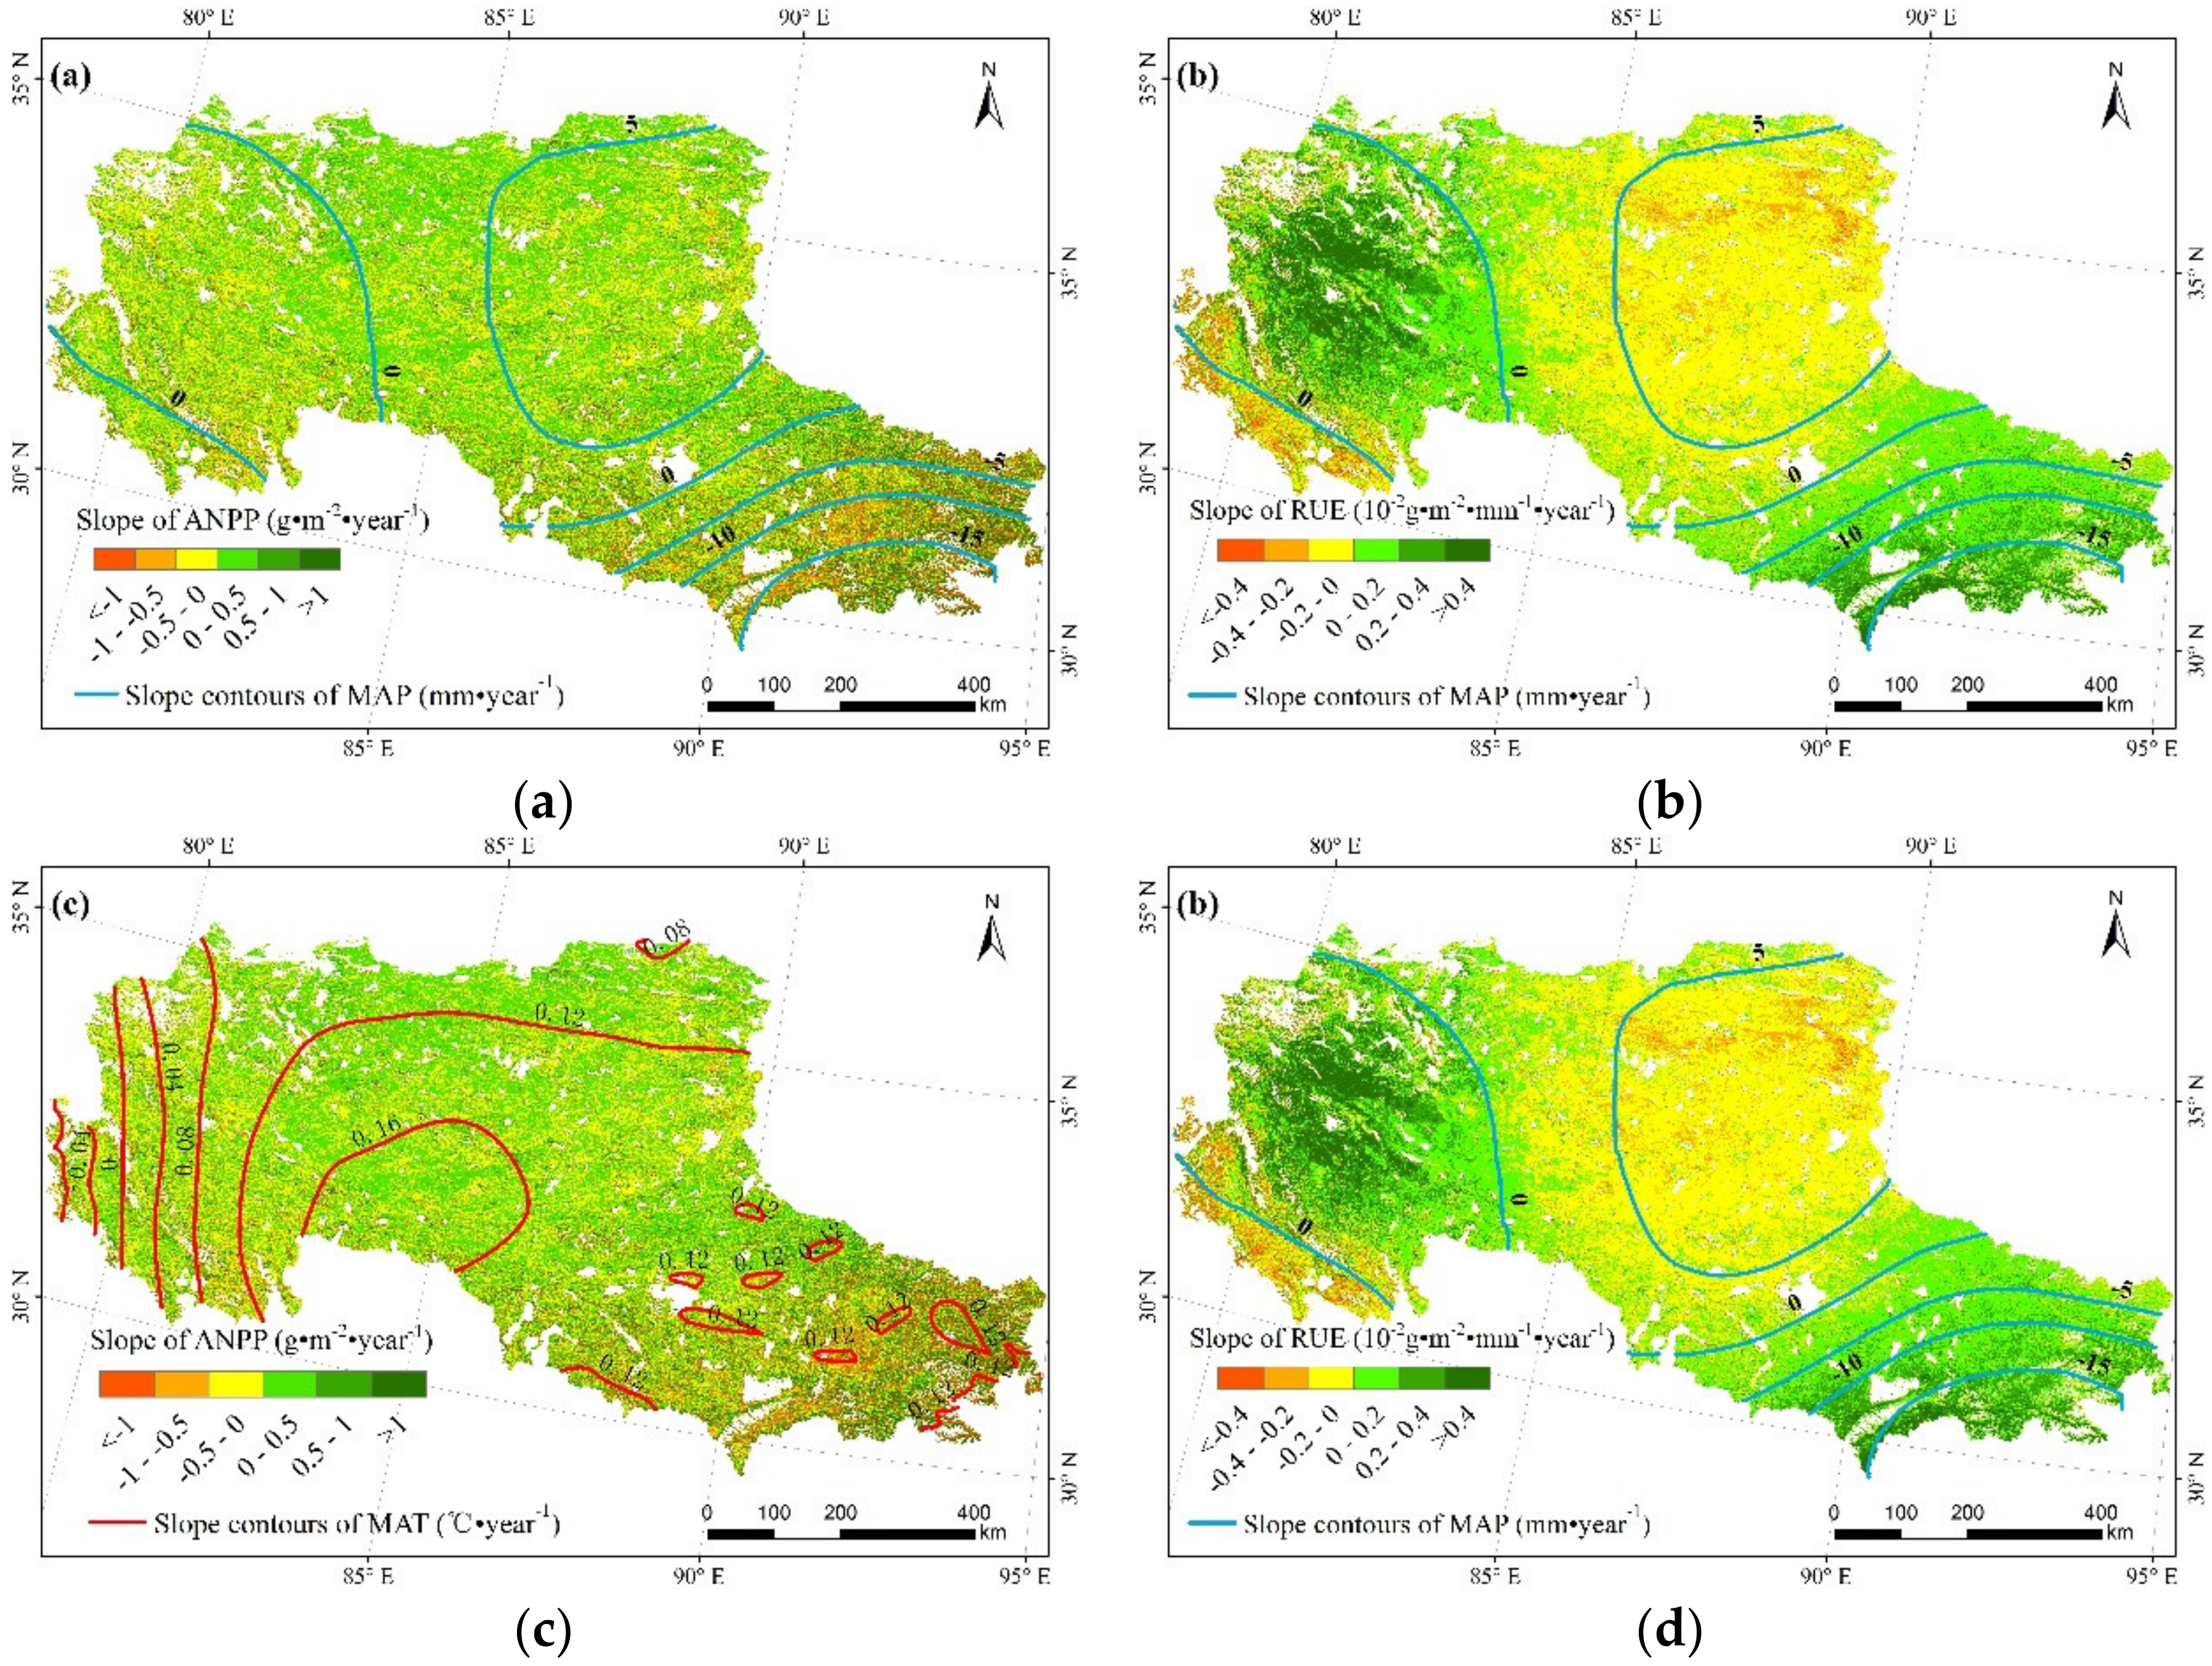
3.2. Spatial–Temporal Patterns of ANPP on the Changtang Plateau

The spatial pattern showed changes in ANPP along the precipitation gradient zone from the west to the east of the Changtang Plateau, with measurements of less than 10 g·m−2 in the west to more than 60 g·m−2 in the east. ANPP was higher in the region that experienced higher precipitation rates (Figure 3a). In different types of grasslands, ANPP was highest in alpine meadows, followed by alpine meadow steppes, alpine steppes, alpine desert steppes and lowest in the alpine deserts (Table 4). In different climate zones, ANPP was highest in the eastern Tibetan semihumid climate zone and Nagchu and Golok semihumid climate zone, followed by the southern Tibetan semiarid climate zone and Changtang semiarid climate zone, and lowest in the Ngari arid climate zone and the Kunlun arid climate zone (Table 4).
There was no significant change in the temporal pattern of ANPP from 2000 to 2014 (Figure 3b). However, statistics showed that ANPP increased in 55% of the grasslands on the Changtang Plateau, with 19% of these areas showing a significant increase. There was a decrease of ANPP in 45% of the grassland on the Plateau, of which 15% showing a significant decrease. ANPP in different types of grasslands experienced an increasing trend, and the mean rates of change in ANPP in alpine meadows and alpine deserts were higher than in other types of grasslands (Table 4). In different climate zones, ANPP showed a decreasing trend at the western and eastern regions (southern Tibetan semiarid climate zone, Ngari arid climate zone, and Nagchu and Golok semihumid climate zone) of the Changtang Plateau despite a significant increase of 14% and a significant decrease of 10% in the middle region (Table 4).

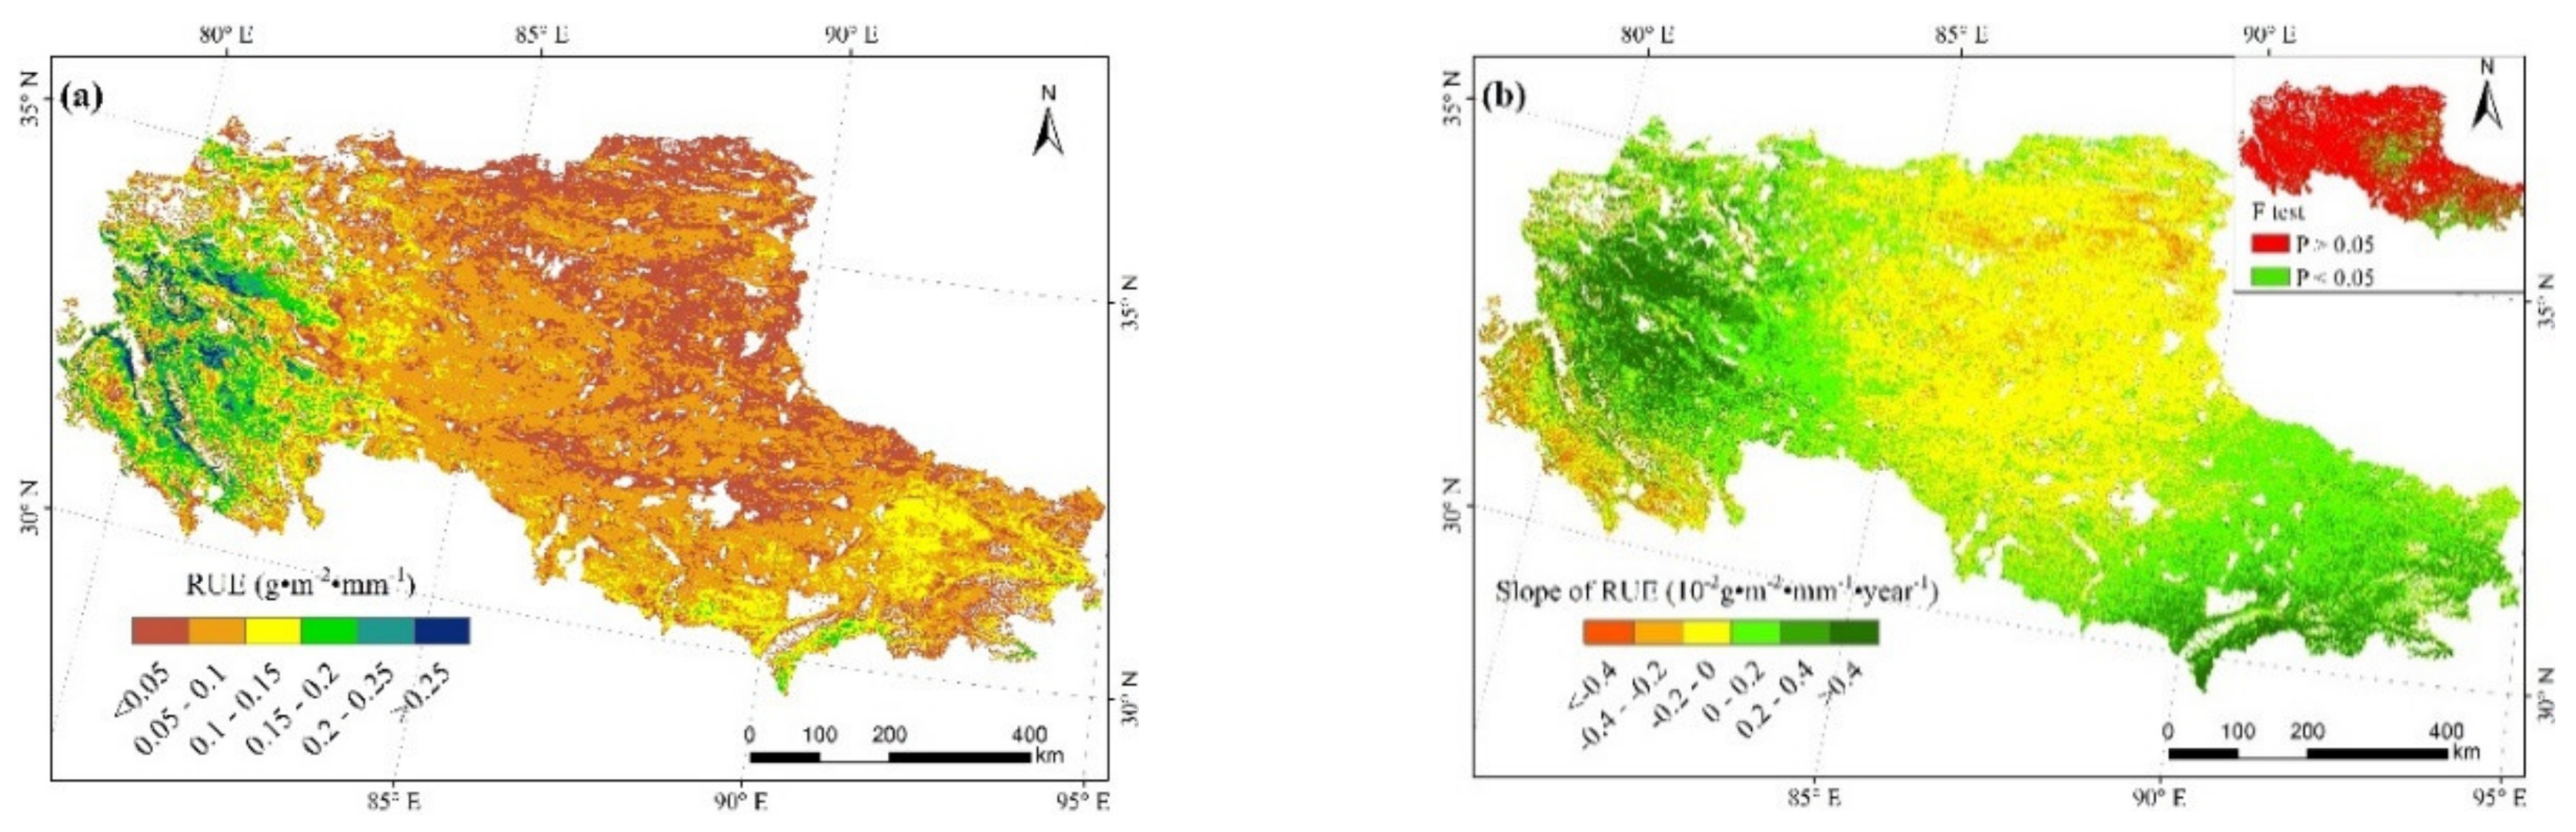
3.3. Spatial–Temporal Patterns of RUE on the Changtang Plateau

The spatial distribution of RUE was highest in the west of the Changtang Plateau, with a maximum value of 0.25 g·m−2·mm−1, and decreased with an increase in precipitation. In the east, the higher measure of RUE ranged from 0.1 and 0.15 g·m−2·mm−1, while the central region showed the lowest RUE (Figure 4a). The mean RUE in different types of grasslands remained around 0.07–0.09 g·m−2·mm−1, while it had a range of 0.06–0.15 g·m−2·mm−1 in different climate zones(Table 5). The mean RUE of the southern Tibetan semiarid and Ngari arid climate zones was higher than those of other climate zones (Table 5).
The temporal patterns of RUE showed a strong increase in the east and west of the Changtang Plateau and a evident decrease in the central region (Figure 4b). Further statistical analysis showed that RUE increased significantly over 11% of the Changtang Plateau but decreased significantly over 8% of the Plateau during 2001–2014 (Table 5). Within different types of grasslands, the mean rates of change in RUE were highest in alpine meadows, increasing significantly in 7% of the region, while no regions exhibited a sizeable decrease. RUE had the lowest mean rates of change in the alpine steppe, decreasing significantly over 6% of the region and increasing significantly less than 2% (Table 5). In different climate zones, the highest mean rates of increase in RUE were in the eastern Tibetan semihumid climate zone, followed by the Ngariarid climate zone and the Nagchu and Golok semihumid climate zone. RUE exhibited a downward trend in the Changtang semiarid and Kunlun arid climate zones (Table 5). RUE was higher at both ends of the Changtang Plateau, most of which showed an upward trend, and lower in the central regions, which generally exhibited a downward trend.

3.4. Influence of Climate Change on Temporal Patterns of ANPP and RUE

Analysis of the spatial relationship between the annual variation of ANPP, RUE, and precipitation from 2000 to 2014 showed that ANPP generally experienced an increase in the regions of growing precipitation and a downward trend in regions of decreasing precipitation rates (Figure 5a). RUE generally showed a decreasing trend in regions of growing precipitation and a sizeable increasing trend in regions with decreased precipitation. Changes in RUE showed a significantly negative correlation with changes in precipitation for all data (r= −0.44, p < 0.001) and the same for the data with significant trends (r= −0.32, p < 0.001) (Figure 5b). In different climate zones, precipitation exhibited an increasing trend in the central areas (Changtang semiarid and Kunlun arid climate zones) (Table 6), resulting in an increase in ANPP (Figure 5a, Table 4) and decrease in RUE (Figure 5b, Table 5). In the climate zones at the western and eastern ends of the Changtang Plateau, precipitation rates tended to decrease (Table 6) and ANPP showed a decreasing trend (Figure 5a, Table 4), while RUE showed an increasing trend (Figure 5b, Table 5).
The greatest mean temperature increase was in the Changtang semiarid climate zone, where ANPP showed a corresponding increase. The smallest mean temperature increase was in the Ngari arid climate zone, where ANPP showed a downward trend (Figure 5c, Table 4, and Table 6). RUE had a downward trend in the Changtang semiarid climate zone and an upward trend in the Ngari arid climate zone (Figure 5d, Table 5). Although ANPP tended to increase while RUE tended to decrease in regions where temperature increases were higher(Figure 5c,d), there were no significant correlations between ANPP and the spatial distribution of changing temperatures (r= 0.02).There were also no significant correlations between RUE and the spatial distribution of changing temperatures for all data (r= −0.06) and the same for the data with significant trends (r= −0.07). There was no strong spatial correlation between increasing temperatures and variations in ANPP and RUE in different types of grasslands.

4. Discussion

4.1. The Spatial Variation of ANPP and RUE

The mean ANPP during 2000–2014 increased progressively from the western arid region to the eastern semihumid region along the precipitation gradient of the Changtang Plateau. Whether it was from the whole plateau or different types of grasslands or climate zones, ANPP increased with increasing precipitation. This is in agreement with previous research results [4,5,6], indicating that the spatial patterns of ANPP are strongly influenced by precipitation. RUE was higher at both the western arid region and the eastern semihumid region, especially at the western arid region, while it was lower in the middle region.
There was a difference between the RUE spatial distribution pattern of the Changtang Plateau and previous research results. The RUE was highest at the arid end of the Changtang Plateau. When MAP was < 400 mm, the RUE decreased with an increase in MAP, which is consistent with the research results on the alpine grasslands on the Qinghai–Tibetan Plateau conducted by Mi et al. [23] and the study of 14 terrestrial ecosystems in South and North America conducted by Huxman et al. [14]. However, the results are opposite to what was found along the precipitation gradient of the East African Prairie by McNaughton [47] and research done on the precipitation gradient of the Inner Mongolian grasslands in China by Bai et al. [13]. When MAP was >400 mm, RUE increased with an increase in MAP, and RUE at the humid eastern end of the Changtang Plateau was relatively higher. This is contrary to the results of work done by Huxman et al. [14] but consistent with the results of research conducted by McNaughton [47] and Bai et al. [13]. The spatial distribution pattern found on the Changtang Plateau differs from research in the middle of North America done by Paruelo et al. [9] and the results (unimodal distribution) on the Qinghai–Tibetan Plateau conducted by Yang et al. [26]. However, our results are generally consistent with those found on the Qinghai–Tibetan Plateau by Qiu et al. [24]. The different research scales and rainfall intervals in precipitation gradients may have an impact on the consistency of the results [13]. Paruelo et al. [9] and Yang et al. [26] did not analyze regions with precipitation of less than 200 mm. Bai et al. [13] and Hu et al. [15] showed that RUE increased with higher MAP. Hu et al. [15] even discovered that RUE experienced a slight increase at the most arid part of the region. However, their research did not include regions with MAP of more than 600 mm. The variation range of RUE is different at a global scale, ecosystem scale, or regional scale. For example, the global research done by Paruelo et al. [9] showed the mean value of RUE was 0.64 g·m−2·mm−1. The ranges in RUE for global arid and semiarid ecosystems was 0.05–1.81 g·m−2·mm−1 [27]. However, the RUE ranged from 0.13 to 0.64 g·m−2·mm−1 along the Inner Mongolia–Qinghai–Tibet Plateau grassland of China [15].
Many researchers have shown that spatial changes in RUE are mainly limited by vegetation life history (self-limitation) and biogeochemical limitations [7,9,14]. The evolutional history and ecological properties of species in the grassland community determine whether species can resist different survival pressures through a series of trade-offs between functional traits, thus limiting the rate of growth and its impact on potential productivity [48]. However, biogeochemical limitations change the relative importance of different limiting resources due to the interaction of climate and biogeochemical conditions, thus impacting the potential productivity of vegetation [14,49]. The RUE of vegetation in the extremely arid region of the Changtang Plateau was mainly constrained by self-limitation. The plants maintained higher water use efficiency (WUE) through a series of trade-offs between functional traits to strengthen competition for water in drought conditions, thus reducing the impact of the water stress [48,50]. For example, from the research on Artemisia ordosica in the Mu Us Sandlands and the northern sandlands of the Qinghai–Tibetan Plateau, Wei et al. [51] discovered that the unit mass leaf nitrogen content (Nmass) of A. ordosica increased, while the specific leaf area (SLA) experienced no marked change as precipitation decreased, resulting in higher Nmass and leaf nitrogen content per unitarea (Narea) under the same SLA in regions that experienced lower precipitation. A. ordosica had a similar WUE compared to regions with high precipitation. Research on the precipitation gradient of the Qinghai–Tibetan Plateau conducted by Hu et al. [52] found that, under drought conditions, the thickness of Stipapurpurea leaves increased to maintain the same Narea, thus maintaining a similar level of photosynthesis and WUE to plants in a relatively humid region. Our previous studies also showed that dominant species had higher leaf nitrogen inthe western arid end than the eastern semihumid end of the Changtang Plateau [53,54]. The highly effective WUE observed in plants is directly correlated to the growth rate of vegetation, which can result in highly effective WUE in the ecosystem overall [14]. The self-limitation of plants reduces while biogeochemical limitations increase with higher precipitation [32,55]. However, such changes may occur quite slowly in the arid regions of the Changtang Plateau because of the extremely low density of vegetation, diversity of species, potential productivity, and extremely highpotential evapotranspirationand water threat resistance capacity [9]. Some researches indicated that ANPP grew exponentially as the diversity of species increased on the Qinghai–Tibetan Plateau [56]. With low growth in species diversity, ANPP increased slowly or even remained unchanged, while MAP increased [26]. However, RUE decreased continuously. With further reductions to self-limitation of vegetation and weaker biogeochemical limitation, the density of vegetation and diversity of species increased rapidly with an increase in MAP [35], ANPP started to increase greatly [13,28] and RUE rose continuously. However, growing precipitation can contribute to higher humidity levels in the air and higher water content of soil as well as higher levels of leaf stomatal conductance of plants. This, along with stronger evapotranspiration, reduces WUE of vegetation overall [57]. This may explain why the RUE of the humid regions of the Changtang Plateau was still lower than that of the extremely arid regions in our study.
In summary, with the joint effects of vegetation self-limitation and biogeochemical limitation, RUE is highest in the extremely arid region of the Changtang Plateau, decreases continuously with higher MAP, and then increases slowly in regions with higher precipitation in the east. However, ANPP will increase rapidly with further growth in rates of precipitation. Then, as the requirements for nutrients increase continuously and biogeochemical limitations become stronger, a continuous reduction of RUE will be observed [9,13]. RUE showed no strong decreasing trend due to the limited range of the precipitation gradient zone on the Changtang Plateau ( < 100 mm–600 mm). However, the mean RUE of the eastern Tibetan semihumid climate zone was slightly lower than that of the Nagchu–Golok semihumid climate zone, possibly because the biogeochemical limitations started to become greater. For example, results of research on the whole Qinghai–Tibetan Plateau (precipitation range: 90 mm–800 mm) done by Ye et al. [25] showed that RUE experienced a multimodal changing trend as precipitation rates increased. Research done by Mi et al. [23] in alpine meadows (precipitation range: 500 mm–700 mm) also showed that RUE decreased as precipitation increased.

4.2. The Interannual Variation of ANPP and RUE and Its Relationship with Climate Change

There was no significant change in ANPP during 2000–2014 on the Changtang Plateau, with 66% of total grasslands presenting little change, while 34% were significantly increased or decreased. In fact, these are consistent with the findings of Liu et al. [38] and Zhang et al. [58]. The results of Zhang et al. [58] in the eastern part of Changtang Plateau indicated that the annual average NDVI of most alpine grasslands did not present significant variations during 2000–2013, with 77.5% presenting little change, while the remaining 22.50% exhibited a significant variation. Their spatial–temporal patterns were basically consistent with our results. Although the results of Liu et al. [38] showed that the aboveground biomass of the grasslands on Qinghai–Tibetan Plateau increased during 2000–2012, most of them were concentrated in the Qinghai. The changes in Changtang Plateau were not significant, with only a small portion of significantly decreased area. The ANPP of the Changtang Plateau showed remarkable hysteresis in response to the annual change in precipitation [59]. Interannual trend of RUE showed a significantly negative correlation with the spatial distribution of the annual change of precipitation, which is consistent with the results of a number of other studies [7,9,10,17]. First, the legacy effects of precipitation changes may impact the growth of grasslands [30]. The grassland ANPP in any given year was greatly impacted by the ANPP and precipitation of previous years. The drier the previous years were relative to this year, the lower was the ANPP of this year; in contrast, the wetter the previous years were, the higher was the ANPP of this year. Second, species that have a relatively low rate of growth are found throughout extremely arid regions [9], with a trade-off between the relative rate of growth and the drought-enduring ability to enable adaptation to extremely arid environments [60,61], which limits the response of vegetation to changes in precipitation. Therefore, the annual downward trend of the MAP at the extremely arid western end of the Changtang Plateau had no strong impact on the ANPP of grasslands, but RUE showed an increasing trend. The change of plant community structures in the arid or semiarid regions, including the coverage of vegetation, density of vegetation, and species composition, require a long period of time [62,63]. Collins et al. [64] conducted water addition during the growing season in the North American grasslands, which indicated no marked change to the main species of the grassland over a period of 10 years. In the shortgrass grasslands, Evans et al. [65] discovered that extremely arid conditions caused changes to the coverage of the main species on the grassland after four to seven years. In the same ecosystem, the temporal changes of RUE were mainly impacted by the interaction of soil water content and effectiveness of nitrogen [13]. There was no great change in the grassland community over the short-term in regions with growing MAP in the center of the Changtang Plateau. However, soil nutrient limitations may be strengthened at a certain level [32,55]. The increase in annual precipitation had no marked impact on the ANPP of the grassland, while the RUE decreased. Similarly, MAP decreased at the humid eastern end of the Changtang Plateau. However, there was no great change in the grassland community over the short-term, and RUE experienced an increasing trend. The research conducted by Huxman et al. [14] showed that RUE tended to reach a maximum value (RUEmax) in extremely dry years, while RUE deviated from RUEmax in the rainy years. Similarly, RUE may tend toward RUEmax gradually in regions with decreasing MAP in the Changtang Plateau, while RUE decreases from RUEmax in regions with increasing MAP.
RUE mostly experienced a downward trend in regions with greater temperature increases, while it increased in regions with lower temperature increases. Increasing temperatures and ANPP will result in a potential increase of RUE. However, water limitations will be strengthened with rises in temperature, which may offset the positive effects of RUE [26]. The regions where temperature increases rapidly will show less of an increase in photosynthesis and more growth in evapotranspiration, thus causing RUE to decline. The actual change in RUE was effected by the interactions of precipitation and temperature. Climate change had no strong impact on community structure in the short-term. However, with a stronger impact of climate change on the Changtang Plateau expected in the future, fundamental changes will take place in the composition and structure of the grassland community over a long period, and the RUE may then show significant changes. The effectiveness of the water content will change under the influence of climate change. The ANPP of the grasslands will respond to such changes but will exhibit hysteresis. ANPP responses will be strengthened as time passes [30]. The changing temporal patterns of ANPP and RUE in different climate zones were consistent with the general pattern. ANPP increased and RUE decreased in the central climate regions when the precipitation rates increased. ANPP decreased and RUE increased strongly in the climate region at both ends of the Changtang Plateau when precipitation decreased. However, there was no marked difference between the different types of grasslands, indicating that the climate zone was more likely to show temporal and spatial patterns of the ANPP and RUE of grasslands on the Changtang Plateau. In zones of different types of grasslands, there may be an impact of soil conditions and landforms as well as climatic implications [13].

5. Conclusions

The spatial patterns of ANPP along the precipitation gradient on the Changtang Plateau were deeply impacted by precipitation levels. The mean ANPP during 2000–2014 increased progressively from the arid west to the humid east as precipitation increased. There was a consistent trend in different grassland types and climate zones. The self-limitation of the vegetation and biogeochemical limitations impacted the spatial patterns of RUE, which were higher at either ends of the Changtang Plateau, especially in the arid west, while lower in the center. In the different climate zones, the mean RUE of the southern Tibet semiarid climate zone and Ngari arid climate zone was much higher than that of other climate zones. However, the mean RUE of different grassland types was consistently around 0.07–0.09 g·m−2·mm−1. Climate change influenced the patterns of ANPP and RUE in the grasslands. ANPP increased while RUE decreased in the central region of the Changtang Plateau with increasing precipitation, and ANPP decreased while RUE strongly increased at both ends of the region when precipitation decreased. The trend of RUE was highly negatively correlated with changing precipitation. RUE mostly experienced a downward trend in regions with higher temperature increases and an increasing trend in regions with lower temperature increases. Generally, the ANPP of the grasslands on the Changtang Plateau developed consistently with the precipitation gradient, and the spatial and temporal patterns of ANPP and RUE in different climate zones were also consistent with the general pattern. However, there was no evident difference in different grassland types, indicating that climate zones can better reflect the spatial and temporal patterns of ANPP and RUE.

Author Contributions

Conceptualization, G.Z. and P.S.; Methodology, X.Z.; Validation, G.Z., M. L., and P.S.; Formal analysis, G.Z.; Investigation, G.Z., N. Z., and J.W (Jianshuang Wu); Resources, M.L. and P.S.; Data curation, G.Z., N.Z., and J.S.W.(Jingsheng Wang); Writing—original draft, G.Z.; Writing—review & editing, M.L. and P.S.; Supervision, M.L. and P.S.; Project administration, M.L. and P.S.; Funding acquisition, P.S. and M.L.

Funding

This research was co-funded by the National Natural Science Foundation of China, grant number 31870406, 41271067, and the Precision Improvement of Forest Quality research project, grant number 2130219-011.

Acknowledgments

The authors are grateful to the National Earth System Science Data Sharing Infrastructure for data supply and Yunfei Feng and Jiaxing Zufor their help in sample collection.

Conflicts of Interest

The authors declare no conflict of interest.

References

  1. Austin, A.T.; Sala, O.E. Carbon and nitrogen dynamics across a natural precipitation gradient in Patagonia, Argentina. J. Veg. Sci. 2002, 13, 351–360. [Google Scholar] [CrossRef]
  2. Jobbágy, E.G.; Sala, O.E.; Paruelo, J.M. Patterns and controls of primary production in the Patagonian Steppe. Ecology 2002, 83, 307–319. [Google Scholar]
  3. Lauenroth, W. Grassland Primary Production: North American Grasslands in Perspective. In Perspectives in Grassland Ecology; Ecological Studies; Springer: New York, NY, USA, 1979; pp. 3–24. [Google Scholar]
  4. Epstein, H.E.; Burke, I.C.; Lauenroth, W.K. Regional patterns of decomposition and primary production rates in the US Great Plains. Ecology 2002, 83, 320–327. [Google Scholar]
  5. McNaughton, S.J.; Sala, O.E.; Oesterheld, M. Comparative ecology of African and South American arid to subhumid ecosystems. In Biological Relationships between Africa and South America; Yale University Press: New Haven, CN, USA, 1993; pp. 548–567. [Google Scholar]
  6. Scanlon, T.M.; Albertson, J.D.; Caylor, K.K.; Williams, C.A. Determining land surface fractional cover from NDVI and rainfall time series for a savanna ecosystem. Remote Sens. Environ. 2002, 82, 376–388. [Google Scholar] [CrossRef]
  7. Lauenroth, W.K.; Sala, O.E. Long-Term Forage Production of North American Shortgrass Steppe. Ecol. Appl. 1992, 2, 397–403. [Google Scholar] [CrossRef] [PubMed]
  8. Paruelo, J.M.; Epstein, H.E.; Lauenroth, W.K.; Burke, I.C. ANPP Estimates from NDVI for the Central Grassland Region of the United States. Ecology 1997, 78, 953–958. [Google Scholar] [CrossRef]
  9. Paruelo, J.M.; Lauenroth, W.K.; Burke, I.C.; Sala, O.E. Grassland precipitation-use efficiency varies across a resource gradient. Ecosystems 1999, 2, 64–68. [Google Scholar] [CrossRef]
  10. Briggs, J.M.; Knapp, A.K. Interannual variability in primary production in tallgrass prairie: Climate, soil moisture, topographic position, and fire as determinants of aboveground biomass. Am. J. Bot. 1995, 82, 1024–1030. [Google Scholar] [CrossRef]
  11. Fabricante, I.; Oesterheld, M.; Paruelo, J.M. Annual and seasonal variation of NDVI explained by current and previous precipitation across Northern Patagonia. J. Arid Environ. 2009, 73, 745–753. [Google Scholar] [CrossRef]
  12. Fang, J.; Piao, S.; Tang, Z.; Peng, C.; Ji, W. Interannual Variability in Net Primary Production and Precipitation. Science 2001, 293, 1723. [Google Scholar] [CrossRef]
  13. Bai, Y.; Wu, J.; Xing, Q.; Pan, Q.M.; Huang, J.H.; Yang, D.L.; Han, X.G. Primary production and rain use efficiency across a precipitation gradient on the Mongolia Plateau. Ecology 2008, 89, 2140–2153. [Google Scholar] [CrossRef] [PubMed]
  14. Huxman, T.E.; Smith, M.D.; Fay, P.A.; Knapp, A.K.; Shaw, M.R.; Loik, M.E.; Smith, S.D.; Tissue, D.T.; Zak, J.C.; Weltzi, J.F.; et al. Convergence across biomes to a common rain-use efficiency. Nature 2004, 429, 651–654. [Google Scholar] [CrossRef] [PubMed]
  15. Hu, Z.; Yu, G.R.; Fan, J.W.; Zhong, H.P.; Wang, S.Q.; Li, S.G. Precipitation-use efficiency along a 4500-km grassland transect. Glob. Ecol. Biogeogr. 2010, 19, 842–851. [Google Scholar]
  16. Le Houérou, H.N. Rain use efficiency: A unifying concept in arid-land ecology. J. Arid Environ. 1984, 7, 213–247. [Google Scholar]
  17. Lauenroth, W.K.; Burke, I.C.; Paruelo, J.M. Patterns of Production and Precipitation-Use Efficiency of Winter Wheat and Native Grasslands in the Central Great Plains of the United States. Ecosystems 2000, 3, 344–351. [Google Scholar] [CrossRef]
  18. Angert, A.; Biraud, S.; Bonfils, C.; Henning, C.C.; Buermann, W.; Pinzon, J.; Tucker, C.J.; Fung, I. Drier summers cancel out the CO2 uptake enhancement induced by warmer springs. Proc. Natl. Acad. Sci. USA 2005, 102, 10823–10827. [Google Scholar] [CrossRef] [PubMed]
  19. Easterling, D.R.; Meehl, G.A.; Parmesan, C.; Changnon, S.A.; Karl, T.R.; Mearns, L.O. Climate extremes: Observations, modeling, and impacts. Science 2000, 289, 2068–2074. [Google Scholar] [CrossRef]
  20. Knapp, A.K.; Fay, P.A.; Blair, J.M.; Collins, S.L.; Smith, M.D.; Carlisle, J.D.; Harper, C.W.; Danner, B.T.; Lett, M.S.; McCarron, J.K. Rainfall Variability, Carbon Cycling, and Plant Species Diversity in a Mesic Grassland. Science 2002, 298, 2202–2205. [Google Scholar] [CrossRef]
  21. Kato, T.; Tang, Y.H.; Gu, S.; Cui, X.Y.; Hirota, M.; Du, M.Y.; Li, Y.N.; Zhao, X.Q.; Oikawa, T. Carbon dioxide exchange between the atmosphere and an alpine meadow ecosystem on the Qinghai–Tibetan Plateau, China. Agric. For. Meteorol. 2004, 124, 121–134. [Google Scholar] [CrossRef]
  22. Piao, S.; Fang, J.; He, J. Variations in vegetation net primary production in the Qinghai-Xizang Plateau, China, from 1982 to 1999. Clim. Chang. 2006, 74, 253–267. [Google Scholar] [CrossRef]
  23. Mi, Z.; Chen, L.; Zhang, Z.; He, J. Alpine grassland water use efficiency based on annual precipitation, growing season precipitation and growing season evapotranspiration. Chin. J. Plant. Ecol. 2015, 39, 649–660. [Google Scholar]
  24. Qiu, J.; Zhang, H.; Shen, W. Spatial characteristics of precipitation use efficiency on the Qinghai-Tibet Plateau from 1982 to 2007. Nat. Sci. 2014, 53, 126–133. [Google Scholar]
  25. Ye, H.; Wang, J.; Huang, M.; Qi, S. Spatial pattern of vegetation precipitation use efficiency and its response to precipitation and temperature on the Qinghai-Xizang Plateau of China. Chin. J. Plant. Ecol. 2012, 36, 1237–1247. [Google Scholar] [CrossRef]
  26. Yang, Y.; Fang, J.; Fay, P.A.; Bell, J.E.; Ji, C. Rain use efficiency across a precipitation gradient on the Tibetan Plateau. Geophys. Res. Lett. 2010, 37, L15702. [Google Scholar] [CrossRef]
  27. Le Houérou, H.N.; Bingham, R.L.; Skerbek, W. Relationship between the variability of primary production and the variability of annual precipitation in world arid lands. J. Arid Environ. 1988, 15, 1–18. [Google Scholar]
  28. Hector, A.; Schmid, B.; Beierkuhnlein, C.; Caldeira, M.C.; Diemer, M.; Dimitrakopoulos, P.G.; Finn, J.A.; Freitas, H.; Giller, P.S.; Good, J.; et al. Plant Diversity and Productivity Experiments in European Grasslands. Science 1999, 286, 1123–1127. [Google Scholar] [CrossRef] [PubMed]
  29. Tilman, D. The Influence of Functional Diversity and Composition on Ecosystem Processes. Science 1997, 277, 1300–1302. [Google Scholar] [CrossRef]
  30. Sala, O.E.; Gherardi, L.A.; Reichmann, L.; Jobbágy, E.; Peters, D. Legacies of precipitation fluctuations on primary production: Theory and data synthesis. Philos. Trans. R. Soc. Lond. Ser. B Biol. Sci. 2012, 367, 3135–3144. [Google Scholar] [CrossRef]
  31. Jobbágy, E.G.; Paruelo, J.M.; León, R.J.C. Vegetation heterogeneity and diversity in flat and mountain landscapes of Patagonia (Argentina). J. Veg. Sci. 1996, 7, 599–608. [Google Scholar]
  32. Knapp, A.K.; Smith, M.D. Variation Among Biomes in Temporal Dynamics of Aboveground Primary Production. Science 2001, 291, 481–484. [Google Scholar] [CrossRef]
  33. Li, M. Soil characteristics and use of the Changtang Plateau. Nat. Resour. 1980, 4, 60–69. [Google Scholar]
  34. Li, M. Rational exploitation of grassland resources in the Northern Xizang Plateau. J. Nat. Resour. 2000, 15, 335–339. [Google Scholar]
  35. Wu, J.; Shen, Z.; Zhang, X. Precipitation and species composition primarily determine the diversity–productivity relationship of alpine grasslands on the Northern Tibetan Plateau. Alpine Bot. 2014, 124, 13–25. [Google Scholar] [CrossRef]
  36. Bella, C.M.D.; Negri, I.J.; Posse, G.; Jaimes, F.R.; Jobbágy, E.G.; Garbulsky, M.F.; Deregibus, V.A. Forage Production of the Argentine Pampa Region Based on Land Use and Long-Term Normalized Difference Vegetation Index Data. Rangel. Ecol. Manag. 2009, 62, 163–170. [Google Scholar] [CrossRef]
  37. Jiao, C.; Yu, G.R.; Ge, J.P.; Chen, X.; Zhang, C.; He, N.P.; Chen, Z.; Hu, Z.M. Analysis of spatial and temporal patterns of aboveground net primary productivity in the Eurasian steppe region from 1982 to 2013. Ecol. Evol. 2017, 7, 5149–5162. [Google Scholar] [CrossRef] [PubMed]
  38. Liu, S.; Cheng, F.; Dong, S.; Zhao, H.; Hou, X.; Wu, X. Spatiotemporal dynamics of grassland aboveground biomass on the Qinghai-Tibet Plateau based on validated MODIS NDVI. Sci. Rep. 2017, 7, 4182. [Google Scholar] [CrossRef] [PubMed]
  39. Yu, H.; Luedeling, E.; Chapin, J.X.S. Winter and spring warming result in delayed spring phenology on the Tibetan Plateau. Proc. Natl. Acad. Sci. USA 2010, 107, 22151–22156. [Google Scholar] [CrossRef]
  40. Ding, M.; Zhang, Y.L.; Sun, X.M.; Liu, L.S.; Wang, Z.F.; Bai, W.Q. Spatiotemporal variation in alpine grassland phenology in the Qinghai-Tibetan Plateau from 1999 to 2009. Chin. Sci. Bull. 2013, 58, 396–405. [Google Scholar] [CrossRef]
  41. Zhang, G.; Zhang, Y.J.; Dong, J.W.; Xiao, X.M. Green-up dates in the Tibetan Plateau have continuously advanced from 1982 to 2011. Proc. Natl. Acad. Sci. USA 2013, 110, 4309–4314. [Google Scholar] [CrossRef] [PubMed]
  42. Shen, M.; Piao, S.L.; Cong, N.; Zhang, G.X.; Jassens, I.A. Precipitation impacts on vegetation spring phenology on the Tibetan Plateau. Glob. Chang. Biol. 2015, 21, 3647–3656. [Google Scholar] [CrossRef] [PubMed]
  43. Sellers, P.J.; Berry, J.A.; Collatz, G.J.; Field, C.B.; Hall, F.G. Canopy reflectance, photosynthesis, and transpiration. III. A reanalysis using improved leaf models and a new canopy integration scheme. Remote Sens. Environ. 1992, 42, 187–216. [Google Scholar] [CrossRef]
  44. Paruelo, J.M.; Burke, I.C.; Lauenroth, W.K. Land-use impact on ecosystem functioning in eastern Colorado, USA. Glob. Chang. Biol. 2010, 7, 631–639. [Google Scholar]
  45. Didan, K. MOD13Q1 MODIS/Terra Vegetation Indices 16-Day L3 Global 250m SIN Grid V006. NASA EOSDIS LP DAAC 2015. [Google Scholar] [CrossRef]
  46. Running, S.; Mu, Q.; Zhao, M. MOD17A3H MODIS/Terra Net Primary Production Yearly L4 Global 500m SIN Grid V006. NASA EOSDIS Land Processes DAAC 2015. [Google Scholar] [CrossRef]
  47. McNaughton, S.J. Ecology of a Grazing Ecosystem: The Serengeti. Ecol. Monogr. 1985, 55, 259–294. [Google Scholar] [CrossRef]
  48. Grime, J.P. Evidence for the Existence of Three Primary Strategies in Plants and Its Relevance to Ecological and Evolutionary Theory. Am. Nat. 1977, 111, 1169. [Google Scholar] [CrossRef]
  49. Epstein, H.E.; Paruelo, J.M.; Pineiro, G.; Burke, I.C.; Lauenroth, W.K.; Barrett, J.E. Interactions of water and nitrogen on primary productivity across spatial and temporal scales in grassland and shrubland ecosystems. In Dryland Ecohydrology; Springer: Dordrecht, The Netherlands, 2006; pp. 201–216. [Google Scholar]
  50. Ogaya, R.; Peñuelas, J. Comparative field study of Quercus ilex and Phillyrea latifolia: Photosynthetic response to experimental drought conditions. Environ. Exp. Bot. 2003, 50, 137–148. [Google Scholar] [CrossRef]
  51. Wei, H.; Wu, B.; Yang, W.; Luo, T. Low rainfall-induced shift in leaf trait relationship within species along a semi-arid sandy land transect in northern China. Plant. Biol. 2011, 13, 85–92. [Google Scholar] [CrossRef] [PubMed]
  52. Hu, M.; Zhang, L.; Luo, T.; Shen, W. Variations in leaf functional traits of Stipa purpurea along a rainfall gradient in Xizang, China. Chin. J. Plant. Ecol. 2012, 36, 136–143. [Google Scholar] [CrossRef]
  53. Zhao, G.S.; Xiong, D.P.; Shi, P.L.; Feng, Y.F.; Wu, J.S.; Zhang, X.Z.; Zeng, Z.X. Leaf nitrogen resorption efficiency of Stipapurpurea and its determinants along aprecipitation gradient on the Changtang Plateau. Acta Ecol. Sinica 2016, 36, 3419–3428. [Google Scholar]
  54. Zhao, G.; Shi, P.; Wu, J.; Xiong, D.; Zong, N.; Zhang, X. Foliar nutrient resorption patterns of four functional plants along a precipitation gradient on the Tibetan Changtang Plateau. Ecol. Evol. 2017, 7, 7201–7212. [Google Scholar] [CrossRef] [PubMed]
  55. Veron, S.R.; Paruelo, J.M.; Sala, O.E.; Lauenroth, W.K. Environmental Controls of Primary Production in Agricultural Systems of the Argentine Pampas. Ecosystems 2002, 5, 625–635. [Google Scholar] [CrossRef]
  56. Yang, Y.H.; Rao, S.; Hu, H.F.; Chen, A.P.; Ji, C.J.; Zhu, B.; Zuo, W.Y.; Li, X.R.; Shen, H.H.; Wang, Z.H.; Tang, Y.H.; Fang, J.Y. Plant species richness of alpine grasslands in relation to environmental factors and biomass on the Tibetan Plateau. Biodivers. Sci. 2004, 12, 200–205. [Google Scholar]
  57. Farquhar, G.; O’Leary, M.; Berry, J. On the Relationship Between Carbon Isotope Discrimination and the Intercellular Carbon Dioxide Concentration in Leaves. Funct. Plant. Biol. 1982, 9, 121–137. [Google Scholar] [CrossRef]
  58. Zhang, X.; Lu, X.; Wang, X. Spatial-Temporal NDVI Variation of Different Alpine Grassland Classes and Groups in Northern Tibet from 2000 to 2013. Mount. Res. Dev. 2015, 35, 254–263. [Google Scholar] [CrossRef]
  59. Peters, D.P.C.; Yao, J.; Sala, O.E.; Anderson, J.P. Directional climate change and potential reversal of desertification in arid and semiarid ecosystems. Glob. Chang. Biol. 2012, 18, 151–163. [Google Scholar] [CrossRef]
  60. Grime, J.; Thompson, K.; Hunt, R.; Hodgson, J.G.; Cornelissen, J.H.C.; Rorison, I.H.; Hendry, G.A.F.; Ashenden, T.W.; Askew, A.P.; Band, S.R.; et al. Integrated Screening Validates Primary Axes of Specialisation in Plants. Oikos 1997, 79, 259–281. [Google Scholar] [CrossRef]
  61. Keddy, P.A. A Pragmatic Approach to Functional Ecology. Funct. Ecol. 1992, 6, 621–626. [Google Scholar] [CrossRef]
  62. Aguiar, M.R.; Sala, O.E. Competition, facilitation, seed distribution and the origin of patches in a Patagonian Steppe. Oikos 1994, 70, 26–34. [Google Scholar] [CrossRef]
  63. Lauenroth, W.K.; Sala, O.E.; Coffin, D.P.; Kirchner, B.T. The importance of soil water in the recruitment of Bouteloua gracilis in the shortgrass steppe. Ecol. Appl. 1994, 4, 741–749. [Google Scholar] [CrossRef]
  64. Collins, S.L.; Koerner, S.E.; Plaut, J.A.; Okie, J.G.; Brese, D.; Calabrese, L.B.; Carvajal, A.; Evansen, R.J.; Nonaka, E. Stability of tallgrass prairie during a 19-year increase in growing season precipitation. Funct. Ecol. 2012, 26, 1450–1459. [Google Scholar] [CrossRef]
  65. Evans, S.E.; Byrne, K.M.; Lauenroth, W.K.; Burke, I.C. Defining the limit to resistance in a drought-tolerant grassland: Long-term severe drought significantly reduces the dominant species and increases ruderals. J. Ecol. 2011, 99, 1500–1507. [Google Scholar] [CrossRef]
Figure 1. Geographic location, grassland types, and climate zones of the study area.
Remotesensing 11 00325 g001
Figure 2. Regression relationship between (a) measured aboveground net primary productivity (ANPP) and normalized differential vegetation index integral (NDVI-I); (b) measured ANPP and MAP, (c) rain-use efficiency (RUE) and MAP for alpine grasslands along a precipitation gradient on the Changtang Plateau in 2013.
Remotesensing 11 00325 g002
Figure 3. (a) Spatial and (b) temporal patterns of ANPP on the Changtang Plateau.
Remotesensing 11 00325 g003
Figure 4. (a) Spatial and (b) temporal patterns of RUE on the Changtang Plateau.
Remotesensing 11 00325 g004
Figure 5. Relationships between interannual variability of (a) ANPP and rainfall, (b) RUE and rainfall, (c) ANPP and temperature, (d) RUE and temperature on the Changtang Plateau.
Remotesensing 11 00325 g005
Table 1. The main grassland types on the Changtang Plateau.
Grassland TypeDominant SpeciesLife Forms
Alpine meadowKobresiapygmaea, K. humilis, and Carexmoorcroftiiperennial herb
Alpine meadow steppe Kobresiapygmaea, Carexmoorcroftii, and Stipapurpureaperennial herb
Alpine steppeS. purpurea, S. capillacea, and S. subsessiliflora var. basiplumosaperennial herb
Alpine desert steppeS. purpurea, S. glareosa, and Ceratoideslatensperennial herb, subshrub
Alpine desertCeratoideslatens and Ajaniafruticolosasubshrub
Table 2. The main climate zones on the Changtang Plateau.
Climate ZoneMean Annual Precipitation (MAP, mm)Average Temperature in August (℃)
Eastern Tibetan semihumid60013–16
Nagchu and Golok semihumid400–7008–10
Southern Tibetan semiarid 40010–15
Changtang semiarid 100–3006–10
Kunlun arid 100 < 6
Ngari arid 50–10010–12
Table 3. The correlation coefficient matrix between in-situ ANPP, calculated NDVI-I, Moderate Resolution Imaging Spectroradiometer net primary production (MODIS NPP), and MAP.
NDVI-IIn-situ ANPPMODIS NPPMAP
NDVI-I10.90 **0.98 **0.87 **
In-situ ANPP 10.84 **0.79 **
MODIS NPP 10.84 **
MAP 1
** represent significant correlation (p < 0.01).
Table 4. Spatial and temporal patterns of ANPP in different grassland types and climate zones on the Changtang Plateau. SD: standard deviation.
RegionANPP ± SD (g·m−2)ANPP Slope ± SD (g·m−2·year−1)Uptrend (p < 0.05) (%)Downtrend (p < 0.05) (%)
Grassland typeAlpine meadow38.79 ± 19.830.06 ± 1.499.03 (2.93)8.59 (2.95)
Alpine meadow steppe 25.79 ± 11.090.02 ± 0.855.15 (1.76)4.36 (1.43)
Alpine steppe15.75 ± 6.780.01 ± 0.5825.2 (8.49)21.39 (6.97)
Alpine desert steppe9.88 ± 5.280.03 ± 0.4610.27 (3.5)7.6 (2.34)
Alpine desert8.1 ± 4.630.05 ± 0.475.2 (1.83)3.2 (0.94)
Climate zoneEastern Tibetan semihumid44.62 ± 27.650.23 ± 2.371.79 (0.56)1.39 (0.46)
Nagchu and Golok semihumid44.07 ± 17.3−0.02 ± 1.423.54 (1.18)3.75 (1.31)
Southern Tibetan semiarid 24.29 ± 18.96−0.02 ± 1.282.18 (0.7)2.58 ( 0.91)
Changtang semiarid 17.11 ± 9.260.02 ± 0.6633.55 (11.5)26.66 (8.56)
Kunlun arid 6.64 ± 3.650.07 ± 0.47.5 (2.63)3.94 (1.03)
Ngari arid 10.75 ± 5.98−0.01 ± 0.576.39 (2.11)6.73 (2.33)
Table 5. Spatial and temporal patterns of RUE for different grass types and climate zones on the Changtang Plateau. SD: standard deviation.
RegionRUE ± SD (g·m−2·mm−1)RUE Slope ± SD (10−2g·m−2·mm−1·year−1)Uptrend (p < 0.05) (%)Downtrend (p < 0.05) (%)
Grassland typeAlpine meadow0.08 ± 0.040.14 ± 0.1914.66 (6.57)2.96 (0.12)
Alpine meadow steppe 0.07 ± 0.030.03 ± 0.165.18 (1.97)4.33 (0.74)
Alpine steppe0.08 ± 0.050 ± 0.2218.29 (1.69)28.31 (6.36)
Alpine desert steppe0.09 ± 0.070.03 ± 0.347.92 (0.49)9.95(0.69)
Alpine desert0.07 ± 0.060.02 ± 0.283.45 (0.24)4.95 (0.32)
Climate zoneEastern Tibetan semihumid0.07 ± 0.040.2 ± 0.182.74 (1.63)0.44 (0)
Nagchu and Golok semihumid0.08 ± 0.030.12 ± 0.136.23 (2.32)1.05 (0.02)
Southern Tibetan semiarid 0.1 ± 0.060.08 ± 0.342.82 (1.42)1.92 (0.17)
Changtang semiarid 0.07 ± 0.03−0.01 ± 0.1824.77 (4.48)35.49 (7.26)
Kunlun arid 0.06 ± 0.04−0.01 ± 0.194.74 (0.25)6.7 (0.2)
Ngari arid 0.15 ± 0.080.17 ± 0.488.78 (0.59)4.33 (0.14)
Table 6. Average interannual variability of rainfall and temperature for different grassland types and climate zones on the Changtang Plateau.
RegionMAP (mm·year−1)Uptrend (p < 0.05) (%)Downtrend (p < 0.05) (%)MAT (°C·year−1)Uptrend (p < 0.05) (%)Downtrend (p < 0.05) (%)
Grassland typeAlpine meadow−8.54 ± 5.861 (0.03)16.75 (9.85)0.13 ± 0.0317.39 (17.09)0.34 (0)
Alpine meadow steppe −1.04 ± 5.894.78 (1.34)4.40 (1.79)0.14 ± 0.019.19 (9.19)0
Alpine steppe2.12 ± 3.7926.65 (12.68)19.22 (0.27)0.13 ± 0.0445.24 (38.79)0.64 (0)
Alpine desert steppe1.42 ± 3.489.28 (0.93)9.07 (0.02)0.09 ± 0.0616.38 (9.95)1.97 (0)
Alpine desert2.3 ± 2.985.92 (0.21)2.93 (0)0.1 ± 0.038.61 (4.00)0.24 (0)
Climate zoneEastern Tibetan Semihumid−14.78 ± 2.1903.43 (3.43)0.12 ± 0.013.43 (3.43)0
Nagchu and Golok Semihumid−7.92 ± 3.8406.82 (3.37)0.13 ± 0.016.83 (6.83)0
Southern Tibetan Semiarid −6.19 ± 7.890.86 (0)4.15 (1.89)0.12 ± 0.034.99 (3.59)0
Changtang Semiarid 1.8 ± 4.736.18 (13.80)21.89 (3.07)0.14 ± 0.0258.18 (55.10)0
Kunlun arid 2.12 ± 2.298.85 (0)3.92 (0)0.1 ± 0.0212.80 (5.21)0
Ngari arid−1.75 ± 1.330.9 (0)13.01 (0.11)0.04 ± 0.059.89 (0.74)3.88 (0)

