Letter

Sinking Tide Gauge Revealed by Space-borne InSAR: Implications for Sea Level Acceleration at Pohang, South Korea

1
School of Earth and Environmental Sciences, Seoul National University, Seoul 08826, Korea
2
Jet Propulsion Laboratory, California Institute of Technology, Pasadena, CA 91125, USA
3
Industrial Technology Center, UST21, Incheon 21999, Korea
4
Ocean Research Division, Korea Hydrographic and Oceanographic Agency, Busan 49111, Korea
*
Author to whom correspondence should be addressed.
Remote Sens. 2019, 11(3), 277; https://doi.org/10.3390/rs11030277
Submission received: 31 December 2018 / Revised: 28 January 2019 / Accepted: 29 January 2019 / Published: 31 January 2019
(This article belongs to the Section Ocean Remote Sensing)

Abstract

:
Vertical land motion at tide gauges influences sea level rise acceleration; this must be addressed for interpreting reliable sea level projections. In recent years, tide gauge records for the Eastern coast of Korea have revealed rapid increases in sea level rise compared with the global mean. Pohang Tide Gauge Station has shown a +3.1 cm/year sea level rise since 2013. This study aims to estimate the vertical land motion that influences relative sea level rise observations at Pohang by applying a multi-track Persistent Scatter Interferometric Synthetic Aperture Radar (PS-InSAR) time-series analysis to Sentinel-1 SAR data acquired during 2015–2017. The results, which were obtained at a high spatial resolution (10 m), indicate vertical ground motion of −2.55 cm/year at the Pohang Tide Gauge Station; this was validated by data from a collocated global positioning system (GPS) station. The subtraction of InSAR-derived subsidence rates from sea level rise at the Pohang Tide Gauge Station is 6 mm/year; thus, vertical land motion significantly dominates the sea level acceleration. Natural hazards related to the sea level rise are primarily assessed by relative sea level changes obtained from tide gauges; therefore, tide gauge records should be reviewed for rapid vertical land motion along the vulnerable coastal areas.

Graphical Abstract

1. Introduction

Sea level rise (SLR) is a global phenomenon that threatens low-lying coasts and islands [1]. Global climate change and anthropogenic activities are considered vital factors for global and regional sea level rise [2]. Until now, long-term global mean sea level rise and regional sea level rise have mainly been estimated using sea level measurements provided by tide gauges (TG) installed around the world [3,4]. Tide gauges provide multi-decadal local sea level records of historical sea level variations which are utilized to project future sea level rise [5]. The spatial and temporal variations of the tide gauges are used to investigate rapid sea level accelerations and the potential impacts on coastal areas [6,7,8]. In addition, tide gauges are often utilized to calibrate and validate the sea level estimates from satellite altimeters. Since the early 1990s, satellite altimeters such as TOPEX/Poseidon and Jason-1, 2, and 3 have been employed in global mean sea level studies (GMSL) and are used to evaluate the model projections of SLR [9,10,11,12]. In addition to the T/P and Jason satellites, the successors of these kinds of satellites, such as ERS-1 & 2, SARAL/Altika, Cryosat, HY-2A, and Sentinel-3 a/b have provided global and regional sea level records for the past 25 years that allow us to detect spatiotemporal variations [13]. These long-term altimeter records are calibrated with the tide gauges to provide accurate sea level records. However, oftentimes, inconsistencies between tide gauge records among neighboring tide gauge stations arise from coastal processes, climate variability, tectonics, and subsidence effects [6,7]. In particular, in delta regions or basins, the relative sea level is often dominated by subsidence due to both long-term glacial isostatic adjustments (GIA) and recent compaction of deltaic sediments due to natural and anthropogenic processes. Anthropogenic subsidence caused by groundwater pumping, oil/gas extraction, and sediment loading also perturbs the sea level records. As tide gauges measure relative SLR with reference to a tidal benchmark grounded on the adjacent coast, even minor ground motions will significantly affect sea level height measurements. Previous studies have reported on vulnerable sites for coastal subsidence and short-term sea level rise, including Hampton Roads, Virginia [14], New York City [15], Taiwan [16], and North Carolina [17]. Hence, the estimation and correction of the local ground motion at and around the tide gauges is important to minimize uncertainties in the local and global sea level changes observed [18,19,20,21,22,23]. In recent decades, long-term glacial adjustments were quantified using historical variations and climate models for the reconstruction of sea level records [24,25]. However, for vertical ground motion at tide gauge sites, few attempts have been made to attribute the dominance of the local subsidence rate, as tide gauges around the world are not always equipped with global positioning system (GPS) instruments [26,27].
According to the Korea Hydrographic and Oceanographic Agency’s report (KHOA), the mean SLR along the entire coast of Korea during 1971–2010 was 2.48 mm/year, which is greater than the global mean SLR (i.e., 2 ± 0.3 mm/year) [28]. The South Korean peninsula is located in the Southeastern part of Asia; several tide gauge stations along the coast continuously record sea level changes (Figure 1). Among these stations, Pohang, Ulsan, Mokpo, Busan, and Mukho have been recording for more than 50 years [29]. A number of tide gauge stations on the East coast of Korea have shown inconsistent relative SLR in recent years [28,29]. Among them, the Pohang Tide Gauge Station has observed the highest relative SLR since the year 2010. The Pohang Tide Gauge Station is located along the breakwater structure at Guhang Port, Pohang (Figure 1). It is thought that the Pohang tide gauge is considerably impacted by surface displacements, which may influence sea level records.
Some tide gauge sites use GPS to measure reliable absolute ground motion in the geocentric reference frame [8,30]. However, although this approach is widely accepted, very few tide gauges are equipped with permanent GPS stations. Recently, other approaches have been presented to estimate vertical land motion using short-term satellite altimetry data and long-term sea level change patterns recorded by tide gauges [19,31]. Consequently, the use of space-borne interferometric Synthetic Aperture Radar (InSAR) techniques has gained importance in recent years [20]. InSAR techniques are widely accepted to estimate Earth’s surface displacements [32]. Time-series InSAR analysis methods can estimate relative displacements at mm-level accuracy; for example, Persistent Scatter Interferometry (PSI) [33,34] and Small Baseline Subset (SBAS) [35]. Unlike GPS, which measures precise vertical displacement at specific locations in the geocentric frame, time-series InSAR estimates relative displacements with high spatial and temporal resolution. Wöppelmann, et al. [36] explored the predominance of line-of-sight (LOS) land motion on sea level change in coastal areas using the PS-InSAR technique. However, there remains a need to estimate precise vertical and horizontal ground motion at tide gauges to apply corrections to the measured sea level changes.
In this study, we aimed to estimate vertical land motion at the Pohang Tide Gauge Station by incorporating a multi-track PS-InSAR time-series analysis in order to evaluate the driver for the overestimated sea level rise. The reliability of the vertical velocity was validated against GPS observations collocated at the tide gauge station. The results confirm that vertical land motion at the tide gauge station significantly influences the observed sea level changes. The difference between the rate of vertical ground motion and sea level rise is used to reconstruct a corrected rate of sea level rise since 2013.

2. Study Area

The Pohang Tide Gauge Station is located on the Southeastern coast of the Korean peninsula, in the Pohang Basin (Figure 1). The coastline borders the East Sea, a marginal sea between the Korean peninsula, Japan, and Russia. The Pohang Basin has witnessed extensive land reclamation over past years, as the city is one of the economic zones of Korea. In particular, the Guhang Port area, where the tide gauge is grounded, is built on the reclaimed land of the Hyongsan River. The Pohang Tide Gauge Station has measured sea level records continuously from 1977–2018 (KHOA). Based on the Intergovernmental Panel on Climate Change Fourth Assessment Report (IPCC AR4), Pohang has shown increasing trends of extreme precipitation; however, its relationship with low-frequency climate events such as the El Niño-Southern Oscillation (ENSO) still need to be investigated [37]. Seasonal analysis of long-term meteorological and hydrological variables suggests that the high intensity of precipitation along the East coast is mainly due to typhoons and extreme rain events [38]. In recent years, a permanent GPS station (POHA) has been collocated at the Pohang Tide Gauge Station; it is maintained by KHOA.

3. Methodology: SAR Data Collection and Time-Series PS-InSAR

InSAR is a widely accepted technique for estimating the Earth’s surface displacements at sub-millimeter accuracy and a high spatial resolution [34]. We used 49 SAR scenes in ascending tracks and 42 scenes in descending tracks acquired by the C-band Sentinel-1 A/B from 2015–2017. Sentinel-1 SAR sensors have the ability to cover a large spatial area (i.e., 250 km swath) and have a revisit cycle of 6 days. Details of data acquisition are shown in Table 1.
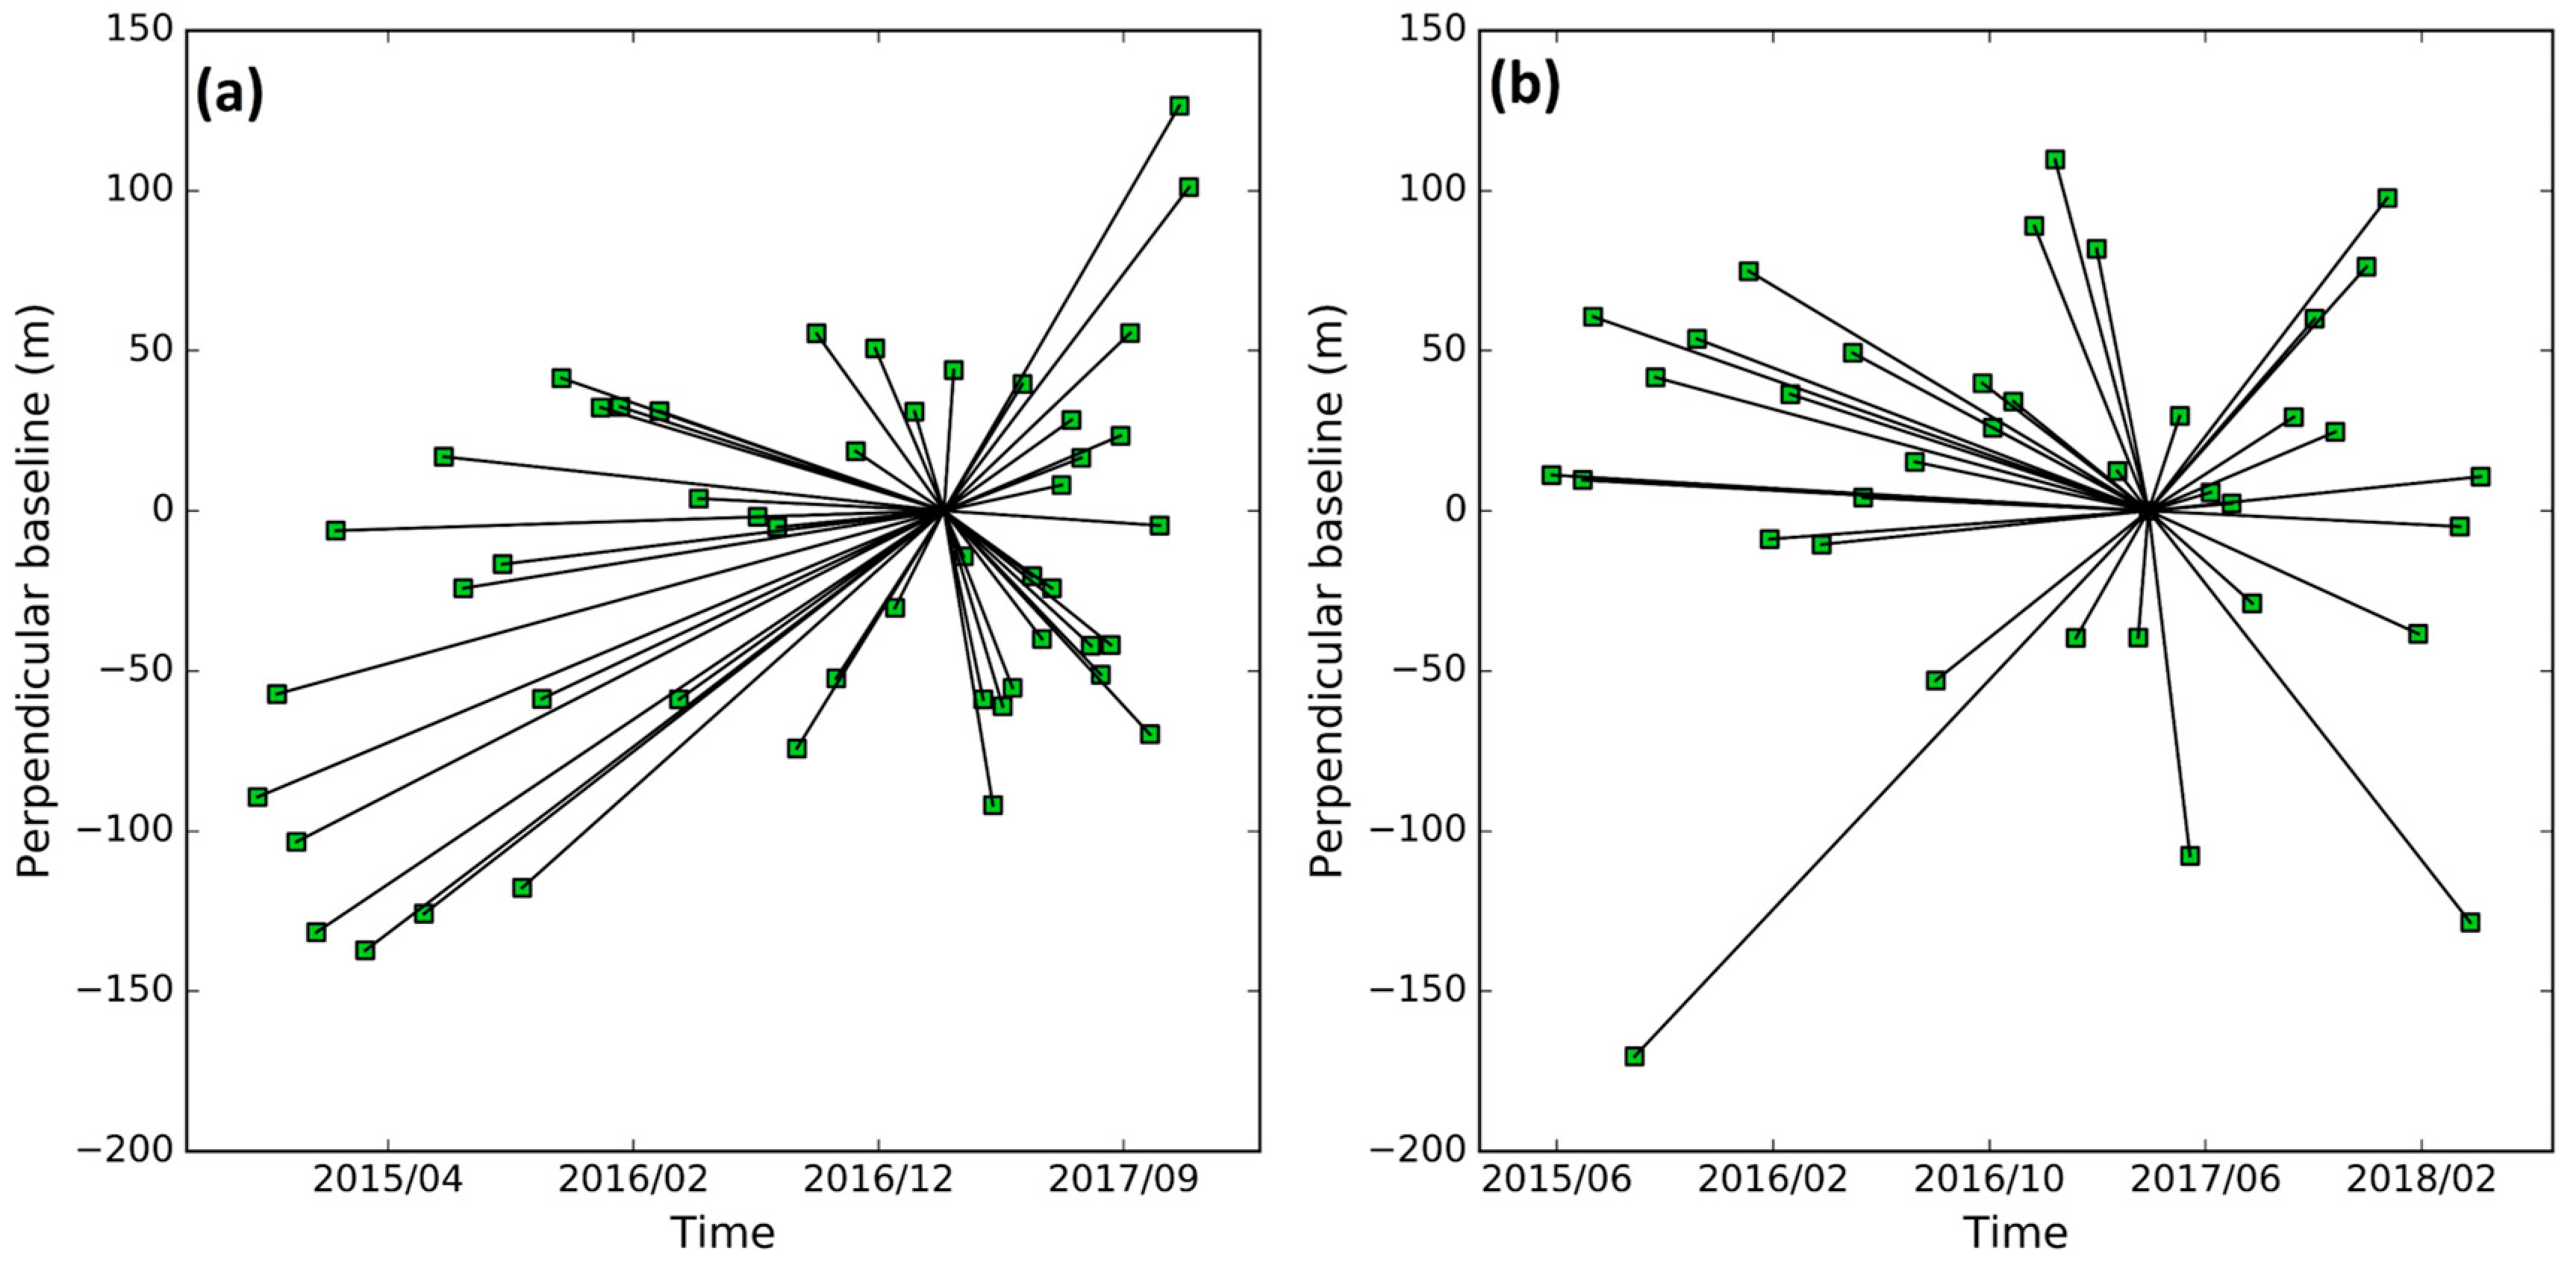
A stack of multi-look interferograms (2 range × 1 Azimuth looks) resulting in a spatial resolution of 10 × 20 m was generated. Sentinel-1 Terrain Observation by Progressive Scans (TOPS) InSAR processing was performed to generate interferograms with a single master scene using the ISCE software [39,40]. SAR scenes acquired on 19 February 2017 and 14 April 2017 were chosen as the master scenes for ascending and descending stacks, respectively. Master scenes were selected based on the minimum perpendicular and temporal baselines, as shown in Figure 2 [41]. A Shuttle Radar Topography Mission (SRTM) Digital Elevation Model (DEM) with 30-m spatial resolution was used to remove the topographic phase effect from the interferometric phase.
Time-series PSI processing was applied using the Stanford Method of Persistent Scatterer (StaMPS) to estimate ground displacement over the study period [34,41]. In this method, initial PS candidates are selected based on the amplitude dispersion index criterion. In this step, if the ratio between the standard deviation and mean amplitude in time is smaller than a threshold value of 0.4, then such pixels are selected as initial PS candidates to form the reference network for further processing. Following that, the phase values of these PS candidates are filtered with neighboring pixels assuming that the deformation, orbital error, and atmospheric artifacts are spatially correlated by bandpass filtering [34]. Then, persistent scatterers are iteratively selected as target pixels found to be phase stable over a period using a measure called temporal coherence. Residual PS candidates having temporal coherence of <0.3 are filtered out at this stage. The resulting PS pixels have minimized spatial and temporal decorrelation noise levels.
The StaMPS PS-InSAR algorithm incorporates advanced time-series processing steps to reduce the decorrelation of noise in the differential interferograms. Furthermore, residual topographic errors that are spatially uncorrelated but correlated with perpendicular baseline information were removed by the least square method before phase unwrapping. The wrapped phase of the PS pixels was unwrapped by 3D (phase in space and time field) unwrapping using the SNAPHU algorithm [42]. The thresholds were carefully selected for filter grid size, and an unwrapped grid size of 5 × 5 was used to control phase unwrapping errors. Spatial filtering was then applied for re-estimation of atmospheric and look-angle errors. Subsequently, the time-series surface displacement rate was estimated with respect to a reference point that presumed a nearly-stable ground location.
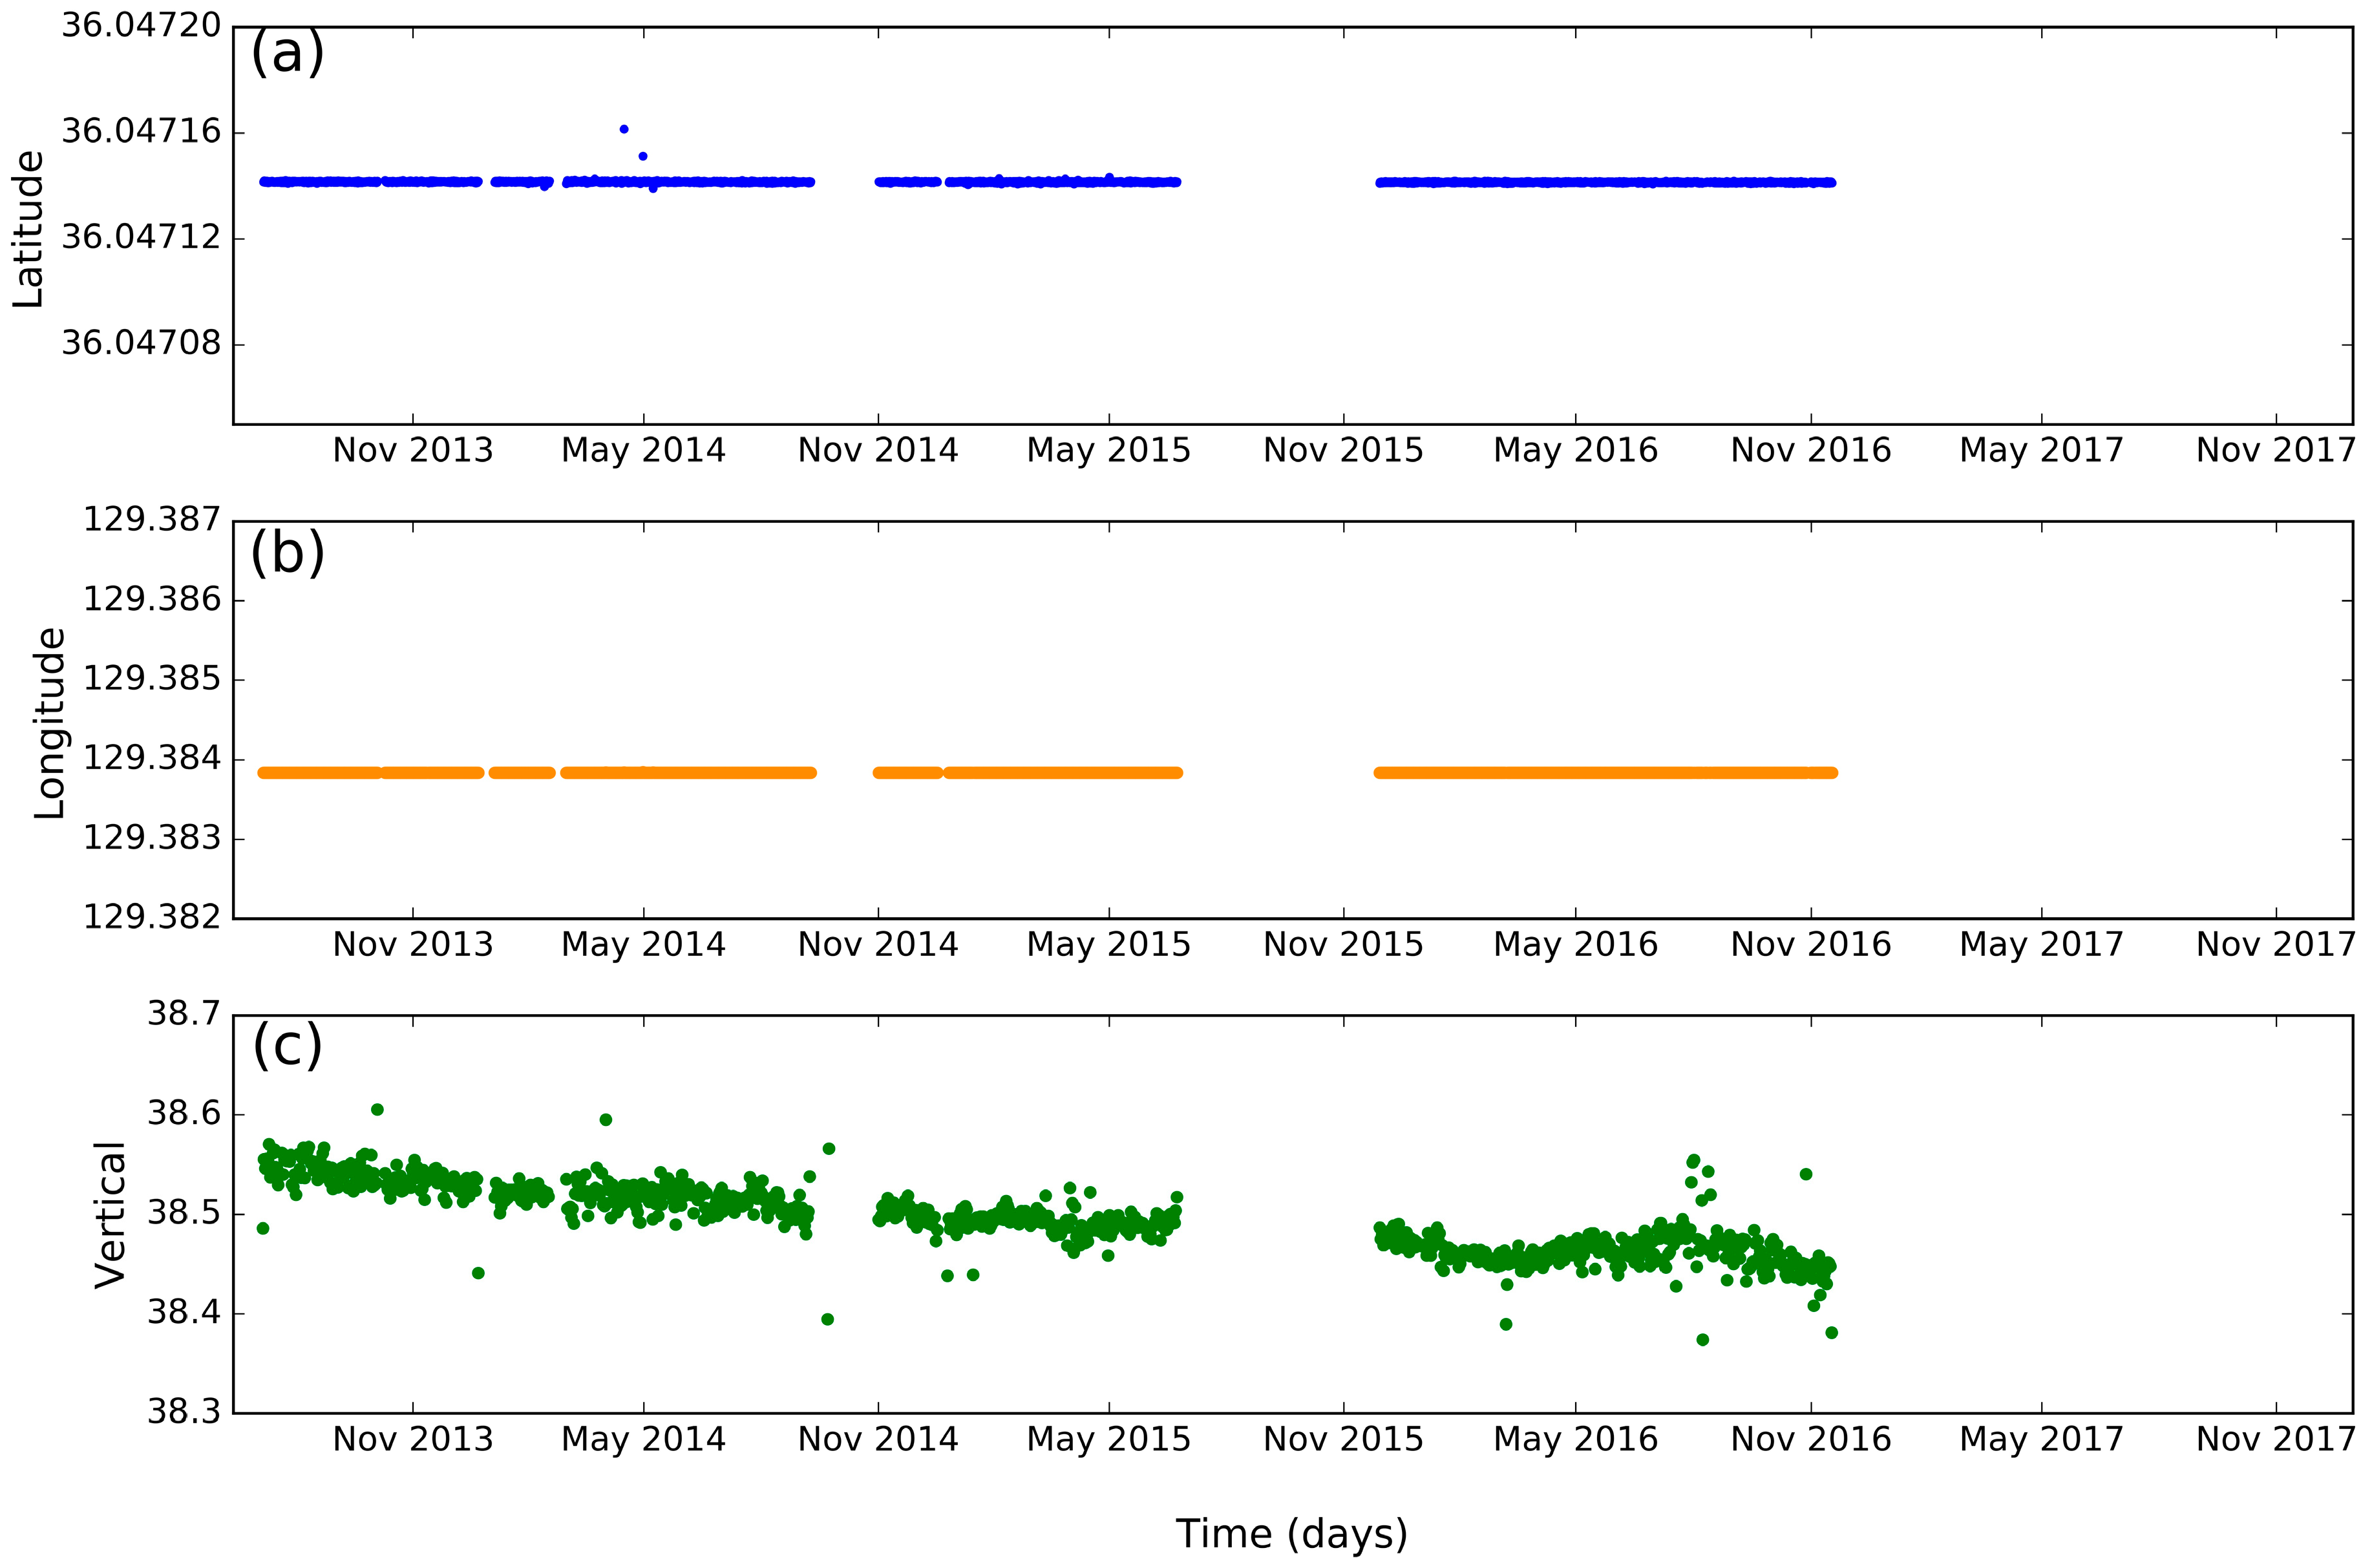
In order to estimate the time-series linear trend of sea level change, we obtained hourly sea level records of the Pohang Tide Gauge Station from KHOA. The sea level records were corrected for local datum over the period. Sea-level trend analyses were performed in order to decompose trends, seasonality, and residual components from observed sea level records with 95% confidence intervals to the linear trend. The 95% confidence intervals on the linear trend were calculated by the standard statistical method. Sea level records are available from 1977–2017; however, the hourly SLR data provided by KHOA only show a rapid acceleration in sea level records since 2013. Therefore, in this study, we focused on recent records (i.e., 2013–2017). In addition, continuous POHA station GPS observations along the N-S, E-W, and vertical directions since 2013 were provided by KHOA (Figure 3). The data show that the Pohang Tide Gauge Station has remained stable for horizontal movement, but is significantly impacted by vertical displacement. Although GPS observations are discontinuous during 2015 and 2017, the displacement pattern shows a linear trend over the study period. Hence, the vertical displacement trend from GPS observations was utilized for comparison with InSAR-derived vertical displacements.

4. Vertical Ground Motion at Pohang Tide Gauge Station

The mean velocity map obtained from the PSI analysis is presented in Figure 4. These PSI results indicate ground motion along the satellite LOS. PS pixels were identified in the urban areas of Pohang, and especially on the Pohang tide gauge. The time-series PSI results reveal that the vicinity of the Pohang Tide Gauge Station is affected by significant relative ground motion away from the satellite. Mean LOS displacement rates of approximately −1.85 cm/year and −1.92 cm/year were observed in ascending (Figure 4a) and descending (Figure 4b) passes, respectively. Other than the Pohang Tide Gauge Station and its neighborhood, most of the study area appeared stable, with minimum downward ground motion and no significant uplift based on PSI results. Time-series profiles show a linear LOS displacement trend at the tide gauge location over the study period for both ascending and descending tracks (Figure 4c). It is worth noting that the LOS displacements at the tide gauge station for both passes showed a similar and constant linear trend.
Using the area that overlapped in both the spatial and temporal coverage of Sentinel-1 for the ascending/descending data, PSI results with respect to a common reference point were interpolated by cubic interpolation on the uniform grid before 2D decomposition. With the availability of LOS displacement for the two different geometries, the vertical (dver) and horizontal displacement components (dhor) were reconstructed, as presented in Equation (1) [43]:
[ d a s c d d s c ]   =   [ cos θ a s c cos α a s c sin θ a s c cos θ d s c cos α d s c sin θ d s c ] [ d v e r d h o r ]
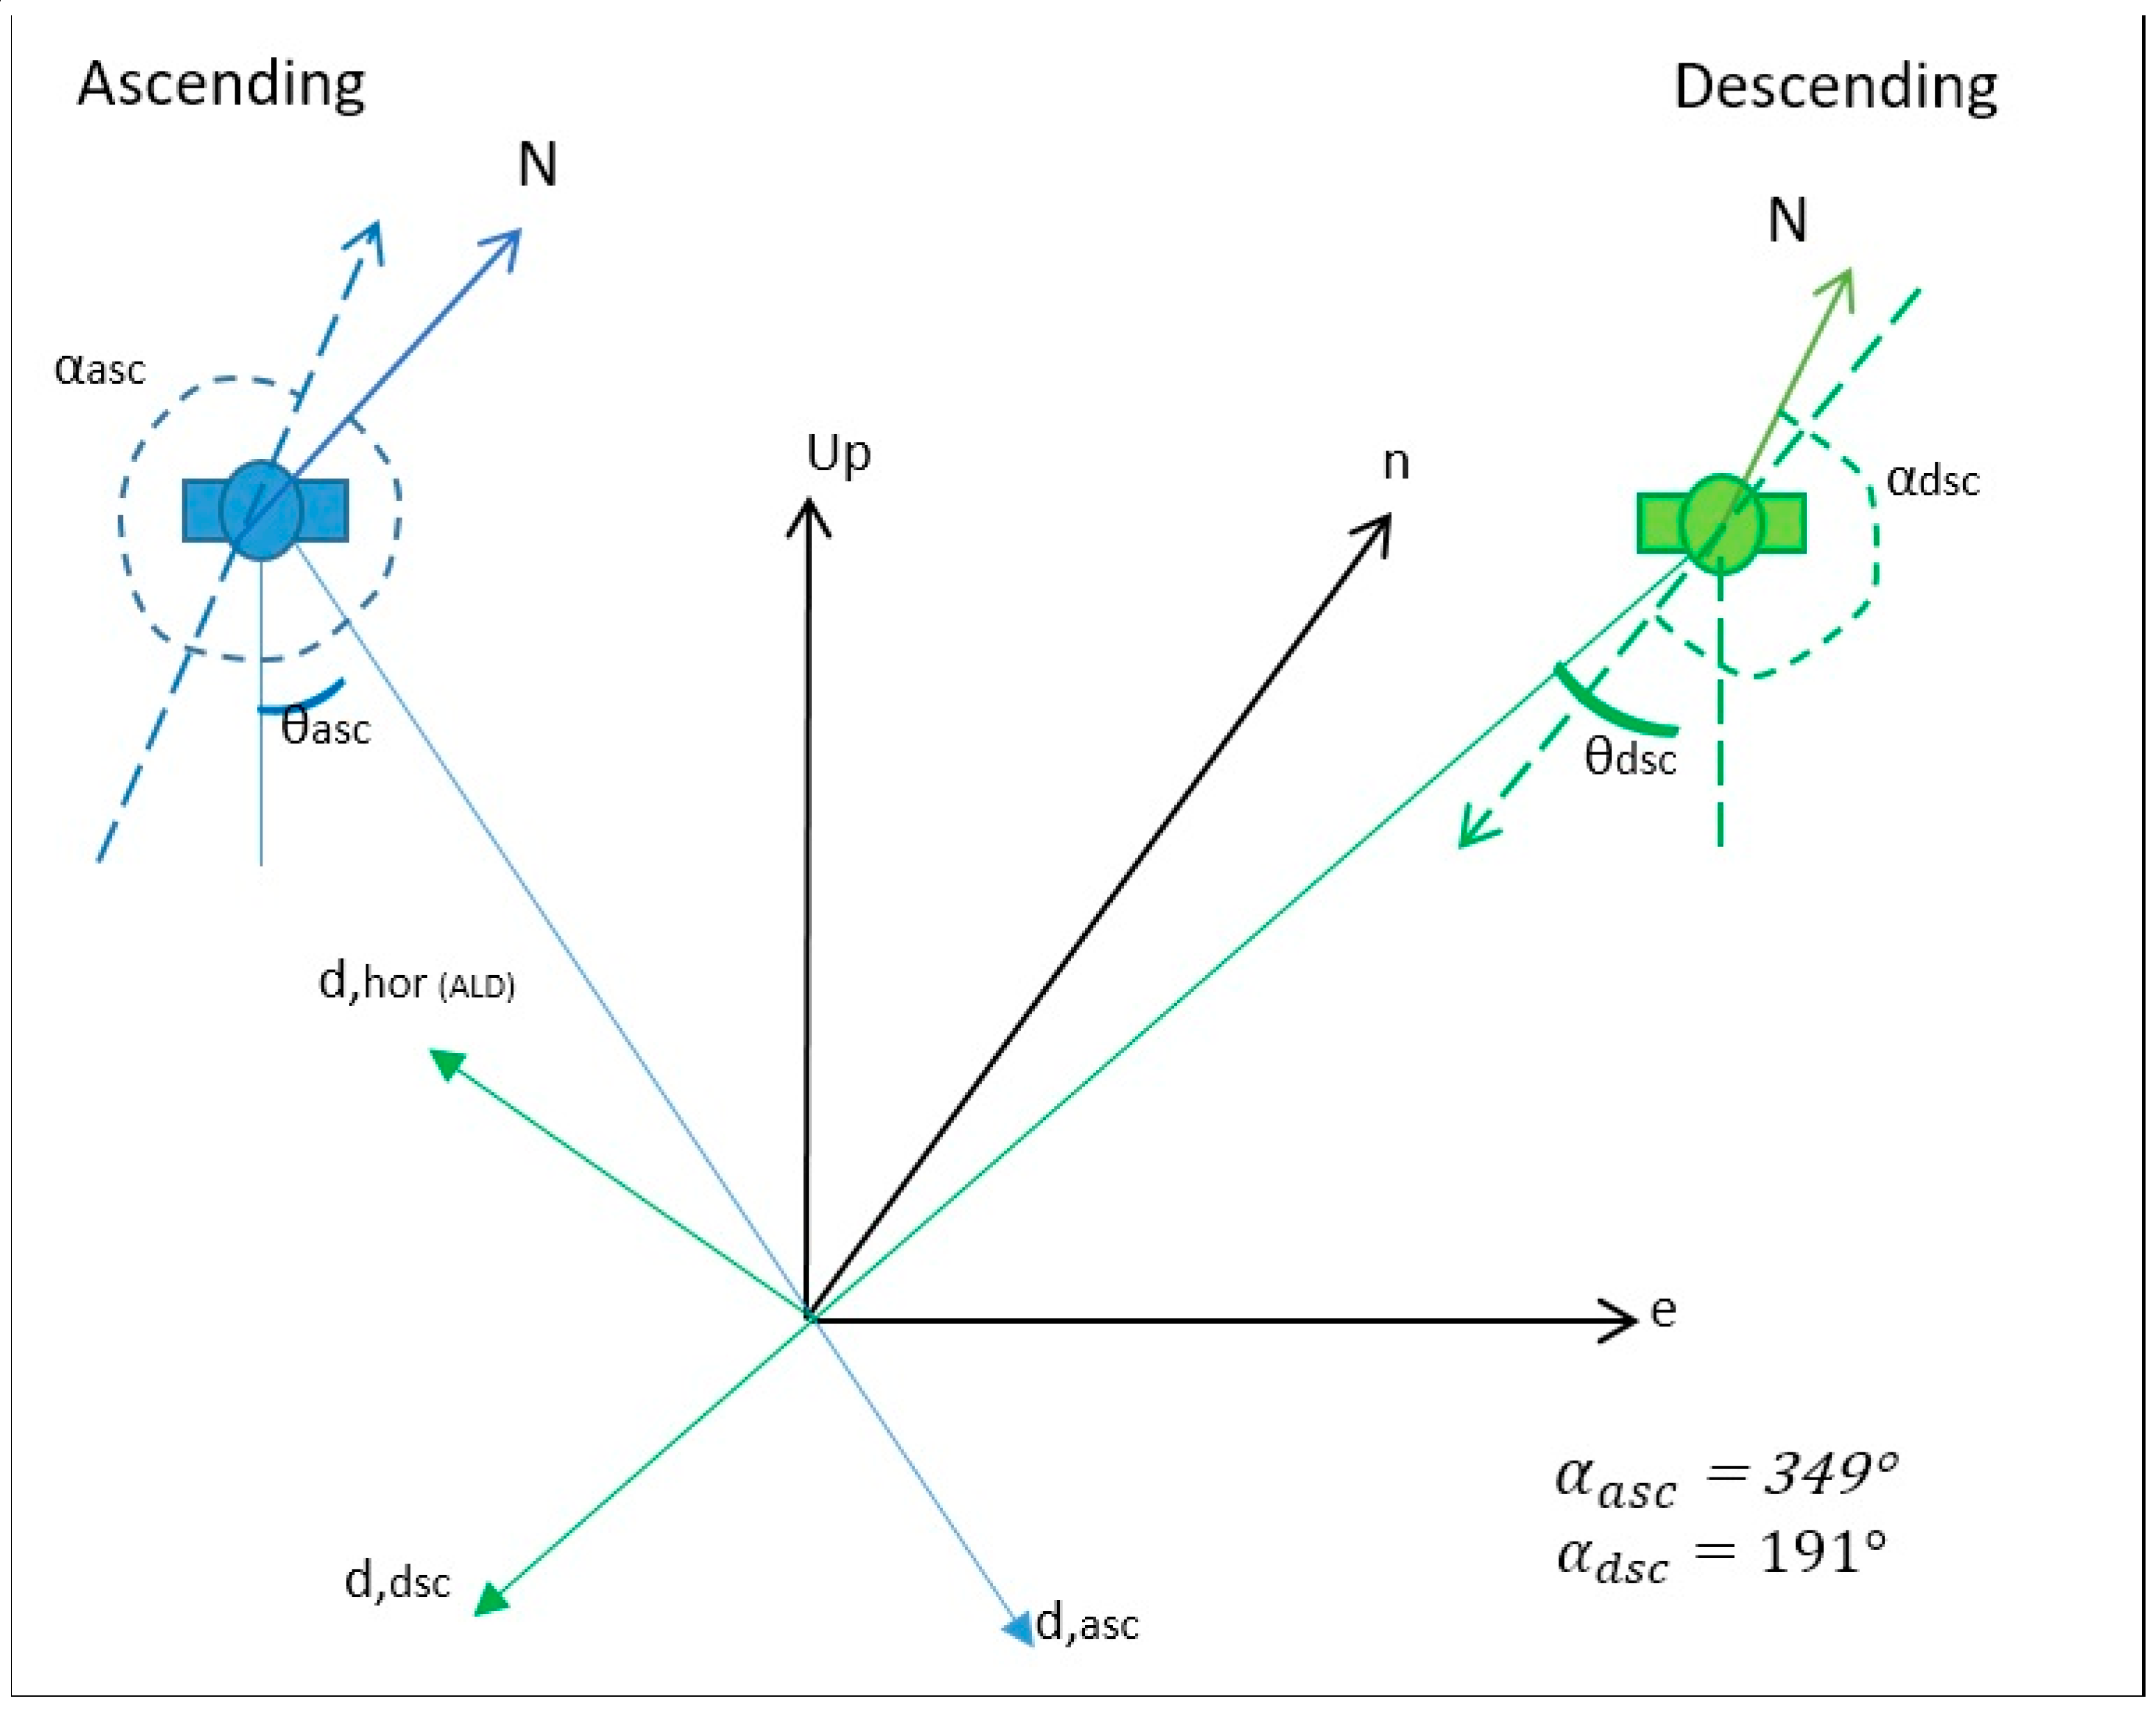
where dasc and ddsc are displacement along LOS in ascending and descending mode, respectively; θasc and θdsc are incidence angle in ascending and descending mode, respectively; α a s c   , α d s c are the satellite heading angle for ascending and descending passes; and dver and dhor are vertical displacement and horizontal displacement, respectively, along the East-West direction.
The projections of the n,e,u vector components of the LOS velocities are presented in Figure 5. The Azimuth look direction (ALD) is perpendicular to the satellite heading and comprises the combined contributions of the E-W and N-S components. In the across-track SAR imaging system, sensitivity towards N-S components is much smaller than sensitivity towards E-W components. The decomposed vertical and horizontal displacements were obtained according to the incidence angles of ascending and descending passes. Hence, we assumed that the derived horizontal component represents the E-W velocity component along the descending Azimuth look direction. The decomposed vertical and horizontal components for the overlapping period (May 2015–December 2017) are presented in Figure 6a,b, respectively. It is clear that ground motions detected over the study area by PSI analysis have primarily undergone vertical movement with minimum to zero horizontal movements. The velocities of ground motion in the vertical and horizontal directions are approximately −2.55 cm/year and +0.01 cm/year, respectively.
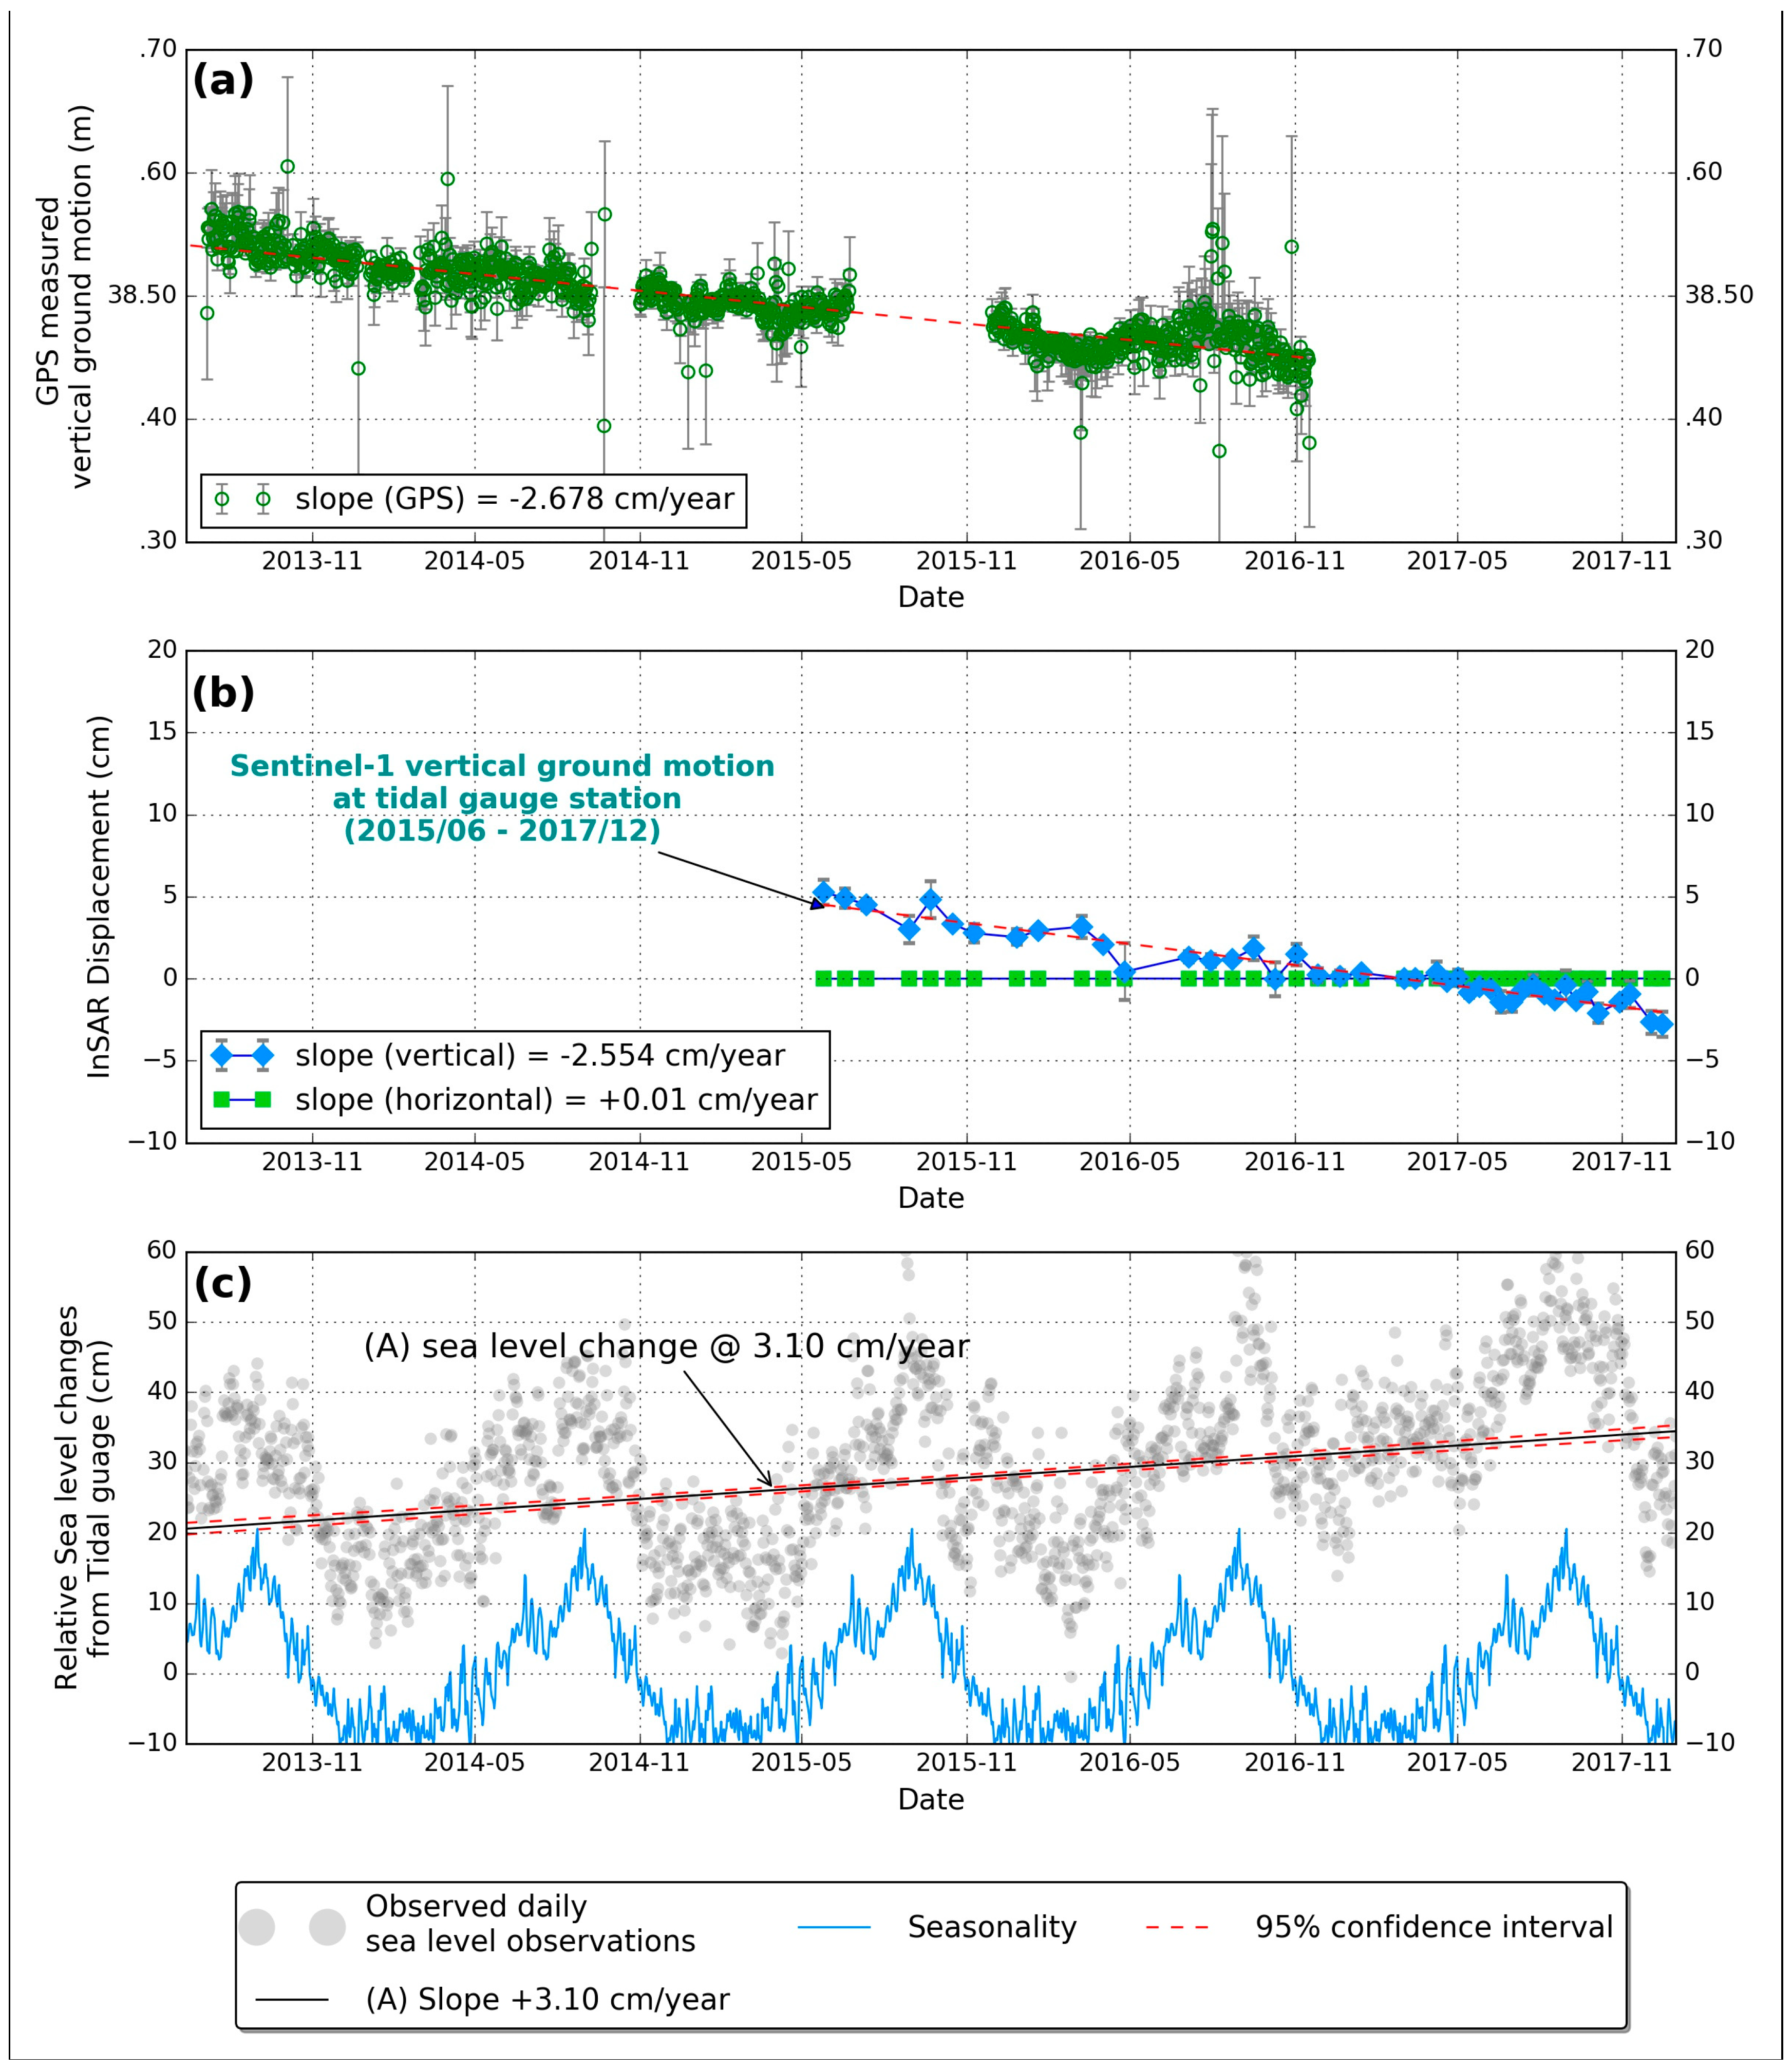
Temporal profiles for vertical ground motions estimated from POHA GPS and PS-InSAR analyses and the non-seasonal sea level trend computed from the Pohang tide gauge are presented in Figure 7. The vertical and horizontal components of the continuous GPS station (POHA) collocated with the Pohang Tide Gauge Station were estimated. The vertical velocity at POHA was found to be −2.67 cm/year from 2013–2016 with respect to the 2008 International Terrestrial Reference Frame (ITRF) coordinate system (Figure 7), for which the horizontal movements of GPS stations are stable.

5. Discussion

With the continued melting of ice sheets and glaciers in recent years, due to ocean and atmospheric warming, sea level is rising at an increasing rate. Based on tide gauge records from the past century and from satellite altimetry, the global mean sea level rises by 1.7 ± 0.3 mm/year and 3.3 mm/year, respectively [28]. Nevertheless, local sea level change at the Pohang Tide Gauge Station deviates significantly from regional and global sea level change, and from sea level records at nearby tide gauge stations (e.g., Ulsan, Mukho). This is because such sea level measurements may include large contributions from ground motion. Vertical ground motion estimates obtained by various approaches have been reported for various sites; for example, Alexandria, Egypt [36] and Manila, and the Philippines [23]. However, these studies estimated the ground motion in the LOS directions at tide gauge stations.
Time-series PSI results reveal vulnerable areas of the Pohang coast; that is, those experiencing vertical (downward) ground motions (Figure 7b). In particular, the breakwater where the Pohang Tide Gauge Station is located is subsiding at a rate of 2.55 cm/year, with InSAR displacements from both ascending and descending tracks showing similar displacement patterns (i.e., a linear subsidence trend). Furthermore, the reliability of the PSI ground motion trend is in good agreement with a continuous GPS vertical velocity profile from a station (POHA) collocated with the Pohang Tide Gauge Station (Figure 7). The Guhang Port area where the tide gauge is grounded was built on the reclaimed land of the Hyongsan River; ground motion at the reclaimed land is primarily induced by the compaction of underlying clay soils [44].
After removing seasonality from the observed tide gauge observations, the non-seasonal sea level trend showed significant SLR of about +3.1 cm/year at the Pohang Tide Gauge Station (Figure 7c). The slope of the SLR has been large in recent years compared with that of long-term sea level rise [19,28]. It is worth remarking that the sea level acceleration trend is possibly the combination of original SLR and local ground motion. Therefore, we infer that the rapid increase in SLR is most likely the result of vertical ground motion along the breakwater. This is substantiated by the vertical ground motion observed from the POHA GPS measurements (Figure 7). The difference between the linear sea level trend (+3.1 cm/year) and the estimated vertical ground motion (−2.55 cm/year) since 2013 (i.e., ~6 mm/year) reflects regional sea level rise around the Korean peninsula. However, 6 mm/year is still higher than the global mean SLR. According to KHOA [28], the SLR at the Pohang Tide Gauge Station was 5.82 mm/year from 1977–2015, hence, the SLR rate of ~6 mm/year is the considered the long-term rate. However, our PSI results represent short-term SLR during the InSAR acquisition period (2015–2017); therefore, our estimated vertical ground motion and subsequent reconstructed SLR rate (6 mm/year) apply only during the 2015–2017 period. We believe that this SLR rate of 6 mm/year reflects the influence of subsidence due to long-term natural or anthropogenic processes and seasonal climate variability [45,46].
Although tide gauges play a vital role in observing relative sea level changes, the observations are limited to land motion, and by sparse distributions around the world. Several studies have provided the sea level reconstruction for post-glacial rebound and other natural processes [31,47]. Nevertheless, until now, rapid land motion at tide gauges caused by anthropogenic processes have not been considered for reconstructions of rapid SLR. Without a doubt, contemporary GPS measurements at the tide gauge stations can provide continuous and reliable information on ground motion rates. Unfortunately, not all tide gauge stations are collocated with permanent GPS stations. Where GPS stations do exist, they may not provide continuous observations. Therefore, the vertical ground motion of the tide gauge stations is not clear enough to reconstruct the original sea level rise. In recent years, InSAR data with high temporal and spatial resolutions for both ascending and descending data have become freely available. InSAR products are useful for the continuous monitoring of vertical ground motion at tide gauge stations and in their vicinities.

6. Conclusions

Despite the importance of sea level measurement accuracy, unexpected local factors can deteriorate sea level records and result in unreliable interpretations. The Pohang Tide Gauge Station has been recording sea level rises that are higher than those of neighboring stations and of the global mean. Here, we have presented an estimation of vertical ground motion at the Pohang Tide Gauge Station using multi-track time-series InSAR analysis; the results verify that ground motion is a vital factor in the measured sea level change, resulting in an overestimated sea level trend (+3.1 cm/year since 2013). The estimated vertical ground motion (−2.55 cm/year) was validated against the ground motion rate from GPS observations (−2.67 cm/year) at a collocated station. The multi-track PS-InSAR technique can be applied to any tide gauge located in a coastal area to determine the influence of vertical ground motion on the observed SLR with high spatial resolution. With the global availability of free and open Sentinel-1 SAR data, the monitoring of tide gauges in the vulnerable delta regions seems to be achievable in the near future for the calibration of sea level records. However, although GPS observations are sparsely distributed, they remain the most reliable approach for monitoring absolute vertical displacements.

Author Contributions

Conceptualization, D.J.K.; Software, S.K.P.V. and J.J.; Formal Analysis and Visualization, S.K.P.V. and J.J.; Methodology and Investigation, S.K.P.V., D.J.K, and J.J., Writing—Original Draft Preparation, S.K.P.V.; Writing—Review and Editing, S.K.P.V., D.J.K. and J.J.; Resources and Validation, Y.K.C., K.J.H., and K.Y.J.; Project Administration and Funding Acquisition, D.J.K. and Y.K.C.

Funding

This study was supported by the Korea Hydrographic and Oceanographic Agency (KHOA) through Analysis and Prediction of Sea Level Change due to Climate Change Program and Ministry of Land, Infrastructure and Transport of the Korean government through the Regional Development Research Program under Grant (18RDP-B07654-05). This research was partially supported by the Ministry of Science and ICT (MSIT), Korea, under the ITRC (Information Technology Research Center) support program (2018-001424) supervised by the IITP (Institue for information & communications Technology Promotion).

Acknowledgments

We thank the Korean Hydrographic and Oceanographic Agency for providing sea level records at Pohang tide gauge station and GPS data of POHA GPS station. Sentinel-1 data used in this study are provided by ESA through the Sentinel-1 Scientific Data Hub.

Conflicts of Interest

The authors declare no conflict of interest.

References

  1. Clark, P.U.; Shakun, J.D.; Marcott, S.A.; Mix, A.C.; Eby, M.; Kulp, S.; Levermann, A.; Milne, G.A.; Pfister, P.L.; Santer, B.D.; et al. Consequences of twenty-first-century policy for multi-millennial climate and sea-level change. Nat. Clim. Chang. 2016, 6, 360. [Google Scholar] [CrossRef]
  2. Hay, C.C.; Morrow, E.; Kopp, R.E.; Mitrovica, J.X. Probabilistic reanalysis of twentieth-century sea-level rise. Nature 2015, 517, 481. [Google Scholar] [CrossRef] [PubMed]
  3. Church, J.A.; Clark, P.U.; Cazenave, A.; Gregory, J.M.; Jevrejeva, S.; Levermann, A.; Merrifield, M.A.; Milne, G.A.; Nerem, R.S.; Nunn, P.D.; et al. Sea-level rise by 2100. Science 2013, 342, 1445. [Google Scholar] [CrossRef] [PubMed]
  4. Woodworth, P.L.; White, N.J.; Jevrejeva, S.; Holgate, S.J.; Church, J.A.; Gehrels, W.R. Evidence for the accelerations of sea level on multi-decade and century timescales. Int. J. Climatol. 2009, 29, 777–789. [Google Scholar] [CrossRef] [Green Version]
  5. Wöppelmann, G.; Pouvreau, N.; Coulomb, A.; Simon, B.; Woodworth, P.L. Tide gauge datum continuity at brest since 1711: France’s longest sea-level record. Geophys. Res. Lett. 2008, 35. [Google Scholar] [CrossRef]
  6. Menéndez, M.; Woodworth, P.L. Changes in extreme high water levels based on a quasi-global tide-gauge data set. J. Geophys. Res. Oceans 2010, 115. [Google Scholar] [CrossRef] [Green Version]
  7. Meyssignac, B.; Becker, M.; Llovel, W.; Cazenave, A. An assessment of two-dimensional past sea level reconstructions over 1950–2009 based on tide-gauge data and different input sea level grids. Surv. Geophys. 2012, 33, 945–972. [Google Scholar] [CrossRef]
  8. Meyssignac, B.; Calafat, F.M.; Somot, S.; Rupolo, V.; Stocchi, P.; Llovel, W.; Cazenave, A. Two-dimensional reconstruction of the Mediterranean sea level over 1970–2006 from tide gage data and regional ocean circulation model outputs. Glob. Planet. Chang. 2011, 77, 49–61. [Google Scholar] [CrossRef] [Green Version]
  9. Ablain, M.; Cazenave, A.; Valladeau, G.; Guinehut, S. A new assessment of the error budget of global mean sea level rate estimated by satellite altimetry over 1993–2008. Ocean Sci. 2009, 5, 193–201. [Google Scholar] [CrossRef] [Green Version]
  10. Mitchum, G.T. An improved calibration of satellite altimetric heights using tide gauge sea levels with adjustment for land motion. Mar. Geod. 2000, 23, 145–166. [Google Scholar] [CrossRef]
  11. Fu, L.-L.; Haines, B.J. The challenges in long-term altimetry calibration for addressing the problem of global sea level change. Adv. Space Res. 2013, 51, 1284–1300. [Google Scholar] [CrossRef]
  12. Watson, C.S.; White, N.J.; Church, J.A.; King, M.A.; Burgette, R.J.; Legresy, B. Unabated global mean sea-level rise over the satellite altimeter era. Nat. Clim. Chang. 2015, 5, 565. [Google Scholar] [CrossRef]
  13. Cazenave, A.; Palanisamy, H.; Ablain, M. Contemporary Sea Level Changes from Satellite Altimetry: What Have We Learned? What are the New Challenges? Adv. Space Res. 2018, 62, 1639–1653. [Google Scholar] [CrossRef]
  14. Bekaert, D.P.S.; Hamlington, B.D.; Buzzanga, B.; Jones, C.E. Spaceborne synthetic aperture radar survey of subsidence in Hampton Roads, Virginia (USA). Sci. Rep. 2017, 7, 14752. [Google Scholar] [CrossRef] [PubMed]
  15. Goddard, P.B.; Yin, J.; Griffies, S.M.; Zhang, S. An extreme event of sea-level rise along the northeast coast of North America in 2009–2010. Nat. Commun. 2015, 6, 6346. [Google Scholar] [CrossRef] [PubMed]
  16. Hung, W.-C.; Hwang, C.; Chen, Y.-A.; Zhang, L.; Chen, K.-H.; Wei, S.-H.; Huang, D.-R.; Lin, S.-H. Land Subsidence in Chiayi, Taiwan, from Compaction Well, Leveling and ALOS/PALSAR: Aquaculture-Induced Relative Sea Level Rise. Remote Sens. 2018, 10, 40. [Google Scholar] [CrossRef]
  17. Karegar, M.A.; Dixon, T.H.; Engelhart, S.E. Subsidence along the atlantic coast of North America: Insights from gps and late holocene relative sea level data. Geophys. Res. Lett. 2016, 43, 3126–3133. [Google Scholar] [CrossRef]
  18. Le Cozannet, G.; Raucoules, D.; Wöppelmann, G.; Garcin, M.; Da Sylva, S.; Meyssignac, B.; Gravelle, M.; Lavigne, F. Vertical ground motion and historical sea-level records in Dakar (Denegal). Environ. Res. Lett. 2015, 10, 084016. [Google Scholar] [CrossRef]
  19. Kuo, C.Y.; Shum, C.K.; Braun, A.; Mitrovica, J.X. Vertical crustal motion determined by satellite altimetry and tide gauge data in Fennoscandia. Geophys. Res. Lett. 2004, 31. [Google Scholar] [CrossRef] [Green Version]
  20. Wöppelmann, G.; Marcos, M. Vertical land motion as a key to understanding sea level change and variability. Rev. Geophys. 2016, 54, 64–92. [Google Scholar] [CrossRef] [Green Version]
  21. Burgos, A.G.; Hamlington, B.D.; Thompson, P.R.; Ray, R.D. Future nuisance flooding in Norfolk, VA, from astronomical tides and annual to decadal internal climate variability. Geophys. Res. Lett. 2018, 45. [Google Scholar] [CrossRef]
  22. Cazenave, A.; Nerem, R.S. Present-day sea level change: Observations and causes. Rev. Geophys. 2004, 42. [Google Scholar] [CrossRef] [Green Version]
  23. Raucoules, D.; Le Cozannet, G.; Wöppelmann, G.; de Michele, M.; Gravelle, M.; Daag, A.; Marcos, M. High nonlinear urban ground motion in Manila (Philippines) from 1993 to 2010 observed by dinsar: Implications for sea-level measurement. Remote Sens. Environ. 2013, 139, 386–397. [Google Scholar] [CrossRef]
  24. Peltier, W.R.; Tushingham, A.M. Influence of glacial isostatic adjustment on tide gauge measurements of secular sea level change. J. Geophys. Res. Solid Earth 1991, 96, 6779–6796. [Google Scholar] [CrossRef]
  25. Mitrovica, J.X.; Tamisiea, M.E.; Davis, J.L.; Milne, G.A. Recent mass balance of polar ice sheets inferred from patterns of global sea-level change. Nature 2001, 409, 1026. [Google Scholar] [CrossRef] [PubMed]
  26. Fadil, A.; Denys, P.; Tenzer, R.; Grenfell, H.R.; Willis, P. New zealand 20th century sea level rise: Resolving the vertical land motion using space geodetic and geological data. J. Geophys. Res. Oceans 2013, 118, 6076–6091. [Google Scholar] [CrossRef]
  27. Han, G.; Ma, Z.; Chen, N.; Yang, J.; Chen, N. Coastal sea level projections with improved accounting for vertical land motion. Sci. Rep. 2015, 5, 16085. [Google Scholar] [CrossRef] [Green Version]
  28. Lim, C.; Park, S.-H.; Kim, D.-Y.; Woo, S.-B.; Jeong, K.-Y. Influence of steric effect on the rapid sea level rise at Jeju Island, Korea. J. Coast. Res. 2017, 189–193. [Google Scholar] [CrossRef]
  29. Kim, Y.; Cho, K. Sea level rise around Korea: Analysis of tide gauge station data with the ensemble empirical mode decomposition method. J. Hydro-Environ. Res. 2016, 11, 138–145. [Google Scholar] [CrossRef]
  30. Wöppelmann, G.; Martin Miguez, B.; Bouin, M.N.; Altamimi, Z. Geocentric sea-level trend estimates from gps analyses at relevant tide gauges world-wide. Glob. Planet. Chang. 2007, 57, 396–406. [Google Scholar] [CrossRef]
  31. Wöppelmann, G.; Marcos, M. Coastal sea level rise in Southern Europe and the nonclimate contribution of vertical land motion. J. Geophys. Res. Oceans 2012, 117. [Google Scholar] [CrossRef]
  32. Massonnet, D.; Rossi, M.; Carmona, C.; Adragna, F.; Peltzer, G.; Feigl, K.; Rabaute, T. The displacement field of the Landers earthquake mapped by radar interferometry. Nature 1993, 364, 138–142. [Google Scholar] [CrossRef]
  33. Ferretti, A.; Prati, C.; Rocca, F. Permanent scatterers in SAR interferometry. IEEE Trans. Geosci. Remote Sens. 2001, 39, 8–20. [Google Scholar] [CrossRef] [Green Version]
  34. Hooper, A.; Zebker, H.; Segall, P.; Kampes, B. A new method for measuring deformation on volcanoes and other natural terrains using InSAR persistent scatterers. Geophys. Res. Lett. 2004, 31. [Google Scholar] [CrossRef] [Green Version]
  35. Berardino, P.; Fornaro, G.; Lanari, R.; Sansosti, E. A new algorithm for surface deformation monitoring based on small baseline differential SAR interferograms. IEEE Trans. Geosci. Remote Sens. 2002, 40, 2375–2383. [Google Scholar] [CrossRef]
  36. Wöppelmann, G.; Cozannet, G.L.; Michele, M.; Raucoules, D.; Cazenave, A.; Garcin, M.; Hanson, S.; Marcos, M.; Santamaría-Gómez, A. Is land subsidence increasing the exposure to sea level rise in Alexandria, Egypt? Geophys. Res. Lett. 2013, 40, 2953–2957. [Google Scholar] [CrossRef] [Green Version]
  37. Jung, S. Spatial Variability in long-term changes of climate and oceanographic conditions in Korea. J. Environ. Biol. 2008, 29, 519–529. [Google Scholar]
  38. Park, J.; Kang, H.; Lee, Y.S.; Kim, M. Changes in the extreme daily rainfall in South Korea. Int. J. Climatol. 2011, 31, 2290–2299. [Google Scholar] [CrossRef]
  39. Rosen, P.A.; Gurrola, E.; Sacco, G.F.; Zebker, H. The InSAR scientific computing environment. In Proceedings of the 9th European Conference on Synthetic Aperture Radar, Nürnberg, Germany, 23–26 April 2012; pp. 730–733. [Google Scholar]
  40. Prats-Iraola, P.; Scheiber, R.; Marotti, L.; Wollstadt, S.; Reigber, A. Tops interferometry with TerraSAR-X. IEEE Trans. Geosci. Remote Sens. 2012, 50, 3179–3188. [Google Scholar] [CrossRef]
  41. Hooper, A.; Segall, P.; Zebker, H. Persistent scatterer interferometric synthetic aperture radar for crustal deformation analysis, with application to Volcán Alcedo, Galápagos. J. Geophys. Res. Solid Earth 2007, 112. [Google Scholar] [CrossRef] [Green Version]
  42. Chen, C.W.; Zebker, H.A. Two-dimensional phase unwrapping with use of statistical models for cost functions in nonlinear optimization. J. Opt. Soc. Am. A 2001, 18, 338–351. [Google Scholar] [CrossRef]
  43. Motagh, M.; Shamshiri, R.; Haghshenas Haghighi, M.; Wetzel, H.U.; Akbari, B.; Nahavandchi, H.; Roessner, S.; Arabi, S. Quantifying groundwater exploitation induced subsidence in the Rafsanjan plain, southeastern Iran, using InSAR time-series and in situ measurements. Eng. Geol. 2017, 218, 134–151. [Google Scholar] [CrossRef]
  44. Jiang, L.; Lin, H. Integrated analysis of SAR interferometric and geological data for investigating long-term reclamation settlement of Chek Lap Kok Airport, Hong Kong. Eng. Geol. 2010, 110, 77–92. [Google Scholar] [CrossRef]
  45. Kumar, P.; Min, S.-K.; Weller, E.; Lee, H.; Wang, X.L. Influence of climate variability on extreme ocean surface wave heights assessed from ERA-interim and ERA-20c. J. Clim. 2016, 29, 4031–4046. [Google Scholar] [CrossRef]
  46. Amiruddin, A.M.; Haigh, I.D.; Tsimplis, M.N.; Calafat, F.M.; Dangendorf, S. The seasonal cycle and variability of sea level in the South China Sea. J. Geophys. Res. Oceans 2015, 120, 5490–5513. [Google Scholar] [CrossRef] [Green Version]
  47. Church, J.A.; White, N.J. Sea-level rise from the late 19th to the early 21st century. Surv. Geophys. 2011, 32, 585–602. [Google Scholar] [CrossRef]
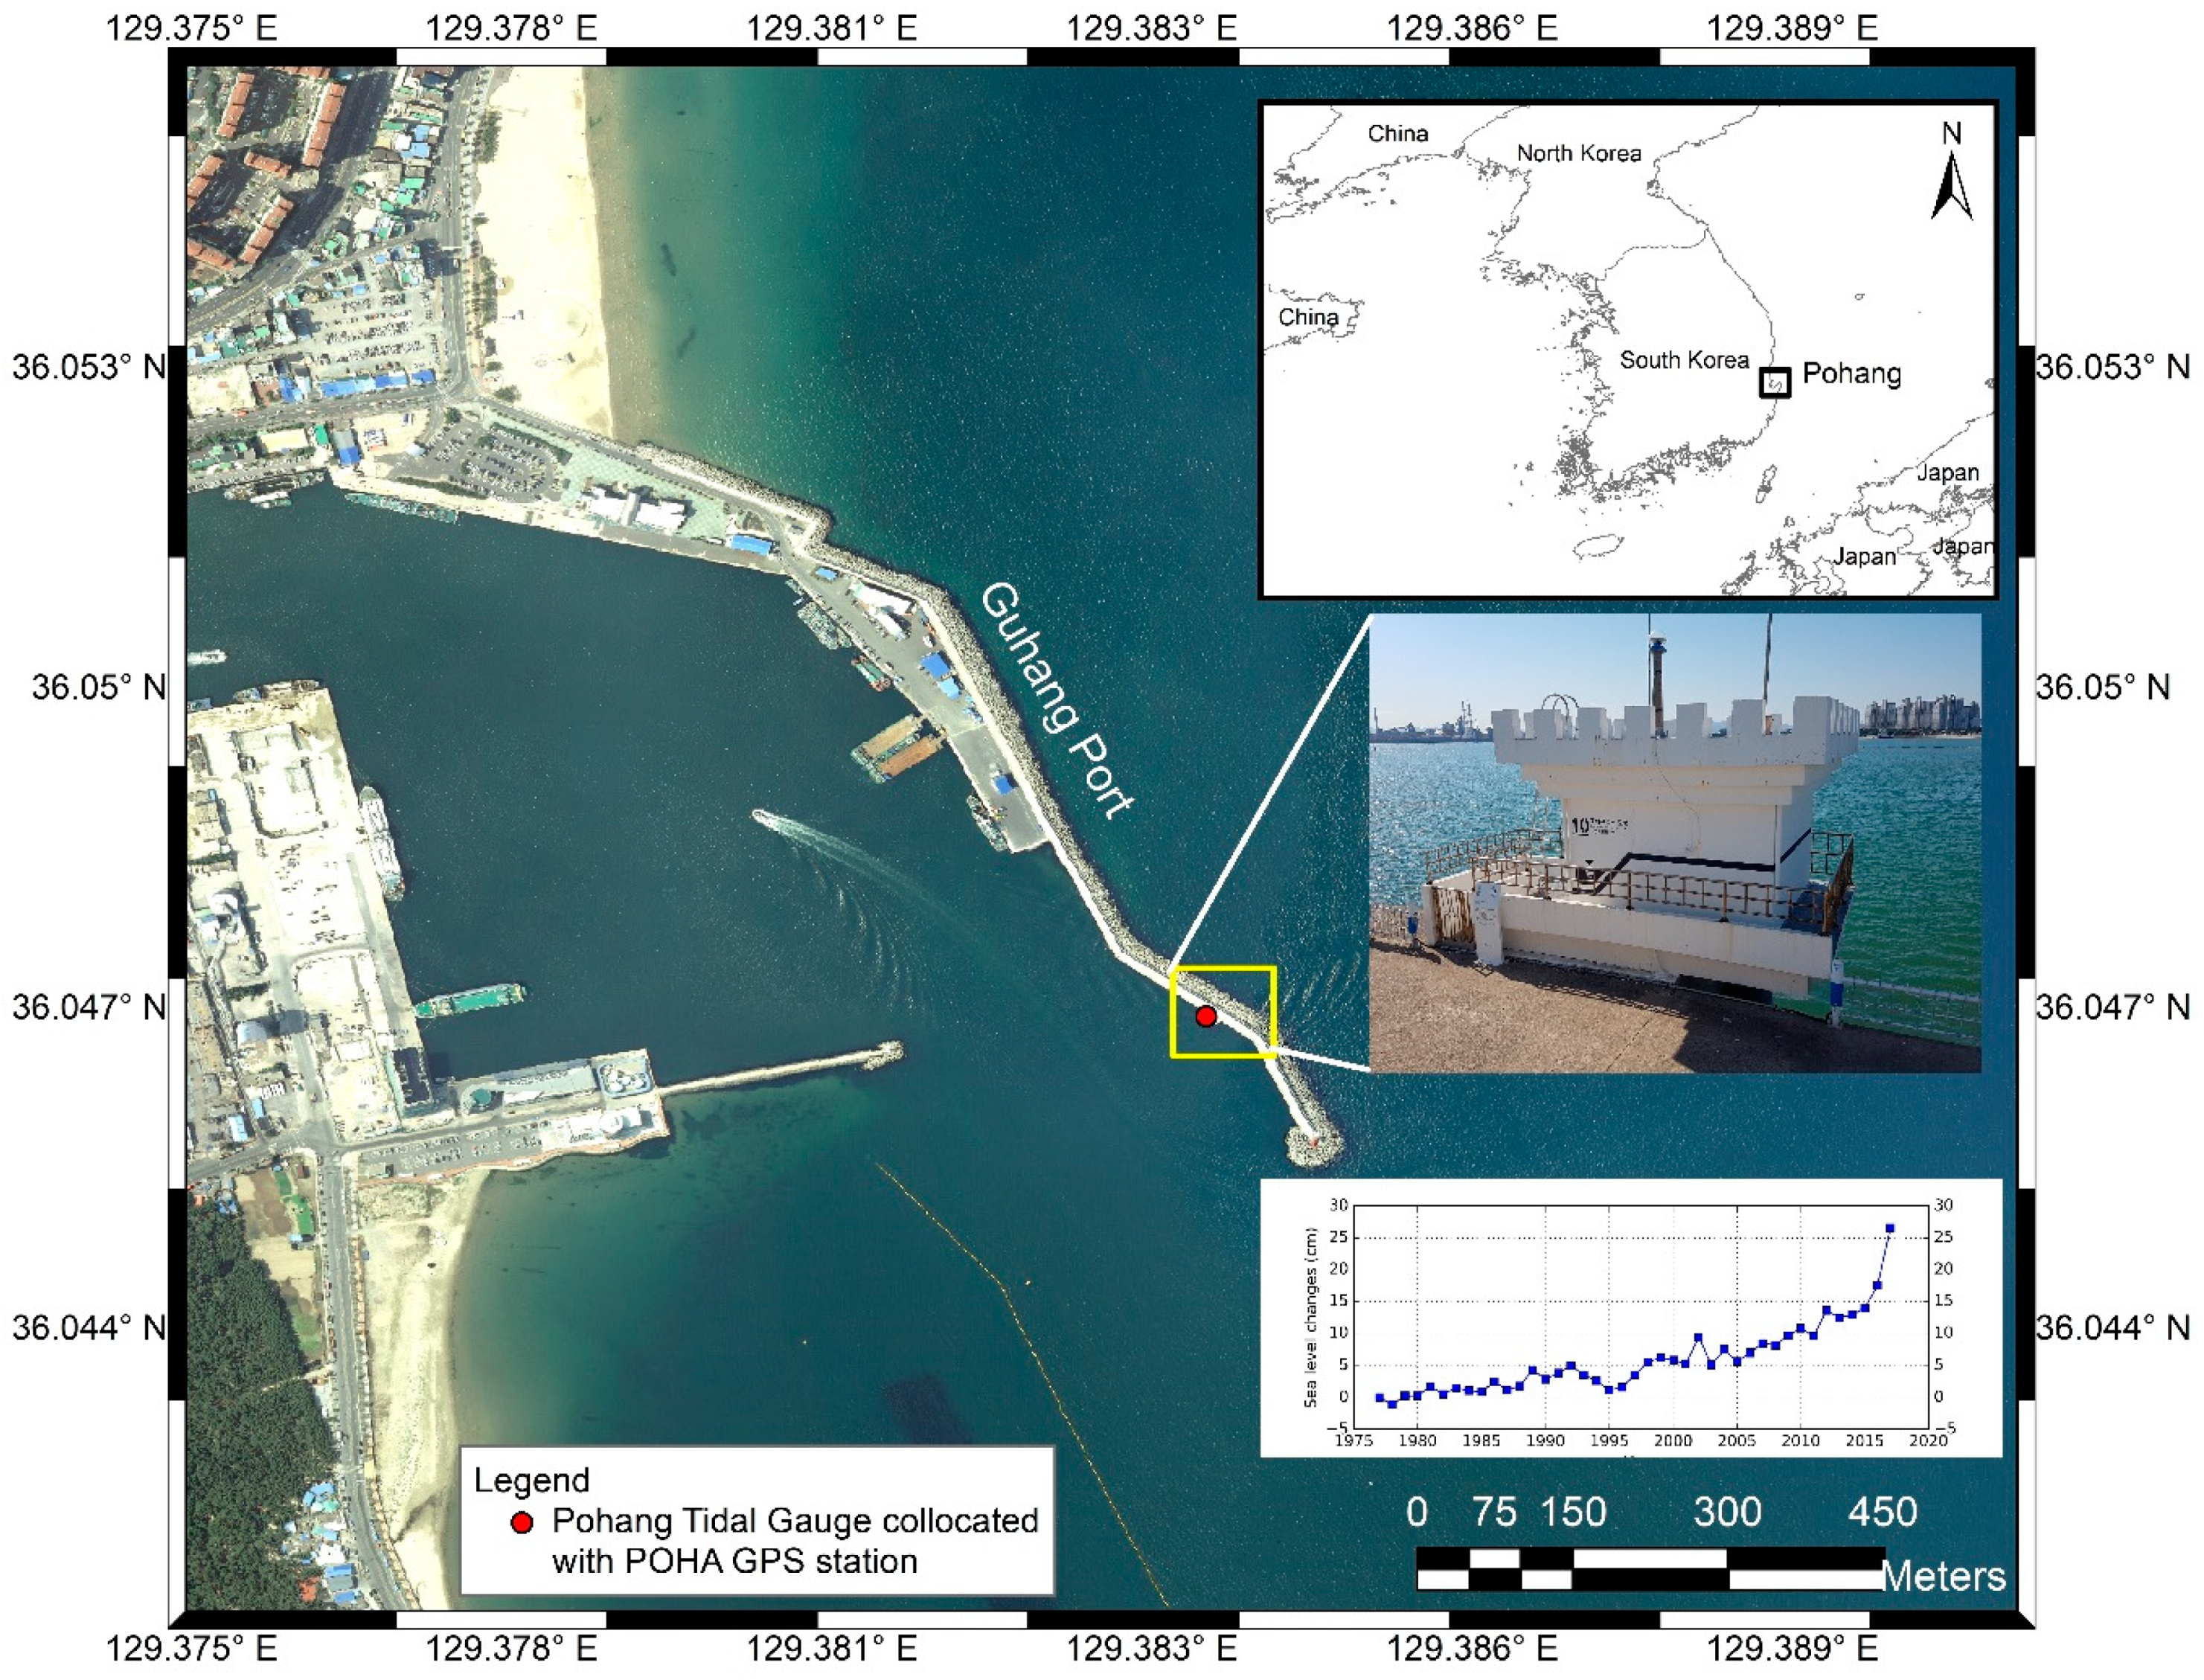
Figure 1. Study area map of Guhang Port, Pohang city (aerial imagery of Pohang city obtained from the National Geographic Information Institute (NGII). The red dot denotes the location of the Pohang Tide Gauge Station and the POHA GPS station. The inset graph shows a time-series profile of monthly sea level rise from 1977–2017 (KHOA).
Remotesensing 11 00277 g001
Figure 2. Sentinel-1 A/B acquisition time with the perpendicular baseline for (a) ascending (master 19 February 2017) and (b) descending (master 14 April 2017) passes.
Remotesensing 11 00277 g002
Figure 3. Global positioning system (GPS) displacements measured at the POHA station from 2013 to 2016 (KHOA). (a) North-South, (b) East-West, and (c) vertical displacements. Horizontal components are measured in degrees and vertical displacement is measured in meters.
Remotesensing 11 00277 g003
Figure 4. Line-of-sight (LOS) velocities from time-series Interferometric Synthetic Aperture Radar (InSAR) results obtained from (a) ascending (November 2014–December 2017) and (b) descending (May 2015–May 2018) tracks. Negative values indicate displacement away from the satellite. (c) Time-series InSAR displacement at Pohang Tide Gauge Station for ascending (blue) and descending (green) tracks.
Remotesensing 11 00277 g004
Figure 5. Projection of Interferometric Synthetic Aperture Radar (InSAR) line-of-sight (LOS) velocity decomposition into 2D velocity components along the vertical and horizontal directions (the Azimuth look direction for the descending heading).
Remotesensing 11 00277 g005
Figure 6. Interferometric Synthetic Aperture Radar (InSAR)-derived ground motion velocities from May 2015 to December 2017. (a) Vertical ground motion component and (b) horizontal ground motion component along the look direction (descending).
Remotesensing 11 00277 g006
Figure 7. Temporal profiles of (a) absolute vertical ground motion from global positioning system (GPS) data, (b) relative vertical ground motion from Interferometric Synthetic Aperture Radar (InSAR) displacements, and (c) sea level records observed at Pohang Tide Gauge Station since 2013.
Remotesensing 11 00277 g007
Table 1. Sentinel-1 A/B SAR scenes used in this study.
DescriptionAscendingDescending
Acquisition ModeInterferometric wide swath (IW)
No. of scenes4942
Incidence angle40°39°
Temporal coverageNovember 2014–December 2017May 2015–May 2018
Azimuth heading angle349°191°