Article

Exposure of Marine Turtle Nesting Grounds to Named Storms Along the Continental USA

1
Marine Turtle Research, Ecology, and Conservation Group, Department of Earth, Atmospheric, and Oceanographic Science, Florida State University, Tallahassee, FL 32306, USA
2
Sea Turtle Project, North Carolina Wildlife Resources Commission, Beaufort, NC 28516, USA
3
Duke Marine Lab, Nicholas School of the Environment, Duke University, Beaufort, NC 28516, USA
4
Department of Clinical Sciences, College of Veterinary Medicine, North Carolina State University, Morehead City, NC 27607, USA
5
Division of Sea Turtle Science and Recovery, Padre Island National Seashore, National Park Service, Corpus Christi, TX 78480, USA
6
Fish and Wildlife Research Institute, Florida Fish and Wildlife Conservation Commission, Saint Petersburg, FL 33701, USA
7
Virginia Department of Game and Inland Fisheries, Charles City, VA 23030, USA
8
U.S. Fish and Wildlife Service, Deepwater Horizon, Gulf Restoration Office, Fairhope, AL 36532, USA
*
Author to whom correspondence should be addressed.
Remote Sens. 2019, 11(24), 2996; https://doi.org/10.3390/rs11242996
Submission received: 14 November 2019 / Revised: 6 December 2019 / Accepted: 11 December 2019 / Published: 13 December 2019

Abstract

:
Named storms can cause substantial impacts on the habitat and reproductive output of threatened species, such as marine turtles. To determine the impacts of named storms on marine turtles and inform management, it is necessary to determine the exposure of marine turtle nesting grounds to recent storm activities. To address this, remote sensing information of named storm tracks coupled with nesting ground data were used to investigate the temporal and spatial overlap between nesting grounds for four species of marine turtles in the continental United States of America. All species of marine turtles were exposed to named storms, with variation in exposure driven by the spatial distribution of each population’s nesting ground, the temporal overlap between the storms and reproductive events, and nest placement on the beach. Loggerhead turtles were the most exposed species to named storms, with the northern management unit having significantly higher exposure levels than all other loggerhead management units. Kemp’s ridley turtles, in contrast, were found to be the least exposed species to named storms. This study establishes a valuable current baseline against which to measure and compare future impacts that result as climate change progresses and storms become more frequent and intense. Importantly, cumulative and synergetic effects from other climatic processes and anthropogenic stressors should be considered in future analysis.

Graphical Abstract

1. Introduction

Understanding the spatial and temporal exposure of biodiversity to specific threats is crucial for targeted management and their conservation. This is particularly true for species threatened with extinction and that are exposed to seasonal disturbances. Consequently, several efforts have been undertaken to determine the specific exposure of species of conservation concern, such as marine turtles, to disturbances [1,2]. Marine turtles use both terrestrial and marine environments throughout different life stages during which they are exposed to an array of anthropogenic and environmental disturbances at various scales [3,4,5]. Most of the studies examining the exposure of marine turtles to disturbances have focused on exposure to anthropogenic threats such as fisheries bycatch [6,7], coastal development [8,9,10], and light and plastic pollution [11,12]. Only a few studies have been focused on determining the exposure and potential disturbance of marine turtles to environmental disturbances such as those from tropical storms and hurricanes [13,14], hereafter “named storms” for simplicity.
Named storms are amongst the world’s most destructive natural hazards [13] and are accompanied by strong winds, intense rainfall, and storm surges that have the potential to flood and/or substantially modify the morphology of coastal areas [15,16]. Several of the world’s marine turtle nesting grounds are exposed to named storms, either during or outside their nesting season [13,17,18,19]. This is problematic because named storms can affect marine turtles in the long term, over several generations, by shaping their nesting habitat (through beach erosion) and in the short-term, during the incubation of their clutches (6–8 weeks), by increasing localized (temporal and spatial) mortality of their eggs and decreasing hatchling production [17,18,19,20,21]. Further, decreases in temperature from increased rainfall and cloud cover during named storms can play a role in influencing phenotype and sex ratios of hatchlings from eggs deposited on beaches [22,23,24], as both incubation duration and sex of marine turtle hatchlings is affected by the sand temperature during incubation [25,26].
Given the potential impacts of named storms on the reproductive output of marine turtles and their habitat, it is speculated that these events can have substantial selective pressures on marine turtles and can play a major role in structuring the current distributions of individuals and populations [13]. However, there is limited information on the exposure of marine turtle nesting grounds to named storms and the spatial and temporal variability of impacts across species and nesting grounds (see [13,14]). Furthermore, these studies are outdated; Dewald and Pike [14] investigated the exposure of marine turtle nesting grounds in the north–western Atlantic and north–eastern Pacific Oceans to named storms from 1970–2007 and Fuentes et al. [13] investigated the exposure of marine turtle nesting grounds in the south Pacific Ocean to named storms from 1969–2007. Considering that named storm frequency and intensity are changing in response to warmer environments [27], with named storm activity in the North Atlantic showing an apparent increasing trend in frequency and intensification [28,29,30], there is a need to revisit earlier studies and reassess the exposure of marine turtle nesting grounds to recent storm activities.
To address temporal gaps on the assessments of the exposure of marine turtle nesting grounds to named storms and to determine the potential impact of storms on different species of marine turtles, we investigated the extent to which marine turtle nesting grounds along the coast of the continental United States of America (USA) have been exposed to named storms between 2008 and 2018. Further, we assessed the temporal and spatial overlap between named storms and nesting grounds for loggerhead turtle (Caretta caretta), green turtle (Chelonia mydas), leatherback turtle (Dermochelys coriacea) and Kemp’s ridley turtle (Lepidochelys kempii) in the region. To illustrate some of the potential impacts of named storms on the reproductive output of marine turtles, we used hurricane Florence, which hit North Carolina, USA in 2017, as a case study and explored how this hurricane affected the hatching success of nests laid by four species of marine turtles nesting in the impacted region.

2. Materials and Methods

2.1. Study Region

Our study covers the continental USA southeast coast, from Texas to Virginia. Four species of marine turtles nest along this area on sandy beaches located on mainland and barrier islands: loggerhead turtles, which are further classified into six management units:northwestern Florida (NW), central–western Florida (CW), south–western Florida (SW), south–eastern Florida (SE), central–eastern Florida (CE) and northern (N) [31,32]), as well as green turtles, leatherback turtles and Kemp’s ridley turtles [9,33,34,35,36,37]. Marine turtle nesting and hatching seasons vary among species and locations across the eastern USA coast, but in general, the nesting season spans from May through August for loggerhead turtles [38,39,40,41,42,43,44,45,46], June through September for green turtles [44,45,47], March through July for leatherback turtles [48,49], and April through June for Kemp’s ridley turtles [35]. Hatching season was determined by adding two months to the nesting season for each species, with the peak of the hatching season occurring in August for loggerhead turtles, September for green turtles, July for leatherback turtles and June through early August for Kemp’s ridley turtles. The Atlantic hurricane season (hereafter “Atlantic storm season” for consistency) typically spans from 1 June through 30 November, and peaks from mid-August to late October [50].

2.2. Datasets

2.2.1. Marine Turtle Nesting Grounds

Geographic location and nesting density (# nests/km) was obtained for all marine turtle nesting grounds along the USA continental coast (loggerhead turtles n = 314; green turtles n = 164; leatherback turtles n = 107; Kemp’s ridley turtles n = 10), between 2010 and 2014, from the Virginia Department of Game and Inland Fisheries, the North Carolina Wildlife Resources Commission, the South Carolina Department of Natural Resources, the Fish and Wildlife Research Institute of the Florida Fish and Wildlife Conservation Commission, the United States Fish and Wildlife Service Alabama Ecological Services Field Office, and the National Park Service Padre Island National Seashore in Texas. We classified the nesting density values for each species separately based on their quartile ranks into “low” (values ≤ 25th quartile), “medium” (values between 25th and 50th quartile), “high” (values between 50th and 75th quartile) and “very high” (values > 75th quartile), as per Fuentes et al. [9]. For loggerhead turtles, these quartile rankings were based on their management units and not range-wide [31,32]. Green turtle and loggerhead turtle nests in Texas were not considered in this study since the numbers of nests are too small on a yearly basis, with approximately 0–13 loggerhead nests and 1–29 green turtle nests in Texas on average each year (Shaver, D. (Division of Sea Turtle Science and Recovery, National Park Service, Corpus Christi, TX, USA). Personal communication, 2019).

2.2.2. Named Storms

The National Hurricane Center, through the Tropical Analysis and Forecast Branch (TAFB), provides spatial files for each named storm formed in the North Atlantic region and their strength (intensity), which are derived from data and imagery from multiple satellites and estimated using the Dvorak technique [51]. Some of the most recent satellites used consist of the NOAA polar-orbiting satellites including the Advanced Microwave Sounding Unit (AMSU), the NASA Global Precipitation Mission (GPM), the European Space Agency’s Advanced Scatterometer (ASCAT), and Defense Meteorological Satellite Program (DMSP) satellites, among others). Spatial data of each named storm (n = 159 tropical storms and hurricanes; hereafter “named storms” for simplicity) in the North Atlantic region between 2008 and 2018 were downloaded from the National Hurricane Center database (“Best Track” available at https://www.nhc.noaa.gov/gis/; downloaded November 2018). We obtained wind swath shapefiles for 151 named storms, which display the extent of impact of the different wind force levels of a named storm (34 kt or tropical storm wind force, 50 kt, and 64 kt or hurricane-force winds) [52]. We selected only the tropical storm wind force swaths (34 kt), to explore the minimum impact of each named storm across its entire geographical extent. For a small subset of named storms (8 out of 159) for which wind swaths were not available, we used the named storm tracks from the International Best Track Archive for Climate Stewardship (IBTraCS) dataset [53]; available at https://www.ncdc.noaa.gov/ibtracs/index.php). Because IBTraCS datasets only include the central track of a named storm, we buffered each track by 40 km to have a representation of the minimum extent of impact of that particular named storm [13]. We summed the occurrence of named storms at each grid cell (15 km grid resolution) to create a rasterized map of the total frequency of named storms. A 15 km grid resolution was used as it was considered the best spatial resolution to cover the length of most nesting grounds and provide fine enough resolution to display differences in the frequency of storms. All spatial analyses were computed in ArcGIS 10.6.

2.3. Overlap between Marine Turtles and Named Storms

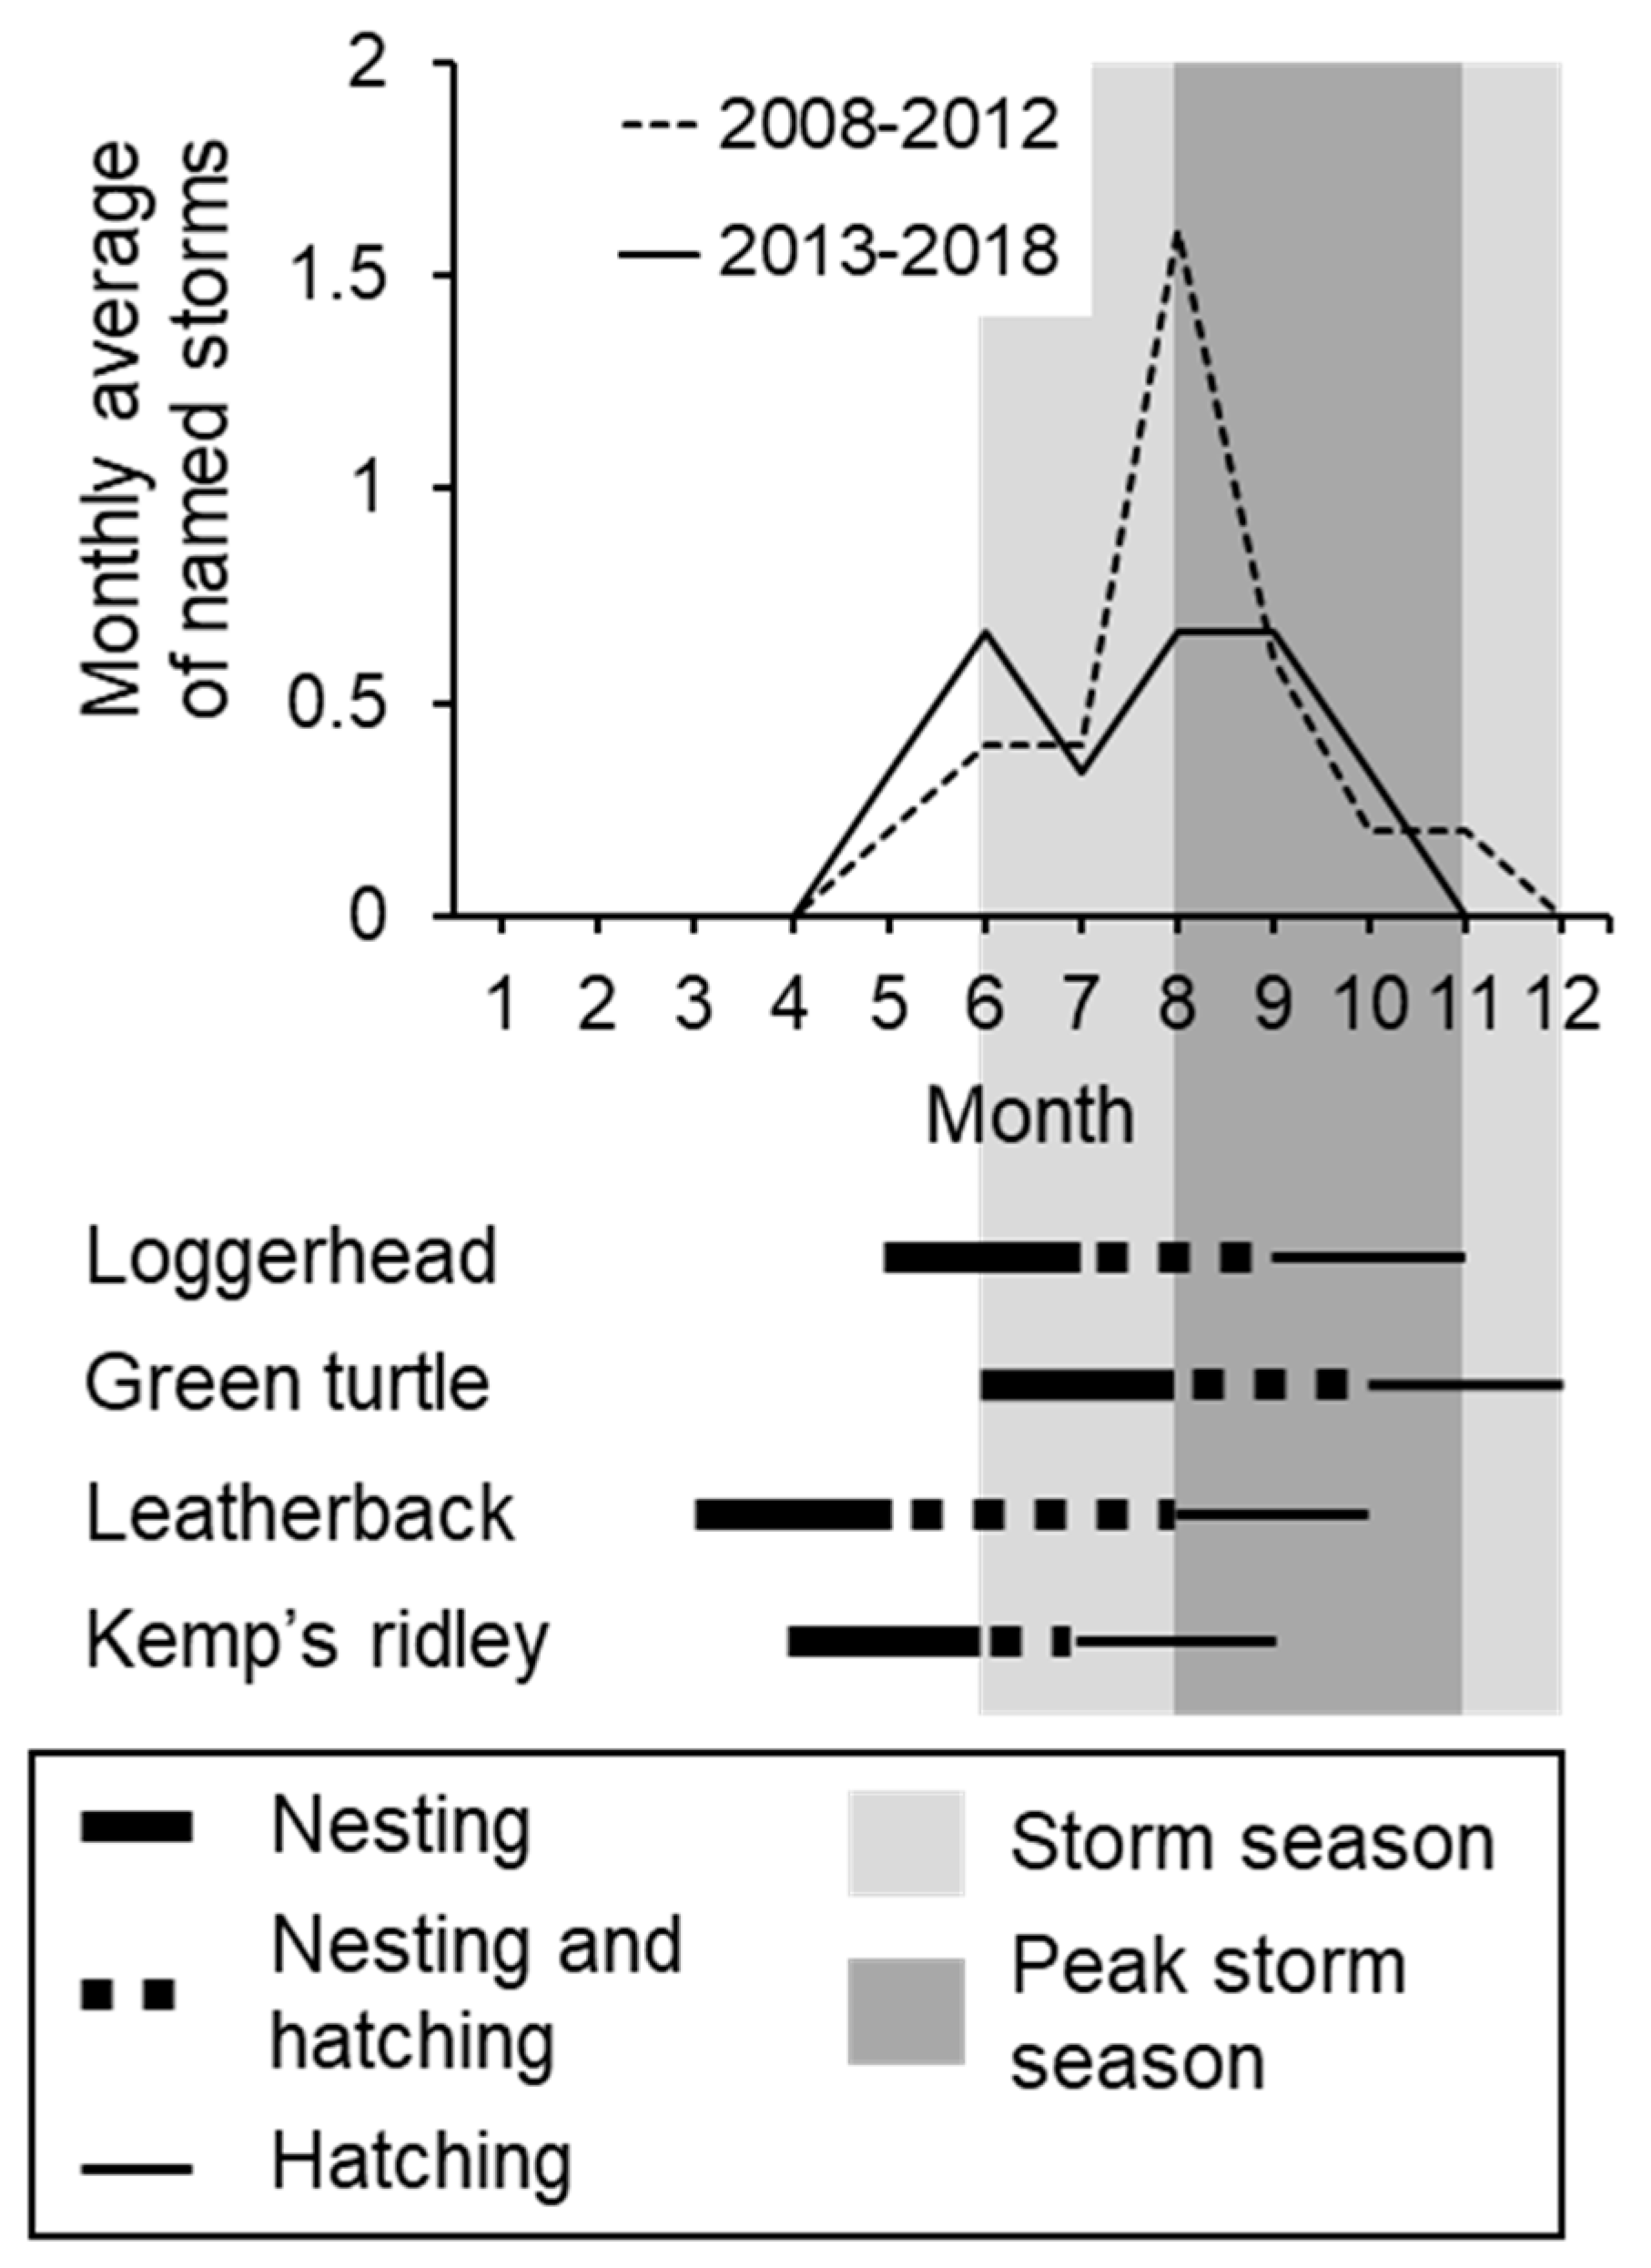
2.3.1. Temporal Overlap

The annual (total number of named storms per year) and monthly (average number of named storms per month across the study period) distribution of named storms that crossed nesting beaches were plotted and assessed with a Chi-square test to depict temporal trends in named storm activity. To assess the temporal overlap between marine turtle nesting and hatching season and named storms during the Atlantic hurricane season, we visually compared the monthly distribution of named storms with the nesting and hatching seasons for each species. In addition, to explore trend changes in the monthly distribution of named storms across the study period, we explored temporal changes by splitting the temporal scale of our data into two time-periods (2008–2012 and 2013–2018) and comparing them graphically.

2.3.2. Spatial Overlap

The exposure of marine turtle nesting grounds to named storms was calculated by multiplying the frequency of named storms that crossed a nesting ground by the density class of that nesting beach (see Excel S1). To make the named storm frequency and marine turtle density spatial layers comparable, we normalized each dataset with a linear transformation. The resulting values ranged from 0 to 1 and were classified based on equal intervals into “no exposure” (0), “low” (≤0.25), “medium” (0.25–0.50), “high” (0.5–0.75) and “very high” (>075) exposure [54]. For loggerhead turtles, we calculated the average exposure for each of the management units. For leatherback turtles, Kemp’s ridley turtles, and green turtles, we calculated the overall average exposure across the species because management units have not yet been defined (leatherback turtles) or are in the process of being defined (green turtles, see [55,56]) or because the consistent nesting range is restricted to one region (Kemp’s ridley turtles).
To assess differences in the exposure of the different species and among loggerhead turtle management units to named storms, we fitted general linear models (GLMs) with negative binomial distributions. Additionally, to assess differences in the frequency of named storms among loggerhead turtle subpopulations, a GLM with Poisson distribution was fitted. For all models, we applied a post-hoc Tukey’s HSD to perform pairwise comparisons. All statistical analyses were performed in R 3.5.1 [57].

2.3.3. Case Study: Disturbance by Named Storms in North Carolina, USA

Changes in hatching success (as defined by [58]) for loggerhead turtle, Kemp’s ridley turtle, leatherback turtle, and green turtle nests laid on beaches in southern versus northern North Carolina, USA, and before and after Hurricane Florence was explored. Hurricane Florence made landfall near Wrightsville Beach in south-central North Carolina on 14 September 2018 as a Category 1 hurricane, but heavy rainfall and strong winds were observed starting on 10 September (https://www.weather.gov/mhx/Florence2018) (Figure 1). Hurricane Florence was accompanied by a storm surge of 2–4 meters and a devastating rainfall of 51–76 cm, which caused extensive flooding and damage to coastal areas.
Hatching success of individual nests was evaluated by examining contents of each nest 72 hours after primary emergence of hatchlings or after 70 days of incubation if there was no sign of hatchling emergence. In cases where nest markers were lost due to the hurricane, efforts were made to find any remaining contents of the nests by digging in the sand near the nest’s recorded GPS location. If no nest contents were found, the nest was assumed to have been lost to erosion associated with the storm and assigned 0% hatching success. Eight nests could not be assigned hatching success due to other circumstances (e.g., coyote predation around the time of expected emergence) and were removed from the analyses. Nests were grouped as pre-hurricane Florence if they had been laid on or before 19 July, which is 57 days prior to September 10, and as post-hurricane Florence if they were laid after 19 July. The value of 57 days was the average incubation period for nests that produced emergent hatchlings during the two weeks immediately prior to 10 September. For spatial comparisons, we grouped nests as those laid south or north of 35 °N, near Ocracoke Inlet, nearly 185 km straight line distance NE from where Hurricane Florence made landfall. For spatial comparisons, only nests laid after 19 July were used in the analyses.

3. Results

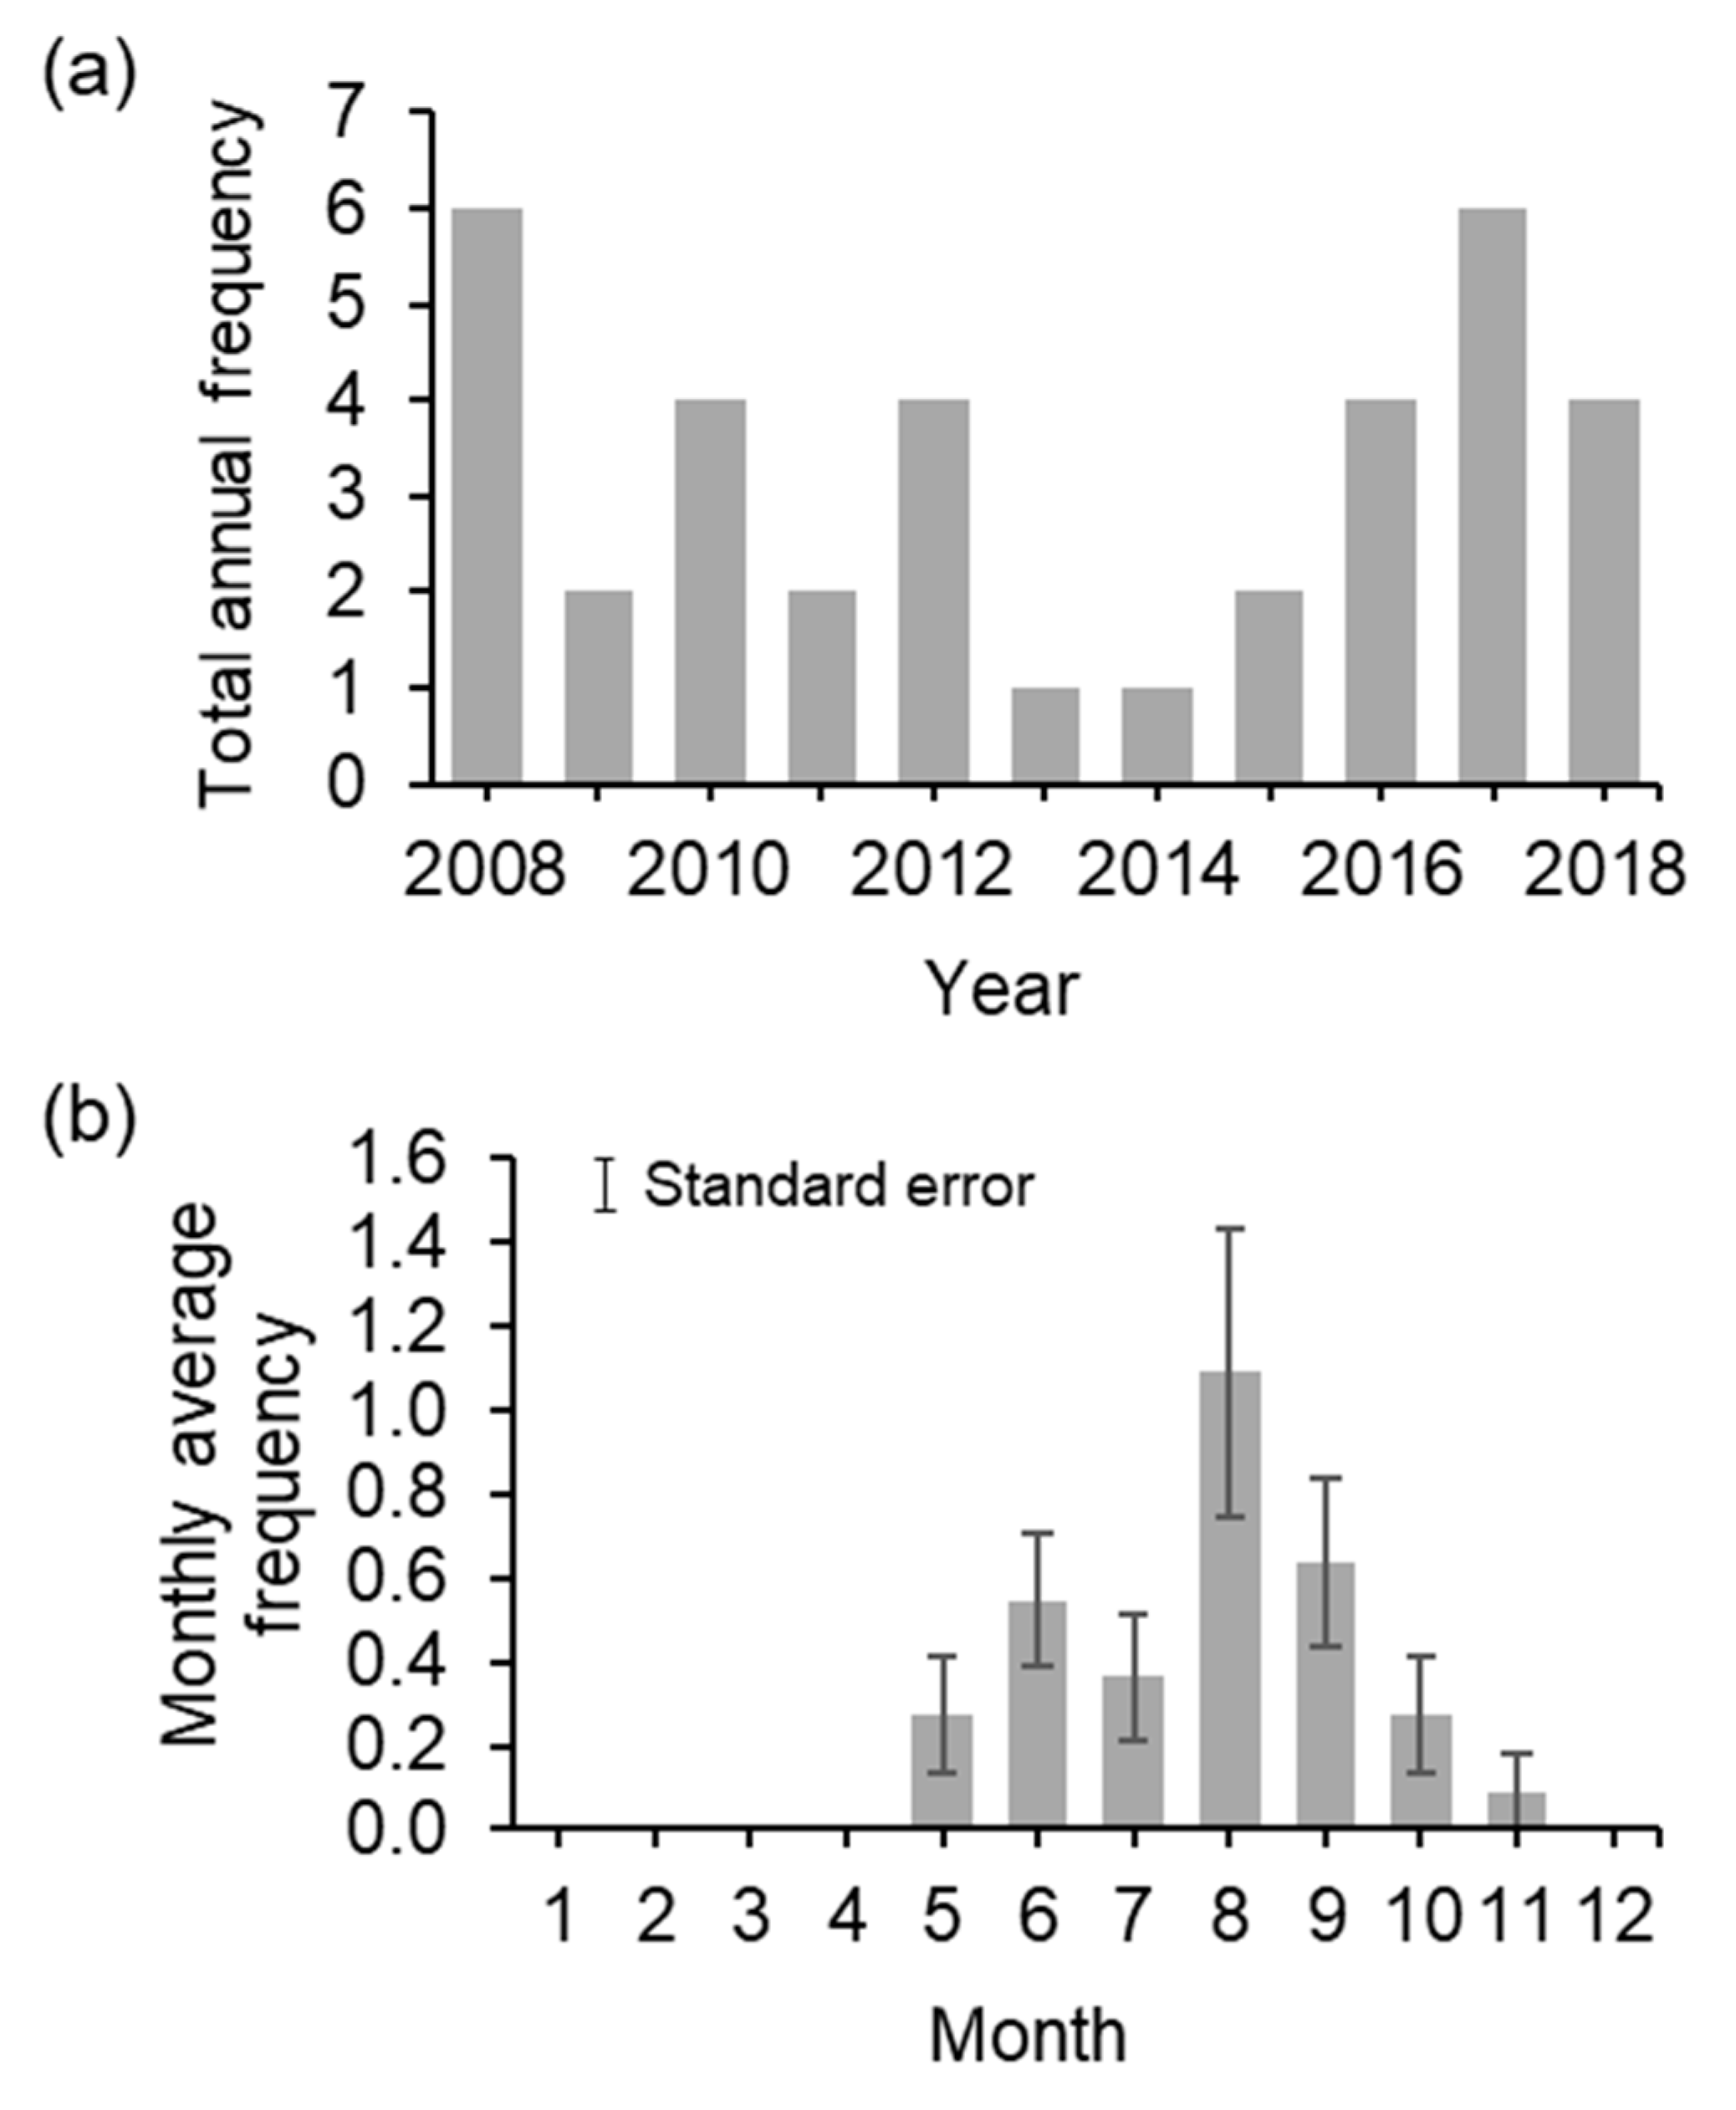
3.1. Temporal Overlap between Nesting Season and Named Storms

The total frequency of named storms that crossed marine turtle nesting grounds during the study period (between one and six named storms per year) oscillated across years without any clear pattern (Chi-squared test; X2 = 9.8333, df = 10, p = 0.4552) (Figure 2a). However, the total monthly named storm frequency was significantly higher during the summer months (May to August) (Chi-squared test; X2 = 15.333, df = 6, p = 0.01782) (Figure 2b).
When looking at trends between the two periods (2008–2012 and 2013–2018), monthly average named storm frequency shifted from having one clear peak in August (average ± SE = 1.6 ± 0.3 storms/month) for the first period (2008–2012) to a more even distribution from June throughout September between 2013–2018 (average ± SE = 0.6 ± 0.17 storms/month) (Figure 3). In terms of temporal overlap, most of the nesting season for loggerhead turtles occurs just before and throughout the Atlantic hurricane season, while nesting season for green turtles occurs in its entirety during the hurricane season. For leatherback turtles and Kemp’s ridley turtles, the first half of the nesting season occurs outside the hurricane season (Figure 3). When considering the hatching season, all species experience an overlap with the hurricane season, with the majority of the hatching season for loggerhead turtles and green turtles occurring throughout the peak of the hurricane season. In contrast, for leatherback turtles and Kemp’s ridley turtles, only the second half of the hatching season overlaps with the peak hurricane season (Figure 3).

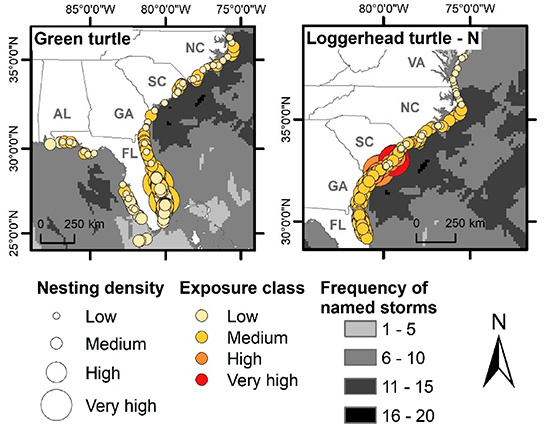
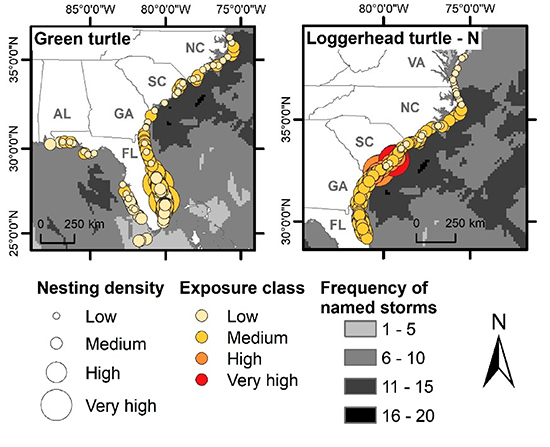
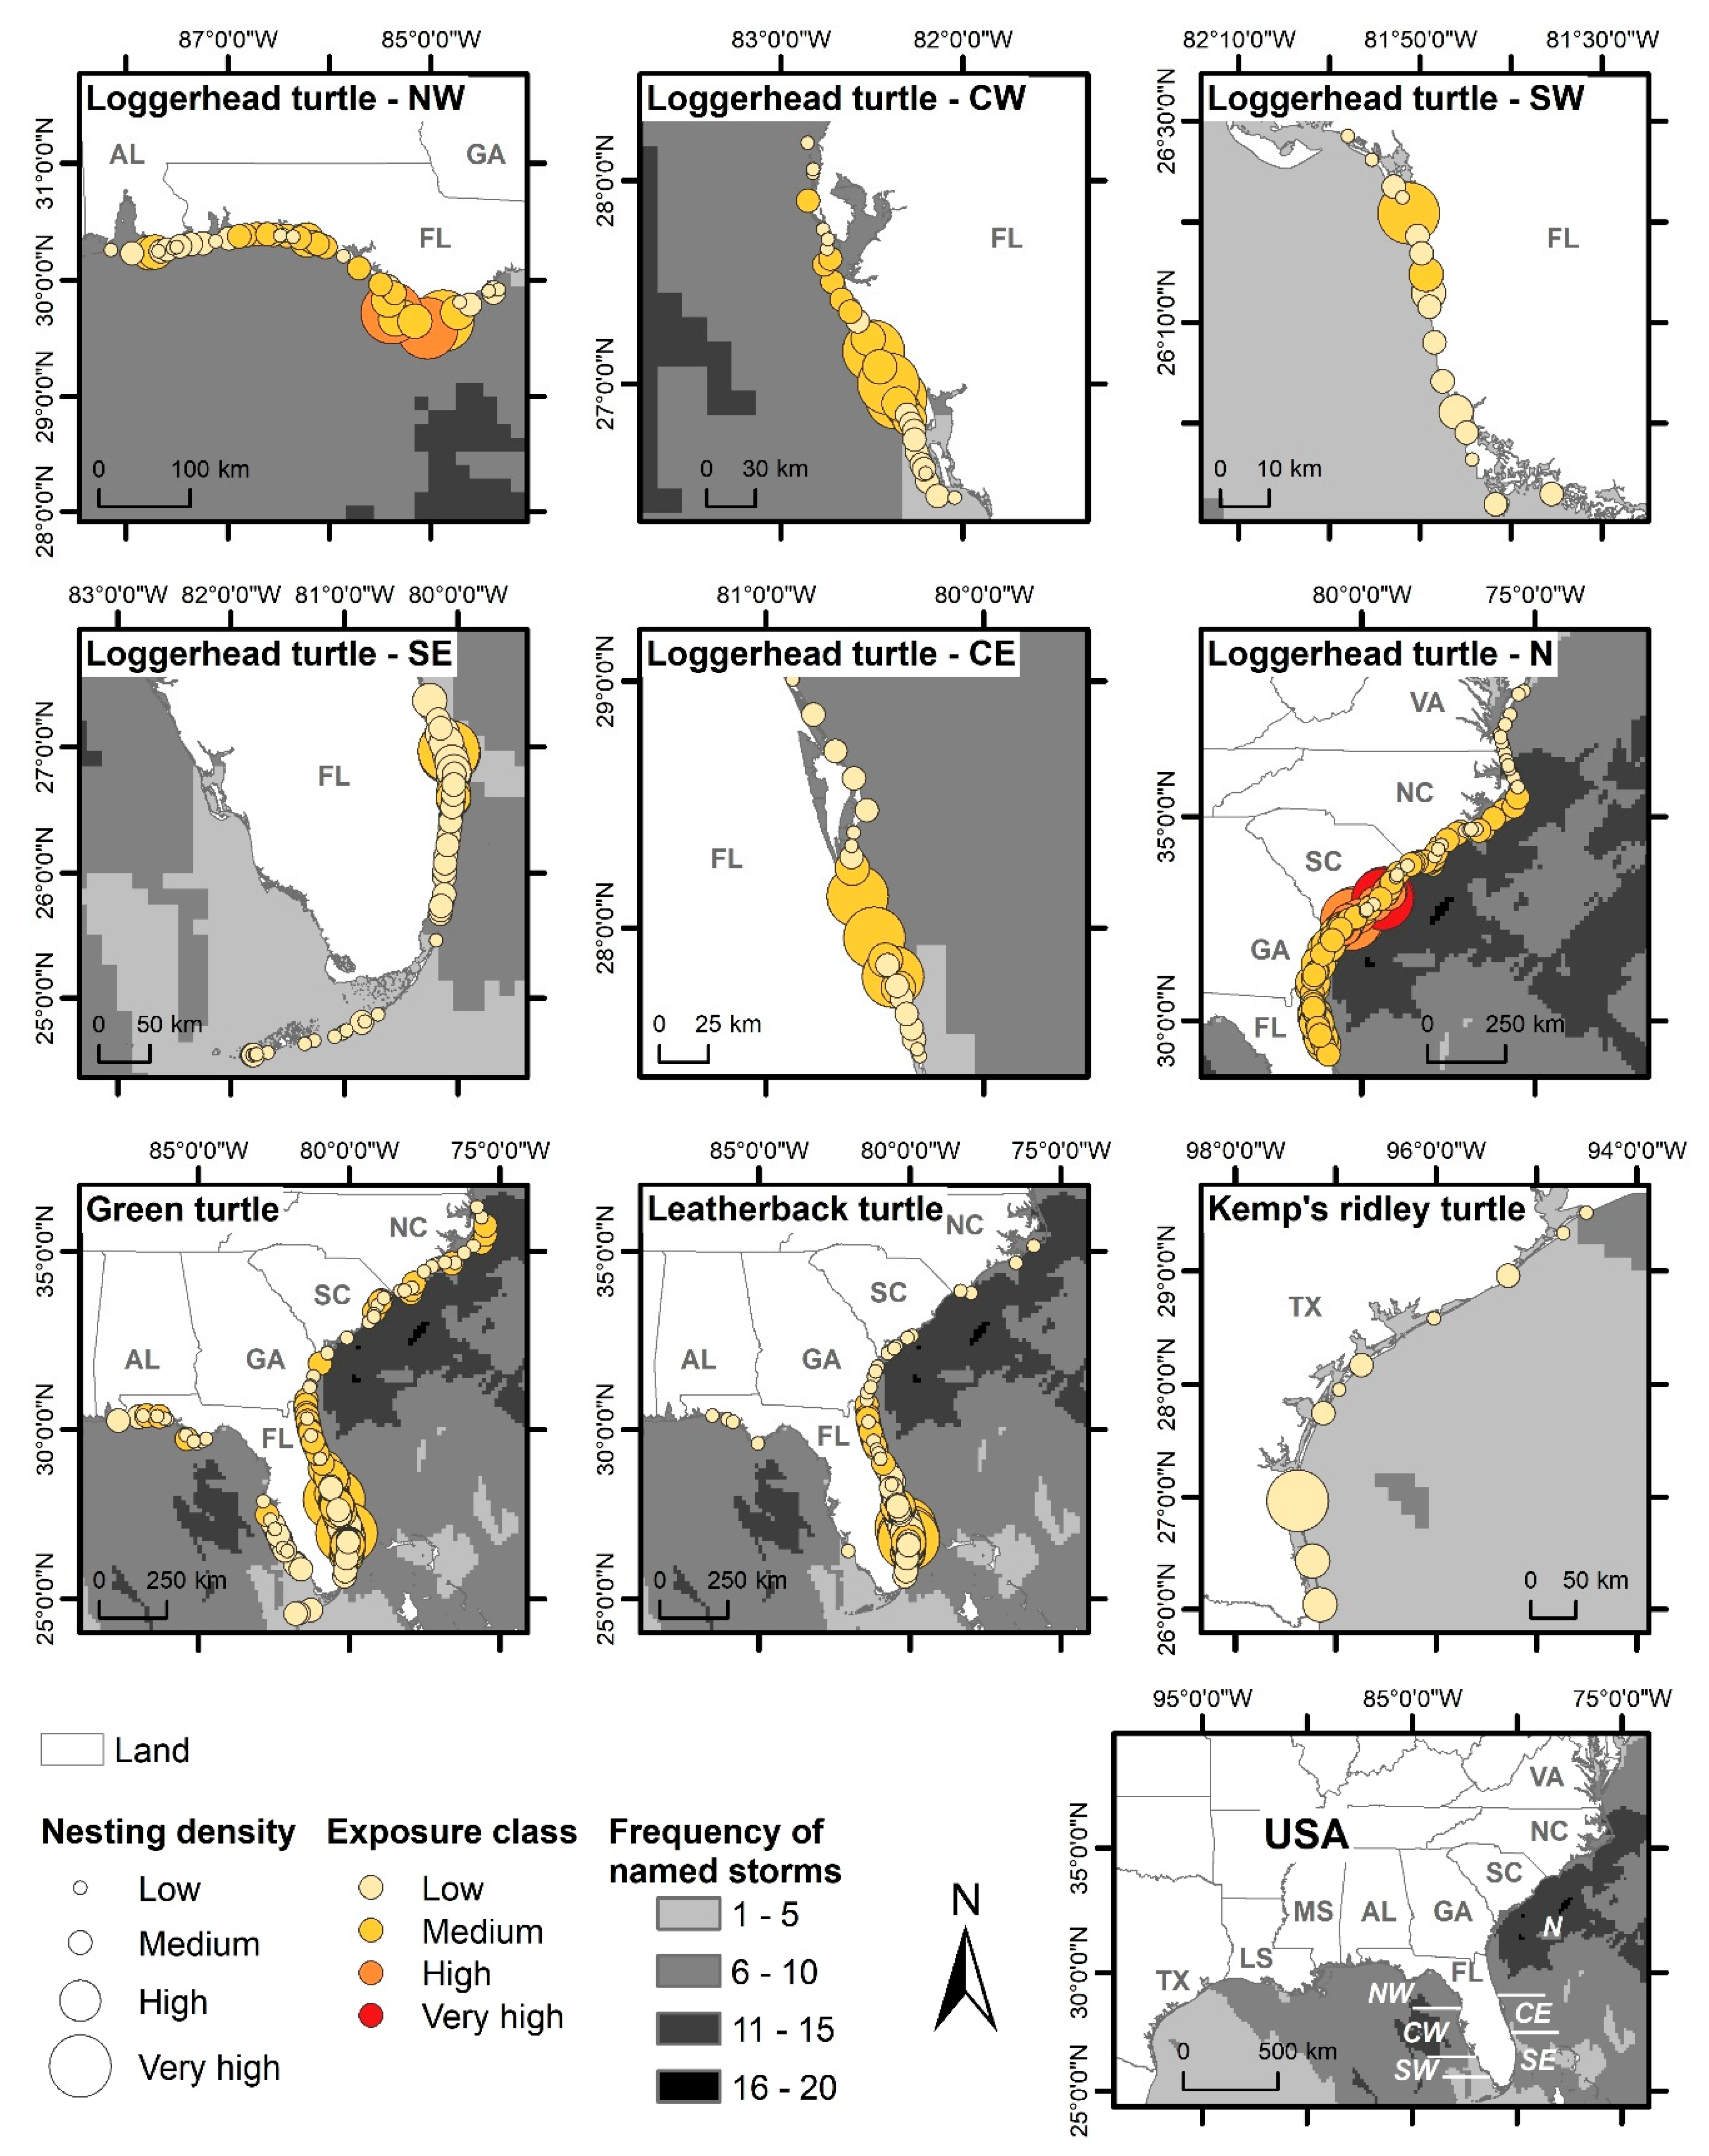
3.2. Spatial Exposure of Nesting Grounds to Named Storms

Spatial distribution of named storms from 2008–2018 varied across the study region. The northern extent of the eastern USA coast, from Georgia to North Carolina, overlapped with the highest frequency of named storms (11–15 named storms over ten years, or ~1 named storm every year; Figure 4). At the species level, there were significant differences in the average exposure of nesting grounds to named storms across the study period (2008–2018) (GLM fit with negative binomial distribution; X2 = 30.843, df = 3, p = 9.17e-7), with loggerhead turtles being the most exposed species to named storms and Kemp’s ridley turtles the least exposed (Table 1, Figure 4). A post-hoc Tukey test (Table S1) indicated that the exposure of Kemp’s ridley turtles is significantly lower than the exposure of all other species. Similarly, the exposure of leatherback turtles was significantly lower than the exposure of loggerhead turtles (Table S1). There were no significant differences between the exposure of green turtles and that of loggerhead turtles or leatherback turtles (Table S1).

3.2.1. Loggerhead Turtles

Exposure of loggerhead turtles to named storms was, on average, medium (0.27, range 0.05 – 0.92; Table 1, Figure 4) across their nesting range. Nearly 45% of nesting grounds were exposed to medium levels of named storms while 5% of nesting grounds reached high and very high exposure levels. In addition, exposure differed significantly at management unit level (GLM fit with negative binomial distribution; X2 = 148.16, df = 5, p = 2.210-16). Based on a post-hoc Tukey test (Table S2), the exposure to named storms of the northern unit was significantly higher than the exposure to named storms of all other management units. Further, within the Gulf of Mexico, the north-western management unit had significantly more exposure to named storms than the south-western management unit (Excel S1). Within the northern unit, exposure reached very high levels in Cape Island and Lighthouse Island in South Carolina, both of which are very high-density nesting grounds for loggerhead turtles (Figure 4; Excel S1). High levels of exposure to named storms were also recorded in other very high-density nesting grounds across the nesting range, such as Edisto Beach State Park and Botany Bay Island in South Carolina (northern unit), and Cape St. George and St. Joseph Peninsula in Florida (north-western unit) (Figure 4; Excel S1). Lowest exposure levels were recorded within the southern and central Florida management units, namely in the south-eastern (e.g., Lower Matecumbe Sea Oats Beach and Fat Deer Key), south-western (e.g., Marco Island and Big Hickory Island), central-eastern (e.g., Fort Pierce Inlet State Park and North Saint Lucie County Beaches), and central-western (e.g., North Captiva Island (South) and Sanibel Island (East)) management units. Named storm frequency along the northern unit averaged 10 named storms from 2008–2018 (or roughly one named storm every year), while average frequency of named storms that crossed the remaining management units ranged between 4.8 (one named storm every 2.3 years in the south-western unit) and 6.7 (one named storm every 1.5 years in the north-western unit) (Table 1).

3.2.2. Green Turtles

Exposure of green turtles to named storms reached, on average, low levels across the range (0.24, range 0.07–0.42; Table 1, Figure 4). Across the nesting range, over 40% of nesting grounds recorded medium levels of exposure to named storms (Excel S1). Nearly 35% of nesting grounds along the coast of Florida displayed medium exposure to named storms, including all very high-density nesting grounds along the eastern coast (i.e., South Brevard, Coral Cave, and Tequesta beaches) and 24 out of the 38 high-density nesting grounds (Figure 4; Excel S1). Medium levels of exposure were also recorded for all medium density nesting grounds from Georgia to North Carolina. In contrast, the lowest exposure to named storms recorded was for St. Joseph Peninsula State Park, St. Vincent National Wildlife Refuge and Ten Thousand Islands National Wildlife Refuge in Florida (Figure 4; Excel S1). In terms of named storm frequency, green turtle nesting grounds in South Carolina and North Carolina received each an average of one annual named storm every year, while those in Georgia received one named storm every 1.2 years, and those in Florida and Alabama received roughly one named storm on a biannual basis.

3.2.3. Leatherback Turtles

Leatherback turtle nesting grounds displayed, on average, low levels of exposure to named storms (0.22, range 0.08–0.32; Table 1, Figure 4), with just over 30% of nesting grounds across the range recording medium levels of exposure (Excel S1). The highest levels of exposure to named storms were registered for Florida, where nearly 40% of nesting grounds displayed medium exposure levels —all located along the eastern coast—including all very high-density nesting grounds (i.e., Hobe Sound National Wildlife Refuge, John D. MacArthur Beach State Park, Jupiter/Juno Beach, and Palm Beach Shores) (Figure 4; Excel S1). Furthermore, exposure of high-density nesting grounds along the coast of Florida was evenly split between low (56% of nesting beaches) and medium (44%) levels of exposure (Excel S1). In contrast, the lower levels of exposure to named storms were recorded for Sanibel Island (East) and Jetty Park in Florida, and Hilton Head Island in South Carolina. Exposure to named storms remained low across all other states (Georgia, South Carolina and North Carolina). Across the nesting range, named storm frequency averaged one named storm every 1.6 years.

3.2.4. Kemp’s Ridley Turtles

The exposure of Kemp’s ridley turtles was, on average, low across their range in Texas (0.12, range 0.05–0.21; Table 1, Figure 4). The highest levels of exposure to named storms were recorded for all very high- and high-density nesting grounds (i.e., Boca Chica, South Padre Island, and North Padre Island) and one medium density nesting ground (Matagorda Island) (Figure 4; Excel S1). The lowest exposure to named storms was recorded for the Matagorda Peninsula, Galveston Island, Mustang Island, and San Jose Island. Named storm frequency along Kemp’s ridley nesting grounds was on average one named storm every three years.

3.3. Case Study: Disturbance by Named Storms in North Carolina, USA

A total of 799 marine turtle nests (loggerhead turtles = 765, green turtles = 20, Kemp’s ridley turtles = 12, and leatherback turtles = 2) were laid in North Carolina during the 2018 nesting season, with the first documented nest laid on 10 May and the last nest laid on 06 September. Kemp’s ridley turtles nested from 18 May to 07 July and leatherback turtles nested from 19 May to 02 June, and therefore were not impacted by Hurricane Florence. One-hundred and twenty-two (16%) loggerhead nests were laid after 19 July. These nests had significantly lower hatching success when compared to those nests laid on 19 July or earlier (p < 0.0001, Kruskal–Wallace nonparametric test, with Dunn’s multiple comparison test post-hoc, Table 2). Green turtle hatching success was not significantly different for nests laid before or after hurricane Florence (Table 2).
Together, loggerhead turtle and green turtle nests laid north of 35° had significantly higher hatching success than those laid south of 35° (p < 0.001, Kruskal–Wallace nonparametric test), Dunn’s multiple comparison test post-hoc revealed that only the hatching success of green turtles nests in the northern part of North Carolina was significantly higher (Table 3).

4. Discussion

All species of marine turtles nesting in the continental USA are exposed to named storms and associated impacts. Variation in exposure to named storms was driven by the spatial distribution of each population’s nesting grounds, with populations nesting in the northern extent of the eastern USA from Georgia to North Carolina being the most exposed. Consequently, loggerhead turtles were found to be the most exposed species, with the northern management unit having significantly higher exposure levels than all other loggerhead management units. Kemp’s ridley turtles, in contrast, were found to be the least exposed species to named storms given their restrained geographic extent, with nesting only on the western coast of the Gulf of Mexico.
The impact that each nesting ground species, and ultimately populations will experience from named storms is a function of their exposure to the storms, the temporal overlap between the storms and nesting and hatching, the importance of each of the nesting grounds in terms of numbers of incubating eggs during the storm, and nest placement on the beach [13,14]. In our study, a significantly higher number of named storms occurred during the summer months which overlaps with marine turtle nesting and hatching season in the region. However, leatherback turtles and Kemp’s ridley turtles have been less exposed to storms as they nest earlier in the season (the first half of their nesting season occurs outside the hurricane season) and thus their eggs are exposed to storms for a shorter period (only the beginning of the storm season, which historically has had fewer storms). Nevertheless, our work indicates that storm frequency is becoming more evenly distributed throughout the storm season, due to the increased duration of storm effects, which could have a larger effect on all marine turtle nesting and hatching in the southeast USA due to the prolonged duration of storm effects.
This increase in exposure can have negative impacts on the reproductive output of marine turtles at each nesting ground. As indicated by our case study and other studies, named storms can dramatically decrease hatching success and overall productivity [18,20,59]. Impacts on the overall productivity of nesting populations will be driven by the importance of the nesting ground (in terms of the percentage of turtles from a population that nests on that site) that the named storm hits. Indeed, Fuentes et al. [13] found that the impacts of named storms to the northern Great Barrier Reef green turtle population can be 100 times higher if it hits the main nesting sites for this population rather than a trivial nesting ground. In our study, high levels of exposure to named storms were recorded in very high-density nesting grounds used by the northern management unit (Cape Island and Lighthouse Island) and high-density nesting grounds (Cape St. George and St. Joseph Peninsula) used by the north-western management unit. Aperiodic impacts from named storms might be an issue particularly for the north-western management unit as it is one of the smallest loggerhead management units within the Northwest Atlantic Ocean Distinct Population Segment [60]. Thus, any impact to this management unit can have severe implications for population stability.
Nest placement on a beach will also affect the impact that named storms will have on overall reproductive output, with nests being placed closer to the high tide line being more vulnerable [61,62]. In our case study, distance (i.e., km) from where the hurricane made landfall seems to have made little impact on the overall hatching success of loggerhead nests deposited post-Hurricane Florence. In contrast, green turtle eggs on beaches further away from the hurricane had significantly higher hatching success. This might be due to species-specific differences in nest-site selection relative to the dune line: on the same nesting grounds, green turtles tend to lay their eggs closer to the dune line than loggerhead turtles, which tend to nest closer to the high tide line [63]. This difference may protect green sea turtle nests from excessive washover.
Even though named storms can directly impact nests that are incubating at the time of landfall, some of the reproductive strategies used by marine turtles can help mitigate the impacts of these discrete events and allow faster than expected recovery from disturbances [14]. Traits include large clutches (approximately 100 eggs/clutch), laying multiple clutches within a nesting season (2–7 clutches depending on species) which are spaced throughout the season (2–3 weeks apart), and extended nesting seasons (several months) [64]. Nevertheless, despite marine turtles having these traits and the ability to withstand the loss of a single cohort of eggs [65], frequent disturbances to incubating eggs (and thus low hatching success over time) from named storms can potentially have a profound effect on the longer-term reproductive output of a population, potentially exerting substantial selective pressures [13,66,67]. This might have been the case for marine turtles nesting in the eastern Queensland coast of Australia, as they currently nest in areas with historically low incidence of tropical cyclones [13]. It was hypothesized by the authors that areas with a high incidence of tropical cyclones might have substantially affected nesting and/or hatching success over time, reducing the number of turtles that return to nest in these areas over several generations [13], which would mean that cyclone activity was an important factor in shaping the distribution of marine turtle nesting grounds along the eastern Queensland coast. Such effects still need to be assessed in the USA.
As climate change progresses, storms may become more frequent and intense [68] and sea level may continue to rise, potentially causing significant alteration of the physical structure of nesting grounds. This coupled with contemporary anthropogenic threats (e.g., coastal development, pollution), may hinder the ability of marine turtle traits to buffer impacts from named storms. This highlights the need to understand how predicted changes in named storm frequency and distribution may affect marine turtle populations; studies such as the present one will provide baseline information for comparison. Future studies should also explore how different pressures (e.g., storm surge, temperature, rainfall), associated with named storms affect hatching success to provide further insights into how named storms with different characteristics may affect marine turtle reproductive output at a site. Importantly, cumulative and synergetic effects from other climatic processes and anthropogenic stressors also need to be considered. Climate processes will not act in isolation and they may produce unexpected changes in combination with local conditions and other pressures [69,70]. For example, seawalls and other structures to protect beaches in Florida from erosion associated with named storms can impede reproductive female marine turtles from accessing nesting habitat [71]. Additionally, the number of structures placed on some beaches increased following named storms [72], suggesting that in the future nesting females may face impediments to nesting grounds more frequently, as the frequency of named storms increases.

5. Conclusions

Remote sensing information on named storm track proved useful in determining the exposure of marine turtle nesting grounds to named storms and identifying populations and species at most risk from impacts. Our broad-scale assessment allowed us to identify areas with higher exposure to named storms, which warrants site-specific assessments of impacts. Site-specific assessment can benefit from the use of other datasets obtained through remote sensing (e.g., LiDAR, satellite microwave radiometers, imagery) to help monitor flood conditions, land cover change, and erosion at marine turtle nesting grounds and determine impact to productivity [73]. An understanding of the exposure of marine turtle nesting grounds to named storms, as obtained here, can be used as a baseline as climate change progresses and storms intensify and become more frequent.

Supplementary Materials

The following are available online at https://www.mdpi.com/2072-4292/11/24/2996/s1, Table S1: Pairwise comparisons (Tukey HSD) to assess differences in the exposure to storms among sea turtle species. CM—green turtle (Chelonia mydas), CC—loggerhead turtle (Caretta caretta), LK—Kemp’s ridley turtle (Lepidochelys kempii), and leatherback turtle (Dermochelys coriacea). Significance codes: 0 ‘***’, 0.001 ‘**’, 0.01 ‘*’, 0.05 ‘.’. Table S2: Pairwise comparisons (Tukey HSD) to assess differences in the exposure to storms among loggerhead management units. Loggerhead management units: north-western (NW), central-western Florida (CW), south-western Florida (SW), south-eastern Florida (SE), central-eastern Florida (CE) and northern (N). Significance codes: 0 ‘***’, 0.001 ‘**’, 0.01 ‘*’, 0.05 ‘.’. Excel S1: List of all marine turtle nesting grounds with an indication of their nesting density and exposure to named storms.

Author Contributions

Conceptualization, M.M.P.B.F., M.H.G. and N.W.; methodology, M.M.P.B.F.; N.W. formal analysis, M.W., M.H.G. and N.W.; resources M.M.P.B.F.; data curation, N.W.; D.K.I.; C.G.; D.S.; S.C.; M.H.G.; R.B. and D.I.; writing—original draft preparation, M.M.P.B.F.; M.H.G. and N.W.; writing—review and editing, M.M.P.B.F.; M.W.; N.W.; C.G.; D.S.; and S.C. visualization, M.M.P.B.F. and N.W.; supervision, M.M.P.B.F.; project administration, M.M.P.B.F.

Funding

This research received no external funding.

Acknowledgments

The collection of the nesting data included in these analyses would not be possible without the dedication and hard work of thousands of permit holders and volunteers who carried out the beach surveys. We thank the many volunteer and collaborators in the Southeast USA who monitor and collect data on marine turtle nests along these beaches. We would like to acknowledge Miss Alexandra Lee, who provided inputs to a preliminary version of this study. The findings and conclusions in this article are those of the author(s) and do not necessarily represent the views of the U.S. Fish and Wildlife Service. We thank participants of the Florida Sea Turtle Permit Holder network for the collection of sea turtle nesting data. Funding for Florida’s sea turtle nest programs has come from the US Fish and Wildlife Service and from the Florida Marine Resources Conservation Trust Fund.

Conflicts of Interest

The authors declare no conflict of interest.

References

  1. Wallace, B.P.; Hutchinson, B.J.; Mast, R.B.; Pilcher, N.J. Putting conservation priority-setting for marine turtles in context. Anim. Conserv. 2011, 14, 14–15. [Google Scholar] [CrossRef]
  2. Wallace, B.P.; DiMatteo, A.D.; Bolten, A.B.; Chaloupka, M.Y.; Hutchinson, B.J.; Abreu-Grobois, F.A.; Mortimer, J.A.; Seminoff, J.A.; Amorocho, D.; Bjorndal, K.A.; et al. Global conservation priorities for marine turtles. PLoS ONE 2011, 6, e24510. [Google Scholar] [CrossRef] [PubMed]
  3. Fuentes, M.M.P.B.; Blackwood, J.; Jones, B.; Kim, M.; Leis, B.; Limpus, C.J.; Marsh, H.; Mitchell, J.; Pouzols, F.M.; Pressey, R.L.; et al. A decision framework for prioritizing multiple management actions for threatened marine mega-fauna. Ecol. Appl. 2014, 25, 200–214. [Google Scholar] [CrossRef] [PubMed]
  4. Klein, C.J.; Beher, J.; Chaloupka, M.Y.; Hamann, M.; Limpus, C.J.; Possingham, H.P. Prioritization of marine turtle management projects: A protocol that accounts for threats to different life history stages. Conserv. Lett. 2016, 10, 547–554. [Google Scholar] [CrossRef]
  5. Bolten, A.B.; Crowder, L.B.; Dodd, M.G.; MacPherson, S.L.; Musick, J.A.; Schroeder, B.A.; Witherington, B.E.; Long, K.J.; Snover, M.L. Quantifying multiple threats to endangered species: An example from loggerhead sea turtles. Front. Ecol. Environ. 2011, 9, 295–301. [Google Scholar] [CrossRef] [Green Version]
  6. Wallace, B.P.; Lewison, R.L.; McDonald, S.L.; McDonald, R.K.; Kot, C.Y.; Kelez, S.; Bjorkland, R.K.; Finkbeiner, E.M.; Helmbrecht, S.; Crowder, L.B. Global patterns of marine turtle bycatch. Conserv. Lett. 2010, 3, 131–142. [Google Scholar] [CrossRef]
  7. Lewison, R.L.; Crowder, L.B.; Wallace, B.P.; Moore, J.E.; Cox, T.; Zydelis, R.; McDonald, S.; DiMatteo, A.; Dunn, D.C.; Kot, C.Y.; et al. Global patterns of marine mammal, seabird, and sea turtle bycatch reveal taxa-specific and cumulative megafauna hotspots. Proc. Natl. Acad. Sci. USA 2014, 111, 5271–5276. [Google Scholar] [CrossRef] [Green Version]
  8. Nelson Sella, K.A.; Fuentes, M.M.P.B. Exposure of marine turtle nesting grounds to coastal modifications: Implications for management. Ocean Coast. Manag. 2019, 169, 182–190. [Google Scholar] [CrossRef]
  9. Fuentes, M.M.P.B.; Gredzens, C.; Bateman, B.L.; Boettcher, R.; Ceriani, S.A.; Godfrey, M.H.; Helmers, D.; Ingram, D.K.; Kamrowski, R.L.; Pate, M.; et al. Conservation hotspots for marine turtle nesting in the United States based on coastal development. Ecol. Appl. 2016, 26, 2706–2717. [Google Scholar] [CrossRef]
  10. Nelson Sella, K.; Sicius, L.; Fuentes, M.M.P.B. Using expert elicitation to determine the relative impact of coastal modifications on marine turtle nesting grounds. Coast. Manag. 2019, 47, 492–506. [Google Scholar] [CrossRef]
  11. Schuyler, Q.A.; Wilcox, C.; Townsend, K.A.; Wedemeyer-Strombel, K.R.; Balazs, G.H.; van Sebille, E.; Hardesty, B.D. Risk analysis reveals global hotspots for marine debris ingestion by sea turtles. Glob. Chang. Biol. 2016, 22, 567–576. [Google Scholar] [CrossRef] [PubMed]
  12. Kamrowski, R.L.; Limpus, C.J.; Moloney, J.; Hamann, M. Coastal light pollution and marine turtles: Assessing the magnitude of the problem. Endanger. Species Res. 2012, 19, 85–98. [Google Scholar] [CrossRef] [Green Version]
  13. Fuentes, M.M.P.B.; Bateman, B.L.; Hamann, M. Relationship between tropical cyclones and the distribution of sea turtle nesting grounds. J. Biogeogr. 2011, 38, 1886–1896. [Google Scholar] [CrossRef]
  14. Dewald, J.R.; Pike, D.A. Geographical variation in hurricane impacts among sea turtle populations. J. Biogeogr. 2014, 41, 307–316. [Google Scholar] [CrossRef]
  15. Morton, R.A.; Barras, J.A. Hurricane impacts on coastal wetlands: A half-century record of storm-generated features from southern Louisiana. J. Coast. Res. 2011, 27, 27–43. [Google Scholar] [CrossRef]
  16. Sherman, D.J.; Hales, B.U.; Potts, M.K.; Ellis, J.T.; Liu, H.; Houser, C. Impacts of Hurricane Ike on the beaches of the Bolivar Peninsula, TX, USA. Geomorphology 2013, 199, 62–81. [Google Scholar] [CrossRef]
  17. Van Houtan, K.S.; Bass, O.L. Stormy oceans are associated with declines in sea turtle hatching. Curr. Biol. 2007, 17, R590–R591. [Google Scholar] [CrossRef] [Green Version]
  18. Milton, S.L.; Leone-Kabler, S.L.; Schulman, A.A.; Lutz, P.L. Effects of Hurricane Andrew on the sea turtle nesting beaches of south Florida. Bull. Mar. Sci. 1994, 54, 974–981. [Google Scholar]
  19. Pike, D.A.; Stiner, J.C. Sea turtle species vary in their susceptibility to tropical cyclones. Oecologia 2007, 153, 471–478. [Google Scholar] [CrossRef]
  20. Martin, R.E. Storm impacts on loggerhead turtle reproductive sucess. Mar. Turt. Newsl. 1996, 73, 10–12. [Google Scholar]
  21. Long, T.M.; Angelo, J.; Weishampel, J.F. LiDAR-derived measures of hurricane- and restoration-generated beach morphodynamics in relation to sea turtle nesting behaviour. Int. J. Remote Sens. 2011, 32, 231–241. [Google Scholar] [CrossRef]
  22. Reed, P. The Sex Ratios of Hatchling Loggerhead Turtles—The Progeny of Two Nesting Adult Females. Ph.D. Thesis, James Cook University, Townsville, Australia, 1980. [Google Scholar]
  23. Godfrey, M.H.; Barreto, R.; Mrosovsky, N. Estimating past and present sex ratios of sea turtles in Suriname. Can. J. Zool. 1996, 74, 267–277. [Google Scholar] [CrossRef]
  24. Houghton, J.D.R.; Myers, A.E.; Lloyd, C.; King, R.S.; Isaacs, C.; Hays, G.C. Protracted rainfall decreases temperature within leatherback turtle (Dermochelys coriacea) clutches in Grenada, West Indies: Ecological implications for a species displaying temperature dependent sex determination. J. Exp. Mar. Bio. Ecol. 2007, 345, 71–77. [Google Scholar] [CrossRef]
  25. Miller, J.D.; Limpus, C.J. Incubation period and sexual differentiation in the green turtle Chelonia mydas L. In Proceedings of the Melbourne Herpetological Symposium; Banks, C.B., Martin, A.A., Eds.; The Zoological Board of Victoria: Melbourne, Australia, 1981; pp. 66–73. [Google Scholar]
  26. Morreale, S.J.; Ruiz, G.J.; Spotila, J.R.; Standora, E.A. Temperature-dependent sex determination: Current practices threaten conservation of sea turtles. Science 1982, 216, 1245–1247. [Google Scholar] [CrossRef] [PubMed]
  27. Webster, P.J.; Holland, G.J.; Curry, J.A.; Chang, H.-R. Changes in tropical cyclone number, duration, and intensity in a warming environment. Science 2005, 309, 1844–1846. [Google Scholar] [CrossRef] [PubMed] [Green Version]
  28. Goldenberg, S.B.; Landsea, C.W.; Mestas-Nuñez, A.M.; Gray, W.M. The recent increase in Atlantic hurricane activity: Causes and implications. Science 2001, 293, 474–479. [Google Scholar] [CrossRef] [PubMed] [Green Version]
  29. Zhao, H.; Duan, X.; Raga, G.B.; Sun, F. Potential large-scale forcing mechanisms driving enhanced North Atlantic tropical cyclone activity since the mid-1990s. J. Clim. 2018, 31, 1377–1397. [Google Scholar] [CrossRef]
  30. Fraza, E.; Elsner, J.B.; Jagger, T.H. A space–time statistical climate model for hurricane intensification in the North Atlantic basin. Adv. Stat. Climatol. Meteorol. Oceanogr. 2016, 2, 105–114. [Google Scholar] [CrossRef] [Green Version]
  31. Shamblin, B.M.; Dodd, M.G.; Bagley, D.A.; Ehrhart, L.M.; Tucker, A.D.; Johnson, C.; Carthy, R.R.; Scarpino, R.A.; McMichael, E.; Addison, D.S.; et al. Genetic structure of the southeastern United States loggerhead turtle nesting aggregation: Evidence of additional structure within the peninsular Florida recovery unit. Mar. Biol. 2011, 158, 571–587. [Google Scholar] [CrossRef]
  32. Shamblin, B.M.; Bolten, A.B.; Bjorndal, K.A.; Dutton, P.H.; Nielsen, J.T.; Abreu-Grobois, F.A.; Reich, K.J.; Witherington, B.E.; Bagley, D.A.; Ehrhart, L.M.; et al. Expanded mitochondrial control region sequences increase resolution of stock structure among North Atlantic loggerhead turtle rookeries. Mar. Ecol. Prog. Ser. 2012, 469, 145–160. [Google Scholar] [CrossRef] [Green Version]
  33. U.S. Fish and Wildlife Service; U.S. National Marine Fisheries Service. Recovery Plan for U.S. Population of Atlantic Green Turtle (Chelonia Mydas); NMFS: Washington, DC, USA, 1991.
  34. U.S. National Marine Fisheries Service; U.S. Fish and Wildlife Service. Recovery Plan for the Northwest Atlantic Population of the Loggerhead Sea Turtle (Caretta Caretta), 2nd ed.; NMFS: Silver Spring, MD, USA, 2008.
  35. U.S. National Marine Fisheries Service; U.S. Fish and Wildlife Service; Mexican Secretariat of Environmental and Natural Resources. Bi-National Recovery Plan for the Kemp’s Ridley Sea Turtle (Lepidochelys Kempii), 2nd ed.; NMFS: Silver Spring, MD, USA, 2011.
  36. U.S. National Marine Fisheries Service; U.S. Fish and Wildlife Service. Recovery Plan for Leatherback Turtles in the U.S. Caribbean, Atlantic and Gulf of Mexico; NMFS: Washington, DC, USA, 1992.
  37. Shaver, D.J.; Rubio, C.; Walker, J.S.; George, J.; Amos, A.F.; Reich, K.J.; Jones, C.; Shearer, T. Kemp’s ridley sea turtle (Lepidochelys kempii) nesting on the Texas coast: Geographic, temporal, and demographic trends through 2014. Gulf Mex. Sci. 2016, 2, 158–178. [Google Scholar] [CrossRef]
  38. South Carolina DNR Loggerhead Sea Turtle (Caretta caretta). Available online: http://www.dnr.sc.gov/marine/turtles/cc.htm (accessed on 15 January 2019).
  39. Georgia DNR Loggerhead Sea Turtle Fact Sheet. Available online: https://georgiawildlife.com/conservation/seaturtles (accessed on 15 January 2019).
  40. Talbert, O.R., Jr.; Stancyk, S.E.; Dean, J.M.; Will, J.M. Nesting activity of the loggerhead turtle (Caretta caretta) in South Carolina I: A rookery in transition. Copeia 1980, 1980, 709–719. [Google Scholar] [CrossRef]
  41. Halls, J.N.; Randall, A.L. Nesting patterns of loggerhead sea turtles (Caretta caretta): Development of a multiple regression model tested in North Carolina, USA. Int. J. Geo-Inf. 2018, 7, 348. [Google Scholar] [CrossRef] [Green Version]
  42. Davis, G.E.; Whiting, M.C. Loggerhead sea turtle nesting Everglades National Park, Florida, USA. Herpetologica 1977, 33, 18–28. [Google Scholar]
  43. Dodd, M.G. Synopsis of the Biological Data on the Loggerhead Sea Turtle Caretta Caretta (Linnaeus 1758); Biological Report, Fish and Wildlife Service; U.S. Department of the Interior: Washington, DC, USA, 1988.
  44. Witherington, B.E.; Bresette, M.; Herren, R.M. Chelonia mydas—Green turtle. In Biology and Conservation of Florida Turtles; Meylan, P.A., Ed.; Chelonian Research Foundation: Phnom Penh, Cambodia, 2006; pp. 90–104. [Google Scholar]
  45. Brost, B.; Witherington, B.E.; Meylan, A.B.; Leone, E.; Ehrhart, L.M.; Bagley, D.A. Sea turtle hatchling production from Florida (USA) beaches, 2002–2012, with recommendations for analyzing hatching success. Endanger. Species Res. 2015, 27, 53–68. [Google Scholar] [CrossRef] [Green Version]
  46. Caldwell, D.K. The loggerhead turtles of Cape Romain, South Carolina. Bull. Fla. State Mus. 1959, 4, 319–348. [Google Scholar]
  47. U.S. Fish and Wildlife Service Green Sea Turtle (Chelonia mydas). Available online: https://www.fws.gov/northflorida/seaturtles/turtle factsheets/green-sea-turtle.htm (accessed on 15 January 2019).
  48. U.S. Fish and Wildlife Service Leatherback Sea Turtle (Dermochelys coriacea). Available online: https://www.fws.gov/northflorida/seaturtles/turtle factsheets/leatherback-sea-turtle.htm (accessed on 15 January 2019).
  49. Stewart, K.R.; Johnson, C. Dermochelys coriacea—Leatherback sea turtle. In Biology and Conservation of Florida Turtles; Meylan, P.A., Ed.; Chelonian Research Foundation: Phnom Penh, Cambodia, 2006; pp. 144–157. [Google Scholar]
  50. National Hurricane Center National Hurricane Center. Available online: https://www.nhc.noaa.gov/ (accessed on 20 September 2002).
  51. Dvorak, V.F. A Technique for the Analysis and Forecasting of Tropical Cyclone Intensities from Satellite Pictures; NOAA Tech(National Technical Information Service): Washington, DC, USA, 1973. [Google Scholar]
  52. National Hurricane Center. National Hurricane Center Product Description Document: A User’s Guide to Hurricane Products; National Hurricane Center: Miami, FL, USA, 2019.
  53. Knapp, K.R.; Kruk, M.C.; Levinson, D.H.; Diamond, H.J.; Neumann, C.J. The international best track archive for climate stewardship (IBTrACS). Bull. Am. Meteorol. Soc. 2010, 91, 363–376. [Google Scholar] [CrossRef]
  54. Wildermann, N. Flatbacks at Sea: Understanding Ecology in Foraging Populations. Ph.D. Thesis, James Cook University, Townsville, Australia, 2017. [Google Scholar]
  55. Shamblin, B.M.; Godfrey, M.H.; Pate, S.M.; Thompson, W.P.; Sutton, H.; Altman, J.; Fair, K.; McClary, J.; Wilson, A.M.N.; Milligan, B.; et al. Green turtles nesting at their northern range limit in the United States represent a distinct subpopulation. Chelonian Conserv. Biol. 2018, 17, 314–319. [Google Scholar] [CrossRef]
  56. Shamblin, B.M.; Bagley, D.A.; Ehrhart, L.M.; Desjardin, N.A.; Martin, E.; Hart, K.M.; Naro-Maciel, E.; Rusenko, K.C.; Stiner, J.; Sobel, D.; et al. Genetic structure of Florida green turtle rookeries as indicated by mitochondrial DNA control region sequences. Conserv. Genet. 2014, 16, 673–685. [Google Scholar] [CrossRef]
  57. Team, R.C. R: A Language and Environment for Statistical Computing; R Foundation for Statistical Computing: Vienna, Austria, 2018. [Google Scholar]
  58. Miller, J.D. Determining clutch size and hatching success. In Research and Management Techniques for the Conservation of Sea Turtles; Eckert, K.L., Bjorndal, K.A., Abreu-Grobois, F.A., Donnelly, M., Eds.; IUCN/SSC Marine Turtle Specialist Group: Gland, Switzerland, 1999; pp. 130–135. [Google Scholar]
  59. Ross, J.P. Hurricane effects on nesting Caretta caretta. Mar. Turt. Newsl. 2005, 108, 13–14. [Google Scholar]
  60. Richards, P.M.; Epperly, S.P.; Heppell, S.S.; King, R.T.; Sasso, C.R.; Moncada, F.; Nodarse, G.; Shaver, D.J.; Medina, Y.; Zurita, J.C. Sea turtle population estimates incorporating uncertainty: A new approach applied to western North Atlantic loggerheads Caretta caretta. Endanger. Species Res. 2011, 15, 151–158. [Google Scholar] [CrossRef]
  61. Fuentes, M.M.P.B.; Limpus, C.J.; Hamann, M.; Dawson, J. Potential impacts of projected sea-level rise on sea turtle rookeries. Aquat. Conserv. Mar. Freshw. Ecosyst. 2010, 20, 132–139. [Google Scholar] [CrossRef]
  62. Hays, G.C.; Speakman, J.R. Nest placement by loggerhead turtles, Caretta caretta. Anim. Behav. 1993, 45, 47–53. [Google Scholar] [CrossRef] [Green Version]
  63. Wetterer, J.K.; Wood, L.D.; Johnson, C.; Krahe, H.; Fitchett, S. Predaceous ants, beach replenishment, and nest placement by sea turtles. Environ. Entomol. 2007, 36, 655–656. [Google Scholar] [CrossRef]
  64. Miller, J.D. Reproduction in sea turtles. In The Biology of Sea Turtles; Lutz, P.L., Musick, J.A., Eds.; CRC Press: Boca Raton, FL, USA, 1997; Volume 1, pp. 51–81. [Google Scholar]
  65. Heppell, S.S.; Limpus, C.J.; Crouse, D.T.; Frazer, N.B.; Crowder, L.B. Population model analysis for the loggerhead sea turtle, Caretta caretta, in Queensland. Wildl. Res. 1996, 23, 143–161. [Google Scholar] [CrossRef]
  66. Zimmermann, N.E.; Yoccoz, N.G.; Edwards, T.C.; Meier, E.S.; Thuiller, W.; Guisan, A.; Schmatz, D.R.; Pearman, P.B. Climatic extremes improve predictions of spatial patterns of tree species. Proc. Natl. Acad. Sci. USA 2009, 106, 19723–19728. [Google Scholar] [CrossRef] [Green Version]
  67. Wootton, J.T. Effects of disturbance on species diversity: A multitrophic perspective. Am. Nat. 1998, 152, 803–825. [Google Scholar] [CrossRef]
  68. Knutson, T.; Camargo, S.J.; Chan, J.C.L.; Emanuel, K.; Ho, C.-H.; Kossin, J.; Mohapatra, M.; Satoh, M.; Sugi, M.; Walsh, K.; et al. Tropical cyclones and climate change assessment: Part II. Projected response to anthropogenic warming. Bull. Am. Meteorol. Soc. 2019. [Google Scholar] [CrossRef] [Green Version]
  69. Harley, C.D.G.; Randall Hughes, A.; Hultgren, K.M.; Miner, B.G.; Sorte, C.J.B.; Thornber, C.S.; Rodriguez, L.F.; Tomanek, L.; Williams, S.L. The impacts of climate change in coastal marine systems. Ecol. Lett. 2006, 9, 228–241. [Google Scholar] [CrossRef] [Green Version]
  70. Darling, E.S.; Côté, I.M. Quantifying the evidence for ecological synergies. Ecol. Lett. 2008, 11, 1278–1286. [Google Scholar] [CrossRef]
  71. Witherington, B.E.; Hirama, S.; Mosier, A. Sea turtle responses to barriers on their nesting beach. J. Exp. Mar. Bio. Ecol. 2011, 401, 1–6. [Google Scholar] [CrossRef]
  72. Witherington, B.E.; Hirama, S.; Mosier, A.E. Barriers to sea turtle nesting on Florida (United States) beaches: Linear extent and changes following storms. J. Coast. Res. 2011, 27, 450–458. [Google Scholar] [CrossRef]
  73. Klemas, V.V. The role of remote sensing in predicting and determining coastal storm impacts. J. Coast. Res. 2009, 1264–1275. [Google Scholar] [CrossRef] [Green Version]
Figure 1. Location of marine turtle nests and path of Hurricane Florence, which made landfall near Wrightsville Beach in south–central North Carolina on 14 September 2018 as a category 1 hurricane. The density of nests is represented for every 25 km.
Remotesensing 11 02996 g001
Figure 2. Total annual frequency (a) and monthly average frequency (b) of named storms that crossed USA marine turtle nesting grounds from 2008–2018.
Remotesensing 11 02996 g002
Figure 3. Monthly average of named storms that crossed USA marine turtle nesting grounds between two time-periods (2008–2012, and 2013–2018) compared to the typical USA nesting season for each species. Shaded areas represent the overall Atlantic storm season and the peak Atlantic storm season. Peak storm season as defined by the National Hurricane Center and Central Pacific Hurricane Center (https://www.nhc.noaa.gov/).
Remotesensing 11 02996 g003
Figure 4. Exposure of marine turtle nesting groundss to named storms (total frequency from 2008–2018) along the USA continental coast. Loggerhead turtle management units: north–western Florida (NW), central–western Florida (CW), south–western Florida (SW), south–eastern Florida (SE), central–eastern Florida (CE) and northern (N).
Remotesensing 11 02996 g004
Table 1. Nesting density class (low, medium, high and very high nesting density), the average number of named storms, and exposure of nesting grounds to named storms across the study period (2008–2018) for each marine turtle species and each loggerhead management unit.
Average Number of Named Storms from 2008–2018 (Range)Average Named Storm Exposure (Range)Average Named Storm Exposure Category
Loggerhead turtles7.6 (2–14)0.27 (0.05–0.92)Medium
Green turtles7.2 (4–13)0.24 (0.07–0.42)Low
Leatherback turtles6.8 (4–12)0.22 (0.08–0.32)Low
Kemp’s ridley turtles3.7 (2–6)0.12 (0.05–0.21)Low
Loggerhead management unit
North–western Florida (NW),6.7 (2–9)0.27 (0.10–0.57)Medium
Central–western Florida (CW)6.2 (4–8)0.23 (0.07–0.50)Low
South–western Florida (SW)4.8 (4–5)0.16 (0.07–0.35)Low
South–eastern Florida (SE)4.9 (3–7)0.17 (0.05–0.32)Low
Central–eastern Florida (CE)5.5 (4–8)0.21 (0.07–0.42)Low
Northern (N)10.0 (6–14)0.36 (0.10–0.92)Medium
Table 2. Average hatching success (HS) for nests of different species of marine turtles in North Carolina, laid pre-hurricane (before 19 July 2018) and post-hurricane (after 19 July 2018).
HS for Pre-Hurricane Nests (SD)Number of Nests (% of Nests for Each Species)HS for Post-Hurricane Nests (SD)Number of Nests (% of Nests for Each Species)p Value
Loggerhead turtles73.1 (32.1)635 (84%)18.7 (33.9)122 (16%)<0.0001
Green turtles36.7 (35.9)7 (35%)29.4 (43.0)13 (65%)>0.05
Kemp’s ridley turtles64.5 (34.8)12 (100%)None laidNone laidn/a
Leatherback turtles1.5 (2.0)2 (100%)None laidNone laidn/a
Table 3. Average HS for nests laid post-hurricane (after 19 July 2018) by different species of sea turtles in North Carolina, located north of 35° and presumably less impacted by Hurricane Florence, or located south of 35° and thus more susceptible to hurricane impacts.
HS <35° Latitude (SD)Number of Nests (% of Nests for Each Species)HS >°35 Latitude (SD)Number of Nests (% of Nests for Each Species)p Value
(Dunn’s Multiple Comparison Test)
Loggerhead turtles16.5 (33.9)79 (64.7%)22.9 (33.9)43 (35.3%)>0.05
Green turtles2.3 (6.5)8 (61.5%)72.7 (40.8)5 (38.5%)<0.01

