Article

Spatiotemporal Analysis of Precipitation in the Sparsely Gauged Zambezi River Basin Using Remote Sensing and Google Earth Engine

1
State Key Laboratory of Remote Sensing Science, Aerospace Information Research Institute, Chinese Academy of Sciences, Beijing 100101, China
2
University of Chinese Academy of Sciences, Beijing 100049, China
3
Department of Geography, the Ohio State University, Columbus, OH 43202, USA
4
Department of Soil Science, School of Agricultural Sciences, University of Zambia, Lusaka 32379, Zambia
5
Town and Regional Planning Department, Faculty of Engineering and the Built Environment, University of Johannesburg, Johannesburg 2006, South Africa
6
Physics Department, University of Zimbabwe, Mt. Pleasant, Harare P.O. Box MP167, Zimbabwe
*
Author to whom correspondence should be addressed.
Remote Sens. 2019, 11(24), 2977; https://doi.org/10.3390/rs11242977
Submission received: 8 October 2019 / Revised: 22 November 2019 / Accepted: 5 December 2019 / Published: 11 December 2019
(This article belongs to the Special Issue Precipitation and Water Cycle Measurements Using Remote Sensing)

Abstract

:
Precipitation plays an important role in the food production of Southern Africa. Understanding the spatial and temporal variations of precipitation is helpful for improving agricultural management and flood and drought risk assessment. However, a comprehensive precipitation pattern analysis is challenging in sparsely gauged and underdeveloped regions. To solve this problem, Version 7 Tropical Rainfall Measuring Mission (TRMM) precipitation products and Google Earth Engine (GEE) were adopted in this study for the analysis of spatiotemporal patterns of precipitation in the Zambezi River Basin. The Kendall’s correlation and sen’s Slop reducers in GEE were used to examine precipitation trends and magnitude, respectively, at annual, seasonal and monthly scales from 1998 to 2017. The results reveal that 10% of the Zambezi River basin showed a significant decreasing trend of annual precipitation, while only 1% showed a significant increasing trend. The rainy-season precipitation appeared to have a dominant impact on the annual precipitation pattern. The rainy-season precipitation was found to have larger spatial, temporal and magnitude variation than the dry-season precipitation. In terms of monthly precipitation, June to September during the dry season were dominated by a significant decreasing trend. However, areas presenting a significant decreasing trend were rare (<12% of study area) and scattered during the rainy-season months (November to April of the subsequent year). Spatially, the highest and lowest rainfall regions were shifted by year, with extreme precipitation events (highest and lowest rainfall) occurring preferentially over the northwest side rather than the northeast area of the Zambezi River Basin. A “dry gets dryer, wet gets wetter” (DGDWGW) pattern was also observed over the study area, and a suggestion on agriculture management according to precipitation patterns is provided in this study for the region. This is the first study to use long-term remote sensing data and GEE for precipitation analysis at various temporal scales in the Zambezi River Basin. The methodology proposed in this study is helpful for the spatiotemporal analysis of precipitation in developing countries with scarce gauge stations, limited analytic skills and insufficient computation resources. The approaches of this study can also be operationally applied to the analysis of other climate variables, such as temperature and solar radiation.

Graphical Abstract

1. Introduction

Rain-fed agriculture is the livelihood foundation for the majority of the rural poor in sub-Saharan Africa [1]. In sub-Saharan Africa, nearly 90% of staple food production is provided by rain-fed farming systems [1]. Both the totals and the variations of annual, seasonal and sub-seasonal precipitation have major effect on crop productivity [2,3]. As a result of climate change, precipitation variation may turn into extremely intense rainfall or prolonged drought [1,4,5], and both will reduce food production and lead to hunger and human malnutrition. Therefore, it is very important to understand the spatial and temporal variation of precipitation patterns, especially for rain-fed agriculture, which is helpful in agriculture management and flood and drought risk assessment.
Previous studies have typically used data from meteorological stations to analyze the spatial and temporal patterns of precipitation [6,7,8,9]. Recently, Nicholson et al. [10] examined rainfall variability in 13 sectors that cover most of the African continent using the available rainfall stations. However, this method cannot be applied to undeveloped and developing regions where ground gauge data are sparse [11]. Efforts have also been made to examine precipitation patterns using simulated precipitation from land surface models at both regional and global scales [12,13]. However, the modeled precipitation is biased against observation, and there have been large uncertainties in modeled results due to the parametrization, the selection of forcing data, and the model used.
With the development of remote sensing and geographic information technology in recent decades, a series of precipitation products have been generated at regional and global scales via different research institutions and government organizations. There are more than 30 commonly used global precipitation products [14], such as the Global Precipitation Climatology Project (GPCP) monthly precipitation analysis dataset [15], the Climate Prediction Center morphing method (CMORPH) precipitation product [16], the Tropical Rainfall Measuring Mission (TRMM) multi-satellite precipitation analysis (TMPA) product [17], the Precipitation Estimation from Remotely Sensed Information using Artificial Neural Networks–Climate Data Record (PERSIANN-CDR) [18], the Global Historical Climatology Network dataset (GHCN) [19], the Climate Hazards Group InfraRed Precipitation with Station (CHIRPS) dataset [20] and the Global Precipitation Measurement (GPM) mission product [21]. These remote sensing precipitation products offer long-term records and continuous spatial coverage, providing great opportunities to explore precipitation patterns. For example, Ahmed [22] used Global Precipitation Climatology Centre (GPCC) data to assess the spatiotemporal patterns of annual and seasonal precipitation in Pakistan from 1961 to 2010. The GPCP precipitation product has been widely applied to investigate global precipitation trends [23,24,25,26]. However, the spatial resolution of this product is too coarse (2.5° × 2.5° grid cell) for sub-country or regional applications. Most recently, Nguyen et al. [27] used the PERSIANN-CDR product (spatial resolution of 0.25°) to study precipitation trends over different climate zones at country and continental levels. Although precipitation patterns have been studied at various spatial scales, they are rarely investigated at different temporal scales (i.e., annually, seasonal and monthly), which is also important for rain-fed agriculture management.
On the other hand, cloud-based platforms have made big breakthroughs in recent years, providing new methods of geospatial analysis. A typical example is the Google Earth Engine (GEE) [28], which integrates high computation capabilities with a large variety of geospatial data. The downloading, storing, formatting and analyzing of long-term geospatial (remote sensing) data is both space- and time-consuming, especially when it comes to data with a high spatial or temporal resolution. Using GEE, the geospatial data can be accessed, visualized and processed online, which avoids the limitations of computation and storage capacity and thus can greatly boost the efficiency of spatial-temporal analysis. GEE has been successfully applied to crop classification [29,30,31], land cover and land-use mapping [32,33], and water surface [34], settlement and population mapping [35]. However, the application of GEE in precipitation pattern analysis has been infrequent. Considering the multiple global precipitation products included and stored in GEE, such as the Global Satellite Mapping of Precipitation, GPM V5, PERSIANN-CDR, TRMM and CHIRPS, this study provides a good opportunity to conduct precipitation analysis using GEE.
The aim of this work is to present an operational methodology for the spatiotemporal analysis of precipitation patterns at the sparsely gauged Zambezi River Basin using long-term remote sensing data and GEE. This study offers new insights into basin-scale precipitation trends across different temporal scales (annual, seasonal and monthly), and provides a suggestion on agriculture management according to the precipitation patterns of this region. A unique feature of this study is that the methodology proposed can be easily applied to other underdeveloped regions and developing countries that lack adequate ground observations and necessary computational resources. The methods can also be used in the trend analysis of other climate variables such as temperature and solar radiation.

2. Materials and Methods

2.1. Study Site

The Zambezi River Basin lies between 9–21°S and 16–36°E (Figure 1) and drains about 1.4 million km2, which makes it the fourth-largest drainage basin in Africa and the largest river system in the Southern African Development Community.
There are approximately 30 million people in the Zambezi River basin. The basin is shared by eight riparian countries, namely, Zambia (40.7%), Angola (18.2%), Zimbabwe (18%), Mozambique (11.4%), Malawi (7.7%), Botswana (2.8%), Tanzania (2%) and Namibia (1.2%). Food insecurity is a big challenge for all of these riparian countries. Agricultural production in the Zambezi Basin is predominantly rain-fed, with about 5.3 million hectares of cultivated arable land, but only 0.18 million hectares (or 3.46%) of the cultivated land equipped with irrigation systems [37]. Monitored by the International Water Management Institute, the ratio of irrigated cropland to the rain-fed cropland in Mozambique, Zambia, Zimbabwe and Malawi are only 0.441%, 0.003%, 0.040% and 0.140%, respectively [38,39], far below the global average of 30%. Considering that the agriculture system in the Zambezi River Basin is mostly rain-fed, changes in precipitation patterns in the region can have a profound impact on its food production. Thus, analyzing and understanding the spatial and temporal variation of precipitation is essential for agricultural management and food security in this region. However, there are two major challenges in examining precipitation patterns in the Zambezi River Basin. One is the limited rain gauges over the basin due to civil war, low income and low revenue. The other is the discontinued precipitation record due to bad management. Therefore, precipitation information from other sources is required for robust pattern analysis. The following sections introduce the remote sensing precipitation data and the statistical methods used in this study.

2.2. Data

Considering the sparse rain gauge network in the Zambezi River Basin, Version 7 TRMM 3B42 precipitation data were used in this work. Version 7 TRMM 3B42 is a daily satellite precipitation product with a spatial resolution of 0.25°. It provides the best estimates of rainfall rate by combining most of the available precipitation datasets derived from satellite sensors and rain gauge networks [17]. The good accuracy of TRMM 3B42 was confirmed by a few studies in the Zambezi River Basin. For example, Cohen Liechti et al. [40] found that the TRMM 3B42 product had a better performance than the Famine Early Warning System product 2.0 (FEWS RFE2.0) and the National Oceanic and Atmospheric Administration/Climate Prediction Centre (NOAA/CPC) CMORPH as an input for the hydraulic-hydrological model in the Zambezi River Basin. TRMM 3B42 was also found to be one of the most accurate products among the six satellite-based rainfall products in the Zambezi River Basin [41]. Matyas used Version 6 TRMM3B42 data to produce a rainfall climatology for Tete Province in Mozambique, and reported that during one of their study months (April 2004) they could not match TRMM estimates with station estimates published by two different groups [4]. This may have been due to the limitations of Version 6 TRMM data, which has higher errors in elevated terrain (such as Mozambique). In this study, Version 7 TRMM 3B42, which is an improved version stored in the Earth Engine Data Catalog of GEE, was adopted for precipitation pattern analysis over the Zambezi River Basin. The whole Zambezi River Basin covers a total of 1873 TRMM grids.
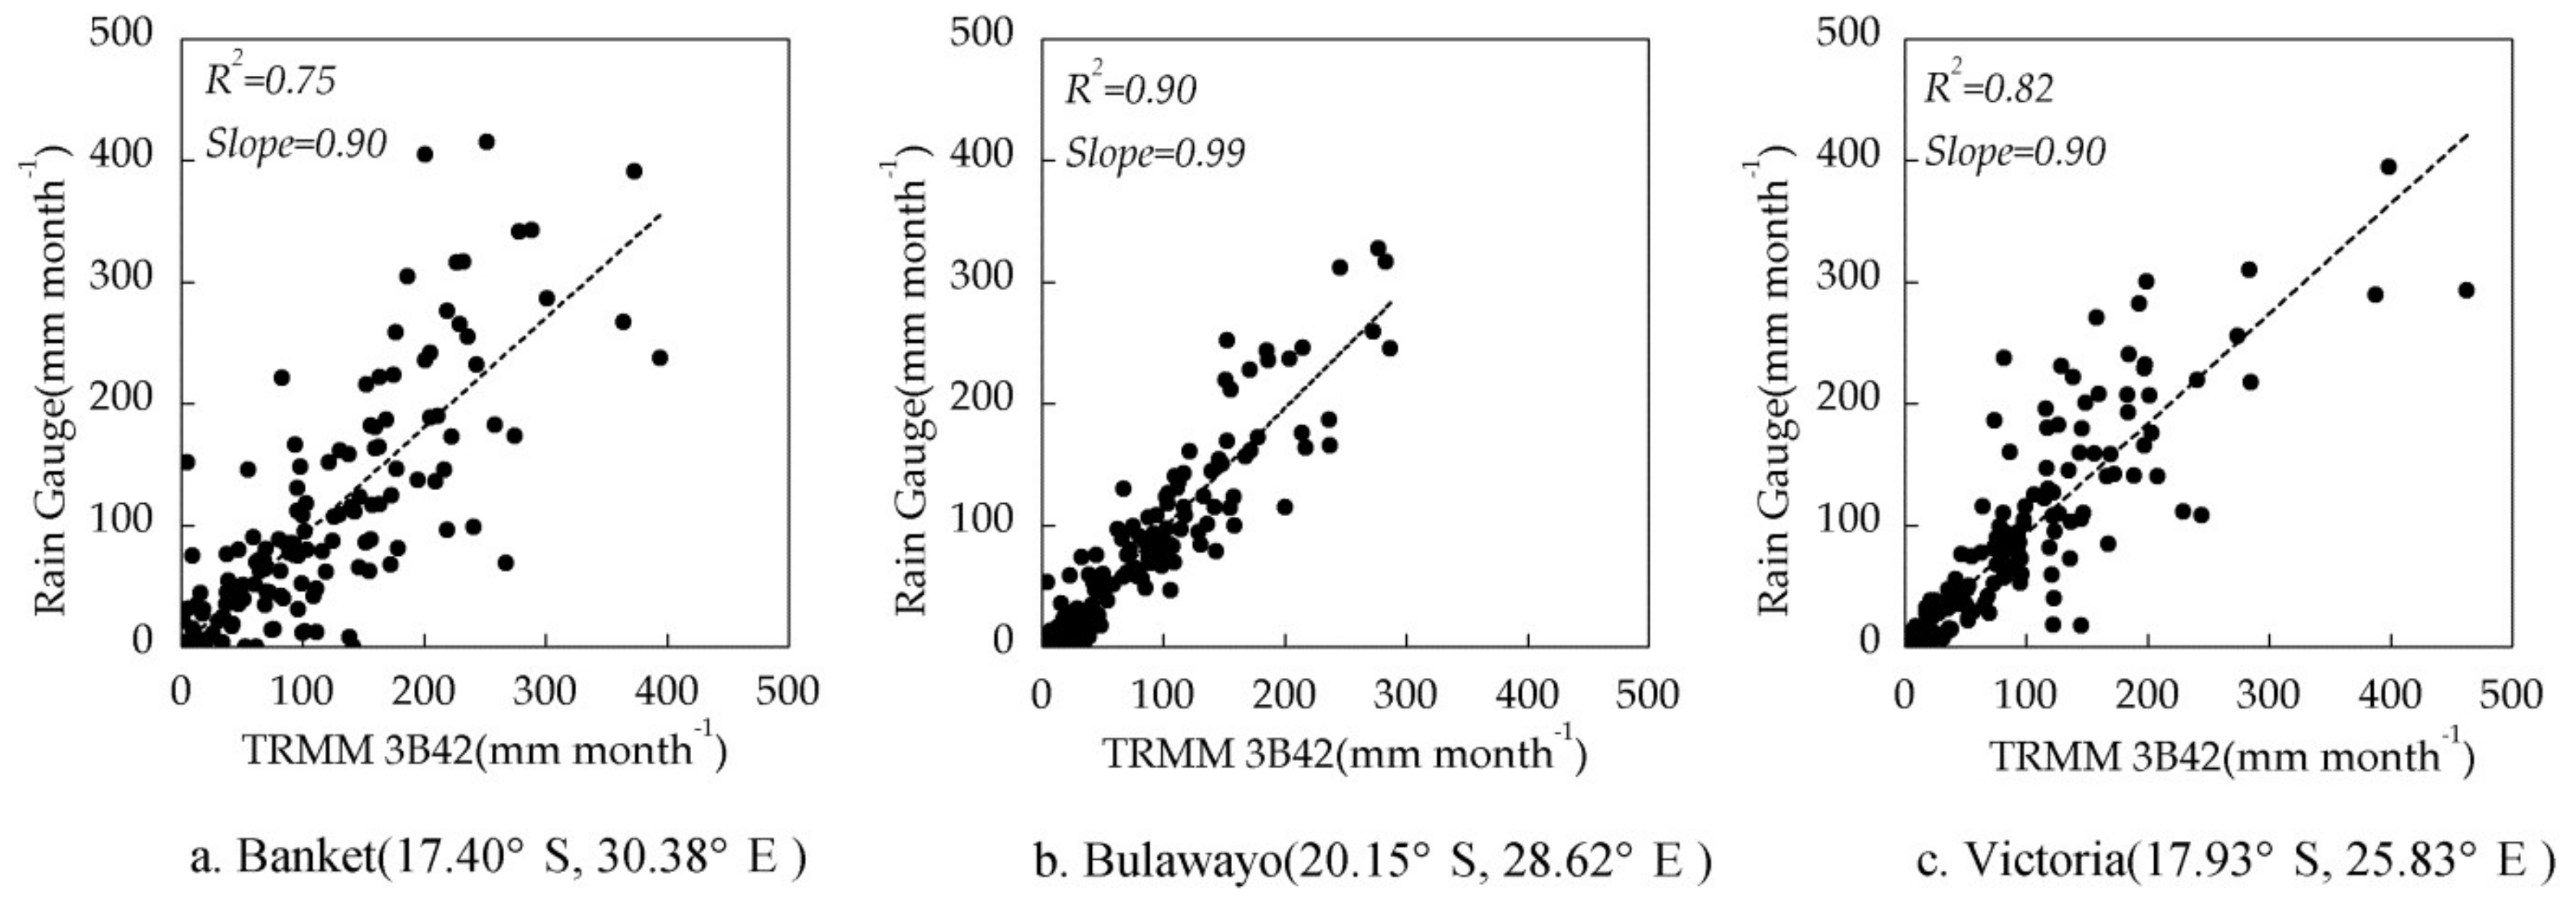
In this study, the agreement between the Version 7 TRMM 3B42 data and the rain gauge measurements are further examined at a monthly scale. The rain gauge data were obtained from three stations within the Zambezi River basin, including Banket, Bulawayo and Victoria, between May 1998 to April 2019. Figure 2 shows the R2 ranged from 0.75 to 0.90, and the regression slope varied from 0.90 to 0.99 among three stations. This indicates a good consistency between rain gauge and the TRMM 3B42 data. Therefore, the Version 7 TRMM 3B42 products can be safely adopted to analyze the precipitation patterns in the Zambezi River Basin. Source code is available at: https://code.earthengine.google.com/d11b528bb2c7d38262a32f1de3505770.

2.3. Methods

This work explores precipitation change using JavaScript based on GEE (Figure 3). GEE consists of a cloud-based data catalogue and computing platform. The App Engine framework was the client used to deliver the data to a web browser and communicate with the GEE using the JavaScript or Python application programming interface (API) [42]. Developers can explore the geospatial data using JavaScript and in a web-based integrated development environment (IDE). GEE integrated 44 reducers that provide strong ability to explore the geospatial datasets. Reducers are the way to aggregate data over time, space, bands, arrays and other data structures in Earth Engine.
In this study, the gridded annual and monthly time-series data of precipitation are first constructed using the methods in Section 2.3.1, after which the precipitation patterns are examined using “Chart.image.seriesByRegion” and kendallsCorrelation and sensSlop reducers. “image.seriesByRegion” is a function that generates a chart from an image by extracting and plotting band values in one or more regions in the image. Detailed information of these functions and reducers can be found in the GEE developer’s guide. A brief introduction to the two major functions, the kendallsCorrelation reducer and the sensSlop reducer, are provided in Section 2.3.2 and Section 2.3.3.

2.3.1. Construction of Time-Series Precipitation

The Zambezi River Basin lies in the Southern Hemisphere, which has opposite seasons to the Northern Hemisphere. Its dry season spans from May to October and its rainy season spans from November to April of the subsequent year. To track a complete period of the dry and rainy seasons, a shift of four months was applied in the construction of the precipitation time series data for the Zambezi River Basin. In our study, the data for one year starts from May of one year and ends in April of the subsequent year. The time series of monthly precipitation from May to December were constructed using data from 1998 to 2017, while the monthly precipitation from January to April were constructed using data from 1999 to 2018. The equations used in constructing the annual and monthly time series are described in Equations (1) and (2).
P _ Y e a r i = i = 1998 i = 2017 j = 5 j = 12 P _ M i j + k = 1 k = 4 P _ M i + 1 k
P _ M o n t h j = P _ M i j , j 5 , 12 , i 1998 , 2017 P _ M i + 1 j , j 1 , 4 , i 1998 , 2018
where P _ Y e a r i indicates the annual precipitation at year i ( i 1998 , 2017 ); P _ M i j   and P _ M i + 1 j   indicate the monthly precipitation at month j ( j 5 , 12 ) and month k ( k ϵ 1 , 4 ) in year i, respectively; and P _ M o n t h j indicates the time series of monthly precipitation during a specific month j from 1998 to 2018.

2.3.2. The kendallsCorrelation Reducer

The kendallsCorrelation reducer was employed to detect the temporal trend of precipitation in this study. The kendallsCorrelation reducer was designed according to Kendall’s Tau ( τ ), which is a nonparametric measure of the relationships between columns of ranked data and is calculated via the following steps:
Step 1: Make (t1,p1),(t2,p2),…,(tn,pn) be a set of records of time (t) and precipitation (p).
Step 2: Identify the concordant pairs. Any two records (ti, pi and tj, pj) with i < j are considered as a concordant pair if pi > pj and ti > tj, or if pi < pj and ti < tj.
Step 3: Identify the discordant pairs. Any two records (ti, pi and tj, pj) with i < j are considered as a discordant pair if pi > pj and ti < tj, or pi < pj and ti > tj.
Step 4: Count he total numbers of the concordant pairs (nc) and discordant pairs (nd). Calculate Kendall’s Tau ( τ ) using Equation (3).
τ = 2 n c n d n n 1
where n is the length of the precipitation time series (n = 20 years in this study). A positive τ value (0 < τ < 1) indicates an increasing trend, while a negative value (−1 < τ < 0) indicates a decreasing trend.
Step 5: Test the significance of Kendall’s Tau ( τ ) using Equations (4) and (5) [43].
σ r = 2 2 n + 5 9 n n 1
Z τ = τ σ
where the Z τ value is normally distributed with a mean of 0 and a standard deviation of 1, and σ τ is the variance. The value of Z τ is used to detect if a trend in the precipitation time series is statistically significant at a significance level of α = 0.05 (| Z τ | > 1.96). A Z τ > 1.96 indicates a significant increasing trend, while a Z τ < −1.96 indicates a significant decreasing trend.

2.3.3. The sensSlop Reducer

The sensSlop reducer was designed according to Sen’s slope estimator, which is a nonparametric estimate of the slope of a trend, or the magnitude of the trend (mm yr−1). The results have the same unit as precipitation (mm yr−1). In this study, the sensSlop reducer was used to estimate the trend magnitude (mm yr−1) of precipitation over 20 years as well as for each individuals month. It is calculated via following steps [44,45]:
Step 1: Make the interval between time-series data points equally spaced.
Step 2: Sort the data in ascending order according to time, and apply Equation (6) to calculate the Sen’s slope (Q):
Q = p j p k j k ( j > k )
where pj and pk are the precipitation values at times j and k (j > k), respectively. Q is the Sen’s slope calculated for each pair with a j greater than k.
Step 3: Finally, based on Equation (6), the trend magnitude (Qm) is the median of the total Q calculated from the previous step:
Q m = Q N + 1 2   , I f   N   i s   o d d Q N 2 + Q N + 2 2 2 , I f   N   i s   e v e n
where N is the number of calculated slopes (Q). The absolute value of Qm indicates the magnitude of the trend. A positive Qm reflects the magnitude of an increasing trend, while a negative Qm indicates the magnitude of a decreasing trend.

3. Results

3.1. Annual Trend of Precipitation

The mean precipitation over the Zambezi River Basin from 1998 to 2018 was 965 mm yr−1, and its spatial distribution is shown in Figure 4a. It is obvious that the average precipitation over the entire basin was unevenly distributed, with an apparent south-to-north gradient, which is consistent with the findings from Cohen et al. [14]. In the extreme southwest part, the average precipitation was below 600 mm yr−1, while the precipitation gradually increased to more than 1500 mm yr−1 in the north part. Figure 4b shows the variation of annual precipitation in the Zambezi River Basin over the most recent 20 years (1998–2017). The mean annual precipitation (middle red line) had a standard deviation of 94 mm yr−1. Its maximum value was observed as 1153 mm yr−1 in 2000, which was 18.43% above average. Its minimum value was observed as 812 mm yr−1 in 2015, which was 16.64% below average. The minimum annual precipitation (bottom black line) had a similar standard deviation (96 mm yr−1) to the mean annual precipitation, with the highest value found in 2007 (630 mm yr−1) and the lowest value in 2015 (257 mm yr−1). In contrast, the standard deviation of the maximum annual precipitation (top black line) was much higher than that of previous two, reaching 246 mm yr−1. The peak of the maximum precipitation was observed in 2017 (2501 mm yr−1), and the lowest value of the maximum precipitation was found in 1999 (1519 mm yr−1). This indicates the maximum precipitation over the Zambezi River Basin had a more dramatic variation than the mean precipitation during the most recent 20 years.
To further investigate the spatial variation of precipitation, statistics including mean, max, min and standard deviation (STD) were calculated for precipitation patterns at each of the 13 sub-basins from 1998 to 2017 (Table A1). In general, the mean precipitation patterns of the 13 sub-basins agreed well with that of the whole basin (Figure 4a), with higher precipitation observed in the northern sub-basins (e.g., Upper Zambezi, Kabompo, Lungue Bungo and Niassa) and lower precipitation observed in the southern sub-basins (e.g., Cuando, Kariba, Tete and Barotse). A previous study of Cohen et al. [40] examined the precipitation intensity in this region and found that the northeast side of the Zambezi River Basin had lower rainfall intensity than its northwest area, and that the southeast corner presented lower rainfall intensity than other coastal areas. This study also approached the precipitation pattern in this region from the extreme precipitation frequency angle. According to Table A1, the Upper Zambezi presented the highest rainfall among 13 sub-basins in 11 out of 20 years, followed by the Kabompo (4 out of 20 years) and Niassa (2 out of 20 years). On the other hand, the Kariba, Cuando, Tete and Zambezi Delta presented the lowest rainfall among 13 sub-basins in 7, 6, 4 and 1 out of 20 years, respectively. These results indicate that the highest and lowest rainfall regions shift with different years, and that extreme precipitation (highest and lowest rainfall) occurs preferentially over the northwest side rather than the northeast area of the Zambezi River Basin. For example, the highest rainfall was more frequently observed over the northwest region (e.g., the Upper Zambezi and Kabompo sub-basins) than the northeast region (e.g., the Niassa sub-basin), while the lowest rainfall zones occurred more frequently in the southwest part (e.g., the Cuando and Karbiba sub-basins) than the southeast (e.g., the Tete and Zambezi Delta sub-basins). The STD was used here as a measure of the interannual variability of precipitation. The STDs of the 13 sub-basins varied from 106 to 217 mm yr−1, indicating an overall large interannual variation for the Zambezi River Basin. The largest STD (interannual variation) was found in the Zambezi Delta sub-basin with 217 mm yr−1, while the smallest interannual variation was observed in the Luangwa sub-basin with an STD of 106 mm yr−1.
The Kendall’s Correlation and SensSlop reducers were applied to determine the trends and magnitude of annual precipitation from 1998 to 2018 for each pixel. It was found that 30% of the whole basin overall presented an upward trend, while only 1% of the basin showed a significant increasing trend (Table 1). In contrast, 70% of the study area showed a downward trend, and 10% of the study area showed a significant decreasing trend. Breaking down the sub-basins, it can be seen that the major agricultural zones, such as Kariba, Tete, Niassa, Zambezi Delta, Muputa, Luangwa, and Kafue were dominated by a decreasing trend. Moreover, the Tete (30%) and Niassa (34%) sub-basins played dominant roles in the significant decreasing trend of the whole basin.
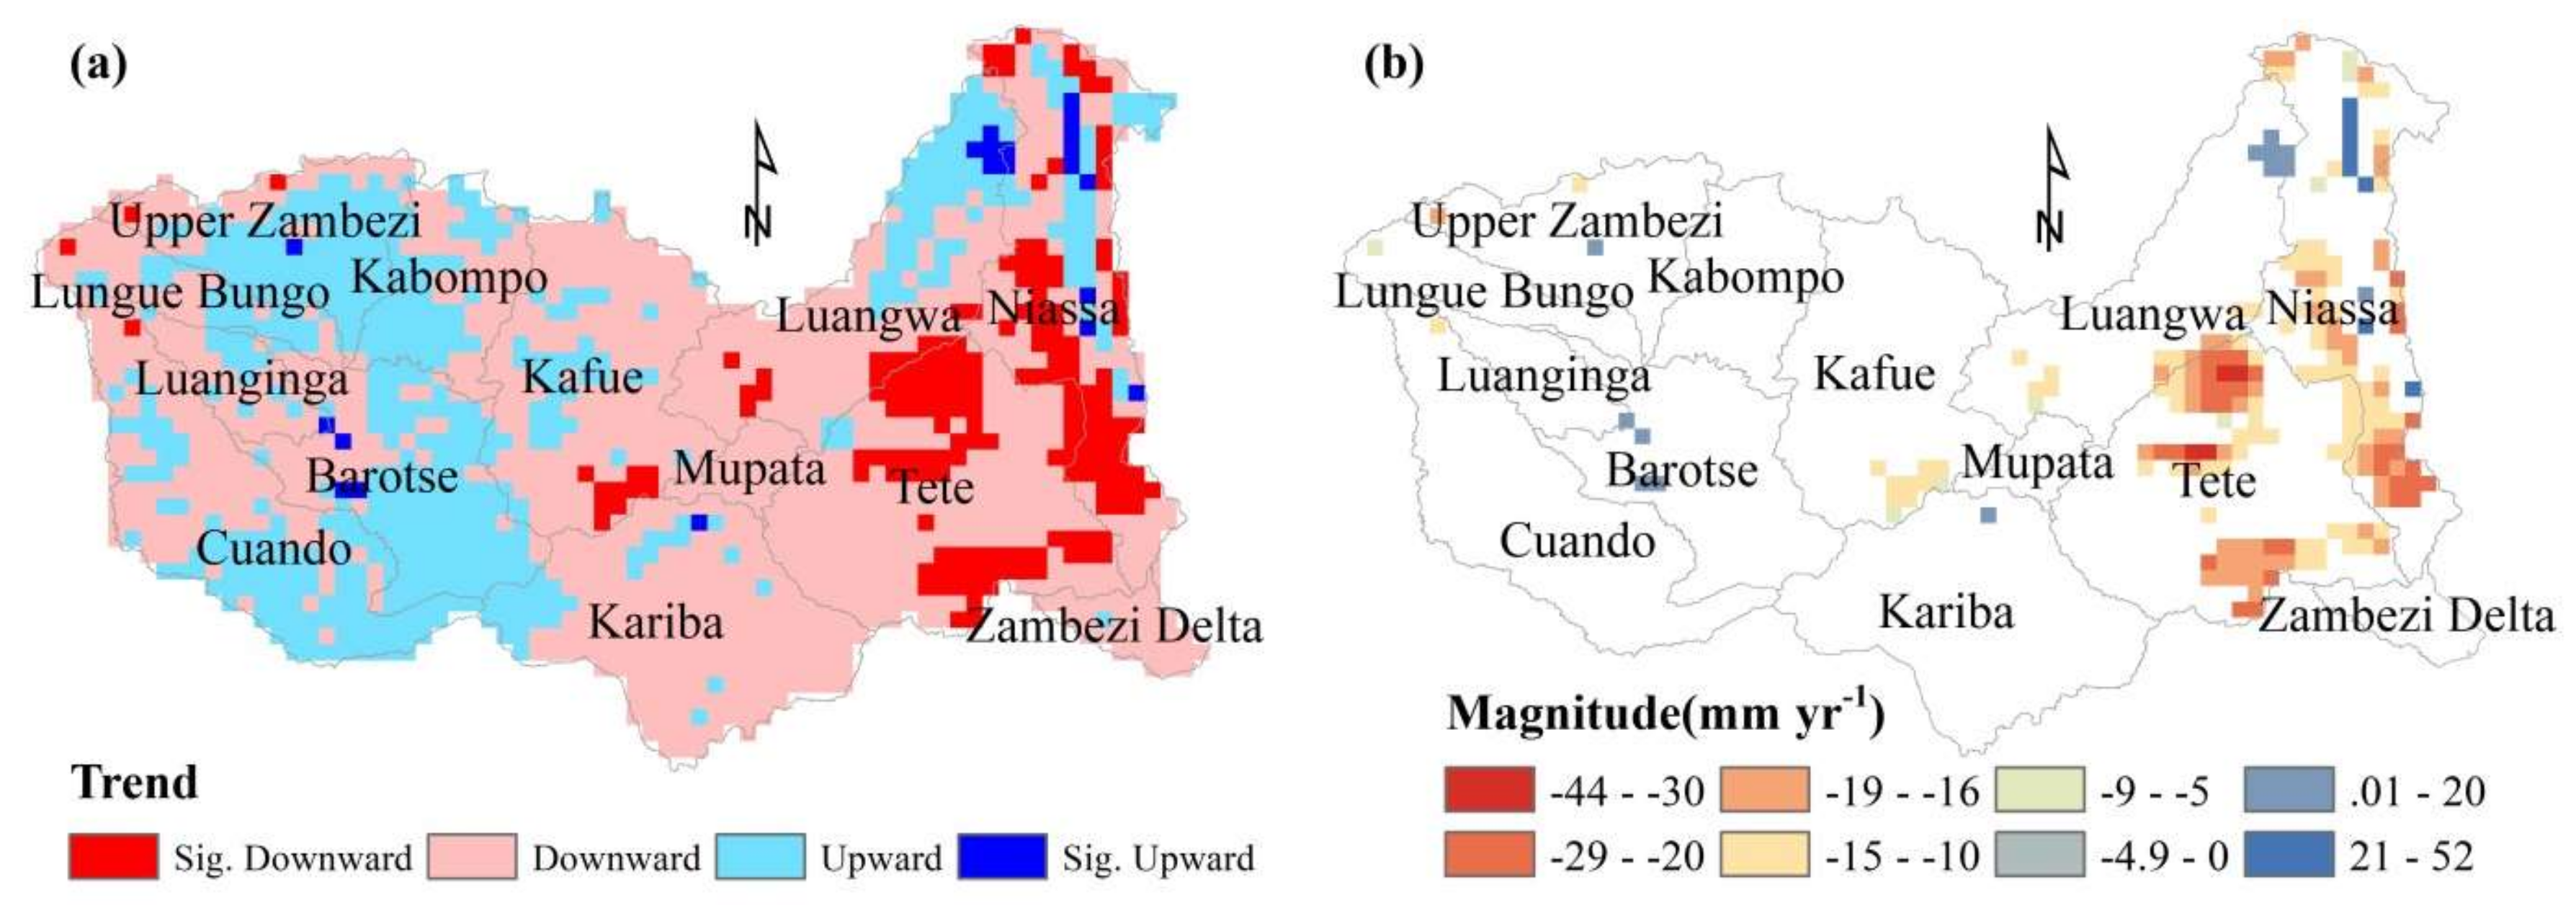
Figure 5 demonstrates the spatial distribution of the precipitation trend and its magnitude using the Kendall’s Correlation and SensSlop reducers in GEE. Figure 5a reveals that the upward trend of precipitation was generally found in the midwest and northeast regions, such as Upper Zambezi, Cuando and Barotse, Luangwa and Niassa. However, the regions with a significant upward trend were rare and sparsely located in the northeast region. In contrast, the downward trend covered larger areas of the region, including the Zambezi Delta, Tete and Mupata, and most parts of the Kariba, Kafue, Luanginga and Niassa sub-basins. A significant downward trend was found in the Niassa and Tete sub-basins. The lack of significant trend in most regions in the Zambezi River Basin may be attributable to the large interannual variability of this region (large STDs over the 13 sub-basins in Table A1). The mechanisms account for interannual variability are further discussed in Section 4.2. As seen in Figure 1, it was also found that the southern Niassa sub-basin was the main crop-producing region. The significant downward trend of precipitation in this region indicates that the rain-fed agriculture may face a more and more severe water stress issue.
Figure 5b illustrates the magnitude of significant precipitation trends over the past 20 years in the Zambezi River Basin. The results indicate that significant decreasing trends (negative values of magnitude in Figure 5b) were dominant among significant trends. The magnitude of a significant upward trend was from 10.0 mm yr−1 to 51.8 mm yr−1, while the magnitude of a significant downward trend ranged from −8.5 mm yr−1 to −44.0 mm yr−1. It is also worth noting that when comparing the annual mean precipitation (Figure 4a) with the significant magnitude map (Figure 5b), a “dry gets drier, wet gets wetter” (DGDWGW) pattern was revealed for the Zambezi River Basin with a significant trend. If a region has a low mean precipitation, it is considered to be a dry region. If the same region presents a decreasing precipitation trend (negative trend magnitude), then it is considered to be a dry region that getting drier over time. The same rule applies to the identification of the “wet gets wetter” pattern. In this study, the moist regions, such as the northeast of the Niassa sub-basin, presented an increasing precipitation trend (large positive magnitude in Figure 5b). On the other hand, the dryer regions (such as the southern part of Niassa and the Tete sub-basin) presented a decreasing trend (large negative magnitude in Figure 5b). These are good examples of the DGDWGW pattern.

3.2. Seasonal and Monthly Trend of Precipitation

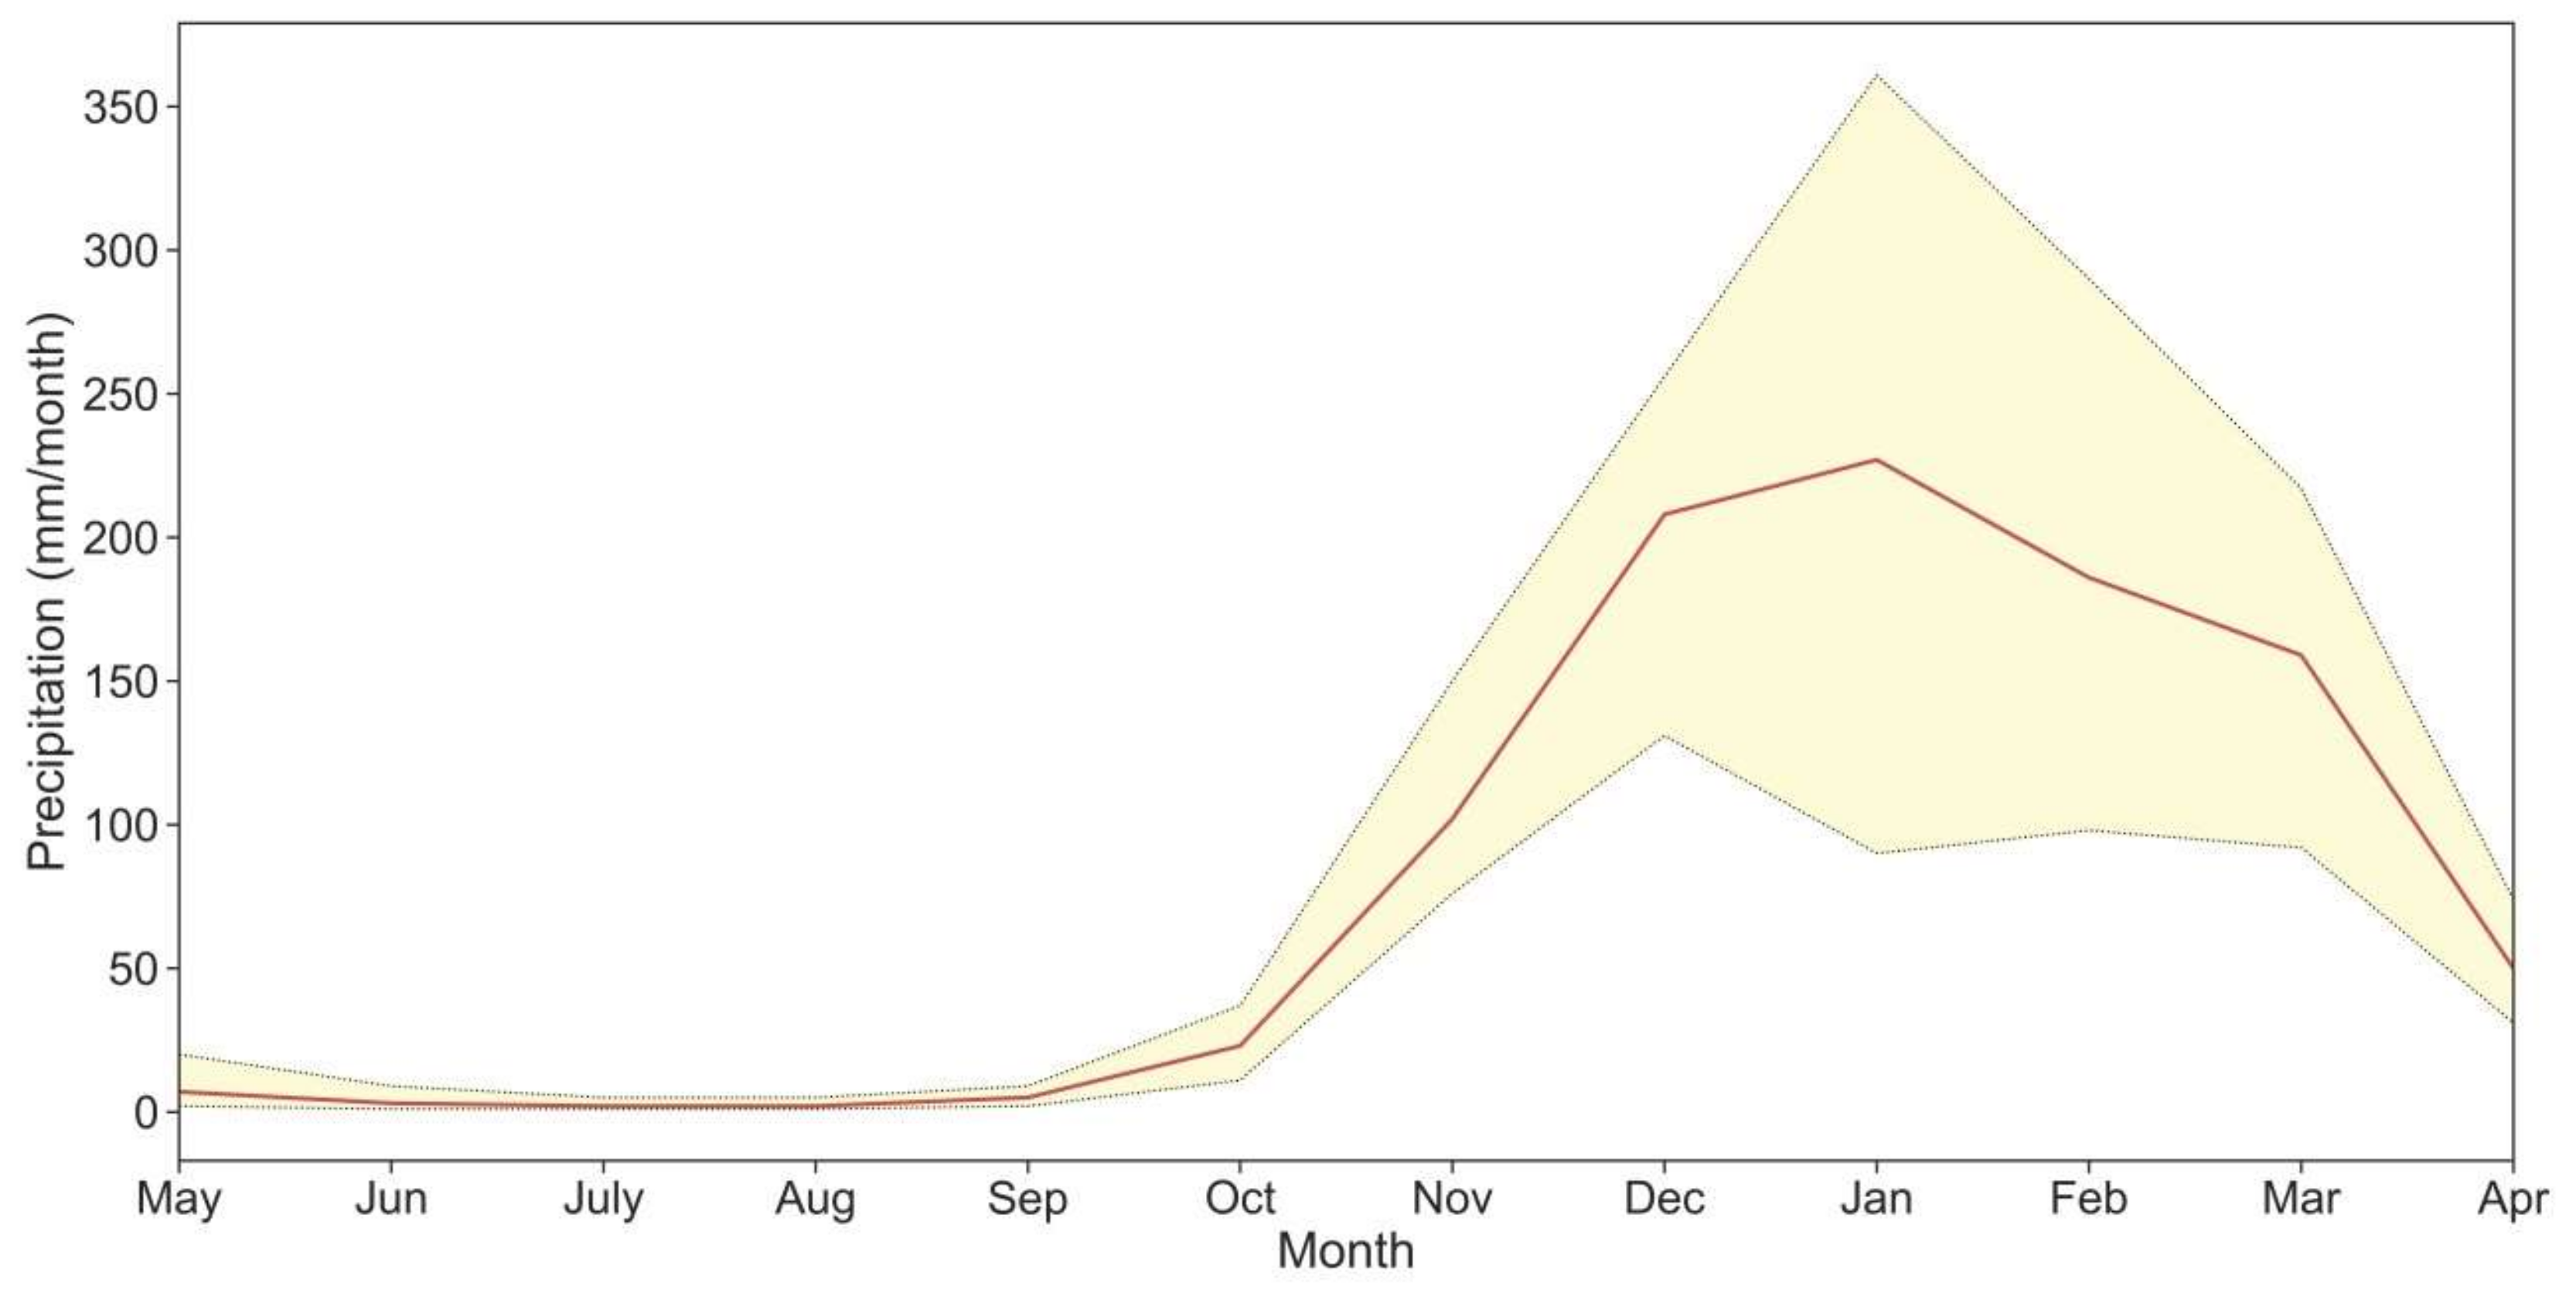
The spatiotemporal variation of precipitation at a finer time scale (monthly and dry vs wet seasons) were also examined using GEE. Figure 6 shows the monthly precipitation averages from 1998 to 2017 for the Zambezi River Basin. It can be seen that precipitation was unevenly distributed across these months, with 95.68% of precipitation falling during the rainy season (November to April of the subsequent year) and peak precipitation observed in January (227 mm/month), accounting for 23.3% of total precipitation. In contrast, only 4.32% of precipitation occurred during the dry season (May to October), and the driest month was August with a precipitation of 2 mm/month. In addition, the rainy-season months were found to have a larger range (the difference between maximum and minimum precipitation) than the dry-season months (Figure 6). As the wettest month on rainy reason, January had a precipitation range of about 271 mm/month and a standard deviation of 52 mm/month. In contrast, May was the wettest month during the dry season, and its precipitation range was 17 mm/month with a standard deviation of only 4 mm/month.
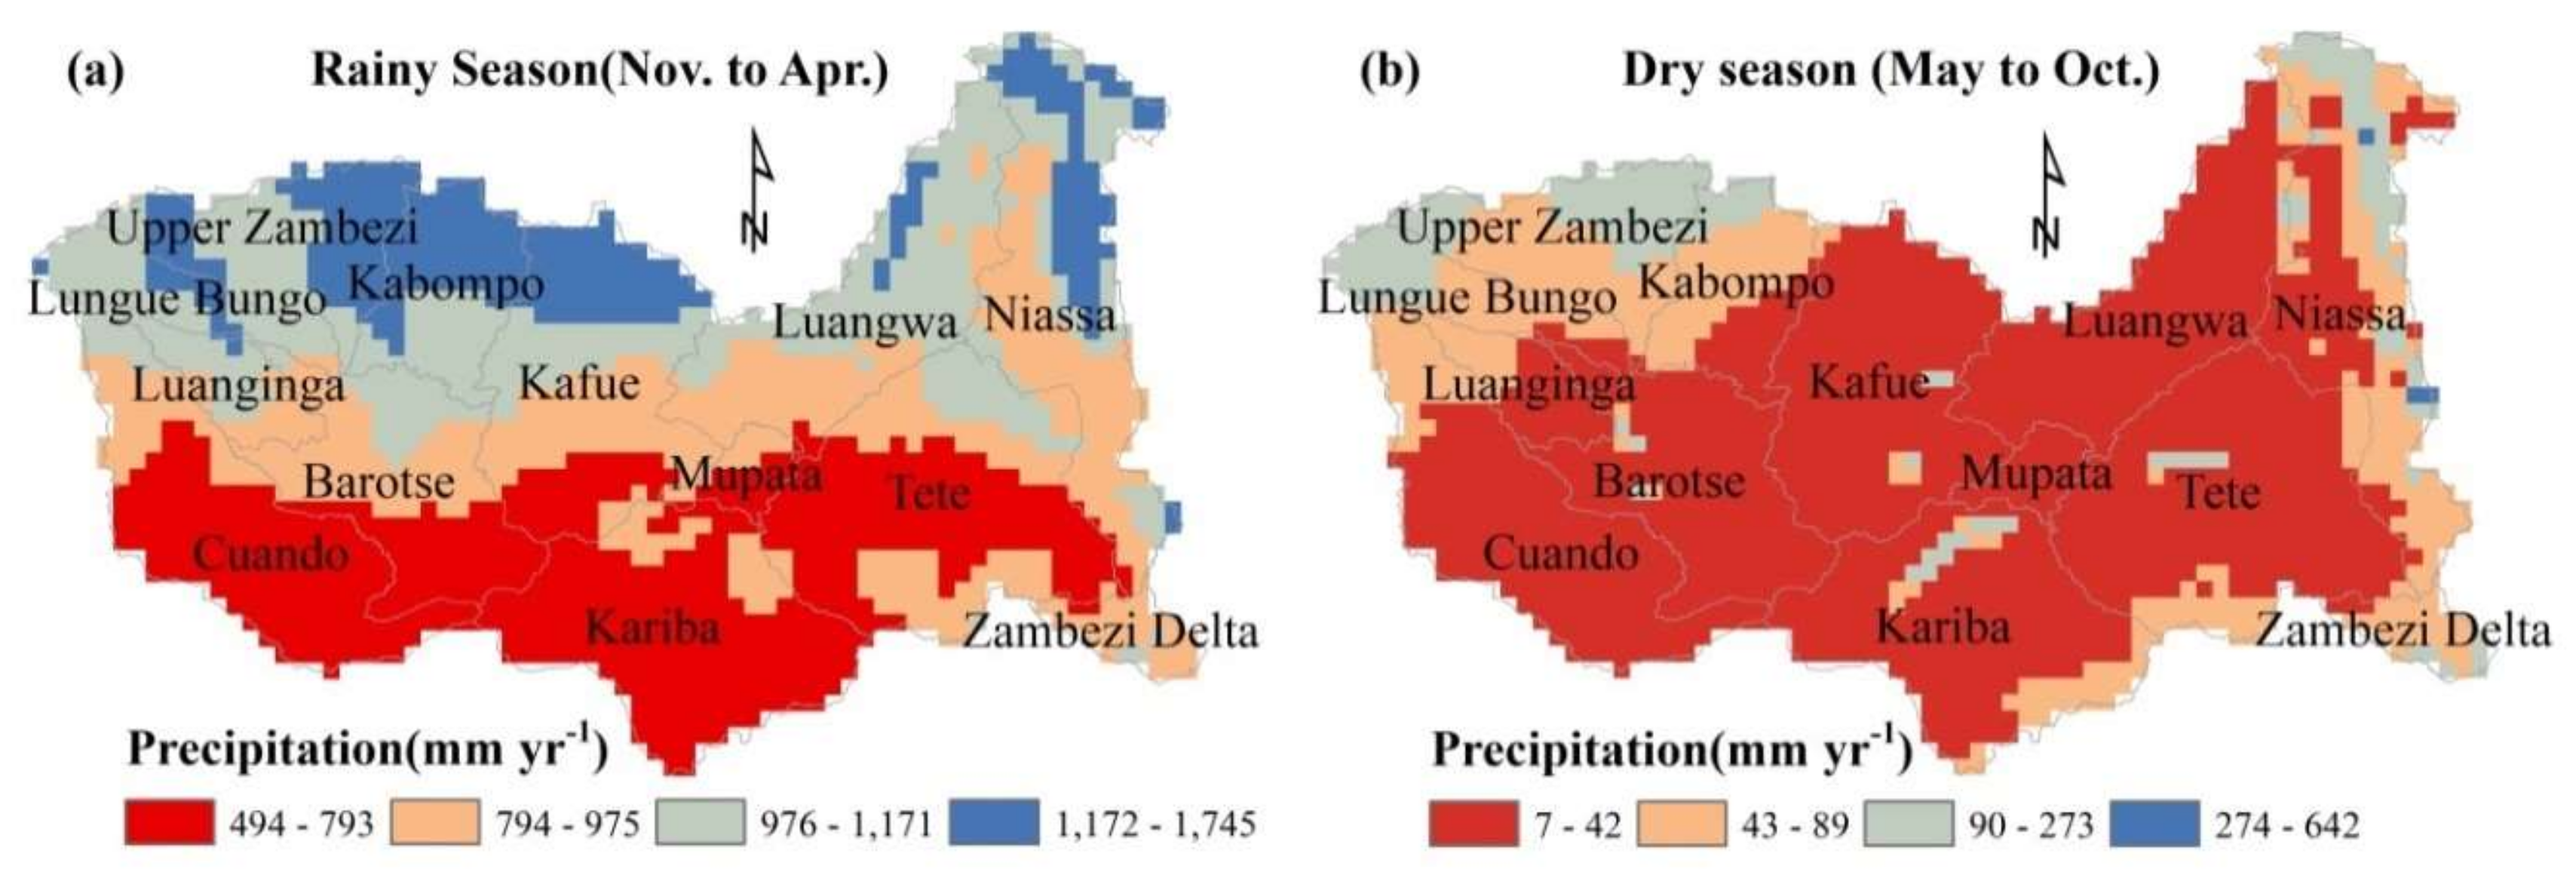
Figure 7 illustrates the spatial distribution of the mean precipitation during the rainy and dry seasons. The average precipitation over the entire basin was 924 mm yr−1 during the rainy season. The spatial pattern of rainy-season precipitation had an apparent south-to-north gradient (Figure 7a) similar to that of the mean annual precipitation (Figure 4a). This indicates that rainy-season precipitation had a dominant impact on the annual precipitation. In the dry season (Figure 7b), more than 70% of the basin was dominated by extremely dry conditions, with a precipitation below 42 mm yr−1. The average precipitation was only 41 mm yr−1 for the dry season. Due to the extremely underdeveloped irrigation system in the Zambezi River Basin, it is impossible for crops to survive in the dry season, thus most crops are planted and grow during the rainy season.
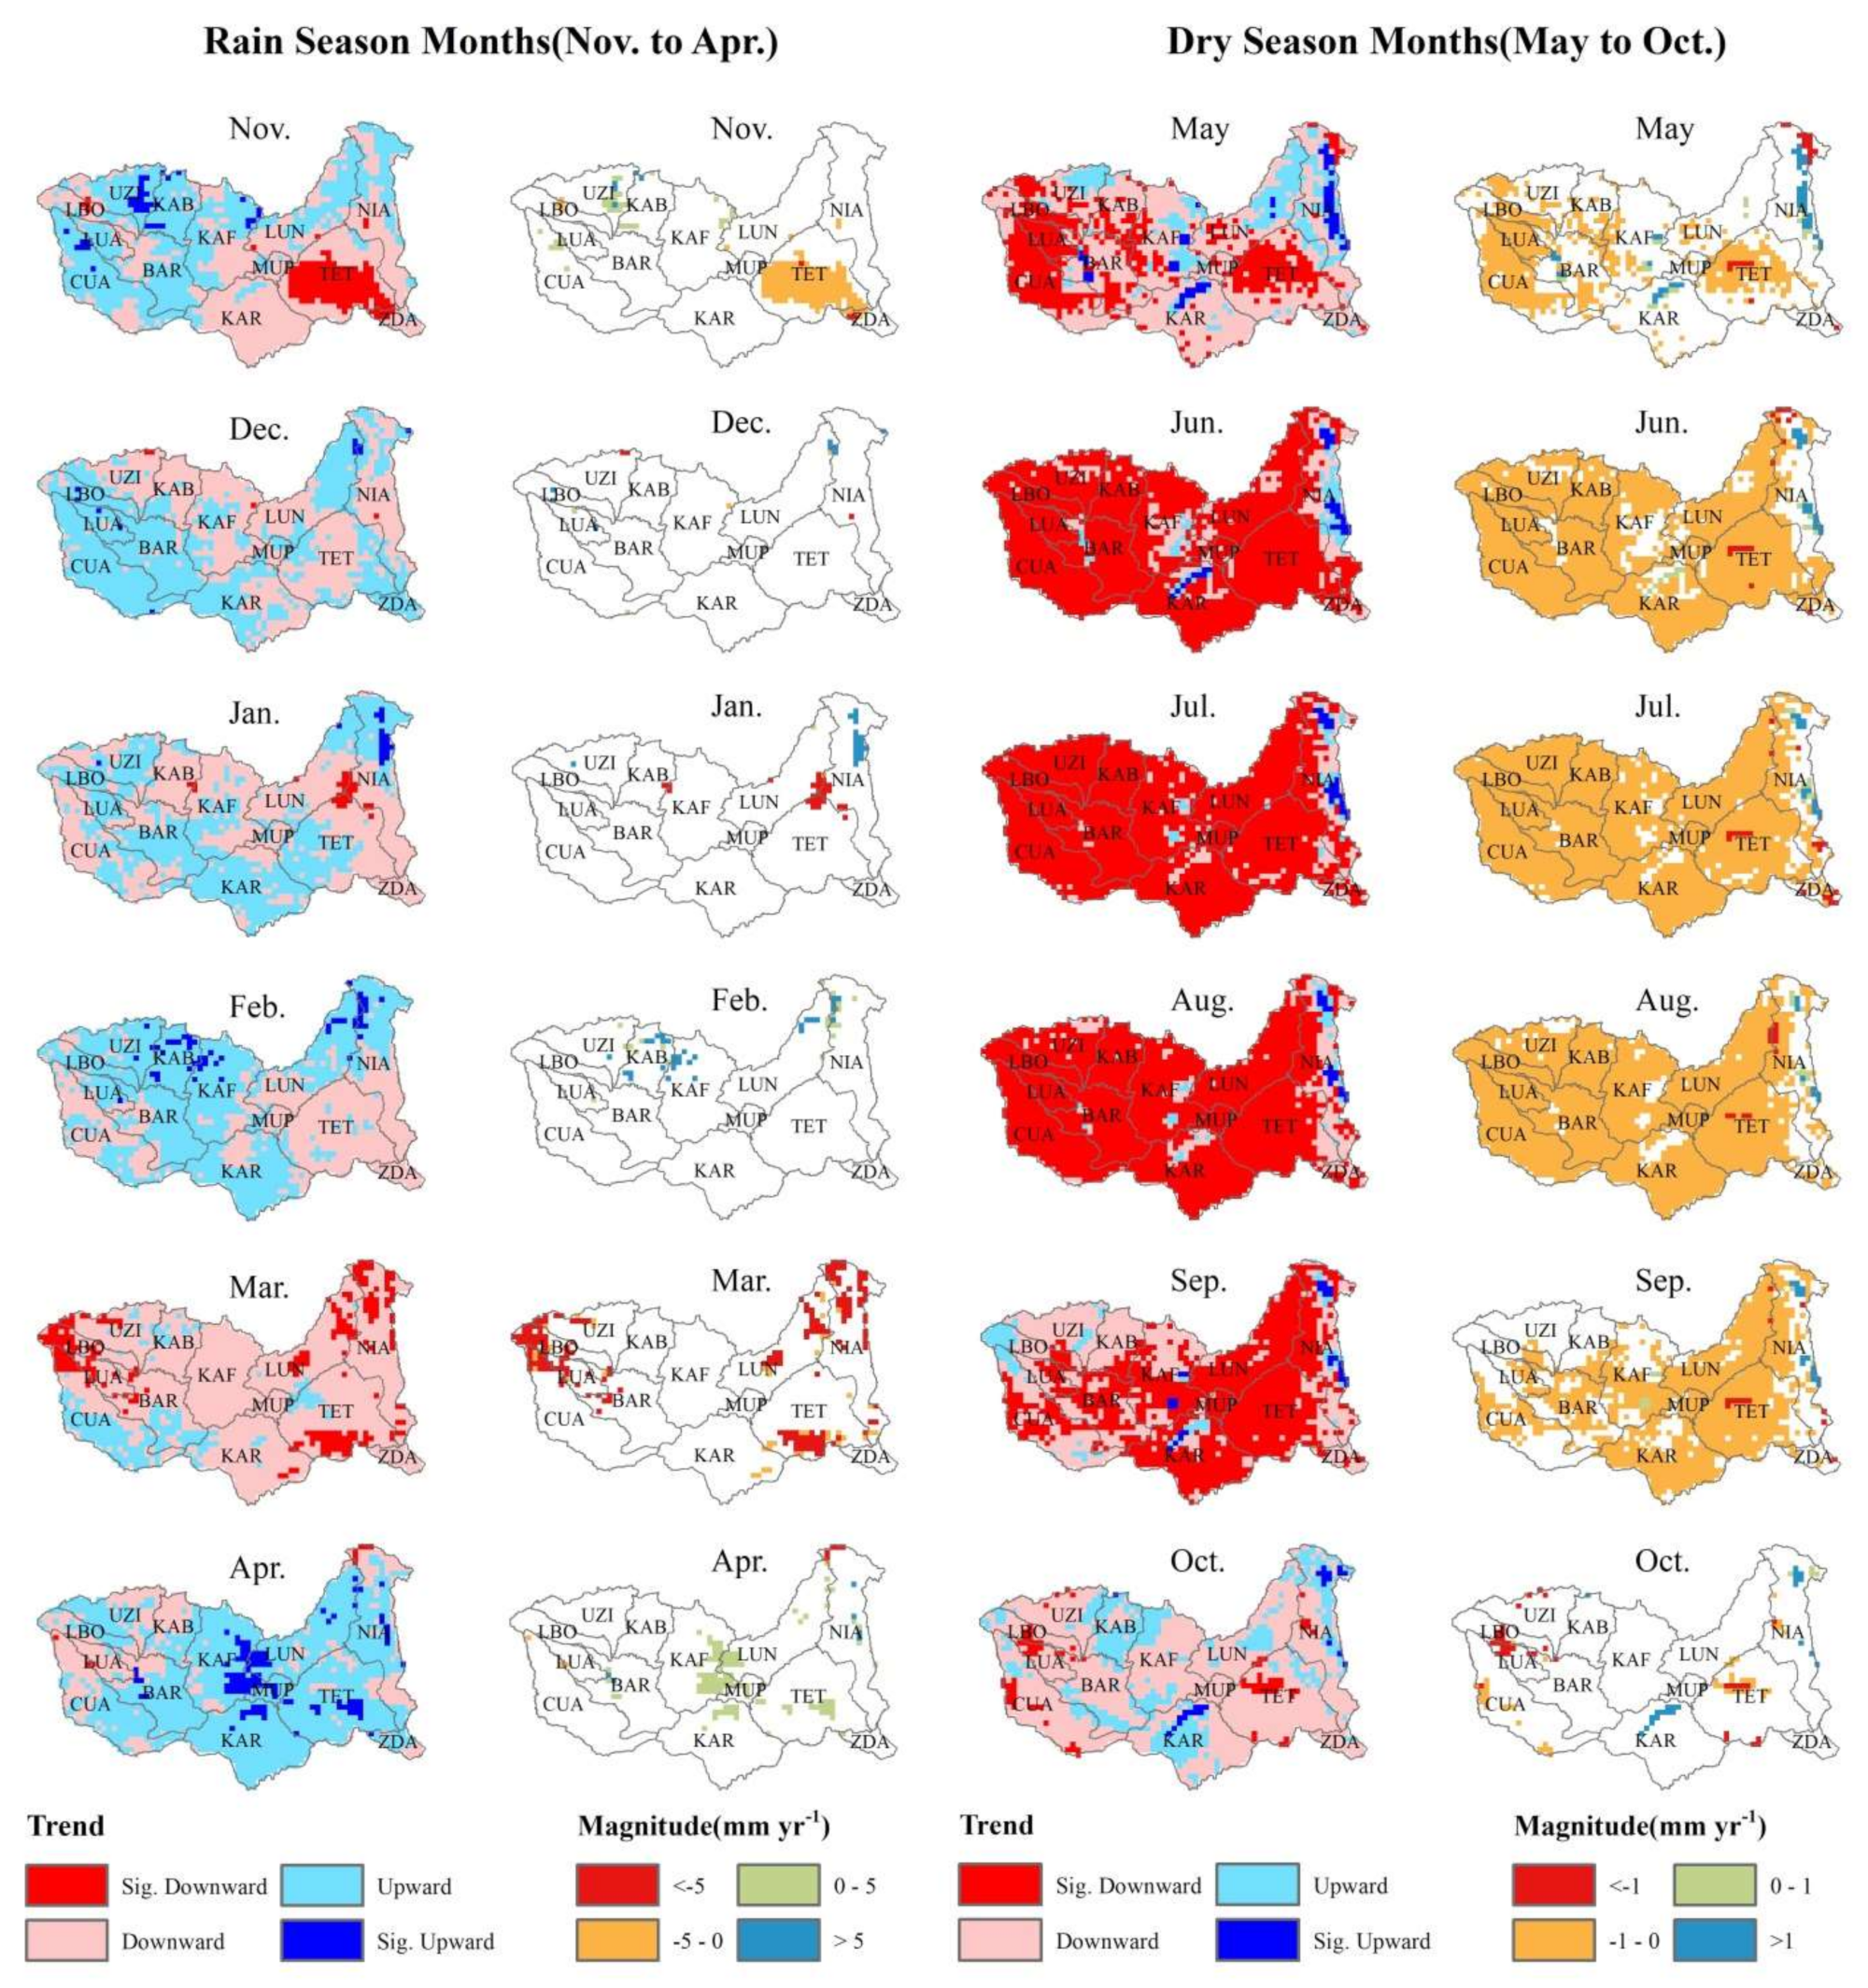
Figure 8 shows the spatial distribution of the precipitation trend (1998 to 2017) during the rainy-season months (November to April) and dry-season months (May to October). It can be seen that the spatial–temporal distribution of the precipitation trend was more heterogeneous in rainy-season months than the dry-season months. A mix of increasing and decreasing trends is presented for the rainy-season months in Figure 8. For example, the decreasing trend assumed the dominant role in November, January and March, accounting for 54%, 54% and 89% of the study region, respectively (Table A1), while in December, February and April the increasing trend assumed the dominant role, covering 54%, 59% and 75% of the study region, respectively (Table A1). However, most of the trends (either increasing or decreasing) were not significant. In general, significant decreasing tends were more frequently observed during the rainy season than the dry season. Only 6% of the whole basin presented a significant increasing trend in April, while 12% and 8% of the study area presented a significant decreasing trend in March and November, respectively. The magnitude of the significant decreasing trend was also larger than that of the increasing trend during the rainy season (Table A3).
In contrast, most of the study region during dry-season months was dominated by a significant decreasing trend (Figure 8), with more than 75% of the study area presenting a downward trend during the dry-season months. From June to September, a significant decreasing trend accounted for 81%, 87%, 85% and 56% of the whole area, respectively (Table A1). Although a significant decreasing trend was observed over larger areas in the dry season, the magnitude of the decreasing trend (0 to −4.7 mm yr−1) was much smaller than that of rainy season (−0.5 to −11.8 mm yr−1) (Table A3).
In sum, the results indicate that precipitation in the dry season of the Zambezi River Basin is dominated by a significant decreasing trend, while the precipitation trend in the rainy season has large spatial and temporal heterogeneity. The significant decreasing precipitation in the dry season and the great spatiotemporal variability of precipitation in the rainy season may pose great challenges to the water supply and rain-fed agriculture in the Zambezi River Basin in the future.

4. Discussion

4.1. Results Comparison and Analysis

Our results are consistent with other studies on precipitation trends in the Zambezi River Basin and its sub-basins [27,46]. Recently, Nguyen et al. [27] adopted the PERSIANN-CDR and studied the precipitation patterns of the Zambezi River Basin. They found no significant trend for the mean annual precipitation when aggregated over the Zambezi River Basin [27]. Likewise, our study took an in-depth evaluation of spatial patterns of the mean annual precipitation using TRMM data and found only 11% of the Zambezi River Basin presented significant precipitation trends, while the remaining 89% presented non-significant trend, which agrees well with the results from Nguyen et al. [27]. Beyer et al. [47] also found significant spatial–temporal variability of rainfall in the rainy season in the Upper Zambezi River Basin, which is in accordance with the high spatial–temporal heterogeneity of precipitation observed in this study. Additionally, our results agree with other studies using in situ measurements at a sub-basin level. For example, the study of Muchuru et al. [46] indicated a non-significant trend in regards to annual precipitation in the Kariba sub-basin based on a network of 13 stations. Table 1 in our study confirms that 0% of the Kariba basin presented significant precipitation trends.
Our study also reveals a “dry gets drier, wet gets wetter” (DGDWGW) pattern in the Zambezi River Basin. This precipitation paradigm has been well confirmed over oceans [48,49], but remains controversial over land [50]. Greve et al. [50] revealed that only 10.8% of the global land area shows a robust DGDWGW pattern, while the other 9.5% of global land area demonstrates the reverse. Later Hu et al. [51] identified the DGDWGW pattern over arid regions of Central Asia (Kazakhstan, Kyrgyzstan, Tajikistan, Turkmenistan and Uzbekistan). In our study, moist regions such as the Lake Malawi (within the Niassa sub-basin) and Lake Kariba (within Kariba sub-basin) regions demonstrated an intensified precipitation (large positive magnitude in Figure 5b). On the other hand, dry regions such as the southern Niassa region and the Tete sub-basin were dominated by decreasing precipitation trends (Figure 5b).

4.2. The Drivers of Precipitation Variability

Precipitation variability can be affected by many factors, such as the position and displacement of the Inter-Tropical Convergence Zone (ITCZ) [4,40,52,53,54], changes in sea surface temperature (SST) in the South Atlantic and Indian Oceans [55], the El Niño-Southern Oscillation (ENSO) [52,53,54] and the Southern African easterly jet [56]. ITCZ is a convective front oscillating along the equator that moves from 6°N to 15°S between July and January, then returns north between February and June. The movement of the ITCZ causes the peak rainy season to occur during the summer (October to April) in the Southern Hemisphere [40]. Considering the Zambezi River Basin lies between 9–21°S, its north regions are frequently covered by the ITCZ as it marches southward, with moist air rising and plenty of precipitation. However, the southern regions of the Zambezi River Basin are seldom reached by the ITCZ, which resluts in less precipitation and relative dry conditions. This explains the north–south precipitaiton gradident and the humid, semi-arid and arid regions from north to south over the Zambezi River Basin. Associated with the ITCZ, the northeasterly winds prevail in the rainy season, while the southeasterly winds prevail during the dry season. Therefore, the position and displacement of the ITCZ would have a major impact on precipitation distribution in the study region.
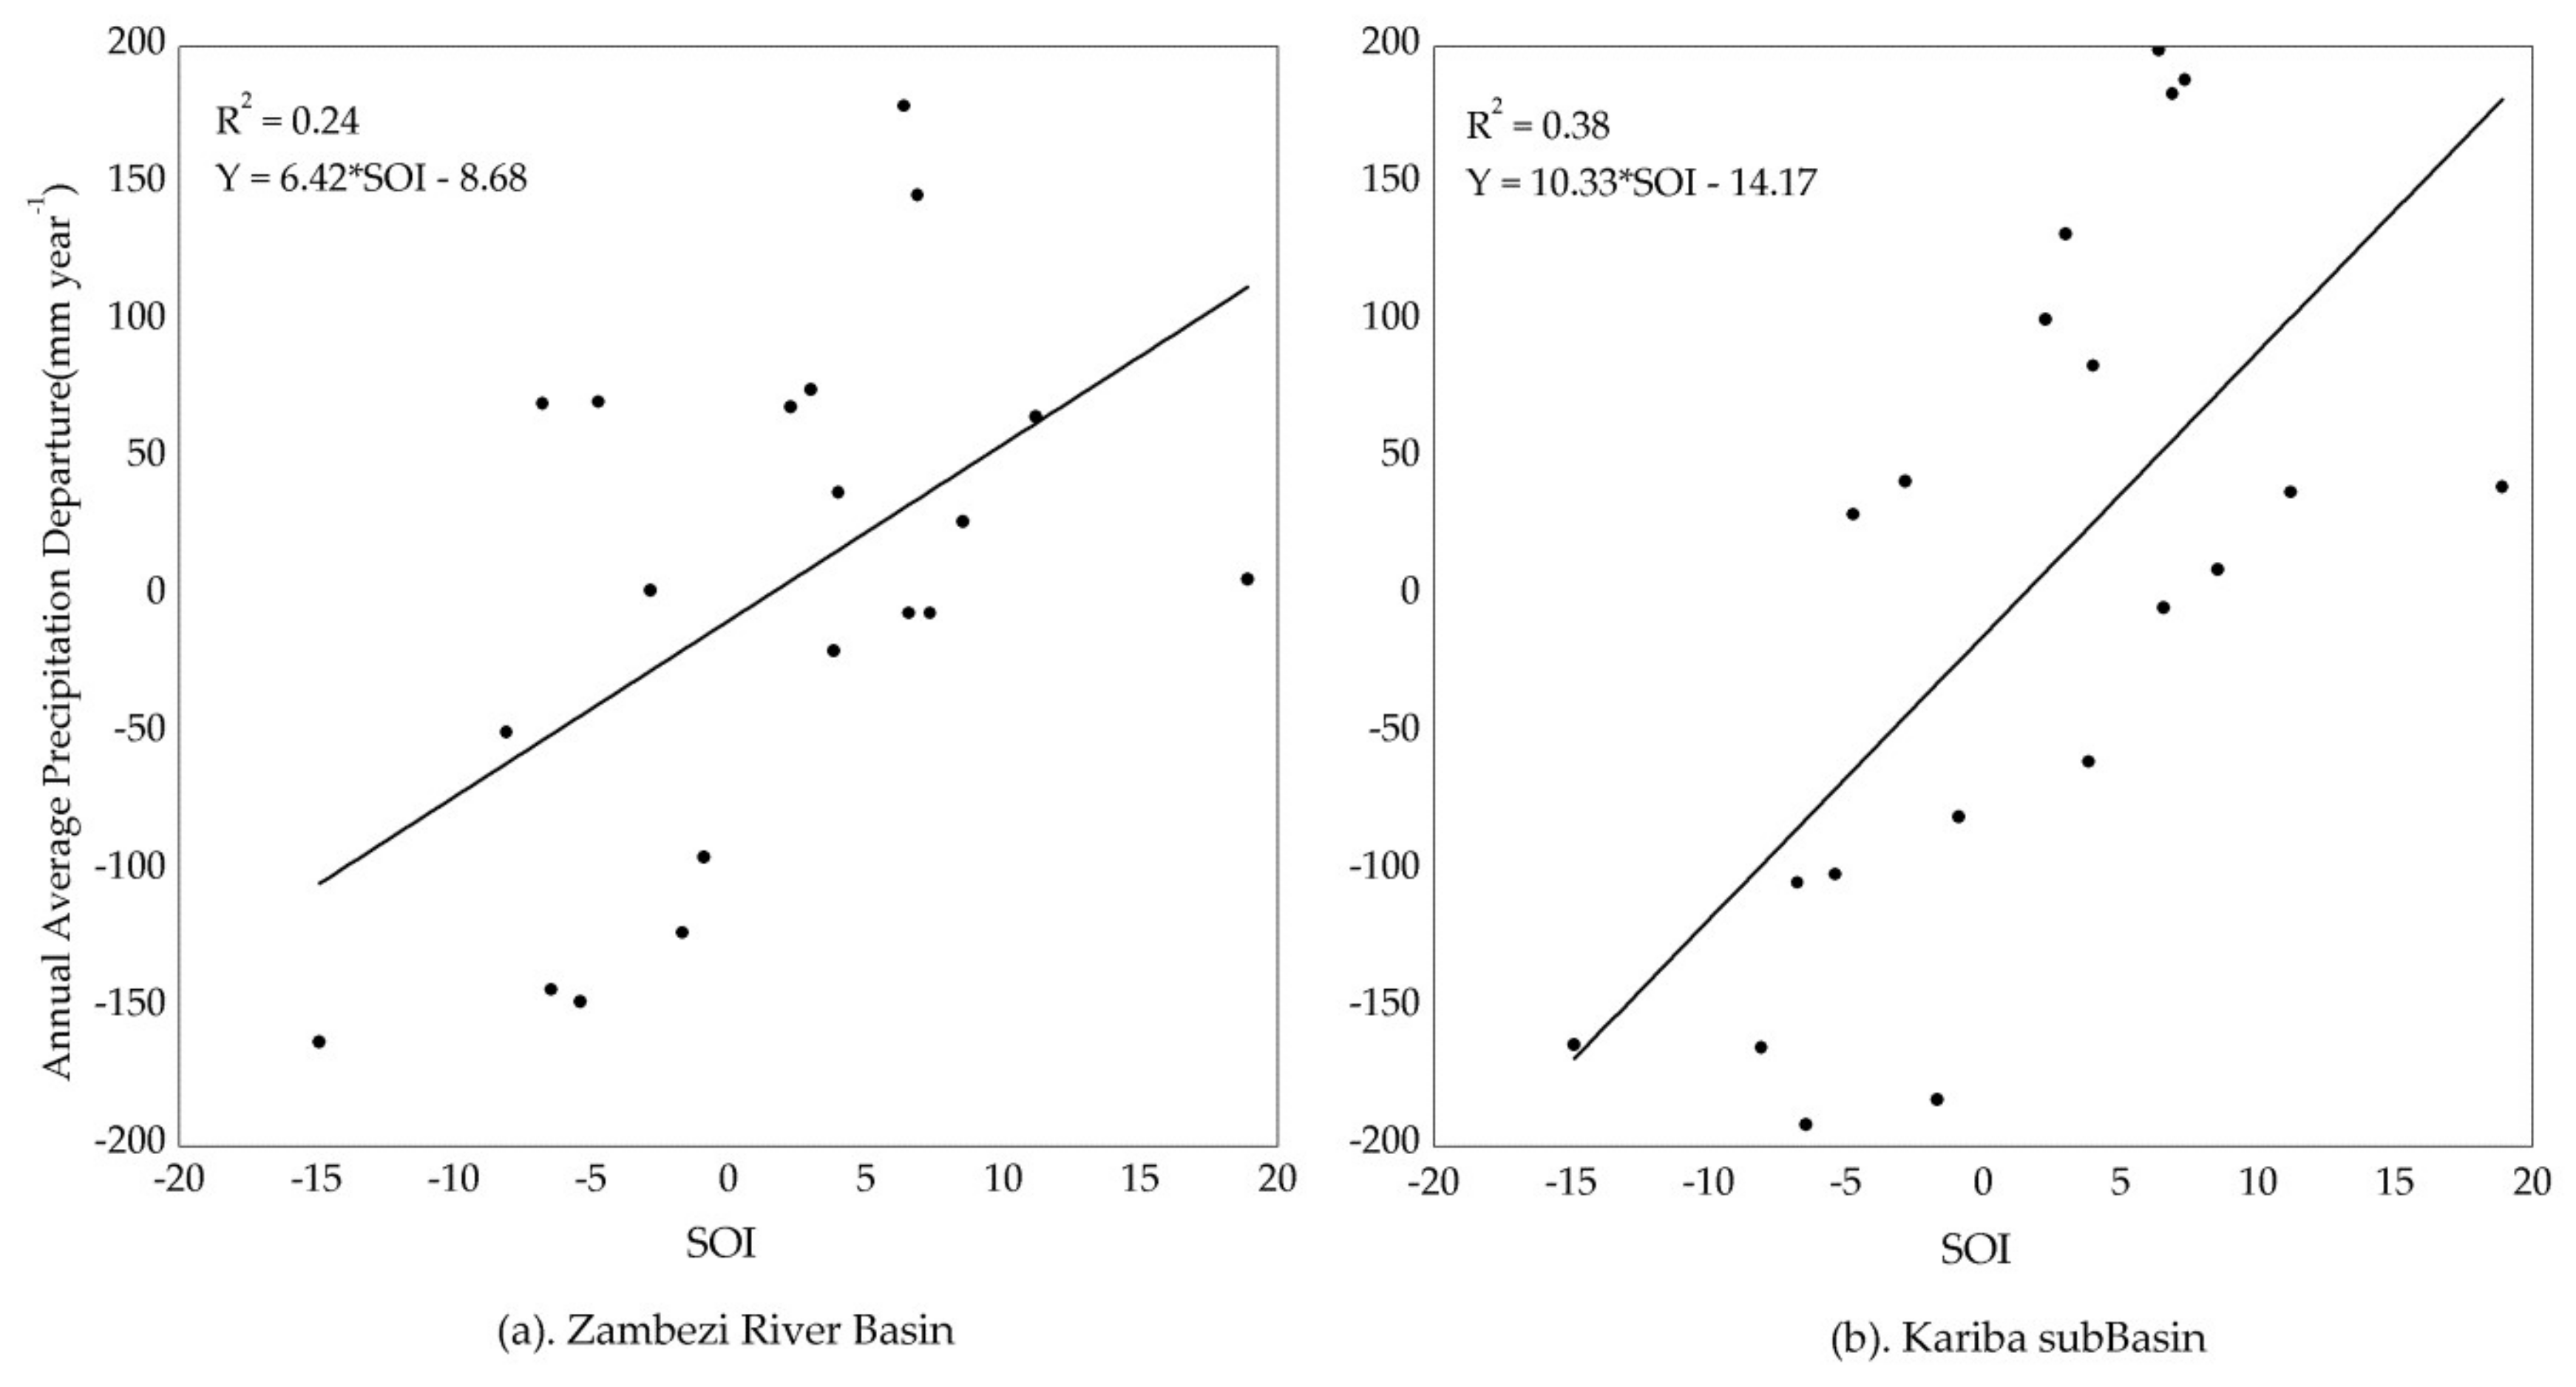
In addition, the shifts in SST in the south Atlantic and Indian oceans may alter the strength of the trade winds and, in turn, affect the position and strength of the ITCZ. For example, warm SST anomalies can stabilize the passage of the ITCZ, slow its northward advancement and bring wet conditions to southern central Africa [56]. Therefore, SST anomalies may be attributable to the interannual variability of precipitation. ENSO could be another factor affecting of the interannual variability of precipitation in the Zambezi River Basin. The Southern Oscillation Index (SOI) is one of the commonly used indicators of ENSO. Sustained negative values lower than −7 in the SOI often indicate El Niño episodes, while sustained positive values greater than +7 in the SOI are a typical sign of a La Niña episode. Taking the monthly average SOI between May 1998 and April 2017 from the bureau of meteorology of Australia (http://www.bom.gov.au/climate/current/soi2.shtml), this study explored the relationship between annual precipitation departure and SOI (Figure 9).
Figure 9 shows the scatter plots comparing the SOI with precipitation departure for the whole Zambezi River Basin (Figure 9a) and at one sub-basin, the Kariba sub-basin, which is the driest sub-basin in study region (Figure 9b). The Kariba sub-basin is used as an example, and similar relationships were also observed for other sub-basins, such as the Tete, Niasa, Mupata and Luangwa. Our results indicate that no matter the basin or sub-basin scale, a significant positive relationship can be observed between the monthly average SOI and the annual precipitation departure (Adj. R2 = 0.24 for the Zambezi River Basin, R2 = 0.38 for Kariba sub-basin, P < 0.05). It was also found that an above average (positive departure) or extremely high rain event in study region could be attributable to a La Niña episode (SOI > +7), while a below average (negative departure) or drought event could be attributable to an El Niño episode (SOI < −7). For example, the 2015–2016 were the strongest El Niño years, with rainfall departure in the Zambezi River Basin reaching −162 mm yr−1 (the driest year reported over a 20-year period).

4.3. Suggestions on Agriculture Management

The Zambezi River Basin is dominated by rain-fed agriculture [38,39]. At current stage, the fraction of agricultural land equipped with irrigation infrastructure in the Zambezi River Basin is below 1%, which is far below the global average of 30%. While only a small fraction of precipitation falls in dry season (Figure 6), the Zambezi River Basin has extensive water resource overall, and croplands could be expanded and cropping activities resumed if there were enough irrigation water supply. The Zambezi River Basin is actually rich in water resources, with annual discharge of 130 km3 yr−1 [38], but its water withdrawal rate is far below the global average. In Zambia, Mozambique, Zimbabwe and Malawi, the water withdrawal rates are 1.72%, 0.68%, 10.02% and 5.3%, respectively [57]. Therefore, there is plenty room to develop irrigation systems and make full use of the water resources in the Zambezi River Basin. It is the current underdeveloped irrigation facilities in the Zambezi River Basin that leave its agriculture heavily dependent on precipitation [47].
On the other hand, a decreasing trend was observed during the planting season (October to November) over the major crop planting zones in the Zambezi River Basin, including Kariba, Tete and southern Niassa (Figure 8) that indicated an increased risk of crop planting delay in the study area. Decreasing precipitation was also observed in March, which is in the later part of the crop-growing season. This indicated the drought conditions may have a stronger impact on crop growth or agricultural production in the future. Developing irrigated agriculture would be an alternate way of reducing the impact of precipitation fluctuations on yield loss, since the irrigated cropland has a more stable agricultural production. Taking the North China Plain as an example, the proportion of irrigated cropland in that region is over 75% [58], and the spatial and temporal variability in crop yield has been largely reduced by increased irrigation agriculture, leading to stable high crop production in most areas [59]. In India, the production of rice has increased from 20 million tons (Mt) in 1950 to 93 Mt in 2002 (Aggarwal et al. 2008) due to an expansion of irrigation agriculture. In fact, irrigation agriculture has been implemented and its effectiveness proven by Zambezi riparian countries. The area equipped for irrigation (AIE) has been expanding since 1980s. During the period of 1980 to 2015, the AIE of Zambia, Zimbabwe and Malawi within the Zambezi River Basin enlarged greatly. In particular, the AIE of Zambia increased from 19,000 ha in 1980 to 155,912 ha in 2005, at an AIE growth rate of more than 5000 ha yr−1 [60]. However, this ratio is still far below the global average. A summary report from the World Bank in 2010 [37] indicated that agricultural irrigation consumed 1.48 billion m³ water, which only accounts for 1.43% of the annual runoff. Therefore, there is much room for the development of irrigation agriculture in the Zambezi River Basin, and rational irrigation plans need to be carefully developed in the future.

5. Conclusions

This study analyzed trends and the magnitude of precipitation over the Zambezi River Basin at annual, seasonal and monthly scales using the remote sensing Version 7 TRMM 3B42 product and Google Earth Engine. Trends were identified using the kendallsCorrelation reducer in GEE, and the magnitude of precipitation was identified using the sensSlop reducer in GEE. In terms of annual precipitation, only 1% of the Zambezi River Basin showed a significant upward trend, while 10% of the Zambezi River basin showed a significant downward trend that was mainly observed for the Tete and Niassa sub-basins. About 95.6% of precipitation fell during the rainy season, thus the rainy-season precipitation had a dominant impact on the annual precipitation. The rainy-season precipitation was found to have larger spatial, temporal and magnitude variation than the dry-season precipitation. In terms of monthly precipitation, June to September in the dry season were dominated by a significant decreasing trend. However, during rainy-season months (November to April of the subsequent year), areas presenting a significant trend were rare (<12%) and scattered. Spatially, the highest and lowest rainfall regions shifted each year, and extreme precipitation (the highest and lowest rainfall) occurred predominantly over northwest side rather than the northeast area of the Zambezi River Basin. A “dry gets drier, wet gets wetter” pattern was also observed over the Zambezi River. The results from our study using TRMM 3B42 data agree well with previous studies in this region based on in situ and other remote sensing data. Thus, TRMM 3B42 is a good alternative and reliable data source for precipitation pattern analysis in sparsely gauged basins.
This study also demonstrated how to apply remote sensing precipitation data and Google Earth Engine in precipitation analysis of sparsely gauged basins. The continuous observation of precipitation from remote sensing is especially helpful for regions with fewer stations or no ground observations. The cloud-computing platform GEE provides a new, easy and feasible solution for precipitation analysis at different scales. It avoids data downloading and storing and is not limited by computing capacity. In addition, the methodology of this study can be used to explore the temporal–spatial patterns of any variables with long-term records in any region of interest. With the development of remote sensing and Google Earth Engine, more and more products on hydrology, ecology and meteorology have been released and added to Earth data catalog; thus, the trend of these variables can be easily explored using Google Earth Engine.
The rain-fed agriculture in the Zambezi River Basin is facing a great challenge due to decreasing dry-season precipitation and highly varied rainy-season precipitation. Suggestions for agriculture management are proposed accordingly in this study. Future works on the change of the rainy season (start, finish and duration), the coupling strength between precipitation and crop yield and major impact factors of crop yield in the Zambezi River Basin can be further studied.

Author Contributions

H.Z. proposed the idea for data curation, formal analysis, methodology, writing—original draft; B.W. contributed to conceptualization, methodology, funding acquisition, and project administration; N.Z. contributed to formal analysis and writing—review & editing; F.T. contributed to the data curation; E.P., W.S., M.Z., W.M., L.Z. and E.M. contributed to the writing—review & editing.

Funding

This paper was funded by the National Natural Science Foundation of China (41561144013, 41601464 and 4171101213), the National Key R&D Program of China (2016YFA0600304) and the International Partnership Program of Chinese Academy of Sciences (121311KYSB20170004).

Acknowledgments

We are very grateful to ZAMCOM for providing watershed basic geographic information data, and to the Meteorological Services Department of Zimbabwe for gauging monthly precipitation at the Banket, Bulawayo and Victoria stations, we are much appreciated the valuable comments from anonymous reviewers.

Conflicts of Interest

The authors declare no conflict of interest.

Appendix A

Table A1. Statistics of average precipitation for each of the 13 sub-basins for each year.
YearCUALUNLUAUZIKABBARKAFLUAMUPNIAKARTETZDAMax
Sub-Basin
Min
Sub-Basin
1998708123710511332127583811151024962126579710991369ZDACUA
19998241197103012181097896989924795998947929984UZIMUP
2000776125511521302130891012841264964137295812101628ZDACUA
20016751109962113110637238578686331220576741784NIAKAR
2002603117410281301120773898510748101214595835971UZIKAR
2003979117512851214112210649359988461033801809875LUAKAR
20046081110840117610956327869736761078567783806UZIKAR
200595212351051135512371013109010919211171891895989UZIKAR
20067981396108315031497981113612007321248655847941UZIKAR
20079851313129113341396110112651108103712739429161004KABTET
20088271196115512411264970105910938451251769802848KABKAR
20098371227100114461592986126611489621091789811761KABZDA
2010886124311311282132791810649867701164799732785KABTET
20117521084102612331213921113511107991119755768941UZICUA
201265591899610419837399679377601146679842982NIACUA
2013857135711721358117496699410328161245843826919UZIMUP
2014599107380611151036720889862775948658781859UZICUA
2015666119988013291144786882853619924596550566UZITET
20168221296117314431329992105610838811113860975926UZICUA
20178221139104213461276960103598378411406996931072UZITET
Max9851197105812851232893103910318191151759842950UZIKAR
Min5999188061041983632786853619924567550566UZITET
Mean7811197105812851232893103910318191151759842950UZIKAR
Std118106126113149127134109109113123138217ZDALUN
Note: ZDA = Zambezi Delta, TET = Tete, NIA = Niassa, MUP = Mupata, LUN = Luangwa, KAR = Kariba, KAF = Kafue, CUA = Cuando, BAR = Barotse, LBO = Lungue Bungo, LUA = Luanginga, UZI = Upper Zambezi, KAB = Kabompo.
Table A2. Precipitation trends (downward/upward) for each month for areas over the Zambezi River Basin.
SeasonsMonthDownwardSignificant
Downward
UpwardSignificant
Upward
Rainy
Season
November54%8%46%2%
December46%0%54%1%
January54%1%46%1%
February41%0%59%3%
March89%12%11%0%
April25%0%75%6%
Dry
Season
May82%28%18%4%
June94%81%6%2%
July97%87%3%1%
August97%85%3%1%
September94%56%6%2%
October75%4%25%1%
Table A3. The minimum, mean and maximum values of trend magnitude for each month over regions with a significant precipitation trend.
SeasonMonthSig. Downward Region (mm yr−1)Sig. Upward Region (mm yr−1)
MinMeanMaxMinMeanMax
Rainy SeasonNovember−0.5−2.6−5.70.52.57.3
December−1.2−4.0−8.41.43.48.8
January−1.2−4.7−9.11.34.413.2
February−1.1−3.7−5.81.24.110.6
March−1.2−4.5−11.81.32.63.7
April−0.8−2.7−7.80.21.59.5
Dry SeasonMay0.0−0.2−4.00.01.216.4
June0.0−0.1−4.70.01.08.6
July0.0−0.1−3.60.01.410.7
August0.0−0.1−2.50.11.07.3
September0.0−0.2−2.10.01.06.7
October0.0−0.7−3.00.21.25.3

References

  1. Rosegrant, M.W.; Cline, S.A. Global Food Security: Challenges and Policies. Science 2003, 302, 1917. [Google Scholar] [CrossRef] [PubMed] [Green Version]
  2. Connolly-Boutin, L.; Smit, B. Climate change, food security, and livelihoods in sub-Saharan Africa. Reg. Environ. Chang. 2016, 16, 385–399. [Google Scholar] [CrossRef] [Green Version]
  3. Cooper, P.J.M.; Dimes, J.; Rao, K.P.C.; Shapiro, B.; Shiferaw, B.; Twomlow, S. Coping better with current climatic variability in the rain-fed farming systems of sub-Saharan Africa: An essential first step in adapting to future climate change? Agric. Ecosyst. Environ. 2008, 126, 24–35. [Google Scholar] [CrossRef] [Green Version]
  4. Matyas, C.J.; Silva, J.A. Extreme weather and economic well-being in rural Mozambique. Nat. Hazards 2013, 66, 31–49. [Google Scholar] [CrossRef]
  5. Silva, J.A.; Matyas, C.J. Relating Rainfall Patterns to Agricultural Income: Implications for Rural Development in Mozambique. Weather Clim. Soc. 2013, 6, 218–237. [Google Scholar] [CrossRef]
  6. Wang, B.; Liu, J.; Kim, H.J.; Webster, P.J.; Yim, S.Y. Recent change of the global monsoon precipitation (1979–2008). ClDy 2012, 39, 1123–1135. [Google Scholar] [CrossRef] [Green Version]
  7. Zarenistanak, M.; Dhorde, A.G.; Kripalani, R.H. Trend analysis and change point detection of annual and seasonal precipitation and temperature series over southwest Iran. J. Earth Syst. Sci. 2014, 123, 281–295. [Google Scholar] [CrossRef]
  8. Sayemuzzaman, M.; Jha, M.K. Seasonal and annual precipitation time series trend analysis in North Carolina, United States. Atmos. Res. 2014, 137, 183–194. [Google Scholar] [CrossRef]
  9. Gajbhiye, S.; Meshram, C.; Singh, S.K.; Srivastava, P.K.; Islam, T. Precipitation trend analysis of Sindh River basin, India, from 102-year record (1901–2002). Atmos. Sci. Lett. 2016, 17, 71–77. [Google Scholar] [CrossRef]
  10. Nicholson, S.E.; Funk, C.; Fink, A.H. Rainfall over the African continent from the 19th through the 21st century. Glob. Planet. Chang. 2018, 165, 114–127. [Google Scholar] [CrossRef]
  11. Hughes, D.A. Comparison of satellite rainfall data with observations from gauging station networks. J. Hydrol. 2006, 327, 399–410. [Google Scholar] [CrossRef]
  12. Rasmussen, S.H.; Christensen, J.H.; Drews, M.; Gochis, D.J.; Refsgaard, J.C. Spatial-Scale Characteristics of Precipitation Simulated by Regional Climate Models and the Implications for Hydrological Modeling. J. Hydrometeorol. 2012, 13, 1817–1835. [Google Scholar] [CrossRef]
  13. Mendoza, P.A.; Mizukami, N.; Ikeda, K.; Clark, M.P.; Gutmann, E.D.; Arnold, J.R.; Brekke, L.D.; Rajagopalan, B. Effects of different regional climate model resolution and forcing scales on projected hydrologic changes. J. Hydrol. 2016, 541, 1003–1019. [Google Scholar] [CrossRef] [Green Version]
  14. Sun, Q.; Miao, C.; Duan, Q.; Ashouri, H.; Sorooshian, S.; Hsu, K.L. A Review of Global Precipitation Data Sets: Data Sources, Estimation, and Intercomparisons. Rev. Geophys. 2018, 56, 79–107. [Google Scholar] [CrossRef] [Green Version]
  15. Adler, R.F.; Huffman, G.J.; Chang, A.; Ferraro, R.; Xie, P.P.; Janowiak, J.; Rudolf, B.; Schneider, U.; Curtis, S.; Bolvin, D.; et al. The Version-2 Global Precipitation Climatology Project (GPCP) Monthly Precipitation Analysis (1979–Present). J. Hydrometeorol. 2003, 4, 1147–1167. [Google Scholar] [CrossRef]
  16. Joyce, R.J.; Janowiak, J.E.; Arkin, P.A.; Xie, P. CMORPH: A Method that Produces Global Precipitation Estimates from Passive Microwave and Infrared Data at High Spatial and Temporal Resolution. J. Hydrometeorol. 2004, 5, 487–503. [Google Scholar] [CrossRef]
  17. Huffman, G.J.; Bolvin, D.T.; Nelkin, E.J.; Wolff, D.B.; Adler, R.F.; Gu, G.; Hong, Y.; Bowman, K.P.; Stocker, E.F. The TRMM Multisatellite Precipitation Analysis (TMPA): Quasi-Global, Multiyear, Combined-Sensor Precipitation Estimates at Fine Scales. J. Hydrometeorol. 2007, 8, 38–55. [Google Scholar] [CrossRef]
  18. Ashouri, H.; Hsu, K.L.; Sorooshian, S.; Braithwaite, D.K.; Knapp, K.R.; Cecil, L.D.; Nelson, B.R.; Prat, O.P. PERSIANN-CDR: Daily Precipitation Climate Data Record from Multisatellite Observations for Hydrological and Climate Studies. Bull. Am. Meteorol. Soc. 2015, 96, 69–83. [Google Scholar] [CrossRef] [Green Version]
  19. Menne, M.J.; Durre, I.; Vose, R.S.; Gleason, B.E.; Houston, T.G. An Overview of the Global Historical Climatology Network-Daily Database. J. Atmos. Ocean. Technol. 2012, 29, 897–910. [Google Scholar] [CrossRef]
  20. Funk, C.; Peterson, P.; Landsfeld, M.; Pedreros, D.; Verdin, J.; Shukla, S.; Husak, G.; Rowland, J.; Harrison, L.; Hoell, A.; et al. The climate hazards infrared precipitation with stations—A new environmental record for monitoring extremes. Sci. Data 2015, 2, 150066. [Google Scholar] [CrossRef] [Green Version]
  21. Hou, A.Y.; Kakar, R.K.; Neeck, S.; Azarbarzin, A.A.; Kummerow, C.D.; Kojima, M.; Oki, R.; Nakamura, K.; Iguchi, T. The Global Precipitation Measurement Mission. Bull. Am. Meteorol. Soc. 2013, 95, 701–722. [Google Scholar] [CrossRef]
  22. Ahmed, K.; Shahid, S.; Chung, E.S.; Ismail, T.; Wang, X.J. Spatial distribution of secular trends in annual and seasonal precipitation over Pakistan. Clim. Res. 2017, 74, 95–107. [Google Scholar] [CrossRef]
  23. Adler, R.F.; Gu, G.; Sapiano, M.; Wang, J.J.; Huffman, G.J. Global Precipitation: Means, Variations and Trends During the Satellite Era (1979–2014). Surv. Geophys. 2017, 38, 679–699. [Google Scholar] [CrossRef] [Green Version]
  24. Gu, G.; Adler, R.F.; Huffman, G. Long-Term Changes/Trends in Surface Temperature and Precipitation During the Satellite Era (1979–2012); Springer: Berlin/Heidelberg, Germany, 2015; Volume 46. [Google Scholar]
  25. Wang, B.; Li, X.; Huang, Y.; Zhai, G. Decadal trends of the annual amplitude of global precipitation. Atmos. Sci. Lett. 2016, 17, 96–101. [Google Scholar] [CrossRef] [Green Version]
  26. Gu, G.; Adler, R.F. Interdecadal variability/long-term changes in global precipitation patterns during the past three decades: Global warming and/or pacific decadal variability? Clim. Dyn. 2013, 40, 3009–3022. [Google Scholar] [CrossRef]
  27. Nguyen, P.; Thorstensen, A.; Sorooshian, S.; Hsu, K.; Aghakouchak, A.; Ashouri, H.; Tran, H.; Braithwaite, D. Global Precipitation Trends across Spatial Scales Using Satellite Observations. Bull. Am. Meteorol. Soc. 2017, 99, 689–697. [Google Scholar] [CrossRef]
  28. Gorelick, N.; Hancher, M.; Dixon, M.; Ilyushchenko, S.; Thau, D.; Moore, R. Google Earth Engine: Planetary-scale geospatial analysis for everyone. Remote Sens. Environ. 2017, 202, 18–27. [Google Scholar] [CrossRef]
  29. Dong, J.; Xiao, X.; Menarguez, M.A.; Zhang, G.; Qin, Y.; Thau, D.; Biradar, C.; Moore, B. Mapping paddy rice planting area in northeastern Asia with Landsat 8 images, phenology-based algorithm and Google Earth Engine. Remote Sens. Environ. 2016, 185, 142–154. [Google Scholar] [CrossRef] [Green Version]
  30. Xiong, J.; Thenkabail, P.S.; Gumma, M.K.; Teluguntla, P.; Poehnelt, J.; Congalton, R.G.; Yadav, K.; Thau, D. Automated cropland mapping of continental Africa using Google Earth Engine cloud computing. ISPRS J. Photogramm. Remote Sens. 2017, 126, 225–244. [Google Scholar] [CrossRef] [Green Version]
  31. Zhang, X.; Wu, B.; Ponce-Campos, E.G.; Zhang, M.; Chang, S.; Tian, F. Mapping up-to-Date Paddy Rice Extent at 10 M Resolution in China through the Integration of Optical and Synthetic Aperture Radar Images. Remote Sens. 2018, 10, 1200. [Google Scholar] [CrossRef] [Green Version]
  32. Jacobson, A.; Dhanota, J.; Godfrey, J.; Jacobson, H.; Rossman, Z.; Stanish, A.; Walker, H.; Riggio, J. A novel approach to mapping land conversion using Google Earth with an application to East Africa. Environ. Model. Softw. 2015, 72, 1–9. [Google Scholar] [CrossRef] [Green Version]
  33. Long, T.; Zhang, Z.; He, G.; Jiao, W.; Tang, C.; Wu, B.; Zhang, X.; Wang, G.; Yin, R. 30 m Resolution Global Annual Burned Area Mapping Based on Landsat Images and Google Earth Engine. Remote Sens. 2019, 11, 489. [Google Scholar] [CrossRef] [Green Version]
  34. Pekel, J.-F.; Cottam, A.; Gorelick, N.; Belward, A.S. High-resolution mapping of global surface water and its long-term changes. Nature 2016, 540, 418. [Google Scholar] [CrossRef]
  35. Patel, N.N.; Angiuli, E.; Gamba, P.; Gaughan, A.; Lisini, G.; Stevens, F.R.; Tatem, A.J.; Trianni, G. Multitemporal settlement and population mapping from Landsat using Google Earth Engine. IJAEO 2015, 35, 199–208. [Google Scholar] [CrossRef] [Green Version]
  36. Thenkabail, P.S.; Knox, J.W.; Ozdogan, M.; Gumma, M.K.; Congalton, R.G.; Wu, Z.T.; Milesi, C.; Finkral, A.; Marshall, M.; Mariotto, I.; et al. Assessing future risks to agricultural productivity, water resources and food security: How can remote sensing help? Photogramm. Eng. Remote Sens. 2012, 78, 773–782. [Google Scholar]
  37. WorldBank. The Zambezi River Basin: A Multi-Sector Investment Opportunities Analysis (Vol. 4): Modeling, Analysis, and Input Data; World Bank: Washington, DC, USA, 2010; pp. 1–37. Available online: http://documents.worldbank.org/curated/en/599191468203672747/Modeling-analysis-and-input-data (accessed on 11 December 2019).
  38. Thenkabail, P.S.; Biradar, C.M.; Noojipady, P.; Dheeravath, V.; Li, Y.; Velpuri, M.; Gumma, M.; Gangalakunta, O.R.P.; Turral, H.; Cai, X.; et al. Global irrigated area map (GIAM), derived from remote sensing, for the end of the last millennium. IJRS 2009, 30, 3679–3733. [Google Scholar] [CrossRef]
  39. Biradar, C.M.; Thenkabail, P.S.; Noojipady, P.; Li, Y.; Dheeravath, V.; Turral, H.; Velpuri, M.; Gumma, M.K.; Gangalakunta, O.R.P.; Cai, X.L.; et al. A global map of rainfed cropland areas (GMRCA) at the end of last millennium using remote sensing. IJAEO 2009, 11, 114–129. [Google Scholar] [CrossRef]
  40. Cohen Liechti, T.; Matos, J.P.; Boillat, J.L.; Schleiss, A.J. Comparison and evaluation of satellite derived precipitation products for hydrological modeling of the Zambezi River Basin. Hydrol. Earth Syst. Sci. 2012, 16, 489–500. [Google Scholar] [CrossRef] [Green Version]
  41. Thiemig, V.; Rojas, R.; Zambrano-Bigiarini, M.; Levizzani, V.; De Roo, A. Validation of Satellite-Based Precipitation Products over Sparsely Gauged African River Basins. J. Hydrometeorol. 2012, 13, 1760–1783. [Google Scholar] [CrossRef]
  42. Poortinga, A.; Clinton, N.; Saah, D.; Cutter, P.; Chishtie, F.; Markert, K.N.; Anderson, E.R.; Troy, A.; Fenn, M.; Tran, L.H.; et al. An Operational Before-After-Control-Impact (BACI) Designed Platform for Vegetation Monitoring at Planetary Scale. Remote Sens. 2018, 10, 760. [Google Scholar] [CrossRef] [Green Version]
  43. Prokhorov, A.J.O. Kendall Coefficient of Rank Correlation. In Encyclopedia of Measurement and Statistics; Sage: Thousand Oaks, CA, USA, 2001. [Google Scholar]
  44. Sen, P.K. Estimates of the Regression Coefficient Based on Kendall’s Tau. J. Amer. Stat. Assoc. 1968, 63, 1379–1389. [Google Scholar] [CrossRef]
  45. Yue, S.; Hashino, M. Long term trends of annual and monthly precipitation in Japan1. JAWRA J. Am. Water Resour. Assoc. 2003, 39, 587–596. [Google Scholar] [CrossRef]
  46. Muchuru, S.; Botai, J.O.; Botai, C.M.; Landman, W.A.; Adeola, A.M. Variability of rainfall over Lake Kariba catchment area in the Zambezi river basin, Zimbabwe. Theor. Appl. Climatol. 2016, 124, 325–338. [Google Scholar] [CrossRef] [Green Version]
  47. Beyer, M.; Wallner, M.; Bahlmann, L.; Thiemig, V.; Dietrich, J.; Billib, M. Rainfall characteristics and their implications for rain-fed agriculture: A case study in the Upper Zambezi River Basin. Hydrol. Sci. J. 2016, 61, 321–343. [Google Scholar] [CrossRef]
  48. Sheffield, J.; Wood, E.F.; Roderick, M.L. Little change in global drought over the past 60 years. Nature 2012, 491, 435. [Google Scholar] [CrossRef]
  49. Durack, P.J.; Wijffels, S.E.; Matear, R.J. Ocean Salinities Reveal Strong Global Water Cycle Intensification During 1950 to 2000. Science 2012, 336, 455. [Google Scholar] [CrossRef] [Green Version]
  50. Greve, P.; Orlowsky, B.; Mueller, B.; Sheffield, J.; Reichstein, M.; Seneviratne, S.I. Global assessment of trends in wetting and drying over land. Nat. Geosci. 2014, 7, 716. [Google Scholar] [CrossRef]
  51. Hu, Z.; Chen, X.; Chen, D.; Li, J.; Wang, S.; Zhou, Q.; Yin, G.; Guo, M. “Dry gets drier, wet gets wetter”: A case study over the arid regions of central Asia. Int. J. Climatol. 2019, 39, 1072–1091. [Google Scholar] [CrossRef]
  52. Mamombe, V.; Kim, W.; Choi, Y.-S. Rainfall variability over Zimbabwe and its relation to large-scale atmosphere–ocean processes. Int. J. Climatol. 2017, 37, 963–971. [Google Scholar] [CrossRef]
  53. Muhammad, T.U.; Reason, C.J.C. Dry spell frequencies and their variability over southern Africa. Clim. Res. 2004, 26, 199–211. [Google Scholar]
  54. Nicholson, S.E.; Kim, J. The relationship of the el niño–southern oscillation to african rainfall. Int. J. Climatol. 1997, 17, 117–135. [Google Scholar] [CrossRef]
  55. Mwale, D.; Yew Gan, T.; Shen, S.S.P. A new analysis of variability and predictability of seasonal rainfall of central southern Africa for 1950–94. Int. J. Climatol. 2004, 24, 1509–1530. [Google Scholar] [CrossRef]
  56. Farnsworth, A.; White, E.; Williams, C.J.R.; Black, E.; Kniveton, D.R. Understanding the Large Scale Driving Mechanisms of Rainfall Variability over Central Africa. In African Climate and Climate Change: Physical, Social and Political Perspectives; Williams, C.J.R., Kniveton, D.R., Eds.; Springer Netherlands: Dordrecht, The Netherlands, 2011; pp. 101–122. [Google Scholar]
  57. Li, X.; Vernon, C.R.; Hejazi, M.I.; Link, R.P.; Huang, Z.; Liu, L.; Feng, L. Tethys–A Python Package for Spatial and Temporal Downscaling of Global Water Withdrawals. J. Open Res. Softw. 2018, 6, 9. [Google Scholar] [CrossRef] [Green Version]
  58. Fang, Q.X.; Ma, L.; Green, T.R.; Yu, Q.; Wang, T.D.; Ahuja, L.R. Water resources and water use efficiency in the North China Plain: Current status and agronomic management options. Agric. Water Manag. 2010, 97, 1102–1116. [Google Scholar] [CrossRef]
  59. Wang, E.; Yu, Q.; Wu, D.; Xia, J. Climate, agricultural production and hydrological balance in the North China Plain. Int. J. Climatol. 2008, 28, 1959–1970. [Google Scholar] [CrossRef]
  60. Siebert, S.; Kummu, M.; Porkka, M.; Döll, P.; Ramankutty, N.; Scanlon, B.R. A global data set of the extent of irrigated land from 1900 to 2005. Hydrol. Earth Syst. Sci. 2015, 19, 1521–1545. [Google Scholar] [CrossRef] [Green Version]
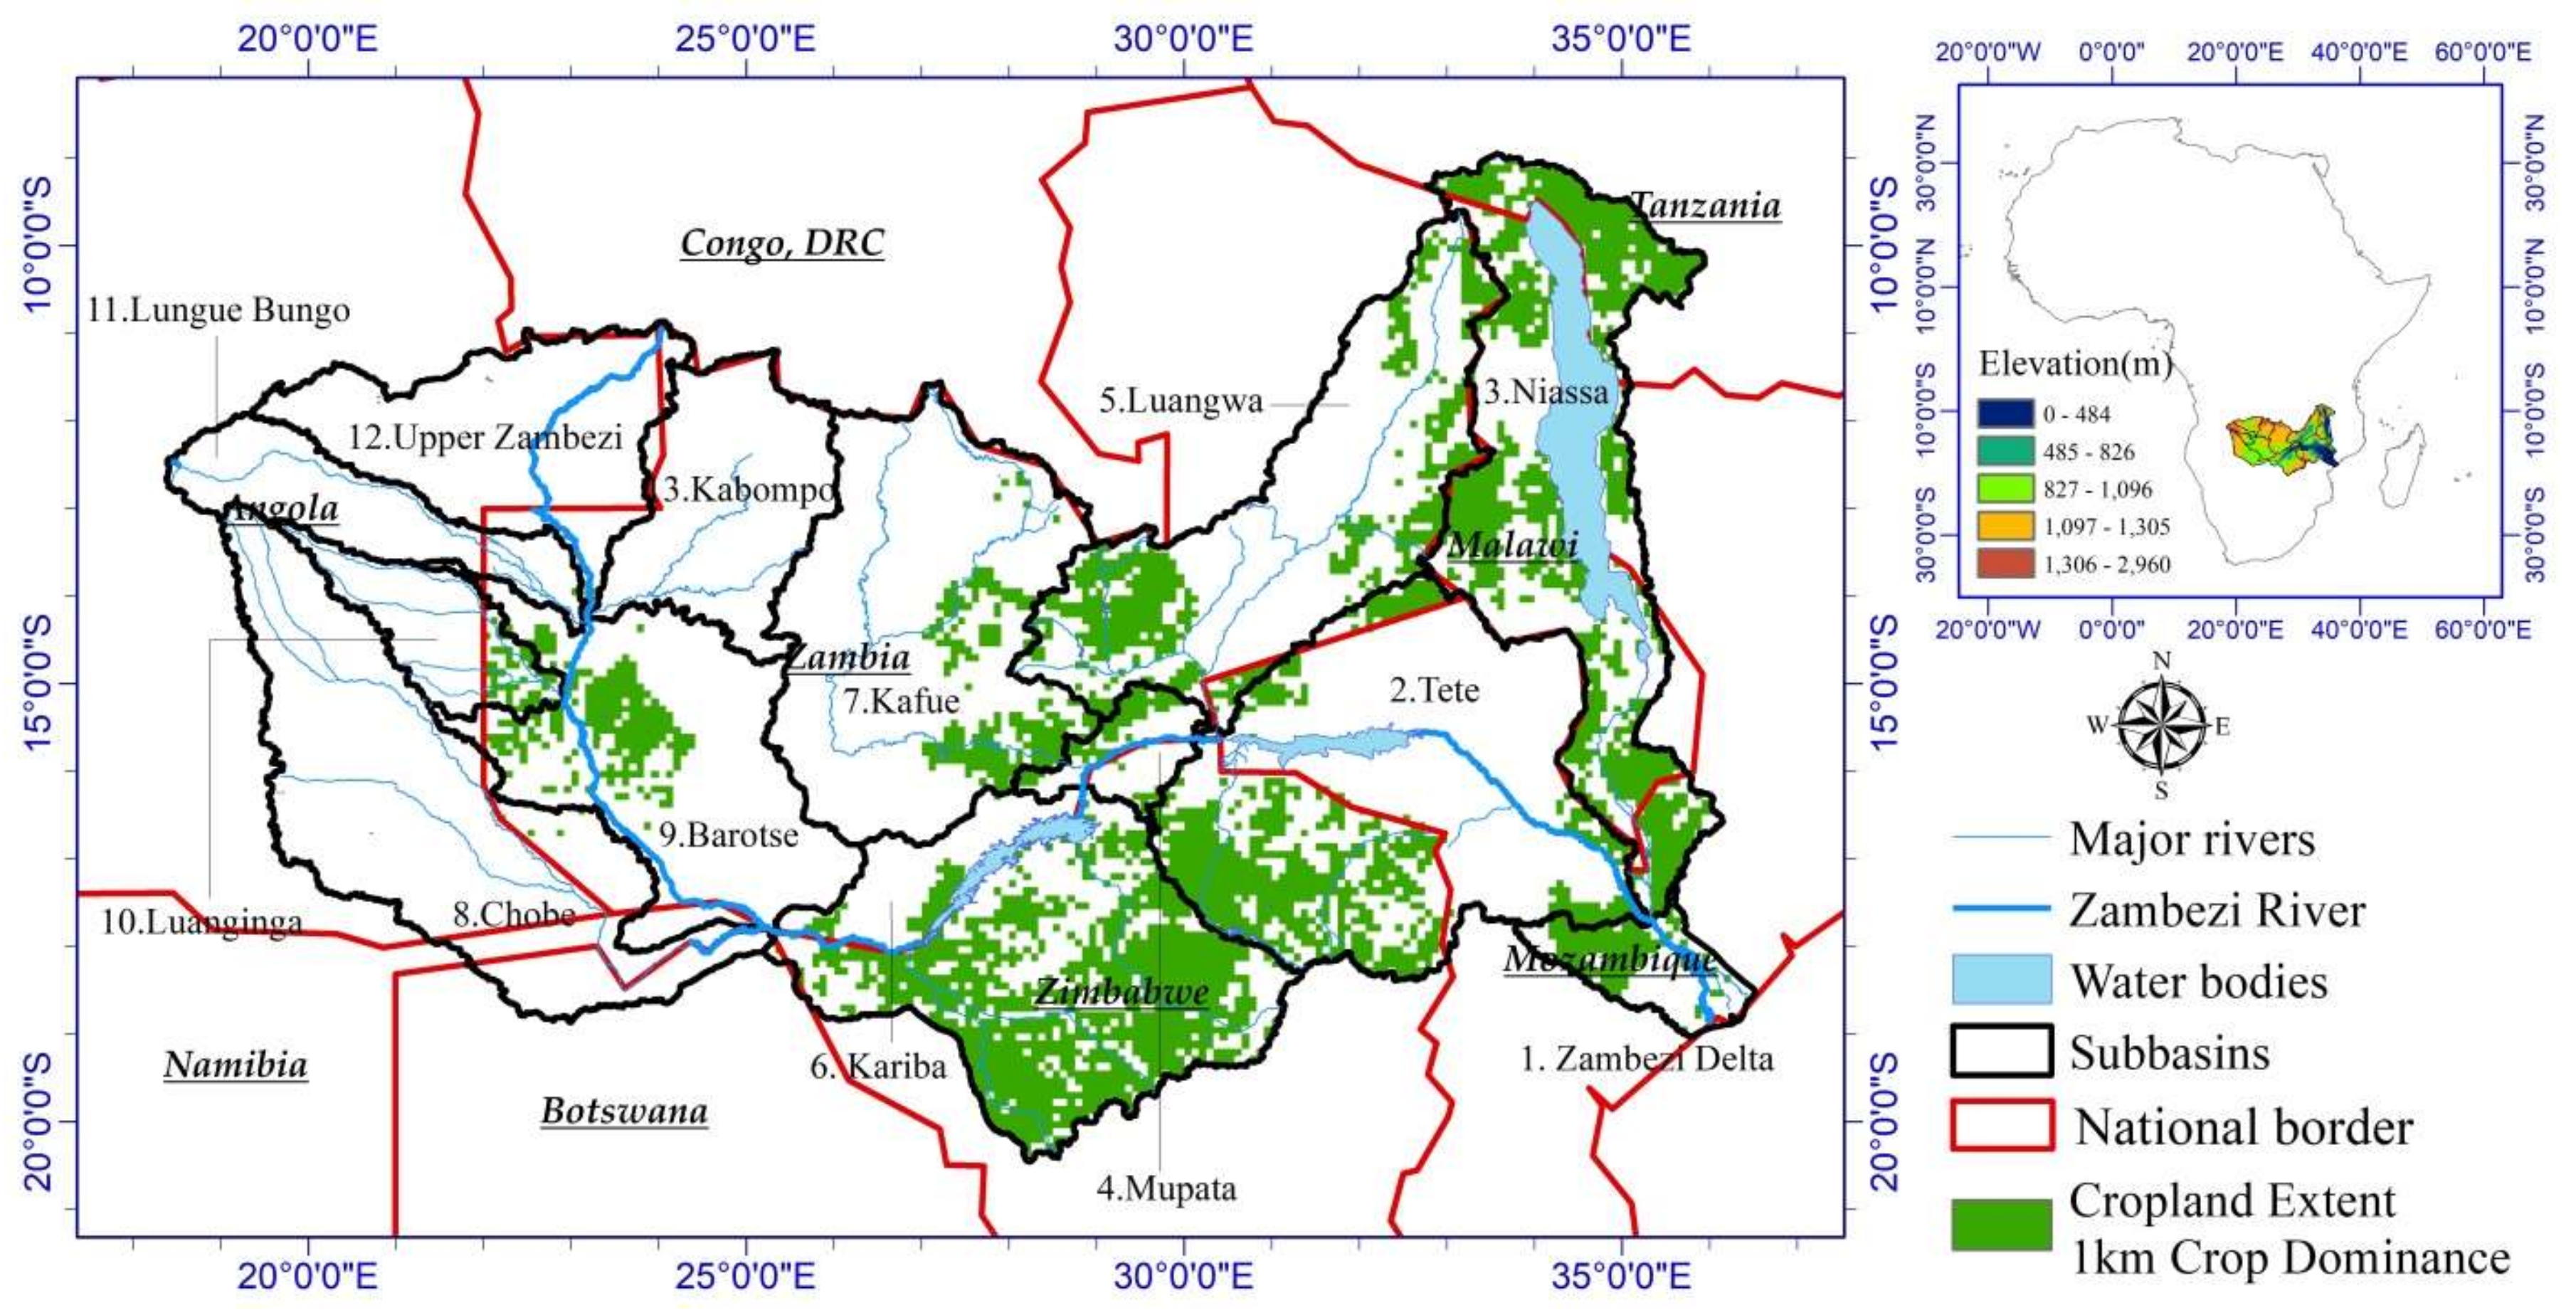
Figure 1. Geographical location of the Zambezi River Basin. Cropland Extent 1-km Crop Dominance is provided by Global Food-Support Analysis Data [36], which are derived from multi-sensor remote sensing data, secondary data and field-plot data, and aim to document cropland dynamics. The underlined terms indicate the names of countries.
Remotesensing 11 02977 g001
Figure 2. Correlation analysis between monthly Tropical Rainfall Measuring Mission (TRMM) 3B42 and rain gauge data.
Remotesensing 11 02977 g002
Figure 3. Flowchart of trend detection and magnitude analysis of precipitation data.
Remotesensing 11 02977 g003
Figure 4. (a) Spatial distribution of average precipitation from 1998 to 2018 over the Zambezi River Basin; (b) time series plot of the min, mean and max precipitation from 1998 and 2018 over the Zambezi River Basin. The top curve is generated by extracting the grids (0.25°) with maximum precipitation within the Zambezi River Basin for each year, and it indicates the maximum precipitation of the study region over 20 years. The bottom curve is generated by extracting the grids (0.25°) with minimum precipitation within the Zambezi River Basin for each year, and it indicates the minimum precipitation of the study region over 20 years. The yellow-shaded area indicates the precipitation range (range = max–min), or the difference between the grids (0.25°) with maximum and minimum precipitation over 20 years.
Remotesensing 11 02977 g004
Figure 5. Spatial distribution of (a) the annual precipitation trend from 1998 to 2017 using the Kendall’s Correlation reducer, and (b) magnitude of the annual precipitation trend of the area with a significant trend using the SensSlop reducer.
Remotesensing 11 02977 g005
Figure 6. Monthly precipitation in the Zambezi River Basin from 1998 to 2017. The top, middle and bottom curves indicate the maximum, mean, and minimum precipitation, respectively, over the study region during 12 months. The distance between the max and min curves represents the variation range (range = max–min) for each month.
Remotesensing 11 02977 g006
Figure 7. Spatial distribution of mean precipitation during the (a) rainy season (November to April) and (b) dry season (May to October).
Remotesensing 11 02977 g007
Figure 8. Spatial distributions of the precipitation trend and trend magnitude from 1998 to 2017 during the rainy-season (November to April) and dry season (May to October) months. ZDA = Zambezi Delta, TET = Tete, NIA = Niassa, MUP = Mupata, LUN = Luangwa, KAR = Kariba, KAF = Kafue, CUA = Cuando, BAR = Barotse, LBO = Lungue Bungo, LUA = Luanginga, UZI = Upper Zambezi, KAB = Kabompo.
Remotesensing 11 02977 g008
Figure 9. Comparison of annual precipitation departure and monthly mean Southern Oscillation Index (SOI) from 1998 to 2017.
Remotesensing 11 02977 g009
Table 1. Area statistics of precipitation trends (downward/upward) over the Zambezi River Basin and its sub-basins (the sub-basins are listed from east to west).
No.Sub-Basin NameDownwardSignificant DownwardUpwardSignificant Upward
1Zambezi Delta97%0%3%0%
2Tete99%30%1%0%
3Niassa77%34%23%5%
4Mupata100%0%0%0%
5Luangwa70%7%30%2%
6Kariba86%0%14%0%
7Kafue80%5%20%0%
8Cuando51%0%49%0%
9Barotse35%0%65%2%
10Lungue Bungo62%2%38%0%
11Luanginga70%0%30%1%
12Upper Zambezi33%2%67%1%
13Kabompo48%0%52%0%
14Zambezi River Basin70%10%30%1%