1. Introduction
Understanding spatial and temporal distributions of dust height and optical depth is of great importance to dust monitoring, warnings, as well as forecast and climate change research [
1,
2,
3]. Central Asia, including northwest China, is one of four areas in the world with the most dust storms (the other areas are the southwestern area of North America, North Africa, and Australia). The land cover of this region is mainly sparse vegetation and crumbly soil with rich mineral particles [
4]. As a result, sandstorms may occur at any time when certain weather conditions are met [
5]. Previous research has noted that dust storms in this region not only influence the atmospheric environment [
6,
7] but also significantly impact marine ecosystems by transporting the iron-containing soil and further affecting the global climate [
8,
9,
10,
11]. In addition, aerosols in the Northwest Pacific Ocean have a close relationship with dust storms in East Asia [
12].
The Taklimakan Desert is one of the main sources of sandstorms in the world, with sandstorms occurring in this area both day and night [
13]. Due to the severe natural environment in this region, there are only a limited number of observation stations. The spatial and temporal distribution and strength of the sandstorms often vary in an inhomogeneous way, making it impossible to acquire three-dimensional variations of the sandstorm using conventional observation methods. Measurements from satellite-based high spectral resolution infrared (IR) atmospheric sounders [
14] can be used to monitor and estimate dust height and dust aerosol optical depth (AOD) in this area. Compared with station observations, satellite technology becomes a more effective way to monitor dust weather. However, it is still difficult to estimate dust-top height (DTH) and night time dust AOD from a satellite-based passive and spectral imager with moderate spatial resolution such as the Moderate-Resolution Imaging Spectroradiometer (MODIS). For instance, although satellite-based thermal IR observations can be used to detect dust storms and retrieve optical depth of dust storms [
15,
16,
17], it is difficult to obtain height information. For shortwave bands, it is difficult to acquire accurate dust AOD over areas with high surface albedo [
18]. The daytime dust AOD can be derived from the Deep Blue (DB) method [
19] based on satellite data under a bright land surface background. However, the DB method cannot be used to acquire DTH and dust AOD at night. In addition, although active remote sensing data such as CALIOP (Cloud-Aerosol Lidar with Orthogonal Polarization) can be used to estimate the vertical structure of dust storms, only nadir observation is available. Therefore, it is not suitable for broad-range dust monitoring.
Dust and meteorological clouds show different signals when observed by satellite-based high spectral infrared sensors such as the Atmospheric InfraRed Sounder (AIRS). Therefore, these sensors can be used to extract dust optical depth and height not only for daytime but also for nighttime [
20,
21]. Pierangelo et al. [
22] developed a look-up table method based on precalculated data, from which AIRS is used to retrieve dust-top height (DTH) and infrared optical depth over the Atlantic. De Souza-Machado et al. [
23] analyzed dust infrared signals over the ocean using AIRS infrared observations; due to higher emission and variation, it is more difficult to estimate dust AOD and DTH over land than that over the ocean [
24]. Yao et al. [
25] analyzed the feasibility of retrieving DTH and optical depth over land using AIRS with a 1Dvar-based iterative method. With infrared land surface emissivity (LSE) and atmospheric profile data as ancillary input data, the DTHs, along with the dust AODs over land were derived from AIRS BT measurements, and results show the great potential of AIRS in the retrieval of dust parameters. Han and Sohn [
26] developed a statistical model based on collocated AIRS BT measurements, MODIS AOD product, and CALIOP dust height observations. Yao et al. [
27] also analyzed the feasibility of retrieving DTH using combined AIRS BT measurements and MODIS DB product and got some preliminary results. Overall, these previous studies mainly focused on limited observation data. It is still necessary to further analyze the properties of dust aerosol over an area with high-frequency dust events.
The main purposes of this study are to develop statistical models suitable for dust AOD and DTH retrieval from AIRS BT measurements and to calculate the statistics of the averaged DTH near the dust source regions, which is useful for understanding and modeling of dust origination and transportation. This study is different from previous research in the following aspects: (1) in-situ measurements are used to validate dust AOD products derived from AIRS; (2) the influence of MODIS DB AOD on AIRS DTH retrieval is investigated and evaluated; and (3) the method and approaches are established and now can be applied to process measurements from an advanced IR sounder and a high-resolution imager onboard the same platform, such as the Cross-track Infrared Sounder (CrIS) and the Visible Infrared Imaging Radiometer Suite (VIIRS) onboard the Suomi-NPP platform and JPSS (Joint Polar Satellite System) series. With the developed algorithms and technical approached, real-time continuous dust monitoring from a hyperspectral IR sounder onboard a geostationary platform such as GIIRS (Geosynchronous Interferometric Infrared Sounder, onboard the Fengyun-4 series [
28]) is now possible.
Independent typical case studies have been conducted in order to demonstrate the application of the statistical retrieval models, as well as to evaluate the performance of AIRS dust retrievals.
Section 2 describes the data used in this study;
Section 3 describes the algorithms and technical approaches used for AIRS dust retrieval;
Section 4 presents various case studies along with DTH retrievals;
Section 5 presents DTH statistics over the Taklimakan Desert;
Section 6 presents the discussion about method and results; conclusion is summarized in
Section 7.
3. Method and Result
3.1. Dust Detection
Designed to measure atmosphere and cloud parameters [
29], AIRS can be used to detect day and night dust properties using its longwave infrared channels [
21]. Previous studies have demonstrated that dust shows an absorption peak at 10 μm (1000 cm
−1), while ice crystals peak at 12 μm (800 cm
−1). DeSouza-Machado et al. [
24] used 5 AIRS channels at 822.4 cm
−1, 900.3 cm
−1, 961.1 cm
−1, 1129.0 cm
−1, and 1231.3 cm
−1 to create 9 tests and to calculate dust score for detecting dust pixel over the ocean. This dust-detection algorithm (DDA) was used over land by doubled last two tests value with the same threshold of 380. The modified DDA is the first step of data processing to pick up the dust in AIRS radiances, and then other source data collocated to AIRS dust pixel.
3.2. Data Collocate
AIRS, MODIS, and CALIOP are all a part of A-train series satellites with different spatial resolutions. A common collocation method was used to turn MODIS and CALIOP data to AIRS pixel size by considering the distances of the center positions. The mean MODIS DB AOD value is used for collocation.
For CALIOP L2 product, there may be several layers of aerosol at each pixel. The dust and polluted dust layers are identified with the information from this aerosol pixel feature classification flag. CALIOP dust height information has been extracted with the dust layer top and bottom altitudes weighted by Aerosol Optical Thickness (AOT) of corresponding layers in order to develop and validate the AIRS dust height algorithm [
26]. The column aerosol and cloud optical depth at 532 nm are used for validating the night case results.
CARSNET AOD data within 7.5 min of AIRS overpass are chosen to use for AIRS dust AOD validation at Tazhong site. For collocating the AIRS dust AOD at 550 nm, CARSNET 550 nm AOD is linearly interpolated with AOD at 440 nm and 870 nm [
37].
Based on the method above, 4 collocated datasets have been structured: 1) AIRS L1B data and MODIS DB AOD for dust AOD model developing and validation; 2) AIRS L1B data, MODIS DB AOD, and CARSNET AOD for AIRS dust AOD validation; 3) AIRS L1B data, CALIOP L2 dust height, and AOD for AIRS DTH model developing and validation; 4) AIRS L1B data, MODIS DB AOD, and CALIOP L2 products for AIRS DTH model developing and validation.
3.3. Artificial Neural Network Method
A typical Back-Propagation (BP)-based artificial neural network (ANN) algorithm was used in this research over the Taklimakan Desert ranging from 35°N to 45°N latitude and from 75°E to 95°E longitude [
38,
39]. Compared with a 1Dvar-based physical retrieval method, the ANN method only depends on the matched observations and dust parameter datasets and avoids the construction of the atmospheric radiation transfer model, which also needs surface and atmospheric parameters as inputs in the retrieval. The BP ANN’s learning process consists of two parts: forward propagation and backward propagation. In the forward propagation stage, input information is processed by the hidden layer’s exiting function and then output into the next layer of neurons. The condition of neurons at every layer influences the next layer. If the expected output is not acquired by the output layer, then the backward propagation starts. The error signals will go back through the primary neuron’s connection and modify the weight of the neuron’s connection for each layer. The forward and backward processes are iterated until the signal error reaches a limited range. Using MODIS data, Cho et al. [
40] detected very thin dust aerosols over the ocean with the ANN algorithm. Similar to Yao et al. [
41], a three-layer network is used in this study. The input layer has no computation function and is only used to enter the input vector. BTs of nine AIRS channels (704.7 cm
−1, 718.0 cm
−1, 1224.6 cm
−1, 843.9 cm
−1, 871.3 cm
−1, 965.4 cm
−1, 1074.5 cm
−1, 1228.2 cm
−1, and 1236.5 cm
−1) are used as input vector, which is similar to Peyridieu et al. [
42], and surface height information from AIRS L1B data is also added as input vector. The first three channels are selected for atmosphere retrieval capabilities and the other six channels are chosen for retrieving dust height and optical depth information. In the hidden layer, there are 10 nodes and each node performs a weighted sum over all of the input values and applies a sigmoidal function to produce an output vector. In the output layer, the Purelin linear function is applied and the output vector corresponds to the retrievals such as MODIS AOD (at 550 nm) and CALIOP dust height. Generally, one dataset is used to train the network and another dataset is used to evaluate the retrievals. The AIRS collocated data is based on dust detection results from the five AIRS channels. The method, presented in
Section 3.1, is used to extract dust pixels and avoid cloud influence. A detailed description of the retrieval approaches is provided in the following sections.
3.4. Dust AOD from AIRS
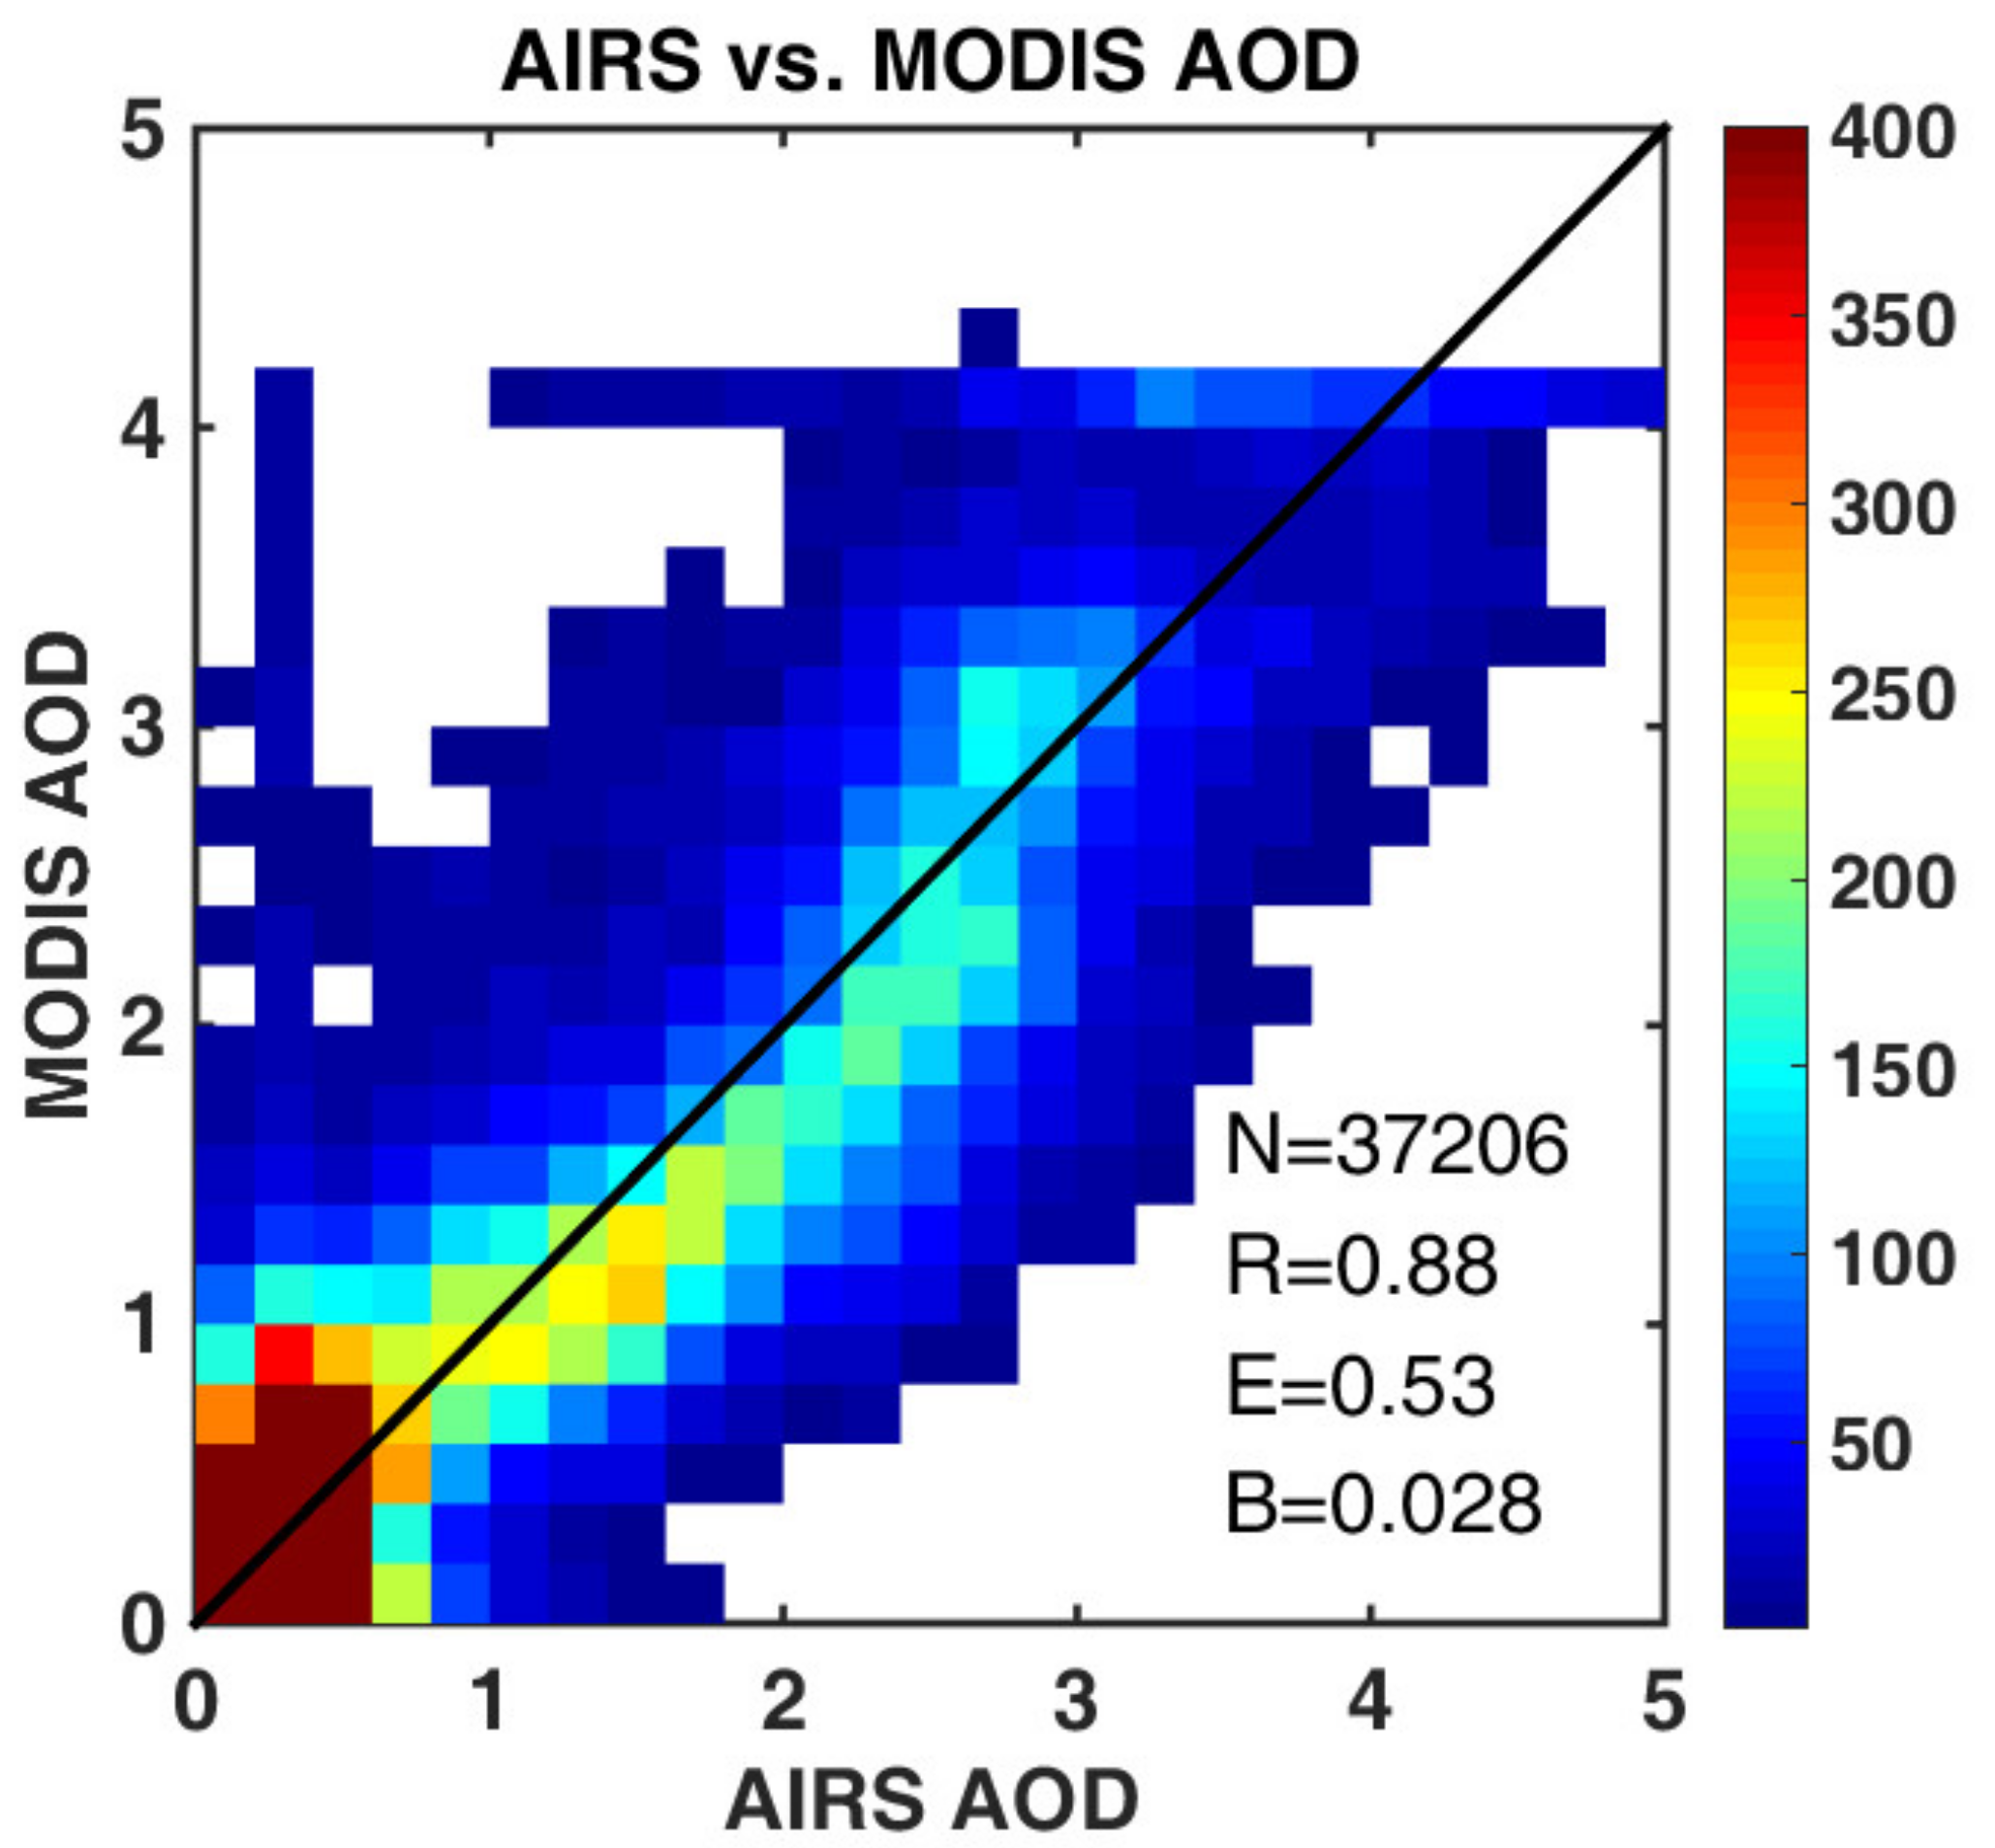
The statistic retrieval model of AIRS dust AOD is based on the collocated data of AIRS L1B data and MODIS DB AOD from 2007 to 2013. In the database, the nine channels BTs measurement and surface elevation from AIRS L1B data were used as input vector and the collocated MODIS AOD as the output vector. The ANN model was built with 93,261 matched pairs from 2010 to 2013, and another 37,206 matched pairs from 2007 to 2009 were used for validation.
A relationship between the AIRS BTs and MODIS AODs is established.
Figure 1 shows the comparison between the dust AOD extracted from AIRS and MODIS using 37,206 independent validation samples. The AIRS dust AOD is well correlated with MODIS, with a linear correlation coefficient (R) approaching 0.88, a root mean square deviation (E) of 0.53 and a deviation (B) of 0.028, which demonstrated a good agreement between the AIRS dust AOD and MODIS AOD.
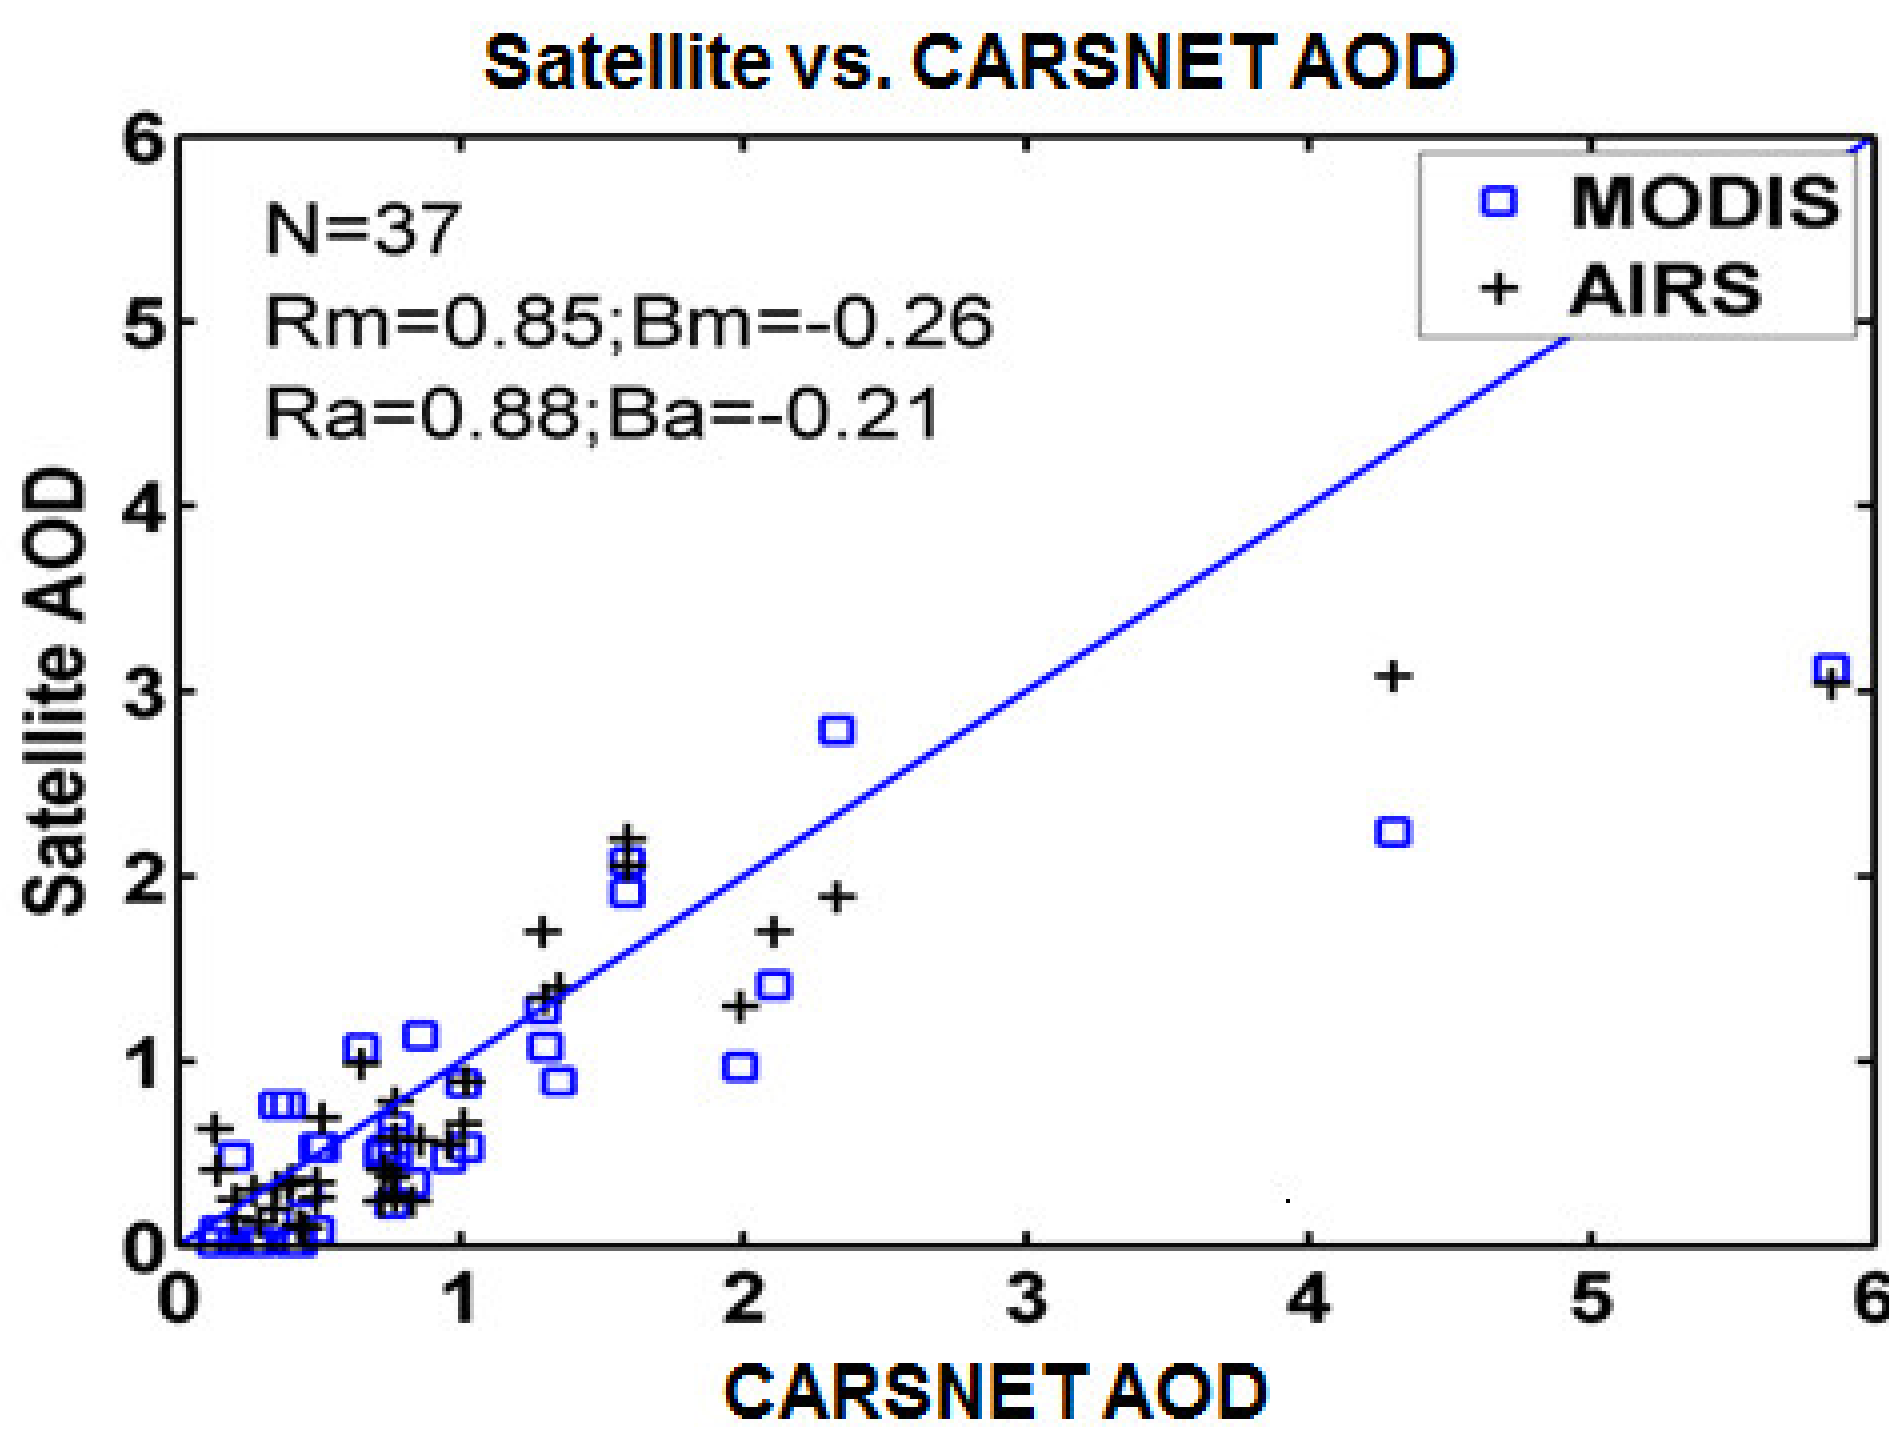
In order to further test the performance of AIRS for dust AOD retrieval, matched CARSNET AOD measurements from the Tazhong site from 2004 to 2009 were used to compare and validate AIRS dust AOD.
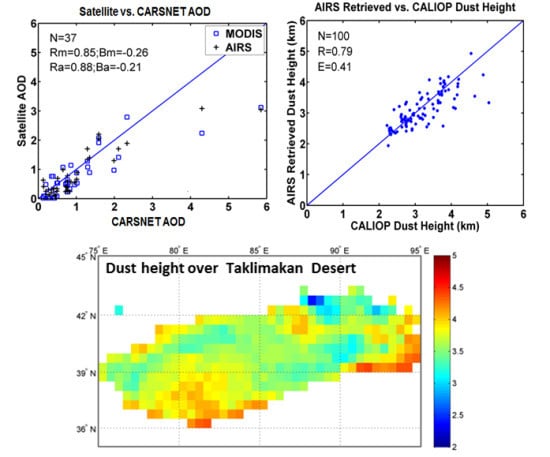
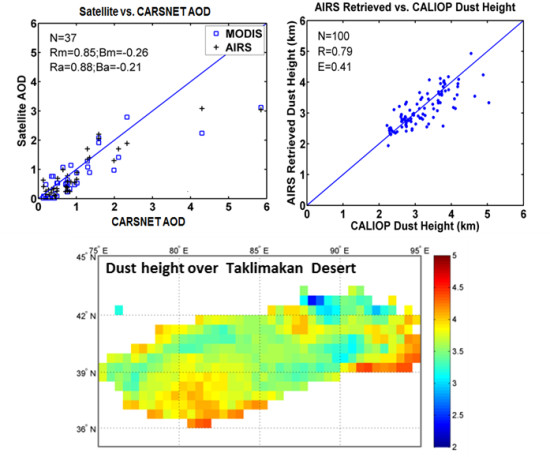
Figure 2 shows the comparison between AIRS dust AOD, MODIS AOD, and CARSNET AOD with 37 samples. The correlation coefficient (Ra) between AIRS dust AODs and CARSNET AODs is 0.88 with a deviation (Ba) of -0.21; while the correlation coefficient (Rm) between MODIS AODs and CARSNET AODs is 0.85 with a deviation (Bm) of -0.26. The results suggest that AIRS and MODIS have similar abilities in retrieving dust aerosol optical depth. Generally, when the AOD is less than 1, the satellite-derived AOD tends to be underestimated. However, the above results demonstrate that AIRS is applicable for extracting dust AOD over land.
3.5. DTH from AIRS
The statistic retrieval model of AIRS DTH is firstly based on the collocated data of AIRS L1B data and CALIOP L2 dust height which has matched to AIRS pixel with the weighted-average method from 2007 to 2013 [
26]. The dust DTH model is developed similarly as dust AOD model. In order to reduce the influence of dust layer below atmospheric boundary layer, the mean height of a single dust layer which was 1 km higher than the land surface is used to compute the CALIOP weighted dust height. Furthermore, the dust layer that is higher than 6 km is excluded to reduce the influence of cirrus clouds. With the improved collocation database, 466 matched samples were acquired using satellite observations between 2007 and 2013, from which 366 samples with an early observation time were used to train and develop a statistical retrieval model for DTH, while the other 100 independent samples were used for validation. It is worth examining that relatively strict principles were used to construct the matchup database in order to reduce the influence of other factors. As a result, the number of final matched samples is not very large.
Observations from multiple instruments onboard the same platform can be used together for cloud and dust retrievals [
27,
43,
44]. According to the simulation experiments conducted by Yao et al. [
27], the retrieval error of the DTH could be reduced by combining MODIS DB AOD and AIRS BT measurements. The DTH error is less than 0.5 km when the DTH is greater than 2.0 km and the MODIS DB AOD is greater than 0.5. Therefore, MODIS DB AOD was used as one of the input parameters, and a DTH retrieval model was established using AIRS BT measurements with an option of including MODIS DB AOD as input for daytime retrieval.
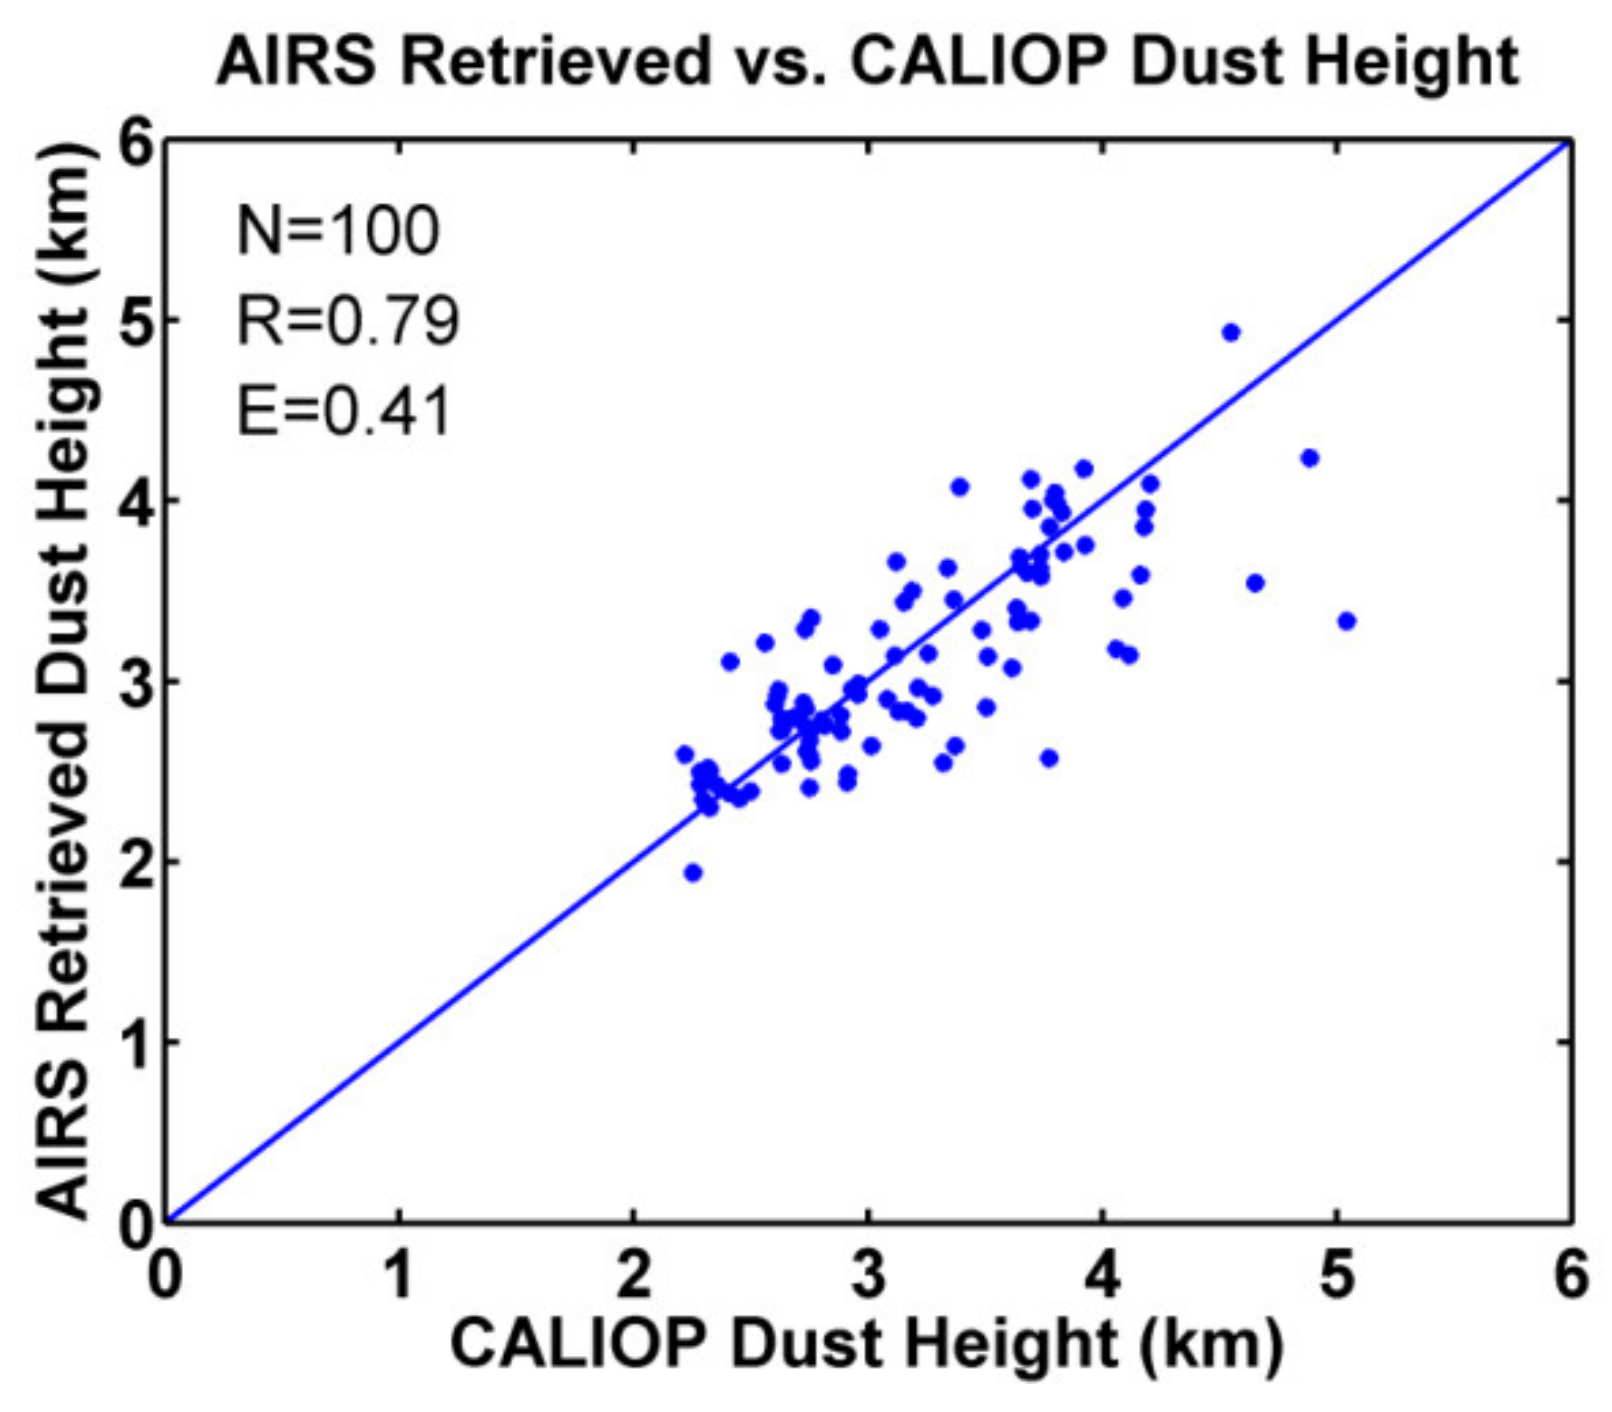
Figure 3 shows the validation results for AIRS DTH retrievals. AIRS DTHs and CALIOP dust heights have a close relationship, in which R is equal to 0.79 and the deviation is equal to 0.41 km. The results demonstrate that AIRS is feasible for DTH retrieval. A nine-channel retrieval model based on AIRS BT measurements was further established for analyzing the influence of MODIS DB AOD on the DTH retrieval. If only AIRS BT measurements were used, the correlation coefficient between retrievals and CALIOP dust heights is 0.75 and the deviation is 0.44 km, indicating that adding MODIS DB AOD information can significantly improve the accuracy of AIRS DTH retrievals. However, for nighttime retrievals, only the AIRS nine-channel BT measurements are used.
4. Case Studies
A series of case studies for different seasons and dust strengths were examined to further analyze the feasibility of AIRS for DTH retrieval. CALIOP vertical profiles were used to compare with satellite extracted DTH results. The study periods are April 4, 2013, November 11, 2013, and March 19, 2010. The first two case studies, conducted during the daytime, are located in the Taklimakan Desert while the last case study, conducted at night, is located in the Gadain Jaran Desert and its neighboring district. Dust AOD was derived from the statistical model using AIRS BT measurements, as described in
Section 3. For the daytime DTH retrieval, the retrieval model uses both AIRS BT measurements and MODIS DB AOD product, while for the nighttime DTH retrieval, the retrieval model uses only AIRS BT measurements. It should be noted that since the nine AIRS channels also contain both the surface and atmospheric profile information, the statistical retrieval model is able to take into account the surface and atmospheric profile effect in the DTH retrieval.
4.1. Case 1: April 4, 2013
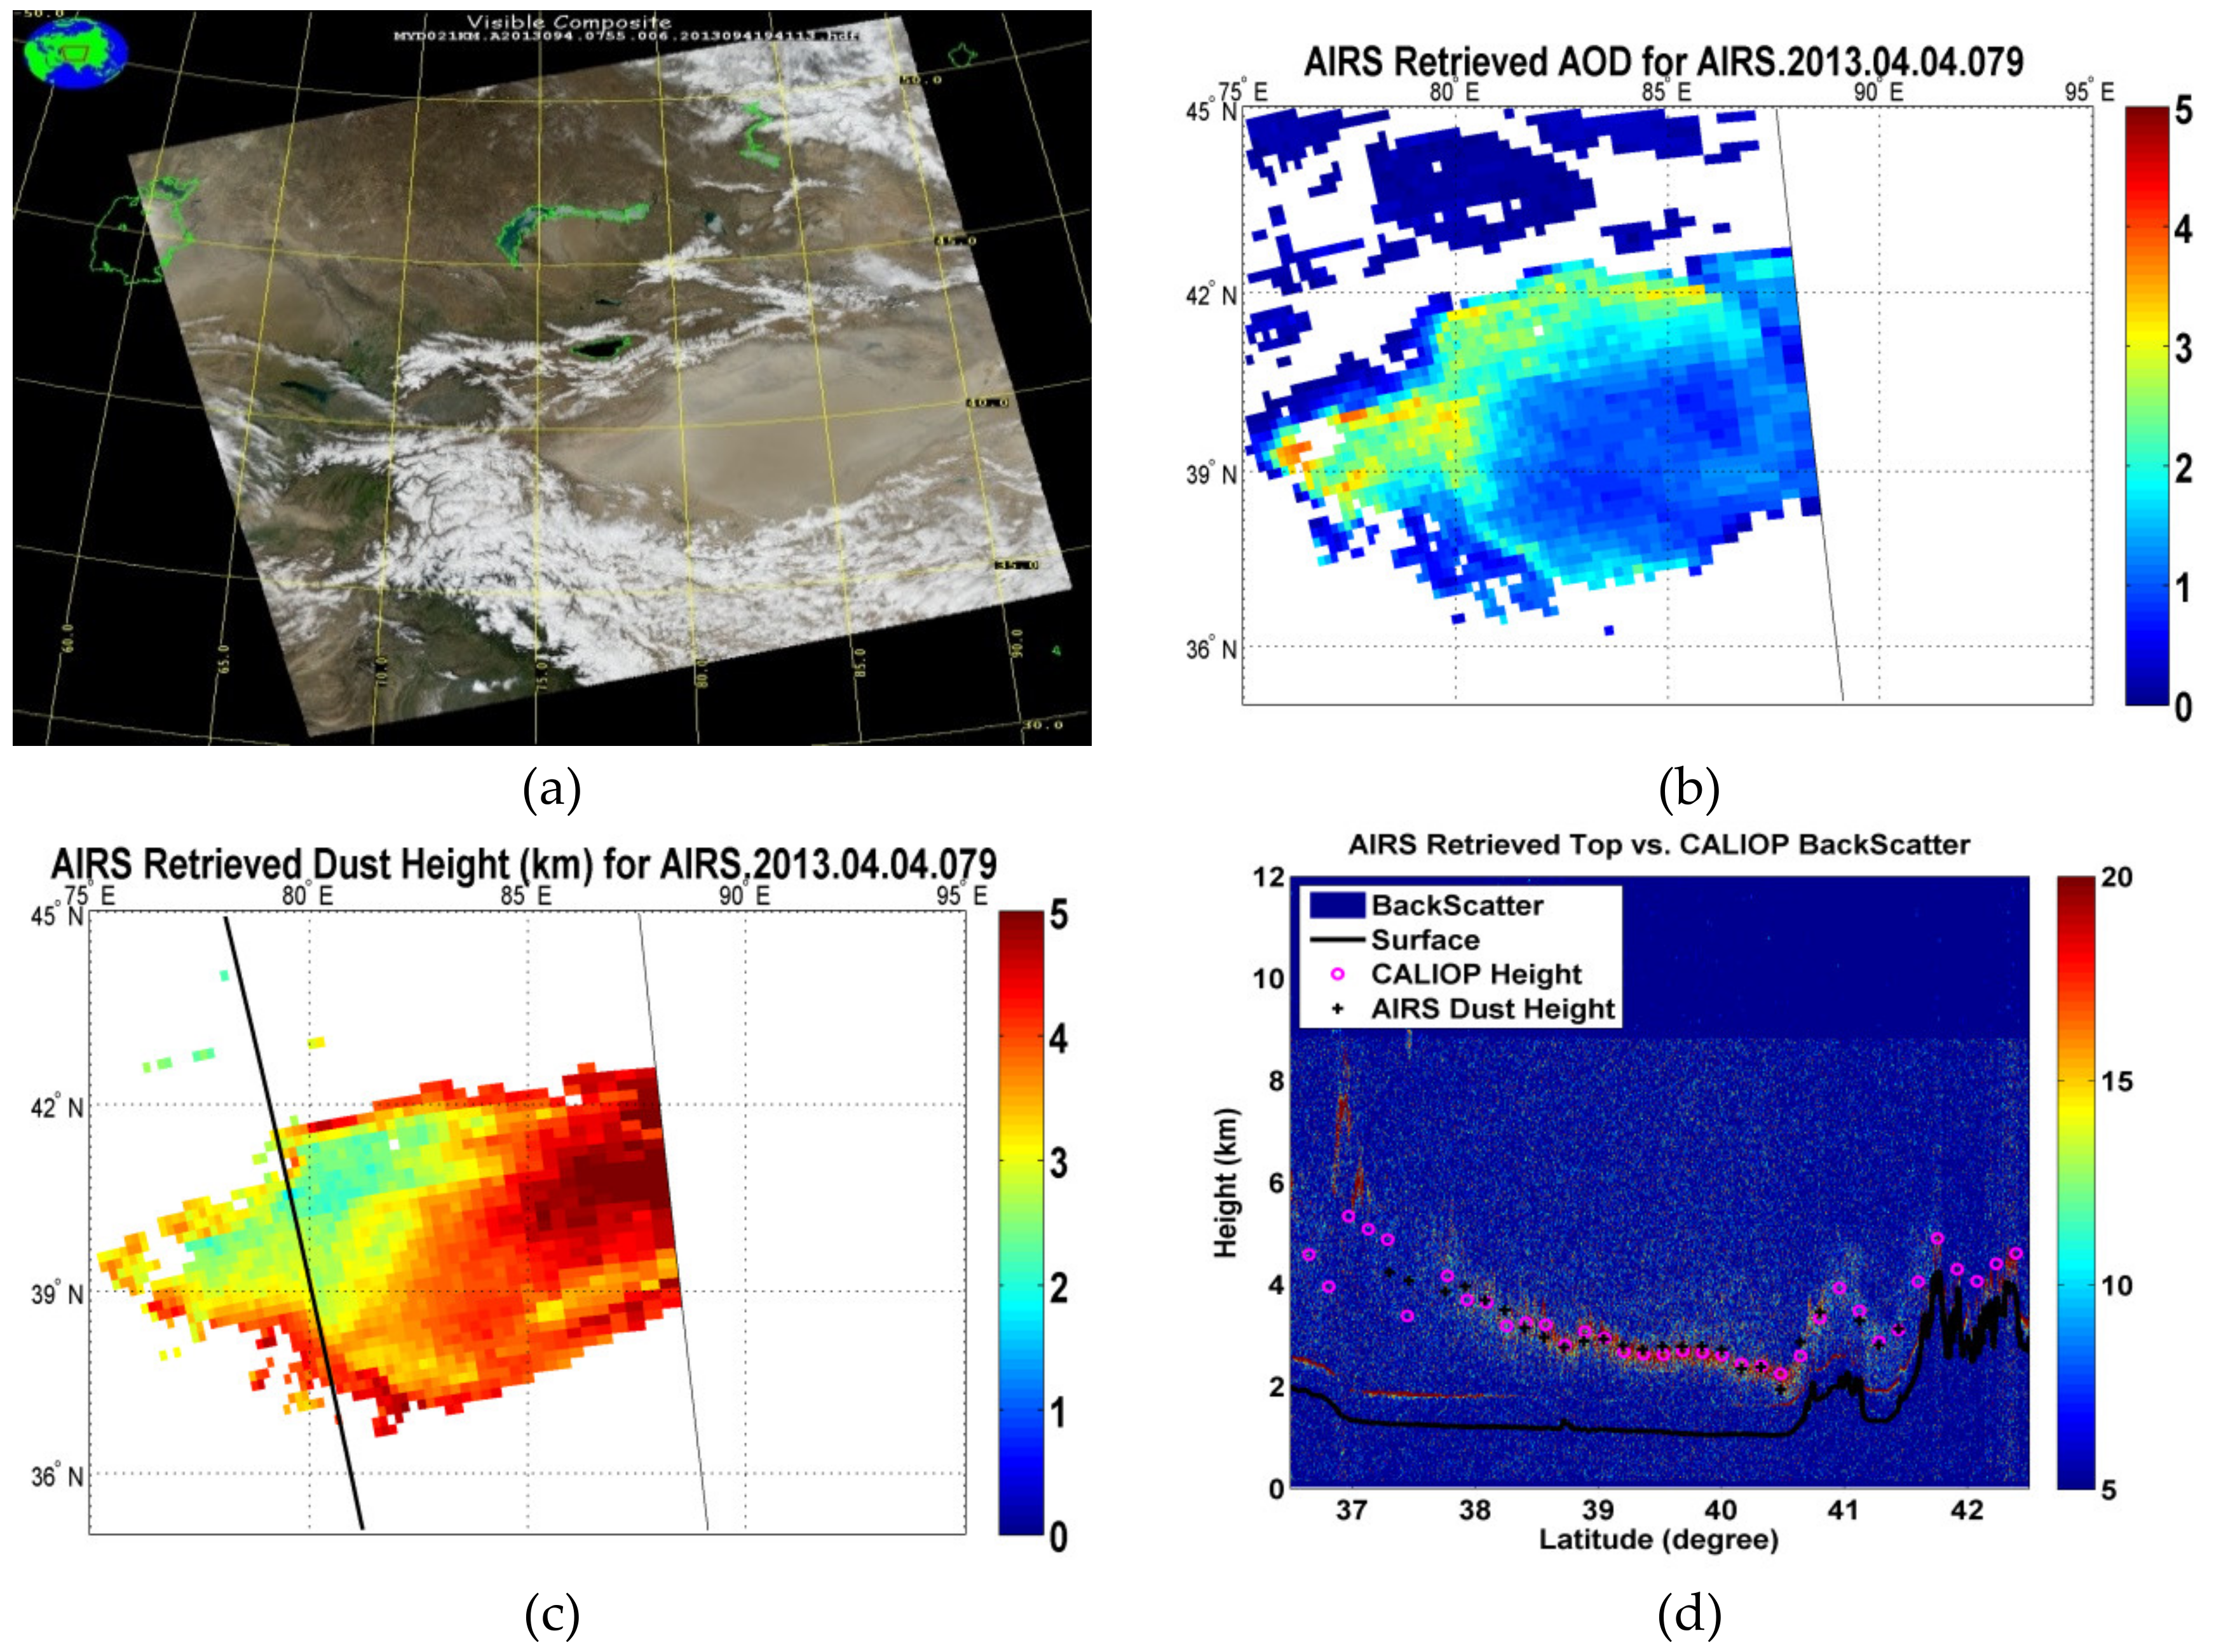
Figure 4a is a visible image acquired by MODIS at 15:55 (local time) on April 4, 2013. It shows that most of the Taklimakan Desert was covered by dust. Heavier dust was observed in the northwest, central, and northern areas. Near the surface, winds were from the northwest according to the dust report from the China Meteorological Administration (CMA).
Figure 4b shows the dust AOD retrievals from AIRS BT measurements. The retrieved dust distribution indicates agreement with the visible image. The dust area had a higher corresponding retrieved dust AOD than the surrounding area.
The extracted DTHs are displayed in
Figure 4c. The DTHs in the northwest area are about 2 km, while in the east, the DTH increases to 5 km. The total attenuated backscatter at 532 nm of the atmospheric vertical profile observed by CALIOP along its observation track is shown in
Figure 4d. The color bar shows the backscatter (km-1 sr-1) times 1000. Pink circles represent CALIOP dust heights and black crosses represent AIRS DTHs. The dust heights from CALIOP are determined by the method described in
Section 3.2. From 37°N to 40.5°N latitude, the dust heights are gradually reduced from 5 km to 2 km. While from 40.5°N to 41.5°N latitude, the CALIOP dust heights are first increased and then decreased due to topographic effects. These variations are fairly reflected in the AIRS DTH retrievals. Therefore, it can be concluded that there is good agreement between AIRS DTH retrievals and CALIOP dust height observations.
4.2. Case 2: November 11, 2013
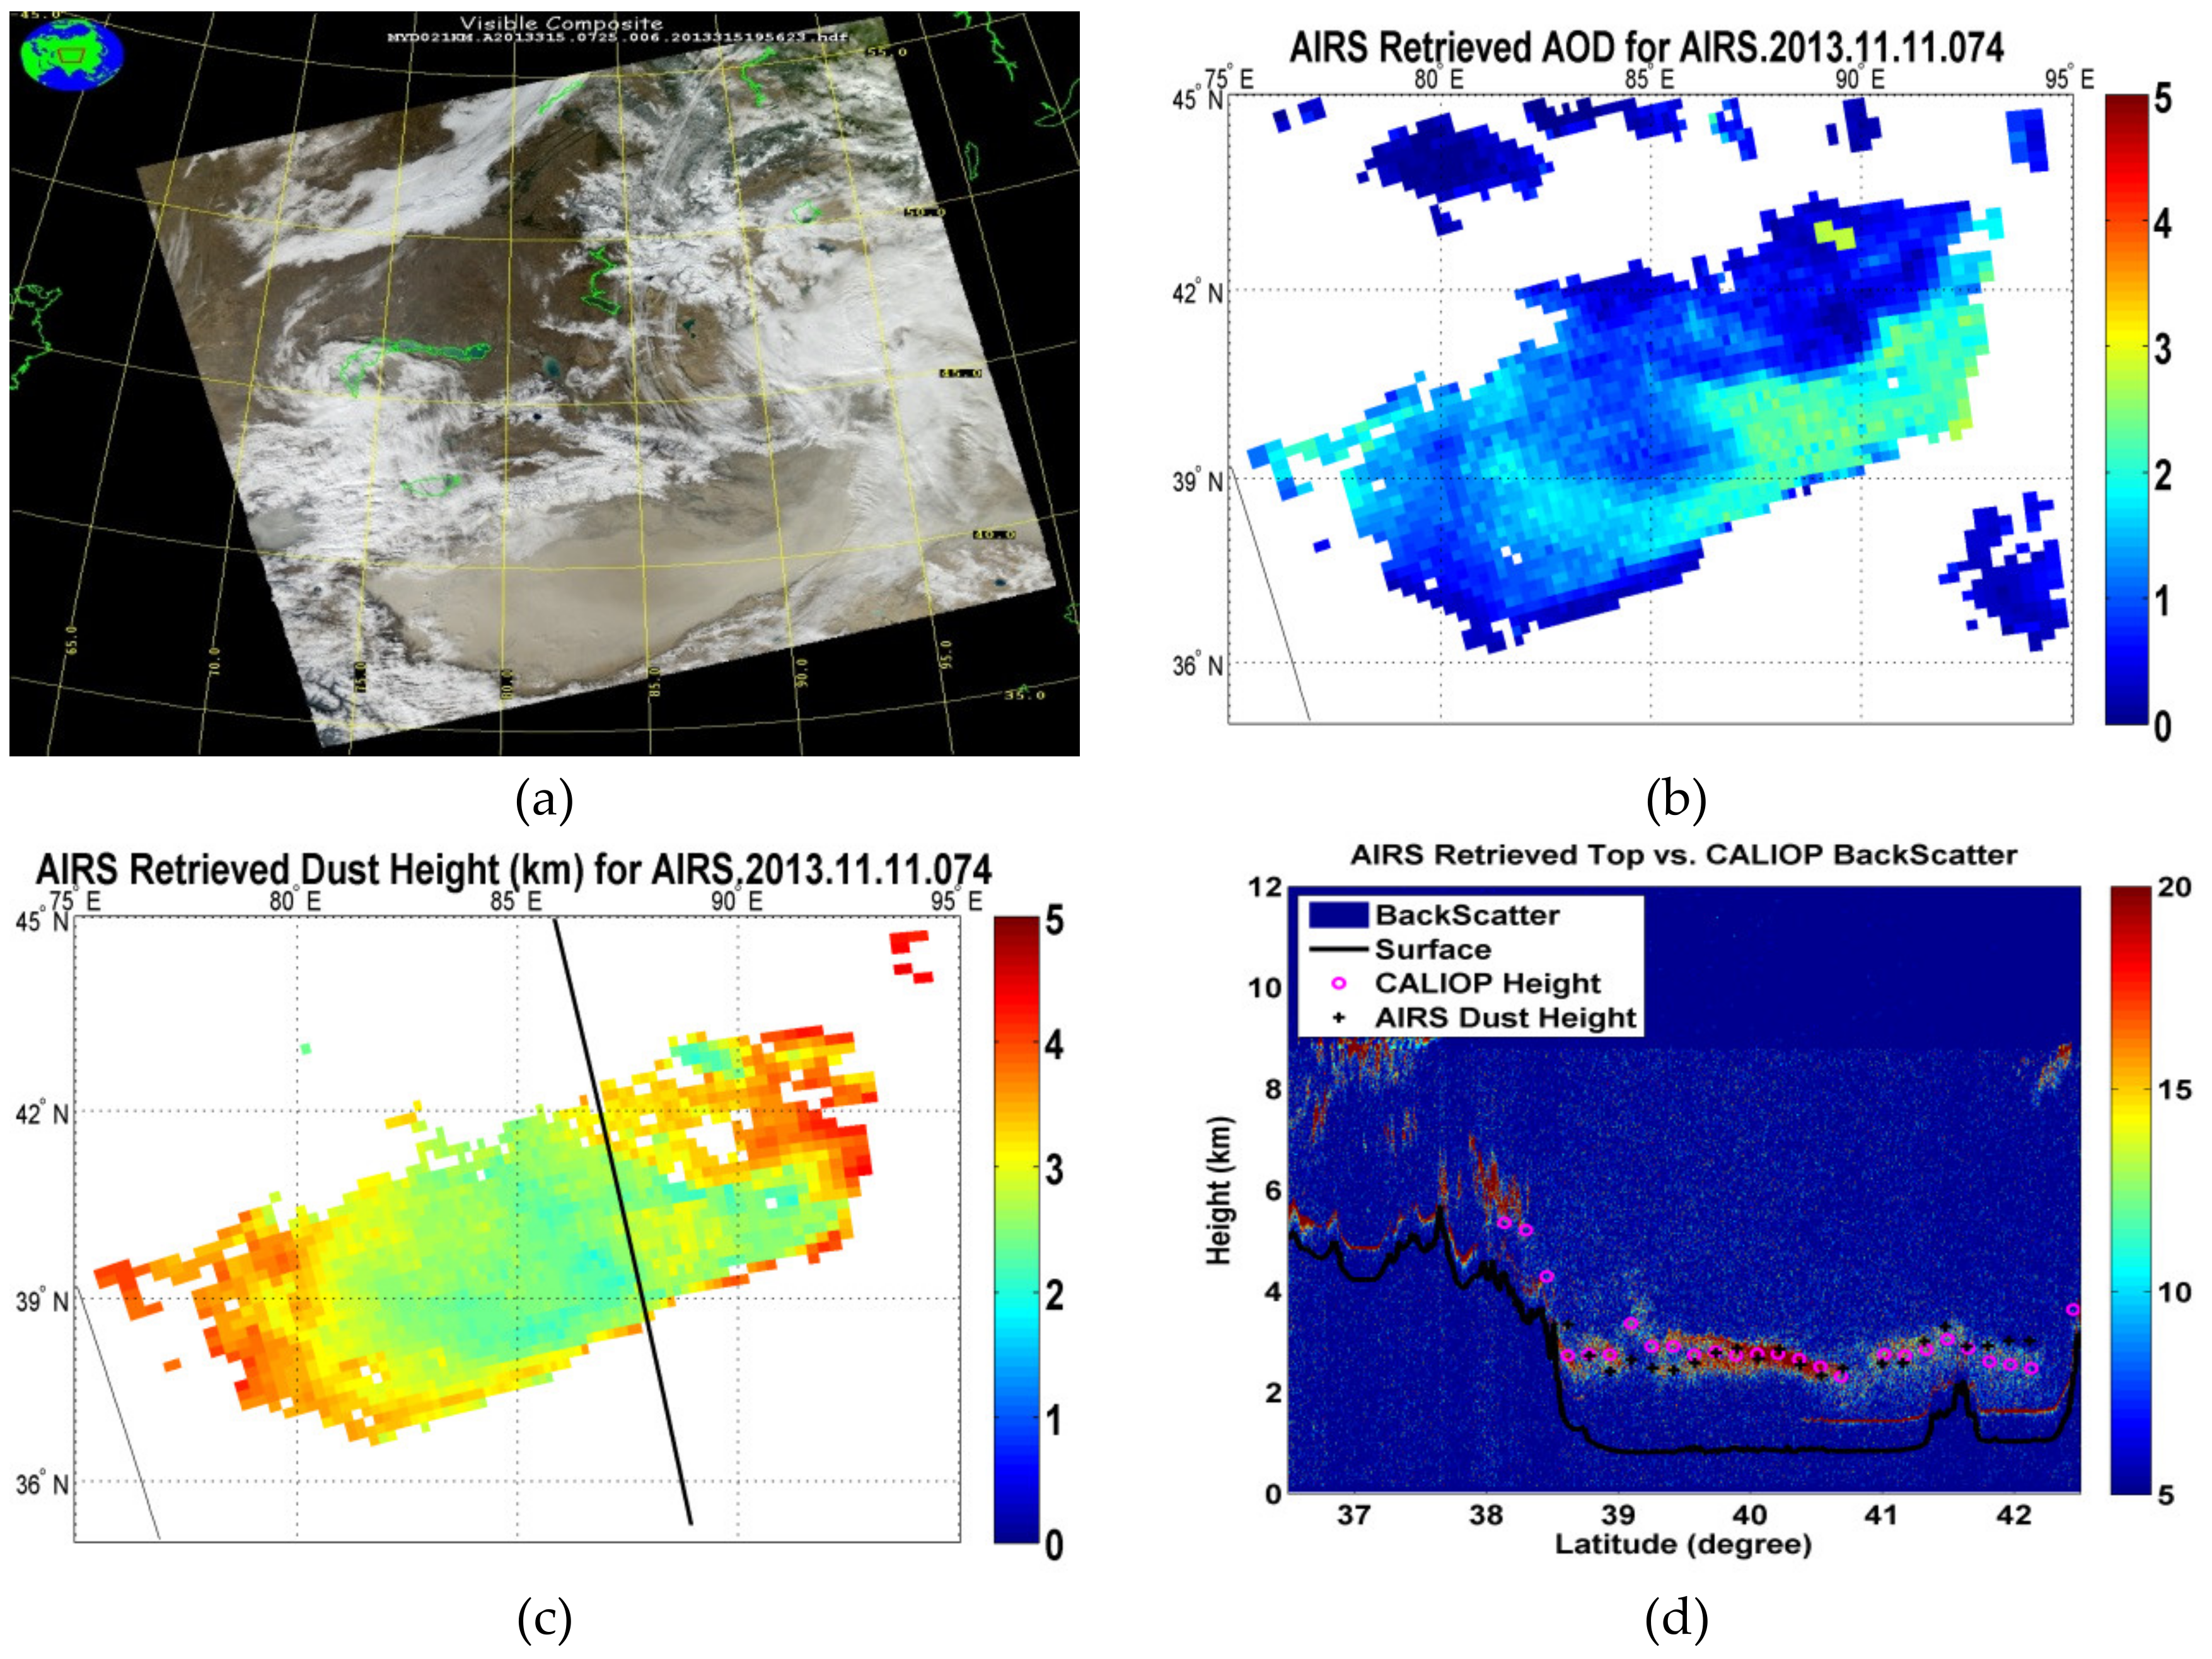
As shown in
Figure 5a, a strong sandstorm covering most of the Taklimakan Desert was observed on November 11, 2013. The strongest dust occurred at the eastern entrance to the desert while dust in other areas was relatively weak. The distribution of AIRS-derived dust AODs (
Figure 5b) agrees well with the satellite visible image, with the largest dust AODs up to 3; from the AIRS derived DTH image, it can be seen that the DTHs in the heavier dust areas are 2–3 km (
Figure 5c). From the comparison between CALIOP and AIRS (
Figure 5d), the dust heights extracted from CALIOP range from 2 to 3 km. At 40.8°N, the CALIOP dust heights are relatively low, while there is a high value at 41.5°N due to an orographic influence. The AIRS DTHs accurately capture the variations of dust heights from CALIOP.
4.3. Case 3: March 19, 2010
In the two cases above, the DTH retrieval results were derived and demonstrated for the daytime. While nighttime applications of the above statistical models still pose a challenge, it is worth examining the feasibility of applying daytime training data to nighttime cases. Wang et al. [
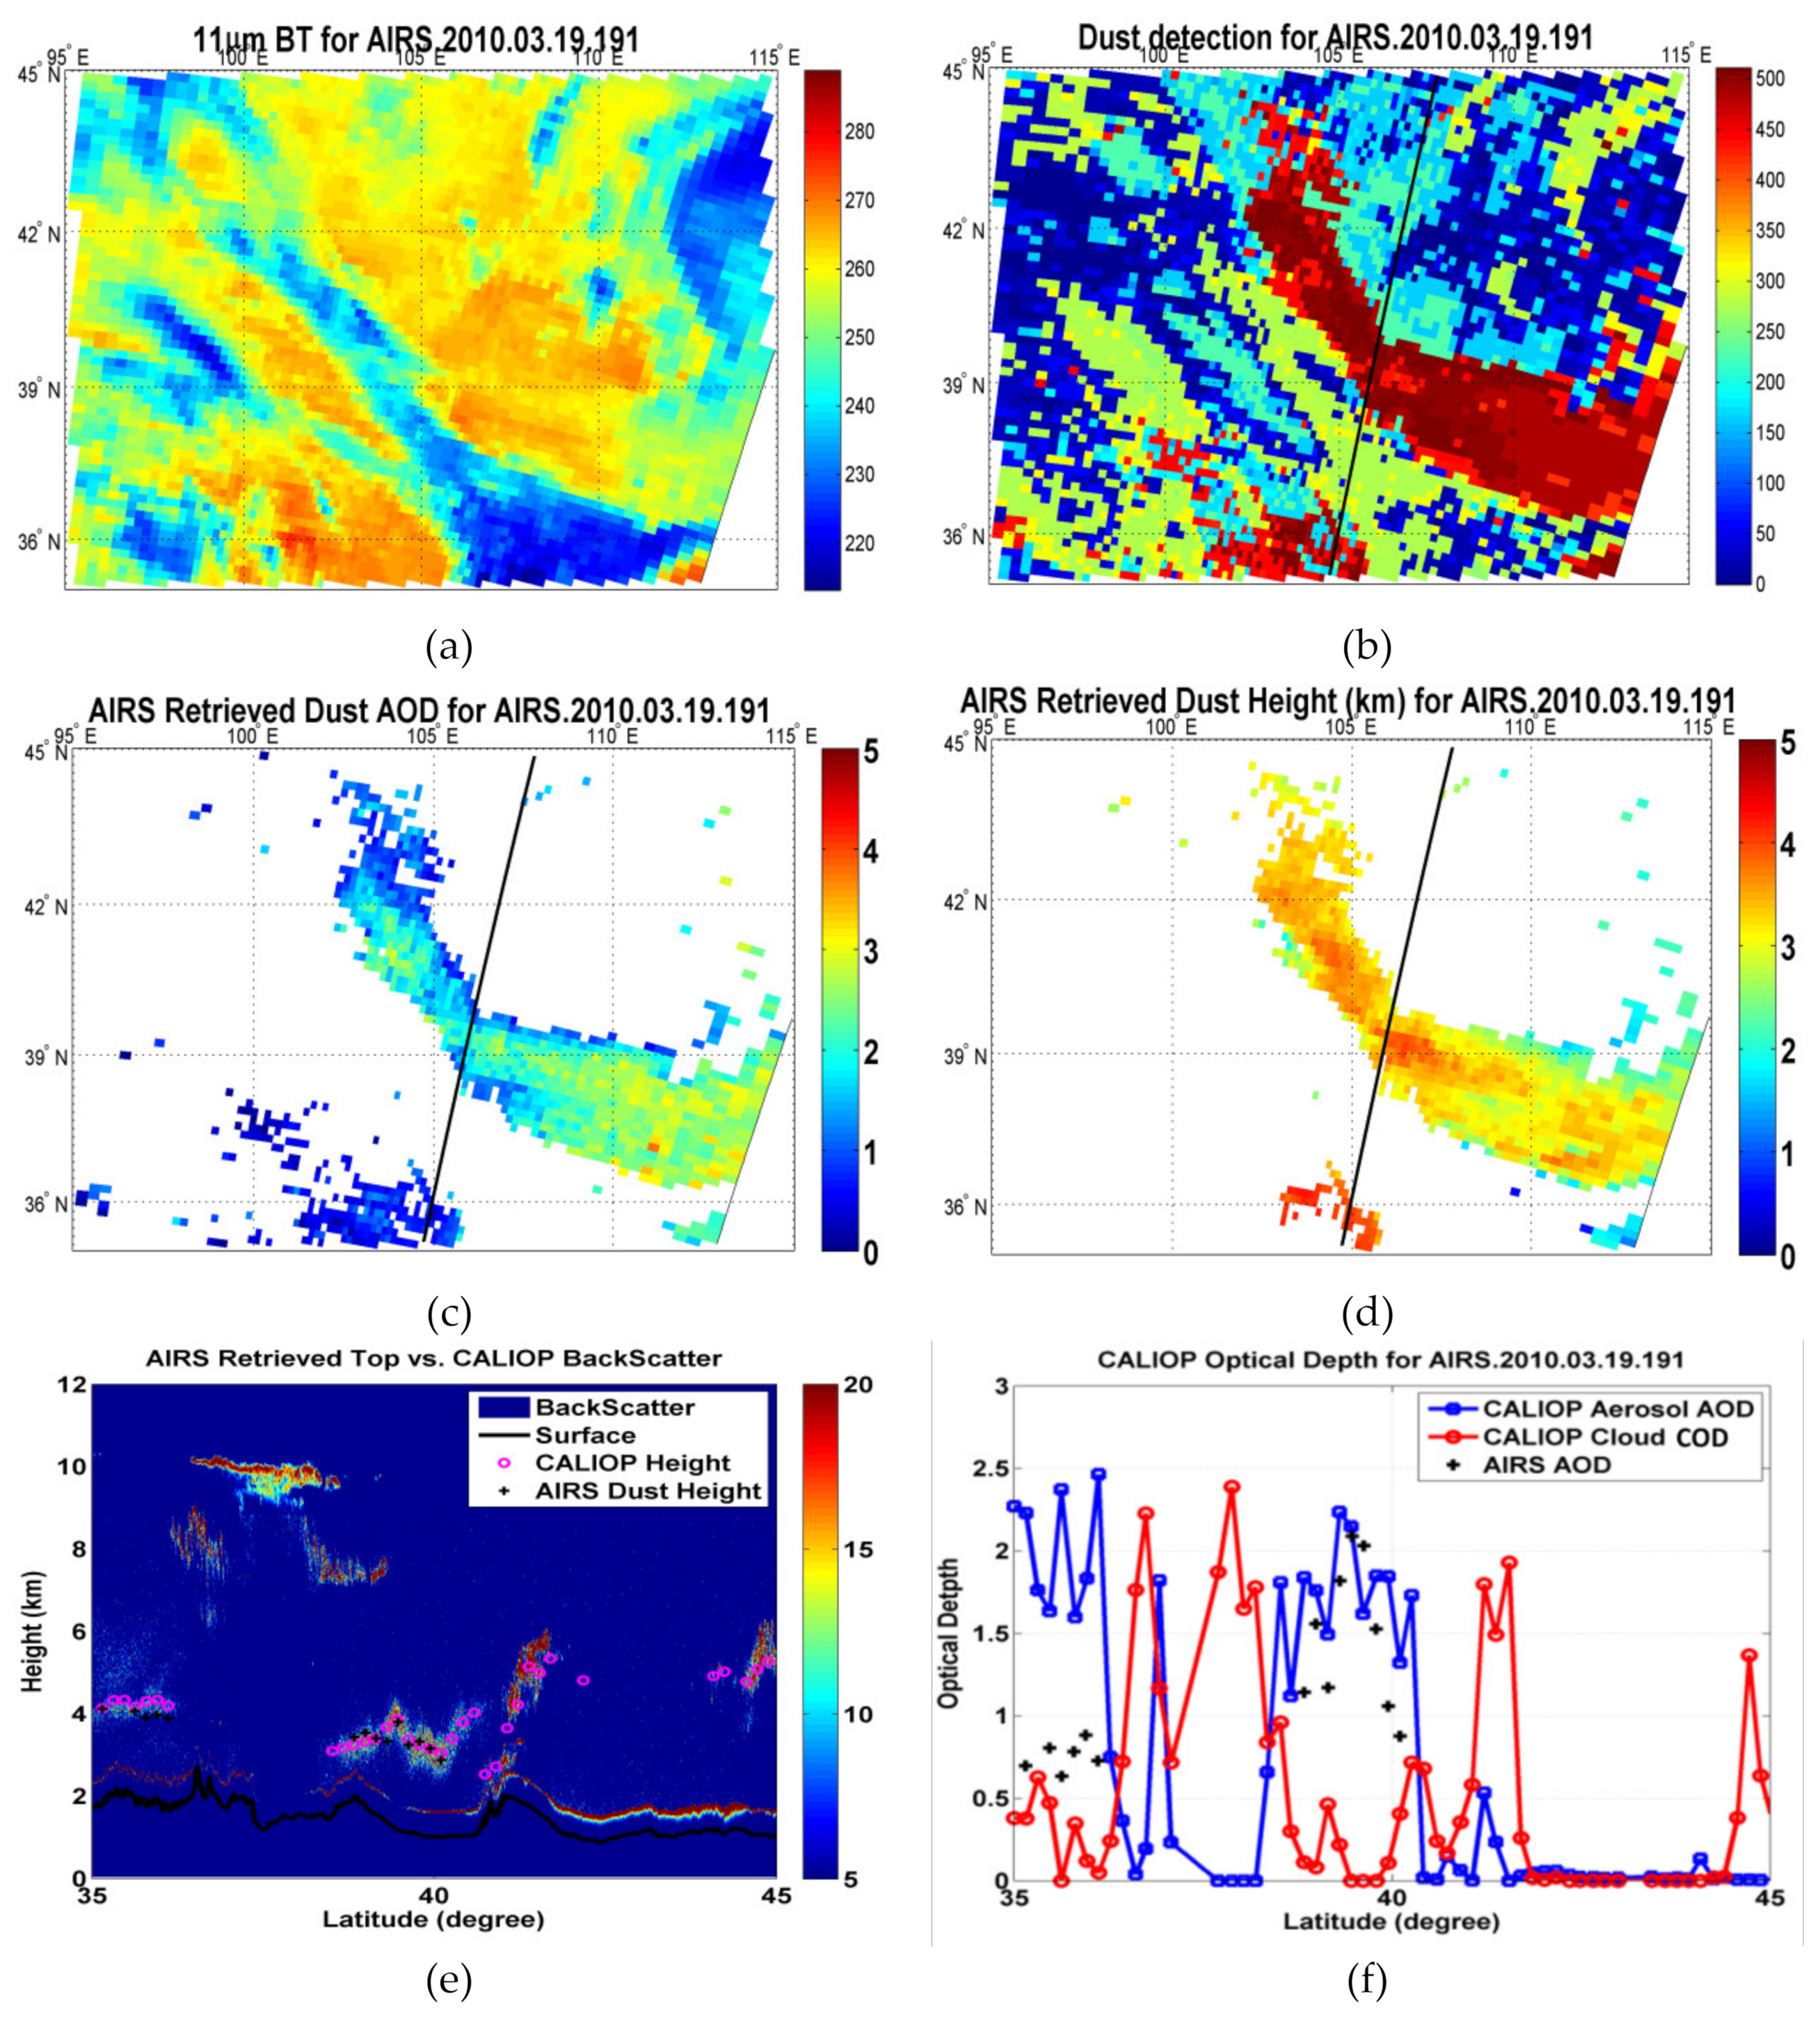
13] suggested that the frequency of dust storms occurring at nighttime is relatively low, as most occur during the daytime. Considering that the Aqua overpass times are at 1:30 and 13:30 (local time), it is difficult to acquire matched data at night. A case study in the Hexi area on March 19, 2010, as shown in
Figure 6, is presented here. The 11 um infrared BT image (
Figure 6a) indicates a low cloud temperature (lower than 240 K). In the northeast of this cloud, a large area of dust was detected spreading from the north-central to the southeastern part of the Badain Jaran Desert. The AIRS-derived dust AODs show that the dust over southeast of the desert is relatively thick (dust AOD is about 3), while over the central and northern portions of the desert, the dust AOD value is about 2. Looking at the CALIOP-derived dust AODs, over the area between 38.5°N and 40°N, the CALIOP AODs first increase and then decrease, which is similar to the variations in the AIRS dust AODs, and also with comparable AOD values. CALIOP dust heights and AIRS DTHs are in good agreement over this area with values around 4 km. Over the area between 38°N and 40°N latitude, the CALIOP dust heights increase first and then decrease, which is similar to the AIRS DTHs, ranging between 3 and 4 km.
From this case study, the AIRS-derived dust AODs and DTHs are in good agreement with CALIOP data. It is a very encouraging result since the training data do not cover this area. This also suggests that the local regression model could be used in an area with similar weather conditions and similar dust microphysical parameters. However, there are still additional uncertainties in retrieving dust AOD and DTH during nighttime than during daytime: when applying the statistical model based on the training data mostly from daytime too fewer nighttime cases, the results would be more influenced by atmospheric and land surface conditions.
5. Statistical Characteristics of DTHs from AIRS
The climatology of DTHs from AIRS BT measurements in the Taklimakan Desert between 2007 and 2013 are derived using the retrieval algorithm described in the previous section.
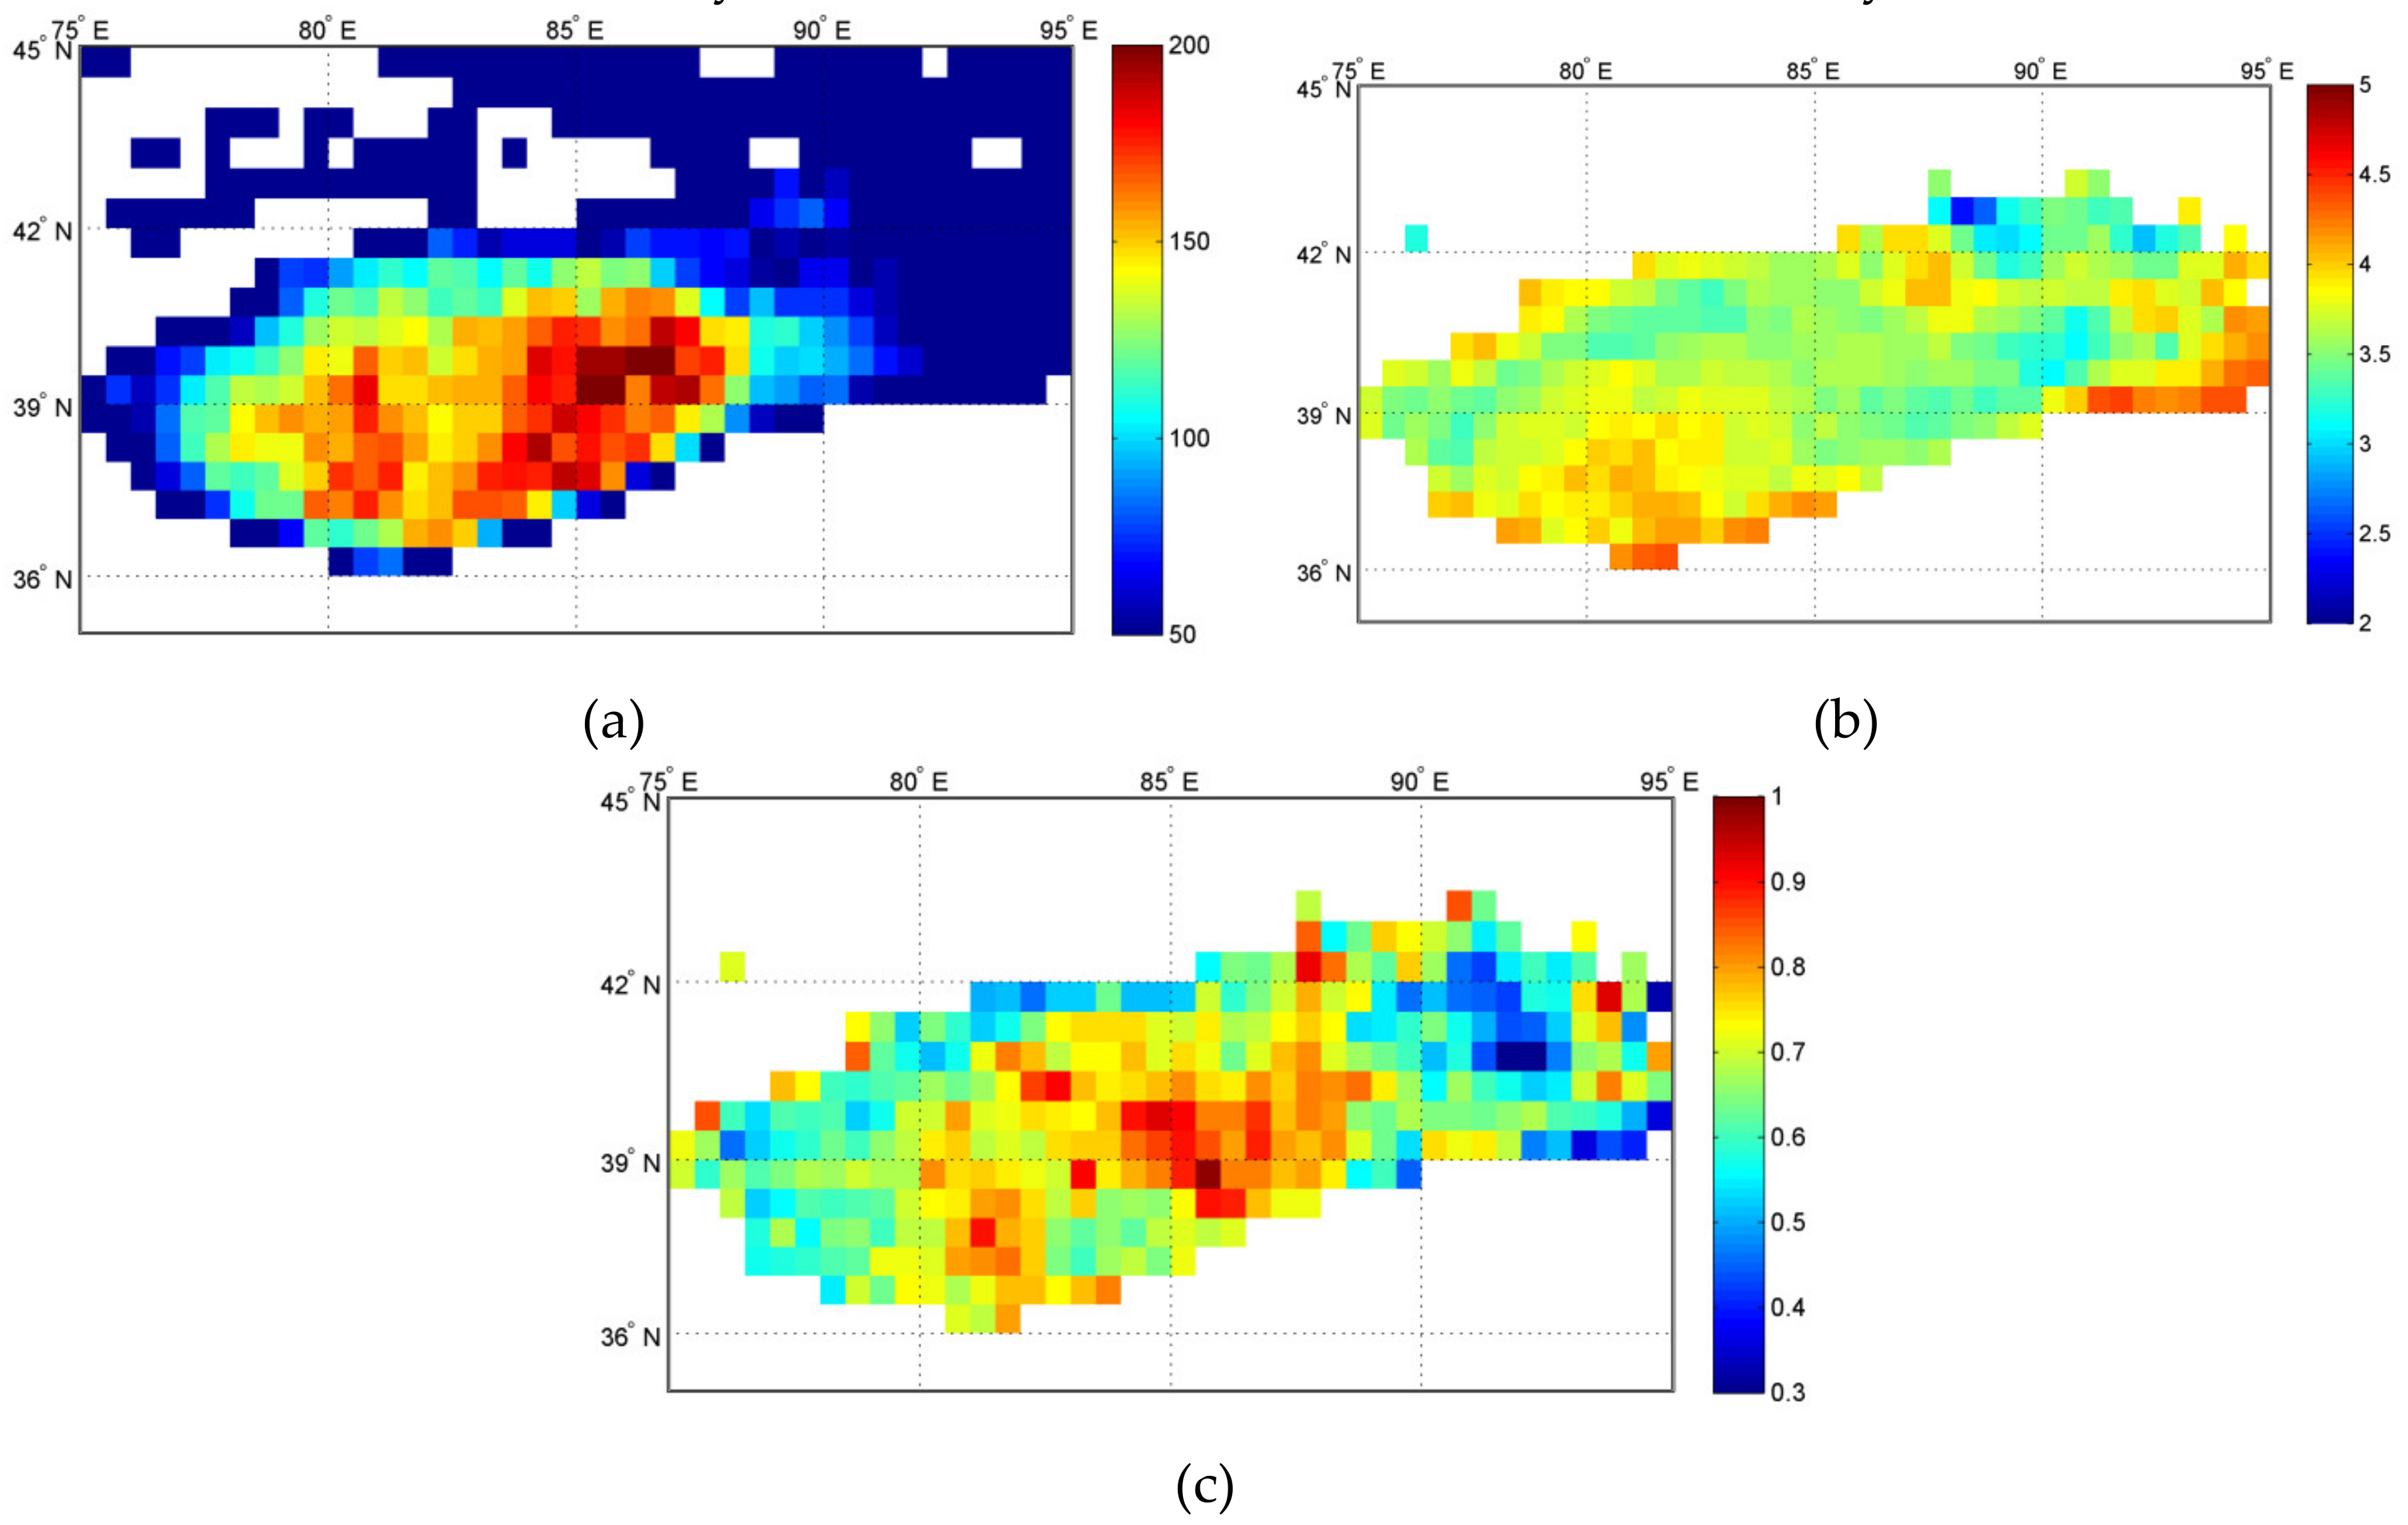
Figure 7a shows the number of AIRS pixels observed in each grid with a resolution of 0.5 degree × 0.5 degree. The observed frequency of dust in the core of the desert is between 100 and 200. The highest frequency of observed dust appears in the southeastern part of the desert, and the second-highest value is in the heart of the desert. In order to ensure that there are enough samples in each grid to calculate the average value, the grids with a frequency less than 50 are excluded here. It should be noted that the results here only show the AIRS DTH retrievals under clear sky conditions.
As shown in
Figure 7b, the maximum of the average DTH is 4.43 km at the eastern exit and edge of the desert, which is mainly related to the direction of dust and the terrain of the basin. The minimum of the DTH is 2.40 km. The average DTH is 3.68 km.
The standard deviation (STD) of DHTs at each grid is also calculated here, ranging from 0.3 km to 1 km, as presented in
Figure 7c. The high values of STD are mainly concentrated in the central to southeastern part of the desert with a maximum value of 0.98 km. The possible factors are: when the area is sandy with low transport, the DTH is relatively low; conversely, when transport is greater with dust blown from the north, the height may be relatively high. The mean of the STD is 0.68 km, and the minimum STD appears at the exit area of the eastern desert at 0.26 km.
The advantage of CALIOP is its accurate dust height information, but the limitation is that it only measures one line (nadir) and does not provide a wide range of information on the distribution of dust. AIRS has the advantage of having a wide range of observational capabilities. In this study, the retrieval algorithm is established using the collocated AIRS BT measurements and CALIOP dust heights in limited regions and is applied to AIRS BT measurements for DTH retrievals with broad coverage. The results can be used for analysis of climatic characteristics, as the initial value for 1Dvar-based physical retrieval of dust parameters, for the numerical simulation of dust characteristics in this area, etc. The results indicate that continuous changes in the dust properties can be obtained when hyperspectral infrared instruments are onboard the geostationary weather satellites.
6. Discussions
Due to the higher emission and larger spatial variation of land compared to ocean, it is challenging to retrieve AOD values over land. To overcome these difficulties, one method involves 1Dvar-based physically retrieving the dust properties by using auxiliary data including surface emissivity and temperature, as in the previous study performed by Yao et al. [
25,
27]. They showed that reasonable results could be obtained by using the physical retrieval method if the surface and atmospheric information is available. Another method involves developing a local regression model by using the collocated data to reduce the impact of the variation of atmospheric and surface conditions, as well as dust composition.
Collecting eight years matched dust atmosphere data of AIRS, MODIS, and CALIOP, which are all part of A-train, the AIRS dust AOD and DTH statistic model have been developed and validated over the dust source, Taklimakan Desert. For the AOD retrieval, the validation shows the same correlation value of 0.88 with MODIS DB AOD and in-situ observation. Comparing with MODIS, the MODIS AOD presents accumulated data at a value of 4.2 and AIRS dust AOD shows it at about 0.4. This is mainly caused by the response difference at visible and infrared waveband. It should be noted that ideally the training should be done separately for daytime and nighttime since the brightness temperature (BT) differences between daytime and nighttime are large due to the surface skin temperature difference over desert [
45]. Using multiple IR window channels might reduce the effects of skin temperature differences, and nighttime training is still needed when there are enough samples collected.
Based on the DTH validation results, AIRS DTHs agree well with CALIOP dust height observations. The statistical retrieval models developed in this study are independent of the dust type and atmospheric radiative transfer model (RTM), which overcomes the limitations of the physical retrieval method developed by Yao et al. [
25]. For example, the accuracy of AIRS-based dust AOD and DTH using the 1Dvar-based physical retrieval method is heavily influenced by the uncertainties of the radiative transfer calculation and auxiliary data, such as atmospheric profiles and surface conditions. However, the disadvantage of the statistical method is that it strongly depends on the accuracy of the dust parameters from MODIS and CALIOP in the matchup database.
Since very few nighttime dust observations are available, only one case study for nighttime DTH and AOD retrieval using AIRS is presented in this study. Meanwhile, it is worth examining the differences between day and night for dust parameter retrievals. Considering that in northwestern China, about 30% of dust events occurred between 18:01 and 21:00 (local time) [
13], other satellite data collected during the first half of the night, such as from the Infrared Atmospheric Sounding Interferometer (IASI), are needed to help analyze the properties of dust aerosols. However, currently, an IASI-based statistical retrieval model is still under development and spatial-temporal collocated observational data from an active satellite are unavailable. Another option is to use 1Dvar-based physical retrieval model to extract dust parameters IASI BT measurements.
7. Conclusions
In this paper, an AIRS-based dust AOD retrieval model has been developed using the collocated AIRS BT measurements and MODIS AOD product. Similarly, an AIRS-based DTH retrieval model is established using the collocated AIRS BT measurements and CALIOP data with an option of including MODIS DB AOD product as input for daytime cases. Through validation with independent reference data, it is demonstrated that AODs derived from AIRS are in good agreement with in-situ measurements, suggesting a potential application of the statistic retrieval model for nighttime dust AOD retrieval. With MODIS DB AOD product, AIRS DTH model shows an improved result compared to the cases of only AIRS BTs used. The climate distribution of dust-top height is extracted based on the improved model during 2007–2013. The frequency of dust storm and mean DTH over Taklimakan Desert have been presented at a resolution of 0.5°*0.5°. The information could give support on dust atmosphere quantitative application as a reference.
The methodologies and technical approaches can be applied to the processing of global AIRS data for global dust height products over land. It can also be used to process new data such as CrIS/VIIRS from Suomi-NPP and the JPSS series, HIRAS/MERSI-II from FY-3D and its follow-on, and GIIRS/AGRI from the FengYun-4 series [
28]. AIRS, together with IASI and CrIS, are able to create global dust parameters from 2002 to the present. Making full use of multi-platform satellite data will significantly improve the temporal resolution of dust parameters, which is very useful for climate studies.


