The July/August 2019 Lava Flows at the Sciara del Fuoco, Stromboli–Analysis from Multi-Sensor Infrared Satellite Imagery

 , , ,
, , ,  ,
,  ,
,
Abstract
1. Introduction
2. Infrared Satellite-Based Volcano Monitoring
3. Materials and Methods
3.1. Data
- (a)
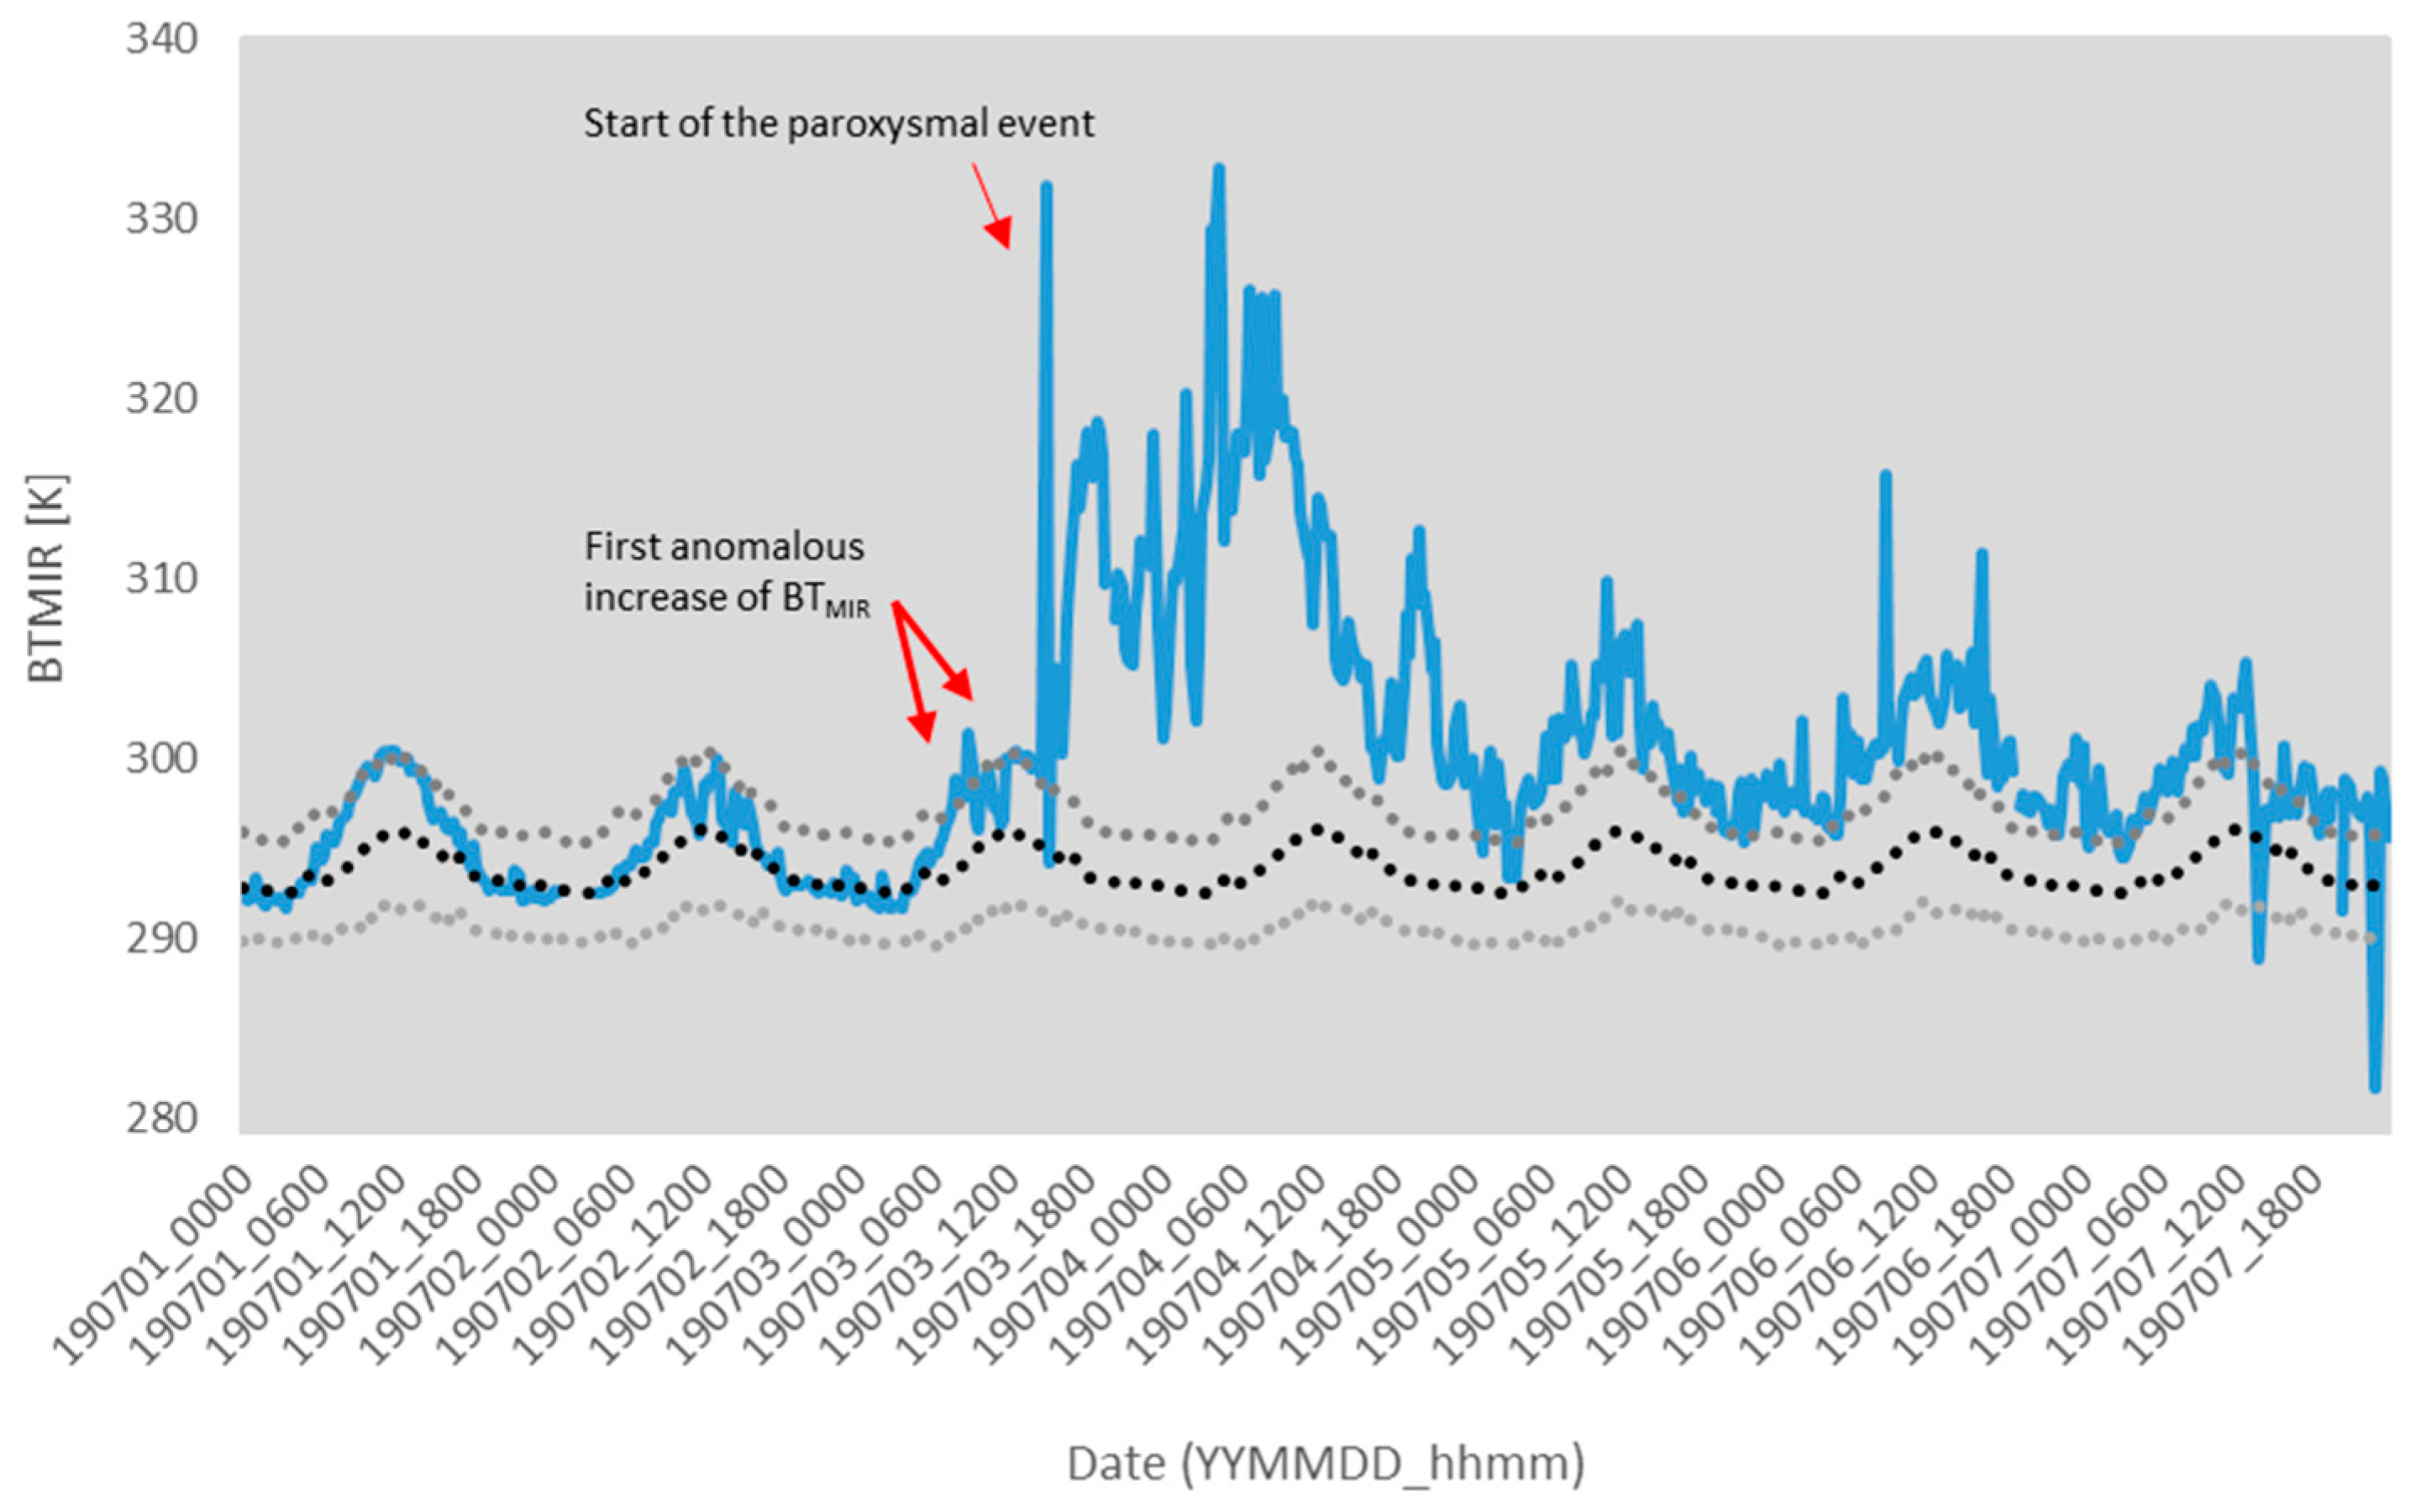
- SEVIRI, aboard Meteosat Second Generation (MSG) satellites, operates in 12 spectral channels, including the mid-infrared (MIR) band centered at wavelength λ = 3.9 µm, providing data with a spatial resolution of about 3 km at the nadir view. The very high frequency of observation (15 min) makes this instrument suited to identify and characterize short-lived eruptive events and to monitor thermal volcanic activity in real time (e.g., [41]). In this work, we analyzed MSG-SEVIRI data directly acquired and processed at the School of Engineering (SI) of University of Basilicata (Italy).
- (b)
- AVHRR, flying aboard National Oceanic and Atmospheric Administration (NOAA) and Meteorological Operational Satellite (METOP) polar satellites, provides data in five spectral channels, with a spatial resolution of 1 km at the nadir, ranging from visible (VIS) to thermal-infrared (TIR) bands. Channel 3 (λ = 3.55–3.93 µm), which is centered in the MIR region, is the one most suited to identify volcanic thermal anomalies, such as lava flows (e.g., [10]). This channel was used often in combination with the channel 4 (λ = 10.3–11.3 µm) for detecting active magmatic surfaces (e.g., [42,43,44]). We used here the NOAA/Metop-AVHRR data directly acquired and processed at the Institute of Methodologies for Environmental Analysis (IMAA) of National Research Council (Italy).
- (c)
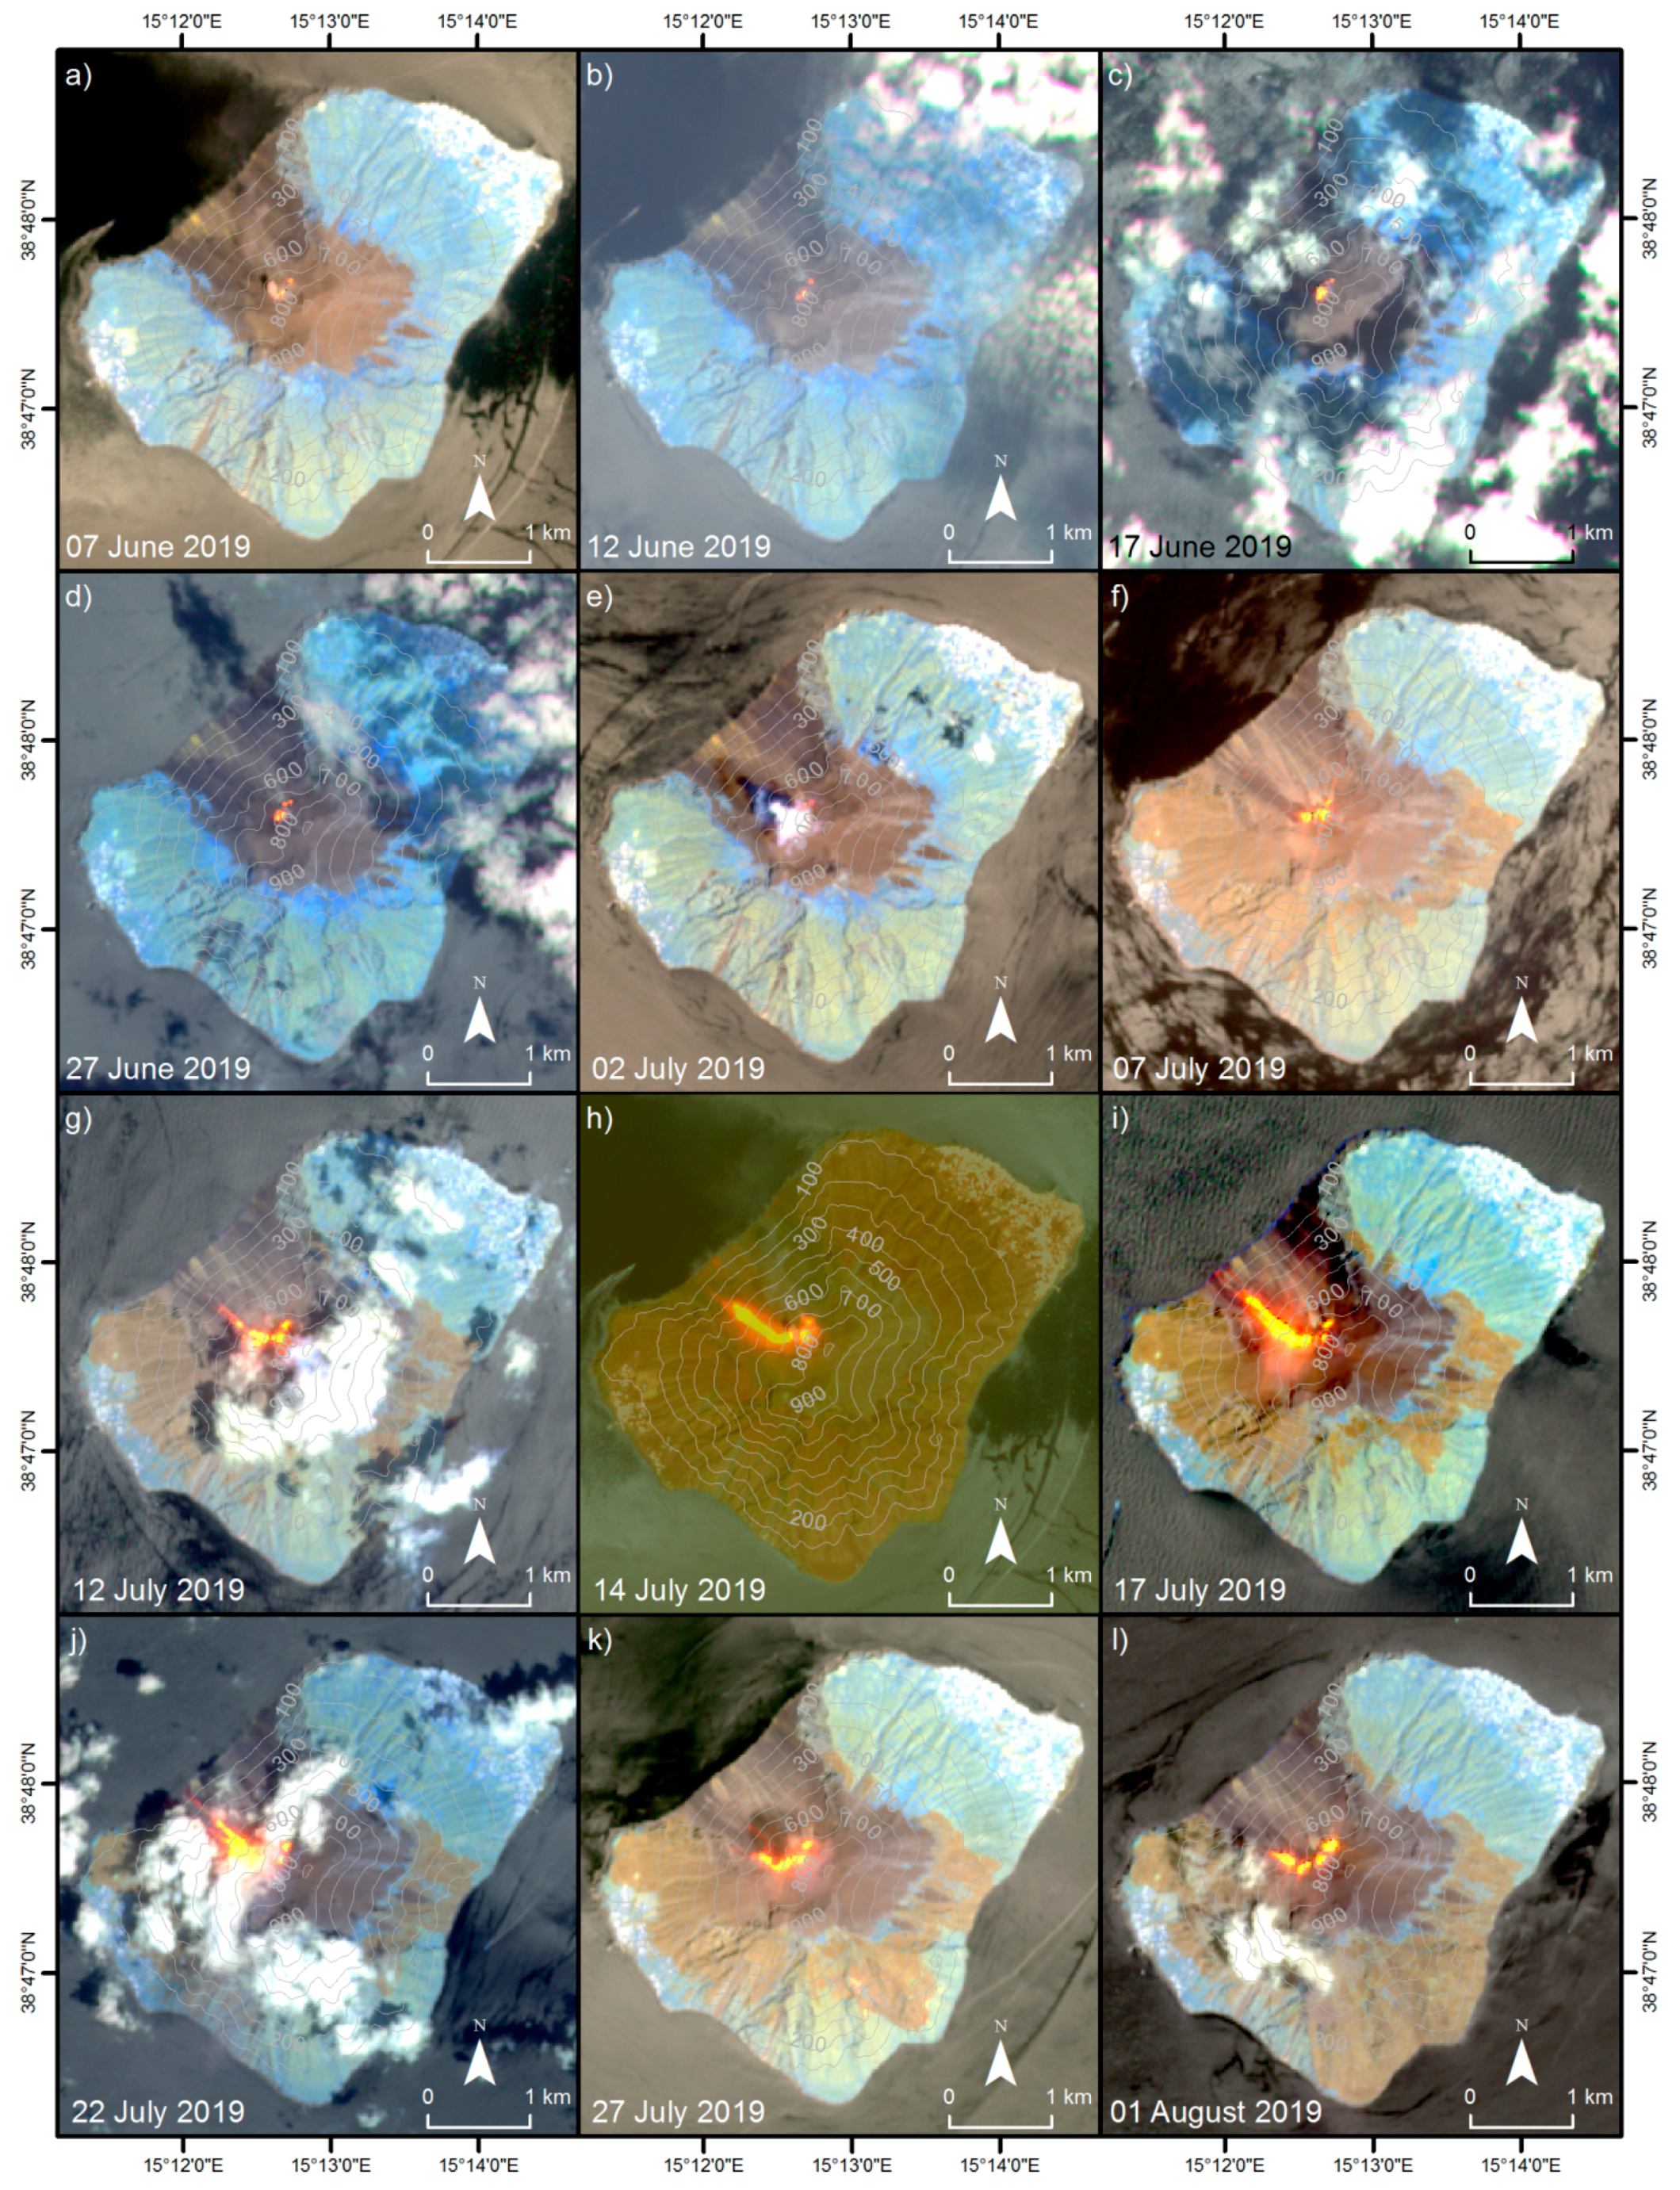
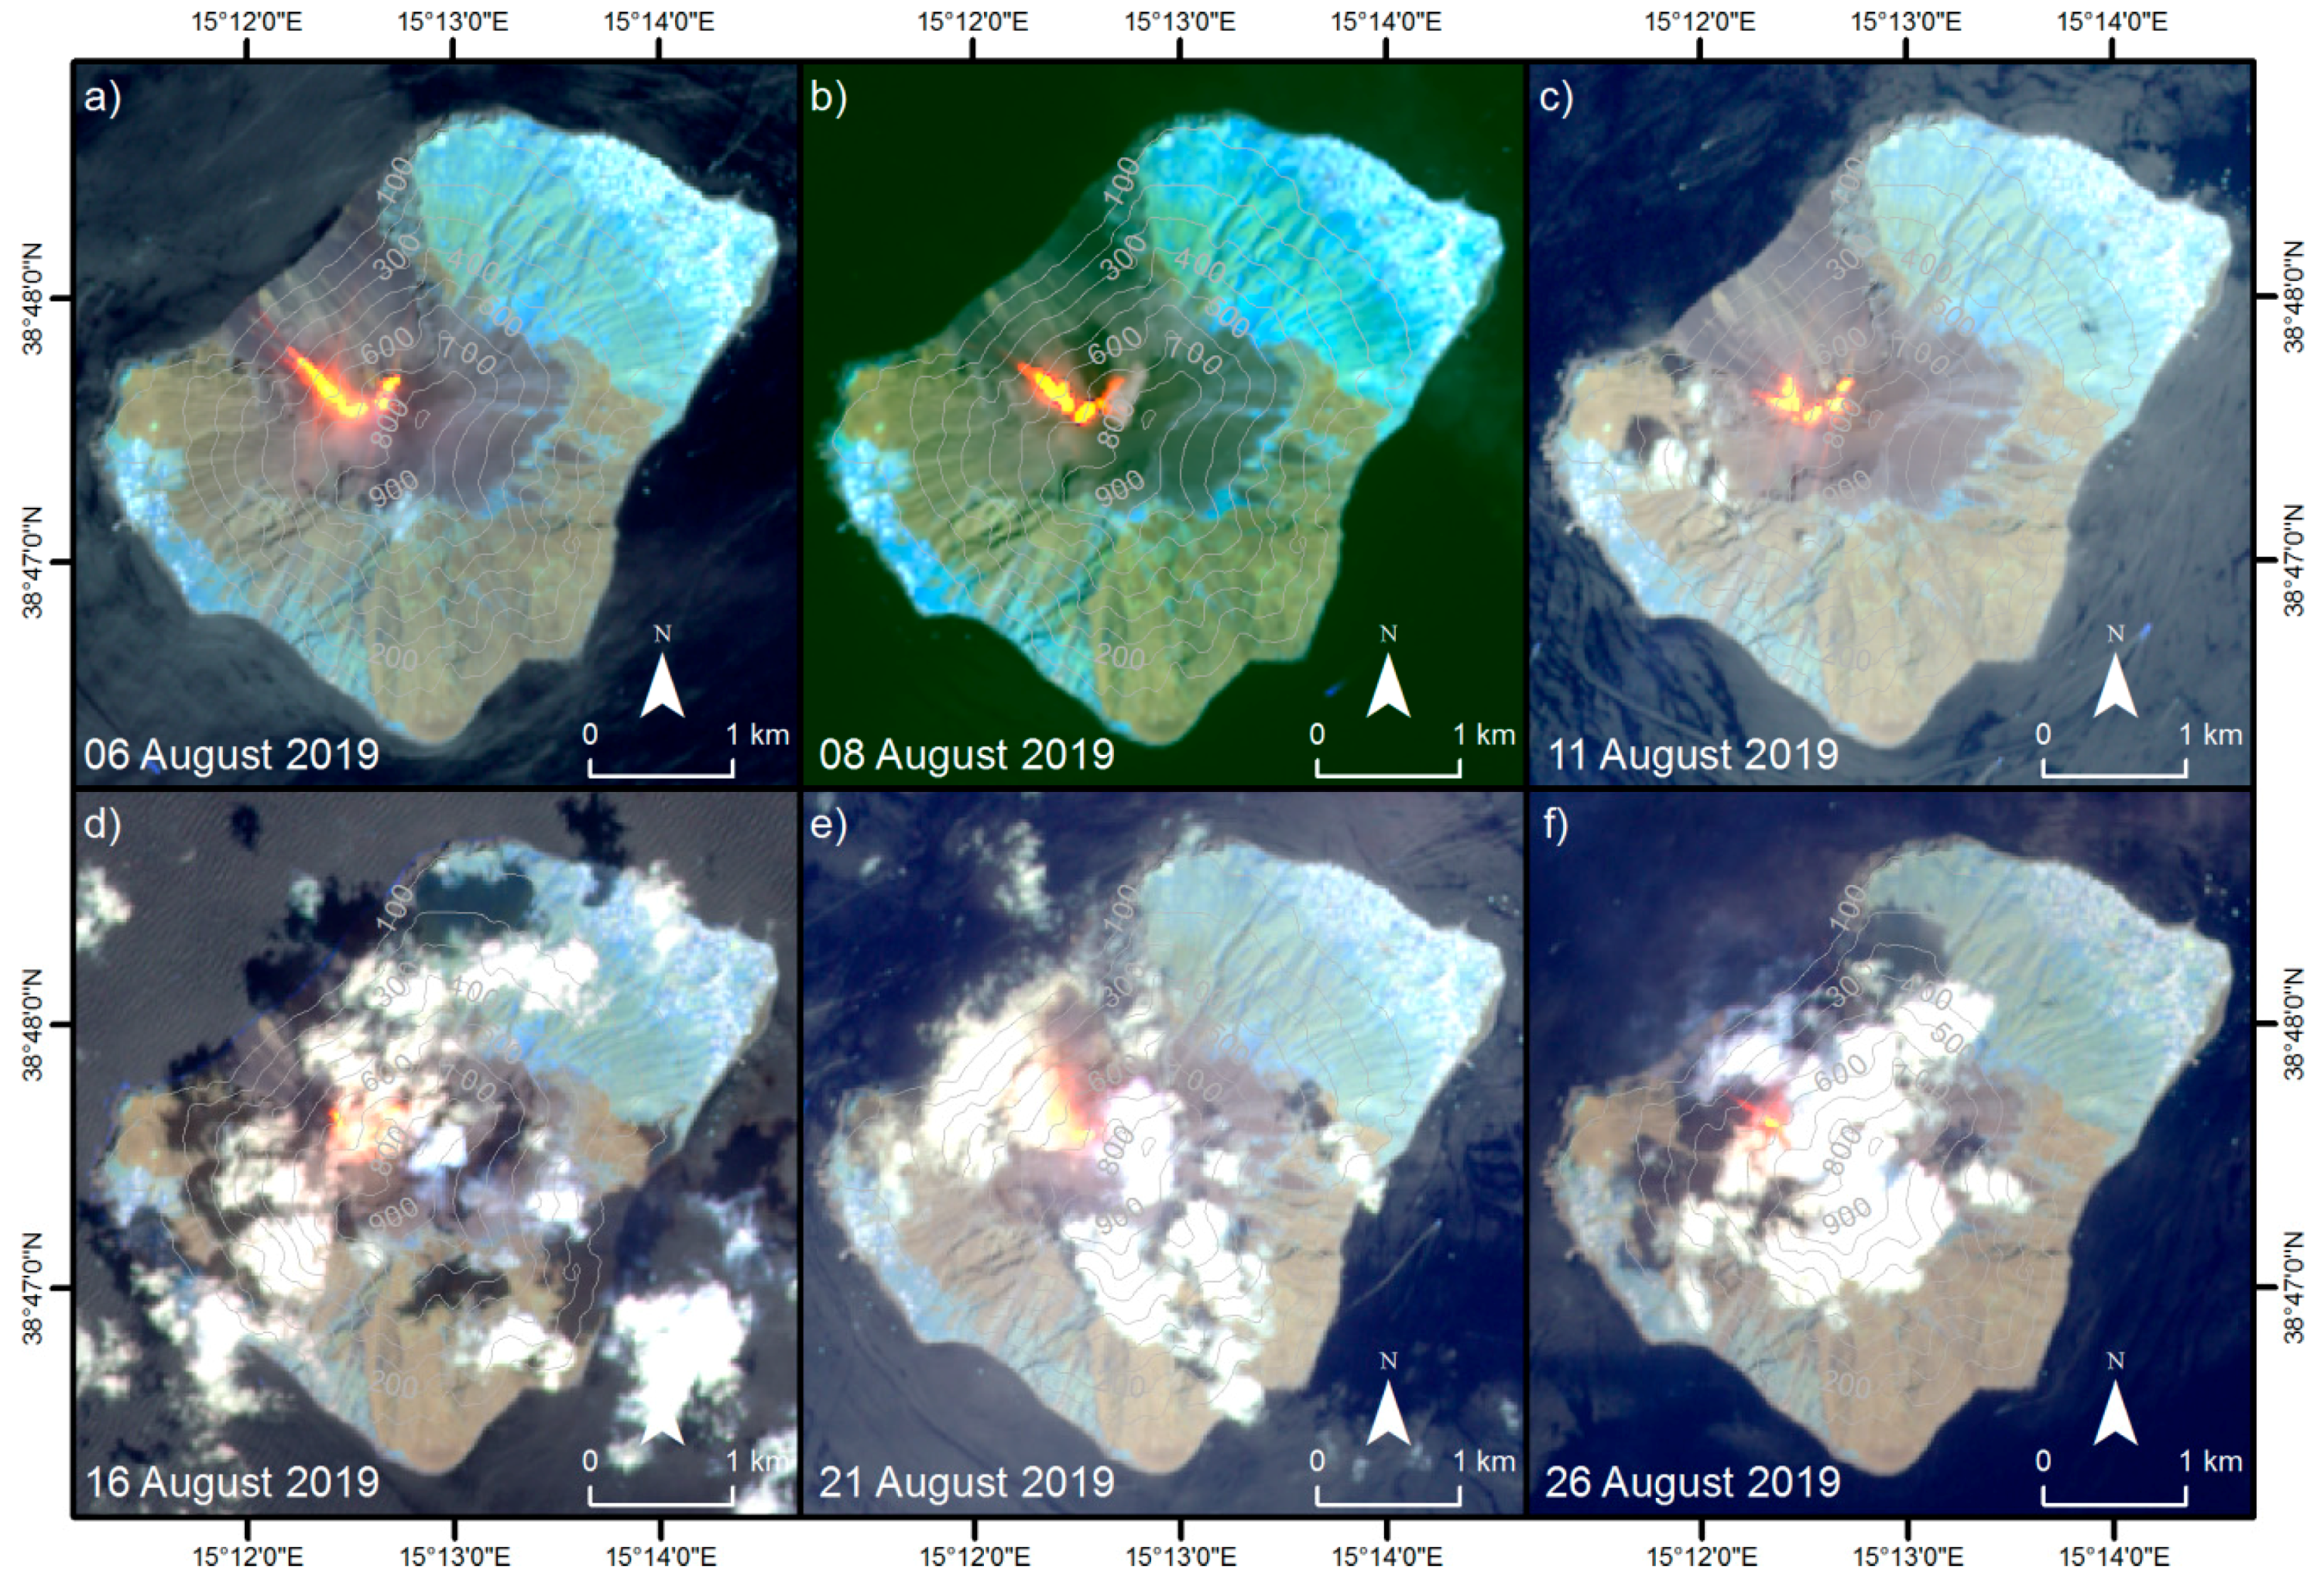
- MSI and OLI, providing HR data even in the short wave infrared (SWIR) bands at around λ = 1.61 and λ = 2.19 µm, have been efficiently used to study thermal volcanic activity (e.g., [45]) enabling the identification of active vents and the mapping of thermal anomalies (e.g., [46,47]). In this study, we used a series of 16 atmospherically corrected L2A Sentinel-2 MSI datasets [48] for the time-period of 7 June to 26 August 2019 and a single daytime and a nighttime Landsat-8 OLI acquisition, free of clouds over the area of interest (AOI).
- (d)
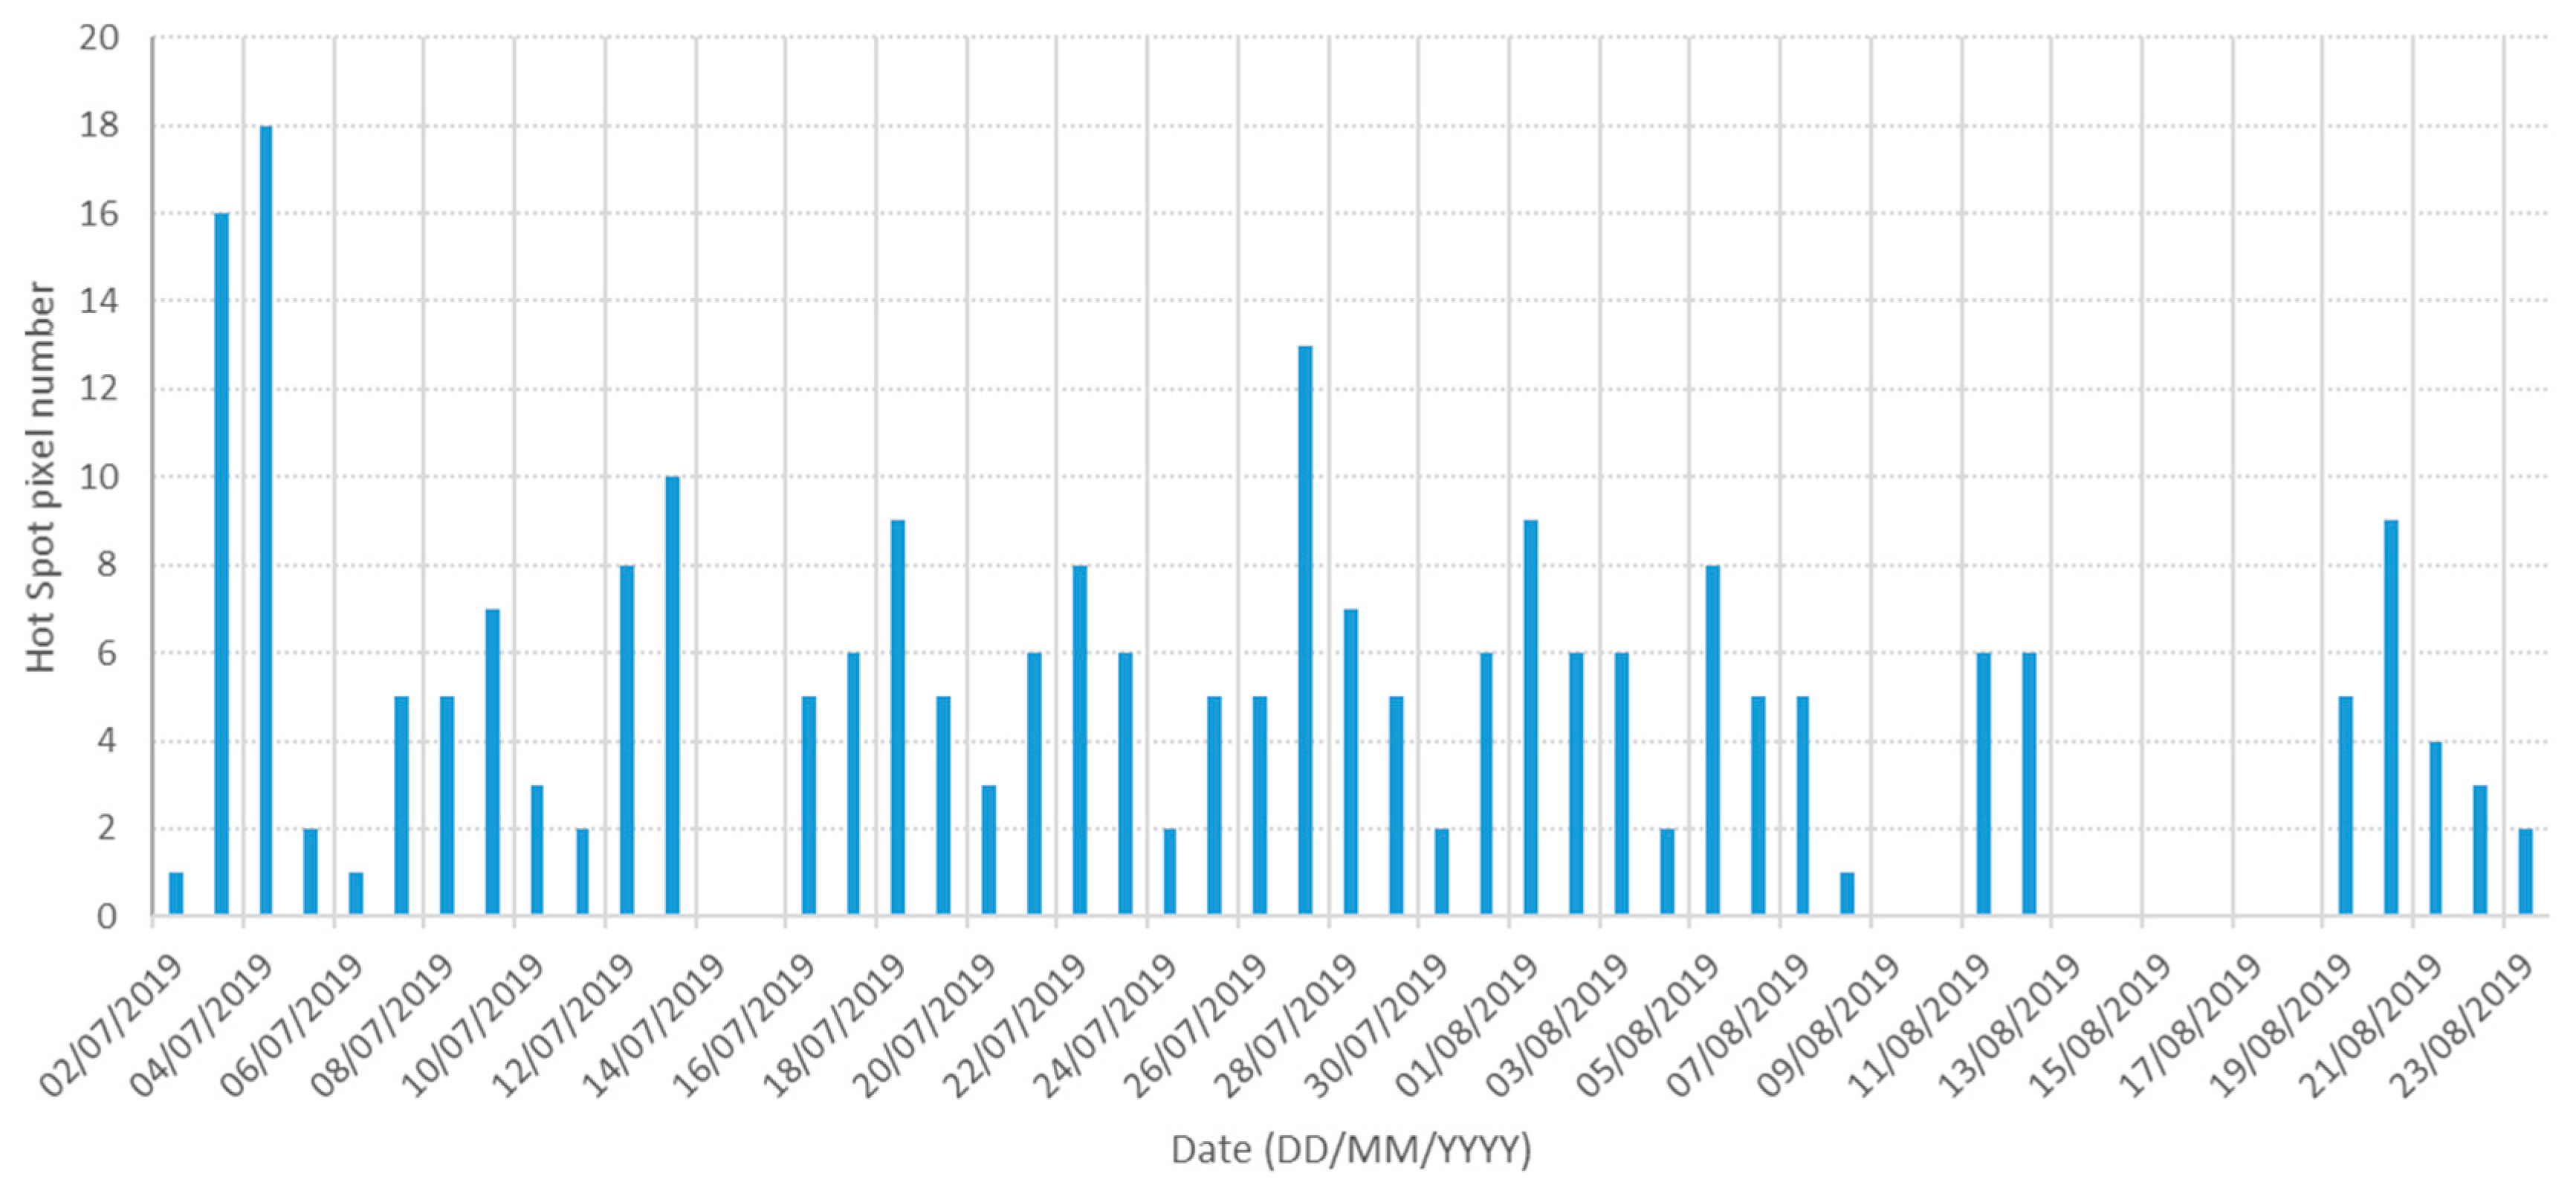
- VIIRS flying aboard the Suomi National Polar-Orbiting Partnership (Suomi NPP) and the Joint Polar Satellite System (JPSS), has a revisit time over the study area of at least twice per day. To investigate volcanic hotspots at Stromboli volcano, we used the 375 m resolution VIIRS mid IR I4 band (λ = 3.74 µm) and the thermal infrared I5 band (λ = 11.45 µm). In particular, for the time period of 3 July to 30 August 2019 (cf. Section 4) hotspot data from [49], identified over the Sciara del Fuoco, were analyzed [50]. Moreover, the VIIRS product CLDMSK_L2_VIIRS_SNPP was used to consider information on the cloud coverage over the study area during daytime [51].
3.2. Methods
- (a)
- The Robust Satellite Techniques (RST) multi-temporal approach [52] was applied to infrared SEVIRI data to identify eruption onsets and analyze short-term changes of thermal volcanic activity during the first phase of eruption. In addition, we used the SEVIRI cloud fraction cover (CFC) product, more precisely the fractional cloud cover during night time. This product is derived from the very frequent (every 15 min) geostationary acquisitions and provides daily information about the frequency of cloud coverage of a specific AOI during nighttime [53].
- (b)
- Hotspots identified by the RSTVOLC algorithm [24,54], running operationally at IMAA, were investigated to retrieve information on different phases of thermal volcanic activity from infrared nighttime AVHRR records. Only acquisitions with a satellite zenith angle (SZA) < 40° were considered in the analysis.
- (c)
- High spatial resolution multispectral satellite monitoring: For the Sentinel-2 imagery, the band combination 12/11/8A, i.e., SWIR 2 (λ = 2.19 µm), SWIR 1 (λ = 1.61 µm) and Near IR (NIR) (λ = 0.865 µm) was chosen. For the Landsat-8 night time imagery the band combination 7/6 (SWIR 2/SWIR 1) was used. The analysis of the Landsat-8 and Sentinel-2 imagery allowed to detect the beginning of the lava flow and to map its space-time evolution.
- (d)
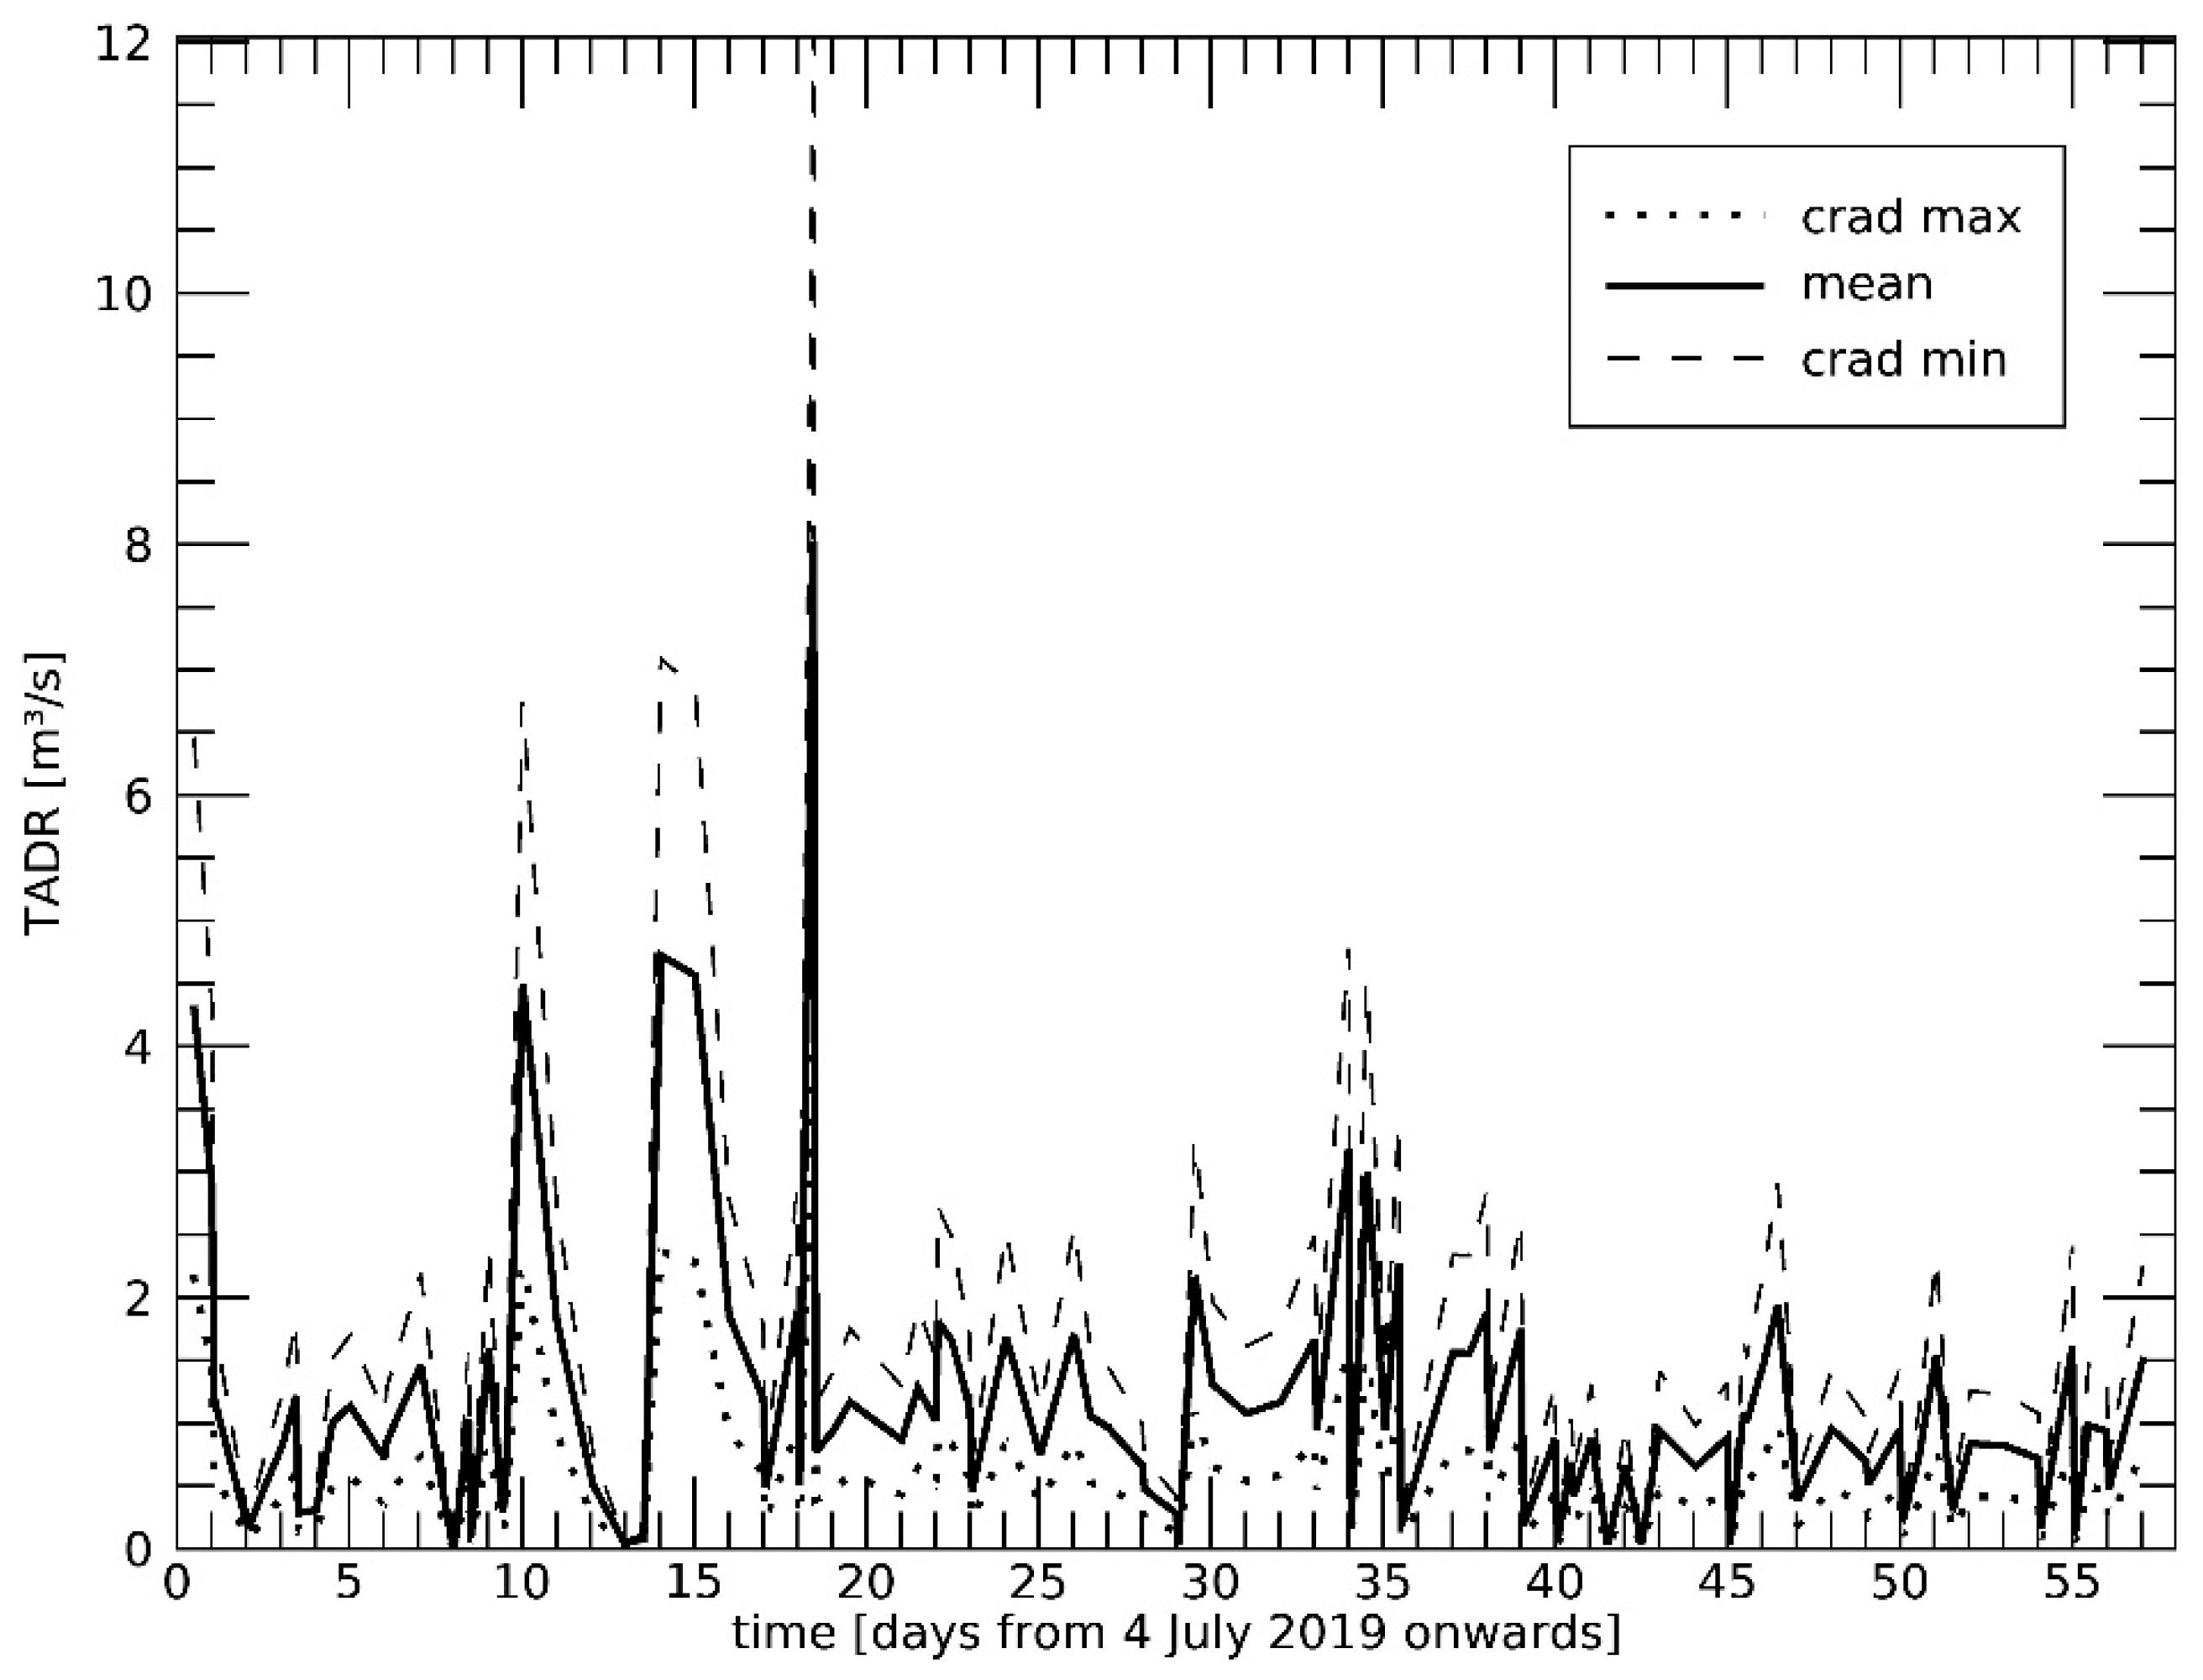
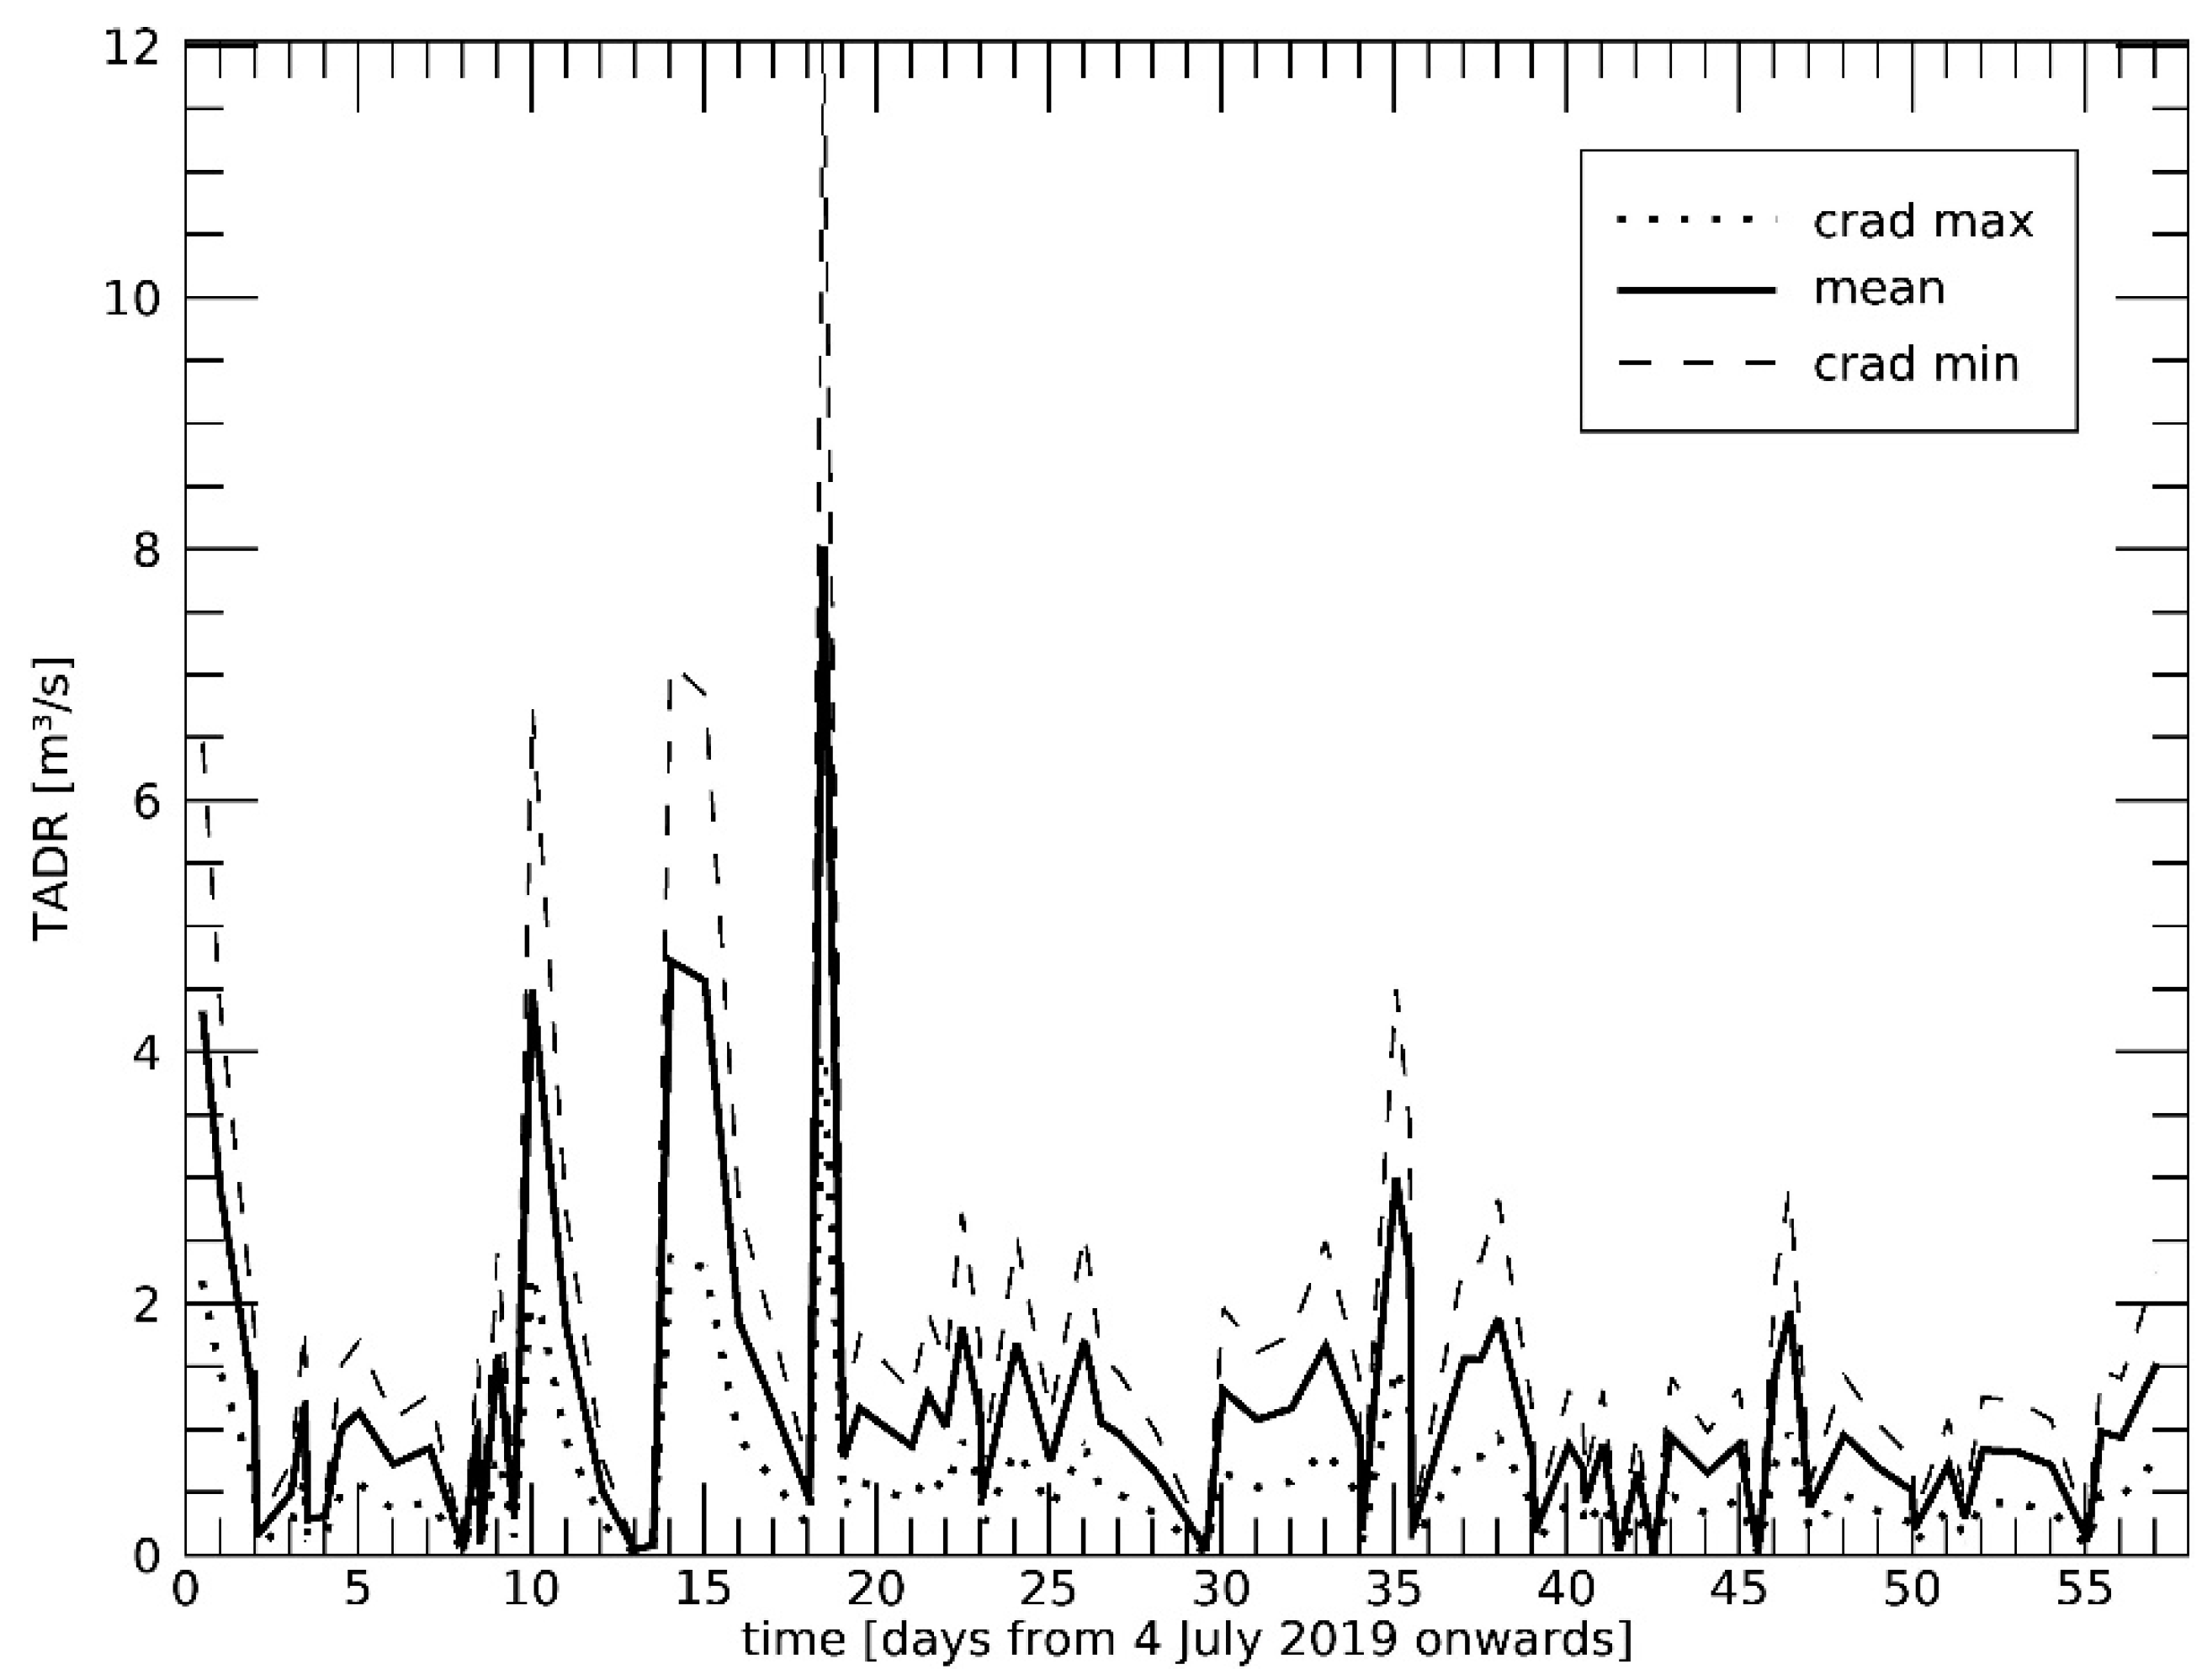
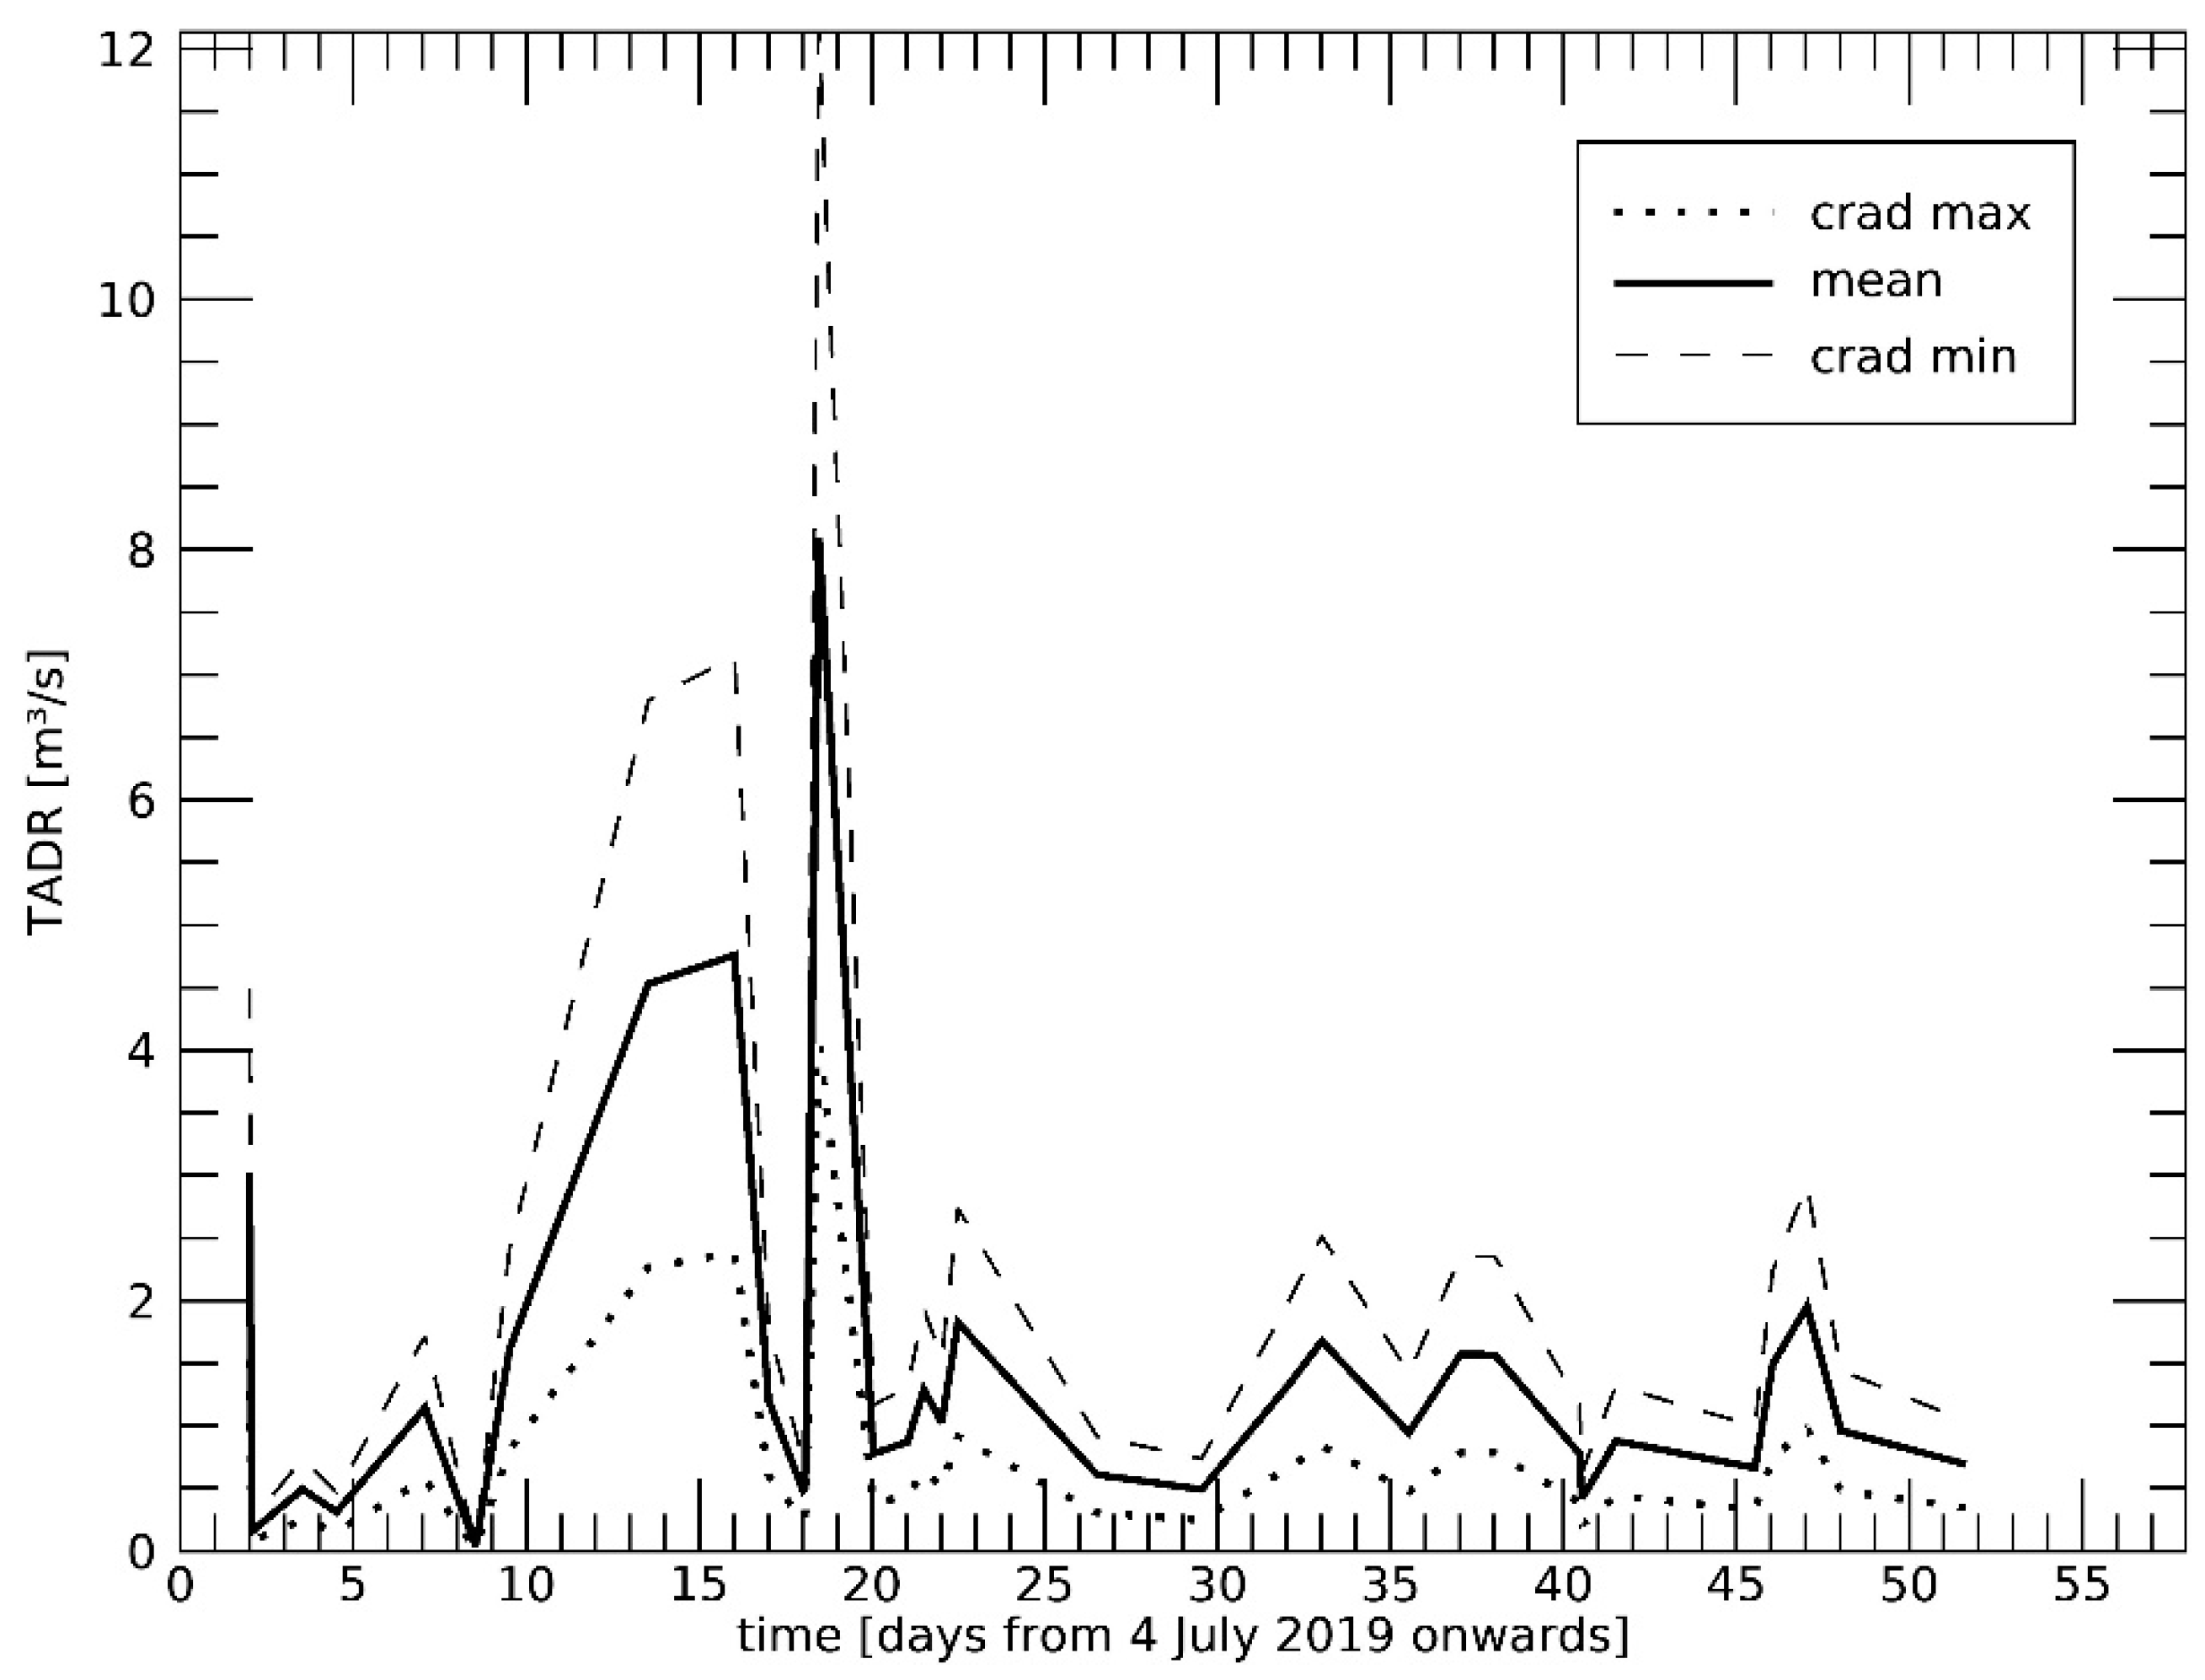
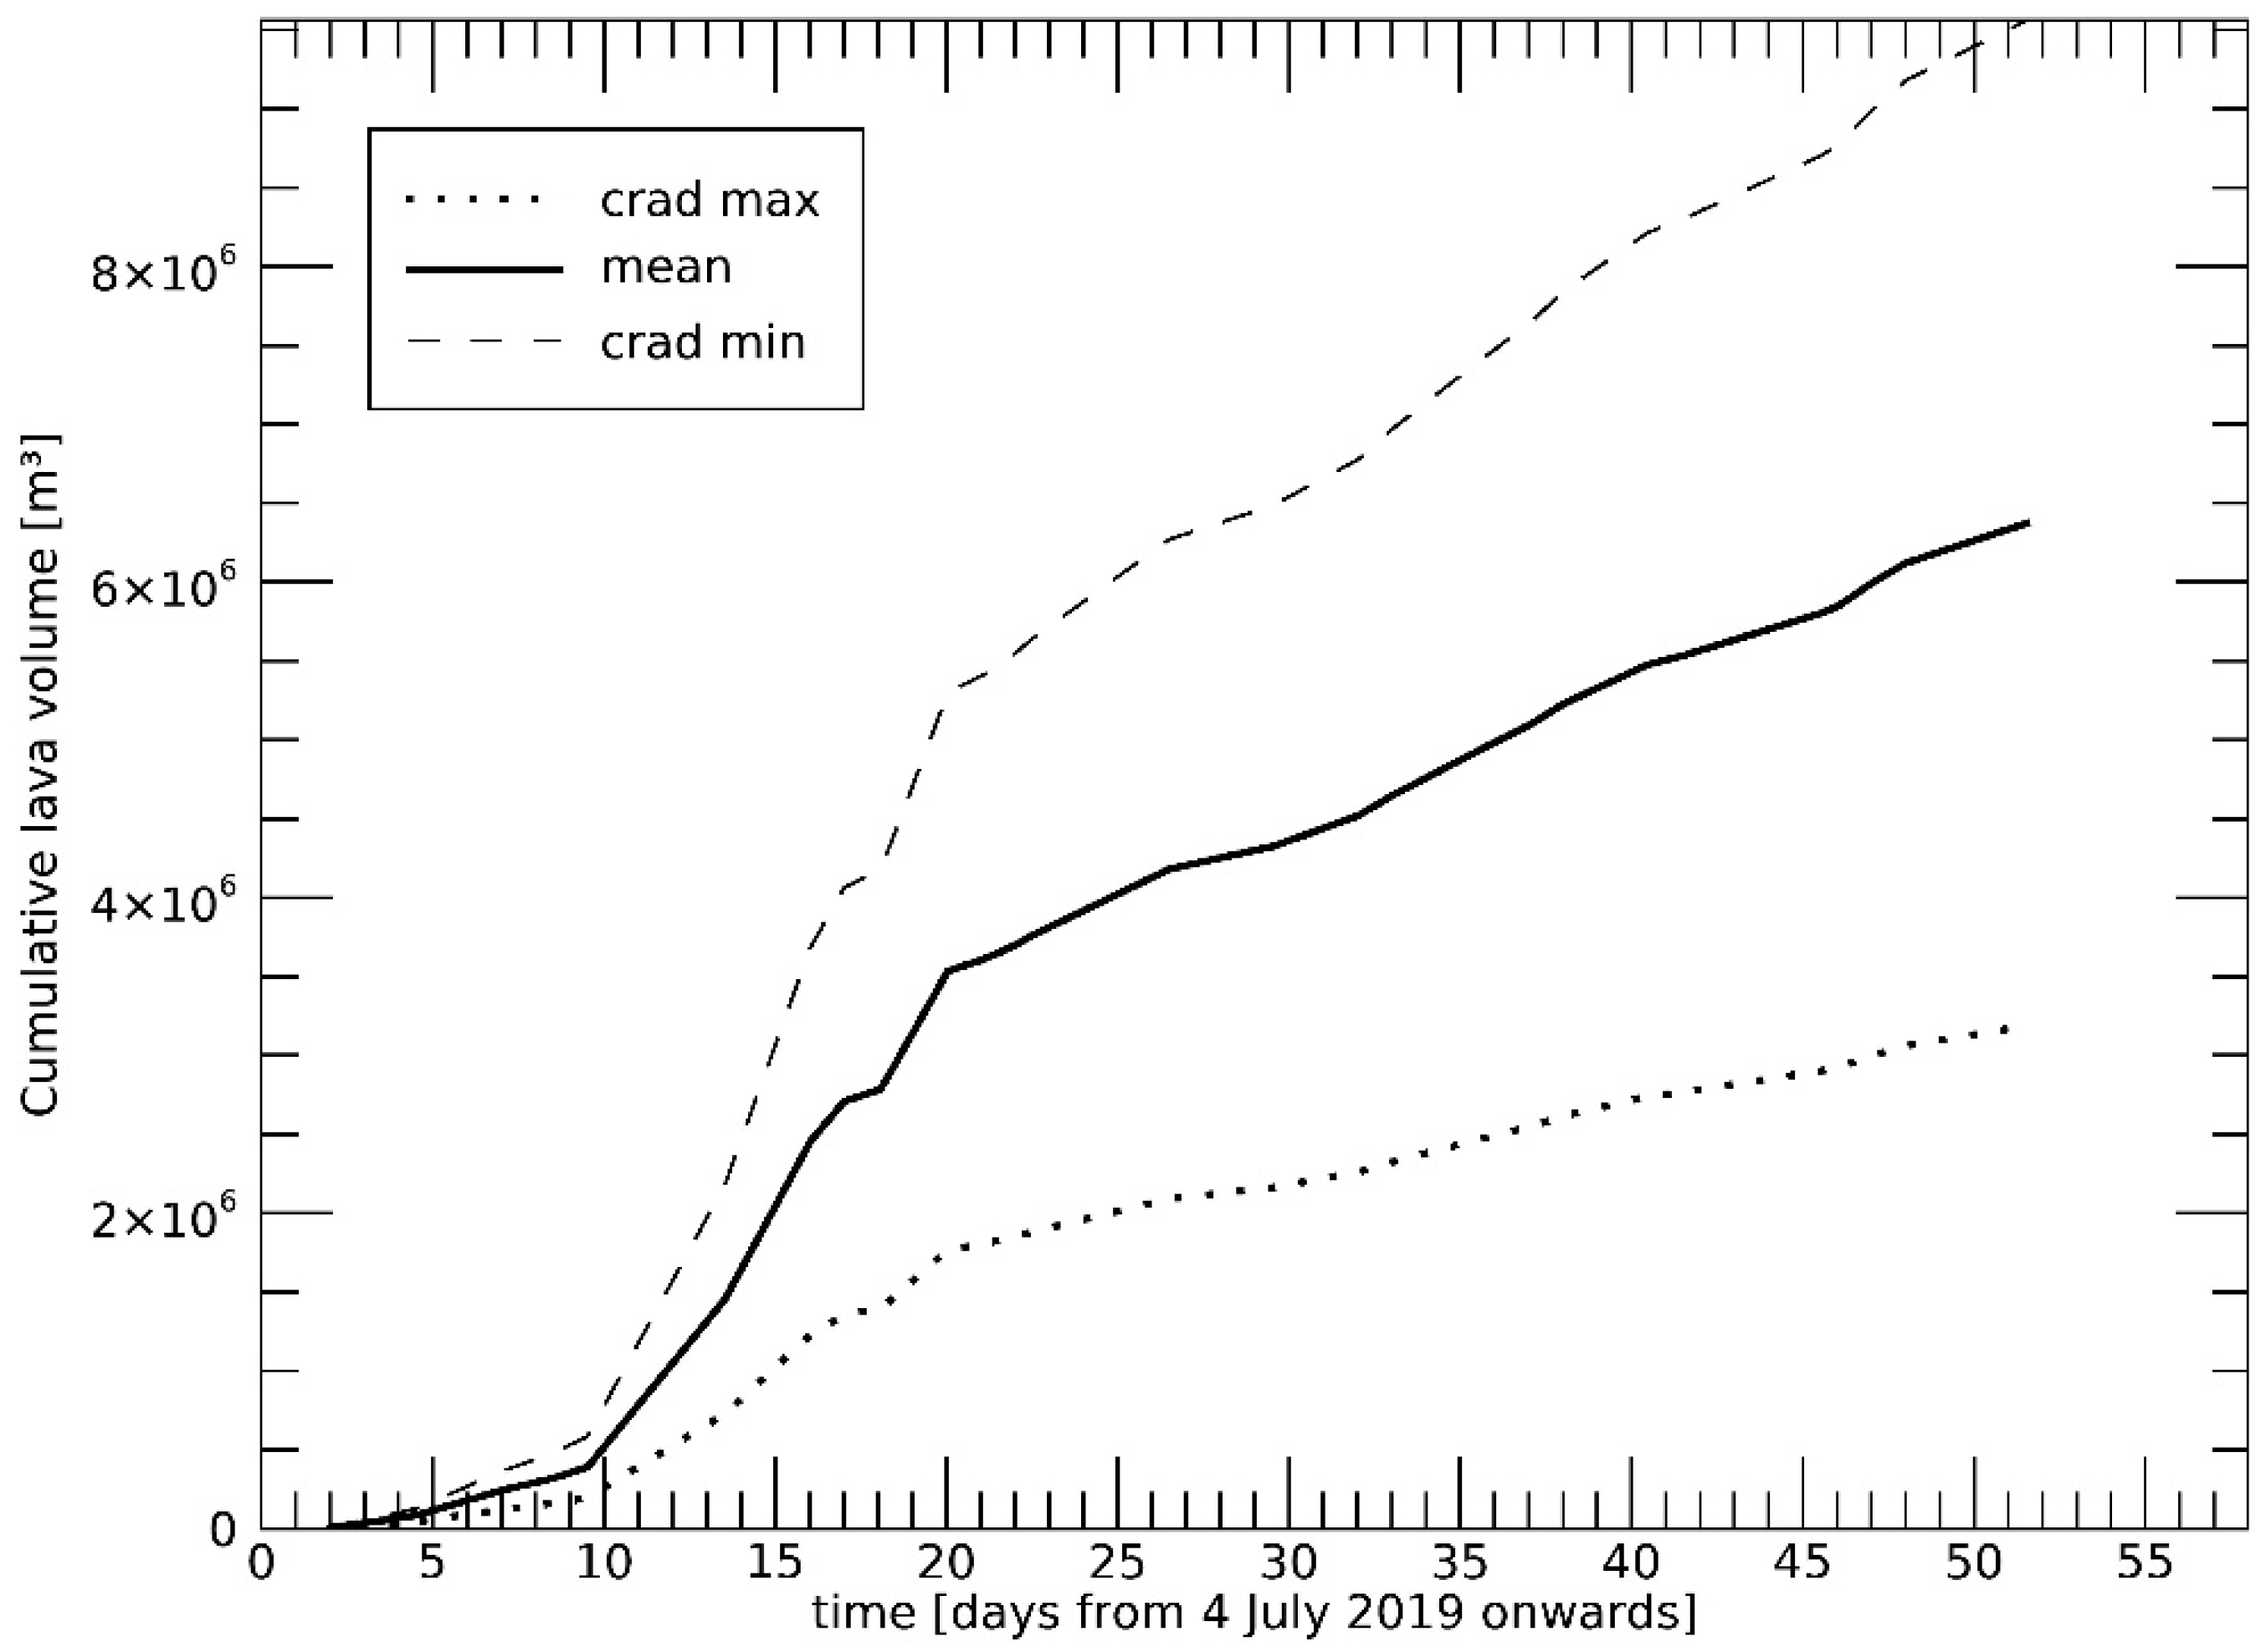
- Methods for VIIRS IR satellite imagery handling: The VIIRS hotspot product, for which a wide description can be found in [50], was used as input because the full implementation of RSTVOLC algorithm on VIIRS data was still in progress at the time of writing. Regarding the used VIIRS hotspot product, it provides the volcanic radiant power (VRP) of detected hotspots according to the well-established MIR-approach [55]. Thereby, the VRP was derived from the M13 band of VIIRS imagery. The geolocation of VIIRS is more accurate and also its spatial resolution is higher than the one of MODIS and AVHRR (1 km in nadir position), respectively. Therefore, the focus of our lava TADR estimation is based on VIIRS data.
4. Results
5. Discussion
6. Conclusions
Author Contributions
Funding
Acknowledgments
Conflicts of Interest
References
- Bertagnini, A.; Roberto, A.; Pompilio, M. Paroxysmal activity at Stromboli: Lessons from the past. Bull. Volcan. 2011, 73, 1229–1243. [Google Scholar] [CrossRef]
- Calvari, S.; Spampinato, L.; Bonaccorso, A.; Oppenheimer, C.; Rivalta, E.; Boschi, E. Lava effusion—A slow fuse for paroxysms at Stromboli volcano? Earth Planet. Sci. Lett. 2011, 301, 317–323. [Google Scholar] [CrossRef]
- Ripepe, M.; Pistolesi, M.; Coppola, D.; Delle Donne, D.; Genco, R.; Lacanna, G.; Laiolo, M.; Marchetti, E.; Ulivieri, G.; Valade, S. Forecasting effusive dynamics and decompression rates by magma static model at open-vent volcanoes. Sci. Rep. 2017, 7, 3885. [Google Scholar] [CrossRef] [PubMed]
- Neri, M.; Lanzafame, G.; Acocella, V. Dike emplacement and related hazard in volcanoes with sector collapse: The 2007 Stromboli eruption. J. Geol. Soc. Lond. 2008, 165, 883–886. [Google Scholar] [CrossRef]
- Neri, M.; Lanzafame, G. Structural features of the 2007 Stromboli eruption. J. Volcanol. Geotherm. Res. 2009, 182, 137–144. [Google Scholar] [CrossRef]
- Calvari, S.; Bonaccorso, A.; Madonia, P.; Neri, M.; Liuzzo, M.; Salerno, G.; Behncke, B.; Caltabiano, T.; Cristaldi, A.; Giuffrida, G.; et al. Major eruptive style changes induced by structural modifications of a shallow conduit system: The 2007–2012 Stromboli case. Bull. Volcan. 2014, 76, 841. [Google Scholar] [CrossRef]
- Maramai, A.; Graziani, L.; Tinti, S. Tsunamis in the Aeolian Islands (southern Italy): A review. Mar. Geol. 2005, 215, 11–21. [Google Scholar] [CrossRef]
- Rosi, M.; Pistolesi, M.; Bertagnini, A.; Landi, P.; Pompilio, M.; Di Roberto, A. Stromboli volcano, Aeolian Islands (Italy): Present eruptive activity and hazards. Geol. Soc. Lond. Mem. 2013, 37, 473–490. [Google Scholar] [CrossRef]
- Calvari, S.; Spampinato, L.; Lodato, L.; Harris, A.J.; Patrick, M.R.; Dehn, J.; Burton, M.R.; Andronico, D. Chronology and complex volcanic processes during the 2002–2003 flank eruption at Stromboli volcano (Italy) reconstructed from direct observations and surveys with a handheld thermal camera. J. Geophys. Res. Solid Earth 2005, 110. [Google Scholar] [CrossRef]
- Harris, A.J.L.; Swabey, S.E.J.; Higgins, J. Automated thresholding of active lavas using AVHRR data. Int. J. Remote Sens. 1995, 16, 3681–3686. [Google Scholar] [CrossRef]
- Lodato, L.; Spampinato, L.; Harris, A.; Calvari, S.; Dehn, J.; Patrick, M. The morphology and evolution of the Stromboli 2002–2003 lava flow field: An example of a basaltic flow field emplaced on a steep slope. Bull. Volcan. 2007, 69, 661–679. [Google Scholar] [CrossRef]
- Calvari, S.; Lodato, L.; Steffke, A.; Cristaldi, A.; Harris, A.J.; Spampinato, L.; Boschi, E. The 2007 Stromboli eruption: Event chronology and effusion rates using thermal infrared data. J. Geophys. Res. Solid Earth 2010, 115. [Google Scholar] [CrossRef]
- Ripepe, M.; Marchetti, E.; Ulivieri, G. Infrasonic monitoring at Stromboli volcano during the 2003 effusive eruption: Insights on the explosive and degassing process of an open conduit system. J. Geophys. Res. Solid Earth 2007, 112. [Google Scholar] [CrossRef]
- Ripepe, M.; Delle Donne, D.; Genco, R.; Maggio, G.; Pistolesi, M.; Marchetti, E.; Lacanna, G.; Ulivieri, G.; Poggi, P. Volcano seismicity and ground deformation unveil the gravity-driven magma discharge dynamics of a volcanic eruption. Nat. Commun. 2015, 6, 6998. [Google Scholar] [CrossRef] [PubMed]
- Di Traglia, F.; Calvari, S.; D’Auria, L.; Nolesini, T.; Bonaccorso, A.; Fornaciai, A.; Esposito, A.; Cristaldi, A.; Favalli, M.; Casagli, N. The 2014 Effusive Eruption at Stromboli: New Insights from In Situ and Remote-Sensing Measurements. Remote Sens. 2018, 10, 2035. [Google Scholar] [CrossRef]
- Francis, P.W.; Rothery, D.A. Using the Landsat Thematic Mapper to detect and monitor active volcanoes: An example from Lascar volcano, northern Chile. Geology 1987, 15, 614–617. [Google Scholar] [CrossRef]
- Wright, R.; Flynn, L.P.; Harris, A.J.L. Evolution of lava flow-fields at Mount Etna, 27–28 October 1999, observed by Landsat 7 ETM+. Bull. Volcan. 2001, 63, 1–7. [Google Scholar] [CrossRef]
- Kaneko, T.; Wooster, M.J.; Nakada, S. Exogenous and endogenous growth of the Unzen lava dome examined by satellite infrared image analysis. J. Volcan. Geotherm. Res. 2002, 116, 151–160. [Google Scholar] [CrossRef]
- Oppenheimer, C.; Francis, P. Remote sensing of heat, lava and fumarole emissions from Erta’Ale volcano, Ethiopia. Int. J. Remote Sens. 1997, 18, 1661–1692. [Google Scholar] [CrossRef]
- Harris, A.J.L.; Stevenson, D.S. Thermal observations of open degassing conduits and fumaroles at Stromboli and Vulcano using remotely-sensed data. J. Volcan. Geotherm. Res. 1997, 76, 175–198. [Google Scholar] [CrossRef]
- Oppenheimer, C. Volcanological applications of meteorological satellites. Int. J. Remote Sens. 1998, 19, 2829–2864. [Google Scholar] [CrossRef]
- Bonaccorso, A.; Bonforte, A.; Calvari, S.; Del Negro, C.; Di Grazia, G.; Ganci, G.; Neri, M.; Vicari, A.; Boschi, E. The initial phases of the 2008–9 Mt. Etna eruption: A multi-disciplinary approach for hazard assessment. J. Geophys. Res. 2011, 116, B03203. [Google Scholar] [CrossRef]
- Wright, R. MODVOLC: 14 years of autonomous observations of effusive volcanism from space. In Detecting, Modelling and Responding to Effusive Eruptions; Harris, A.J.L., de Groeve, T., Garel, F., Carn, S.A., Eds.; Geological Society Special Publications: London, UK, 2016; Volume 426, pp. 23–54. [Google Scholar] [CrossRef]
- Marchese, F.; Filizzola, C.; Genzano, N.; Mazzeo, G.; Pergola, N.; Tramutoli, V. Assessment and improvement of a Robust Satellite Technique (RST) for thermal monitoring of volcanoes. Remote Sens. Environ. 2011, 115–116, 1556–1563. [Google Scholar] [CrossRef]
- Coppola, D.; Laiolo, M.; Cigolini, C.; Delle Donne, D.; Ripepe, M. Enhanced volcanic hot-spot detection using MODIS IR data: Results from the MIROVA system. In Detecting, Modelling and Responding to Effusive Eruptions; Harris, A.J.L., de Groeve, T., Garel, F., Carn, S.A., Eds.; Geological Society Special Publications: London, UK, 2016; Volume 426. [Google Scholar] [CrossRef]
- AVA. ASTER Volcano Archive. Available online: https://ava.jpl.nasa.gov/about.php (accessed on 20 August 2019).
- Reath, K.; Pritchard, M.E.; Moruzzi, S.; Alcott, A.; Coppola, D.; Pieri, D. The AVTOD (ASTER Volcanic Thermal Output Database) Latin America archive. J. Volcan. Geotherm. Res. 2019, 376, 62–75. [Google Scholar] [CrossRef]
- Zakšek, K.; Hort, M.; Lorenz, E. Satellite and ground based thermal observation of the 2014 effusive eruption at Stromboli volcano. Remote Sens. 2015, 7, 17190–17211. [Google Scholar] [CrossRef]
- Plank, S.; Nolde, M.; Richter, R.; Fischer, C.; Martinis, S.; Riedlinger, T.; Schoepfer, E.; Klein, D. Monitoring of the 2015 Villarrica volcano eruption by means of DLR’s experimental TET-1 satellite. Remote Sens. 2018, 10, 1379. [Google Scholar] [CrossRef]
- Harris, A.J.L. Thermal Remote Sensing of Active Volcanoes—A User’s Manual; Cambridge University Press: Cambridge, UK, 2013. [Google Scholar] [CrossRef]
- Harris, A.J.L.; de Groeve, T.; Garel, F.; Carn, S.A. (Eds.) Detecting, Modelling and Responding to Effusive Eruptions; Geological Society Special Publications: London, UK, 2016. [Google Scholar] [CrossRef]
- Harris, A.J.L.; Dehn, J.; Calvari, S. Lava effusion rate definition and measurement: A review. Bull. Volcan. 2007, 70, 1–22. [Google Scholar] [CrossRef]
- Harris, A.J.L.; Rowland, S.K. FLOWGO: A kinematic thermos-rheological model for lava flowing in a channel. Bull. Volcan. 2001, 63, 20–44. [Google Scholar] [CrossRef]
- Ganci, G.A.; Vicari, A.; Cappello, A.; Del Negro, C. An emergent strategy for volcano hazard assessment: From thermal satellite monitoring to lava flow modelling. Remote Sens. Environ. 2012, 119, 197–207. [Google Scholar] [CrossRef]
- Calvari, S.; Neri, M.; Pinkerton, H. Effusion rate estimations during the 1999 summit eruption on Mount Etna, and growth of two distinct lava flow fields. J. Volcan. Geotherm. Res. 2003, 119, 107–123. [Google Scholar] [CrossRef]
- Poland, M.P. Time-averaged discharge rate of subaerial lava at Kīlauea Volcano, Hawai’i, measured from TanDEM-X interferometry: Implications for magma supply and storage during 2011–2013. J. Geophys. Res. Solid Earth 2014, 119, 5464–5481. [Google Scholar] [CrossRef]
- Coppola, D.; Ripepe, M.; Laiolo, M.; Cigolini, C. Modelling satellite-derived magma discharge to explain caldera collapse. Geology 2017, 45, 523–526. [Google Scholar] [CrossRef]
- Coppola, D.; Barsotti, S.; Cigolini, C.; Laiolo, G.M.; Pfeffer, M.A.; Ripepe, M. Monitoring the time-averaged discharge rates, volumes and emplacement style of large lava flows by using MIROVA system: The case of the 2014–2015 eruption at Holuhraun (Iceland). Ann. Geophys. 2018, 61. [Google Scholar] [CrossRef]
- Walter, T.R.; Haghighi, M.H.; Schneider, F.M.; Coppola, D.; Motagh, M.; Saul, J.; Babeyko, A.; Dahm, T.; Troll, V.R.; Tilmann, F.; et al. Complex hazard cascade culminating in the Anak Krakatau sector collapse. Nat. Commun. 2019, 10. [Google Scholar] [CrossRef]
- ESA Sentinel Online. Available online: https://sentinel.esa.int/web/sentinel/user-guides/sentinel-2-msi/resolutions (accessed on 15 October 2019).
- Pergola, N.; Marchese, F.; Tramutoli, V.; Filizzola, C.; Ciampa, M. Advanced satellite technique for volcanic activity monitoring and early warning. Ann. Geophys. 2008, 51, 287–301. [Google Scholar] [CrossRef]
- Higgins, J.; Harris, A. VAST: A program to locate and analyze volcanic thermal anomalies automatically from remotely sensed data. Comput. Geosci. 1997, 23, 627–645. [Google Scholar] [CrossRef]
- Pergola, N.; Marchese, F.; Tramutoli, V. Automated detection of thermal features of active volcanoes by means of infrared AVHRR records. Remote Sens. Environ. 2004, 93, 311–327. [Google Scholar] [CrossRef]
- Lombardo, V. AVHotRR: Near-real time routine for volcano monitoring using IR satellite data. In Detecting, Modelling and Responding to Effusive Eruptions; Harris, A.J.L., de Groeve, T., Garel, F., Carn, S.A., Eds.; Geological Society Special Publications: London, UK, 2016; Volume 426, pp. 73–92. [Google Scholar] [CrossRef]
- Mia, M.; Fujimitsu, Y.; Nishijima, J. Thermal activity monitoring of an active volcano using Landsat 8/OLI-TIRS sensor images: A case study at the Aso volcanic area in southwest Japan. Geosciences 2017, 7, 118. [Google Scholar] [CrossRef]
- Marchese, F.; Neri, M.; Falconieri, A.; Lacava, T.; Mazzeo, G.; Pergola, N.; Tramutoli, V. The Contribution of Multi-Sensor Infrared Satellite Observations to Monitor Mt. Etna (Italy) Activity during May to August 2016. Remote Sens. 2018, 10, 1948. [Google Scholar] [CrossRef]
- Valade, S.; Ley, A.; Massimetti, F.; D’Hondt, O.; Laiolo, M.; Coppola, D.; Loibl, D.; Hellwich, O.; Walter, T.R. Towards Global Volcano Monitoring Using Multisensor Sentinel Missions and Artificial Intelligence: The MOUNTS Monitoring System. Remote Sens. 2019, 11, 1528. [Google Scholar] [CrossRef]
- Richter, L.; Louis, J.; Berthelot, B. Sentinel-2 MSI—Level 2A Products Algorithm Theoretical Basis; S2PAD-ATBD-0001; German Aerospace Center (DLR): Oberpfaffenhofen, Germany; VEGA, 2011. [Google Scholar]
- Fire-Information-for-Resource-Management-System (FIRMS). Available online: https://firms.modaps.eosdis.nasa.gov (accessed on 31 October 2019).
- Schroeder, W.; Giglio, L. Visible Infrared Imaging Radiometer Suite (VIIRS) 375 m Active Fire Detection and Characterization Algorithm Theoretical Basis Document; University of Maryland: Washington, DC, USA, 2016. [Google Scholar]
- VIIRS Cloud Mask. CLDMSK_L2_VIIRS_SNPP. Available online: https://ladsweb.modaps.eosdis.nasa.gov/missions-and-measurements/products/CLDMSK_L2_VIIRS_SNPP/ (accessed on 31 October 2019).
- Tramutoli, V. Robust satellite techniques (RST) for natural and environmental hazards monitoring and mitigation: Theory and applications. In Proceedings of the 2007 International Workshop on the Analysis of Multi-temporal Remote Sensing Images, Provinciehuis Leuven, Belgium, 18–20 July 2007; pp. 1–6. [Google Scholar] [CrossRef]
- Finkensieper, S.; Stengel, M.; Selbach, N.; Hollmann, R.; Werscheck, M.; Meirink, J.F. ICDR SEVIRI Clouds—Based on CLAAS-2 Methods, Satellite Application Facility on Climate Monitoring. 2018. Available online: https://wui.cmsaf.eu/safira/action/viewICDRDetails?acronym=CLAAS_V002_ICDR (accessed on 15 October 2019).
- Pergola, N.; Coviello, I.; Filizzola, C.; Lacava, T.; Marchese, F.; Paciello, R.; Tramutoli, V. A Review of RSTVOLC, an Original Algorithm for Automatic Detection and Near-Real-Time Monitoring of Volcanic Hotspots from Space; Geological Society Special Publications: London, UK, 2016; Volume 426, pp. 55–72. [Google Scholar] [CrossRef]
- Wooster, M.J.; Zhukov, B.; Oertel, D. Fire radiative energy for quantitative study of biomass burning: Derivation from the BIRD experimental satellite and comparison to MODIS fire products. Remote Sens. Environ. 2003, 86, 83–107. [Google Scholar] [CrossRef]
- Coppola, D.; Laiolo, M.; Piscopo, D.; Cigolini, C. Rheological control on the radiant density of active lava flows and domes. J. Volcan. Geotherm. Res. 2013, 249, 39–48. [Google Scholar] [CrossRef]
- Landi, P.; Corsaro, R.A.; Francalanci, L.; Civetta, L.; Miraglia, L.; Pompilio, K.; Tesoro, R. Magma dynamics during the 2007 Stromboli eruption (Aeolian Islands, Italy): Mineralogical, geochemical and isotopic data. J. Volcan. Geotherm. Res. 2009, 182, 255–268. [Google Scholar] [CrossRef]
- Istituto Nazionale di Geofisica e Vulcanologia (INGV). The 3 July 2019 paroxysm of Stromboli and its activity during the following days. Available online: https://ingvvulcani.com/2019/07/15/the-3-july-2019-paroxysm-of-stromboli-and-its-activity-during-the-following-days/ (accessed on 15 July 2019).
- Zanon, V.; Neri, M.; Pecora, E. Interpretation of data from the monitoring thermal camera: The case of Stromboli volcano (Aeolian Islands, Italy). Geol. Mag. 2009, 146, 591–601. [Google Scholar] [CrossRef]


| Scenario | Description |
|---|---|
| I | Considering the VRP measurements from all hotspots detected over the AOI |
| II | Considering only VRP measurements with scan angles ≤ 31.59° |
| III | In addition to scenario II: considering only clear sky acquisitions (for the daytime acquisitions) and in addition all nighttime acquisitions |
| IV | In addition to scenario III: considering in addition to the clear sky daytime acquisitions only clear sky nighttime acquisitions (SEVIRI nighttime CFC = 0%) |
| V | Same as scenario III, but considering only the daytime acquisitions with clear sky |
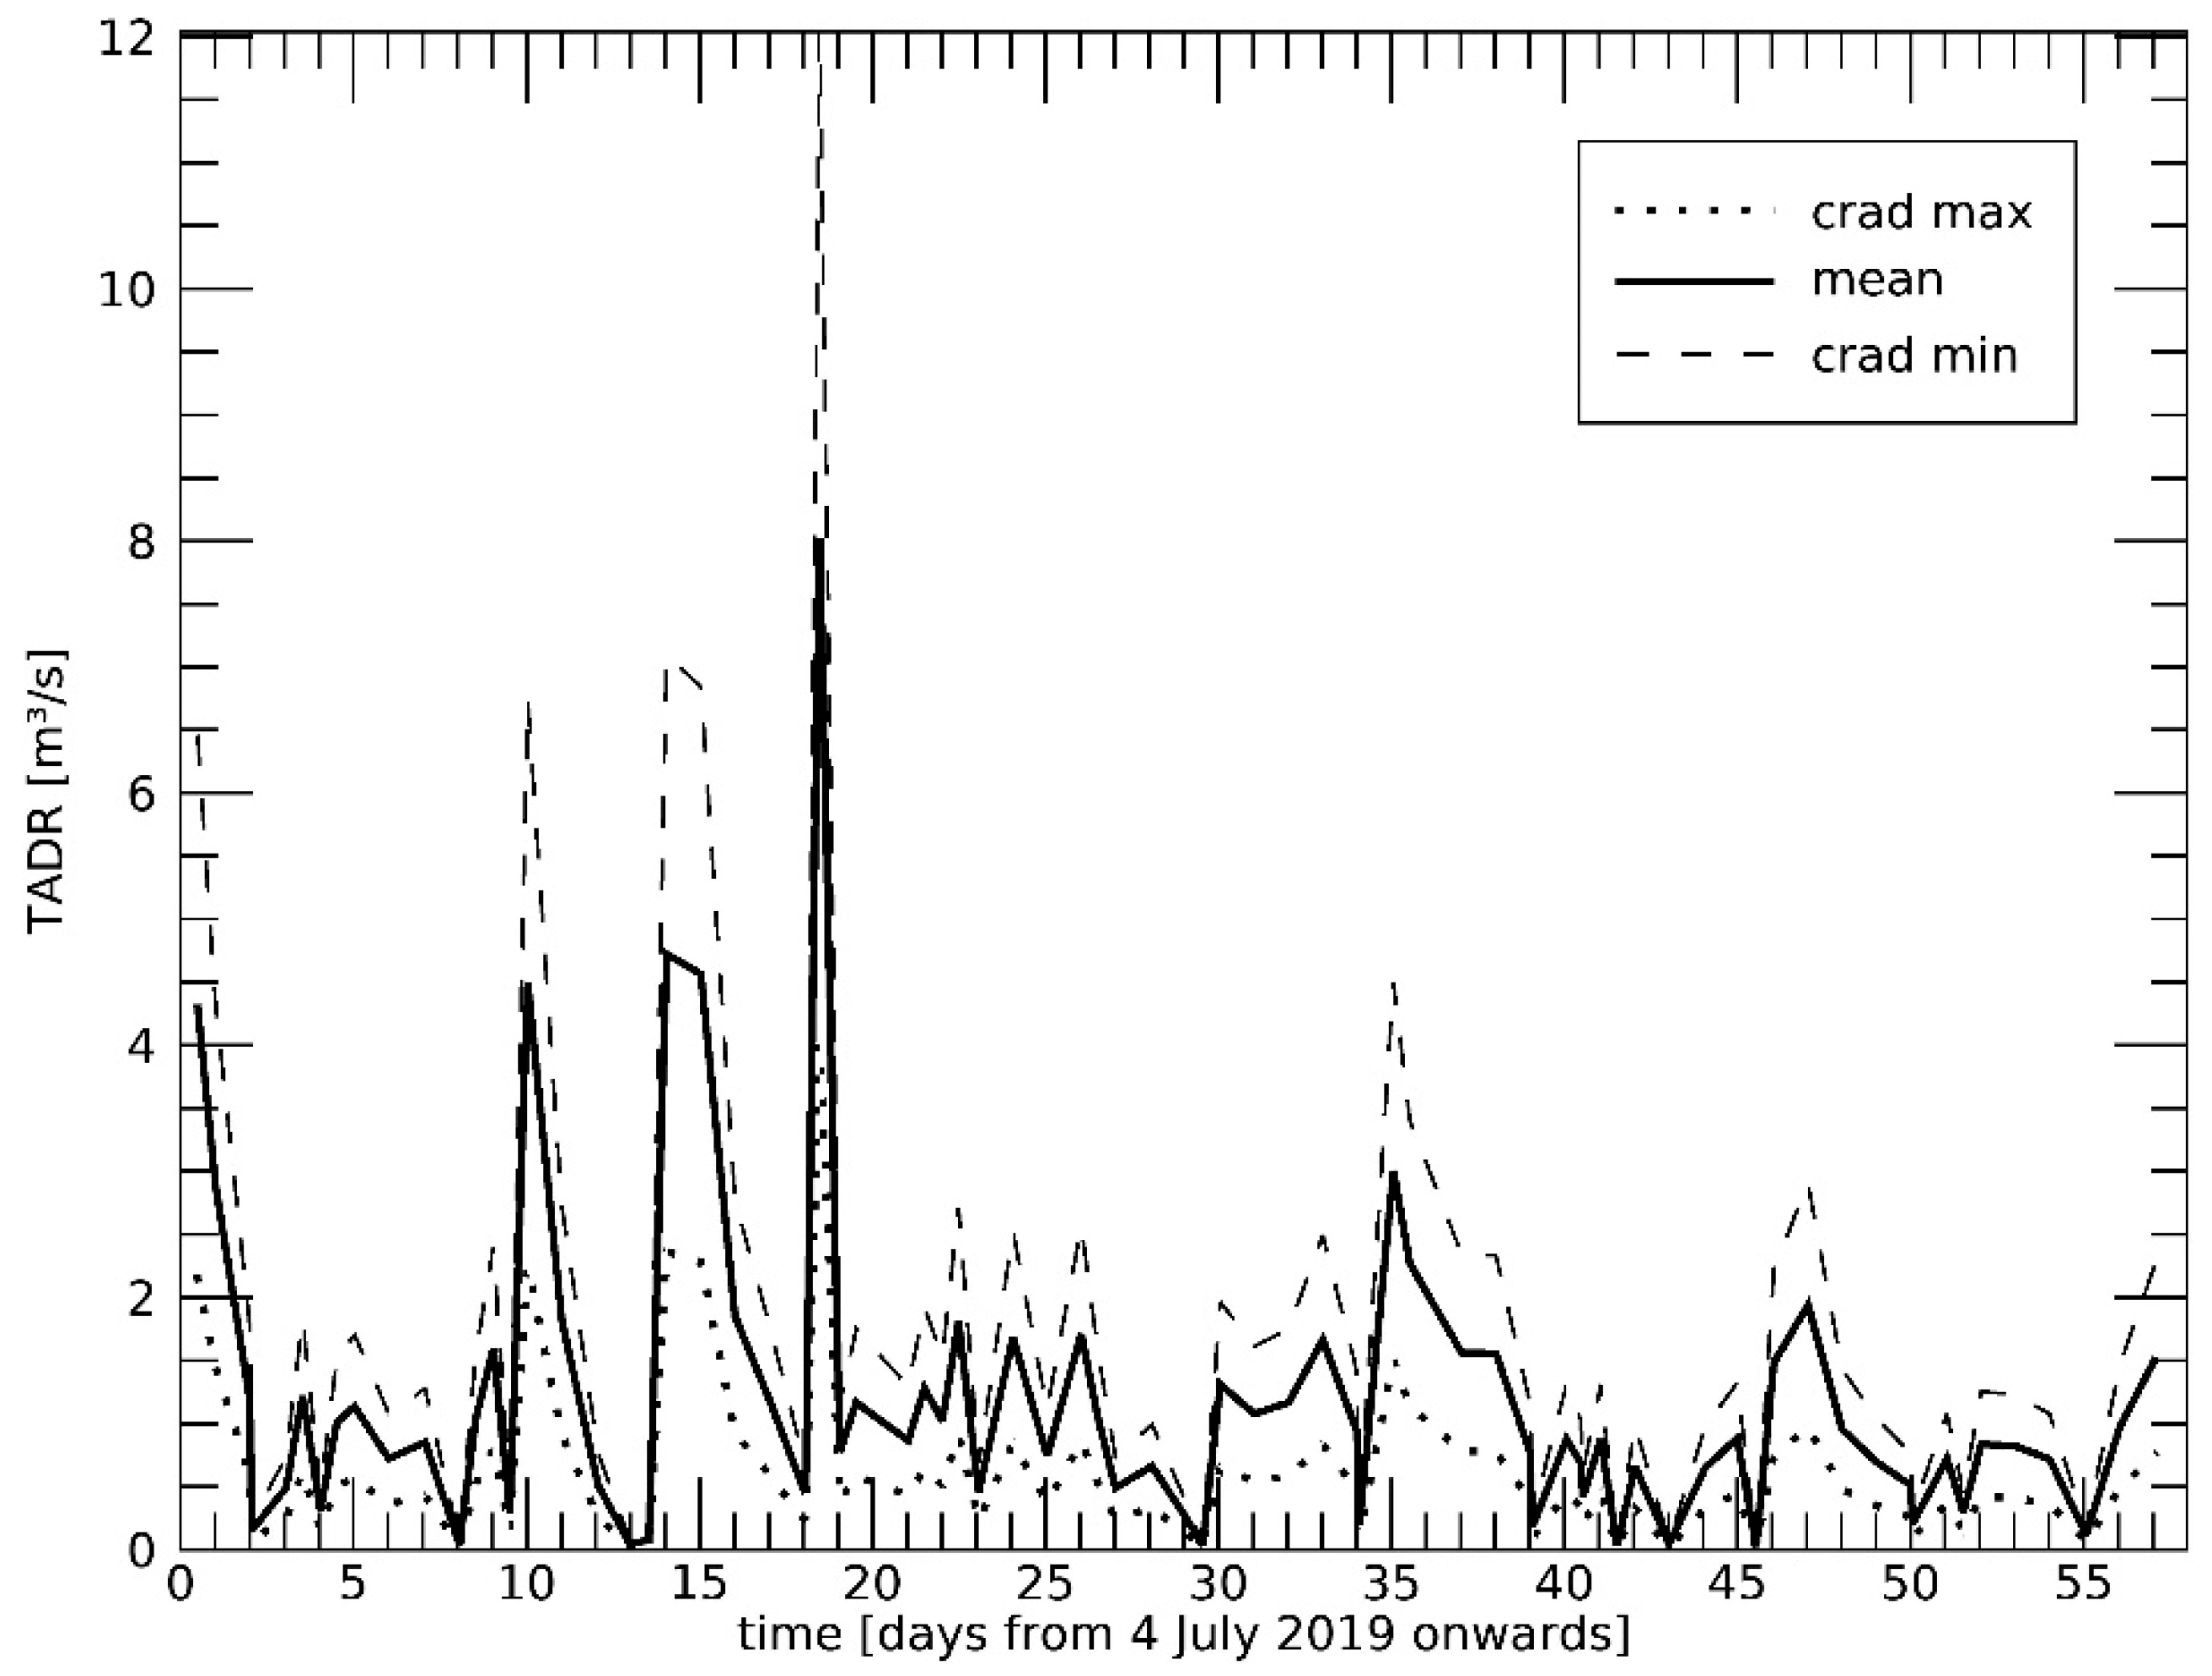
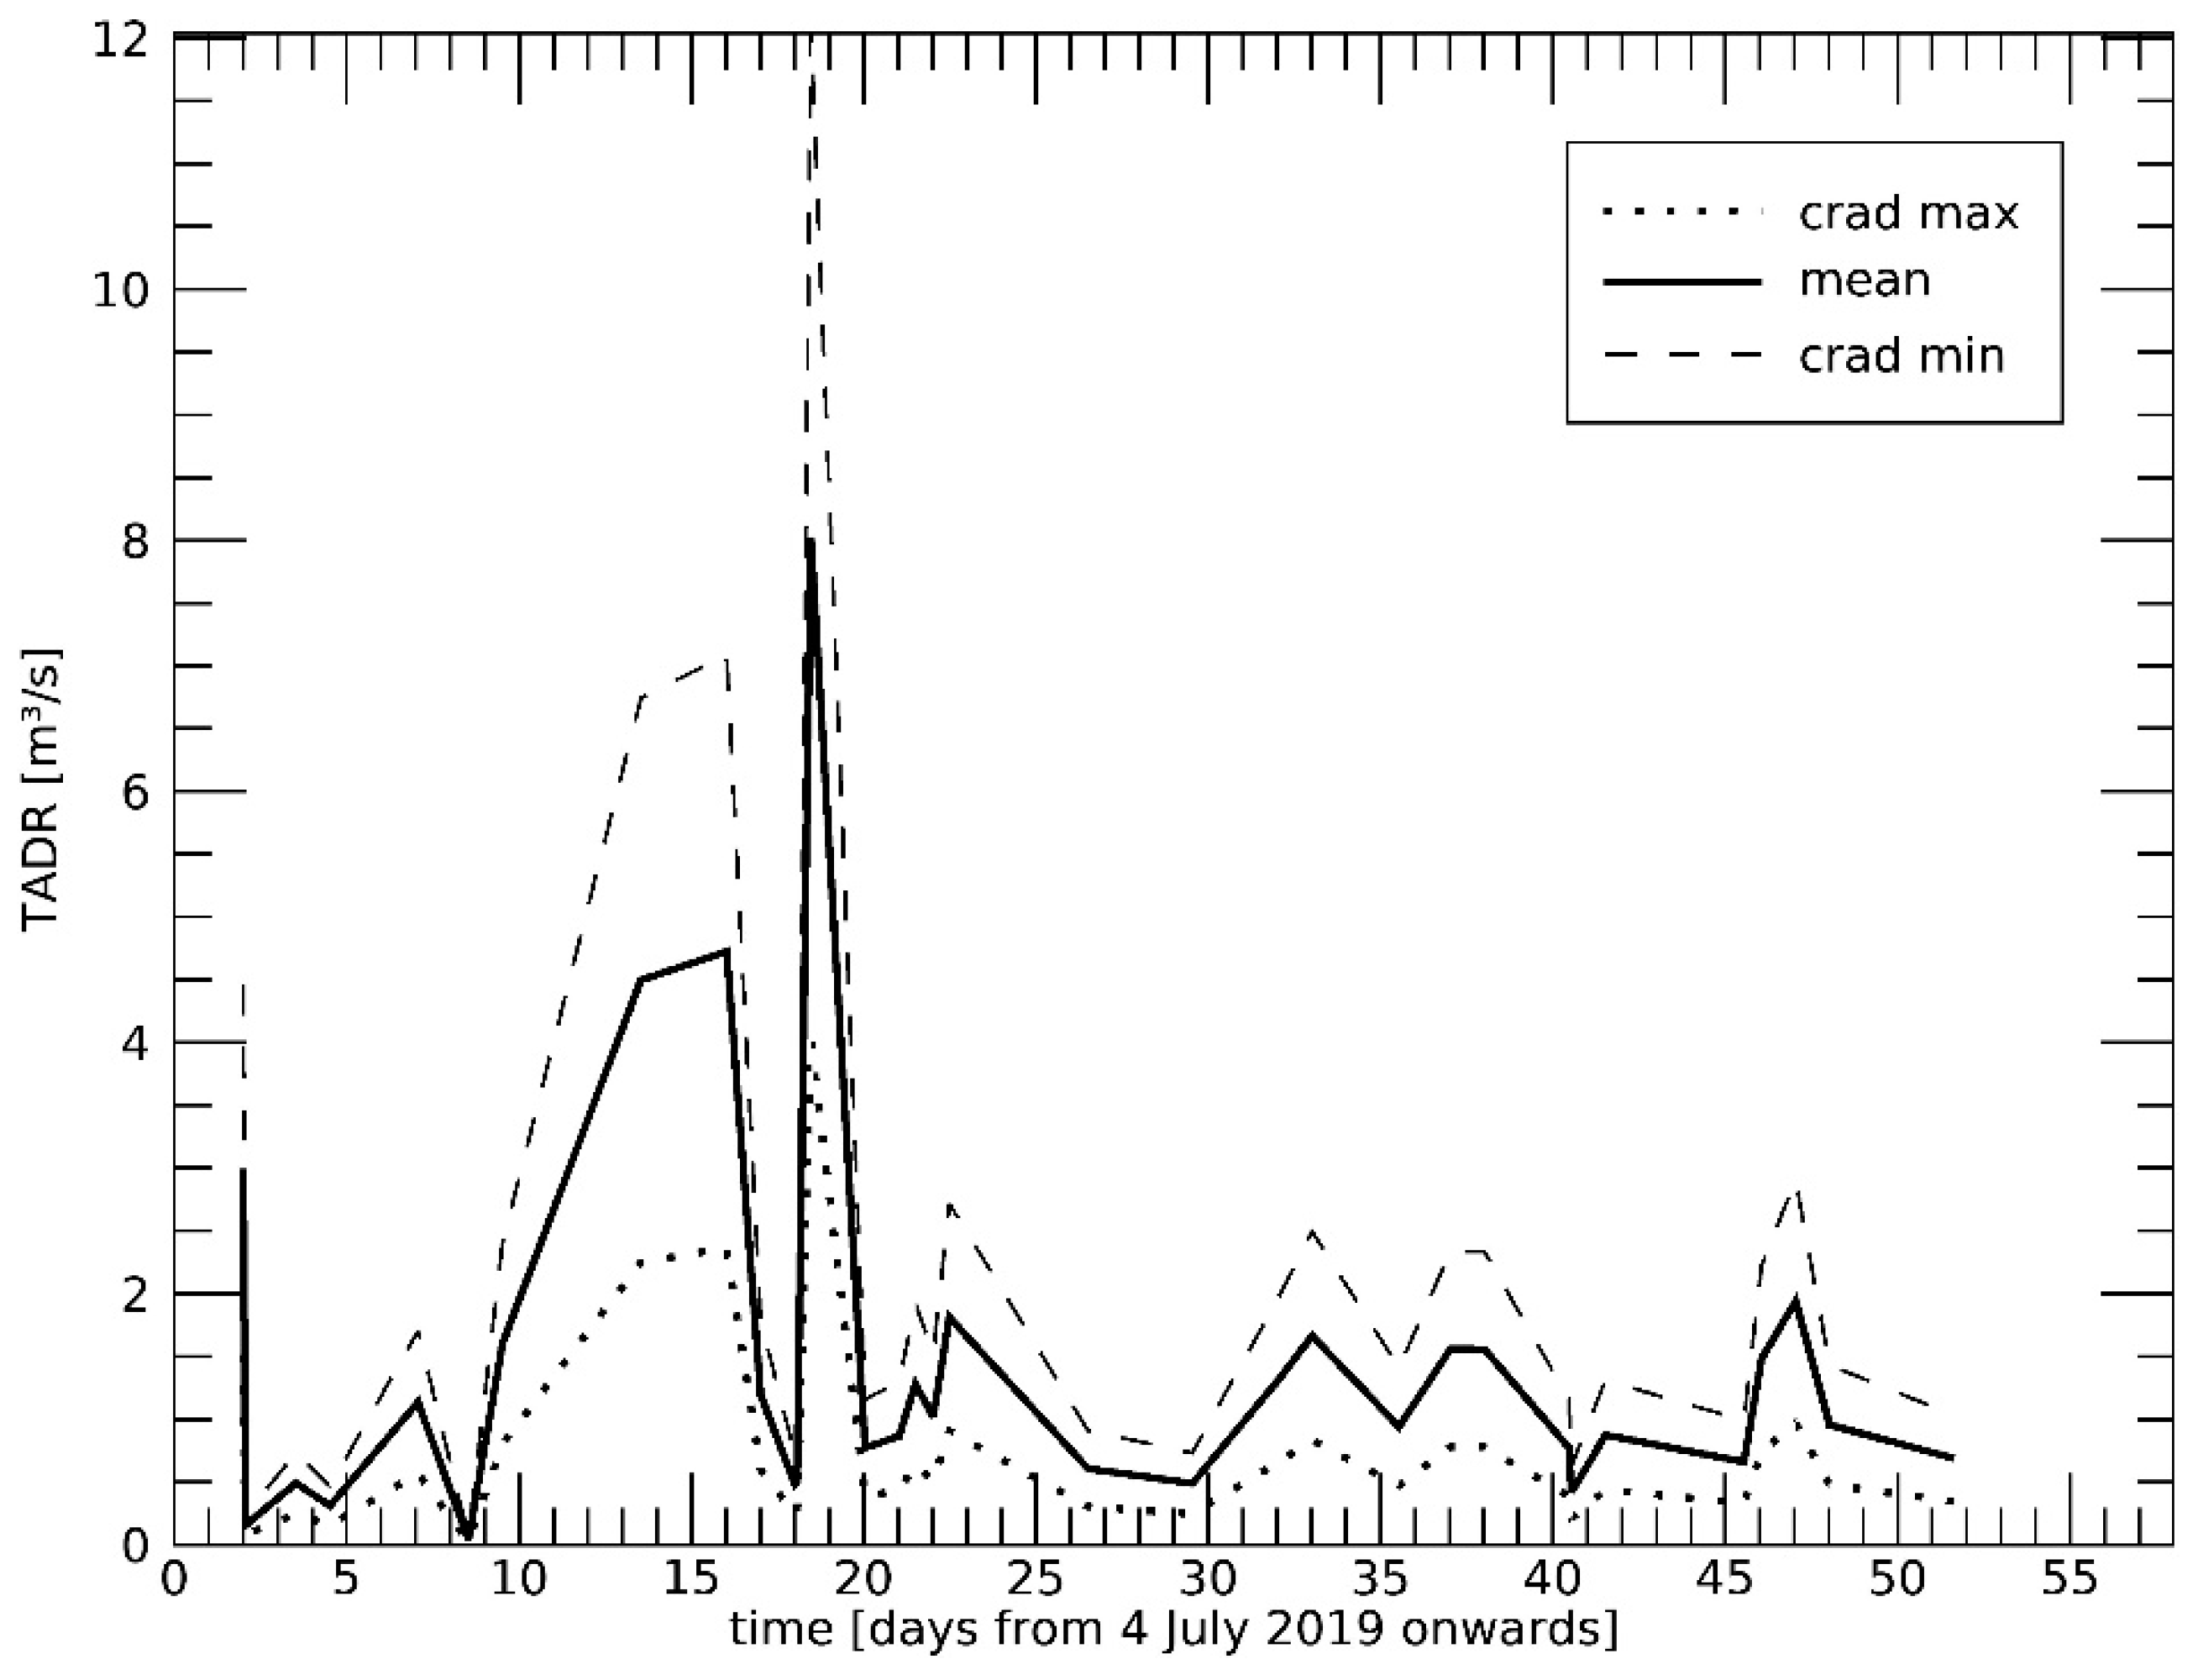
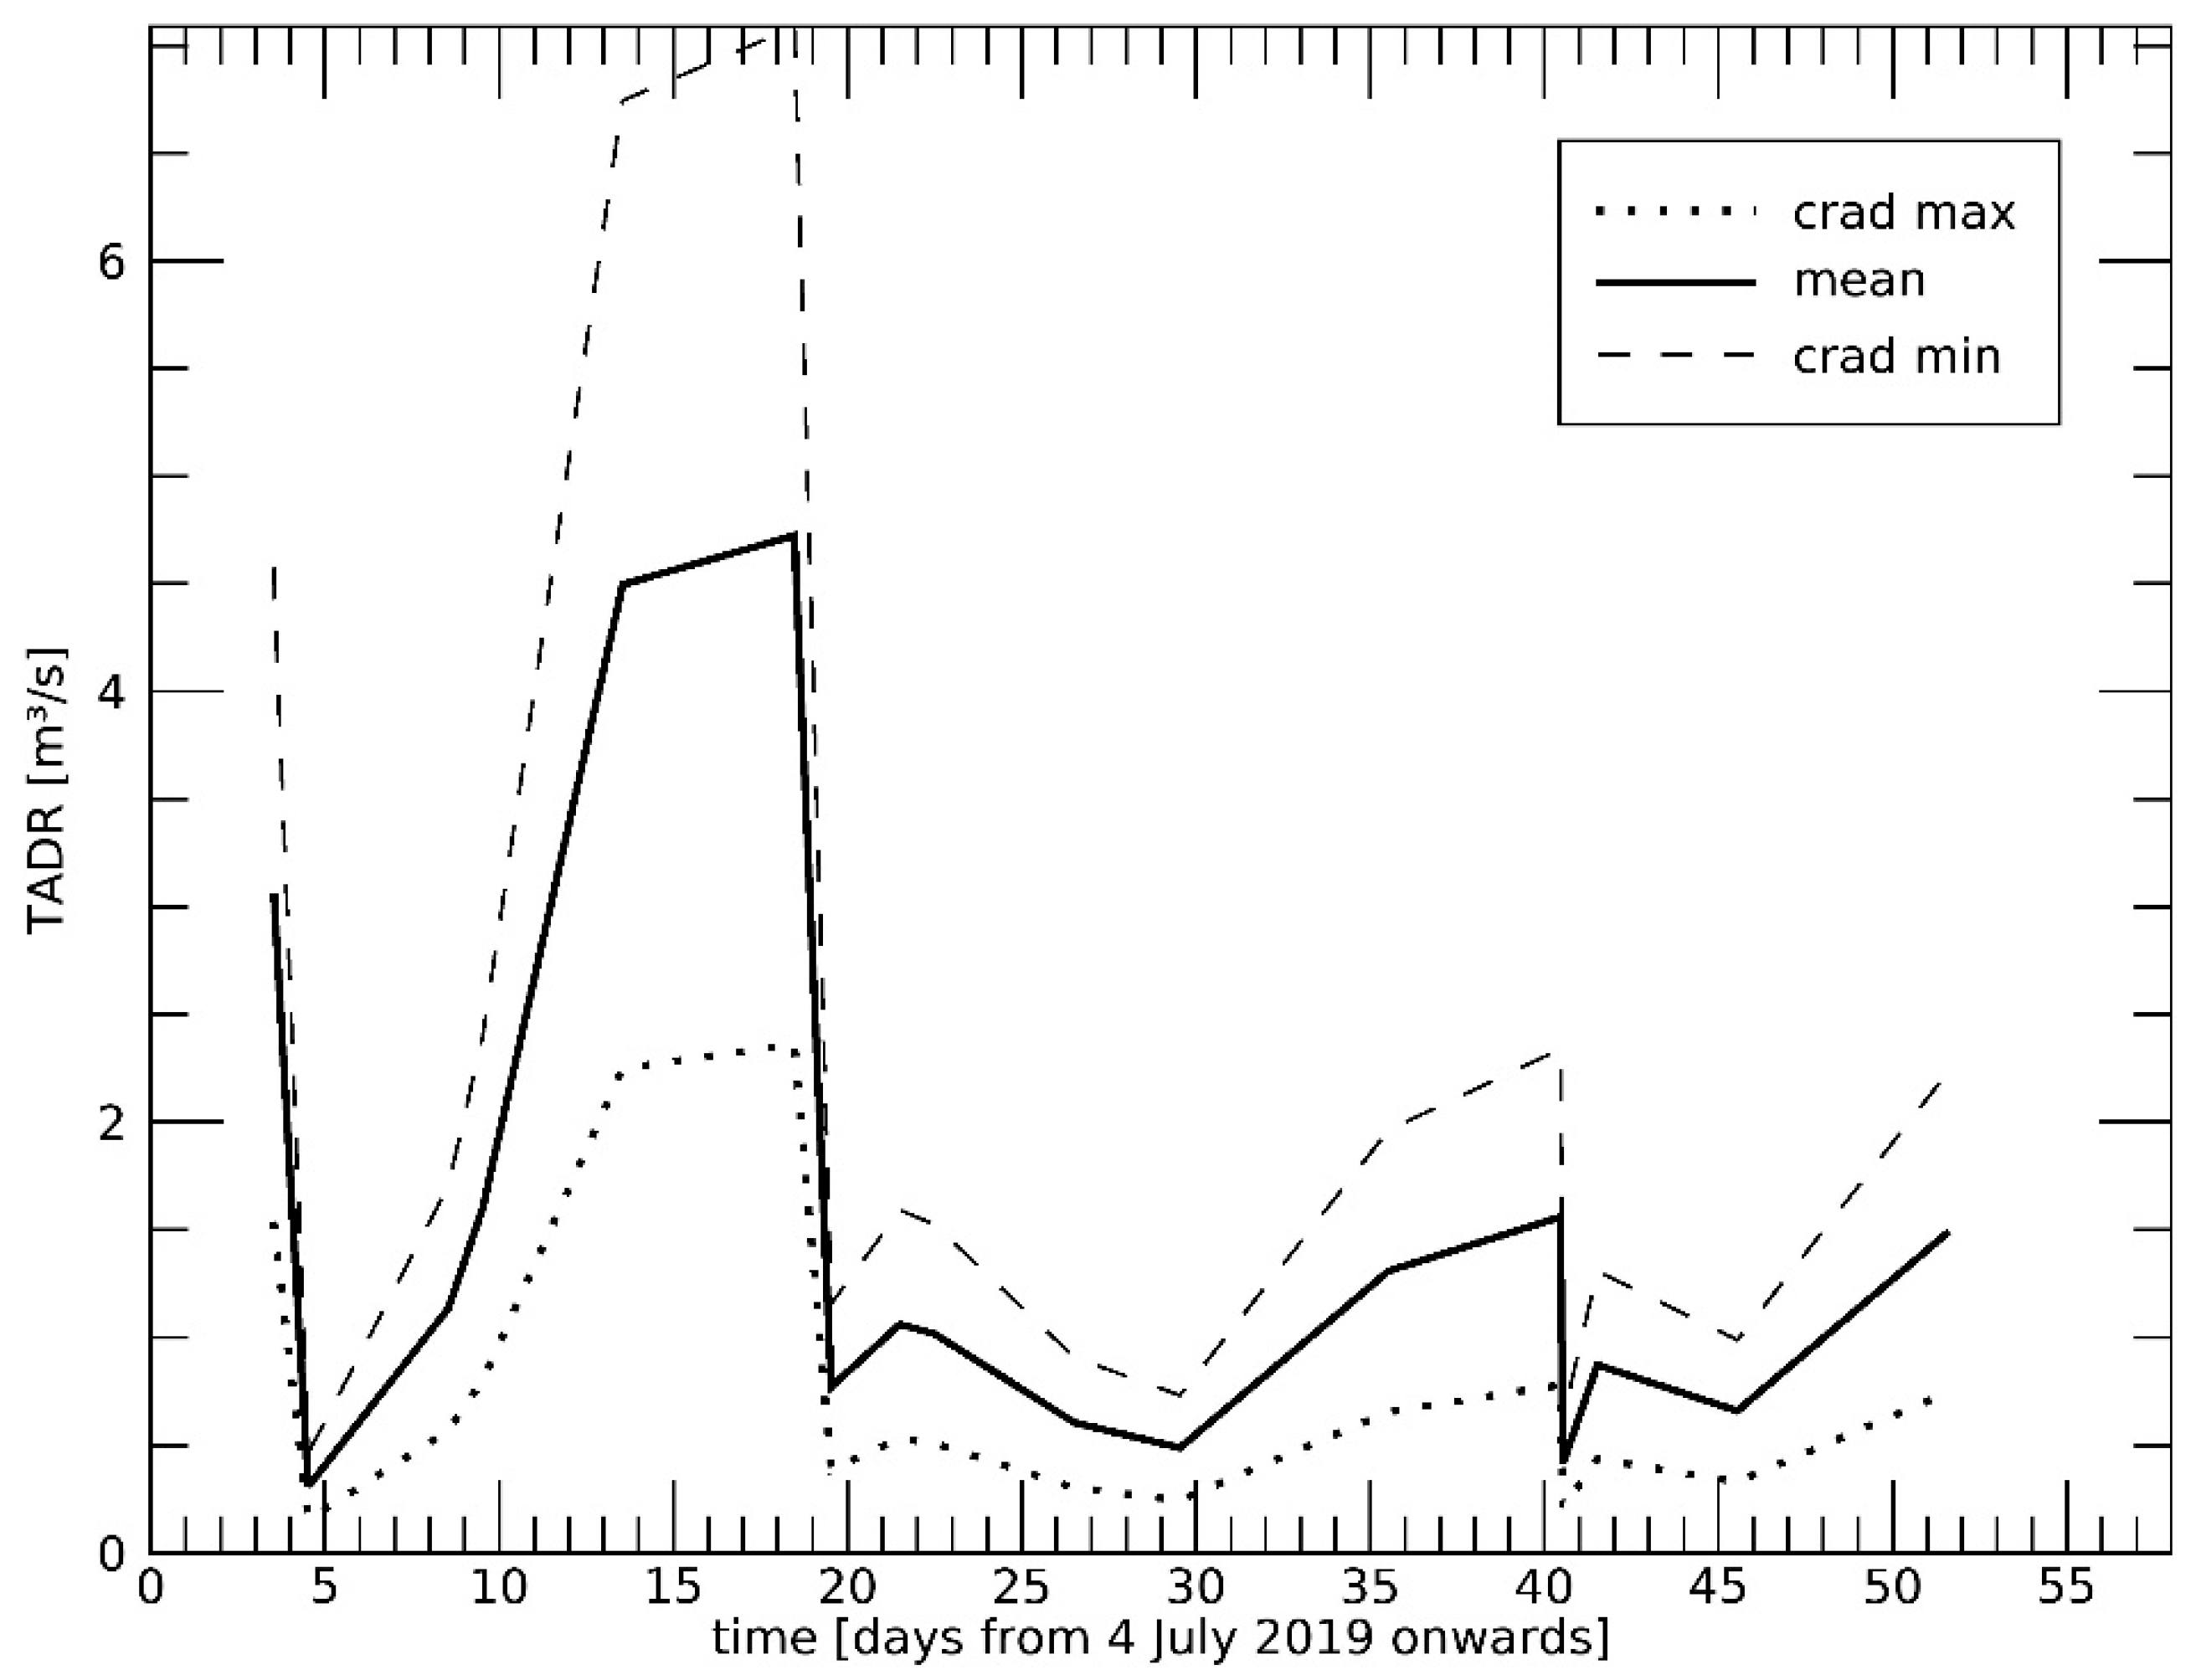
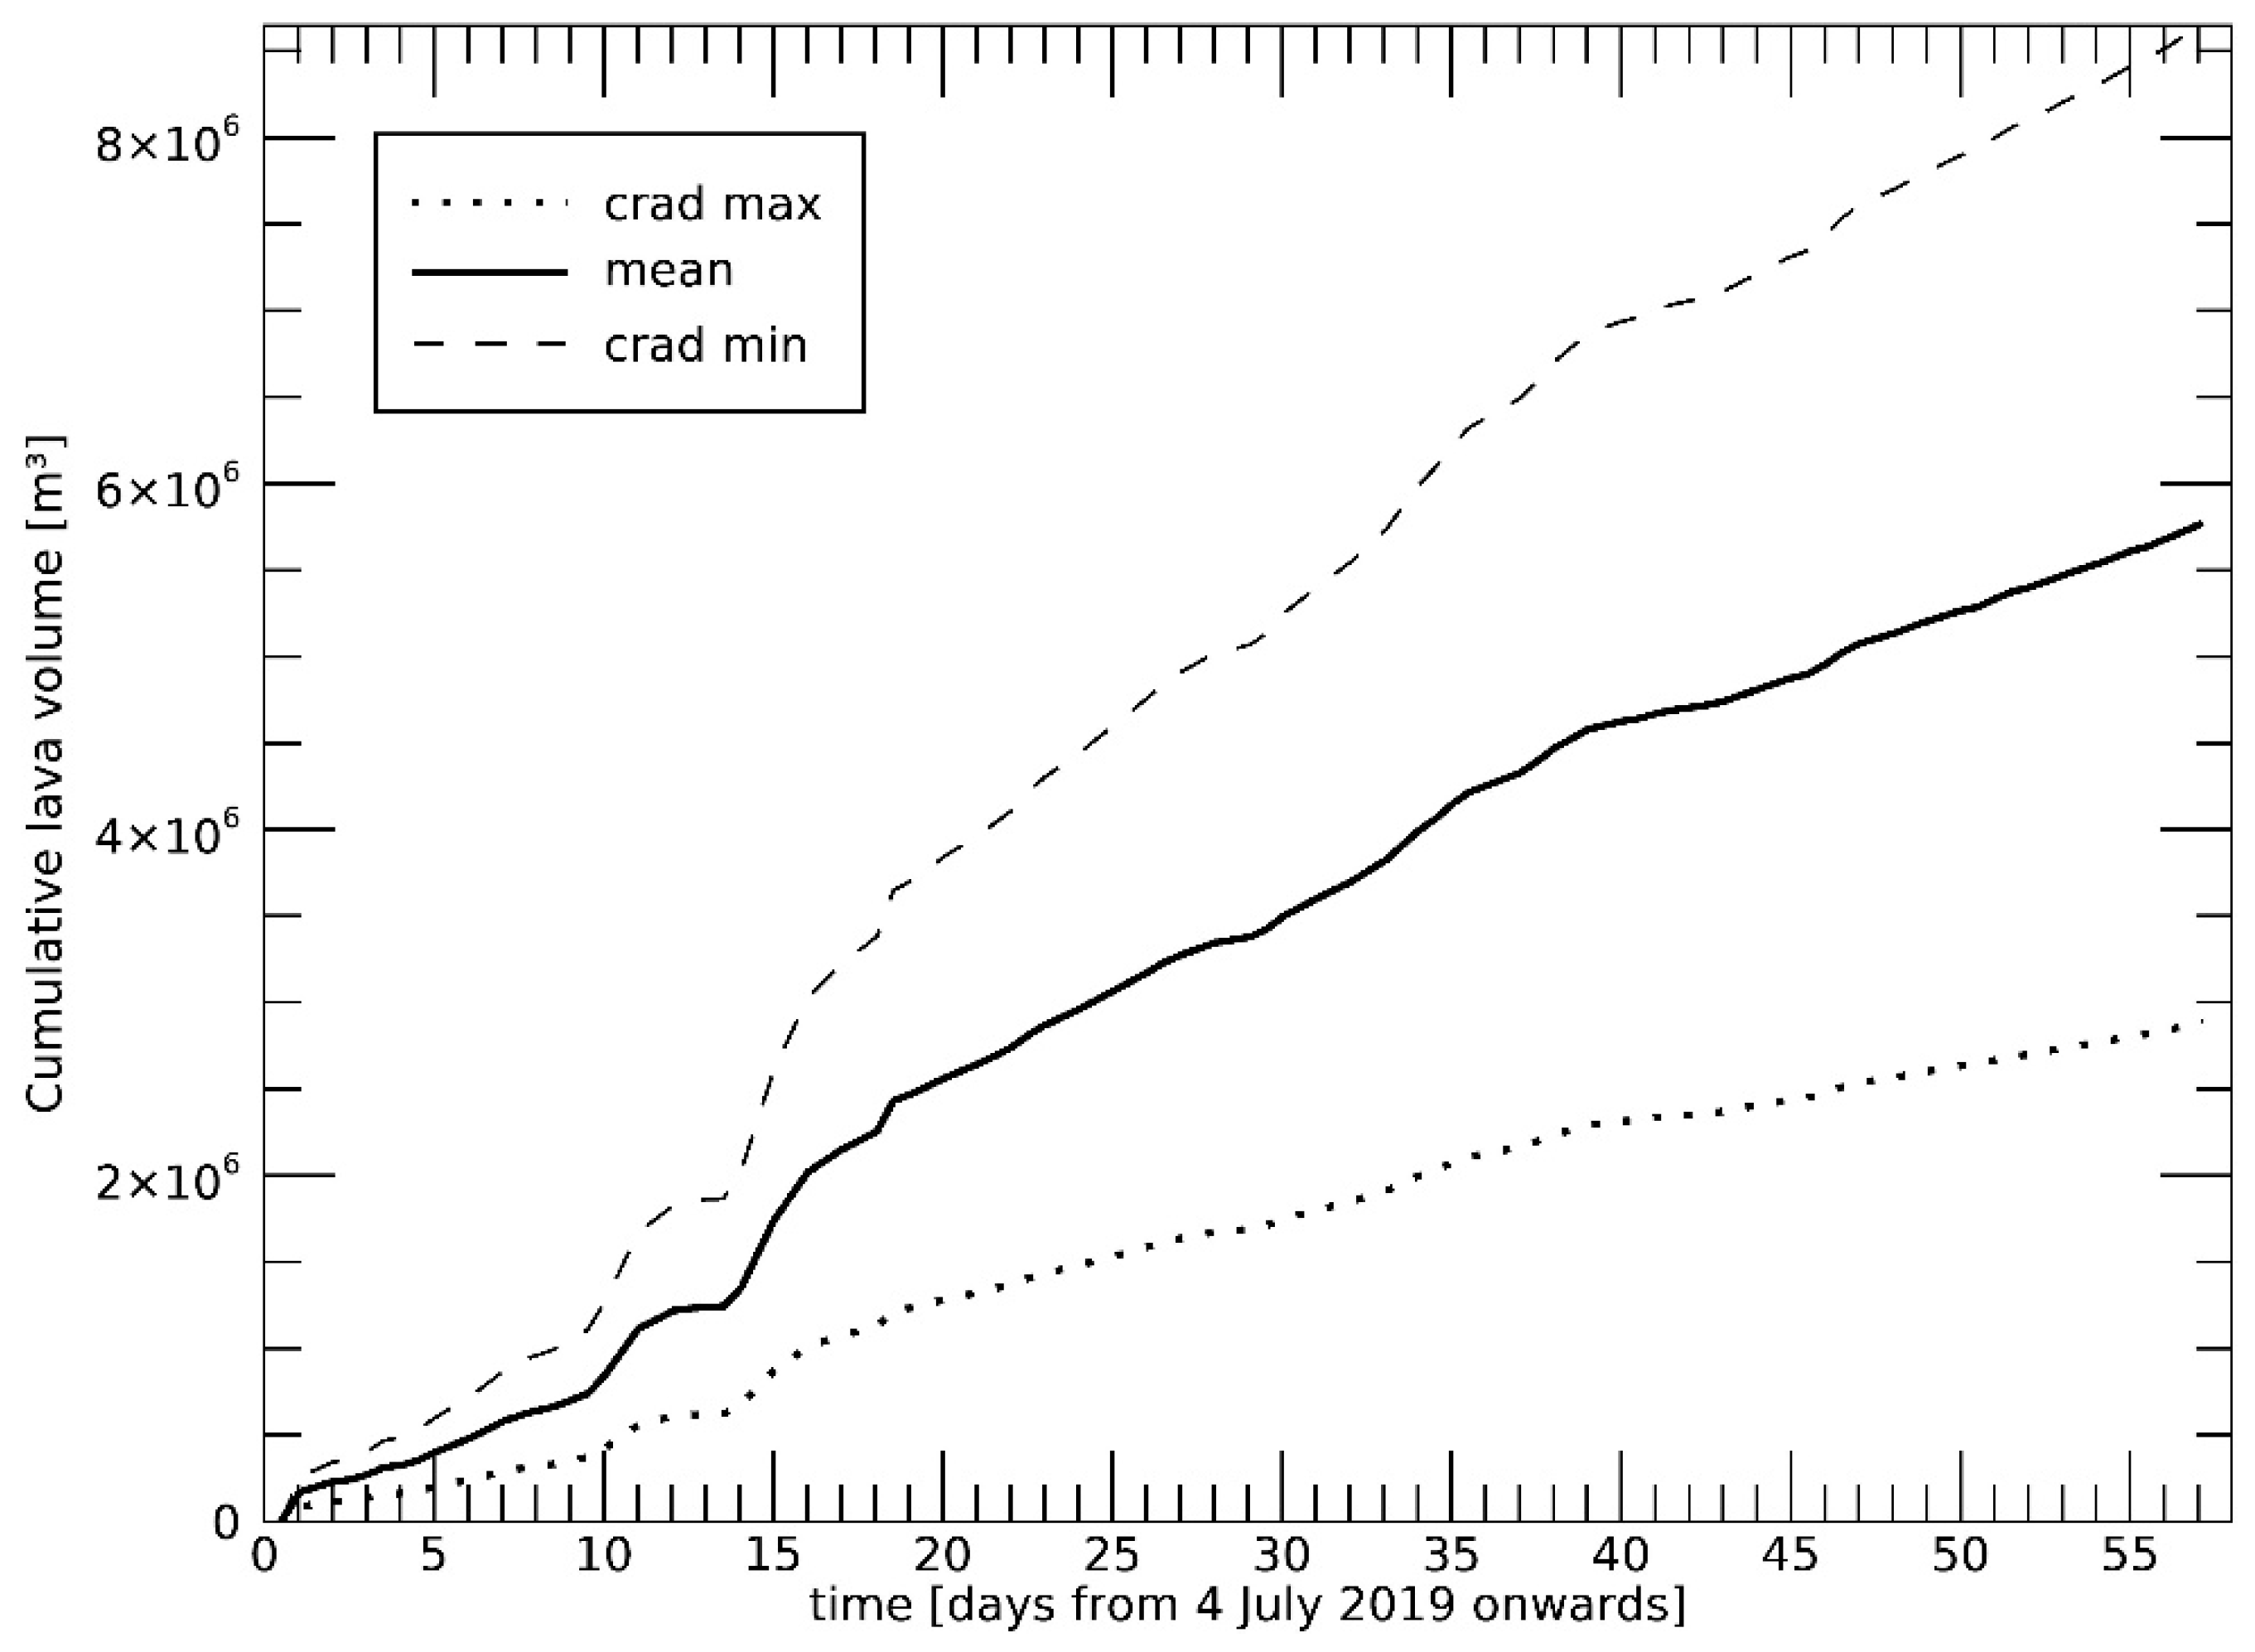
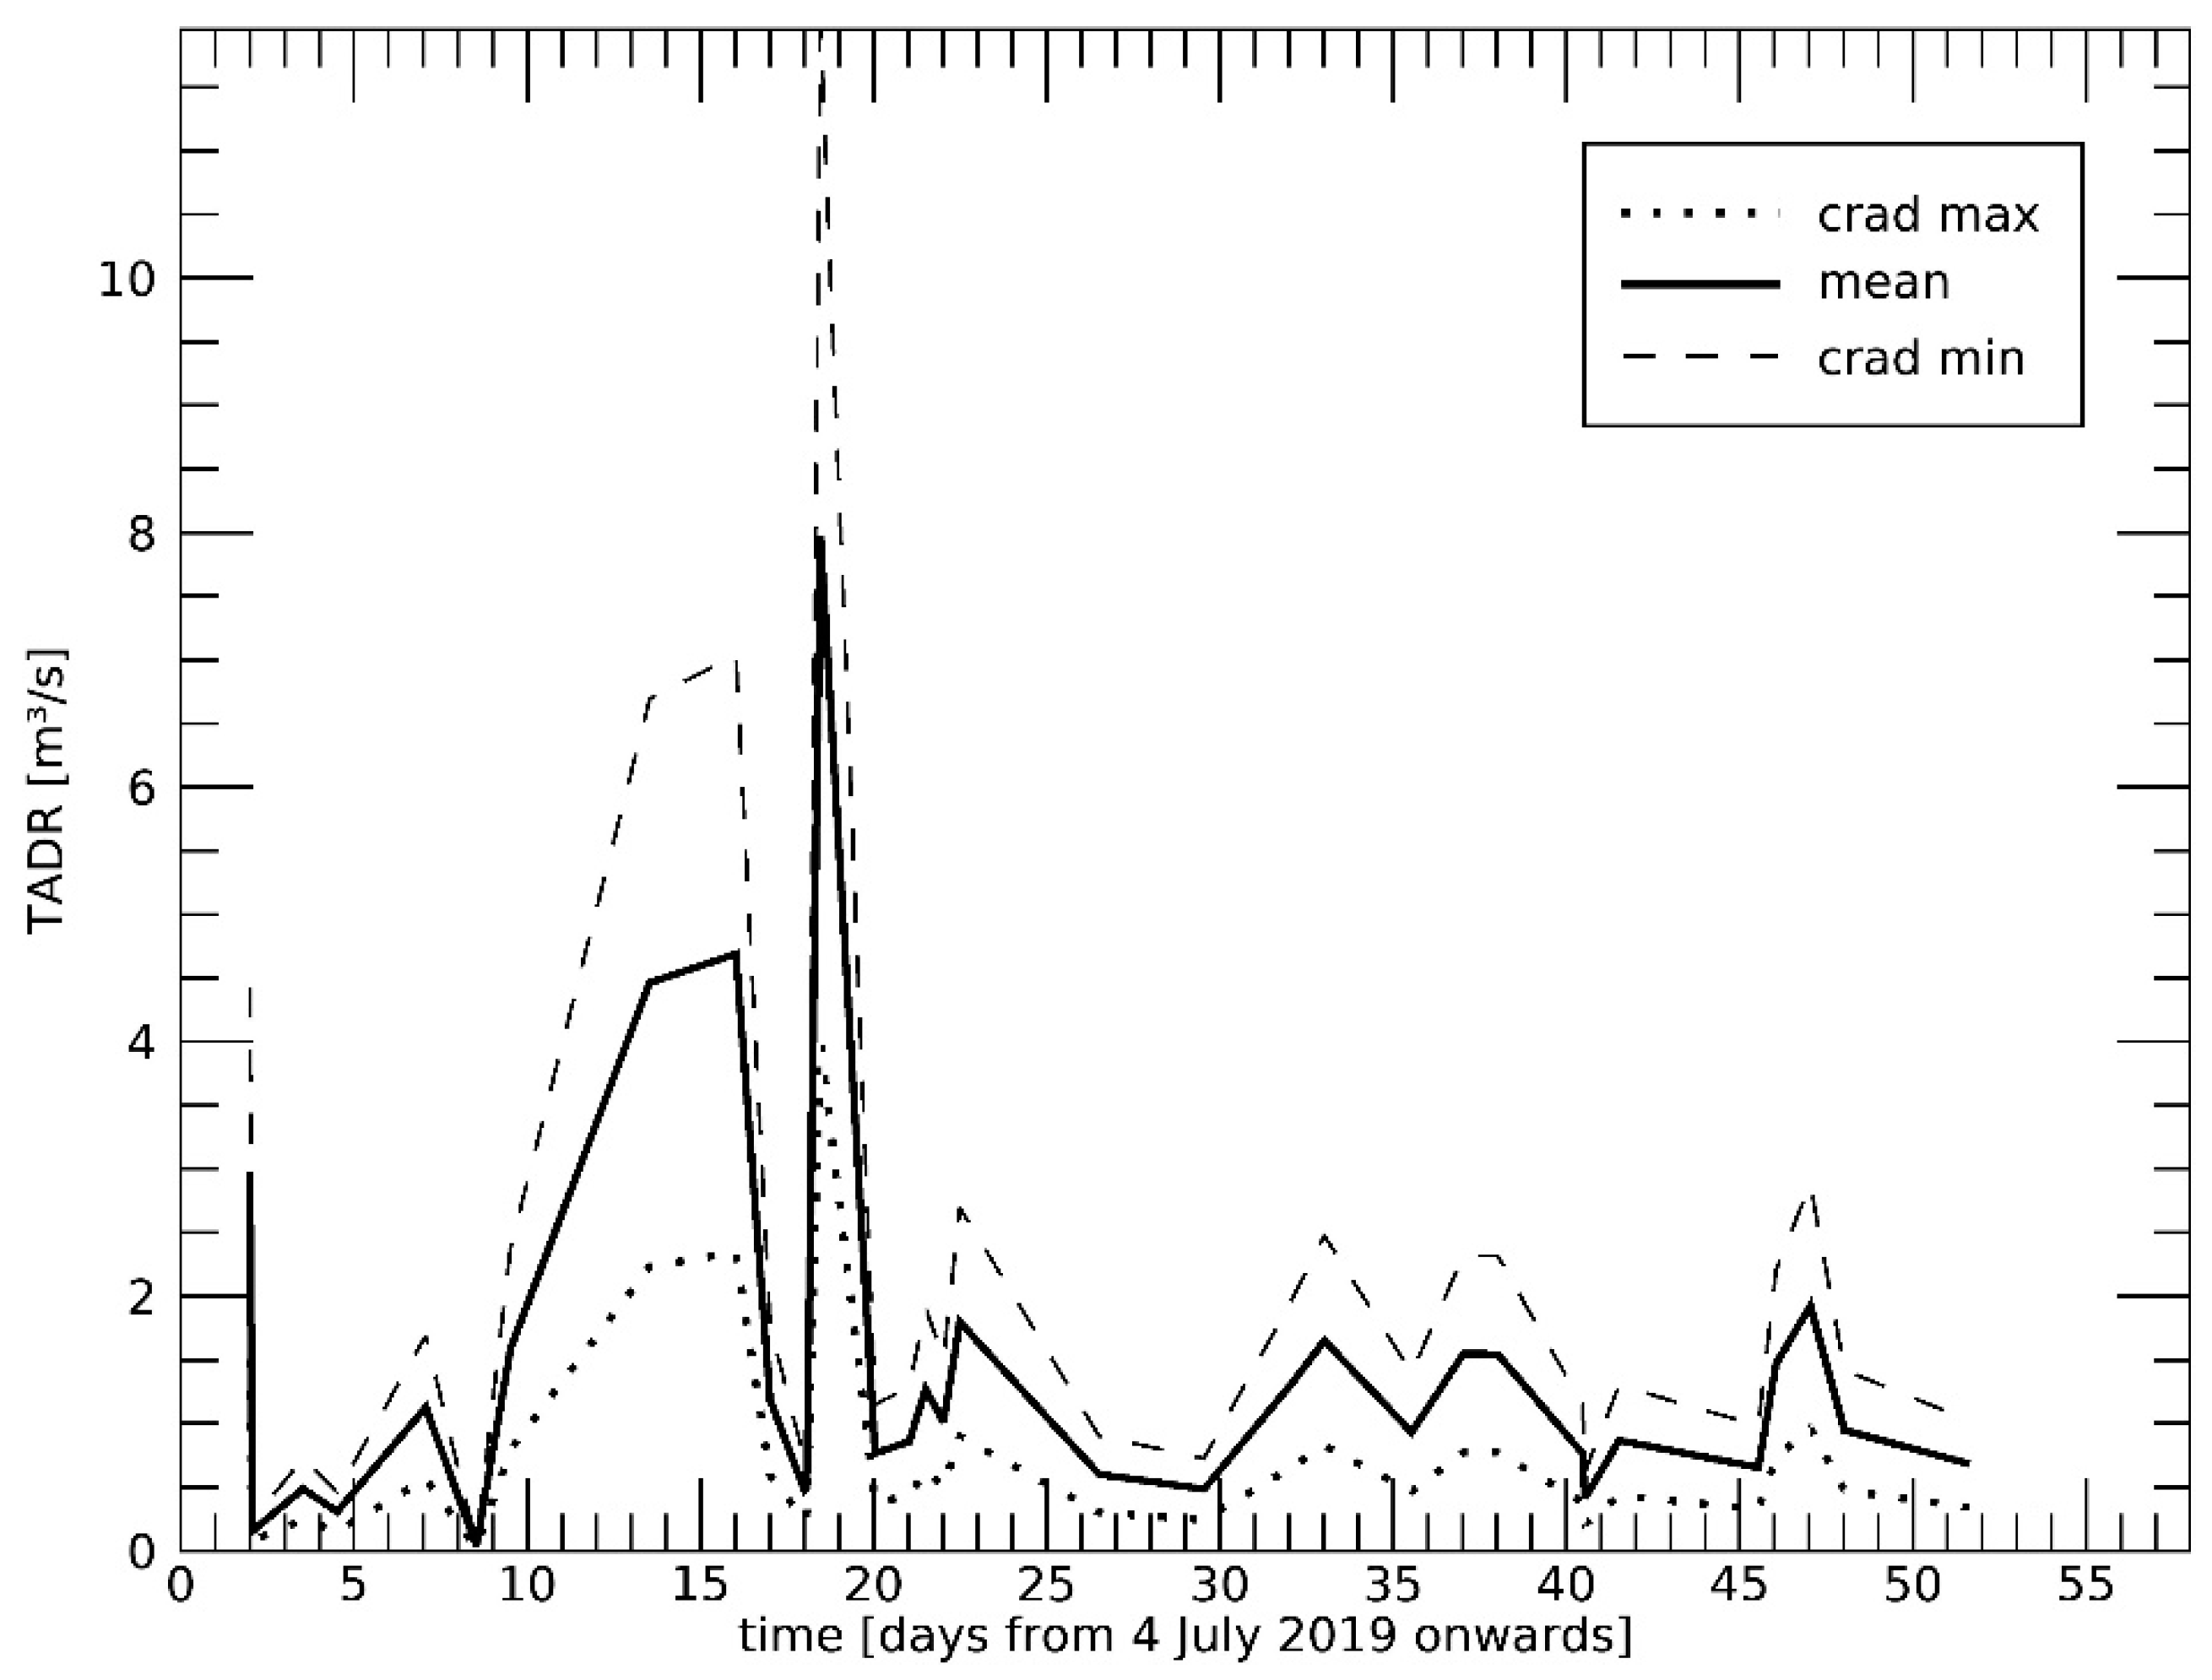
| Scenario | Number of Useful VIIRS Acquisitions | Number of Valid Hotspots | Maximum TADR Measurement [m3/s] | Day and Time [UTC] of Max. TADR Measurement | Cumulative Lava Volume [m3] | Mean Lava Output Rate [m3/s] Over 58 Days |
|---|---|---|---|---|---|---|
| I | 108 | 593 | 8.03 ± 4.02 | 22 July 2019 at 01:36 | 1.15 ± 0.57 | |
| II | 88 | 481 | 8.03 ± 4.02 | 22 July 2019 at 01:36 | 1.14 ± 0.57 | |
| III | 81 | 467 | 8.03 ± 4.02 | 22 July 2019 at 01:36 | 1.17 ± 0.58 | |
| IV | 33 | 165 | 8.03 ± 4.02 | 22 July 2019 at 01:36 | 1.26 ± 0.63 | |
| V | 17 | 45 | 4.72 ± 2.36 | 22 July 2019 at 11:18 | 1.28 ± 0.64 |
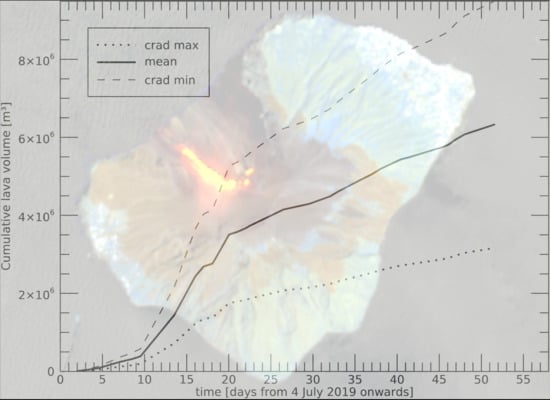
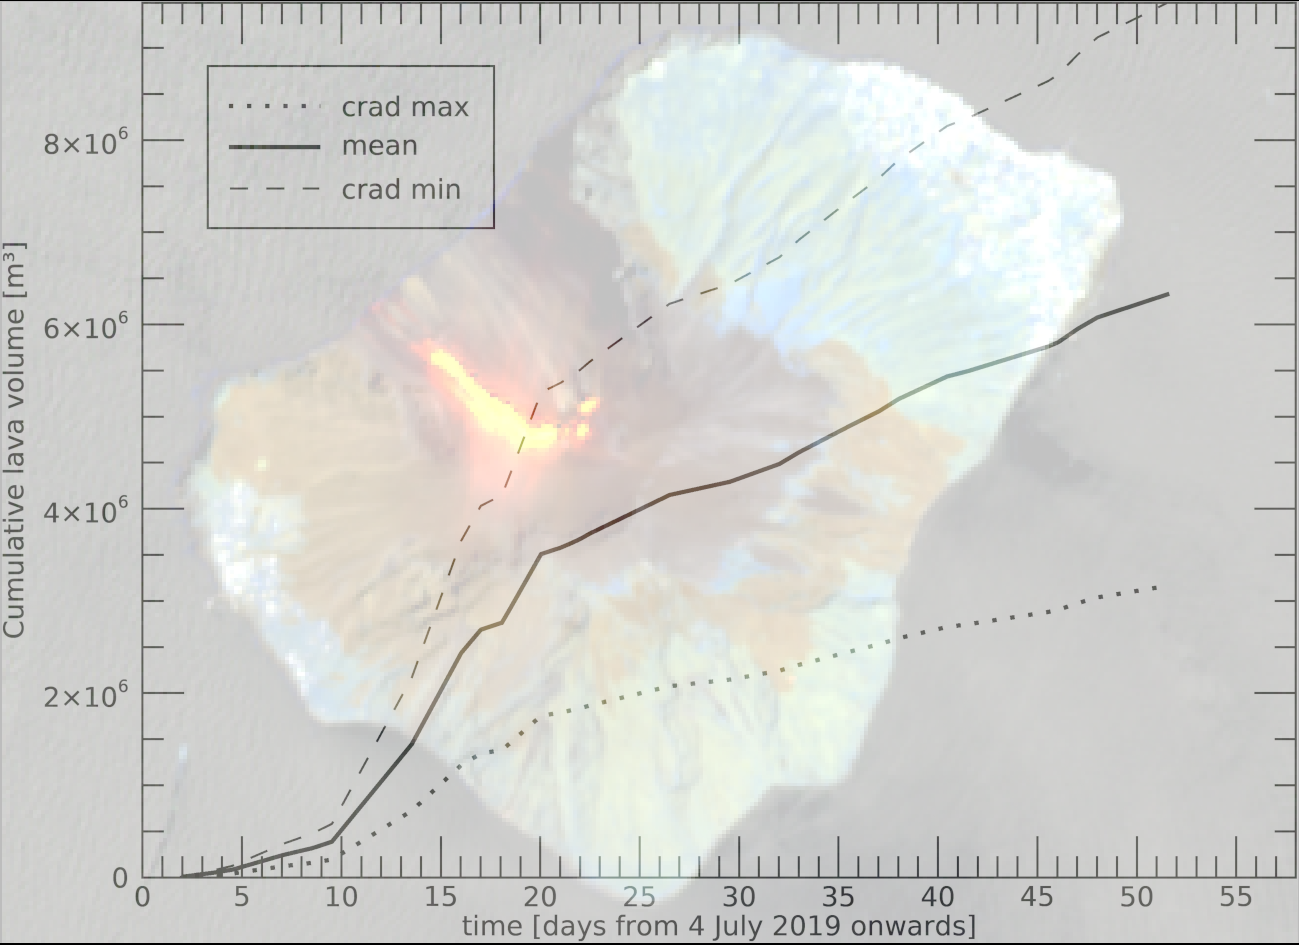
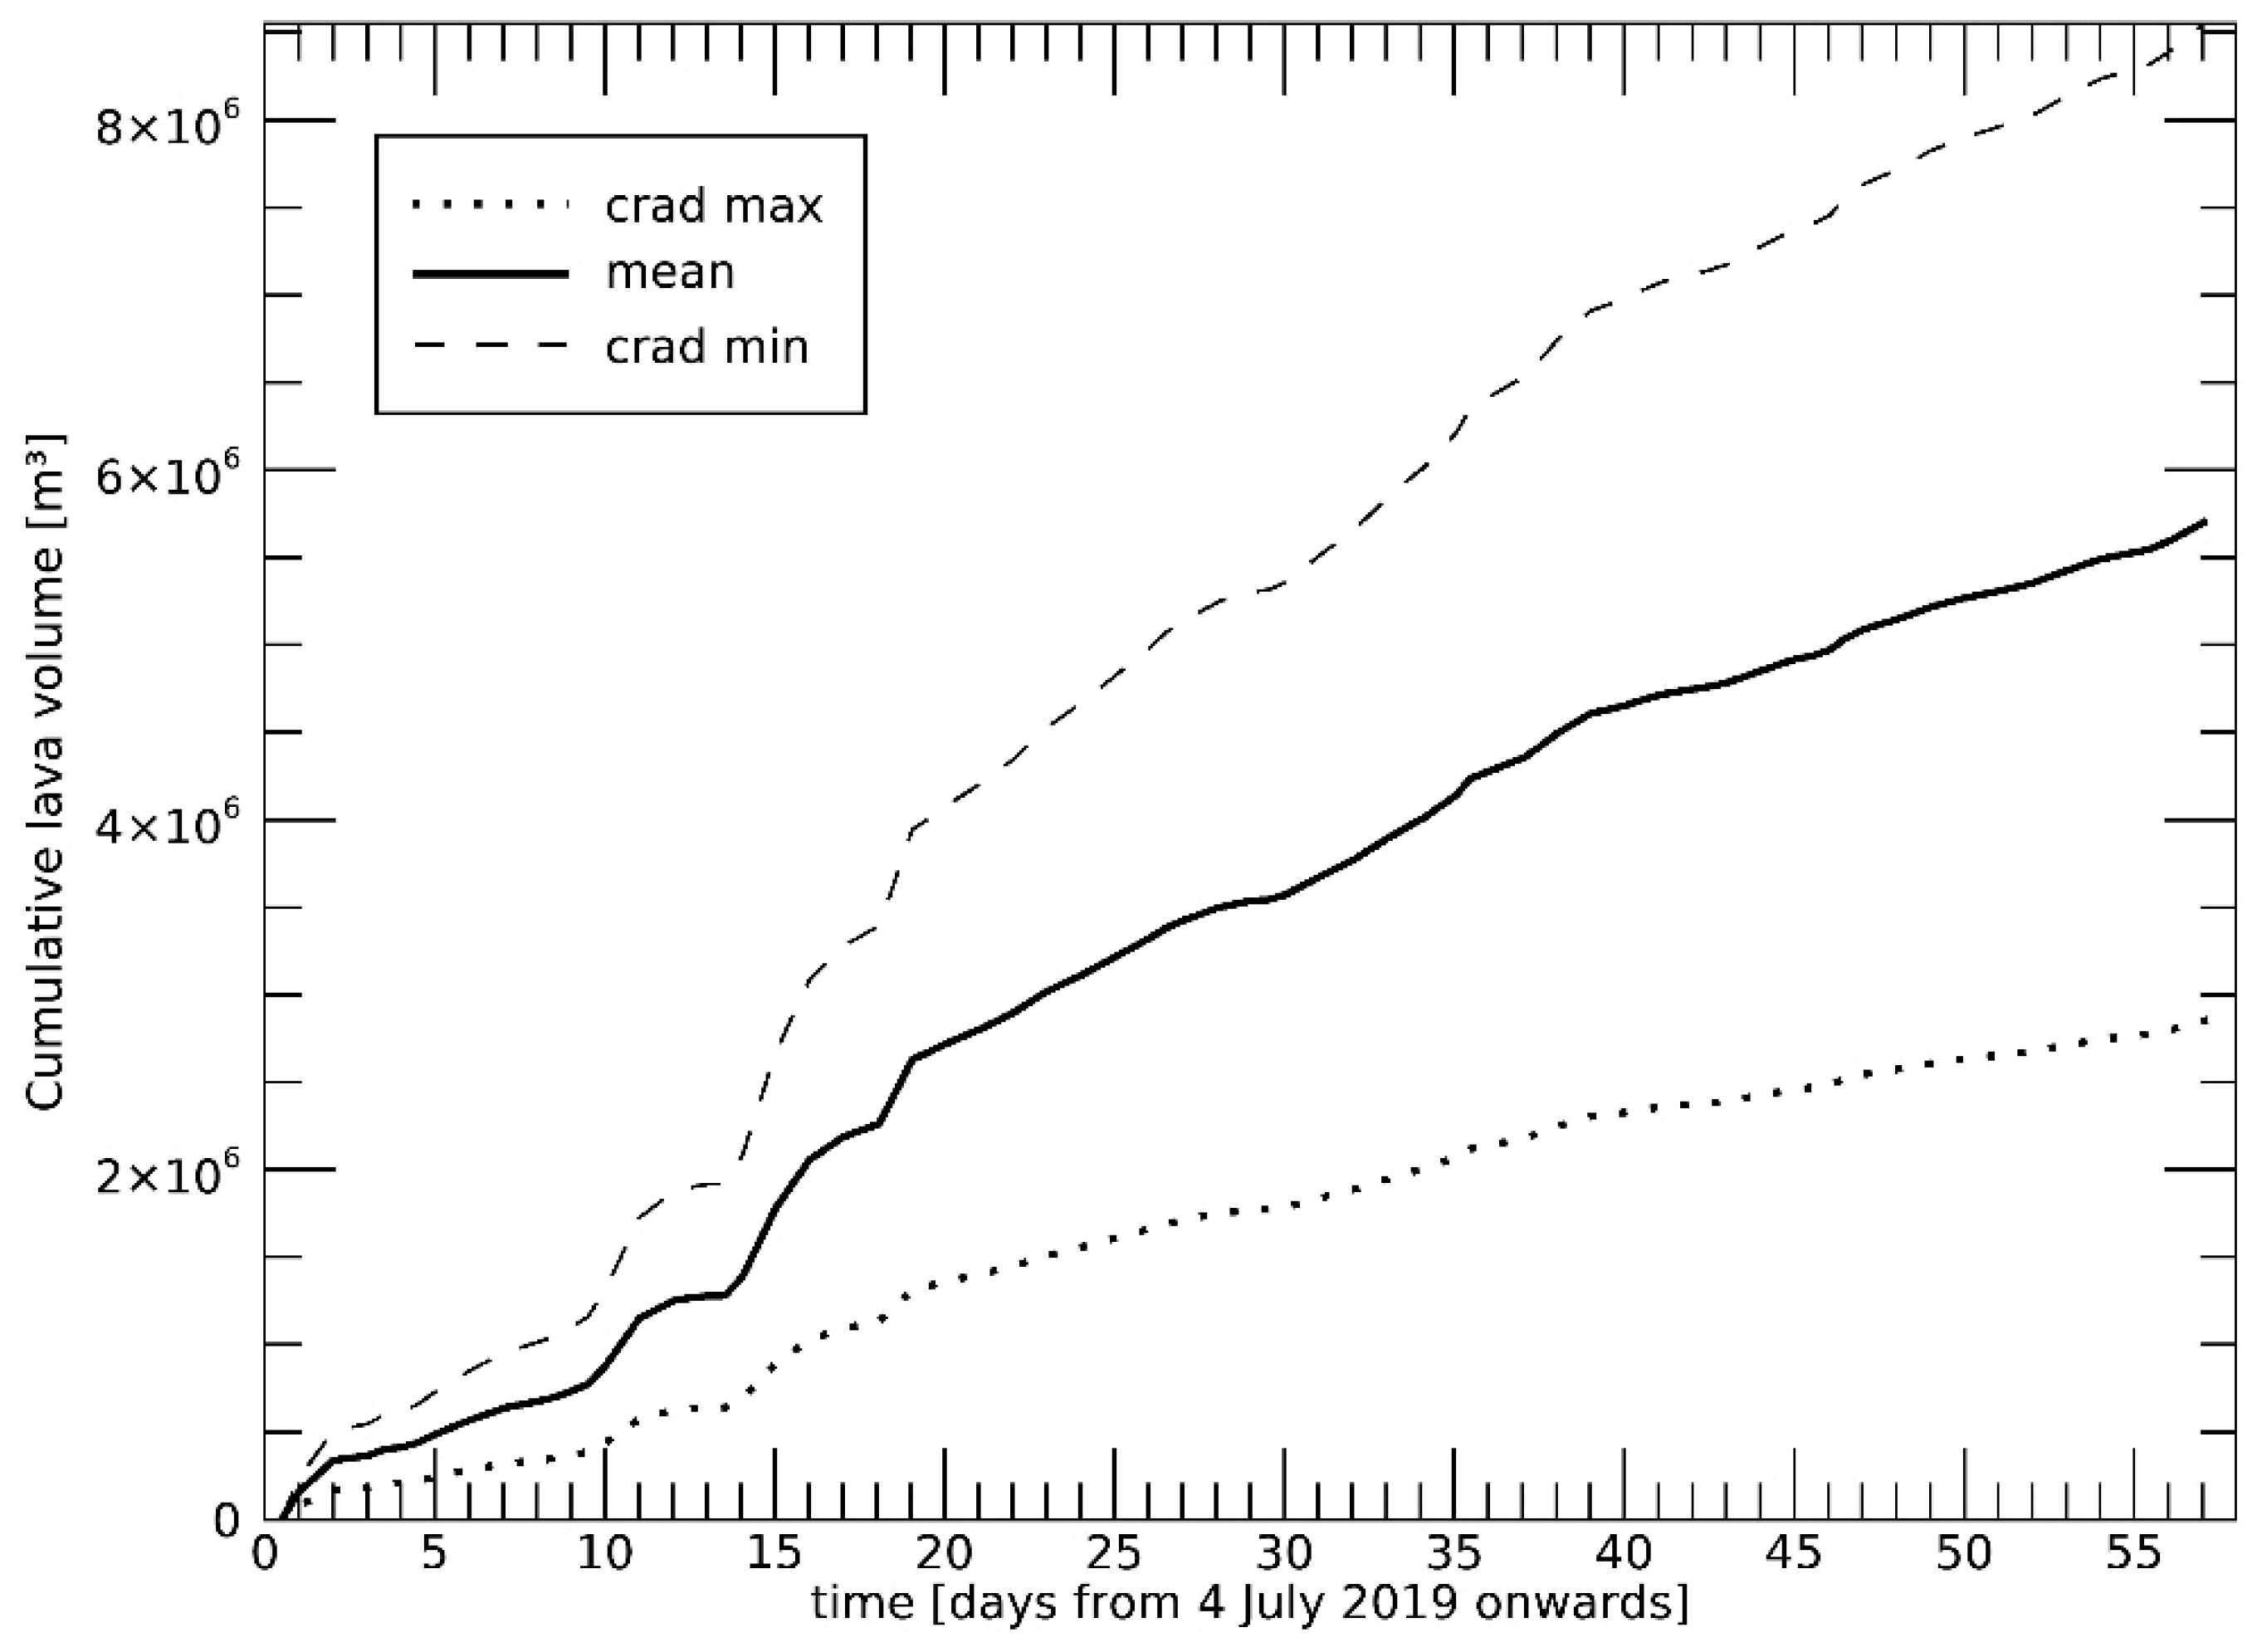
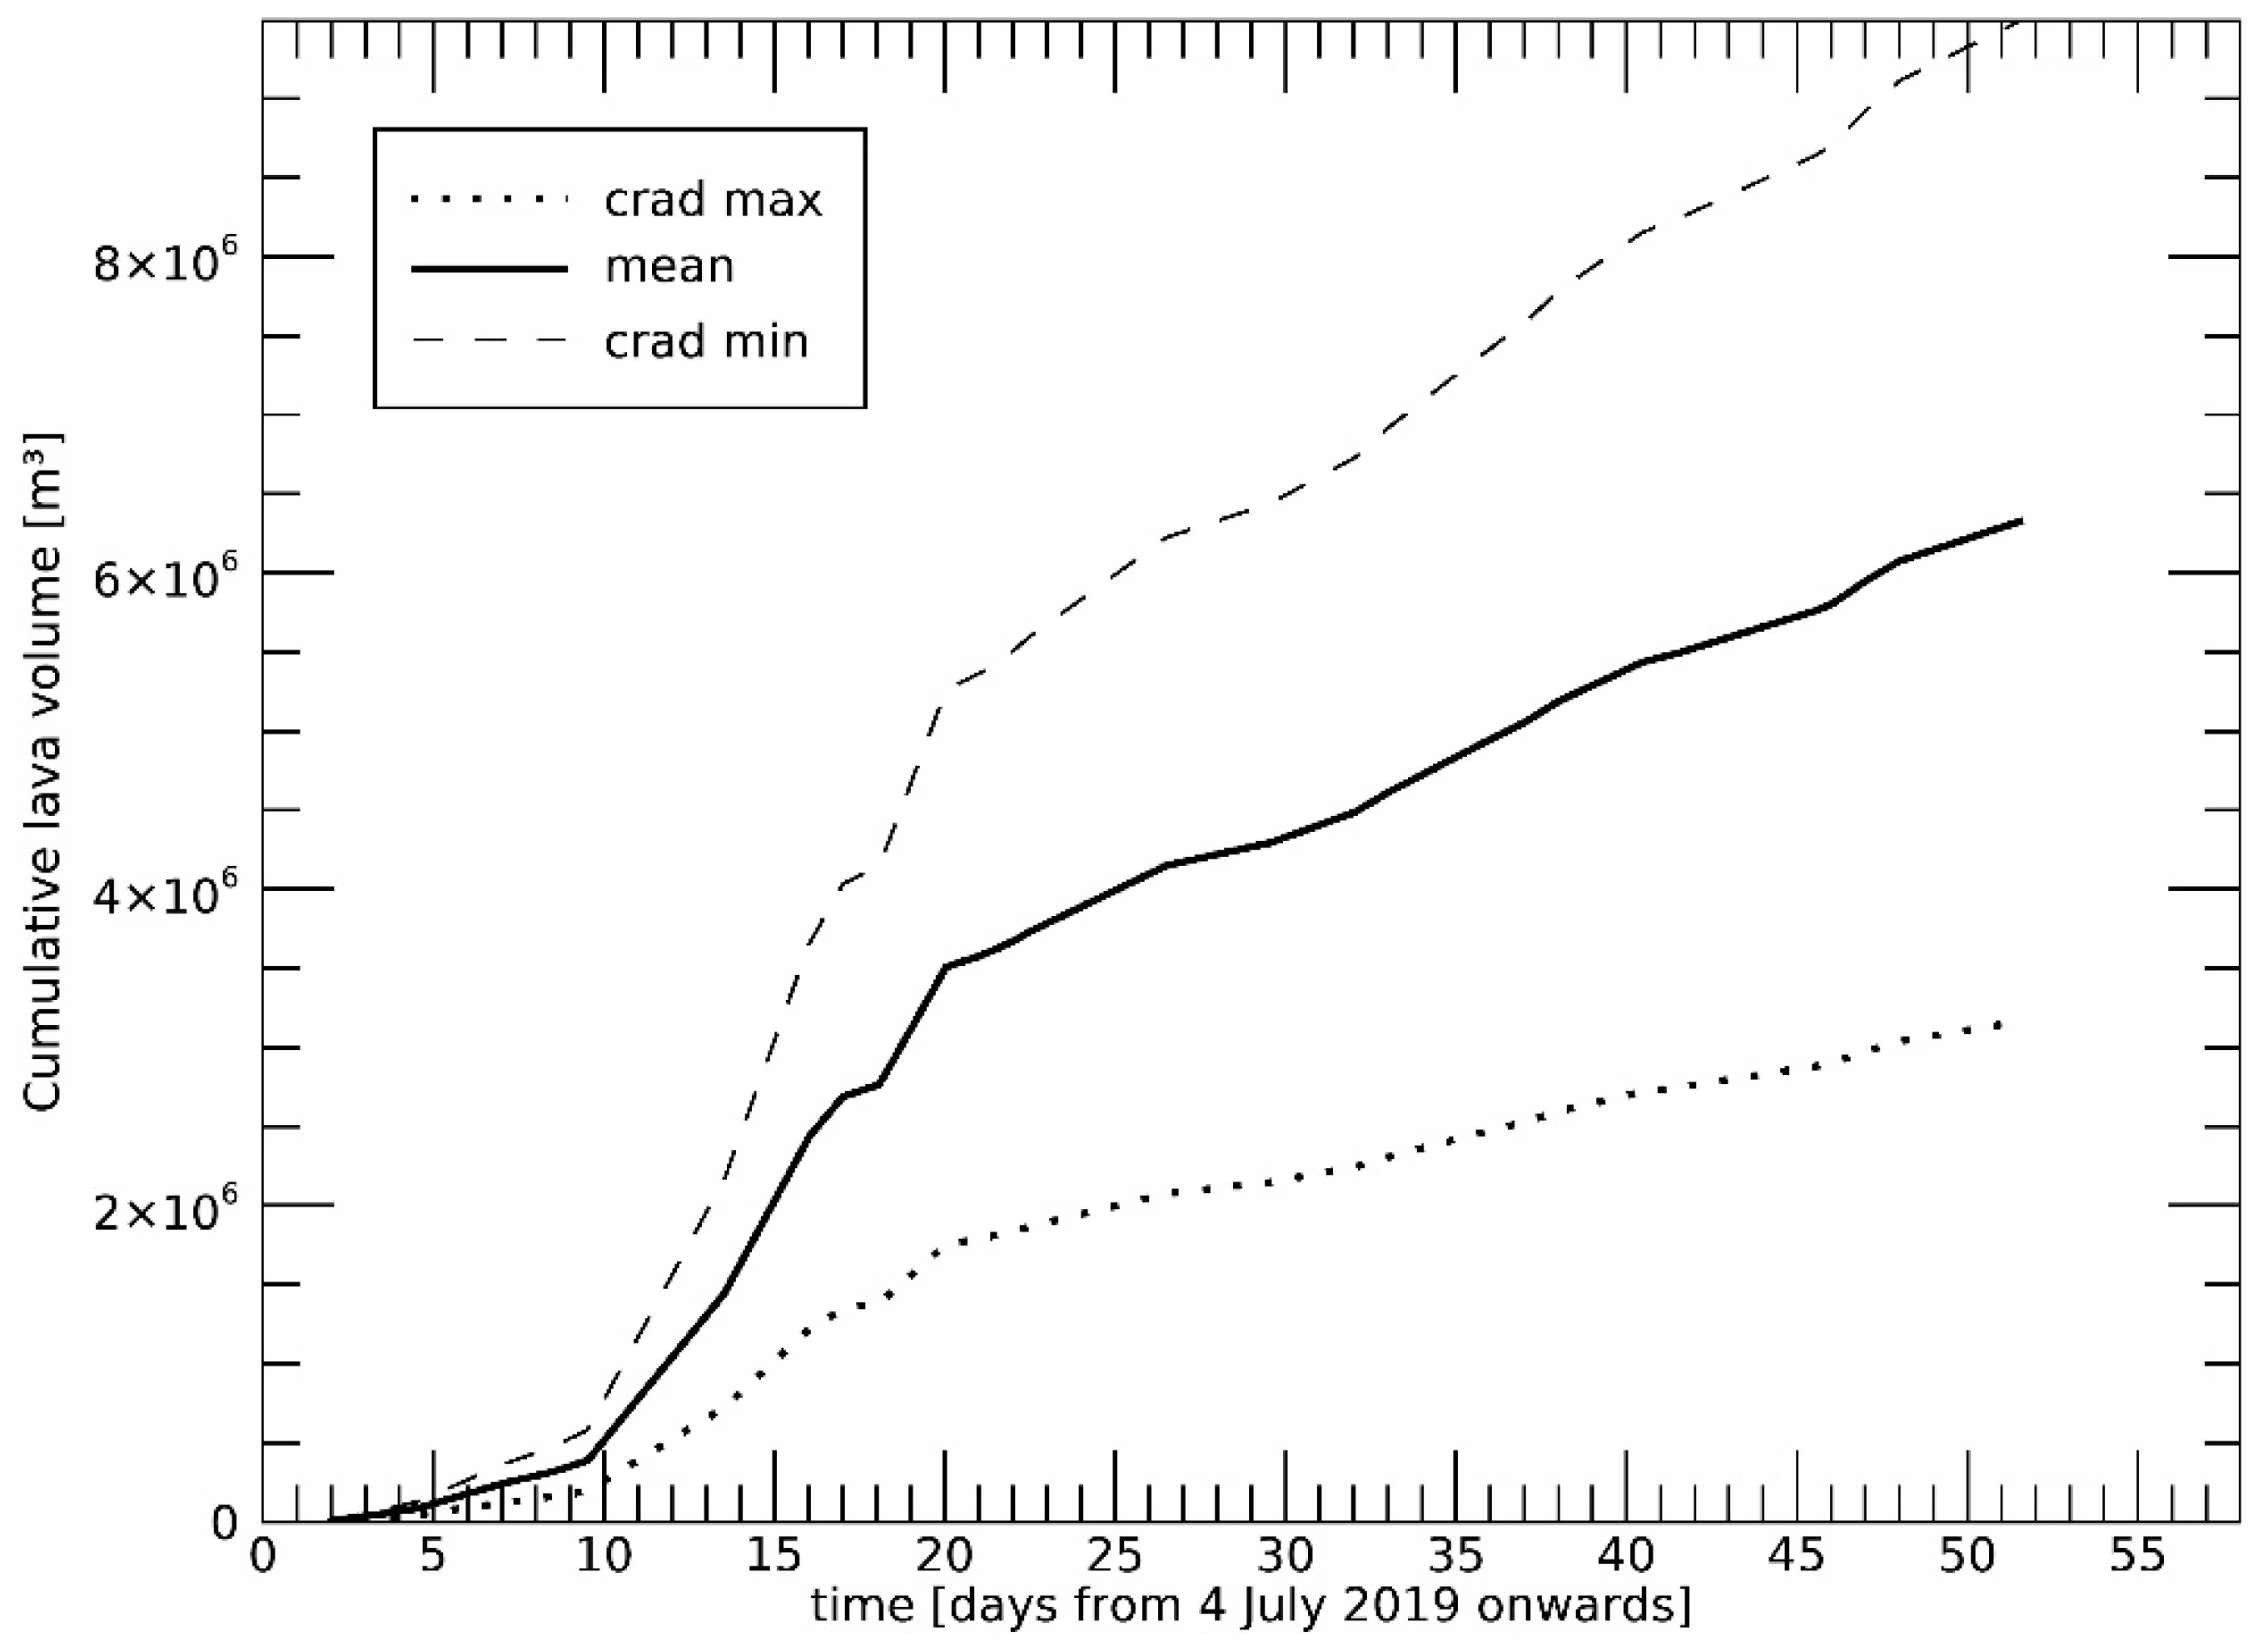
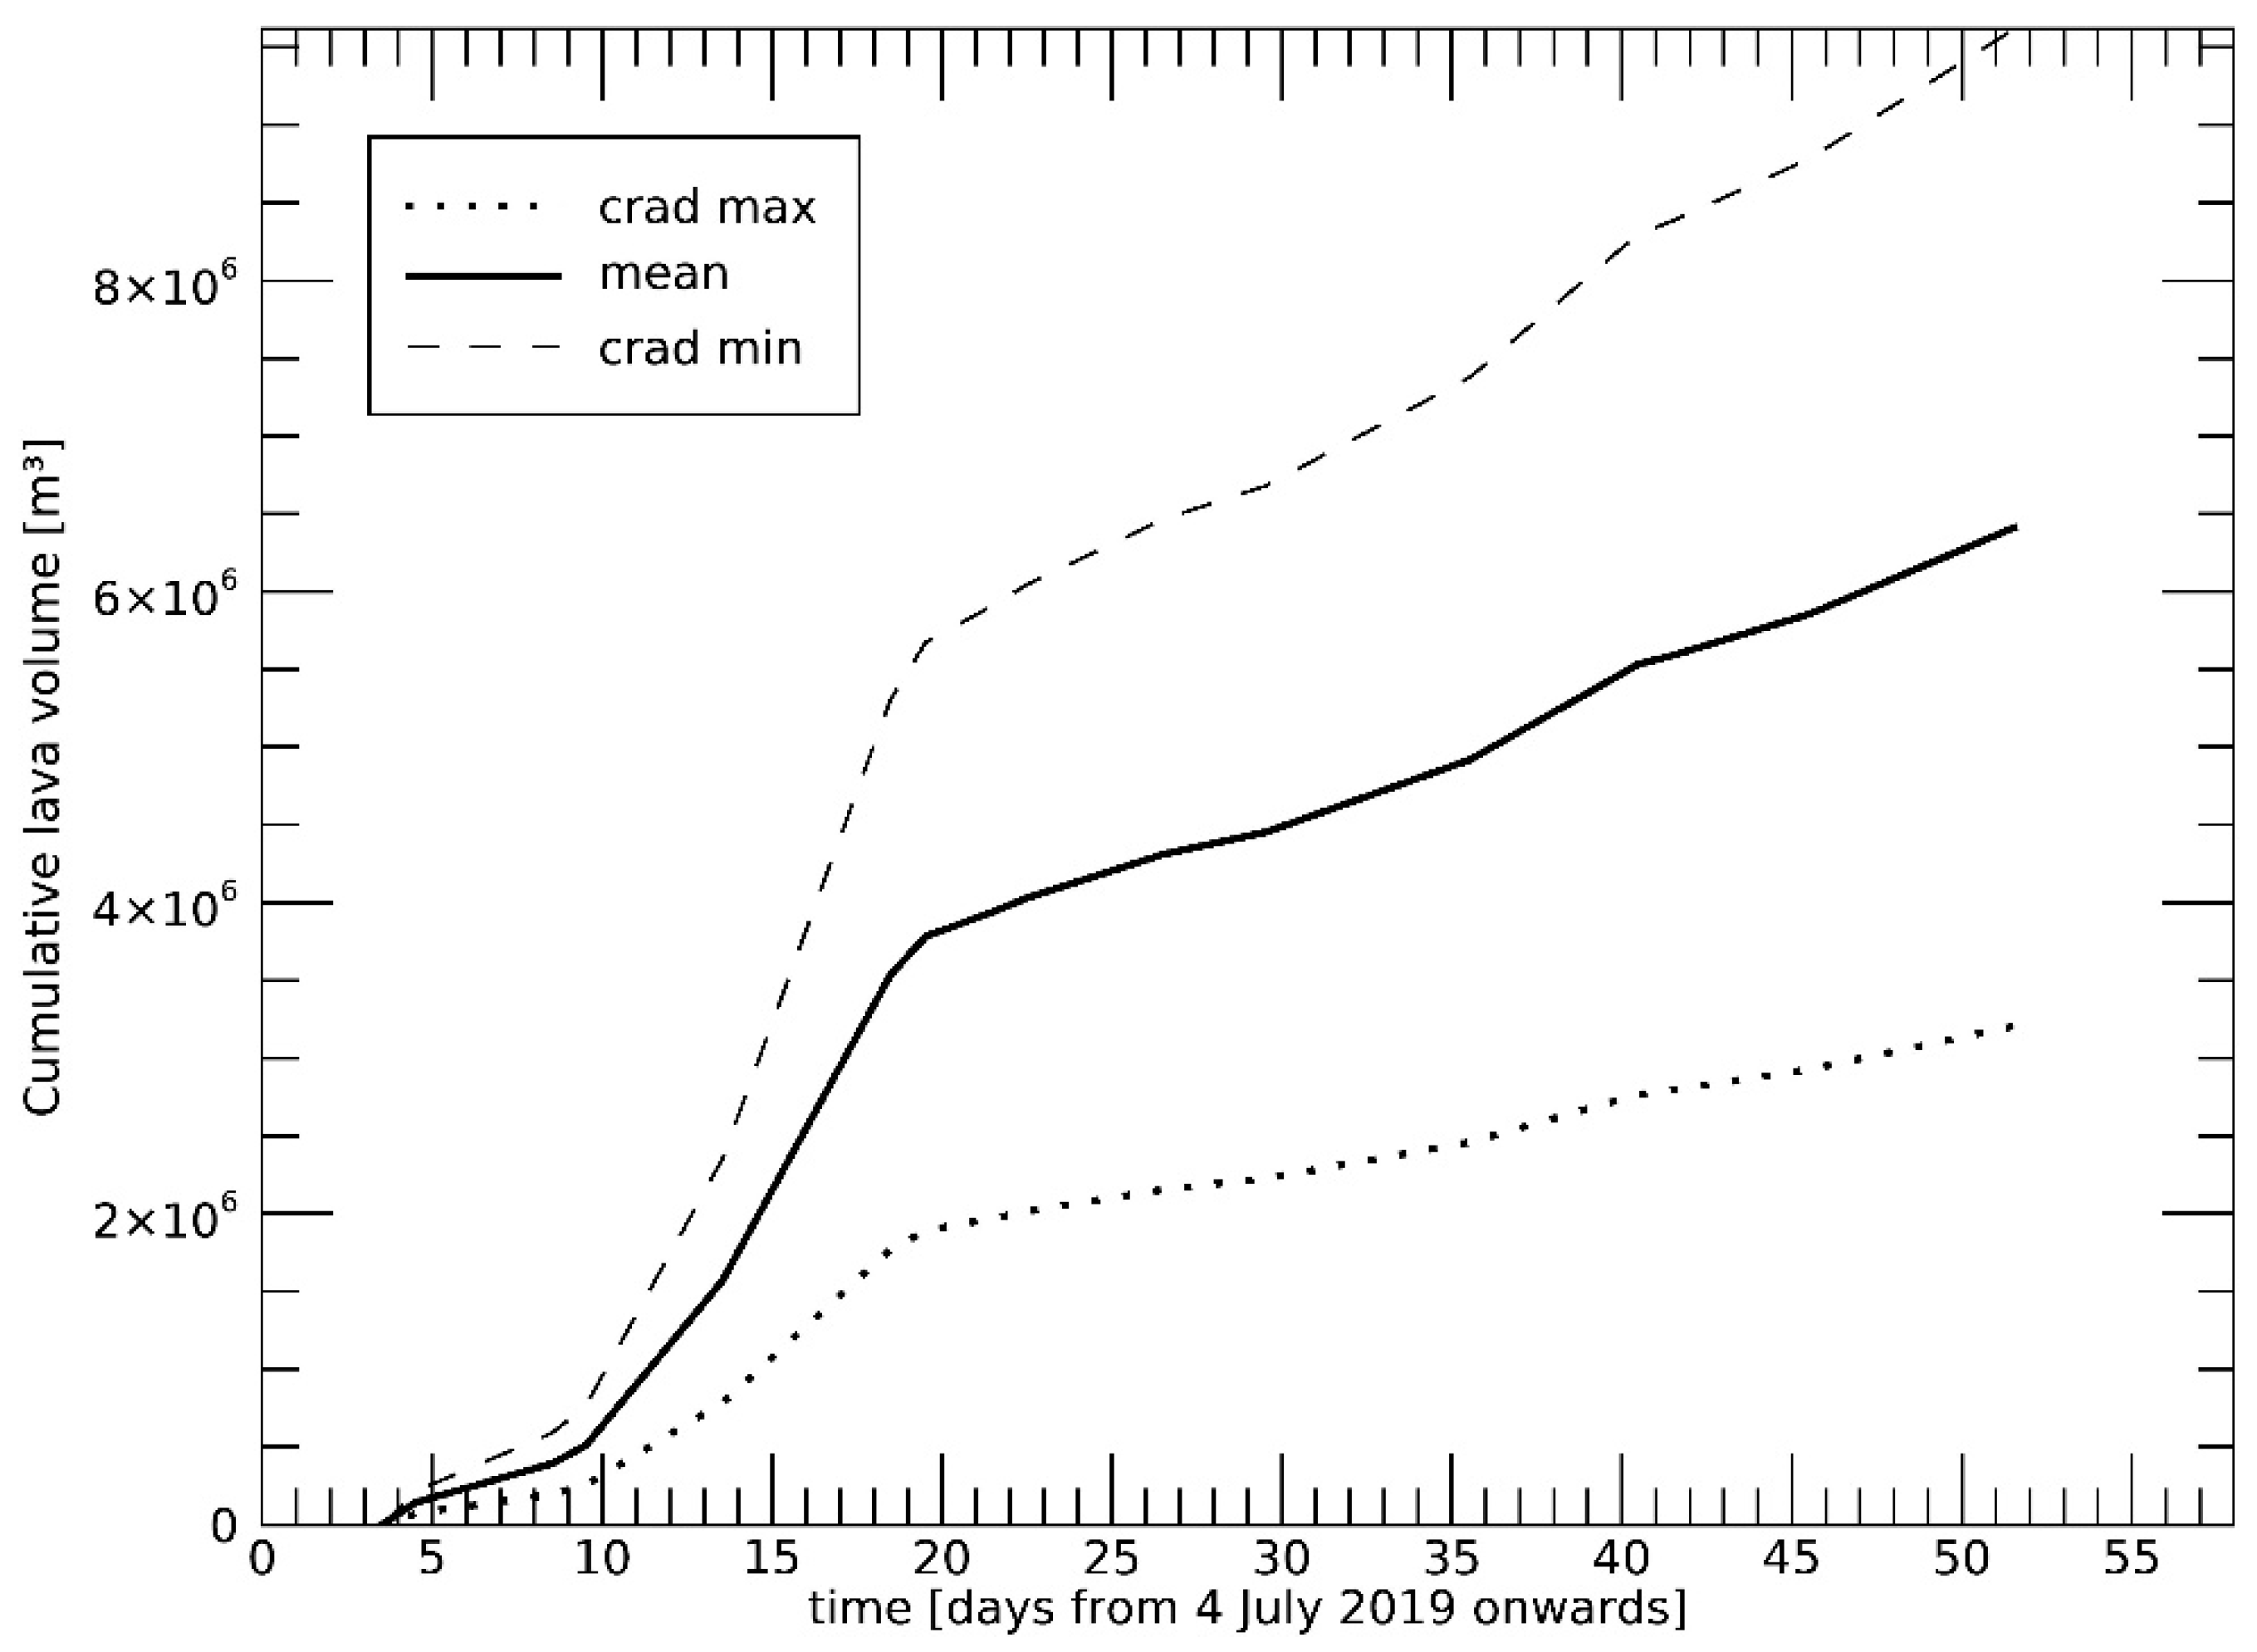
| Silica Content XSiO2 [wt%] | crad | Cumulative Lava Volume [m3] | Mean Lava Output Rate [m3/s] Over 58 Days | |
|---|---|---|---|---|
| 49.12 | 1.25 ± 0.63 | |||
| 49.155 | 1.26 ± 0.63 | |||
| 49.19 | 1.27 ± 0.64 |
© 2019 by the authors. Licensee MDPI, Basel, Switzerland. This article is an open access article distributed under the terms and conditions of the Creative Commons Attribution (CC BY) license (http://creativecommons.org/licenses/by/4.0/).
Share and Cite
Plank, S.; Marchese, F.; Filizzola, C.; Pergola, N.; Neri, M.; Nolde, M.; Martinis, S. The July/August 2019 Lava Flows at the Sciara del Fuoco, Stromboli–Analysis from Multi-Sensor Infrared Satellite Imagery. Remote Sens. 2019, 11, 2879. https://doi.org/10.3390/rs11232879
Plank S, Marchese F, Filizzola C, Pergola N, Neri M, Nolde M, Martinis S. The July/August 2019 Lava Flows at the Sciara del Fuoco, Stromboli–Analysis from Multi-Sensor Infrared Satellite Imagery. Remote Sensing. 2019; 11(23):2879. https://doi.org/10.3390/rs11232879
Chicago/Turabian StylePlank, Simon, Francesco Marchese, Carolina Filizzola, Nicola Pergola, Marco Neri, Michael Nolde, and Sandro Martinis. 2019. "The July/August 2019 Lava Flows at the Sciara del Fuoco, Stromboli–Analysis from Multi-Sensor Infrared Satellite Imagery" Remote Sensing 11, no. 23: 2879. https://doi.org/10.3390/rs11232879
APA StylePlank, S., Marchese, F., Filizzola, C., Pergola, N., Neri, M., Nolde, M., & Martinis, S. (2019). The July/August 2019 Lava Flows at the Sciara del Fuoco, Stromboli–Analysis from Multi-Sensor Infrared Satellite Imagery. Remote Sensing, 11(23), 2879. https://doi.org/10.3390/rs11232879