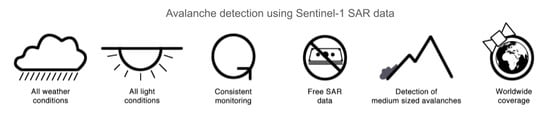
Near-Real Time Automatic Snow Avalanche Activity Monitoring System Using Sentinel-1 SAR Data in Norway


Abstract
:
1. Introduction
2. Avalanche Activity Monitoring System: Specifications, Data and Workflow
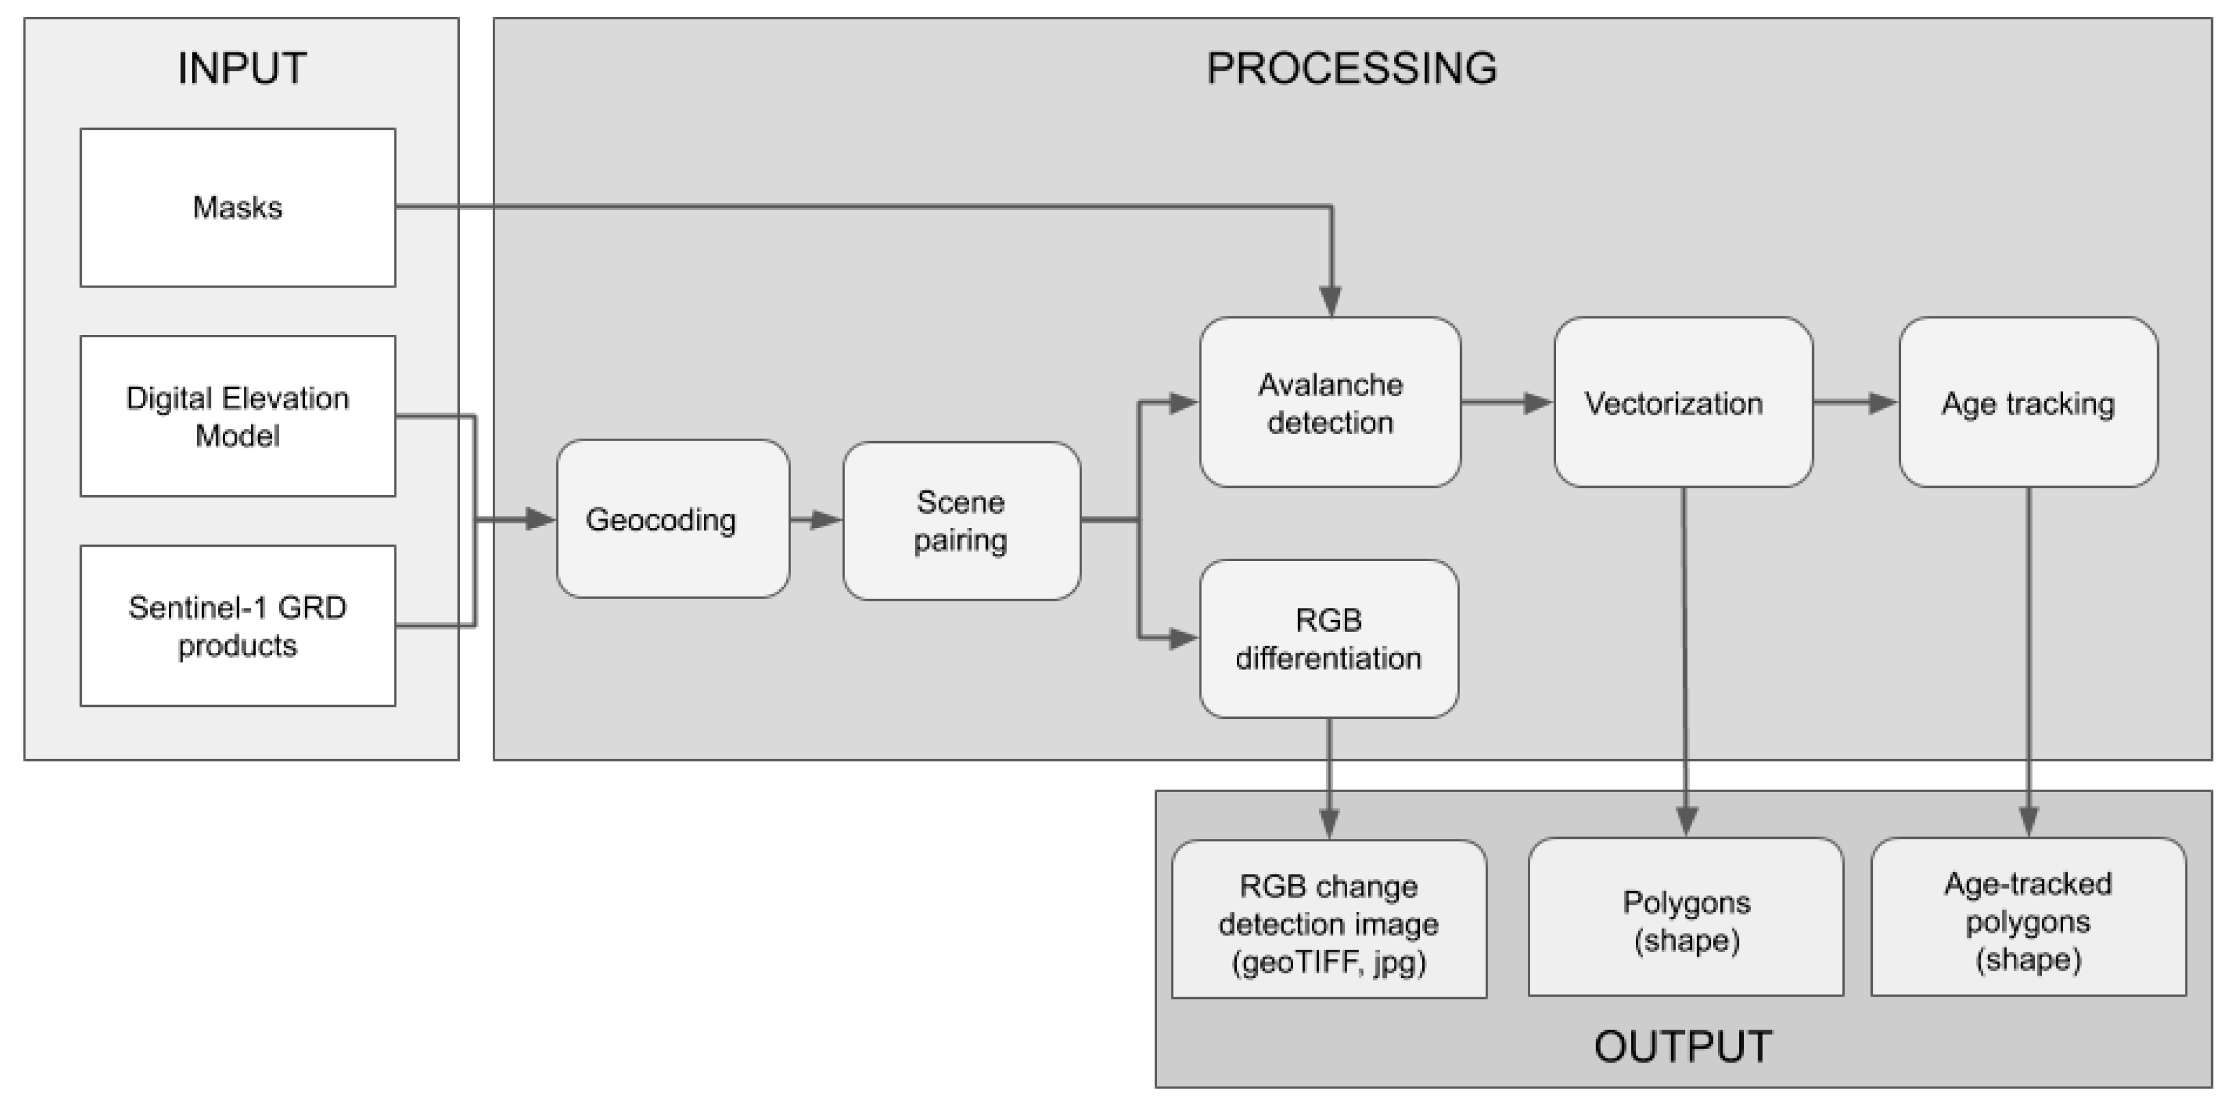
2.1. Input
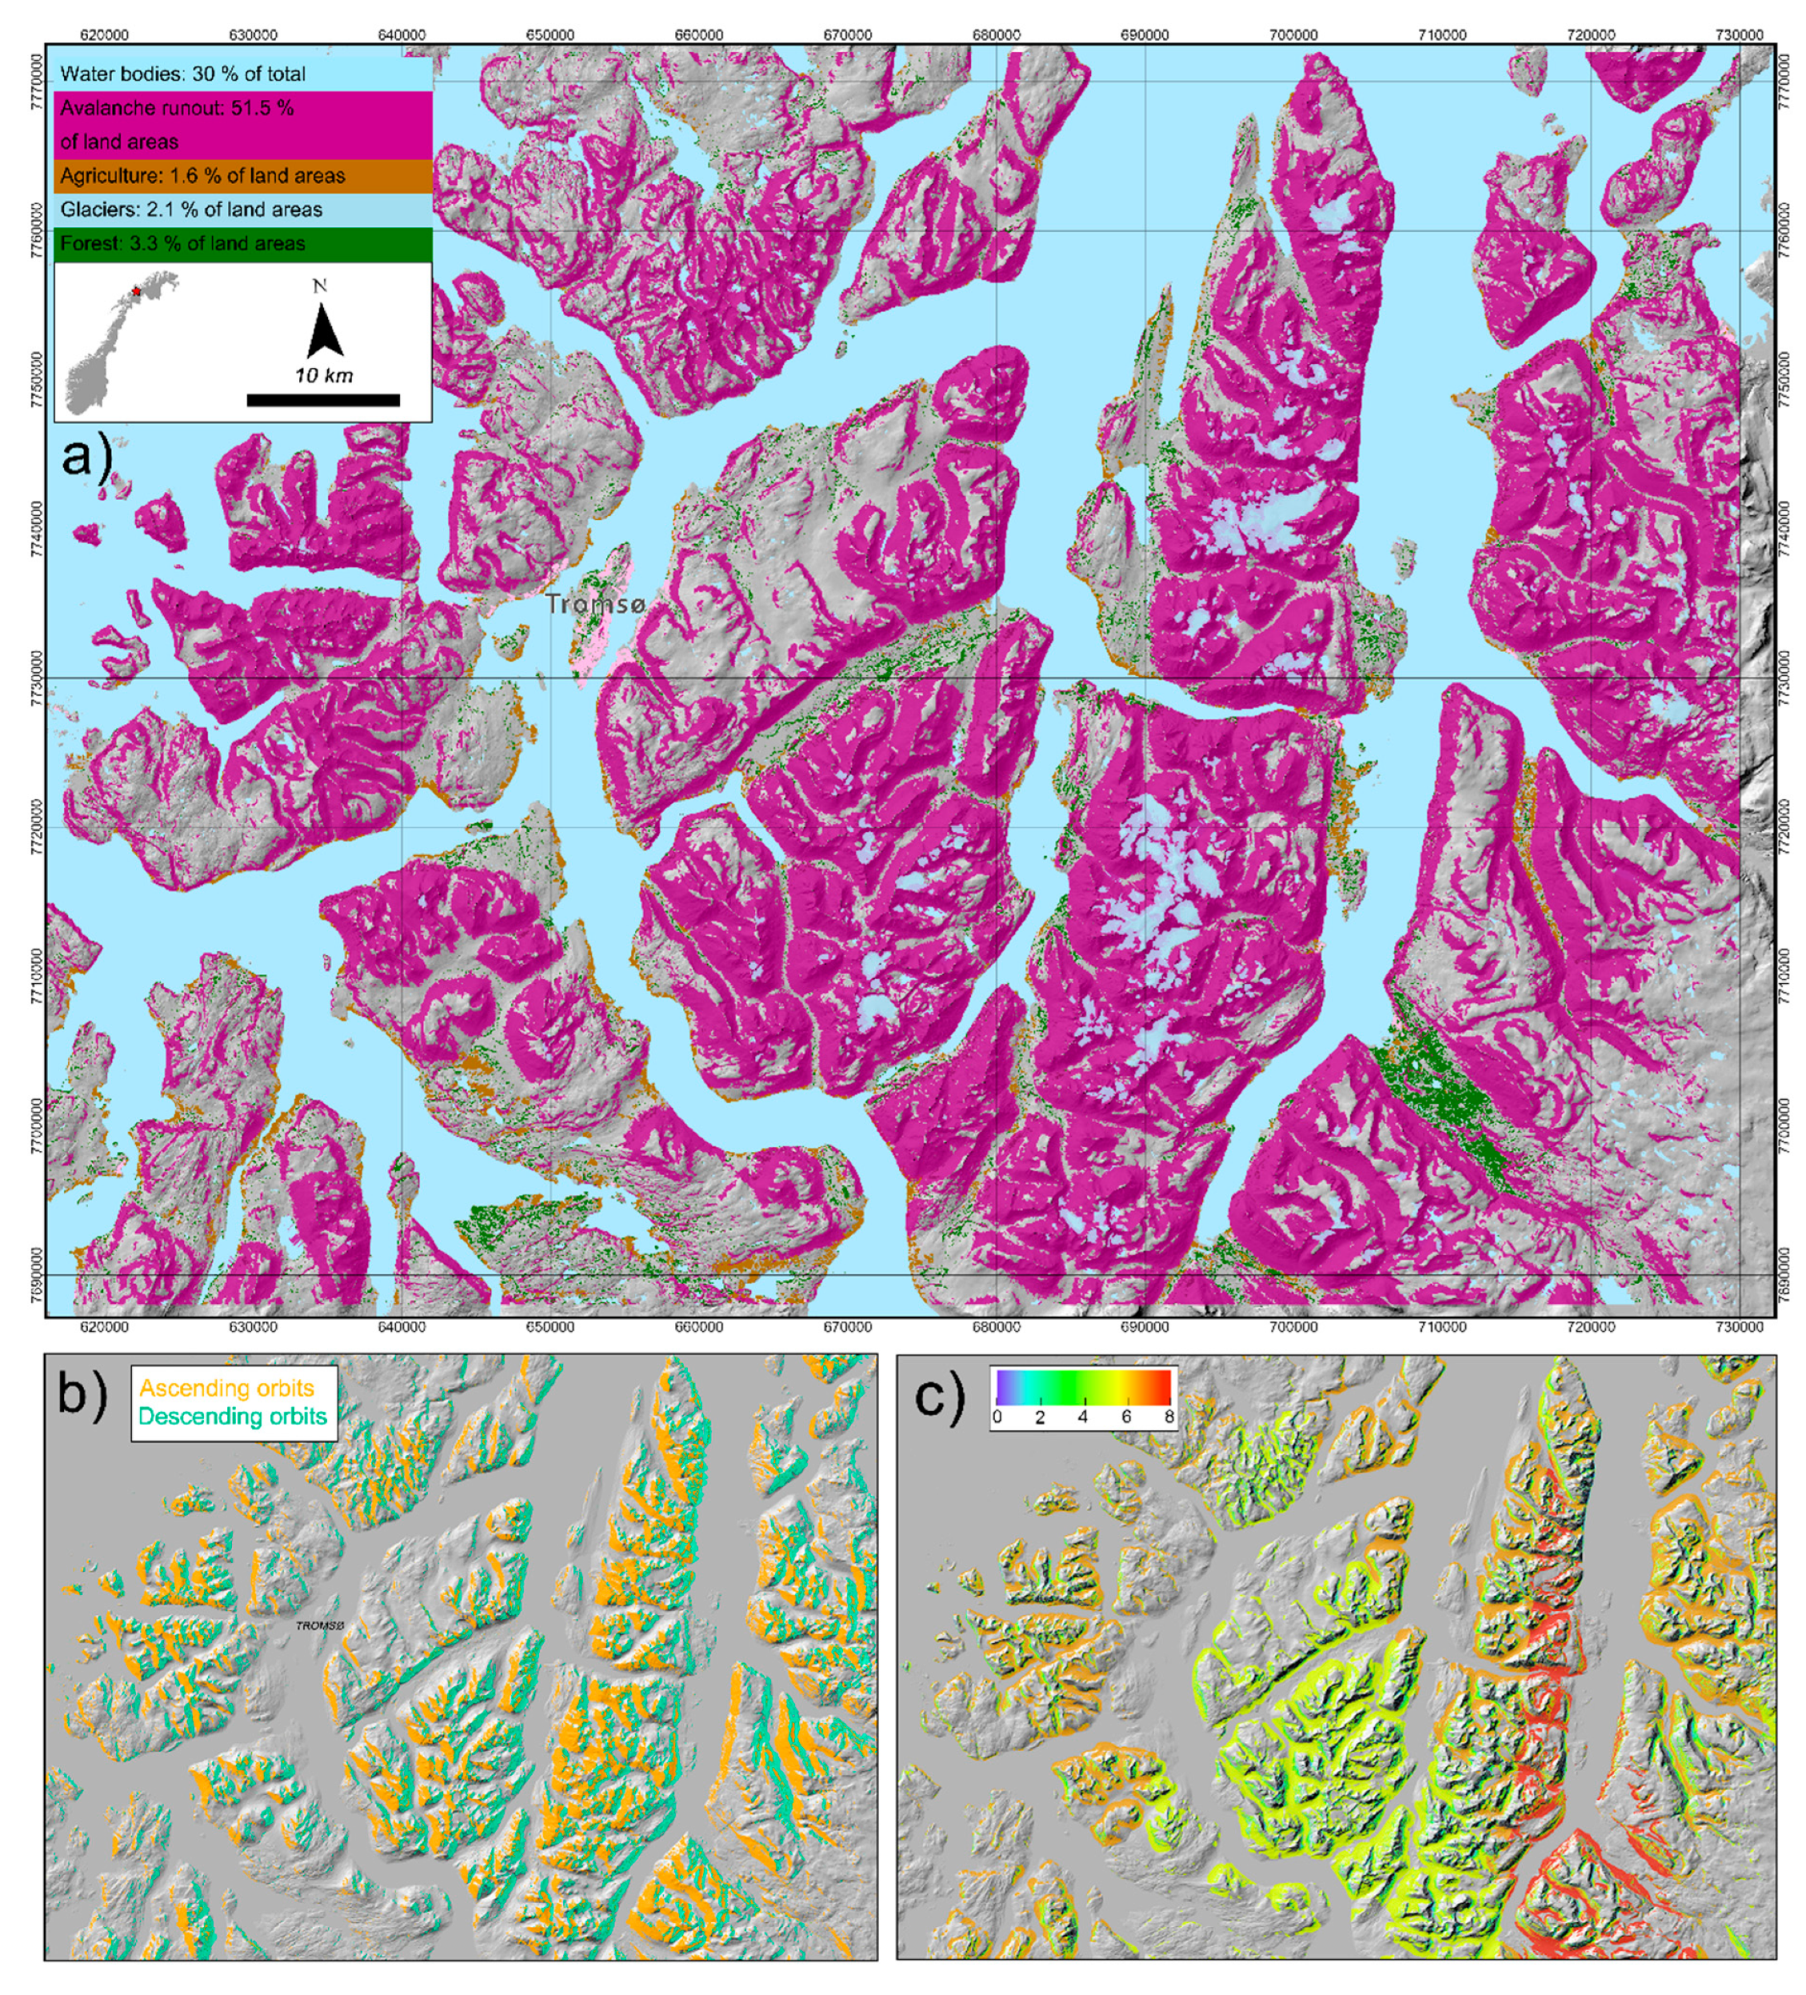
2.1.1. Masks
2.1.2. Digital Elevation Model (DEM)
2.1.3. Sentinel-1 GRD Products
2.2. Processing
2.2.1. Geocoding
- Start with the required output map projection (UTM 33N) and a 10 m DEM, projected to the required output grid if necessary.
- Solve range-doppler equations with respect to radar slant range/azimuth coordinates for the grid of 3D positions corresponding to the output grid.
- Convert slant range coordinates to ground range coordinates using the product annotations.
- Resample using calculated precise ground range/azimuth coordinates after converting to subpixel positions in the GRD grid.
- Export sigma nought (radar backscatter) for VV and VH-polarization. Radar backscatter is exported as two separate geotiff-files for the area of interest. In addition, we also export a mask-file defining the layover and shadow regions.
2.2.2. Scene Pairing
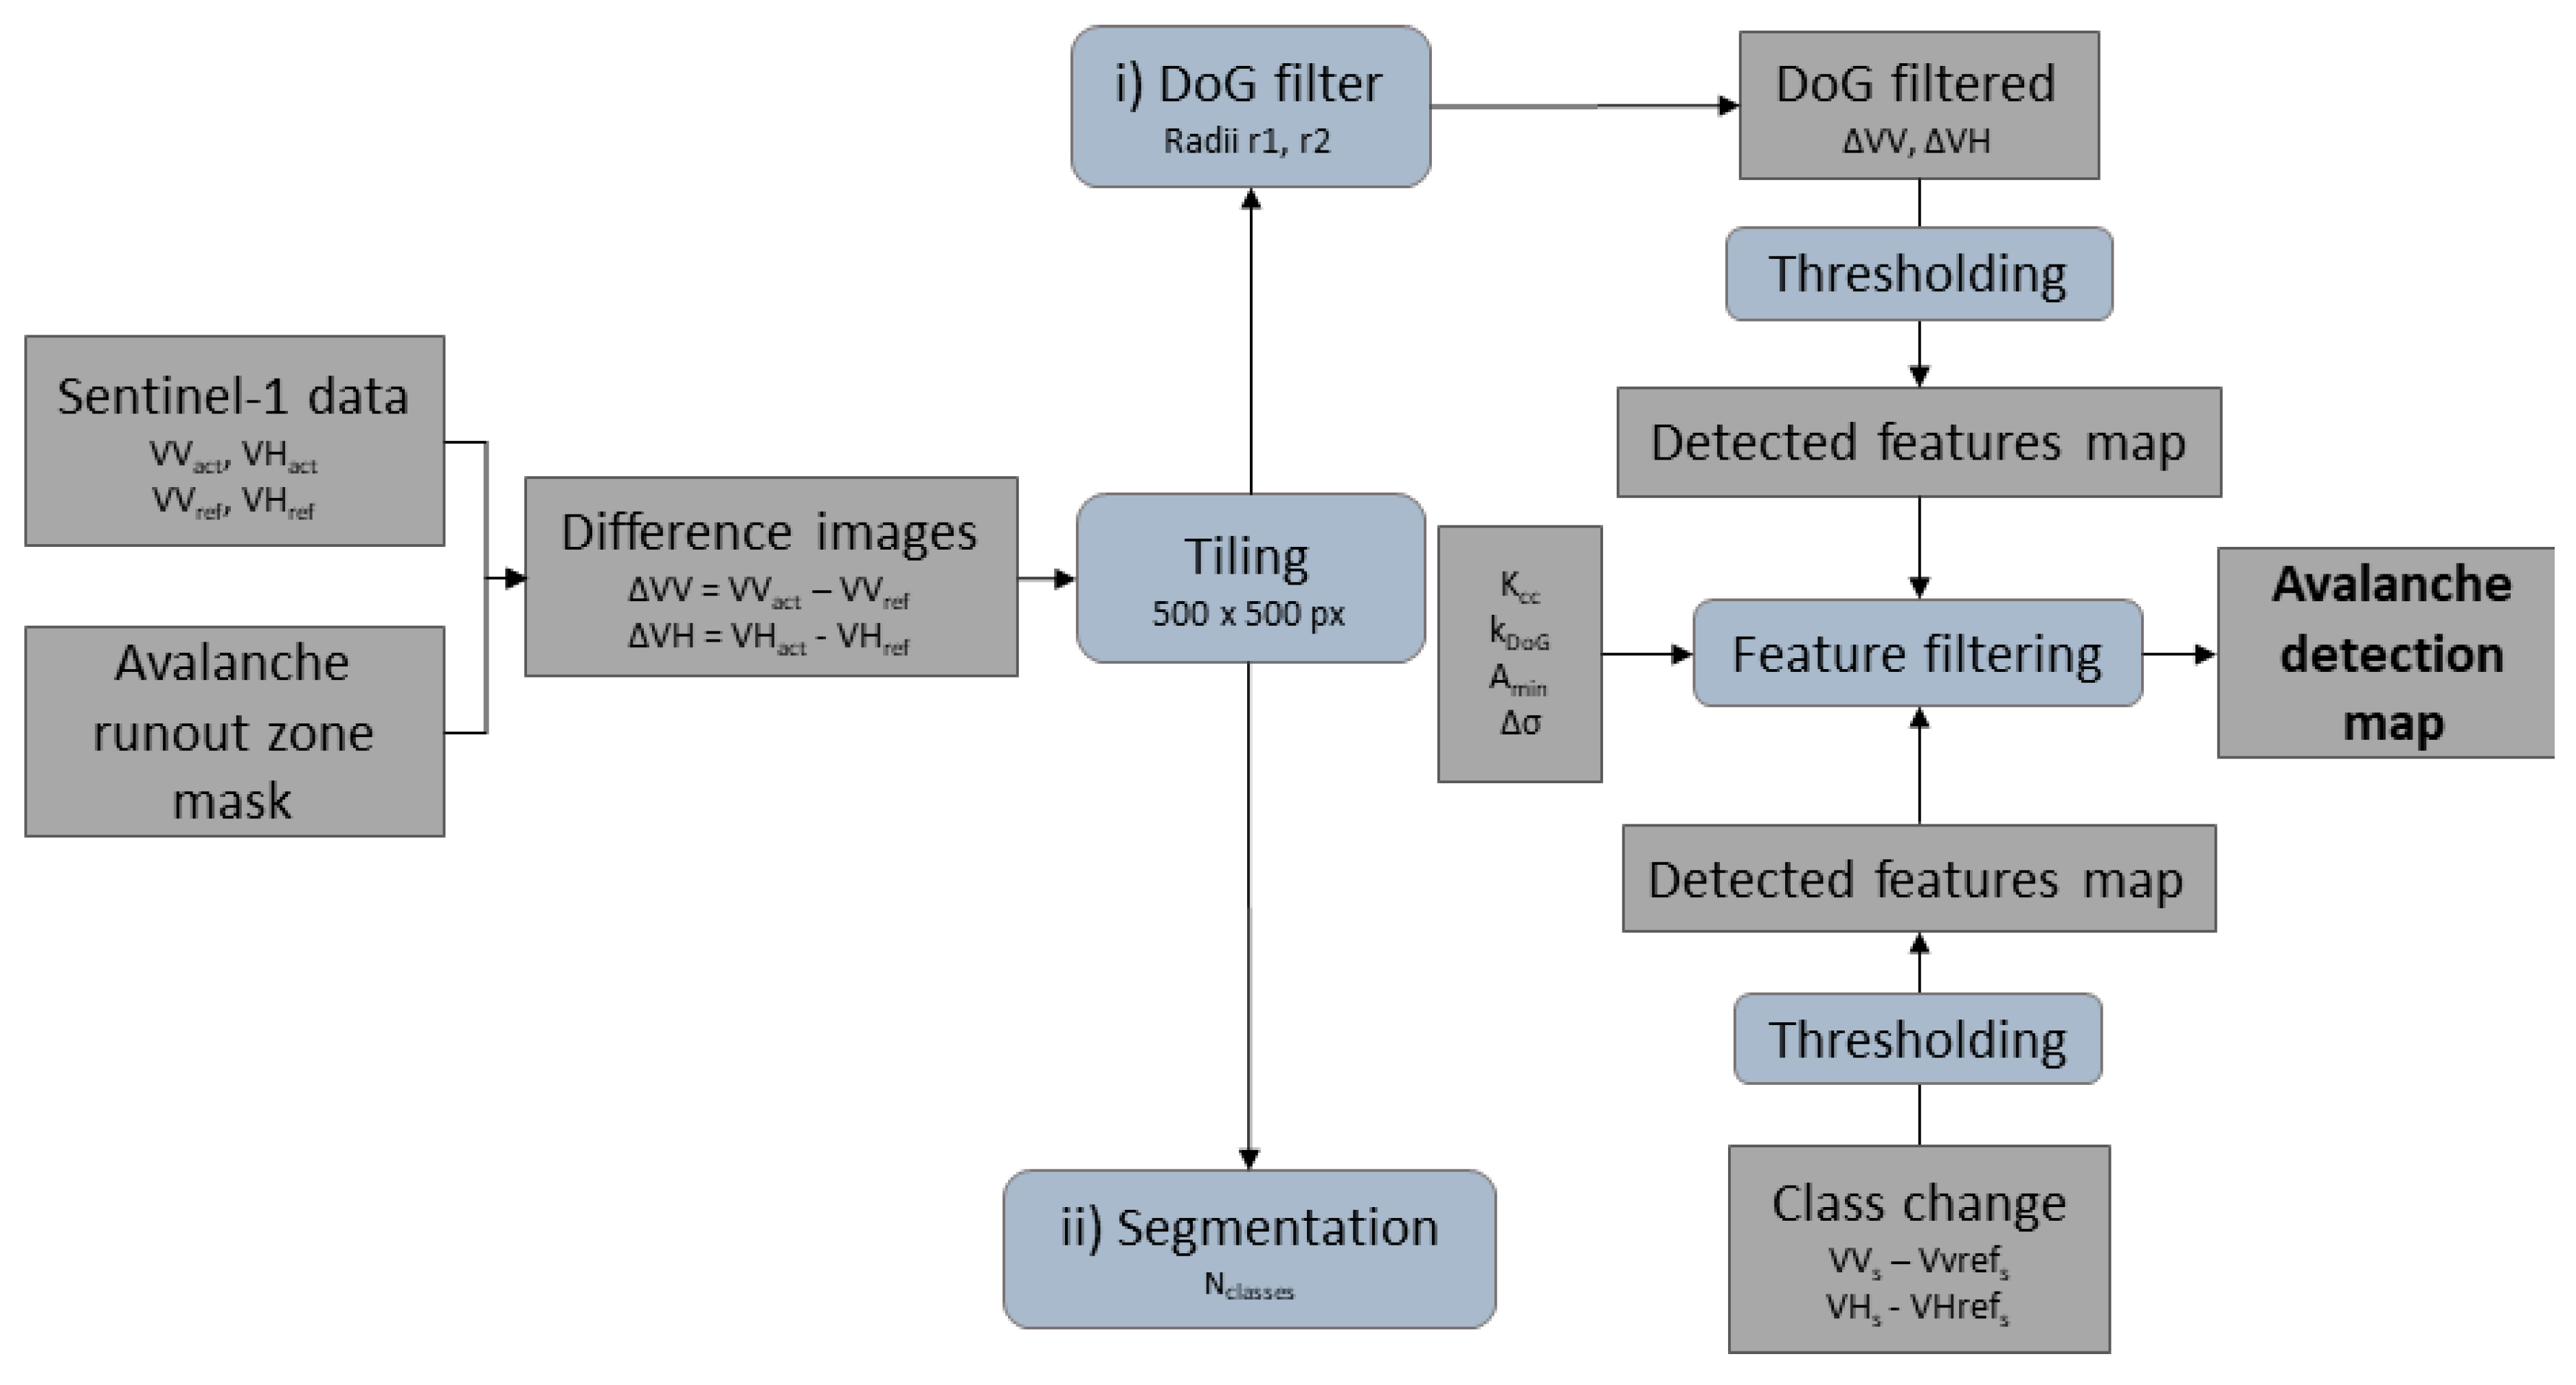
2.2.3. RGB Differentiation and Avalanche Detection
- DoG filtering:A Gaussian filter of radius r1 and a Gaussian filter of radius r2 is applied to the ΔVV and ΔVH images with the Difference of Gaussians image being the result of the difference between the two filtered ΔVV (or ΔVH) images. A threshold is calculated and applied to the DoG filtered difference images using the mean μ and standard deviation of the DoG filtered images. More specifically, we apply two thresholds to the two DoG filtered (ΔVV, ΔVH) images; a lower threshold is defined by μ + 1.5sd and an upper threshold μ + 2.5sd. This yields two interpretations of potential avalanche debris pixels, with the result from the higher threshold representing the greater likelihood of correct detections.
- Segmentation:The four input images are segmented into N classes and used to calculate a class change (i.e., classified activity image–classified reference image) image for the two channels. To distinguish potential avalanche pixels, a threshold is calculated automatically (as with the DoG filtering) from the mean and standard deviation of class change values in the image window. This is done separately for the VV and VH channels. Avalanche debris pixels are those that exceed the threshold in each polarization and a binary map (detected features map) is created, indicating either 0 for “not avalanche” or 1 for “avalanche”.
- Merging of binary maps:The results from the segmentation and DoG filtering are combined to achieve the best possible delineation of the avalanche debris (referred to as “Feature Filtering”) as follows: first, the detected regions from the lower DoG thresholding are taken as a proxy for the avalanche debris. The number of pixels within each region that were also detected from class change thresholding is deduced and converted into a fraction kCC of the total number of pixels within the region. The fraction of pixels within the region that also exceeded the upper DoG threshold, kDoG is also calculated. If both fractions exceed a specified threshold, then the entire detection region is retained; if the criteria are not met, then the detection is nulled out and not considered avalanche debris. In addition, a backscatter contrast Δσ filter is applied to check whether the detected regions are probable candidates for avalanche debris. Here, the backscatter change image is used as a starting point and the difference between the mean backscatter change within (ΔVVIN) and outside (ΔVVOUT) of the detection is calculated (VVContr = ΔVVIN - ΔVVOUT). To calculate the mean backscatter change outside of the detection, a box of a width three times the region width and three times the region height is used to isolate the region of interest. A threshold is applied to determine whether the backscatter contrast is great enough to represent avalanche debris. If the backscatter contrast does not exceed the threshold, then the detected region is again nulled out and does not remain in the final avalanche map. Lastly, a check is performed on the number of pixels in the detected regions, such that if the region area is smaller than minimum Amin of 10 pixels, then the region is not included in the final avalanche map. Vice versa, if the region is larger than maximum Amax of 390 pixels, this corresponds to the largest field validated avalanche detected.
2.2.4. Vectorization
2.2.5. Age Tracking
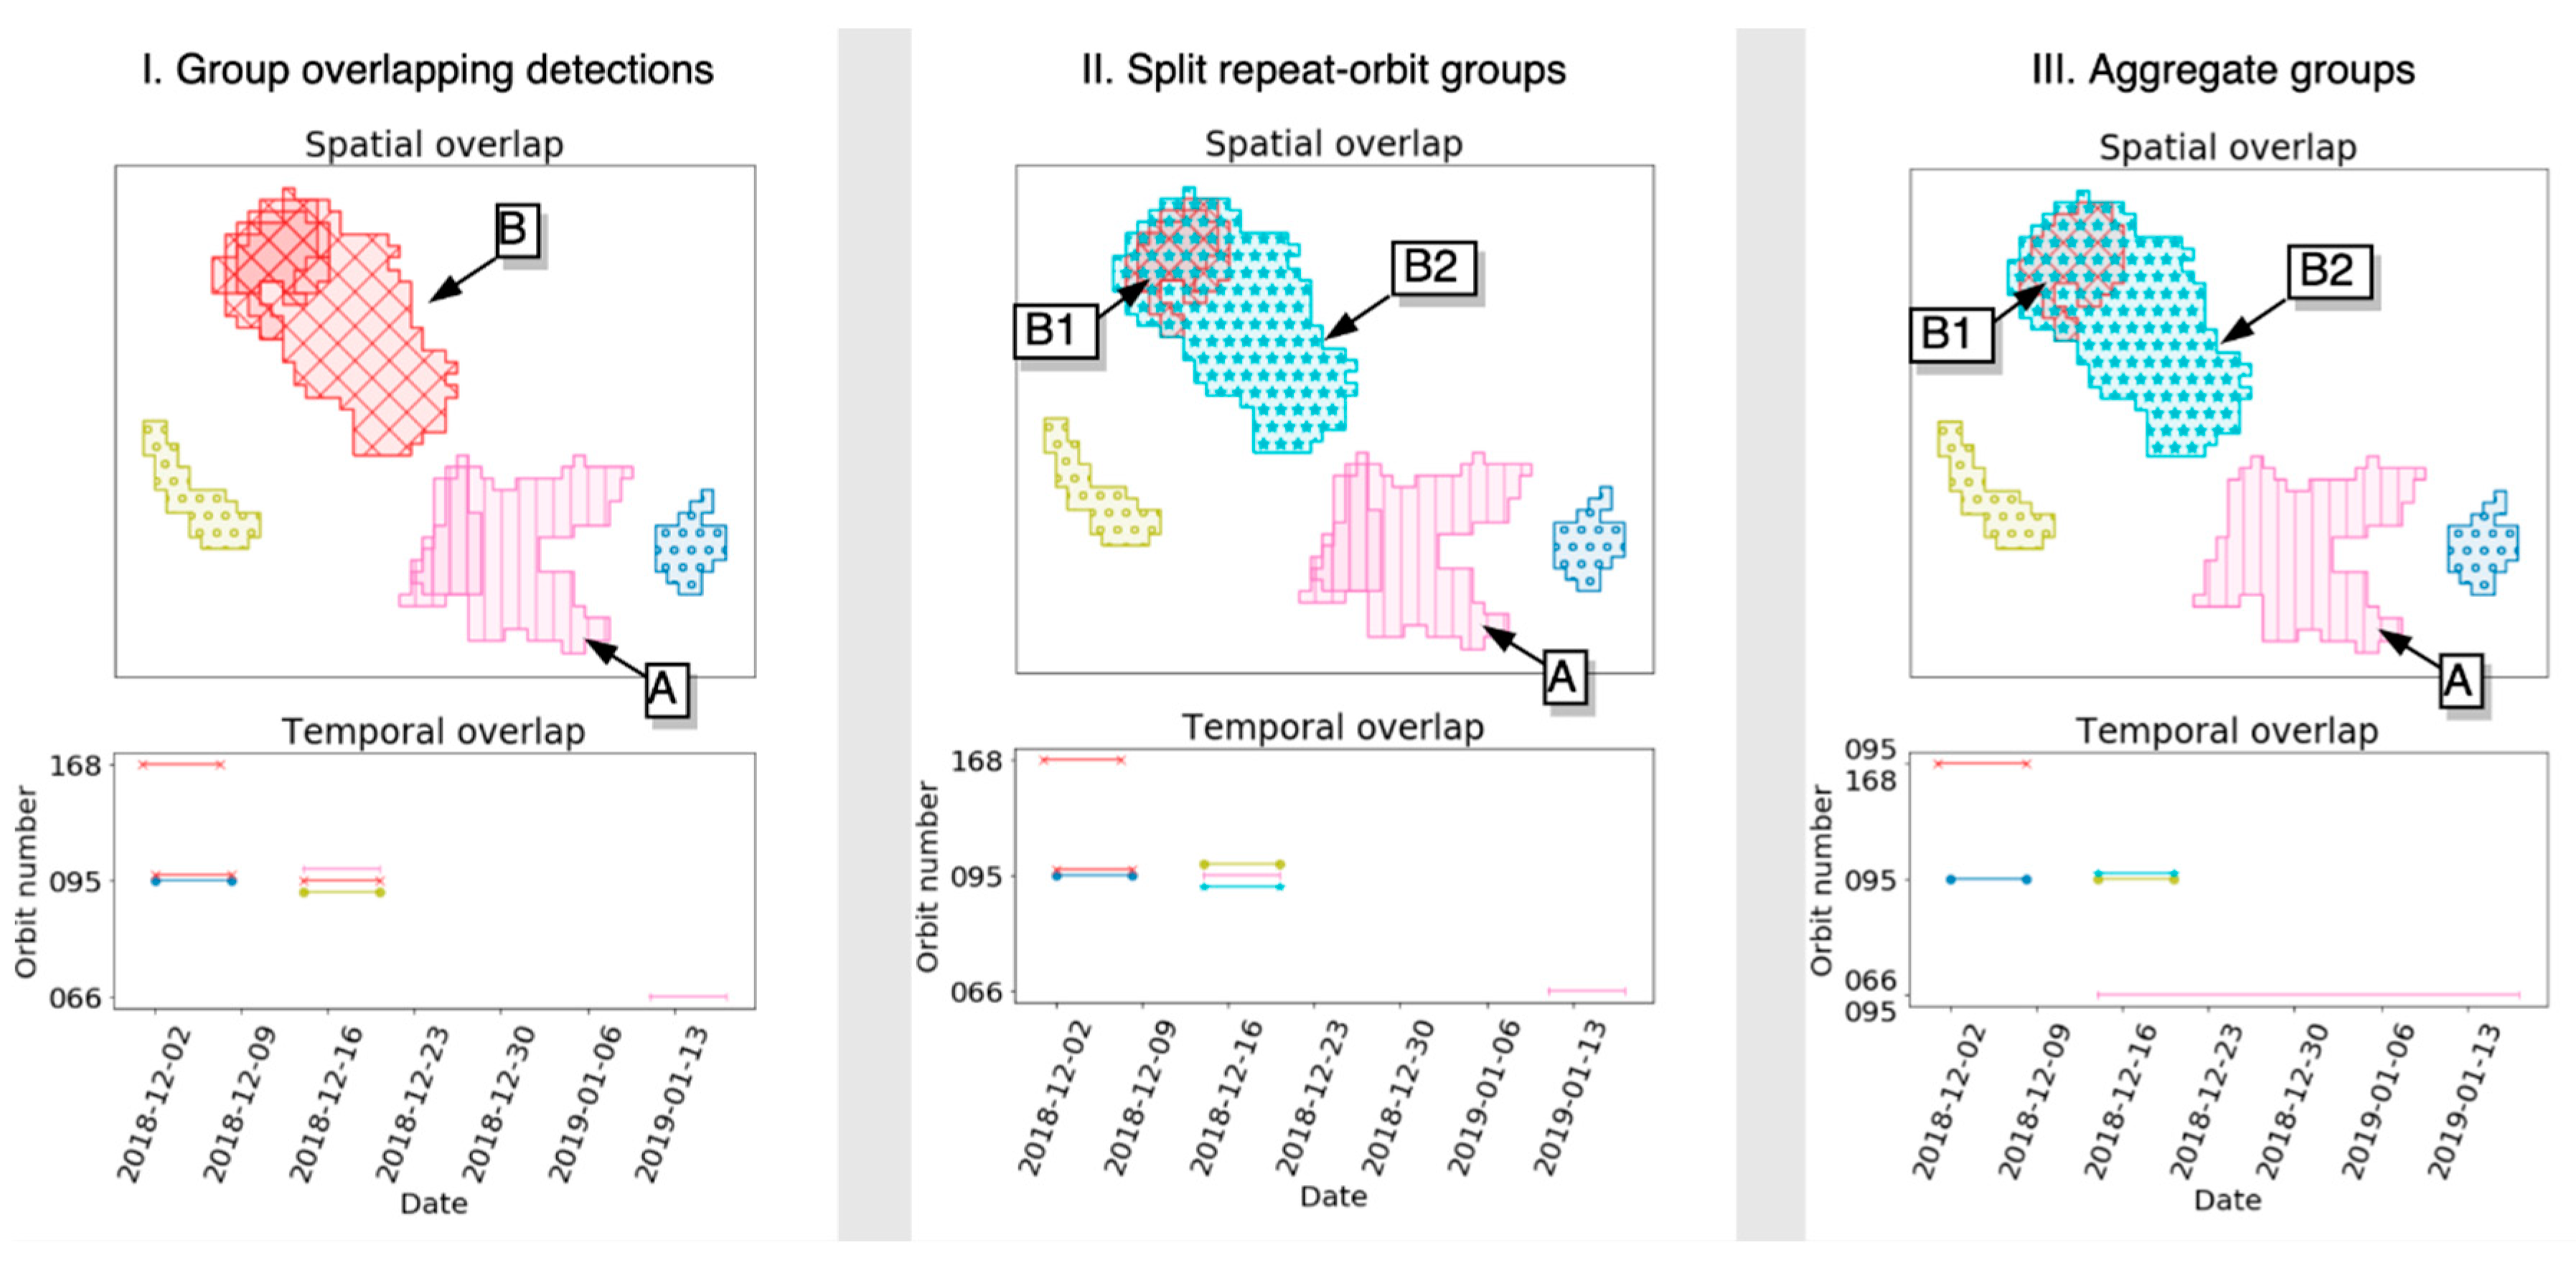
- Group overlapping detections:In this first step, features detected in multiple images of different orbit overlapping in time (within the 6 days repeat cycle) and space (75% areal overlap) are assumed to be the same avalanche.
- Split repeat orbit groups:If an overlapping group contains multiple detections from the same satellite geometry, the group is split into sub-groups. The split is done in such a way that each resulting sub-group contains at most one detection per satellite geometry, while at the same time, as much overlap as possible between the detections in the resulting sub-groups is preserved. Formally, this is done by representing each detection in the original group as nodes in a graph with the spatial-temporal overlap representing edges between the nodes. If a pair of nodes corresponds to the same satellite orbit, a maximum-flow graph cut is applied between the node pair, resulting in two sub-graphs. The sub-graphs are recursively cut until no pair of nodes corresponding to the same satellite geometry is found.
- Aggregation of groups:Finally, groups that fulfill all requirements from step I are merged into single detections.
2.3. Output
3. Tuning of the Avalanche Activity Algorithm
4. Results
4.1. Tuning of Algorithm Parameters to Improve Automatic Detection
4.2. Manual Deletion of False Alarms
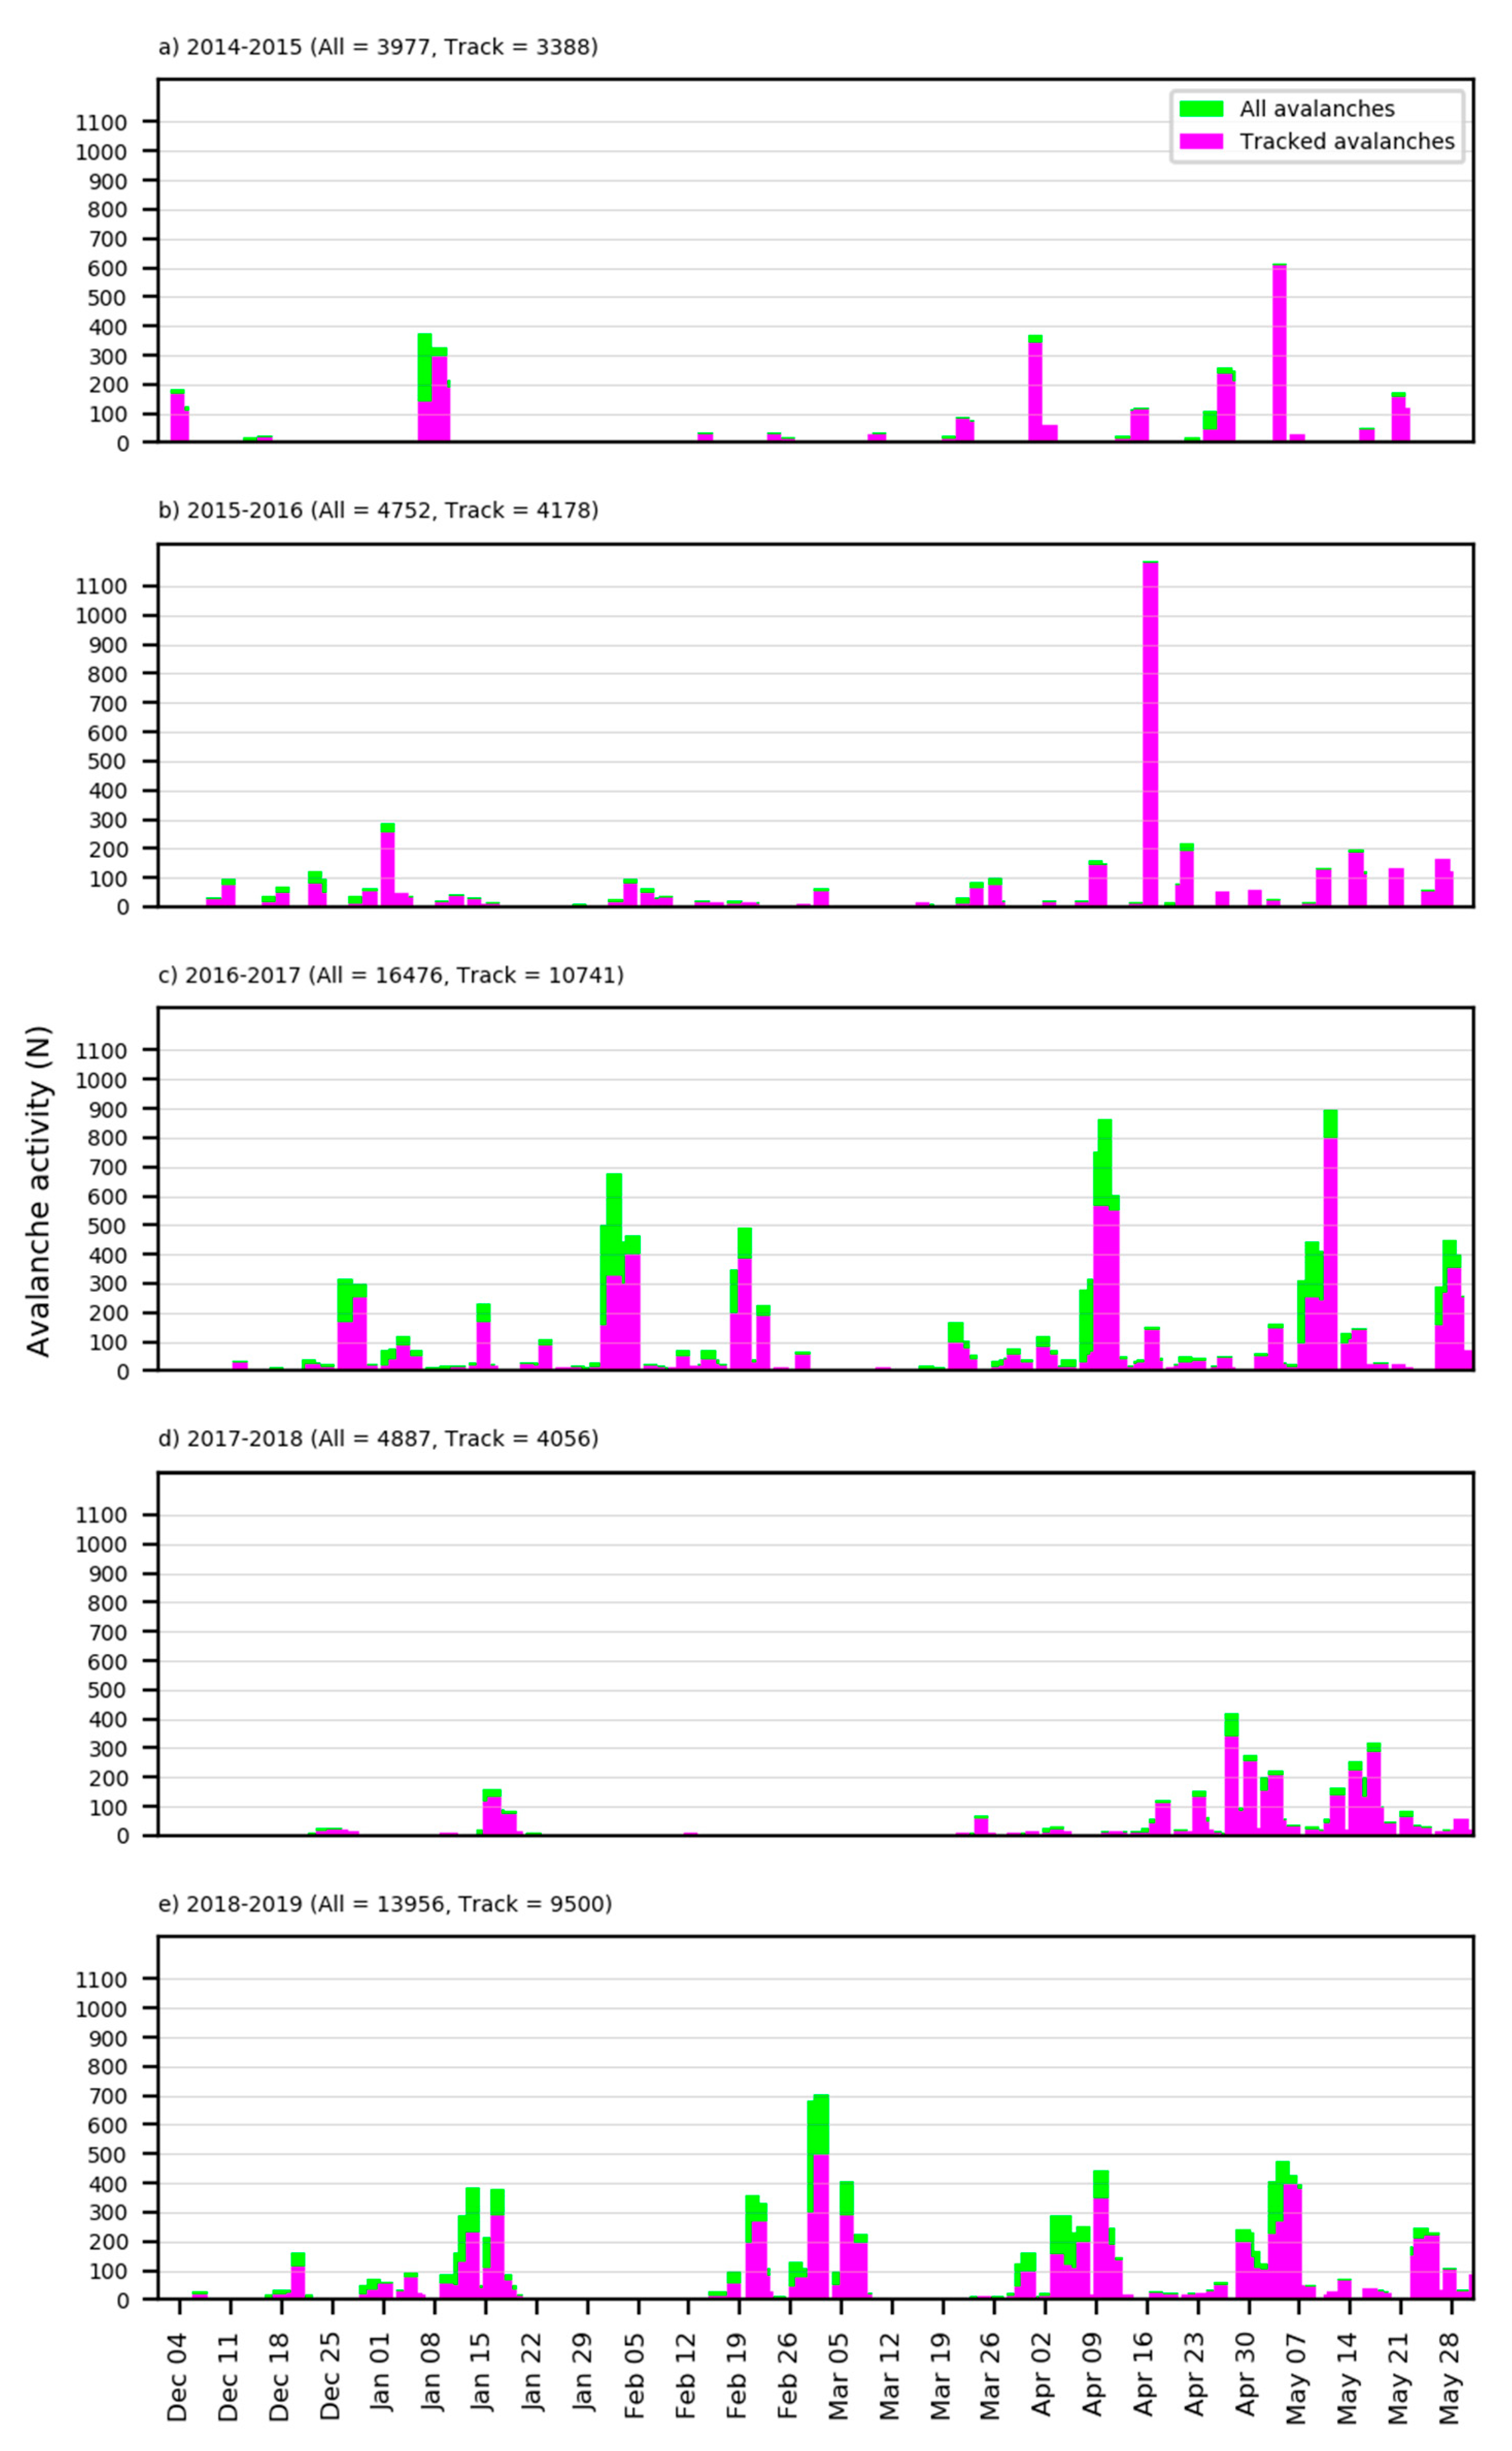
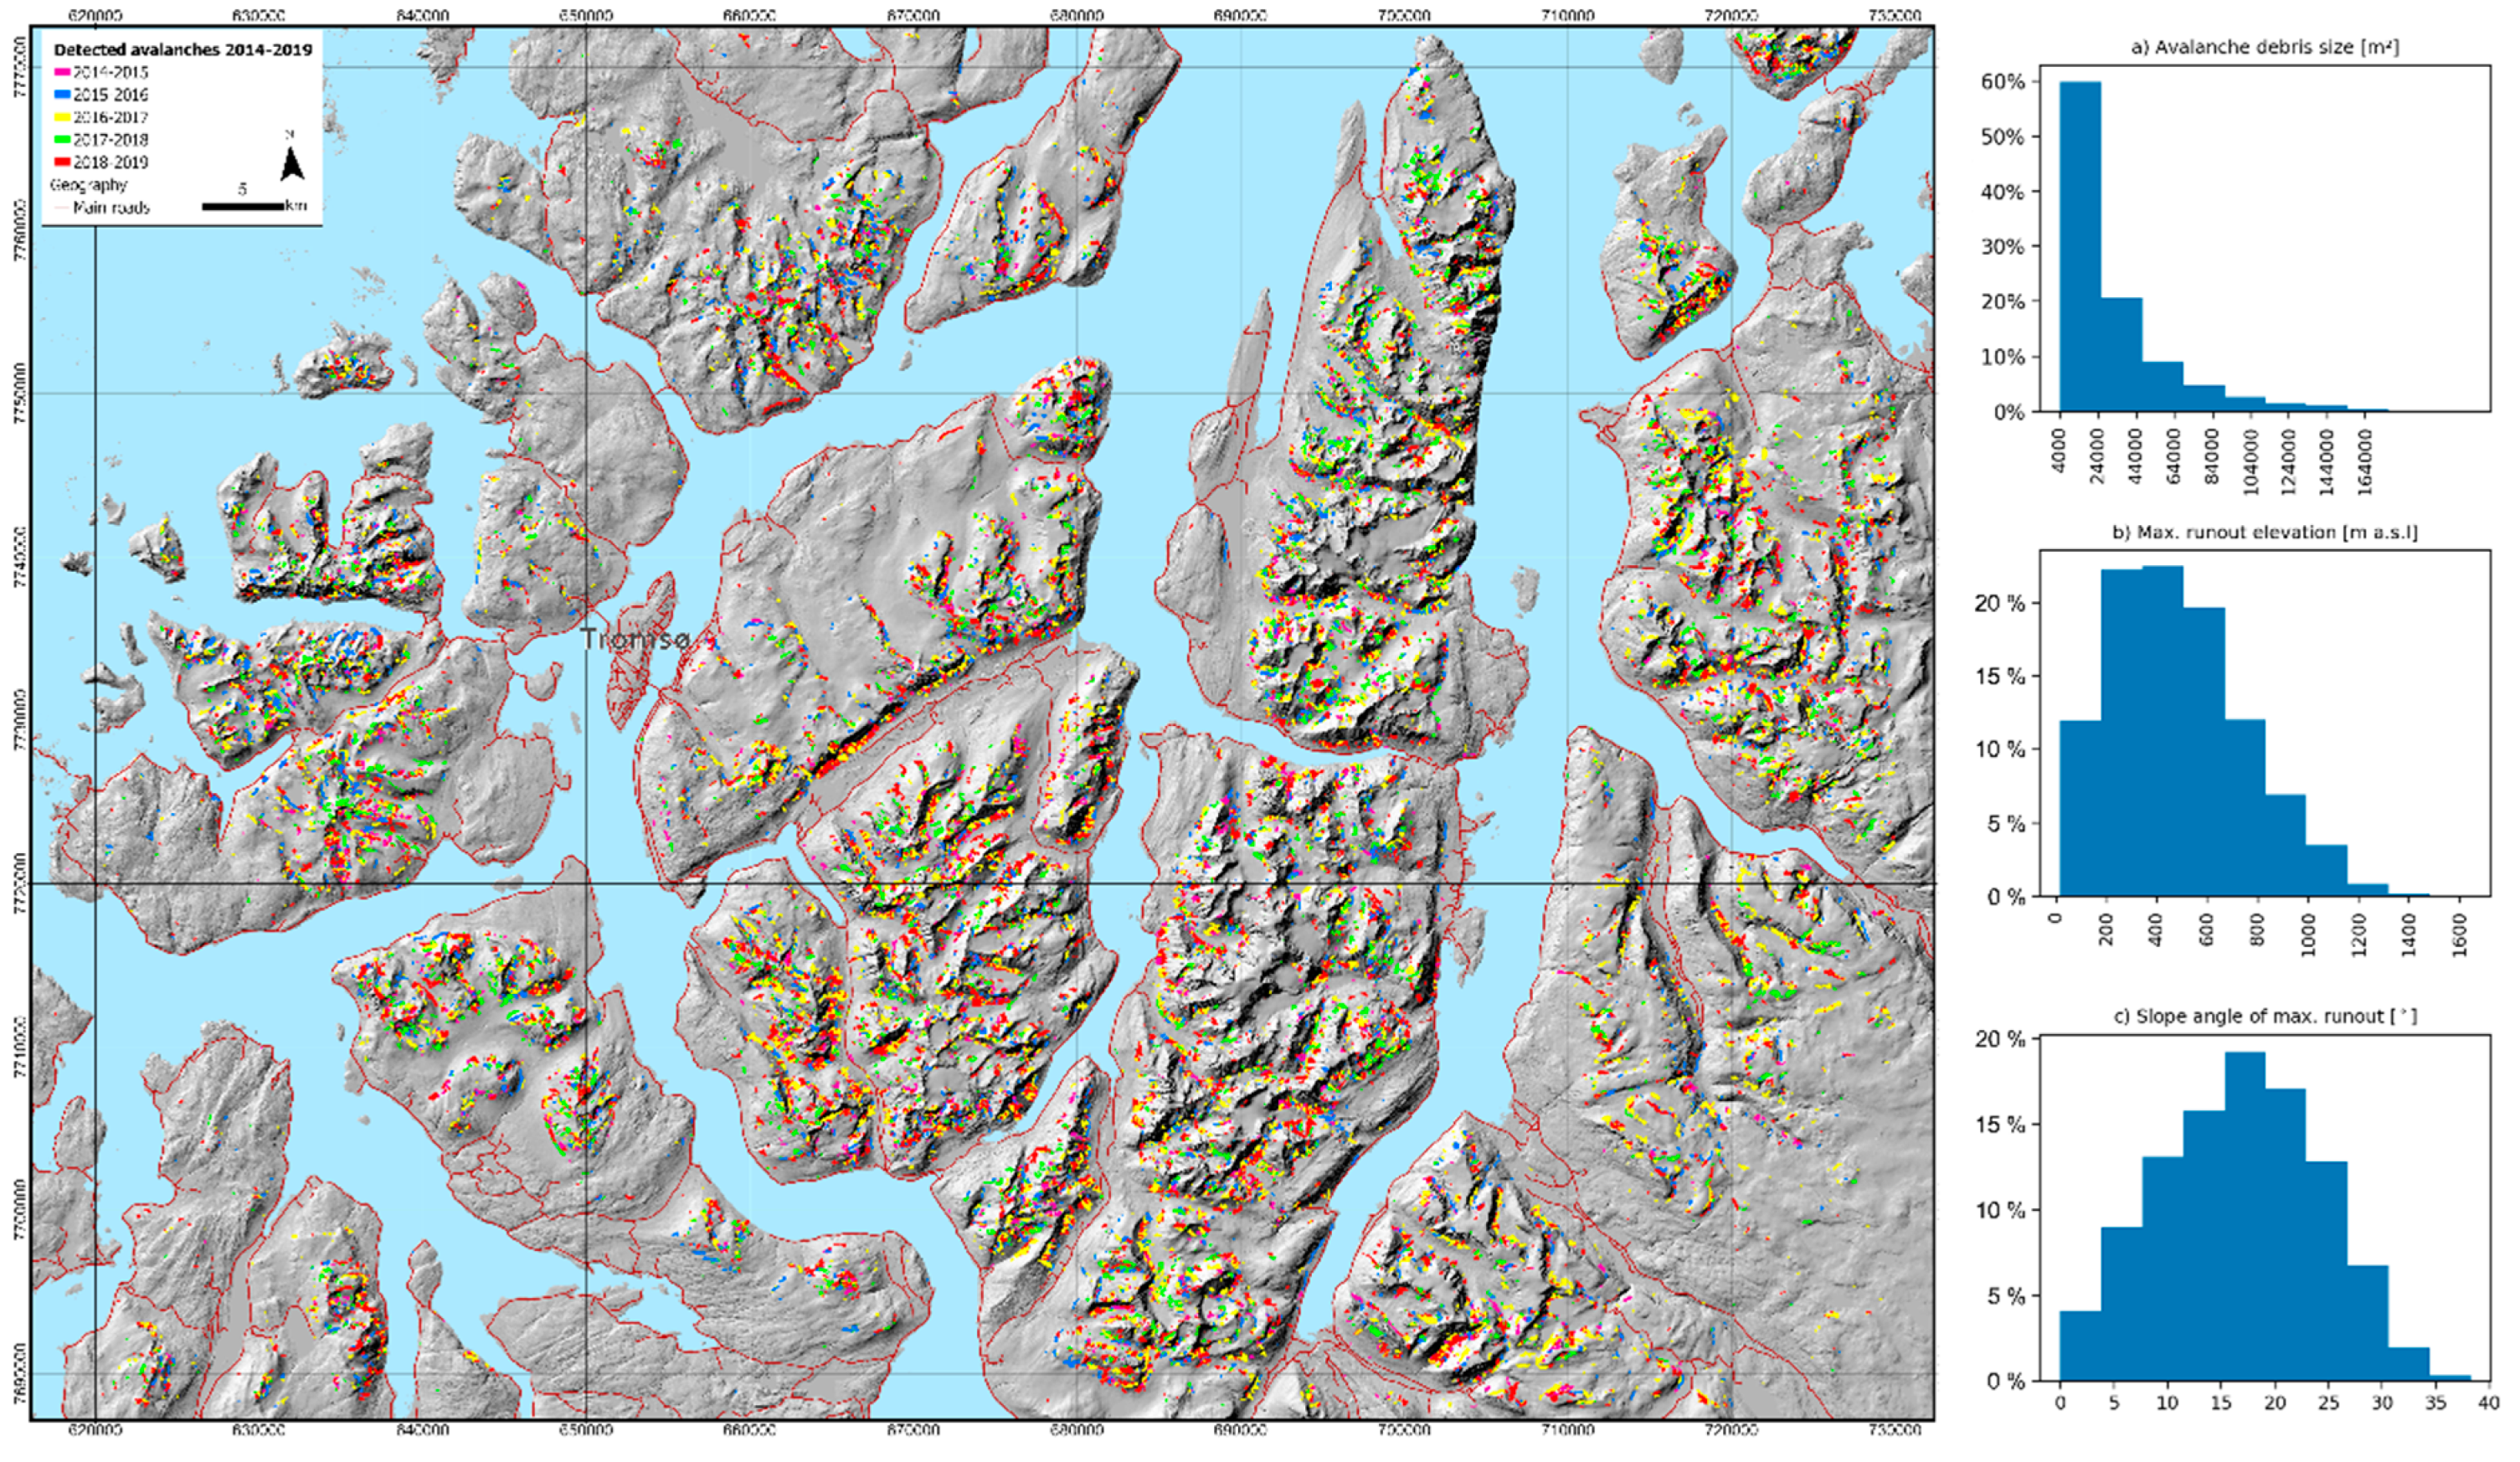
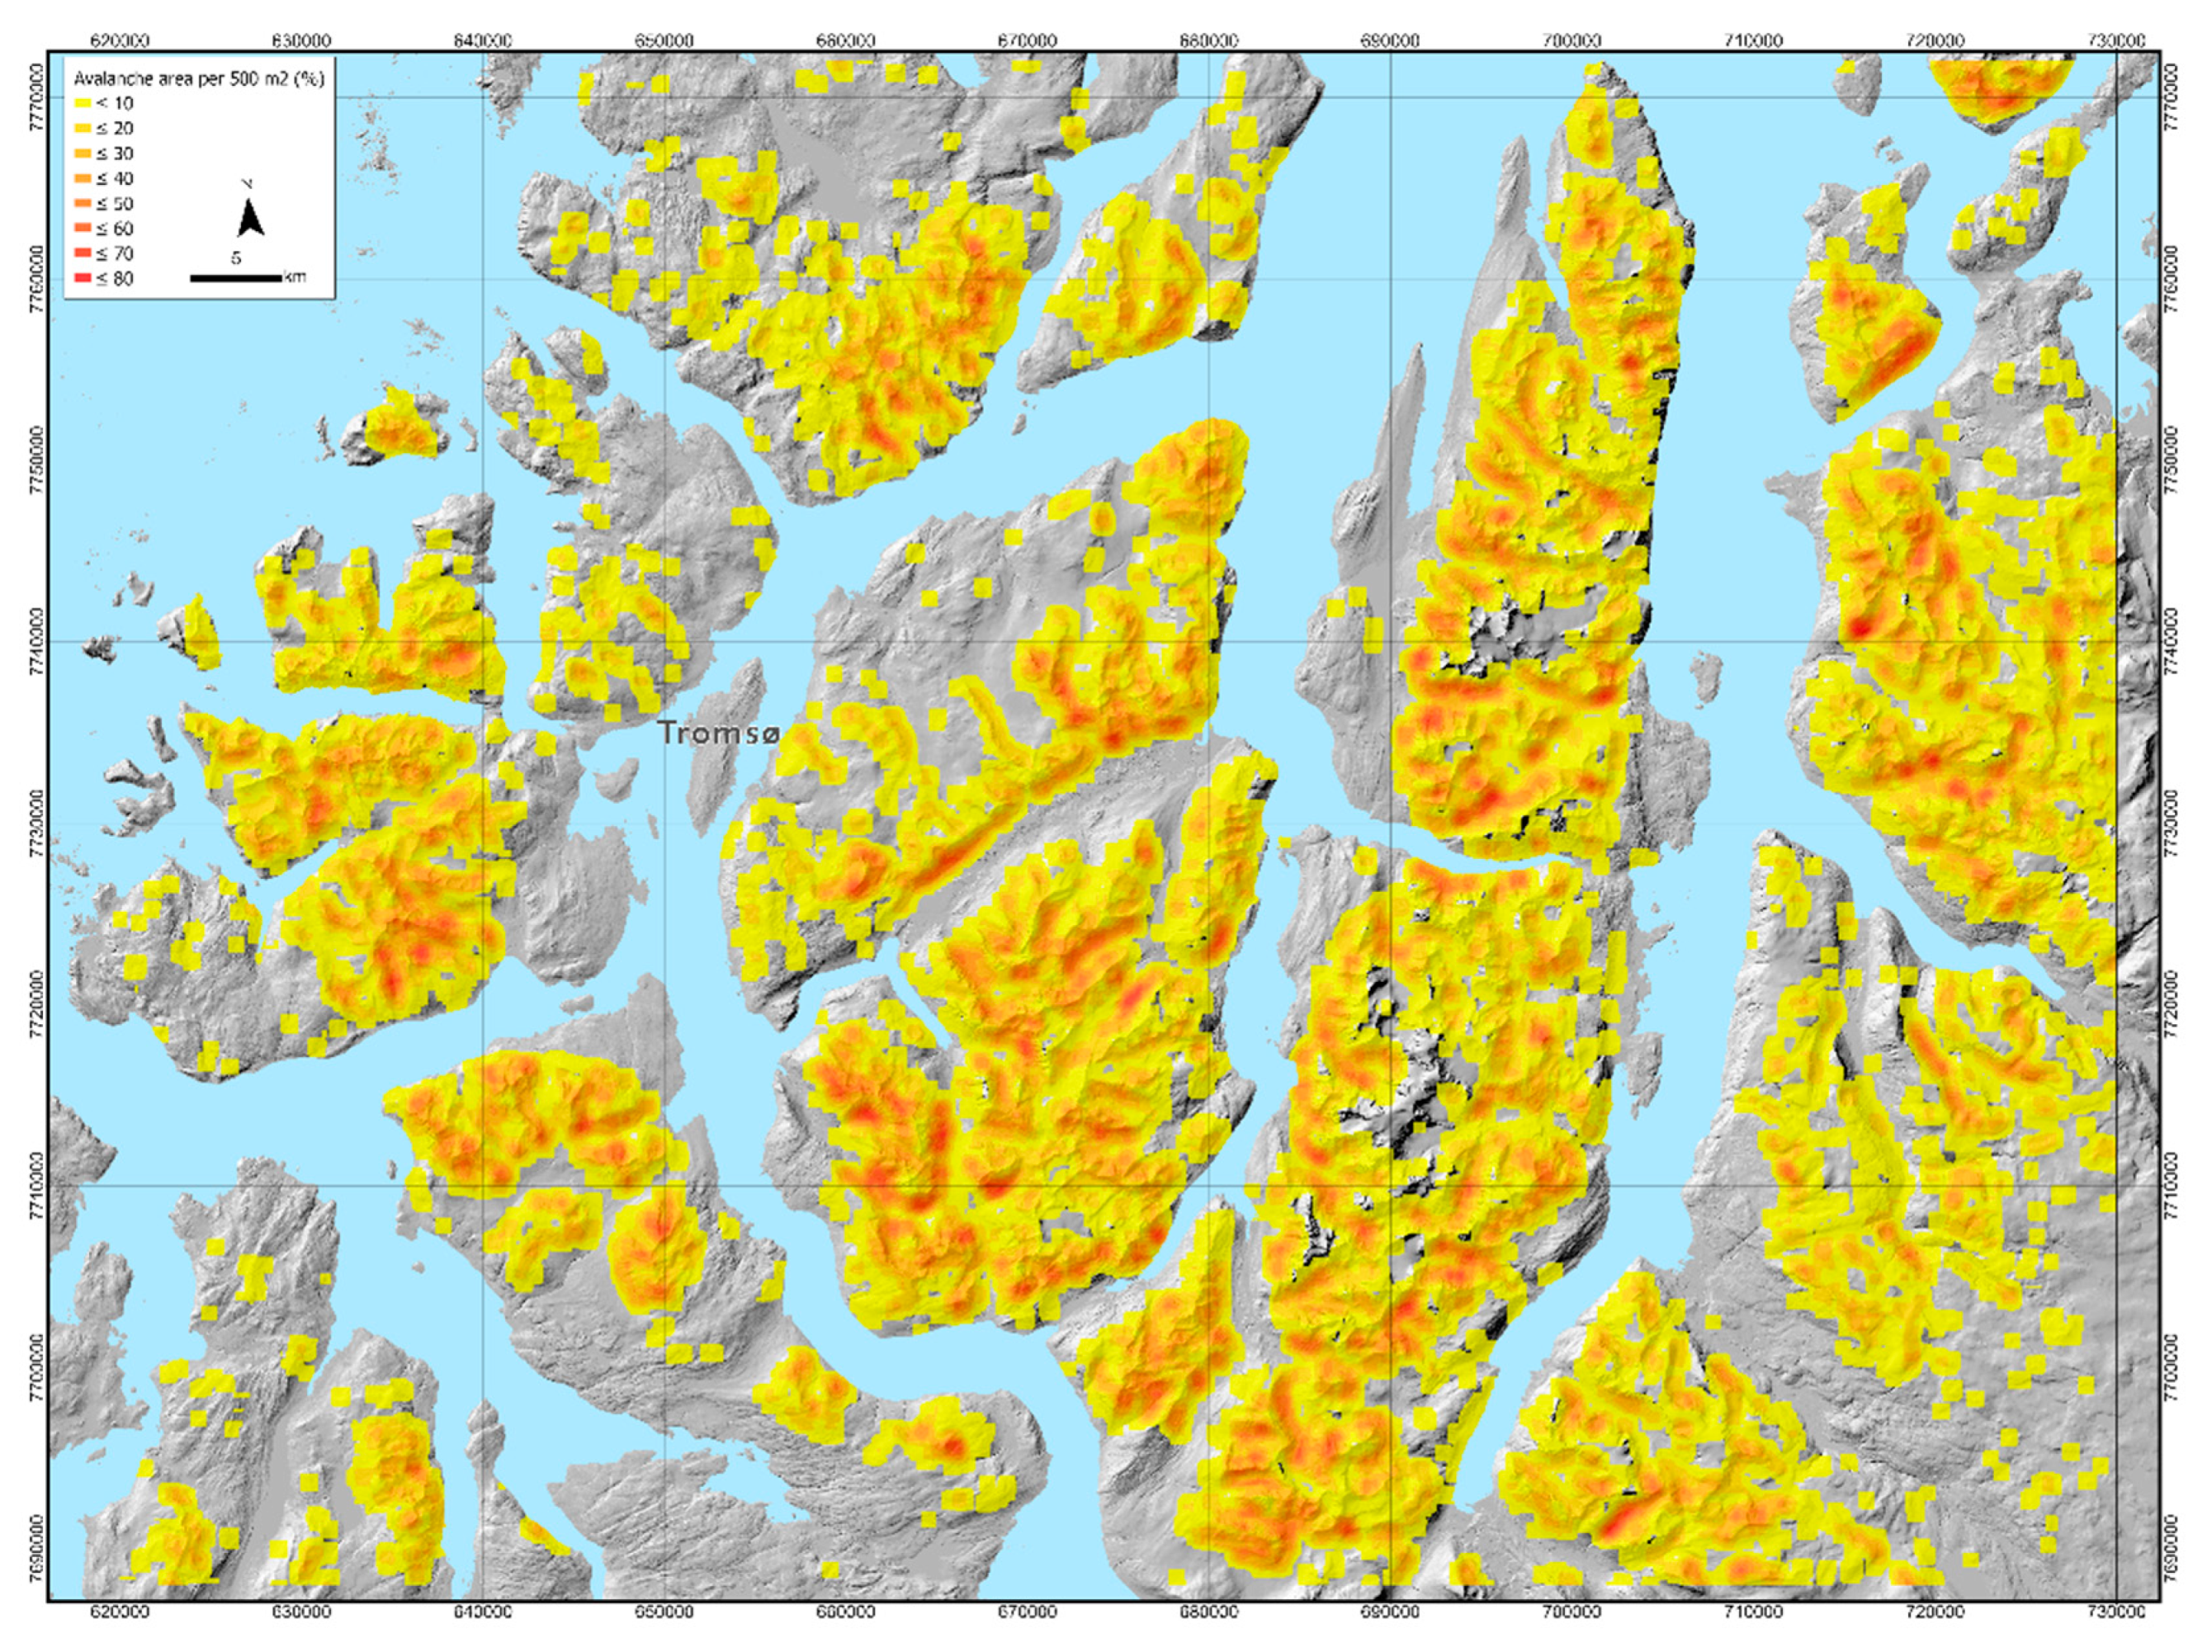
4.3. Spatio-Temporal Avalanche Activity
4.4. Avalanche Activity Map and Time Series
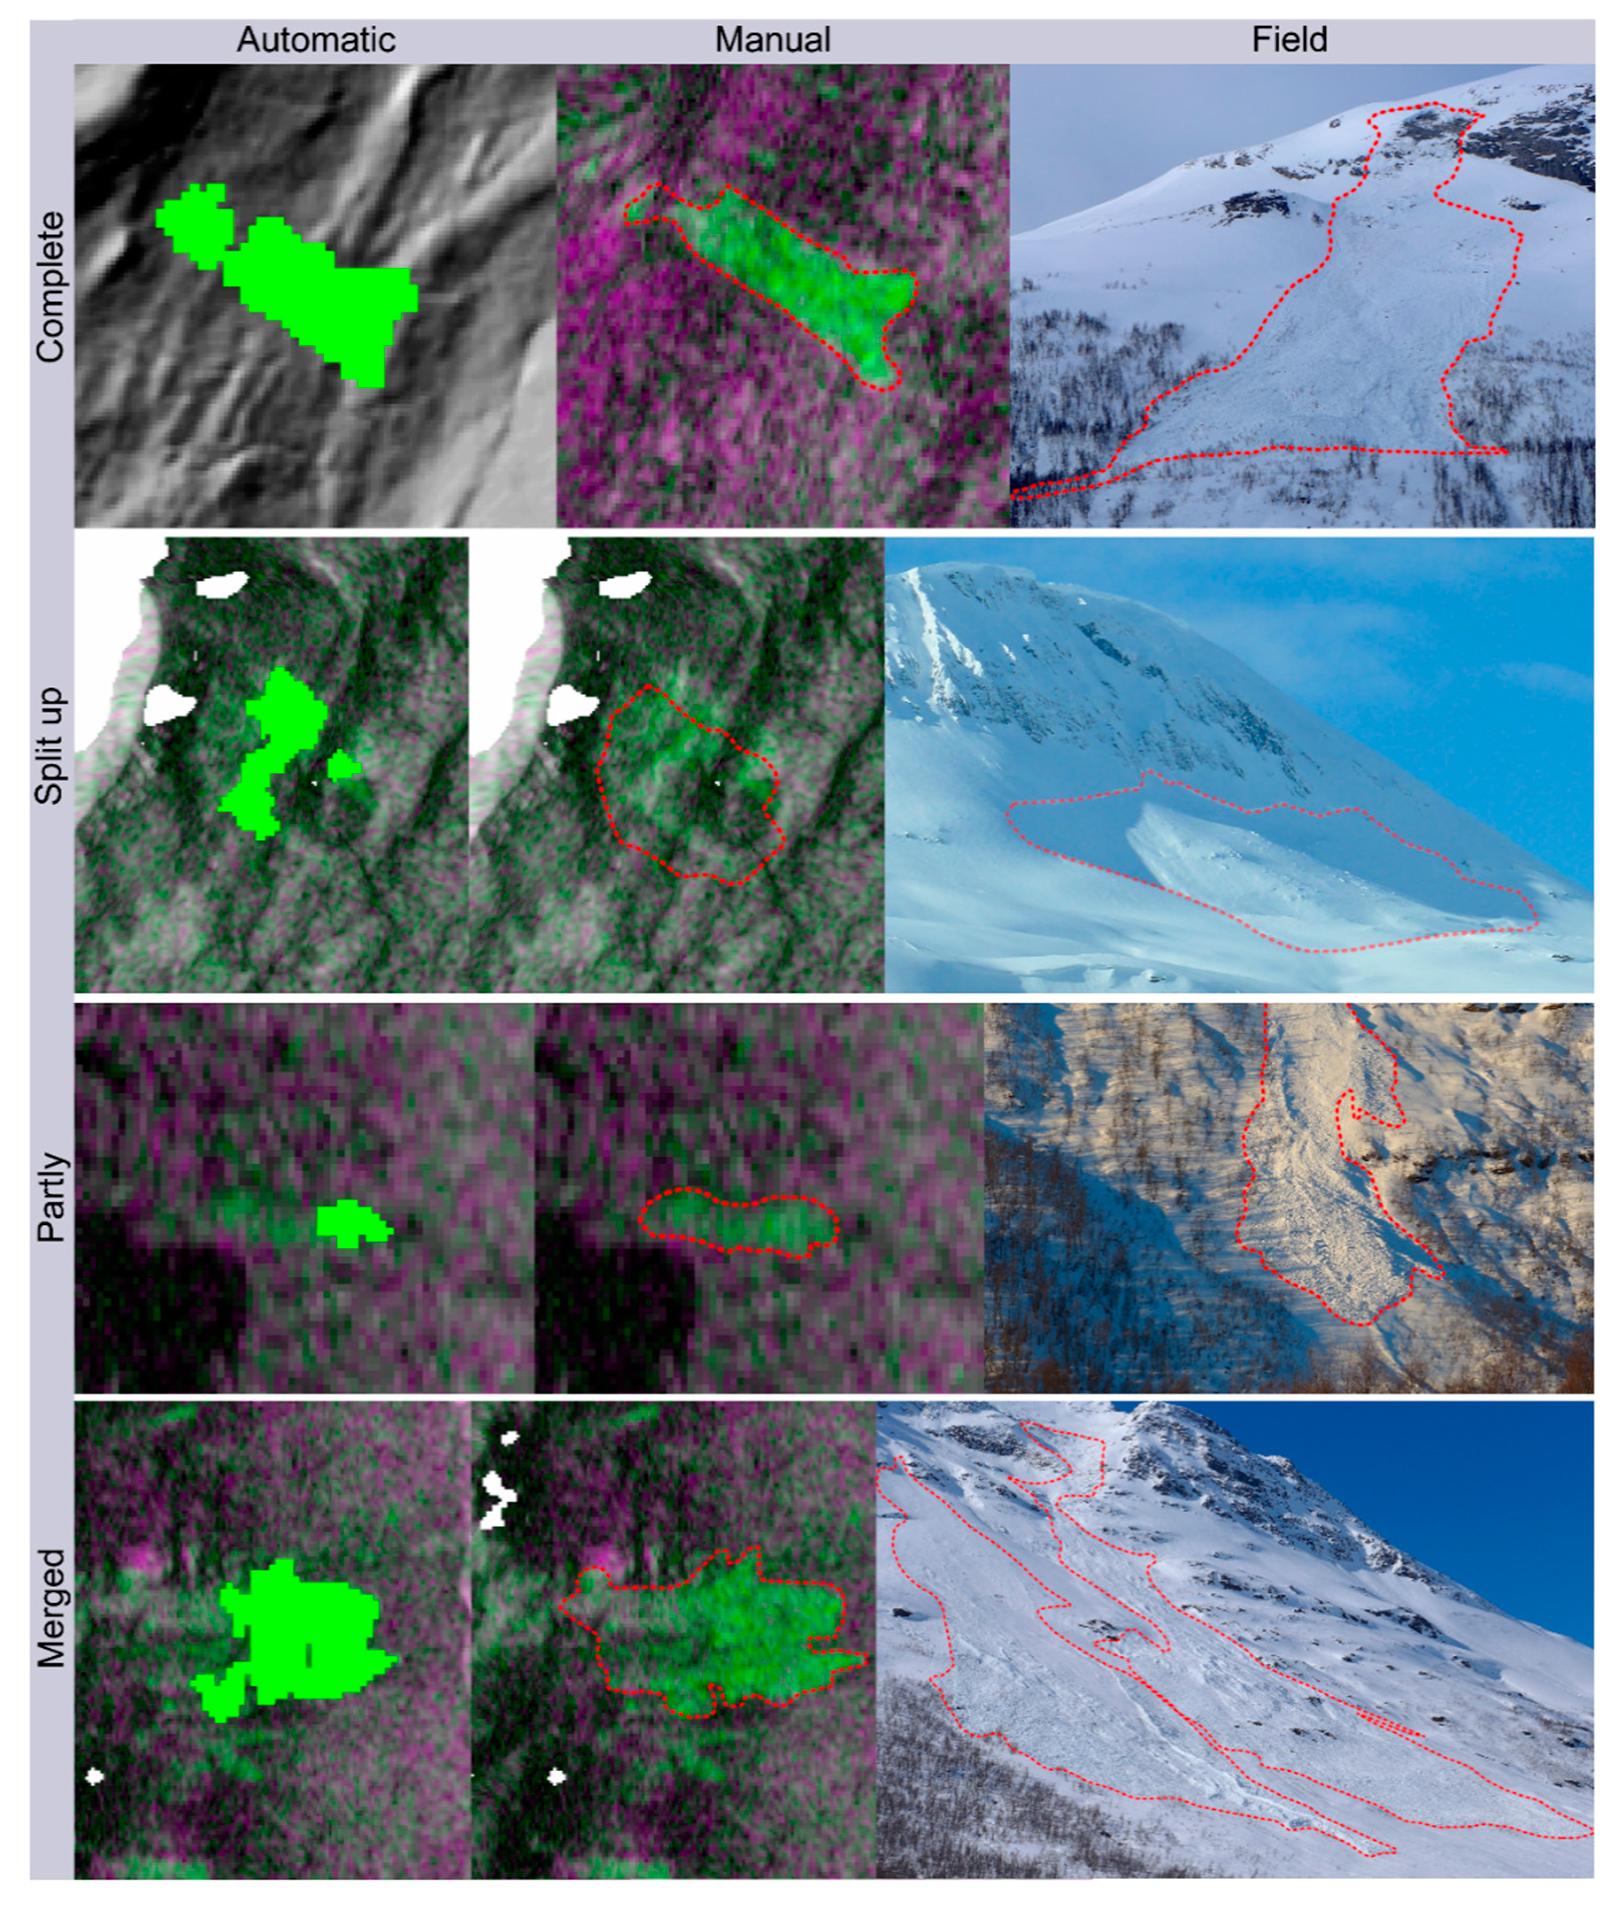
4.5. Field Validation of Manual and Automatic Avalanche Detections
5. Discussion
5.1. Performance of the Automatic Avalanche Detection Algorithm
5.2. Comparison to Other Automatic Avalanche Detection Schemes
5.3. Limitations and Sources of Error
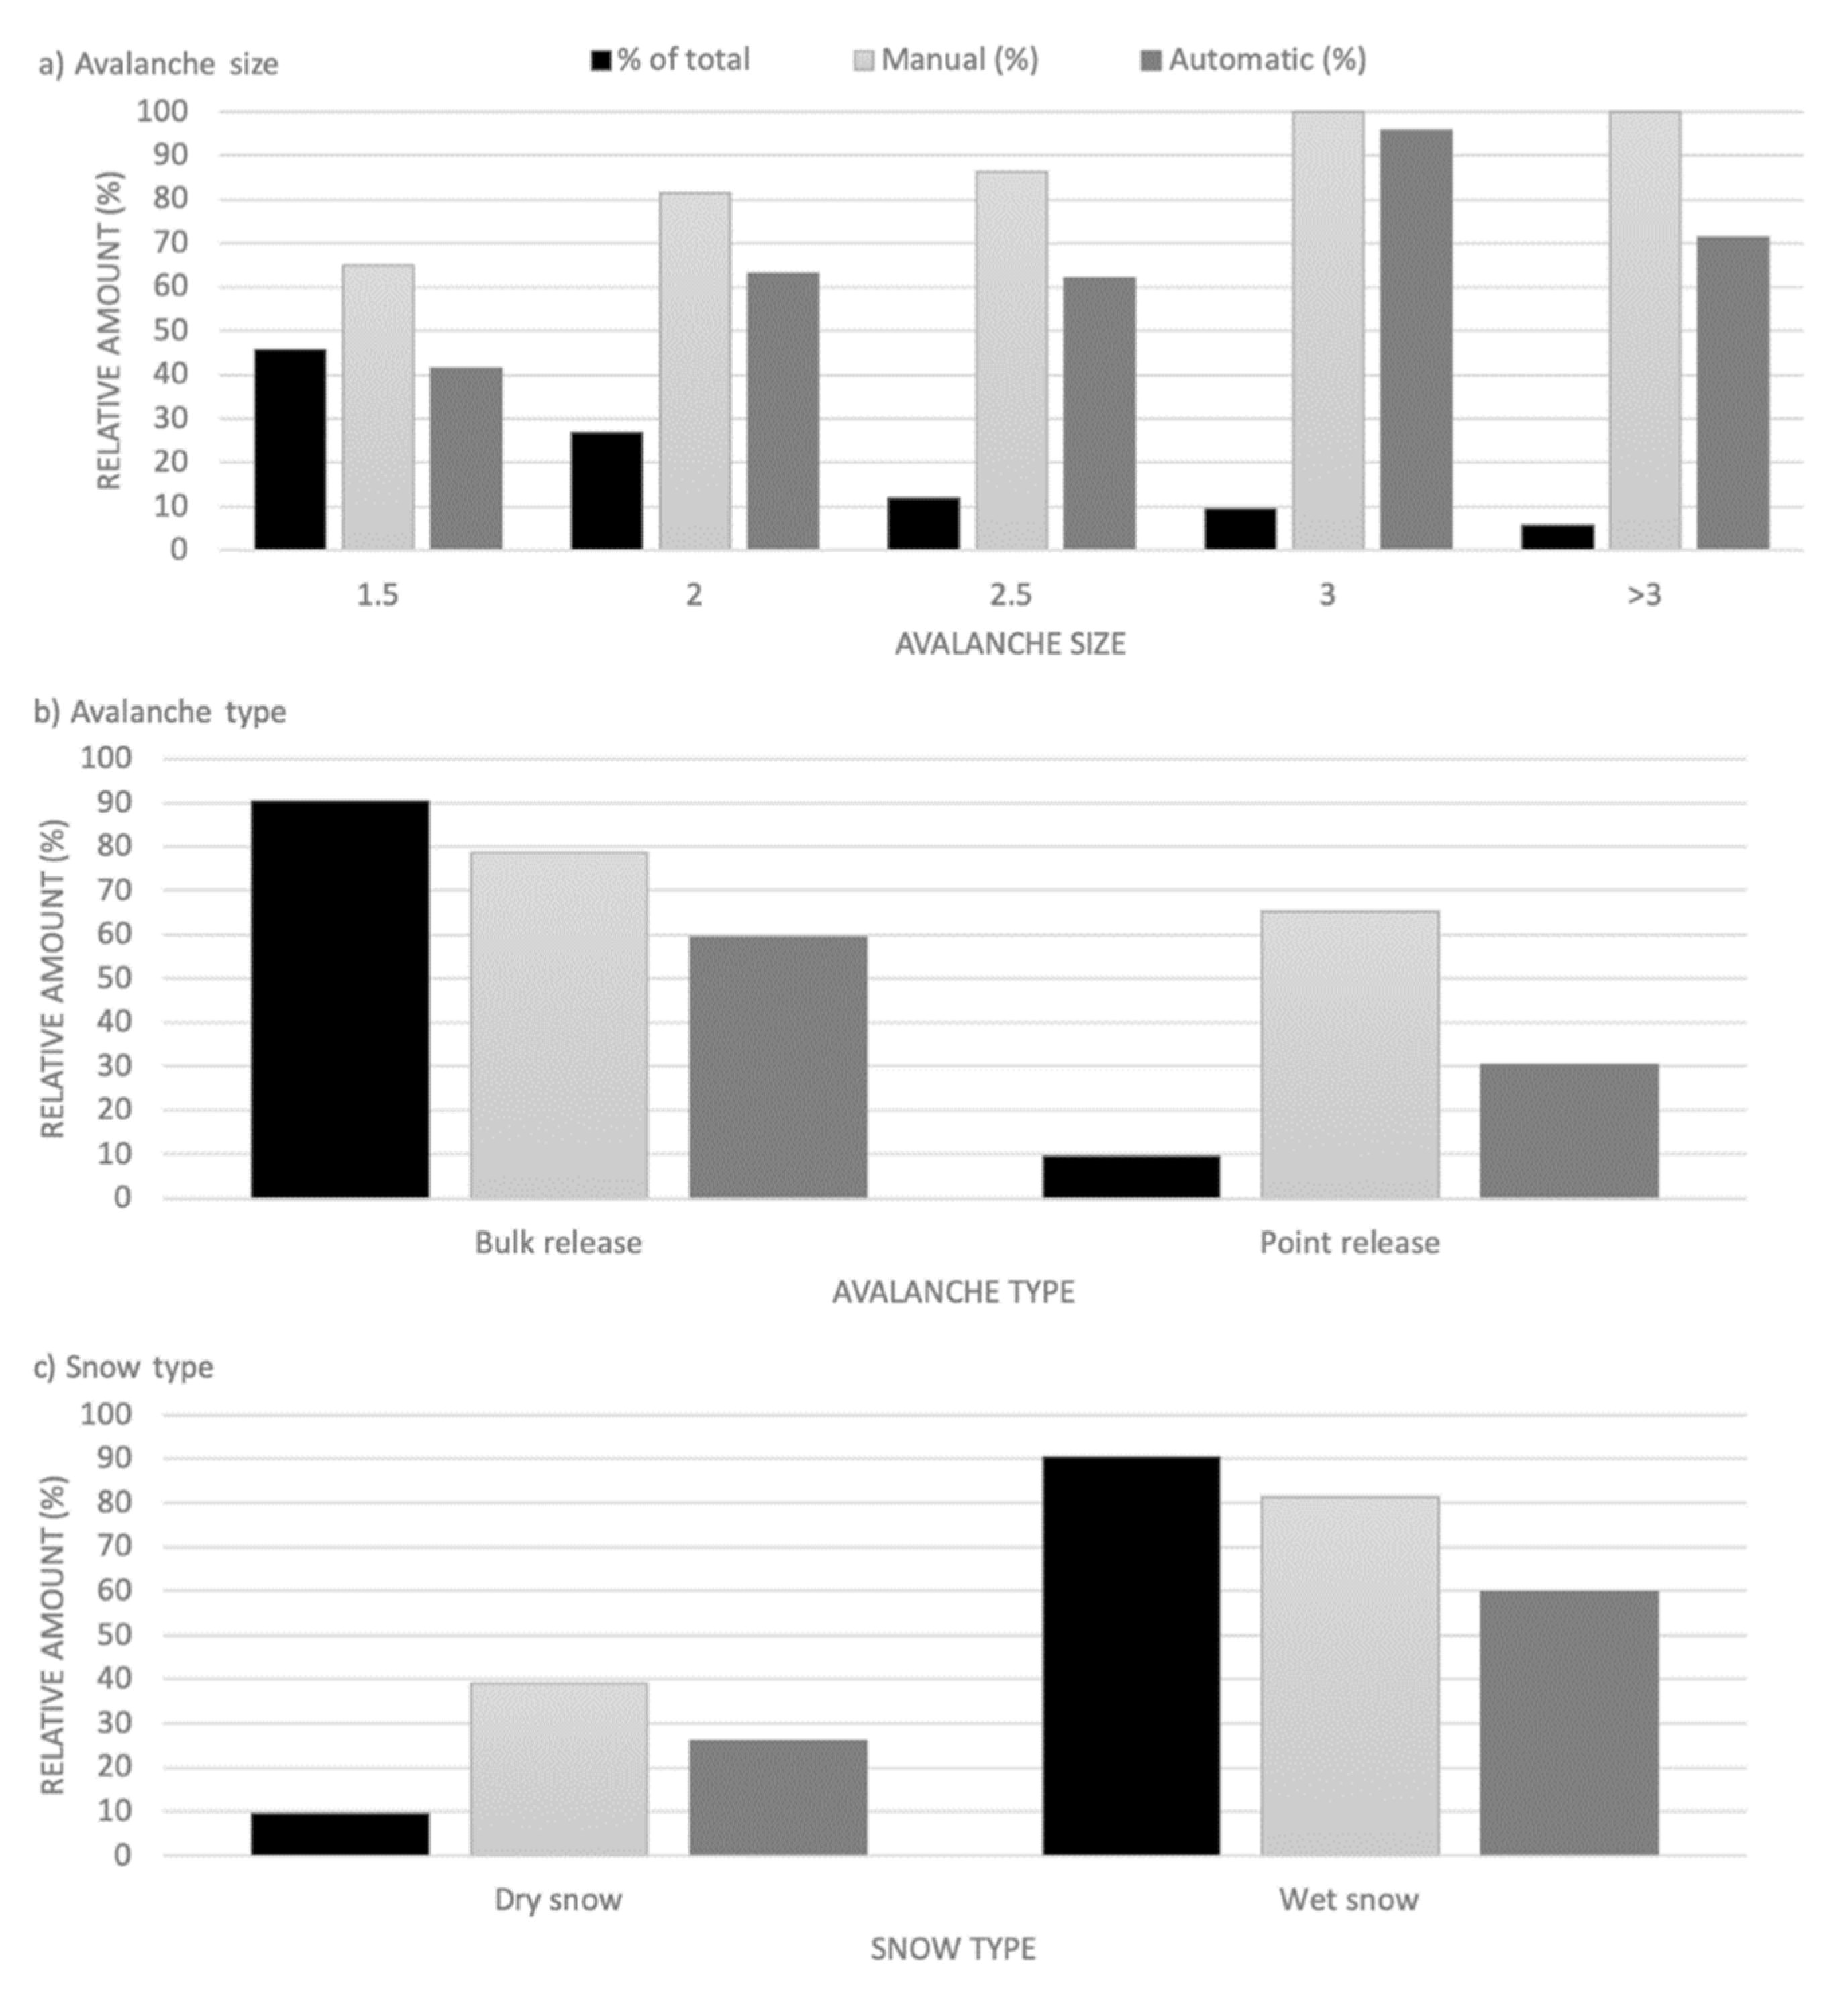
- Avalanche size: With a pixel spacing of 20 m in our processed S1 images, we are not able to detect small avalanches (unlikely to bury a person, 100 m3) or avalanches that are thinner than then sub-pixel spacing. Since we are aware of this, we have a cut-off minimum avalanche size of 10 pixels. By doing so, we can reduce the false alarm rate significantly. The detection of smaller avalanches will only be possible with higher spatial resolution SAR sensors. Eckerstorfer and Malnes [10] showed that more and smaller avalanches were detectable in very high resolution Radarsat-2 images compared to Sentinel-1 images. Future sensor constellations may provide higher spatial resolution while maintaining or increasing the temporal/spatial coverage of Sentinel-1, and thus opening for the possibility of detecting small avalanches.
- S1 data availability: For complete, near-real time avalanche detection in large regions throughout an entire winter, reliable S1 data availability is of critical importance. The S1 acquisition plan is not predictable and prone to changes. The disappearance of satellite orbits can then be especially troubling in areas at lower latitude that are covered by less orbits to begin with.
- Wet to dry snow transition: We are certainly over-detecting avalanches over the course of a winter with respect to the avalanche sizes we are capable of detecting. The single major contributor to a high false alarm rate is the change in snow conditions from wet to dry in the images that compose the change detection image we use for detection. We thus deleted the days with high false alarms resulting from wet to dry snow transition, assuming that widespread avalanche activity is unlikely when snow dries up, as the snowpack typically stabilizes and consolidates. However, this manual intervention is not ideal, especially in a near-real time monitoring scenario. A possible solution would be to automatically flag these instances of wet to dry snow transition by simply detecting wet snow in the SAR images, following a backscatter intensity thresholding method by Nagler and Rott [28].
- Radar shadow and layover areas: With the SAR instruments on board the S1 satellites being sideways looking radars, radar shadow and layover affected areas are introduced to the images. In these areas, avalanche detection is not possible. The effect of these masked out areas is in our study area negligible as most affected areas are nevertheless masked out by the avalanche runout zone mask. Nevertheless, in areas with very steep topography, radar shadow and layover affected areas could to a large degree reduce the detectable area.
- Sources of false alarms: It is not possible to determine from C-band SAR data if there is dry snow on the ground or no snow. This can lead to false alarms from changing agricultural areas, man-made infrastructure, glaciers, debris flow channels and rock fall scars. By consistently monitoring our area of interest over the past five years, we were able to identify problematic areas that led to many false alarm rates and masked them out.
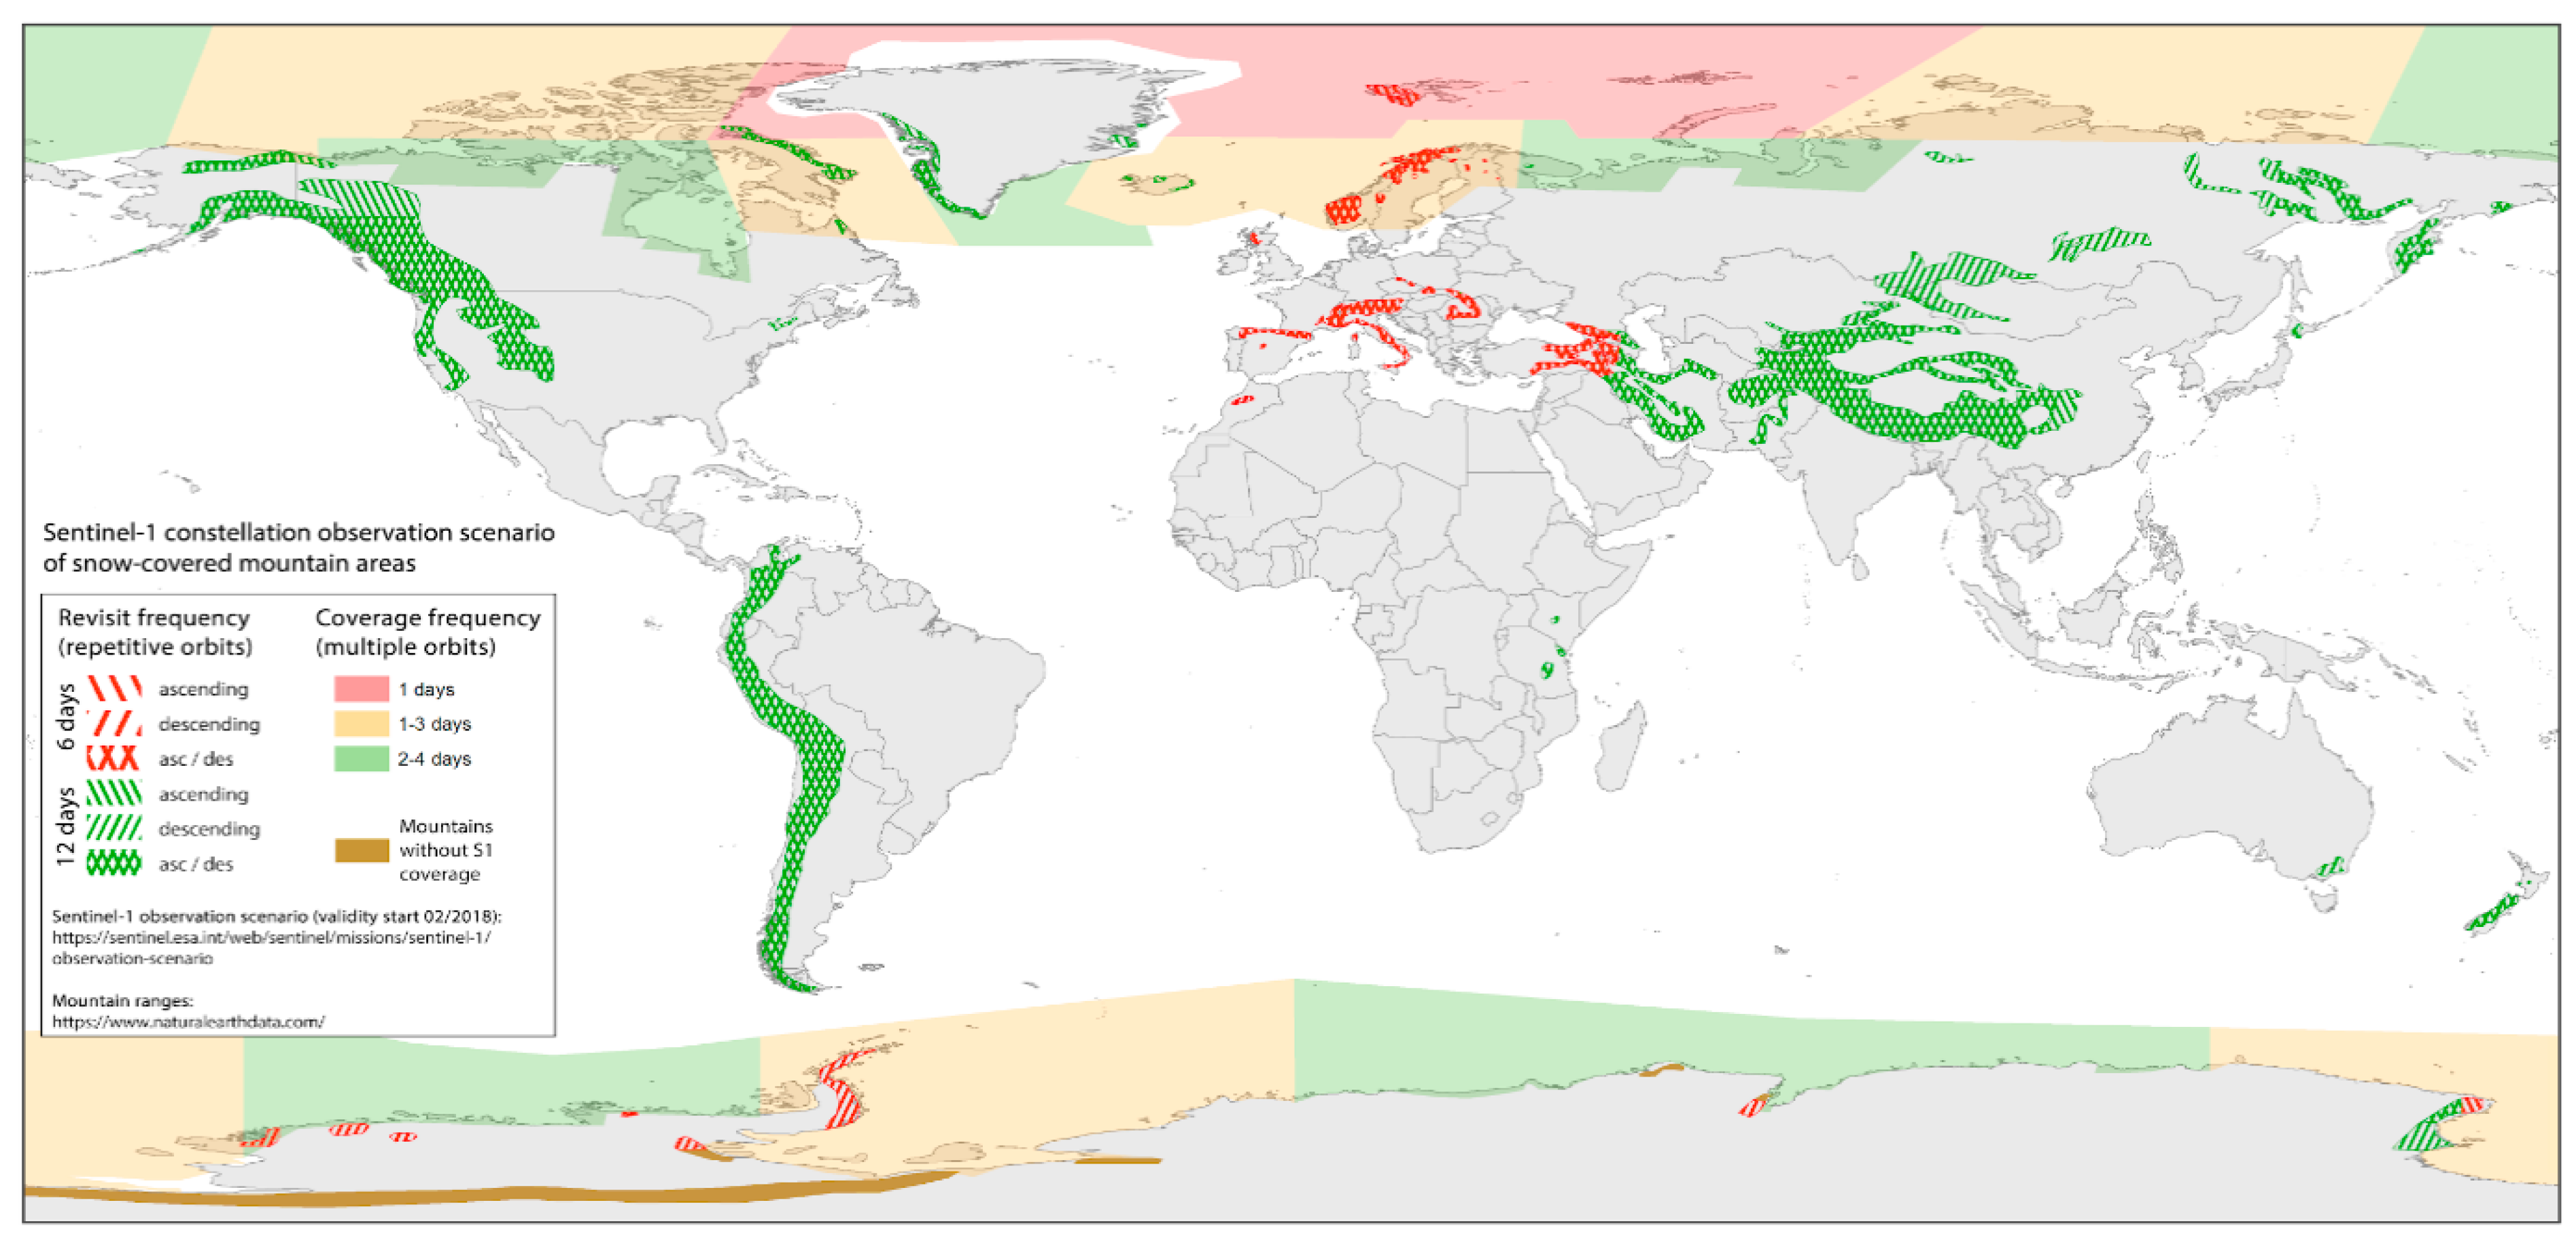
5.4. Global Application of Near-Real Time Avalanche Monitoring Using S1
- The forecasting region lies in Europe, ensuring 6-days repeat cycles and coverage at least every second day. Ideally, there is an even distribution of available ascending and descending orbits to ensure that all slope aspects are monitored equally.
- The forecasting region has a geometry that ensures complete coverage by only a few S1 orbits. Complete spatial coverage by S1 data is not only dependent on the regions’ spatial extent, but more so on its geometry relative to the footprint of S1 images. Norway is ideal as it stretches North-South and can thus be covered by only a few orbits with high frequency. If a region stretches rather East-West, more S1 orbits are required to cover the region in its entirety.
- Enough field observations should be available to validate the avalanche detections.
6. Conclusions
Author Contributions
Funding
Acknowledgments
Conflicts of Interest
References
- Techel, F.; Stucki, T.; Margreth, S.; Marty, C.; Winkler, K. Schnee und Lawinen in den Schweizer Alpen. Hydrologisches Jahr 2013/2014. 2015. Available online: https://www.slf.ch/de/publikationen/schnee-und-lawinen-in-den-schweizer-alpen-hydrologisches-jahr-201314.html (accessed on 28 October 2019).
- Rudolf-Miklau, F.; Sauermoser, S. The Technical Avalanche Protection Handbook; Mears, A.I., Ed.; Wiley Ernst & Sohn: Berlin, Germany, 2015. [Google Scholar]
- McClung, D.M. The Elements of Applied Avalanche Forecasting, Part II: The Physical Issues and the Rules of Applied Avalanche Forecasting. Nat. Hazards 2002, 26, 131–146. [Google Scholar] [CrossRef]
- Eckerstorfer, M.; Bühler, Y.; Frauenfelder, R.; Malnes, E. Remote sensing of snow avalanches: Recent advances, potential, and limitations. Cold Reg. Sci. Technol. 2016, 121, 126–140. [Google Scholar] [CrossRef]
- Vogel, S.; Eckerstorfer, M.; Christiansen, H.H. Cornice dynamics and meteorological control at Gruvefjellet, Central Svalbard. Cryosphere 2012, 6, 157–171. [Google Scholar] [CrossRef]
- Hancock, H.; Prokop, A.; Eckerstorfer, M.; Hendrikx, J. Combining high spatial resolution snow mapping and meteorological analyses to improve forecasting of destructive avalanches in Longyearbyen, Svalbard. Cold Reg. Sci. Technol. 2018, 154, 120–132. [Google Scholar] [CrossRef]
- Bühler, Y.; Hafner, E.D.; Zweifel, B.; Zesiger, M.; Heisig, H. Where are the avalanches? Rapid mapping of a large snow avalanche period with optical satellites. Cryosphere Discuss 2019. in review. [Google Scholar] [CrossRef]
- Wiesmann, A.; Wegmueller, U.; Honikel, M.; Strozzi, T.; Werner, C.L. Potential and methodology of satellite based SAR for hazard mapping. In Proceedings of the IEEE 2001 International Geoscience and Remote Sensing Symposium, Sydney, Australia, 9–13 July 2001. [Google Scholar]
- Bühler, Y.; Bieler, C.; Pielmeier, C.; Wiesmann, A.; Caduff, R.; Frauenfelder, R.; Jaedicke, C.; Bippus, G. All-weather avalanche activity monitoring from space? In Proceedings of the International Snow Science Workshop 2014, Banff, Canada, 29 September–3 October 2014; pp. 795–802. [Google Scholar]
- Eckerstorfer, M.; Malnes, E. Manual detection of snow avalanche debris using high-resolution Radarsat-2 SAR images. Cold Reg. Sci. Technol. 2015, 120, 205–218. [Google Scholar] [CrossRef]
- Malnes, E.; Eckerstorfer, M.; Vickers, H. First Sentinel-1 detections of avalanche debris. Cryosphere Discuss. 2015, 9, 1943–1963. [Google Scholar] [CrossRef]
- Eckerstorfer, M.; Malnes, E.; Vickers, H.; Müller, K.; Engeset, R.; Humstad, T. Operational avalanche activity monitoring using radar satellites: From Norway to worldwide assistance in avalanche forecasting. In Proceedings of the International Snow Science Workshop Proceedings 2018, Innsbruck, Austria, 7–12 October 2018; pp. 333–337. [Google Scholar]
- Coleou, C.; Karbou, F.; Deschartes, M.; Martin, R.; Dufour, A.; Eckert, N. The use of SAR satellite observations to evaluate avalanche activities in the French Alps during remarkable episodes of the 2017-2018 season. In Proceedings of the International Snow Science Workshop 2018, Innsbruck, Austria, 7–12 October 2018; pp. 392–395. [Google Scholar]
- Karbou, F.; Coleou, C.; Lefort, M.; Deschatres, M.; Eckert, N.; Martin, R.; Charvet, G.; Dufour, A. Monitoring avalanche debris in the French mountains using SAR observations from Sentinel-1 satellites. In Proceedings of the International Snow Science Workshop 2018, Innsbruck, Austria, 7–12 October 2018; pp. 344–347. [Google Scholar]
- Kummervold, P.E.; Malnes, E.; Eckerstorfer, M.; Arntzen, I.M.; Bianchi, F. Avalanche detection in Sentinel-1 radar images using convolutional neural networks. In Proceedings of the International Snow Science Workshop 2018, Innsbruck, Austria, 7–12 October 2018; pp. 377–381. [Google Scholar]
- Sinha, S.; Giffard-Roisin, S.; Karbou, F.; Deschatres, M.; Karas, A.; Eckert, N.; Coléou, C.; Monteleoni, C. Can Avalanche Deposits be Effectively Detected by Deep Learning on Sentinel-1 Satellite SAR Images? In Proceedings of the Climate Informatics, Paris, France, 2–4 October 2019. [Google Scholar]
- Waldeland, A.U.; Reksten, J.H.; Salberg, A.-B. Avalanche Detection in Sar Images Using Deep Learning. In Proceedings of the IGARSS 2018 IEEE International Geoscience and Remote Sensing Symposium, Valencia, Spain, 22–27 July 2018; pp. 2386–2389. [Google Scholar]
- Vickers, H.; Eckerstorfer, M.; Malnes, E.; Larsen, Y.; Hindberg, H. A method for automated snow avalanche debris detection through use of synthetic aperture radar (SAR) imaging. Earth Space Sci. 2016, 3, 446–462. [Google Scholar] [CrossRef]
- Vickers, H.; Eckerstorfer, M.; Malnes, E.; Doulgeris, A.; Sharma, P.; Bianchi, F.M. Synthetic Aperture Radar (SAR) Monitoring of Avalanche Activity: An Automated Detection Scheme. In Computer Vision—ECCV 2012; Springer Science and Business Media LLC: Berlin, Germany, 2017; Volume 10270, pp. 136–146. [Google Scholar]
- Larsen, H.T.; Hendrikx, J.; Slåtten, M.S.; Engeset, R.V. GIS based ATES mapping in Norway, a tool for expert guided mapping. In Proceedings of the International Snow Science Workshop 2018, Innsbruck, Austria, 7–12 October 2018; pp. 1604–1608. [Google Scholar]
- Veitinger, J.; Sovilla, B. Linking snow depth to avalanche release area size: measurements from the Vallée de la Sionne field site. Nat. Hazards Earth Syst. Sci. 2016, 16, 1953–1965. [Google Scholar] [CrossRef]
- Lato, M.J.; Frauenfelder, R.; Bühler, Y. Automated detection of snow avalanche deposits: segmentation and classification of optical remote sensing imagery. Nat. Hazards Earth Syst. Sci. 2012, 12, 2893–2906. [Google Scholar] [CrossRef]
- Bühler, Y.; Hüni, A.; Christen, M.; Meister, R.; Kellenberger, T. Automated detection and mapping of avalanche deposits using airborne optical remote sensing data. Cold Reg. Sci. Technol. 2009, 57, 99–106. [Google Scholar] [CrossRef]
- Korzeniowska, K.; Bühler, Y.; Marty, M.; Korup, O. Regional snow-avalanche detection using object-based image analysis of near-infrared aerial imagery. Nat. Hazards Earth Syst. Sci. 2017, 17, 1823–1836. [Google Scholar] [CrossRef]
- Heck, M.; Hammer, C.; van Herwijnen, A.; Schweizer, J.; Fäh, D. Automatic detection of snow avalanches in continuous seismic data using hidden Markov models. Nat. Hazards Earth Syst. Sci. 2018, 18, 383–396. [Google Scholar] [CrossRef]
- Thüring, T.; Schoch, M.; van Herwijnen, A.; Schweizer, J. Robust snow avalanche detection using supervised machine learning with infrasonic sensor arrays. Cold Reg. Sci. Technol. 2015, 111, 60–66. [Google Scholar] [CrossRef]
- Meier, L.; Jacquemart, M.; Blattmann, B.; Arnold, B. Real-Time Avalanche Detection with Long-Range, Wide-Angle Radars for Road Safety in Zermatt, Switzerland. In Proceedings of the International Snow Science Workshop 2016, Breckenridge, CO, USA, 3–7 October 2016; pp. 304–308. [Google Scholar]
- Nagler, T.; Rott, H. Retrieval of wet snow by means of multitemporal SAR data. IEEE Trans. Geosci. Remote. Sens. 2000, 38, 754–765. [Google Scholar] [CrossRef]


| Avalanche Forecasting Seasons (1 December–31 May) | Spatial Coverage (%) | Radar Shadow & Layover Areas (%) | |||||
|---|---|---|---|---|---|---|---|
| Orbits | 2014–2015 (N) | 2015–2016 (N) | 2016–2017 (N) | 2017–2018 (N) | 2018–2019 (N) | ||
| 029-ASC | - | - | 28 | 31 | 28 | 10.7 | 0.5 |
| 087-ASC | - | - | 13 | 29 | 29 | 42.2 | 13.4 |
| 131-ASC | 14 | 14 | 26 | 29 | 30 | 100 | 11.2 |
| 160-ASC | 12 | 15 | 27 | 26 | 28 | 81 | 20.9 |
| Ascending | 58.5 | 11.5 | |||||
| 022-DES | - | - | 13 | 31 | 30 | 100 | 5.5 |
| 058-DES | - | - | 28 | 28 | 30 | 94.1 | 16.6 |
| 066-DES | - | 15 | 27 | 29 | 29 | 100 | 24.5 |
| 095-DES | 4 | 15 | 28 | 31 | 31 | 28.5 | 14.9 |
| 139-DES | - | 11 | 28 | 25 | 28 | 97.6 | 4.6 |
| 168-DES | 14 | 14 | 28 | 30 | 29 | 34.2 | 18.4 |
| Descending | 75.7 | 14.1 | |||||
| S1 Data Totals | 44 | 84 | 246 | 289 | 292 | ||
| Nan | 132 | 104 | 61 | 18 | 5 | ||
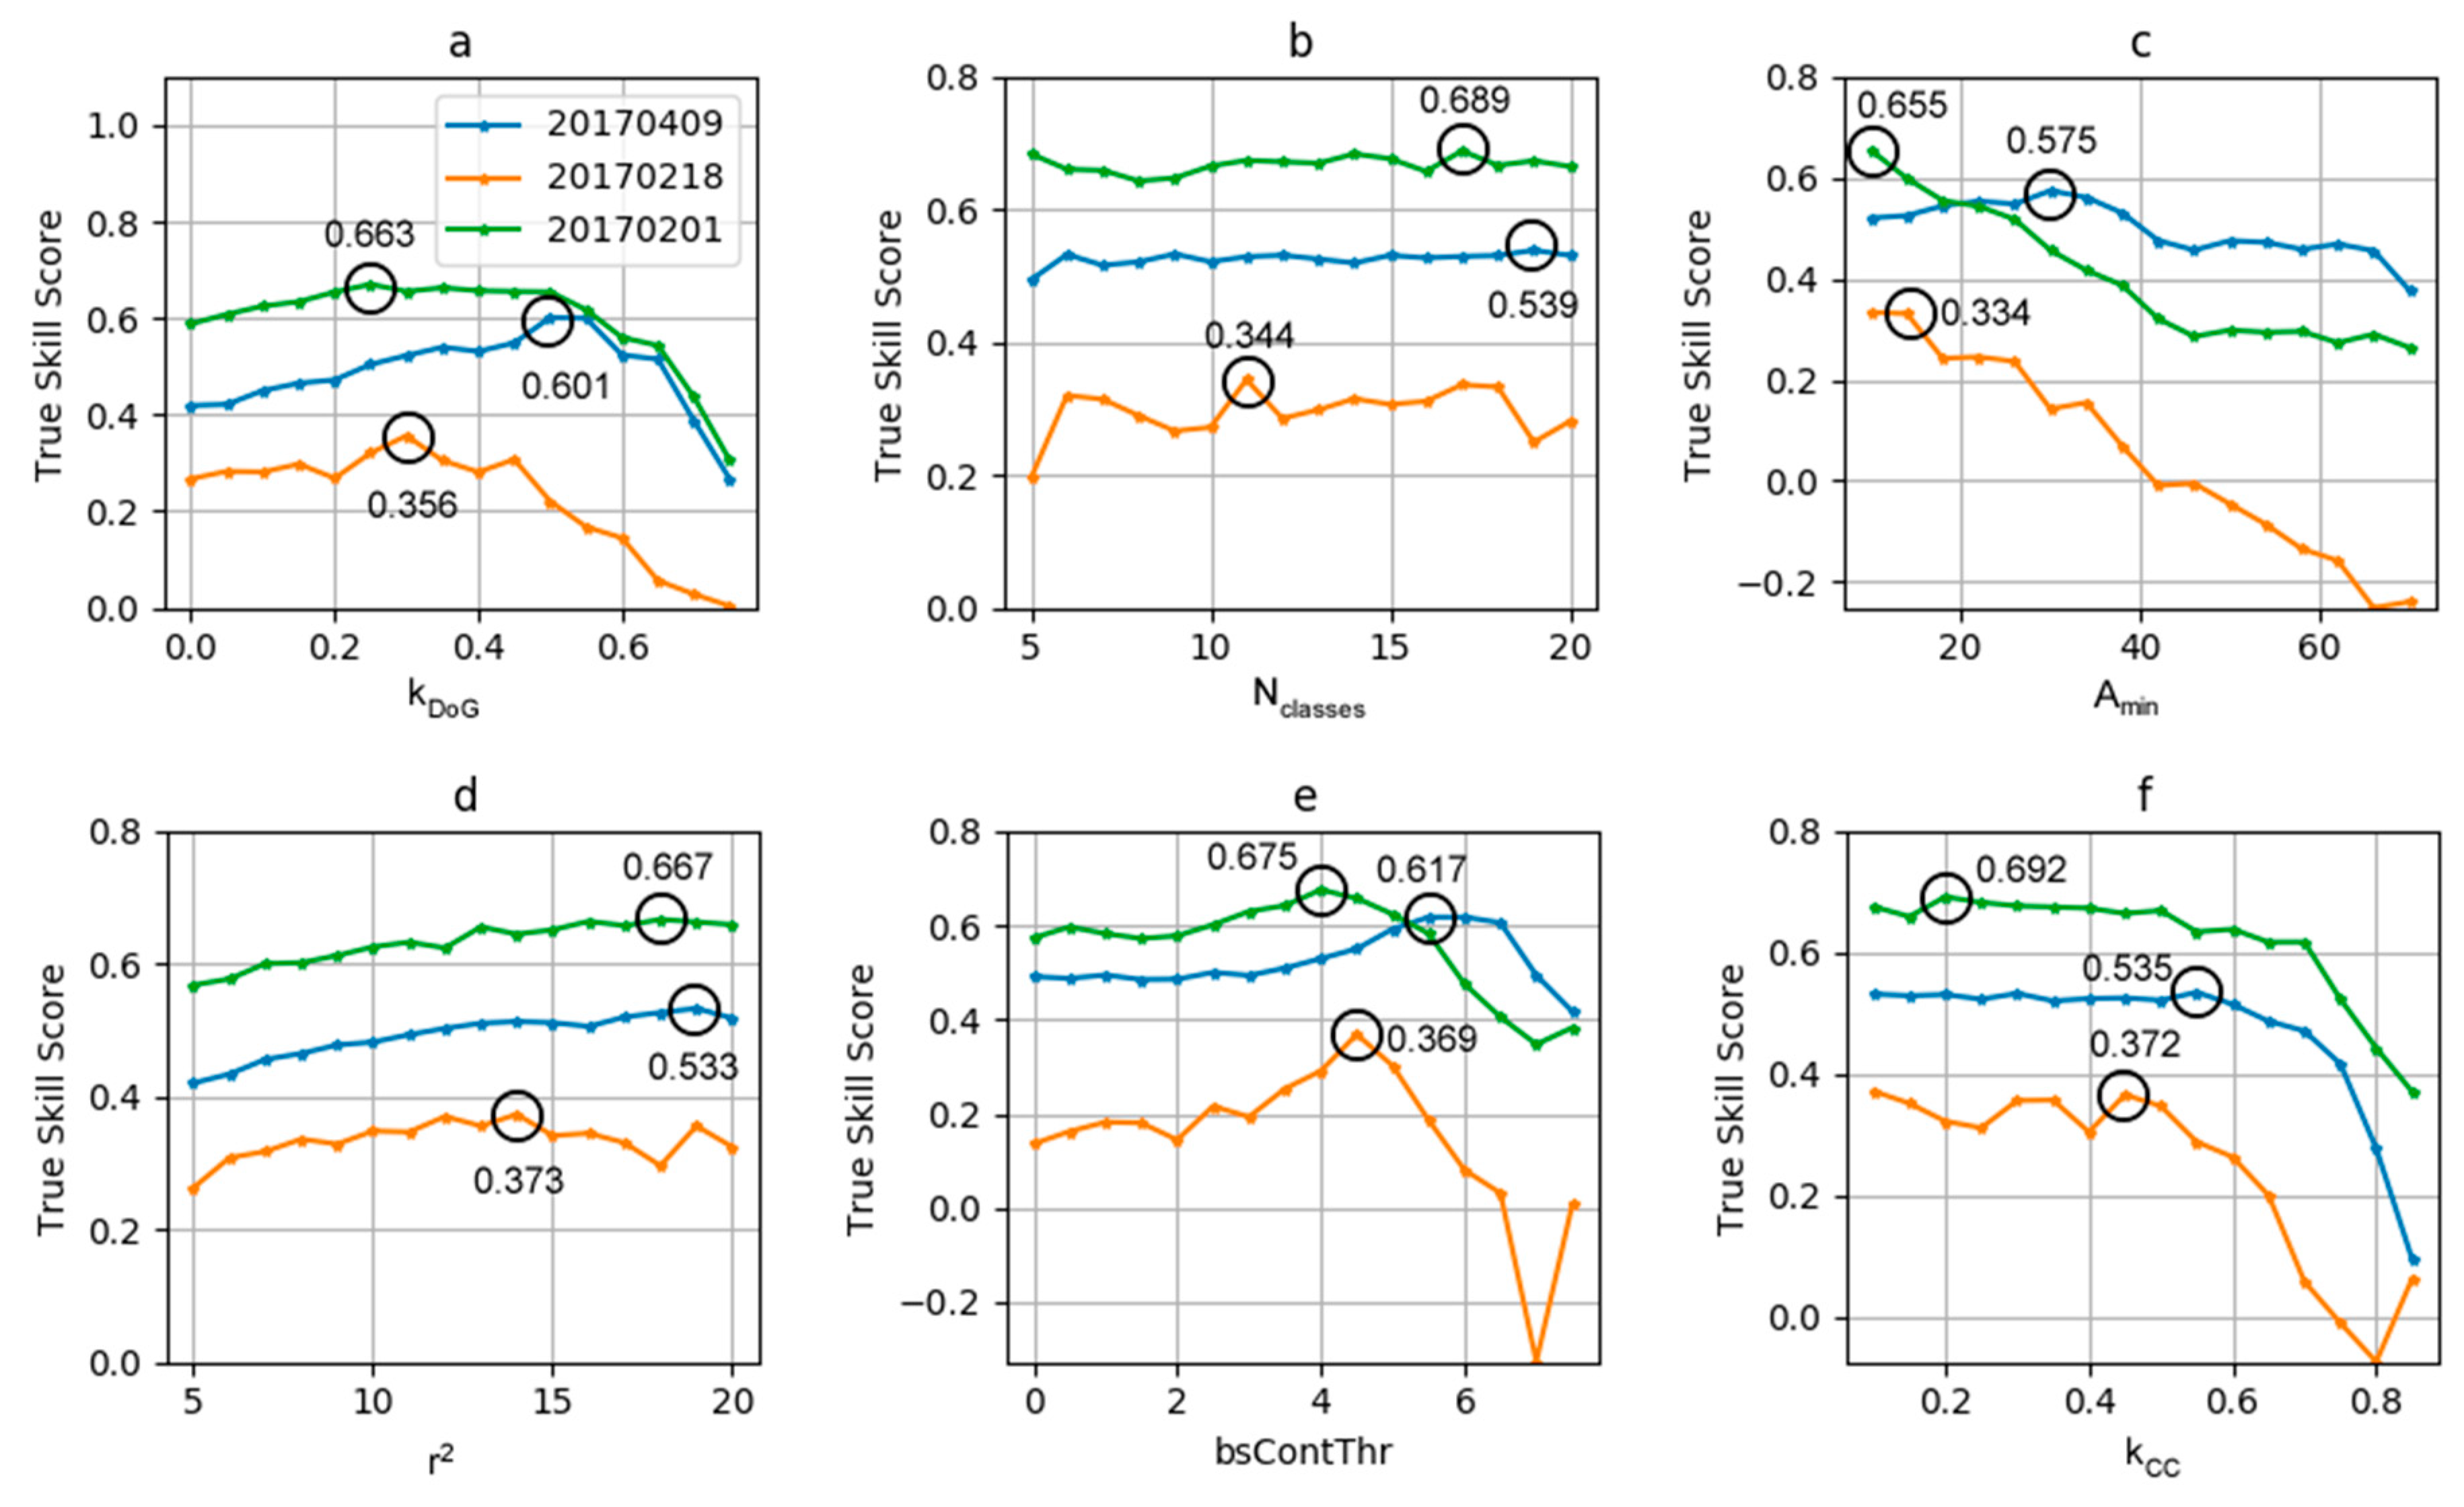
| Parameter | Description | Default Value | Values Evaluated |
|---|---|---|---|
| kDoG | Fraction of pixels in region > upper DoG threshold | 0.25 | 0–0.75 |
| Nclasses | Number of classes for image segmentation | 10 | 5–20 |
| Amin | Minimum avalanche size | 10 pixels | 10–70 pixels |
| r2 | Filter radius of second Difference of Gaussians filter | 6 | 5–20 |
| bsContThr | Backscatter contrast (false detection filter) | 4.0dB | 0–7.5dB |
| kCC | Fraction of pixels in region > class change threshold | 0.3 | 0.1–0.85 |
| # | Act | Ref | # Man Detections | Snow (ref) | Snow (act) | POD | FAR | TSS | G/RB |
|---|---|---|---|---|---|---|---|---|---|
| 1 | 20151218 | 20151206 | 33 | wet | dry | 68.8 | 56.9 | 0.119 | 1.08 |
| 2 | 20151223 | 20151129 | 36 | dry | dry | 76 | 37.7 | 0.383 | 0.82 |
| 3 | 20160101 | 20151220 | 56 | wet | wet | 70.5 | 72.1 | −0.016 | 1.20 |
| 4 | 20160218 | 20160206 | 33 | wet | dry | 31 | 35.7 | −0.047 | 0.92 |
| 5 | 20161226 | 20161214 | 186 | wet | dry | 75.7 | 52.3 | 0.234 | 0.87 |
| 6 | 20170131 | 20170125 | 265 | wet | dry | 71.4 | 26.9 | 0.445 | 0.78 |
| 7 | 20170201 | 20170126 | 359 | dry | wet | 84.1 | 27 | 0.571 | 0.96 |
| 8 | 20170204 | 20170129 | 161 | wet | dry | 70.7 | 55.2 | 0.155 | 1.13 |
| 9 | 20170214 | 20170208 | 26 | dry | dry | 85.7 | 50 | 0.357 | 0.91 |
| 10 | 20170218 | 20170212 | 196 | wet | dry | 62 | 25.9 | 0.361 | 0.86 |
| 11 | 20170409 | 20170403 | 396 | dry | wet | 87.4 | 33.5 | 0.539 | 0.80 |
| 12 | 20170511 | 20170505 | 576 | dry | wet | 59.8 | 52.5 | 0.073 | 1.06 |
| 13 | 20180115 | 20180109 | 34 | wet | dry | 56.1 | 81.7 | −0.256 | 1.05 |
| 14 | 20180421 | 20180415 | 63 | wet | wet | 41.3 | 35 | 0.063 | 1.12 |
| avg. | 67.2 | 45.9 | 0.213 | 1.0 | |||||
| min. | 31.0 | 25.9 | −0.256 | 0.8 | |||||
| max. | 87.4 | 81.7 | 0.571 | 1.2 | |||||
| stdv. | 16.2 | 17.2 | 0.241 | 0.1 |
| Manual Detections (True Condition) | ||||
|---|---|---|---|---|
| Yes | No | |||
| Automatic detections (predicted condition) | Yes | 138 | 0 | |
| No | 50 | 55 | 0.52 b | |
| a True positive rate (sensitivity). b Negative predictive value. c Accuracy. | 0.73 a | |||
| 0.79 c | ||||
© 2019 by the authors. Licensee MDPI, Basel, Switzerland. This article is an open access article distributed under the terms and conditions of the Creative Commons Attribution (CC BY) license (http://creativecommons.org/licenses/by/4.0/).
Share and Cite
Eckerstorfer, M.; Vickers, H.; Malnes, E.; Grahn, J. Near-Real Time Automatic Snow Avalanche Activity Monitoring System Using Sentinel-1 SAR Data in Norway. Remote Sens. 2019, 11, 2863. https://doi.org/10.3390/rs11232863
Eckerstorfer M, Vickers H, Malnes E, Grahn J. Near-Real Time Automatic Snow Avalanche Activity Monitoring System Using Sentinel-1 SAR Data in Norway. Remote Sensing. 2019; 11(23):2863. https://doi.org/10.3390/rs11232863
Chicago/Turabian StyleEckerstorfer, Markus, Hannah Vickers, Eirik Malnes, and Jakob Grahn. 2019. "Near-Real Time Automatic Snow Avalanche Activity Monitoring System Using Sentinel-1 SAR Data in Norway" Remote Sensing 11, no. 23: 2863. https://doi.org/10.3390/rs11232863
APA StyleEckerstorfer, M., Vickers, H., Malnes, E., & Grahn, J. (2019). Near-Real Time Automatic Snow Avalanche Activity Monitoring System Using Sentinel-1 SAR Data in Norway. Remote Sensing, 11(23), 2863. https://doi.org/10.3390/rs11232863