Article

A New Typhoon-Monitoring Method Using Precipitation Water Vapor

1
College of Geomatics, Xi’an University of Science and Technology, Xi’an 710054, China
2
School of Geodesy and Geomatics, Wuhan University, Wuhan 430072, China
*
Author to whom correspondence should be addressed.
Remote Sens. 2019, 11(23), 2845; https://doi.org/10.3390/rs11232845
Submission received: 28 October 2019 / Revised: 27 November 2019 / Accepted: 27 November 2019 / Published: 29 November 2019

Abstract

:
Some seasonal natural floods can be attributed to typhoons that bring a large amount of atmospheric water vapor, and variations in atmospheric water vapor can be reflected in the precipitable water vapor (PWV). Therefore, monitoring typhoons based on the anomalous variations of the PWV is the focus of this paper. The anomalous variations of ERA5(fifth-generation reanalysis dataset of the European Centre for Medium-range Weather Forecasting)-derived PWV with other atmospheric parameters related to typhoons, such as precipitation, pressure, and wind, were first analyzed during typhoon periods. After that, a typhoon-monitoring method with and without considering the typhoon’s acceleration was proposed according to the time of the maximum value of the PWV during the typhoon period in this paper. Corresponding experiments based on the measured and simulated data were performed to evaluate the proposed method. The experimental measurement of Typhoon Hato revealed that the velocity of the typhoon’s movement estimated by the proposed method was close to the observed value, and the maximum difference between the estimated and observed values was less than 3 km/h. A simulated experiment was also carried out in which the acceleration of the typhoon’s movement was also considered. The simulated results verified the reliability and feasibility of the proposed method. The estimated velocity and acceleration of the typhoon’s movement were almost equal to the true values under the cases of using different numbers of stations and selecting various typhoon locations. Such results obtained above indicate that the method proposed in this paper has a significant potential application value for typhoon monitoring.

Graphical Abstract

1. Introduction

A tropical cyclone, which is formed on the tropical or subtropical ocean surface, is one of the most destructive and harmful weather systems [1,2]. Bender et al. [3] simulated and predicted tropical cyclones using a proposed model and proposed that more severe storms may occur as a result of the warming of the climate. China is one of the countries most affected by typhoon disasters, where typhoons have affected ten coastal provinces and six inland provinces, and more than 250 million properties have been lost due to typhoon disasters in the past [4]. Under the background of climate change characterized by global warming, the number of extreme weather and climate disasters have increased significantly, and their effects on social and economic development have also become increasingly serious [5].
Typhoon landings bring with them a considerable amount of atmospheric water vapor [6,7], causing extreme disasters, such as the rain storms. Precipitable water vapor (PWV), which is used to reflect variations in the atmospheric water vapor, is the basis of moisture and atmospheric heat transfers and the result of the balance between precipitation, evaporation, and water vapor convergence [8]. Having sufficient atmospheric water vapor is a prerequisite for rainfall. Therefore, PWV plays an important role in the process of rainfall brought by typhoon events. Some techniques have been used to detect PWV, such as radiosonde telemetry, microwave radiometry, solar photometry, and satellite remote sensing [9]. However, these techniques are limited by certain shortcomings, such as low spatial resolution, poor temporal resolution, and unreliable accuracy [10,11,12,13]. Bevis et al. [14] proposed the concept of Global Navigation Satellite System (GNSS) meteorology, which enabled the PWV to be retrievable from GNSS observations with a high precision and temporal resolution, and under all-weather conditions. Some studies have shown that GNSS-derived PWV is accurate and reliable, with RMS values of 1–3 mm [14,15,16,17]. The GNSS-derived PWV has also been widely used in different fields, such as the monitoring and forecasting for extreme short-term disasters [6,18].
Previously, some studies have analyzed the variations of PWV during a typhoon landing. Choy et al. [19] monitored the storm that occurred in Melbourne in 2010 based on the GPS-derived PWV. Zhao et al. [6] and Yao et al. [18] proposed a method for forecasting precipitation during a typhoon period using a GNSS-derived PWV time series. Tang et al. [20] found that GNSS-derived PWV displayed a continually increasing trend as the typhoon approached Zhejiang province in 2016. Nykiel et al. [21] determined that GNSS-derived PWV in a high-density network can be used not only to monitor the current location of storms, but also to potentially predict storms. Such previous studies indicate the potential capability of GNSS-derived PWV to monitor typhoon events. However, previous studies have focused mainly on the analysis of various characteristics of the PWV during typhoon events; a thorough understanding of the PWV in typhoon disaster events has yet to be achieved. Therefore, PWV cannot be used to monitor the characteristics of typhoons, such as the velocity and acceleration of a typhoon’s movement, accurately within a short time.
With the rapid development and popularization of GNSS technology, GNSS data with high precision and high spatio-temporal resolutions can be obtained in the near future. These data will not only provide support for weather monitoring of severe convective extreme disasters, but will also increase the application potential of GNSS-derived PWV in typhoon monitoring. However, the corresponding theory is deficient, and thus, this study attempts to establish a corresponding theory for monitoring typhoons using the PWV data. The fifth-generation atmospheric reanalysis data of the global climate (ERA5) was released in 2018 with the spatial and temporal resolutions of 0.25° × 0.25° and 1 h, respectively [22]. Compared with the previous version (ERA-Interim), the temporal resolution has improved by six times. Therefore, the PWV and the corresponding atmospheric parameters, such as pressure and wind, derived from ERA5 were used to perform the typhoon monitoring experiment, and the ERA5-derived PWV was validated using the GNSS-derived PWV from Zhang et al. [23].
In this paper, a typhoon monitoring approach was proposed using the PWV data, which was validated based on the measured and simulated data. The time-varying characteristics of the PWV, pressure, and wind velocity during the typhoon period were analyzed, and the velocity and acceleration of a typhoon’s movement were estimated using the proposed method in this paper. Finally, a comparison experiment revealed the good performance of the proposed typhoon monitoring approach. This paper is organized as follows: Section 2 describes the data used and the study area; time-varying characteristics of the PWV, pressure, and wind velocity are analyzed in Section 3, and a typhoon monitoring method is proposed in Section 4; and the conclusion is summarized in Section 5.

2. Study Area and Data Description
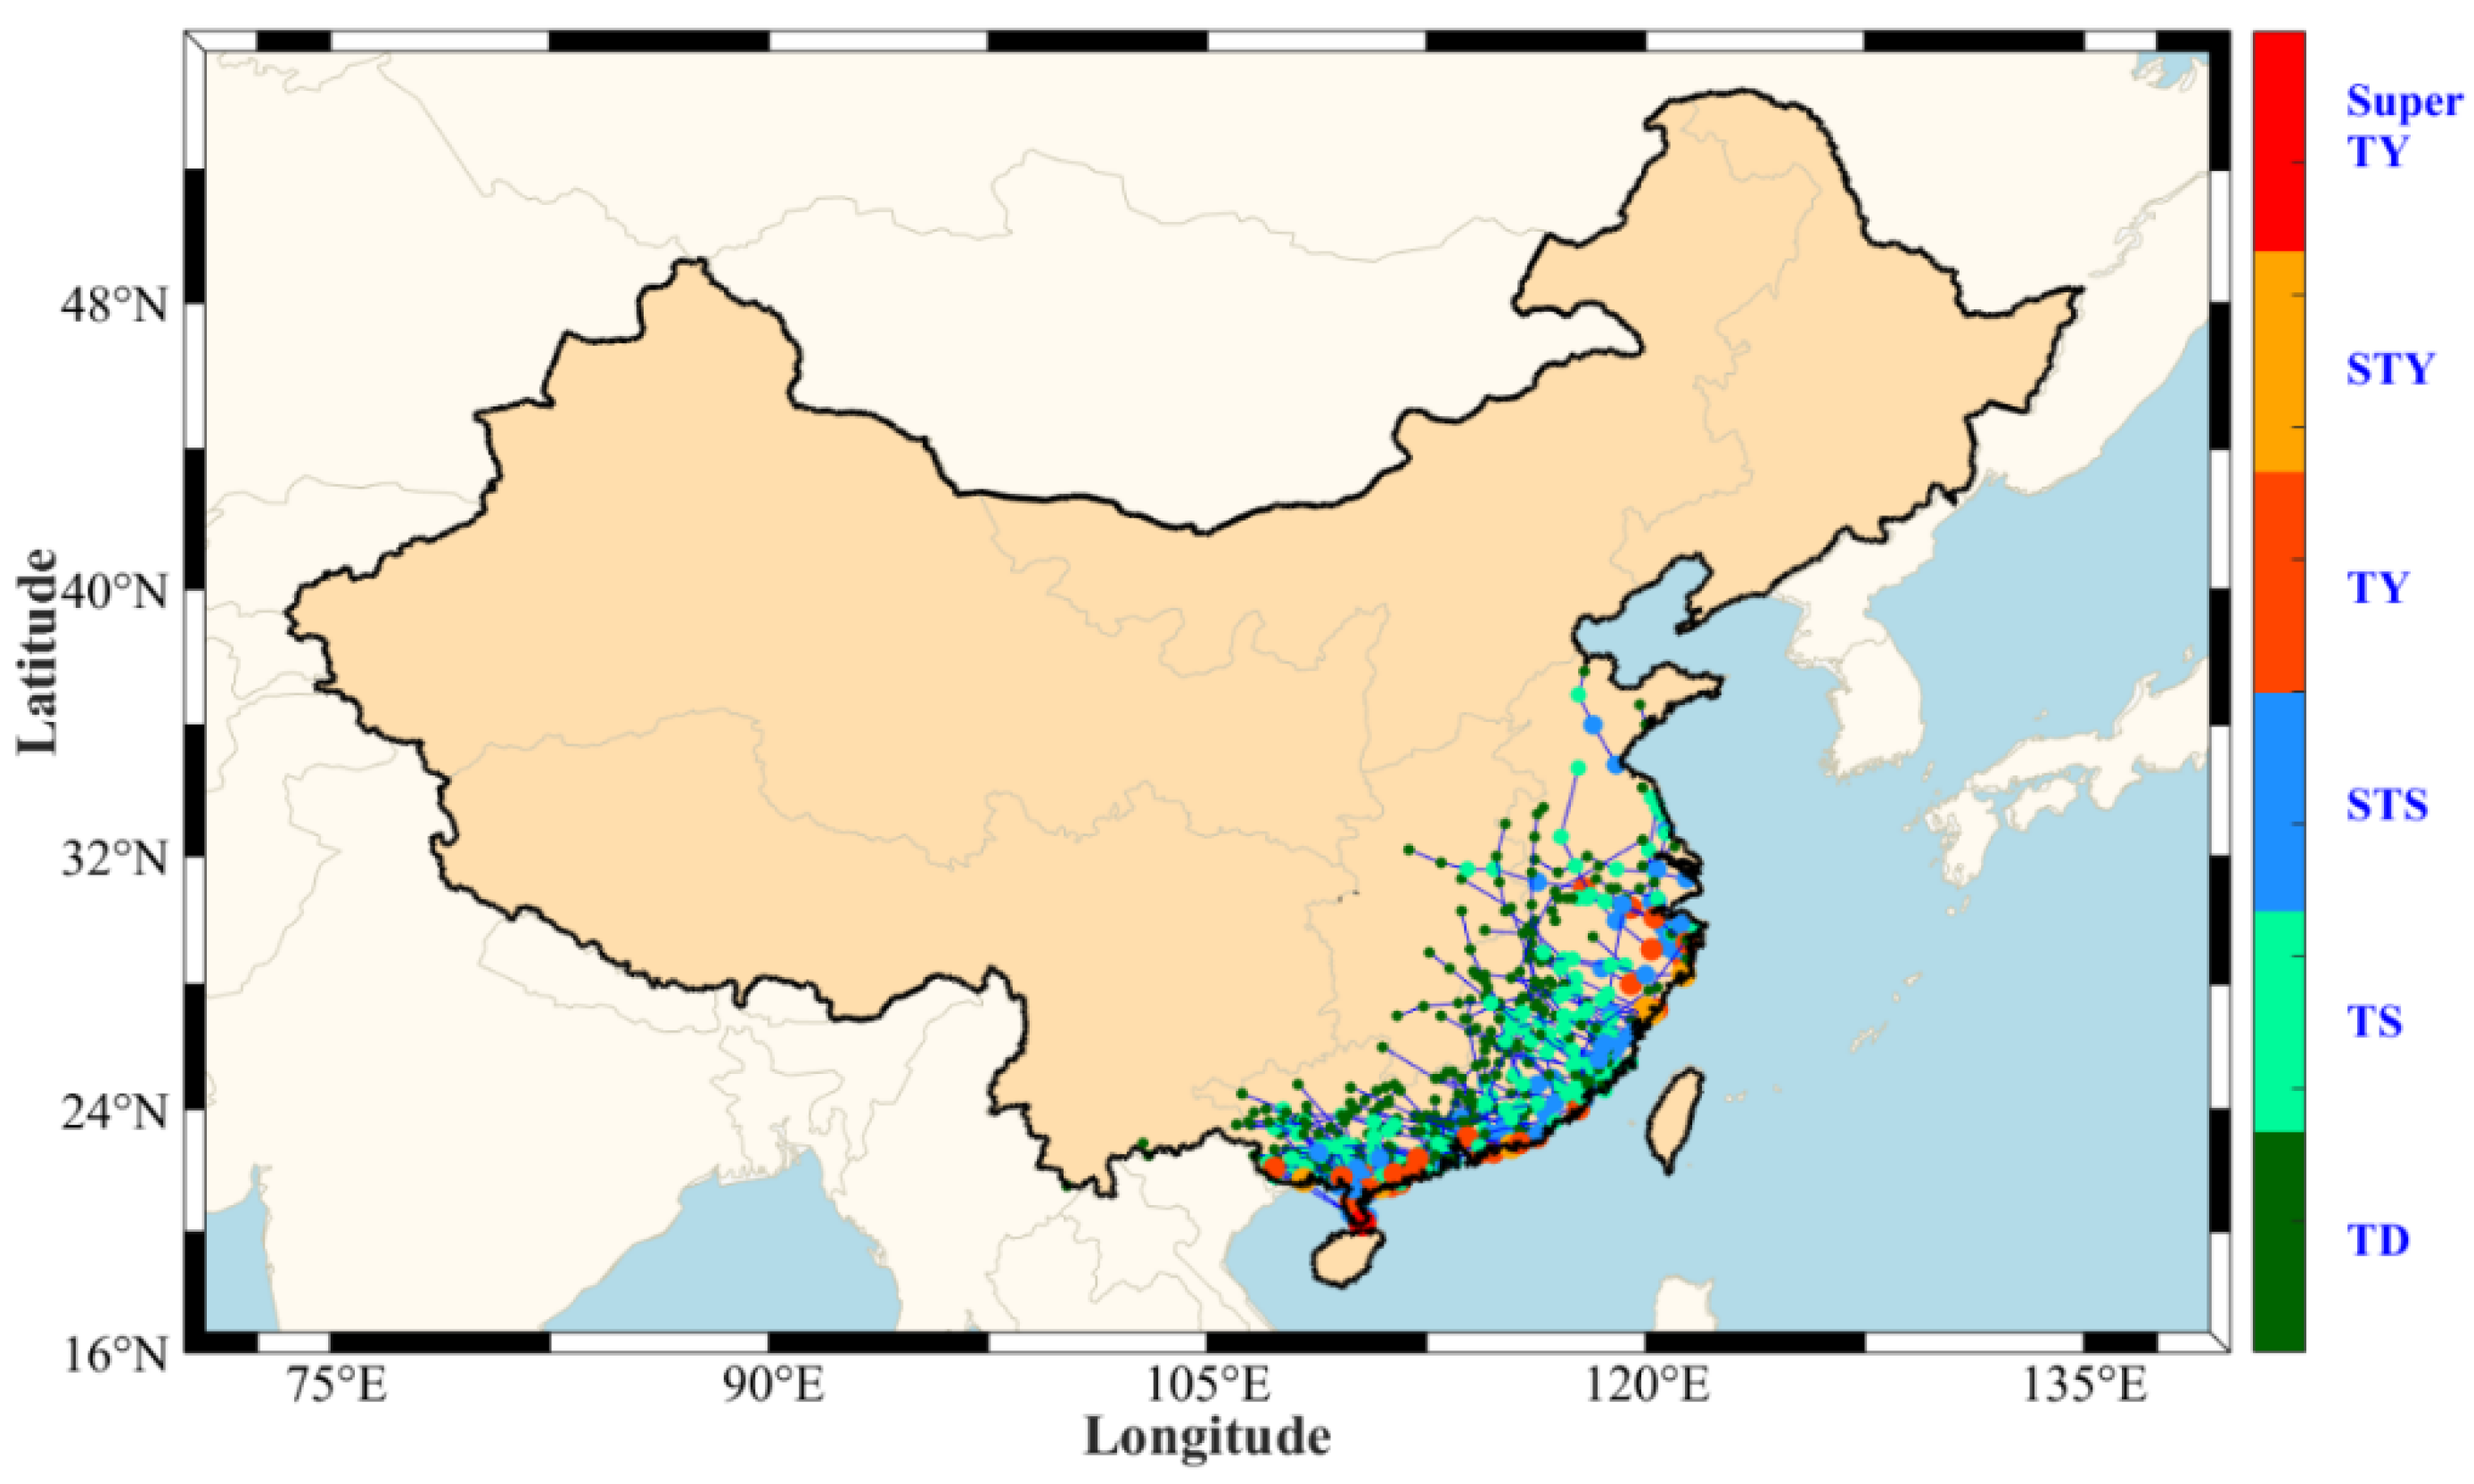
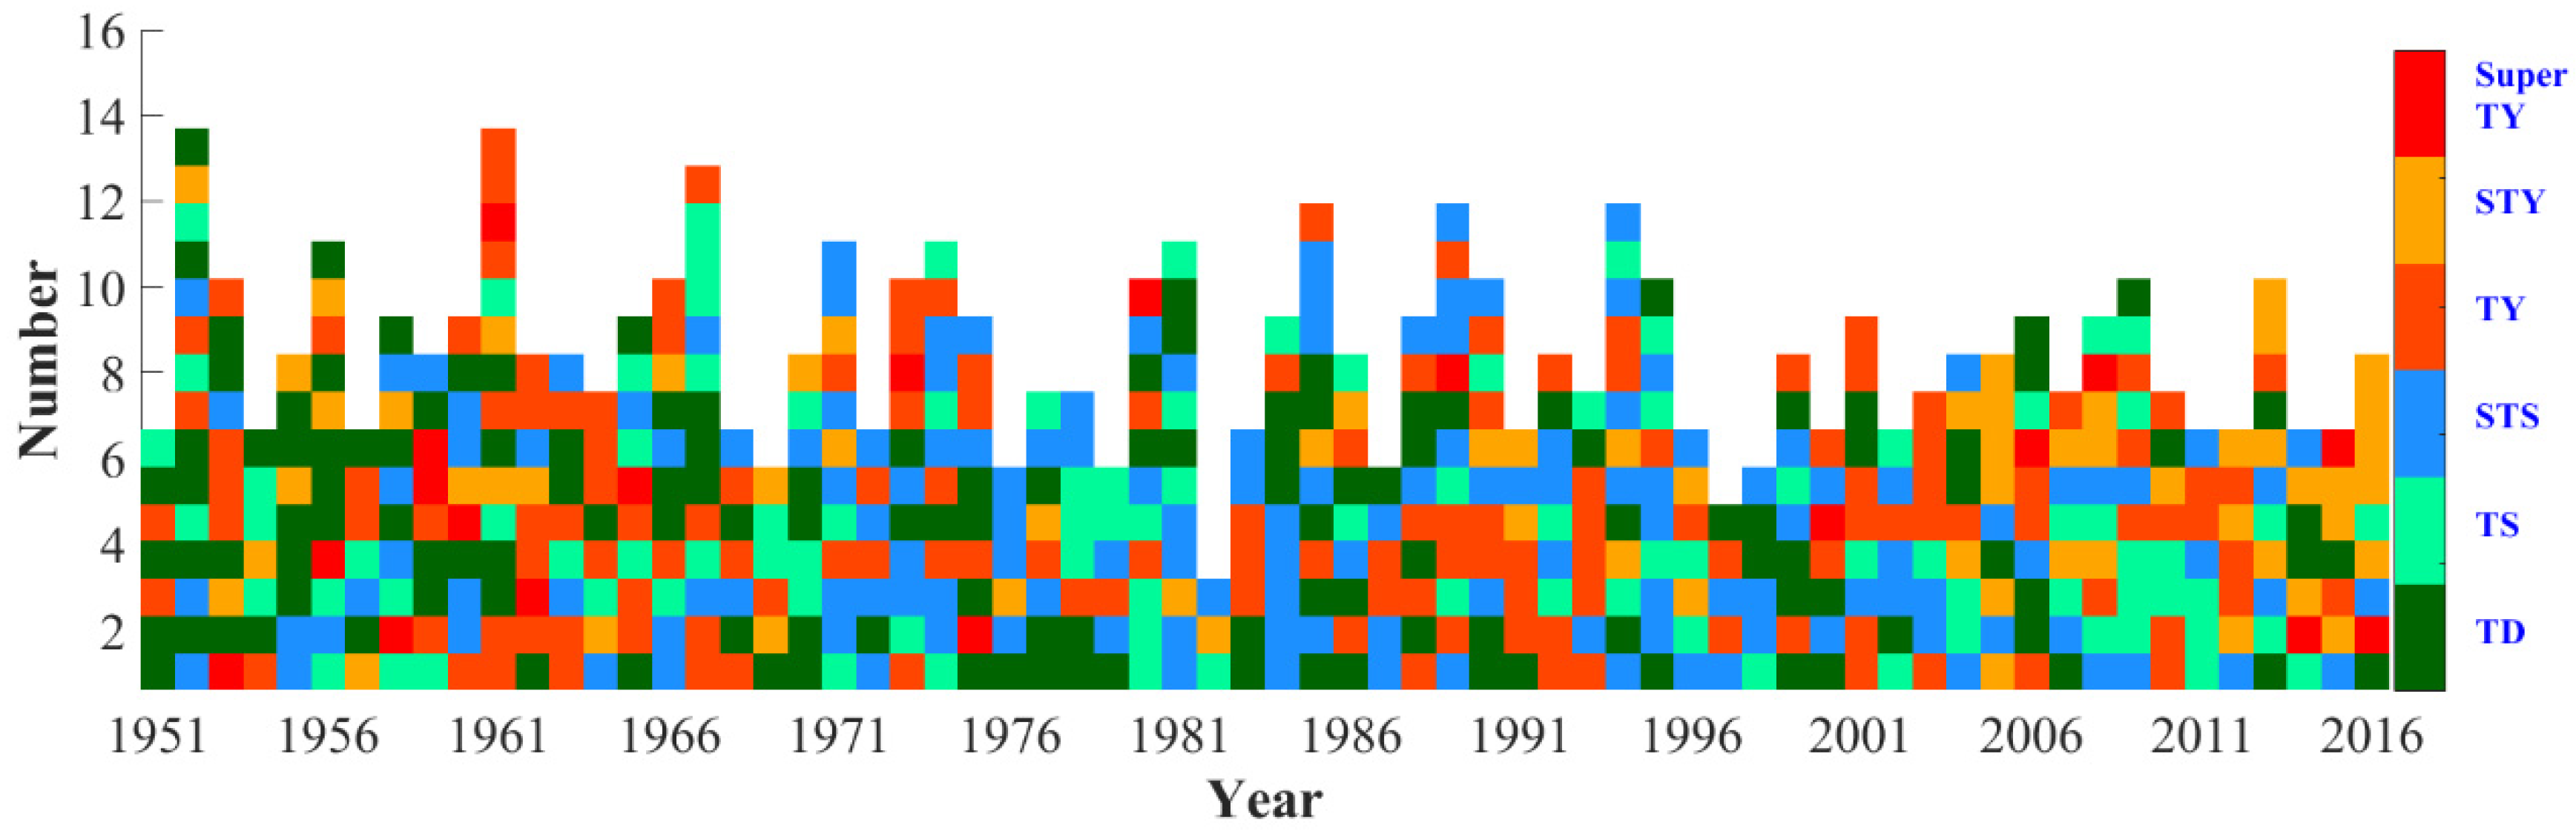
2.1. Study Area

China is located on the west coast of the northwest Pacific Ocean. It is the most active area for tropical cyclones in the world, with the annual total of tropical cyclones generated in the northwest Pacific Ocean numbering more than 20. The number of typhoons landing in China is over 10 every year, and the number for individual years is as high as 14. The southeastern coastal area is the most developed and densely populated area in China. It is also one of the areas that are most severely affected by typhoons in the world [24]. Figure 1 shows the tracking of typhoons that landed in China from 1951–2017. According to the recordings from 1951–2017, the total number of typhoons landing in China was approximately 850, with more than 450 of the 850 typhoons landing on the southeast coast of China. The strong winds, rainstorms, and storm surges brought by tropical cyclones have a severe effect on infrastructure, property, personal safety, and agricultural production activities in coastal cities of China. Therefore, this area is one of the areas most frequently and seriously affected by typhoons in China [25]. The frequency of strong typhoon and super typhoon events in China is increasing, as indicated in the statistical results of typhoon events landing on the southeastern coast of China over the past 66 years (Figure 2). Before 2000, the landing frequency of strong typhoons and super typhoons in China was 9 times per 10 years; this value reached 23 times per 10 years after 2000.

2.2. Data Description

The typhoon data used in this paper were derived from the tropical cyclone data center of the China Meteorological Administration [26], which can be downloaded from http://tcdata.typhoon.org.cn/. This dataset covers the period from 1949 to 2018 and provides the location and intensity of tropical cyclones every six hours in the northwest Pacific Ocean (including the South China Sea, north of the equator, and west of 180 degrees east longitude). According to the National Standard of Tropical Cyclone Classification (GBT 19201-2006), the intensity of a tropical cyclone landing is divided into six grades (Table 1). However, this dataset does not provide the velocity of a typhoon’s movement. To verify the velocity estimated by the method proposed in this paper, the velocity of the corresponding Typhoon Hato on 23 August 2017 was obtained from the China Meteorological Observatory Typhoon Network (http://typhoon.nmc.cn/web.html).
The PWV and corresponding atmospheric parameters (pressure, precipitation, and wind) used in this paper were derived from the ERA5 dataset, which can be downloaded from https://www.ecmwf.int. ERA5 is the fifth-generation atmospheric reanalysis data of the global climate, and this version is mainly used to monitor data on climate change, scientific research, education, and business applications, and provides a way to assess climate trends and climate change [22,27]. Compared to the previous four reanalysis datasets (FGGE(First Garp Globe Experiment), ERA-15, ERA-40, and ERA-Interim), ERA5 adds many new variables, including a 100 m wind component.
To evaluate the accuracy of the ERA5-derived PWV, the PWV values derived from GNSS and radiosonde telemetry were also used in this paper. The GNSS-derived PWV with a temporal resolution of four times daily over the period of 2005–2016 was obtained from the Crustal Movement Observation Network of China (CMONOC) from more than 250 GNSS stations, which were calculated with the mean RMS value of approximately 0.7 mm [23]. The radiosonde-derived PWV was obtained from the Integrated Global Radiosonde Archive Version 2 (IGRA2) dataset. Compared to the previous version (IGRA1), IGRA2 includes more stations and has a longer recording, which includes the geopotential height, pressure, temperature, relative humidity, and other atmospheric parameters. Such data can be downloaded from ftp://ftp.ncdc.noaa.gov/pub/data/igra/. The specific process of calculating the PWV using radiosonde data can be seen in our previous study [28].

3. Anomalous Analysis of PWV with other Atmospheric Parameters during the Typhoon Period

3.1. Validation of ERA5-Derived PWV Using GNSS and Radiosonde Data

The ERA5-derived PWV data were used to monitor a typhoon’s movement, and therefore the verification of its accuracy and reliability was first required, with the results presented in this section. The PWV values at 249 GNSS and 87 radiosonde stations were interpolated using the surrounding data of four grid-based points derived from the ERA5 dataset and compared with that from the GNSS and radiosonde. Figure 3 presents the RMS and bias distributions of the PWV differences between GNSS/radiosonde and ERA5 at various stations over the period of 2005–2016. Figure 3a shows that the RMS of the ERA5-derived PWV had a good performance when compared to that from the GNSS and radiosonde, except for the central part of Southwest China. Figure 3b reveals that the distribution of bias was similar to that of the RMS. The statistical result shows that the mean RMS and bias over China were approximately 2.1 mm and 0.6 mm, respectively. Such accuracy indicates that the ERA5-derived PWV met the requirements for typhoon monitoring [29].

3.2. Validation of ERA5-Derived PWV Using GNSS and Radiosonde Data

The variations of the PWV with atmospheric parameters (precipitation, pressure, and wind) during the process of typhoon landing were investigated by choosing four typhoon events in 2017, namely Merbok, Nesat, Hato, and Khanun. These four typhoons landed in Hong Kong, Taipei, Macao, and Haikou, China, in June, July, August, and October, respectively, causing damage to the coastal cities’ facilities and severe losses to the economy. Figure 4 shows the tracks of the four selected typhoon events and their intensity.

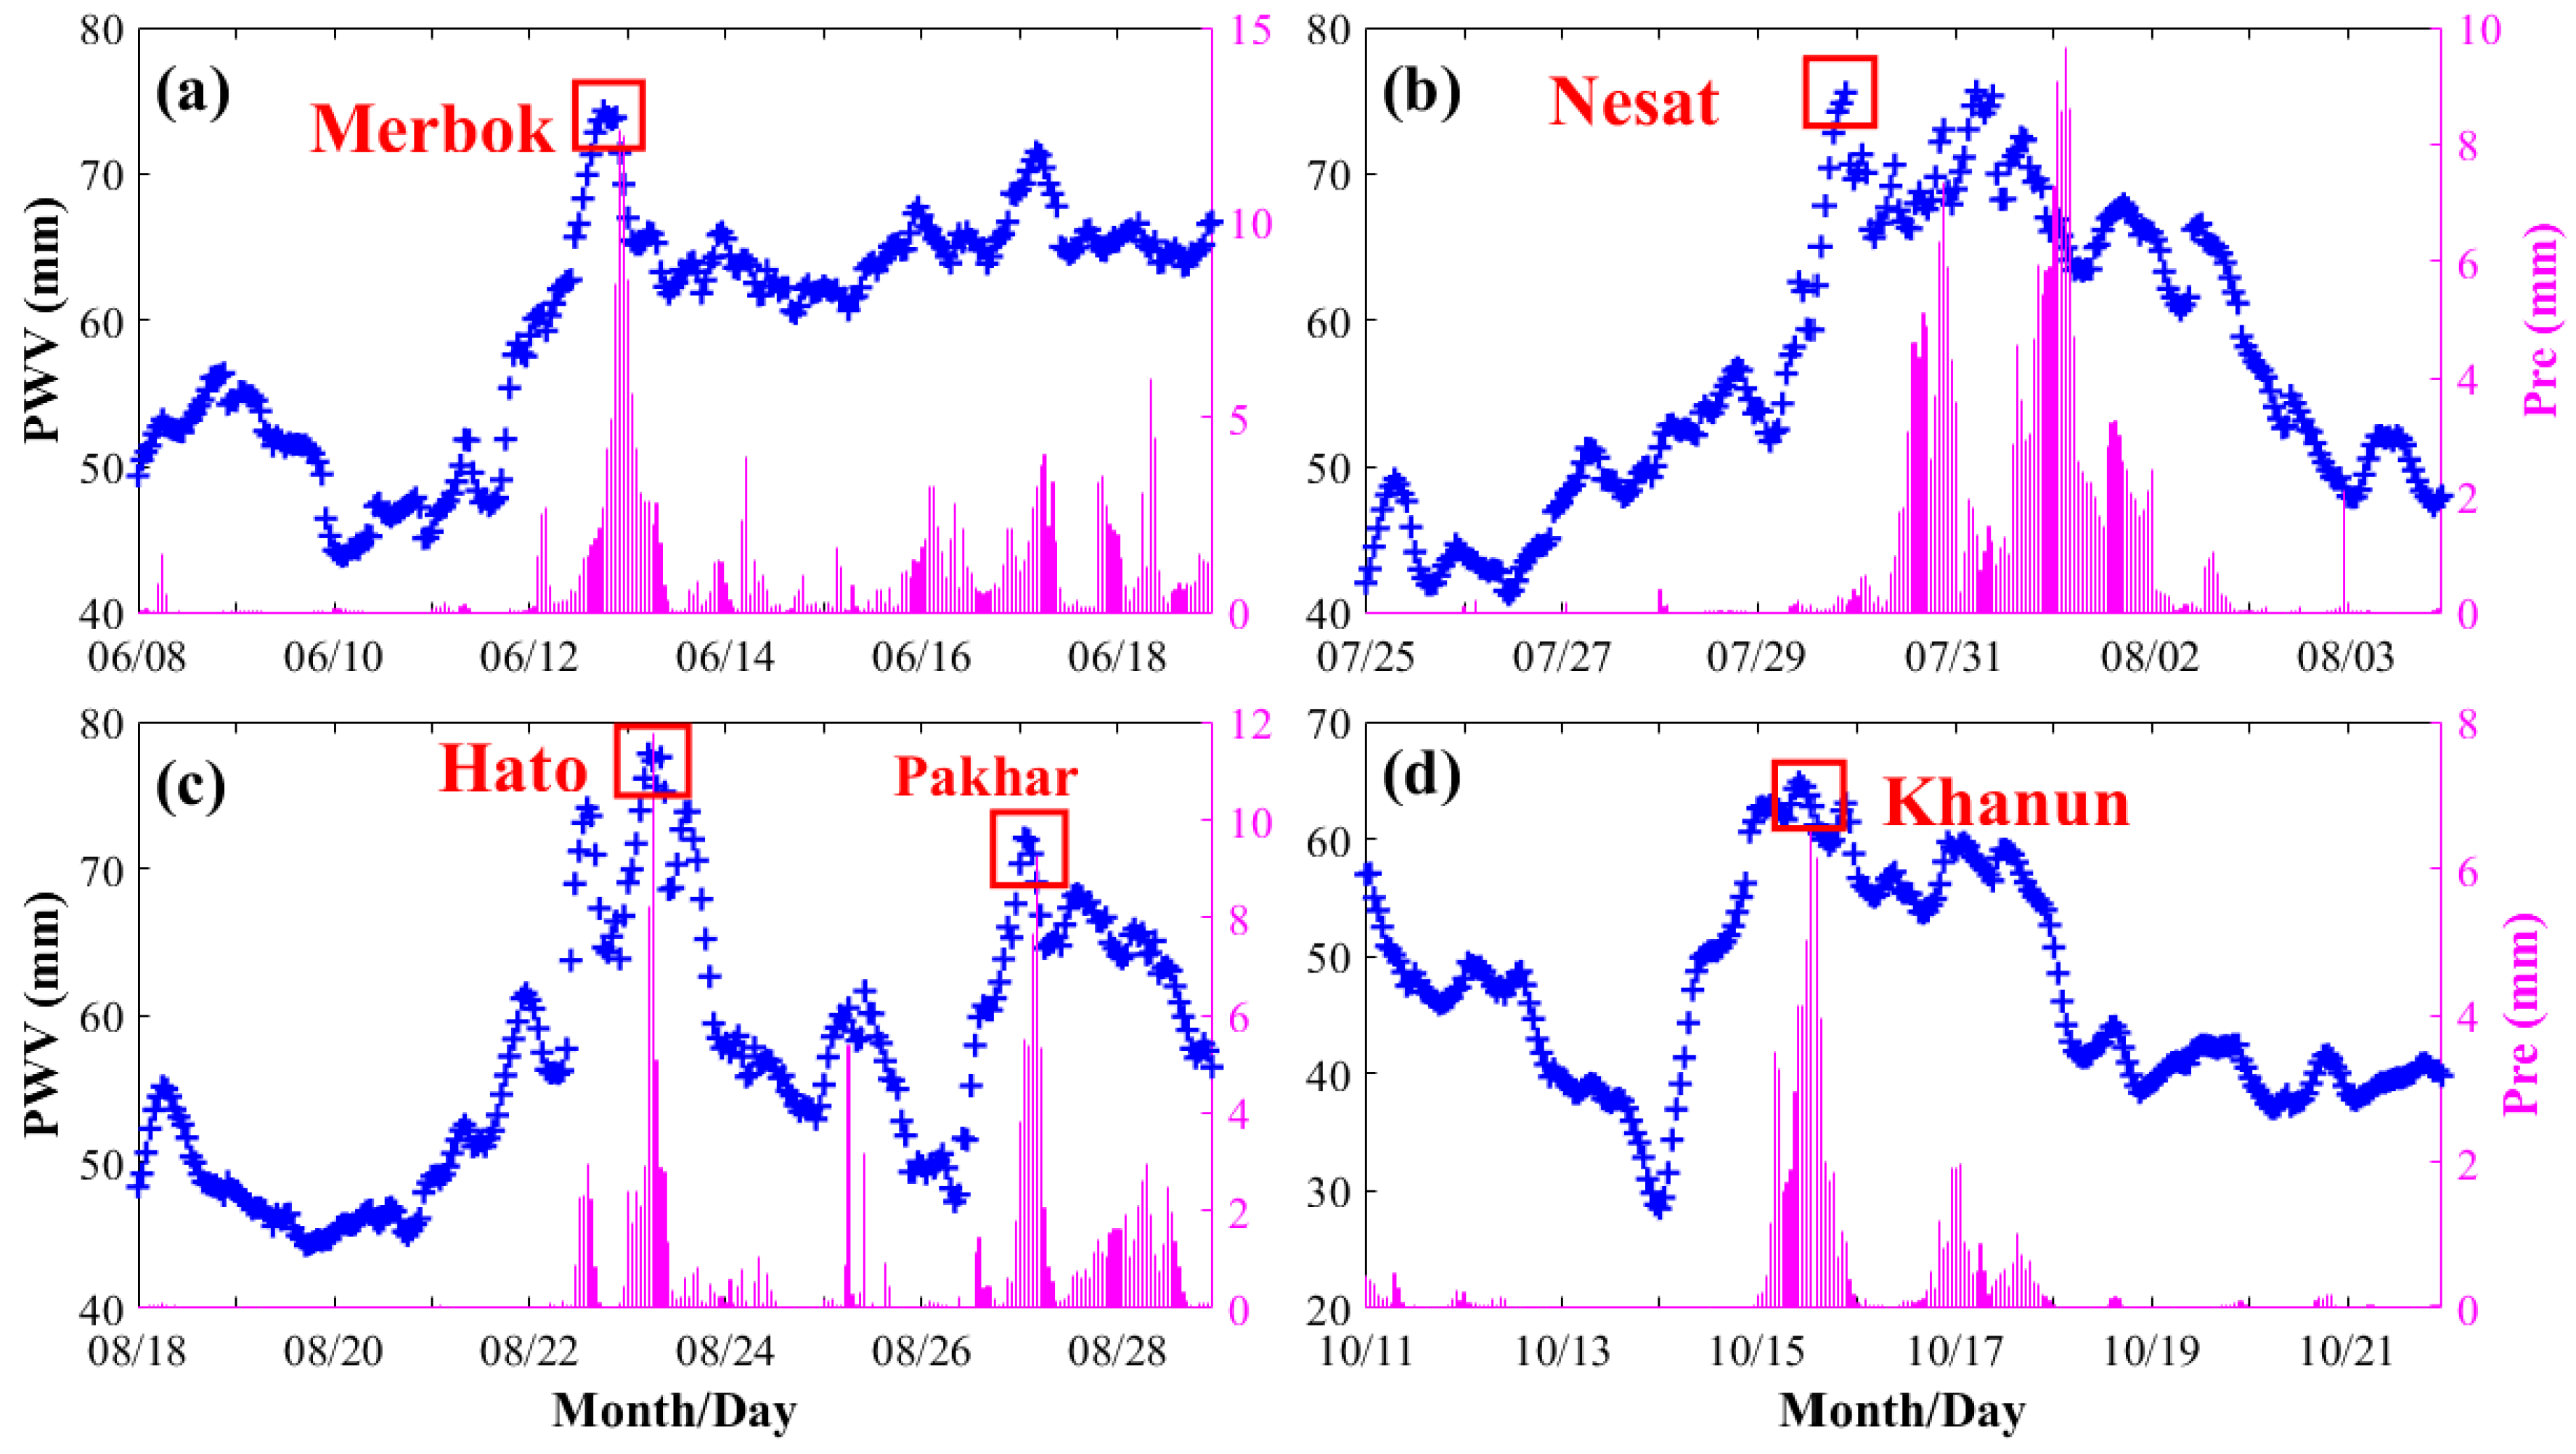
3.2.1. Relationship between PWV and Precipitation

The relationships between the PWV and precipitation during the landings of the four typhoon events were investigated. Figure 5 presents the time-series variations of the hourly PWV and precipitation during the landing periods of Merbok, Nesat, Hato, and Khanun. It can be observed that the variations of the PWV had a good response to that of precipitation. Taking Typhoon Merbok as an example, which landed at local time 23:00 on 12 June 2017, and the maximum value of PWV appeared at almost the same time. The typhoon gradually moved away, and its intensity weakened. Correspondingly, the PWV also decreased. Similar situations have also been observed during the landing of typhoons Nesat, Hato, Pakhar, and Khanun. Pakhar is the typhoon that followed Hato. Such a phenomenon is consistent with the result of the PWV change during typhoon landing in Zhejiang Province [6,20]. PWV values become very high when the typhoons approach. As shown in Figure 5, the PWV values of typhoons Merbok, Nesat, Hato, and Pakhar were all between 60–80 mm. Typhoon landing not only causes the water vapor to rise sharply but also brings much rainfall, with the rainfall increasing as the typhoon approaches.

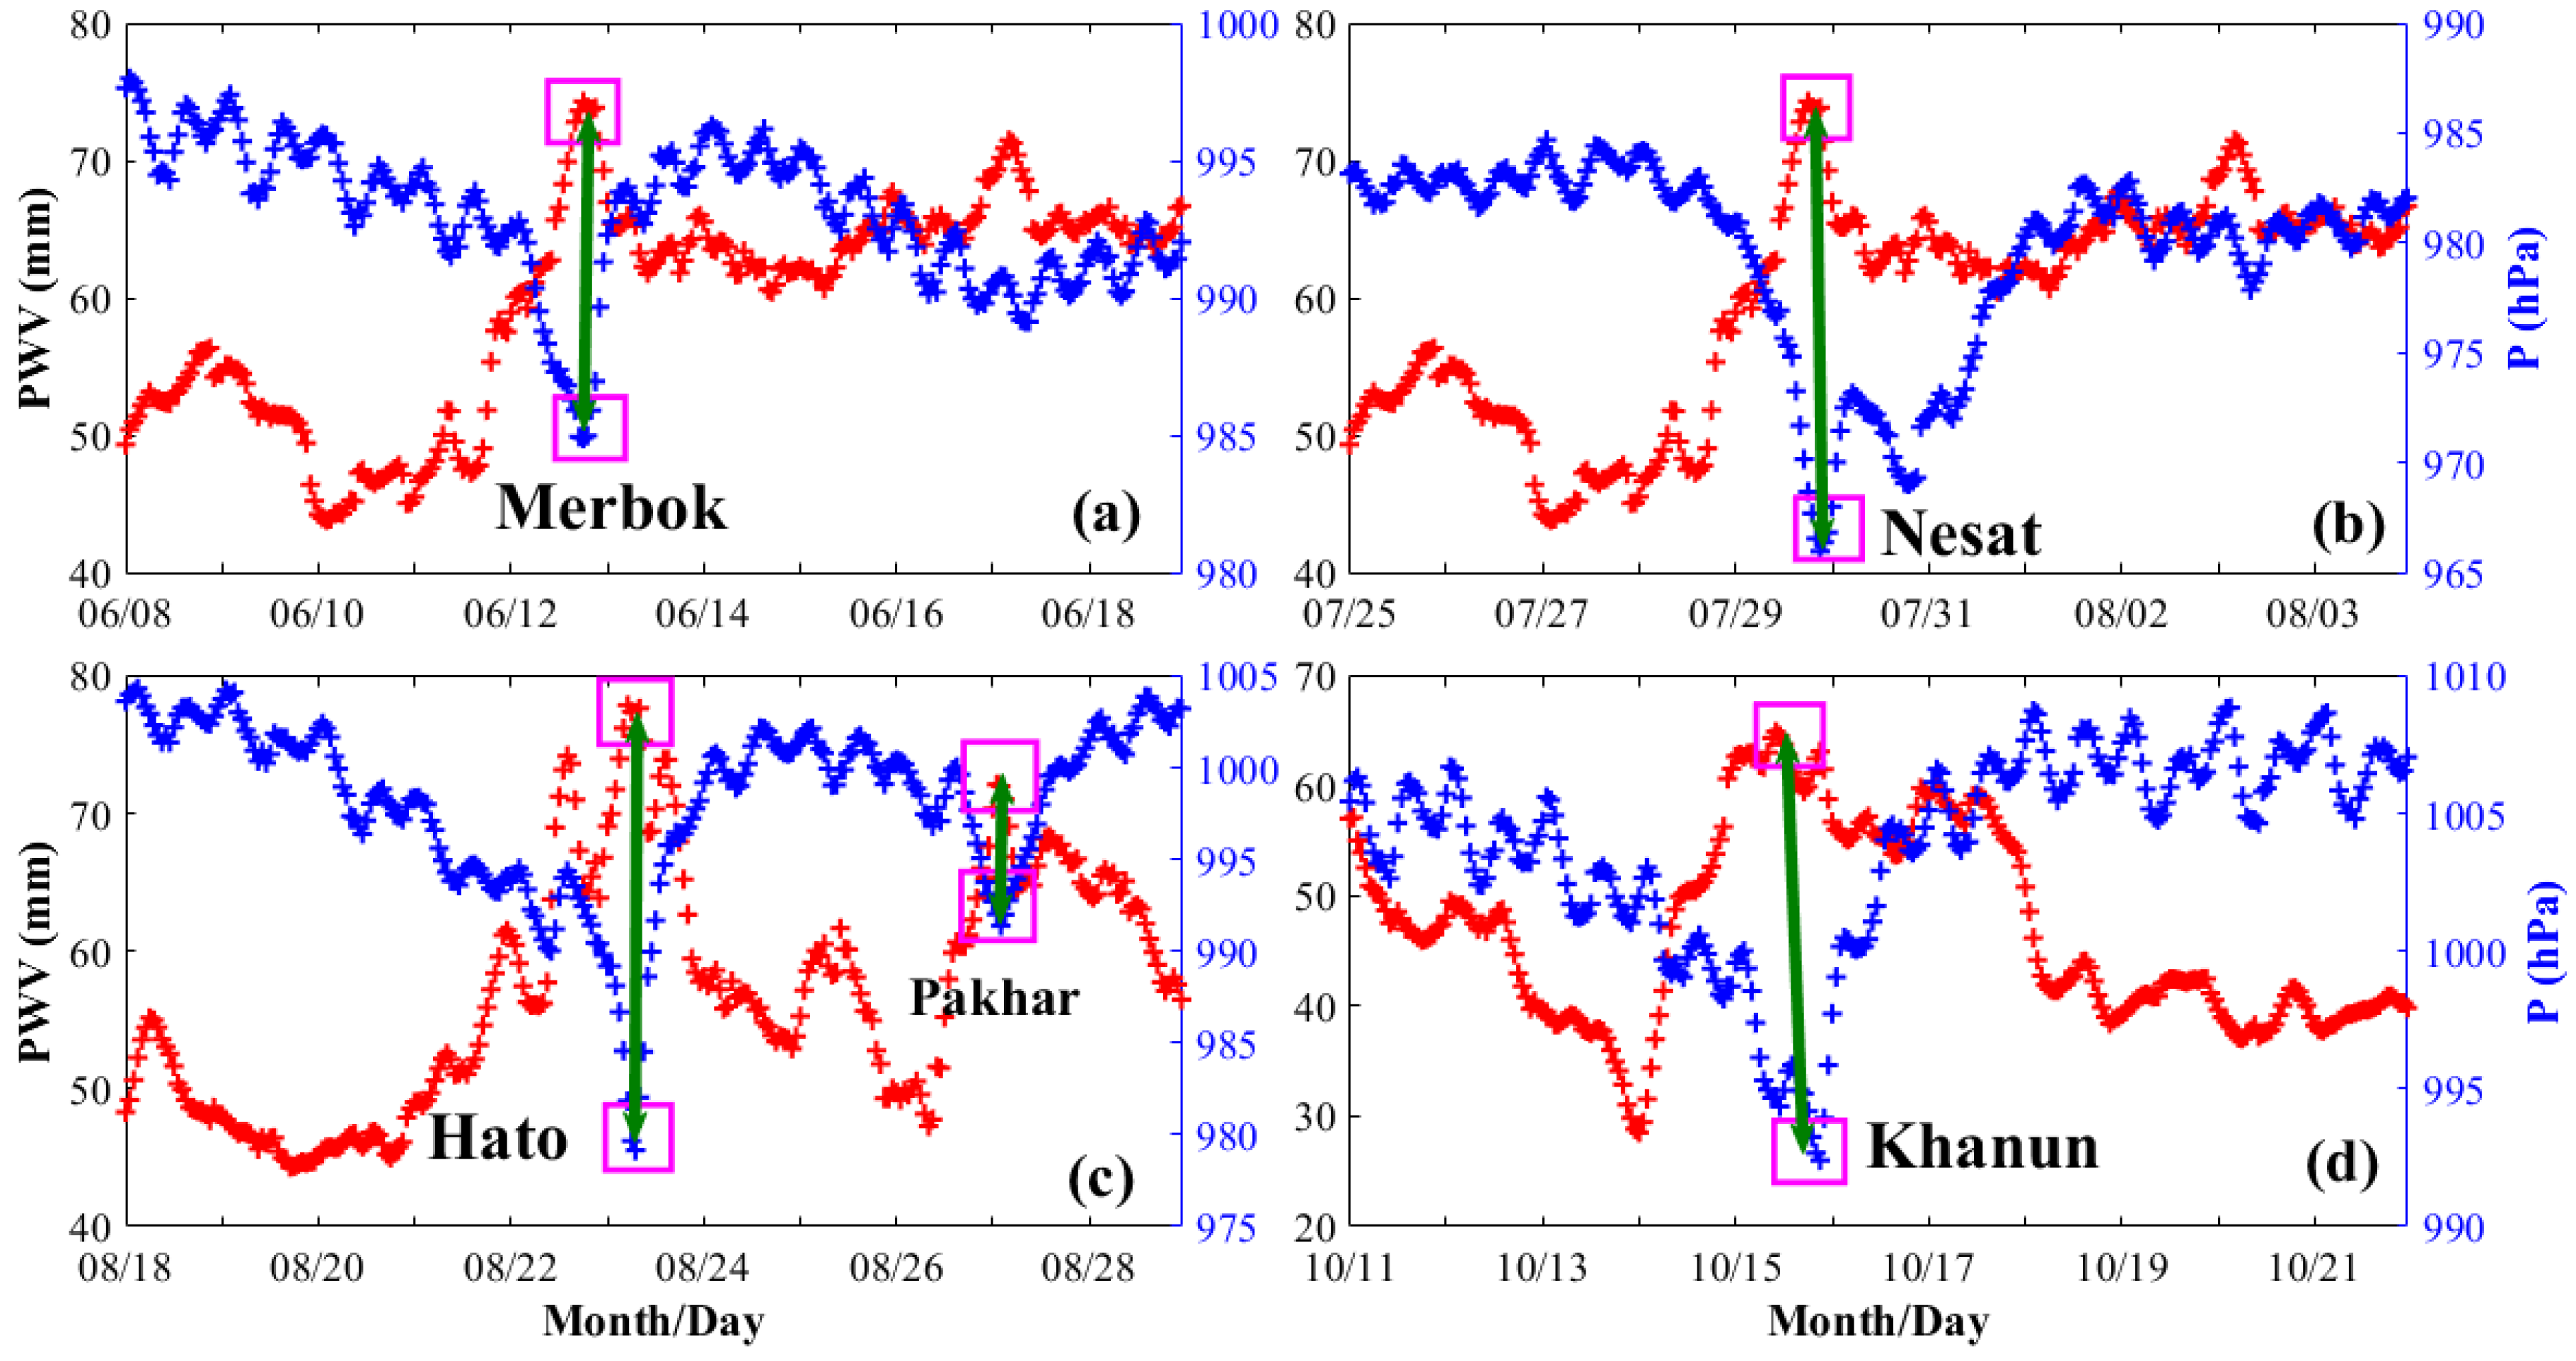
3.2.2. Relationship between PWV and Pressure

The variation of pressure during typhoon landing was also investigated. Figure 6 presents the time-series variations of hourly PWV and pressure during the landing period of typhoons Merbok, Nesat, Hato, and Khanun. Compared to Figure 5, Figure 6 shows that when the pressure reached the lowest value, the atmospheric water vapor reached the maximum value. The main reason was that the atmospheric pressure in the center of the original typhoon was low, and the water vapor flowed from all around to the center. The water vapor convergence rose after reaching the center. When the water vapor reached its maximum, the strong rainfall was caused by the condensation of the cold water vapor during the rising process of the water vapor.
Water vapor variations are controlled mainly by two factors: the thermodynamic processes related to vapor evaporation and condensation [30] and the regional dynamics related to global atmospheric motion [31]. The thermodynamic process of water vapor includes liquefaction and gasification related to atmospheric elements in the internal region. A typhoon is a tropical cyclone with a strong development, and thus, the gradient of horizontal pressure from all sides to the center of typhoon is very high, and the resulting wind velocity is also very high. The greater the velocity of the typhoon, the greater the effect of the geostrophic deflection force on the horizontal airflow. The higher the wind velocity is, the higher the influence of the geostrophic deflection force on the horizontal airflow is, so the airflow rotates around the center of typhoon, resulting in an ultra-low pressure in the center of the typhoon. The atmospheric water vapor included in the atmosphere also changes with the change in air pressure. Therefore, a typhoon’s movement is reflective of the variations of the PWV and pressure.

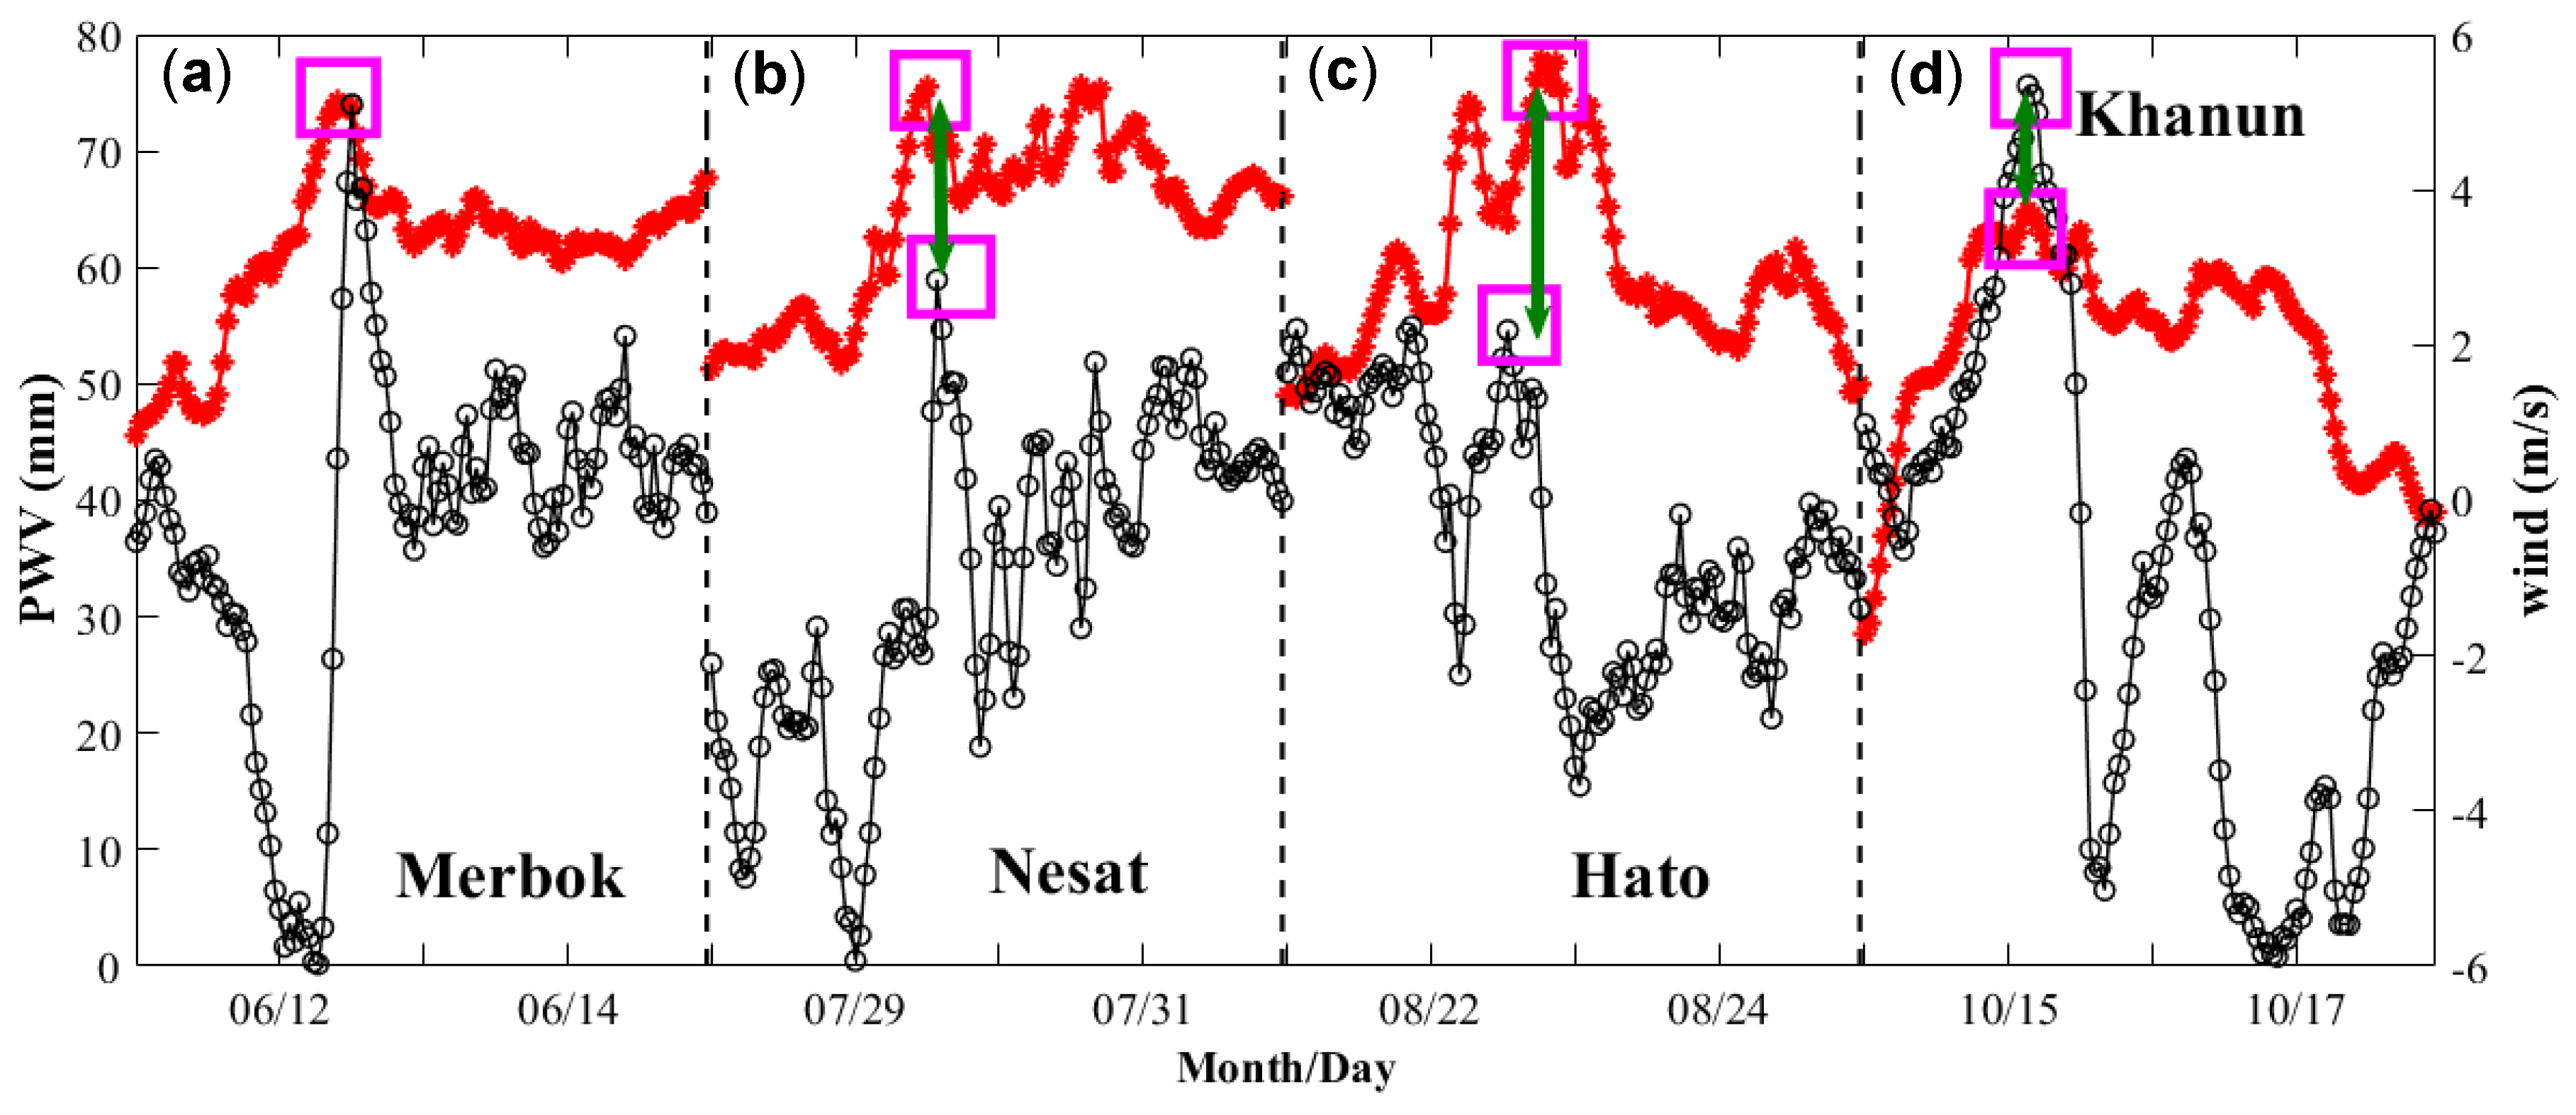
3.2.3. Relationship between PWV and Wind

Wind variation was tested to analyze the reason for the rapid increase in atmospheric water vapor during the typhoon landing period. Figure 7 gives the time-series variations of hourly PWV and wind during the landing period of typhoons Merbok, Nesat, Hato, and Khanun. It can be observed that the wind velocity reached the maximum value when the maximum value of the PWV appeared. Such a phenomenon indicates that the dominant factor of water vapor change was the external water vapor transport related to wind, and the wind velocity was a necessary condition for water vapor rise. According to the analysis in the previous sections, the important characteristic is that the air pressure decreases around the typhoon center when typhoon occurs. This decrease leads to an increase in typhoon pressure from all sides to the center of the typhoon, and the wind velocity increases. In addition, the effect of the geostrophic deflection force makes the horizontal airflow move around the typhoon center rapidly, thus intensifying the rapid aggregation of water vapor around the typhoon area and causing the water vapor in the typhoon area rise rapidly.

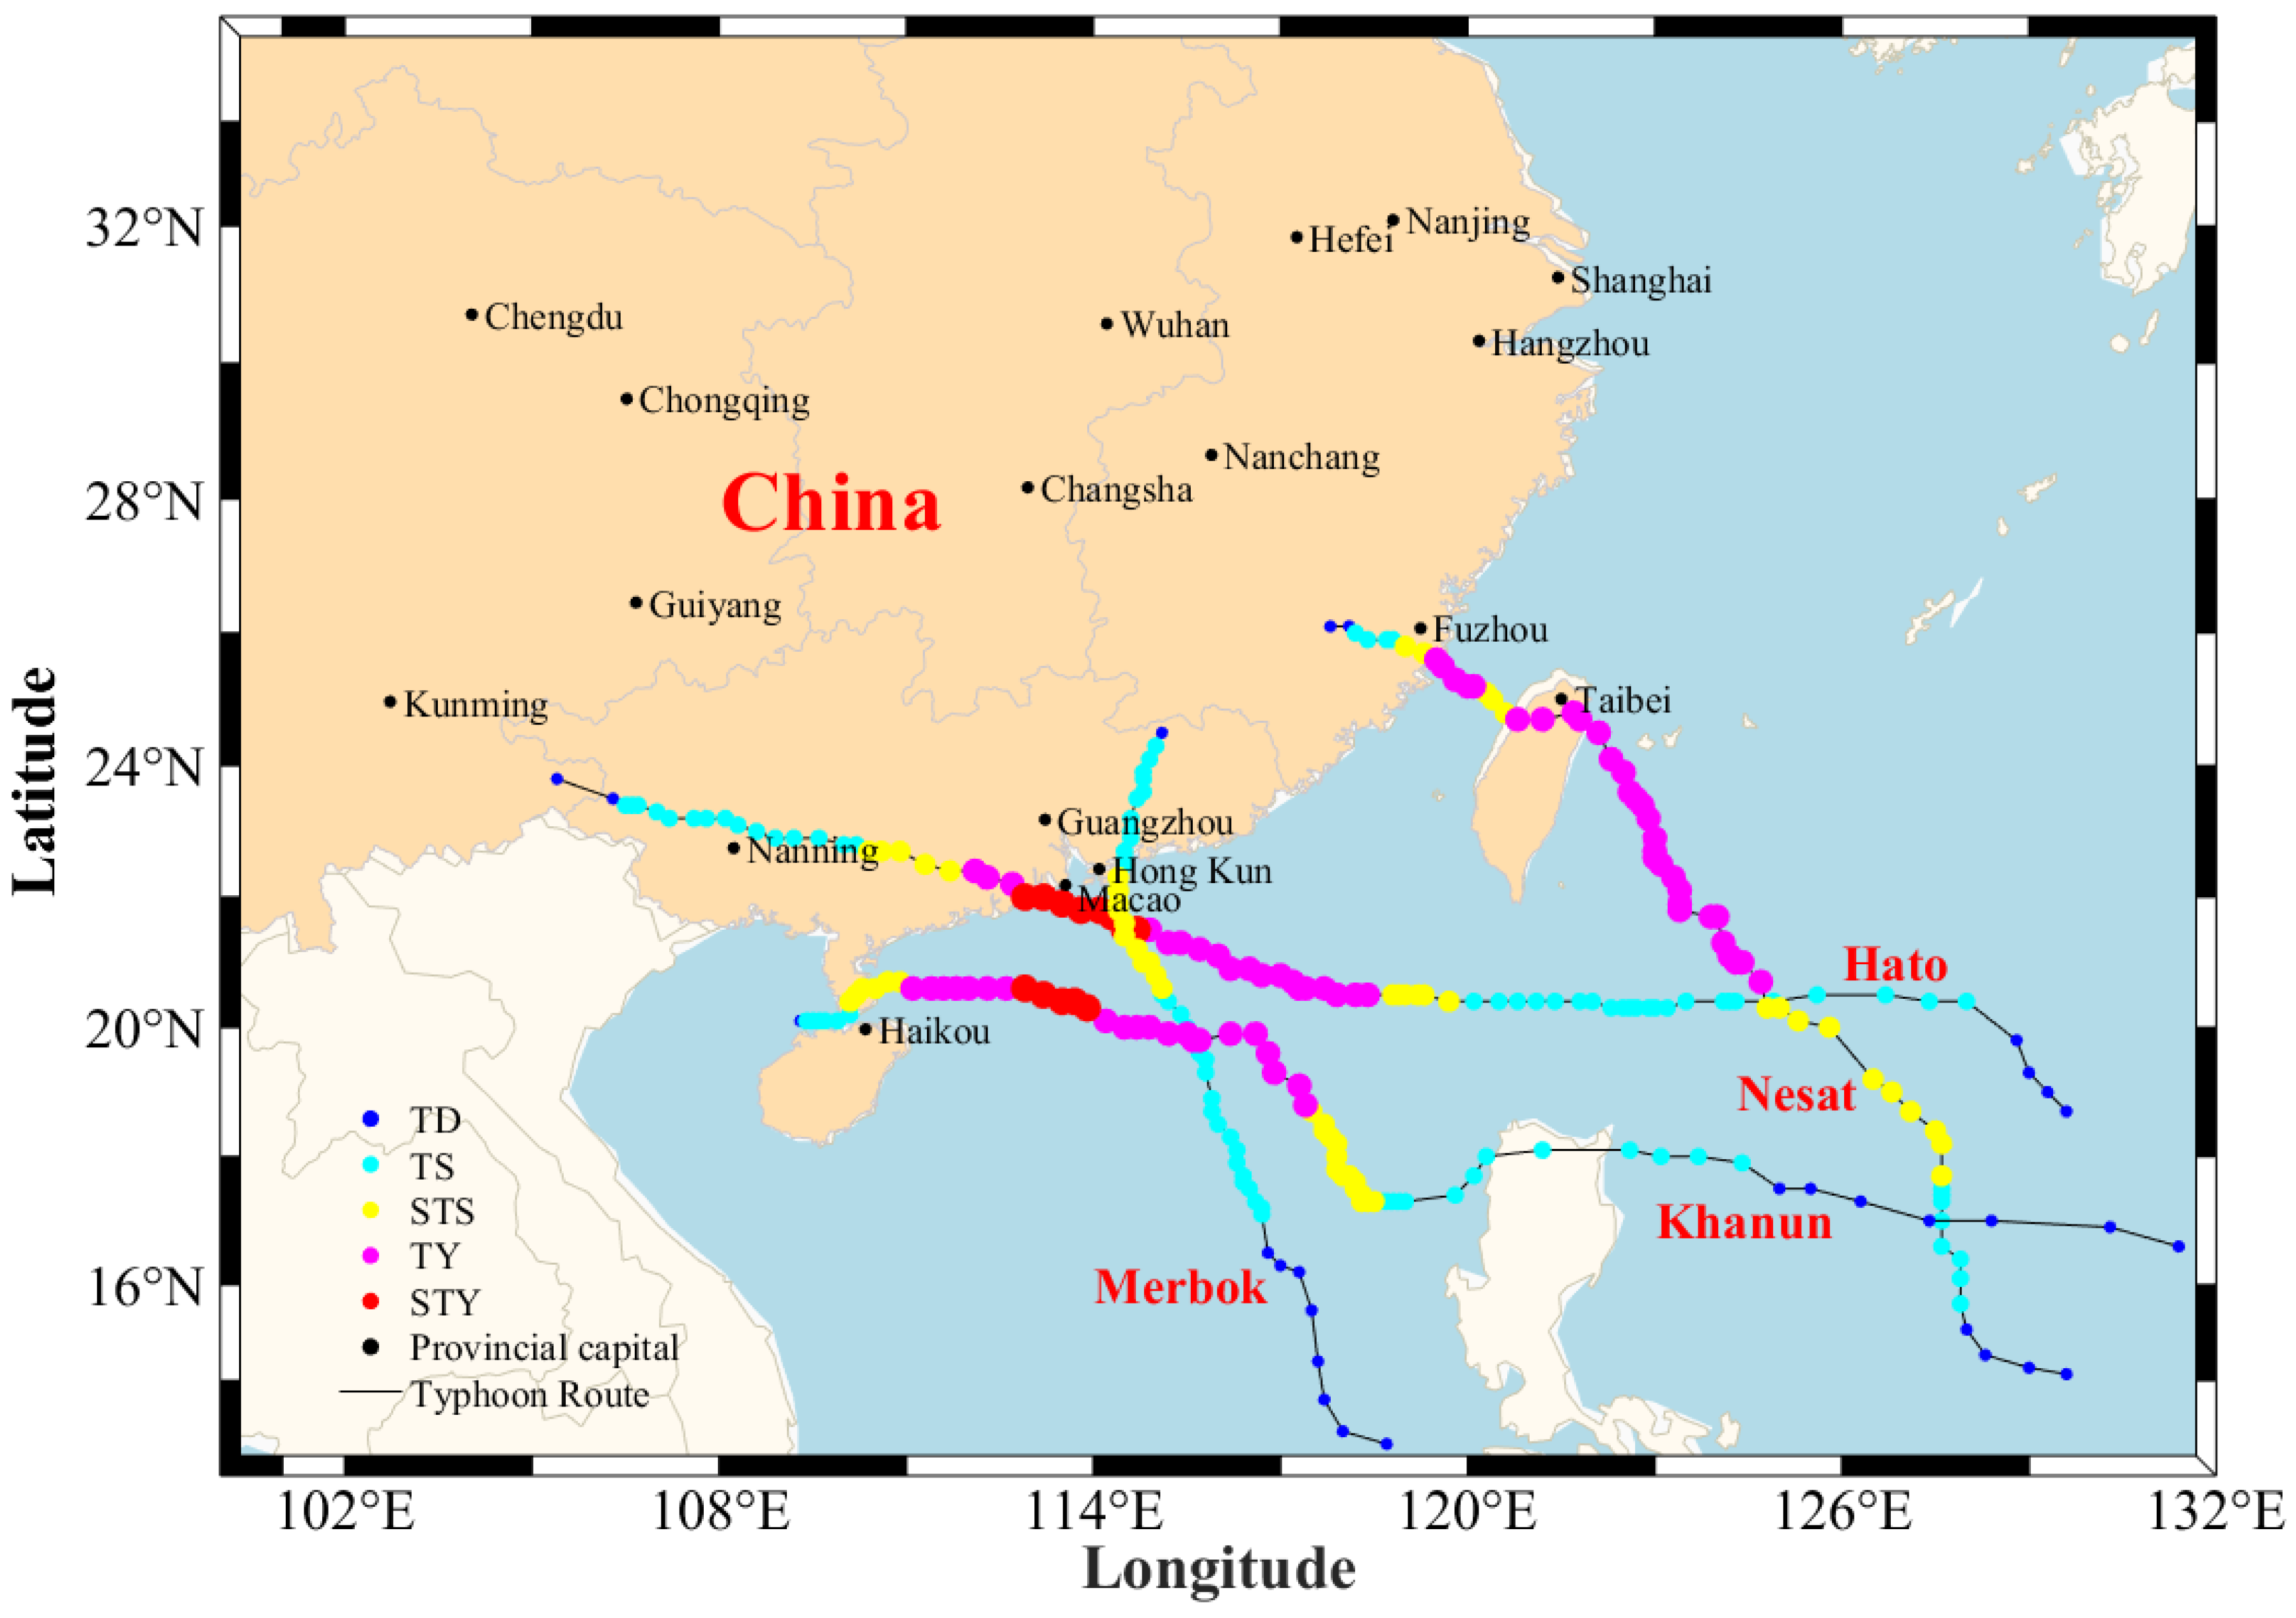
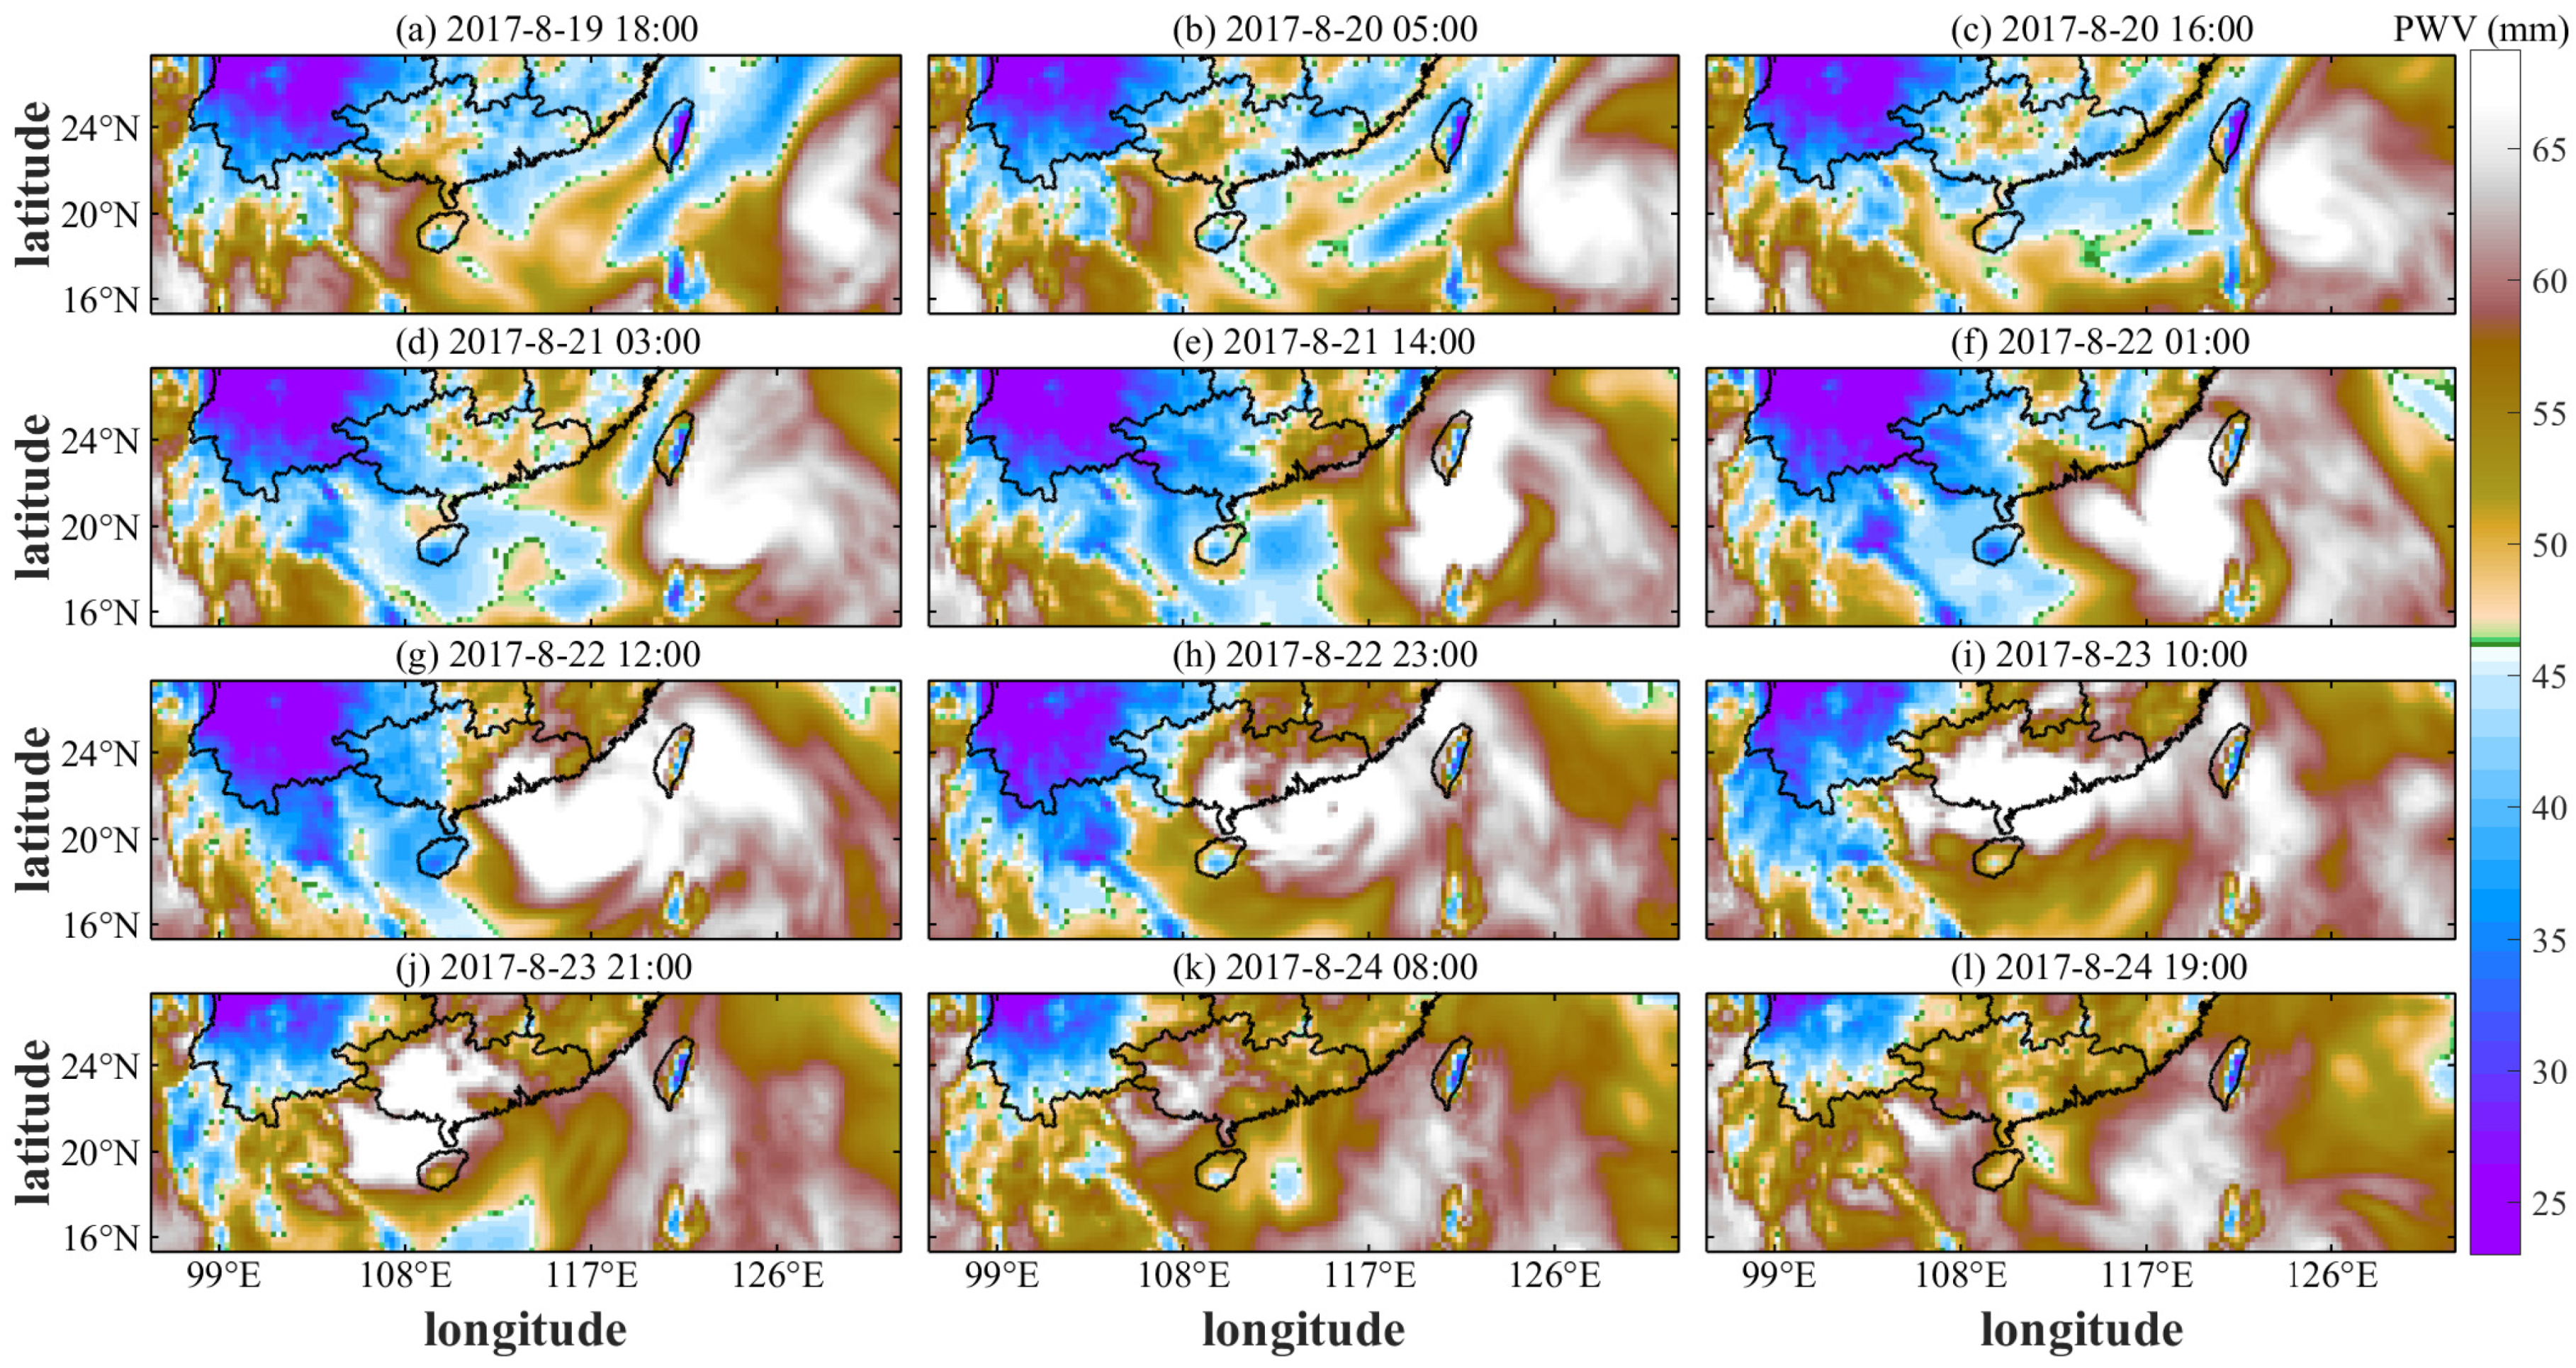
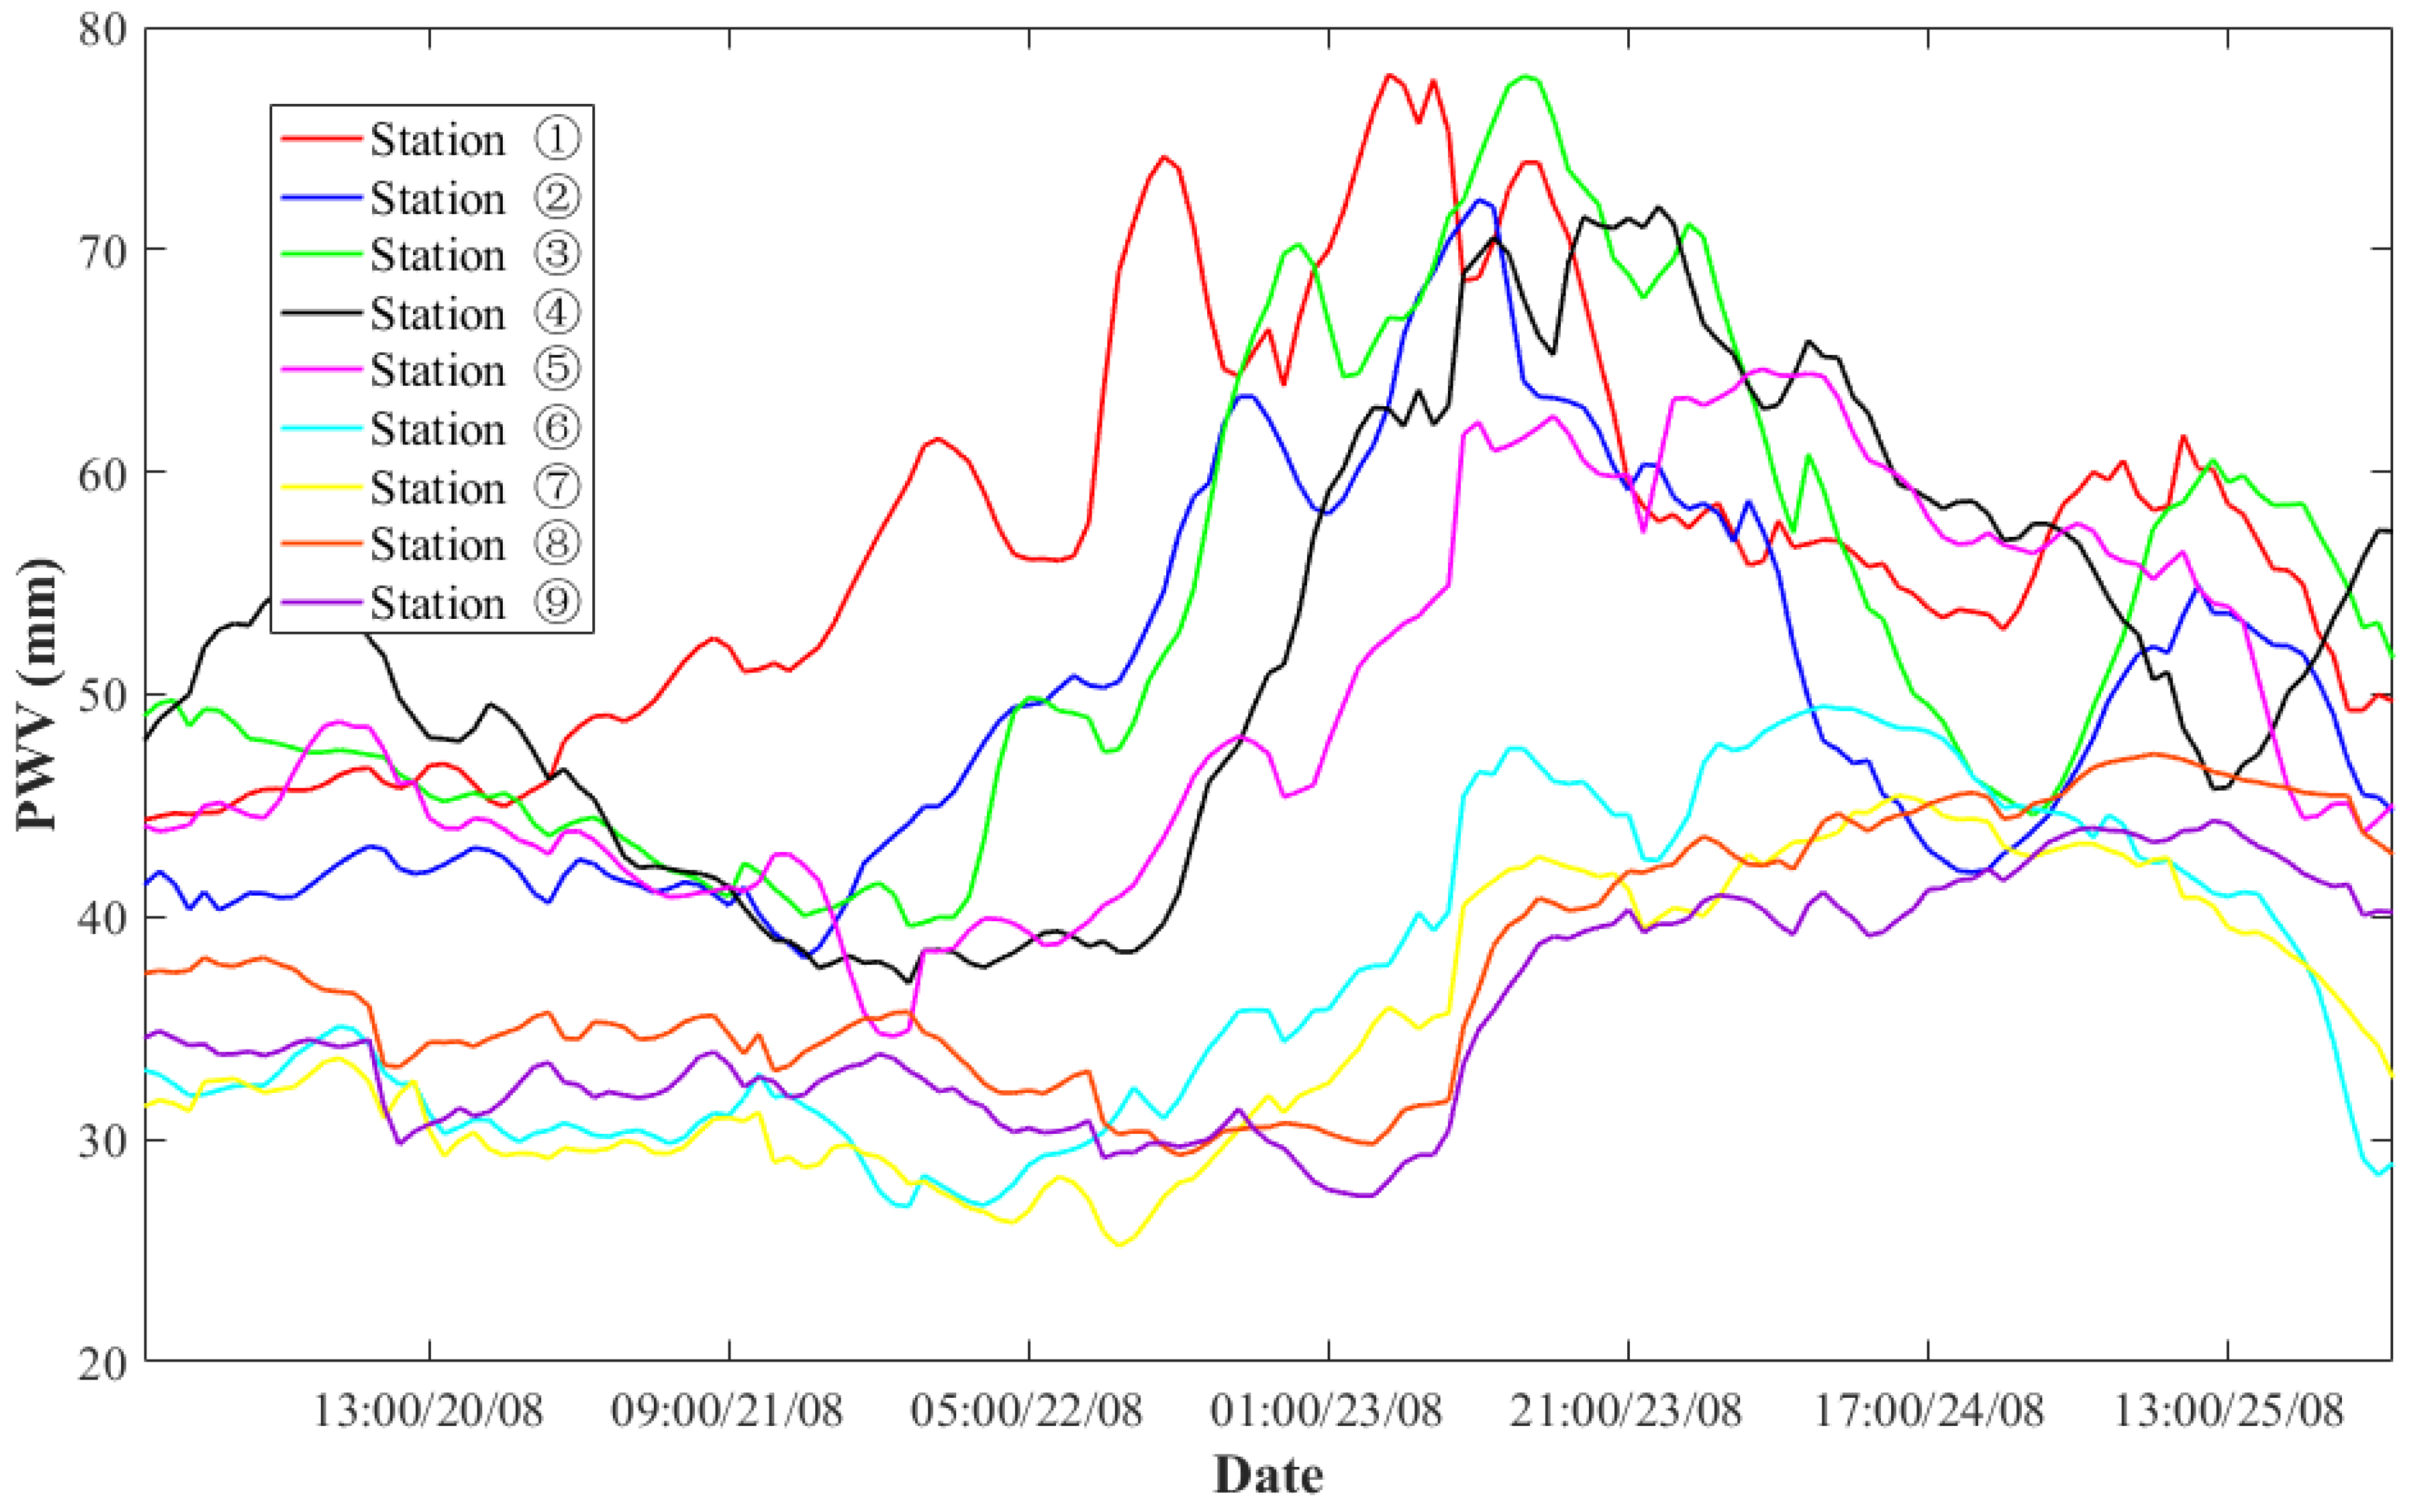
3.3. PWV Variation during the Typhoon Hato

Typhoon Hato was generated on the northwest Pacific Ocean at local time 02:00 on 20 August 2017 and then intensified. It eventually dissipated in Guangxi province of China at local time 17:00 on 24 August 2017. When Hato landed in the Macao region of China, the wind velocity was as high as 45 m/s, and the typhoon intensity was strong. After a short trip, the strong typhoon weakened to a typhoon, lasting for three hours, with an average wind velocity of 36.7 m/s. It gradually changed from a typhoon to a tropical depression after 23 h and dissipated. Hato lasted 29 h from onshore to dissipation and its total path was approximately 979 km long. Therefore, Hato is selected in this section as an example to analyze the spatial distribution of the PWV. Figure 8 presents the variation of the PWV during Typhoon Hato with the temporal resolution of 11 h over the period of local time 18:00 on 19 August to 19:00 on 24 August 2017. It can be clearly observed from Figure 8 that the movement direction of the PWV was highly consistent with the movement of the typhoon. In addition, it shows that the water vapor content increased gradually at 18:00 on 19 August 2017, and was higher than that in other areas. With the formation of tropical storms, the high-value area of the PWV becomes increasingly larger. Then, the area with a high PWV value moved westward and finally landed in China on 23 August 2017 and continued to move northwestward. Finally, the PWV value decreased on 24 August. The area with a high PWV value disappeared, which was highly consistent with the track of the typhoon. This finding indicates that the value of the PWV was susceptible to the typhoon in the process of its movement and that the arrival of the typhoon led to an increase in the PWV value. Therefore, the movement track of the typhoon could be reflected by the variation of in the maximum PWV value, which provides a new idea for monitoring typhoon movements.

4. A New Method for Typhoon Monitoring Based on PWV

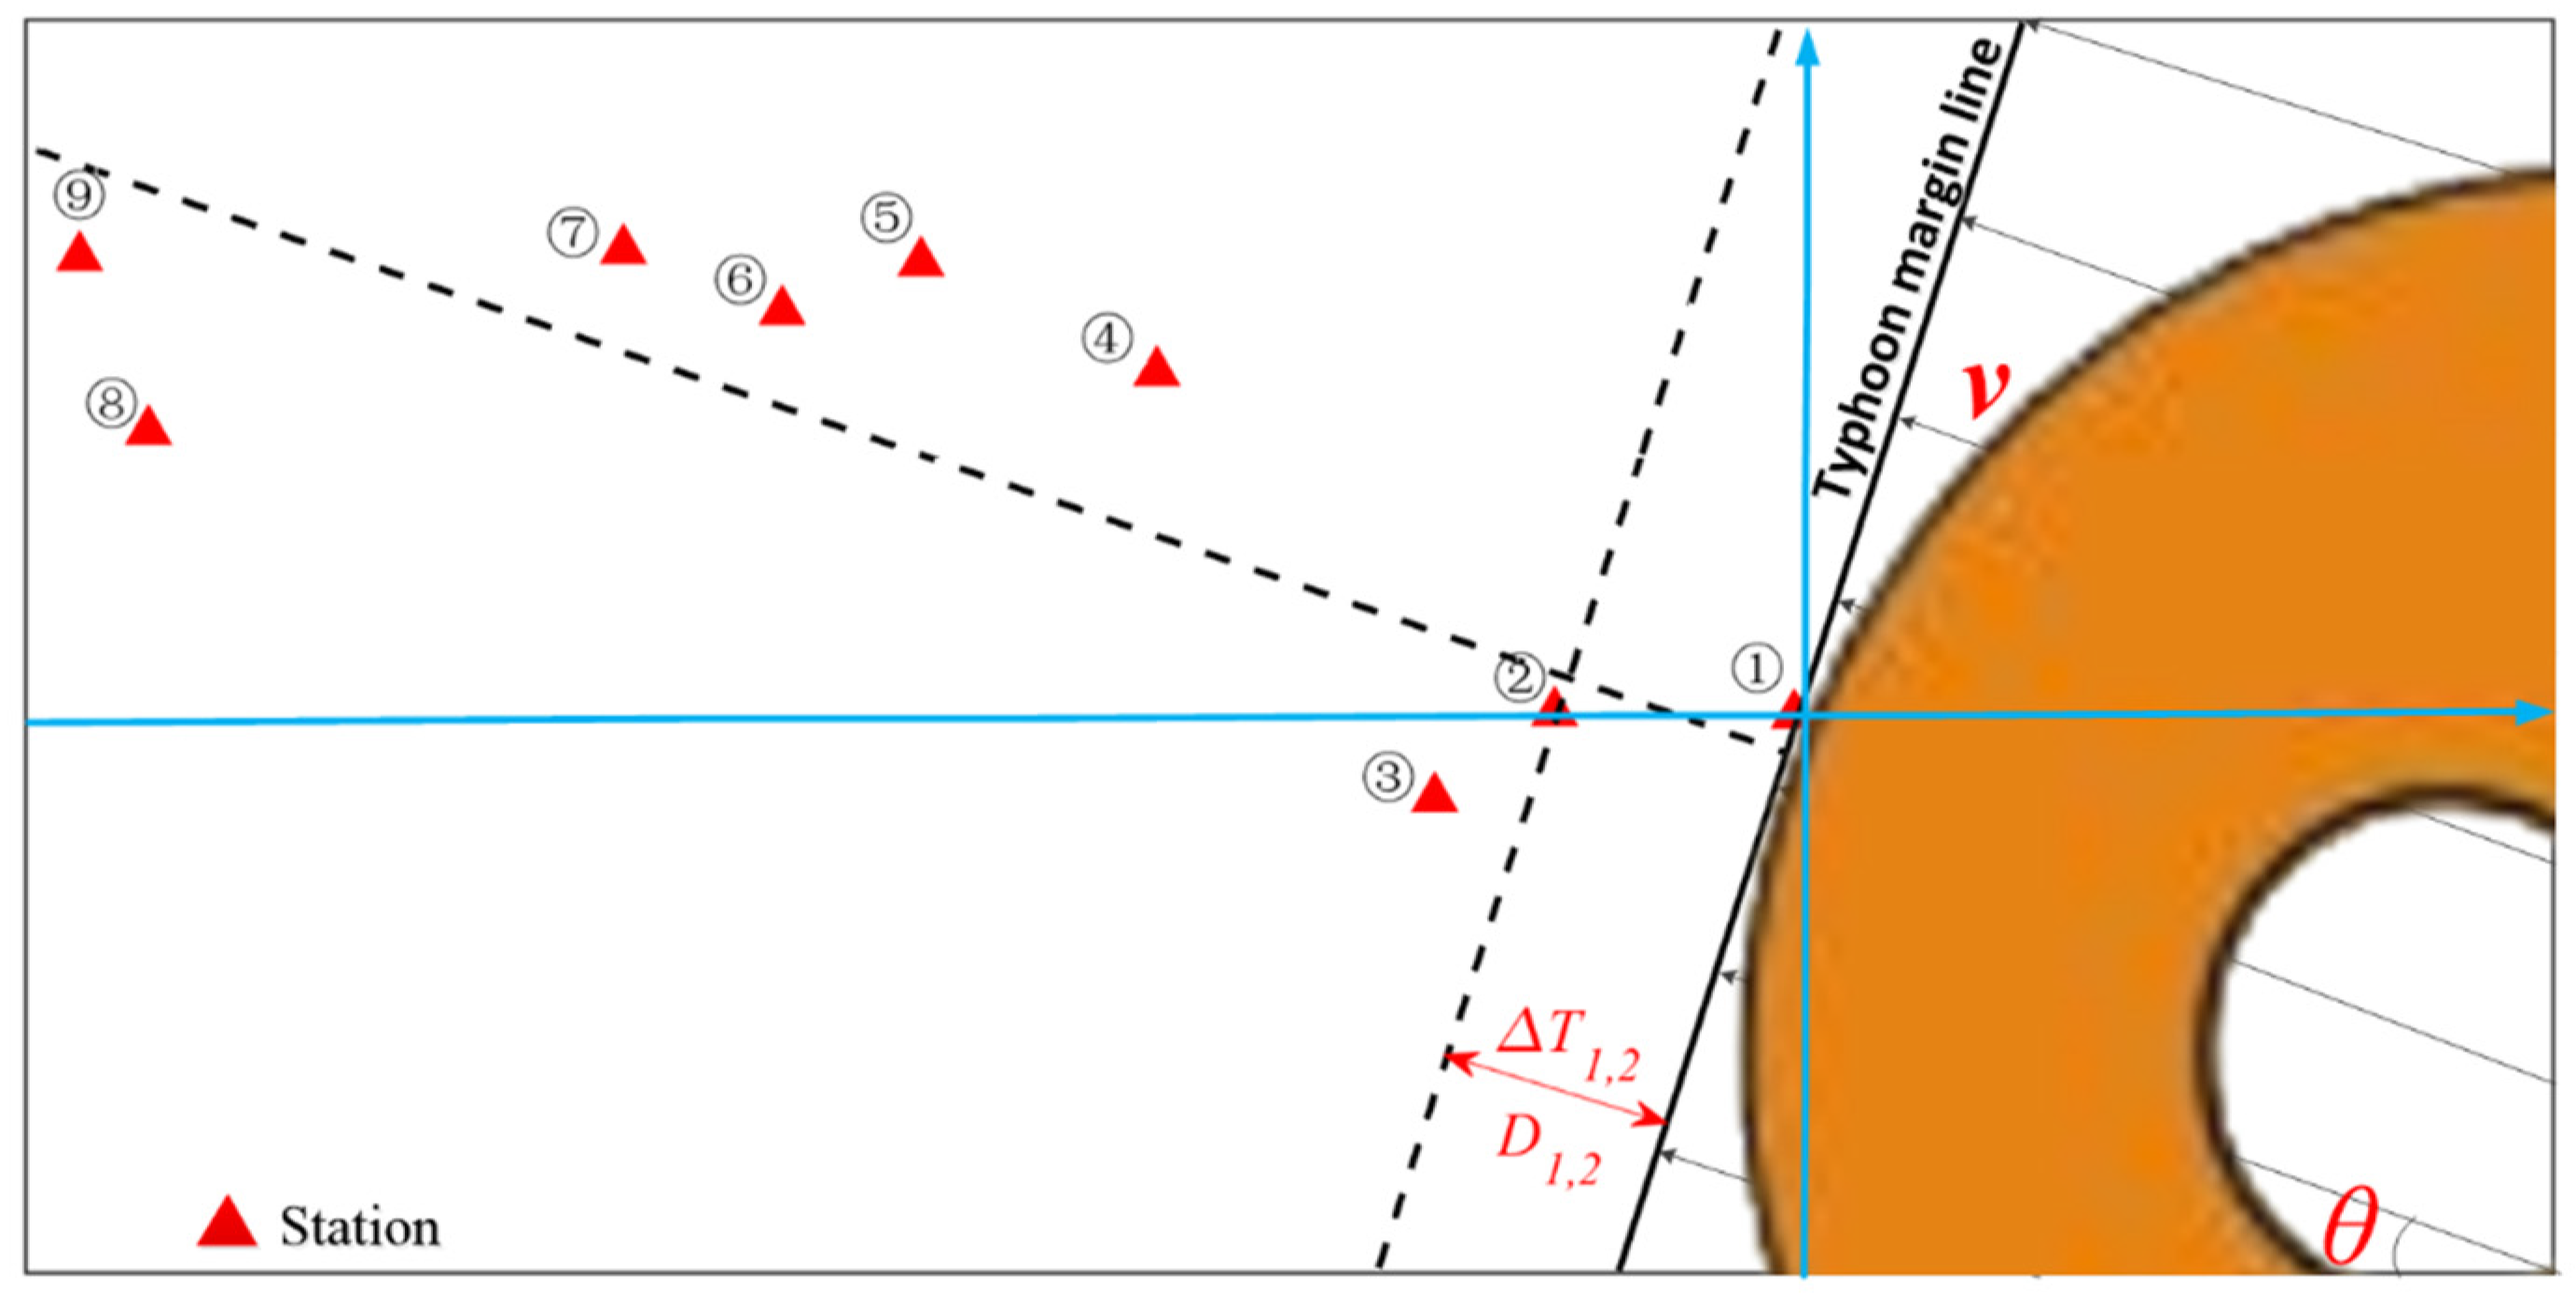
4.1. Theory Description of Typhoon Monitoring

Analysis of the relationship between the PWV and atmospheric parameters during the four typhoon events showed that PWV has good potential for typhoon monitoring. Due to the limitation of obtaining GNSS-derived PWV with high spatio-temporal resolutions, only the ERA5-derived PWV with the spatio-temporal resolutions of 0.25° × 0.25° and 1 h, respectively, were used in this section. Therefore, nine monitoring points were randomly selected from the land route of Typhoon Hato, and the PWV variations of these nine points were analyzed. The relative position relationship between the randomly selected monitoring points is presented in Figure 9, and Figure 10 shows the time series of the PWV at the nine stations. It can be observed from Figure 10 that the maximum PWV values appeared at different epochs for the nine stations. The emergence of the maximum PWV value during the typhoon period indicated that the typhoon wind circle reached this station. Therefore, the velocity of a typhoon’s movement can be estimated according to the distance and time difference between two epochs in which the maximum PWV values appeared at two stations.

4.1.1. Theory of Determining Typhoon Velocity Based on PWV

According to the above analysis, a method to determine the typhoon velocity based on the time-varying characteristics of PWV was proposed. Figure 9 presents the schematic diagram of the typhoon velocity determination method based on the PWV. The independent plane rectangular coordinate system was established while the origin of the coordinates was on station 1. θ and v are the direction and velocity of the typhoon, respectively. Here, the typhoon direction ( θ ) was first estimated based on the selected stations along the typhoon track. When θ is obtained, the slope in the direction of the typhoon can be calculated using:
K 1 = t a n ( θ ) .
Since the tangent of typhoon’s wind circle is perpendicular to the direction of the typhoon, the slope of the tangent of typhoon’s wind circle can be expressed as:
K 2 = 1 K 1 = 1 t a n ( θ ) = c o t ( θ ) .
Therefore, the equation of the tangent line of the typhoon wind circle is as follows:
y = c o t ( θ ) · x + b .
When the typhoon circle reaches the station i ( i > 1), the corresponding equation of the tangent line of typhoon wind circle is calculated using:
b = y i + c o t ( θ ) x i .
Then, the typhoon velocity is calculated when the distance between the two stations and the corresponding time difference of the local peak of the PWV at two stations are determined. The linear equation of station i at the tangent of the typhoon circle can be expressed as follows:
y + x cot ( θ ) y i x i cot ( θ ) = 0 ,
where x i and y i are the coordinates of station i in the independent plane rectangular coordinate system. The distance of typhoon circle moves from stations i to i + 1 can be calculated as follows:
D i , i + 1 = | y i + 1 + x i + 1 cot ( θ ) y i x i cot ( θ ) | 1 + cot 2 ( θ ) .
In addition, the time difference of the local peak of the PWV between the station i and i + 1 can also can be obtained, and is expressed as:
Δ t i , i + 1 = T i + 1 T i ,
where T i + 1 and T i correspond to the time of the local peak of the PWV at stations i and i + 1 , respectively. Therefore, the velocity of a typhoon’s movement between stations i and i + 1 can be calculated as follows:
v i , i + 1 = D i , i + 1 Δ t i , i + 1 ( i > 1 ) .
Although the above method can be used to monitor the typhoon’s movement toward a station, this method is performed a short time after the typhoon has passed because it requires knowing the variation of the PWV in advance and depends on the spatial and temporal resolutions of the monitored stations

4.1.2. Theory of Typhoon Monitoring That Includes Acceleration

The above section only gives the method to calculate the velocity of a typhoon’s movement based on the PWV. However, the calculated velocity of a typhoon’s movement is an average velocity over six hours because of the lack of PWV data with a high temporal resolution. The velocity of a typhoon’s movement varies as the typhoon moves forward. If the PWV data with a high temporal resolution can be obtained, monitoring the velocity of a typhoon’s movement with the higher temporal resolution is achievable by introducing the acceleration. Therefore, in this section, a method to estimate the velocity and acceleration of a typhoon’s movement is proposed.
The independent plane rectangular coordinate system is first established, and the origin of coordinates is on station 1. Figure 11 presents the schematic diagram of velocity and acceleration monitoring of a typhoon’s movement. The linear equation of station i at the tangent of the typhoon circle can be expressed as follows:
y i = cot ( θ ) x i + b ,
where b is the intercept of the equation on the y-axis. The initial velocity and acceleration of a typhoon’s movement are given as v 0 and a , respectively. Therefore, the velocity and distance of a typhoon’s movement can be expressed after time t as follows:
v t = v 0 + a t , S = v 0 t + 1 2 a t 2 .
The intercept b in Equation (9) can be expressed according to the geometric relationship in Figure 11:
b = v 0 t + 1 2 a t 2 sin ( θ ) .
When the tangent of the typhoon circle moves to station i after time, t i , the following equation can be obtained by combining Equations (9) and (11):
2 ( y i sin ( θ ) + x i cos ( θ ) v 0 t i ) a 0 t i 2 = 0.
Assuming F i ( θ , v , a ) = 2 ( y i sin ( θ ) + x i cos ( θ ) v 0 t i ) a 0 t i 2 , the first-order Taylor expansion of the equation can be obtained at θ = θ 0 , v = v 0 , and a = a 0 using the Gaussian–Newton method [32]. Therefore, Equation (12) can be expressed as follows:
l = A x , A = [ 2 ( cos ( θ 0 ) y 2 sin ( θ 0 ) x 2 ) 2 t 2 t 2 2 2 ( cos ( θ 0 ) y 3 sin ( θ 0 ) x 3 ) 2 t 3 t 3 2 2 ( cos ( θ 0 ) y n sin ( θ 0 ) x n ) 2 t n t n 2 ] , x = [ θ θ 0 a a 0 v v 0 ] T , l = [ F 2 ( θ 0 , v 0 , a 0 ) F 3 ( θ 0 , v 0 , a 0 ) F n ( θ 0 , v 0 , a 0 ) ] T .
The above equation can be solved by the least-squares method, and the initial values θ 0 , v 0 , and a 0 are given randomly. Therefore, the iteration resolution is required to obtain an accurate result. In this paper, a difference of < 10 3 was selected as the iterative termination condition.

4.2. Experiment Validation

4.2.1. Experimental Analysis of Typhoon Velocity Monitoring using PWV

The reliability of the typhoon monitoring method proposed in Section 4.1.1 was first validated by selecting Typhoon Hato for the experiment. Nine stations were selected randomly along the typhoon track of Hato and their relative positions were given in the independent plane rectangular coordinate system (Figure 9). The PWVs used in the nine stations were interpolated using the surrounding data of four grid points derived from ERA5 with a temporal resolution of one hour. Figure 10 shows the PWV time series of the nine selected stations during the Typhoon Hato period. The epoch corresponds to the maximum value of the PWV, which indicates that the typhoon circle of Hato reached this station. It can be observed from Figure 10 that the epochs corresponding to the maximum value of the PWV differed for the selected stations and that the maximum value of the PWV first appeared at station 1 at 05:00 local time on 23 August 2017. After six hours, the maximum value of the PWV appeared at station 2 at 11:00 local time on 23 August 2017.
The mean velocity of the typhoon’s movement in each period was calculated for Hato using the peak variation of the PWV at nine stations. The specific statistical results for the typhoon velocity are given in Table 2. The results indicate that the mean velocity calculated in this paper conforms to the mean value of the hourly velocity given by the China Meteorological Observatory Typhoon Network and that the maximum difference in the typhoon velocity was less than 3 km/h. Such a result indicates the good capability of the proposed method at monitoring the velocity of a typhoon’s movement using the PWV.

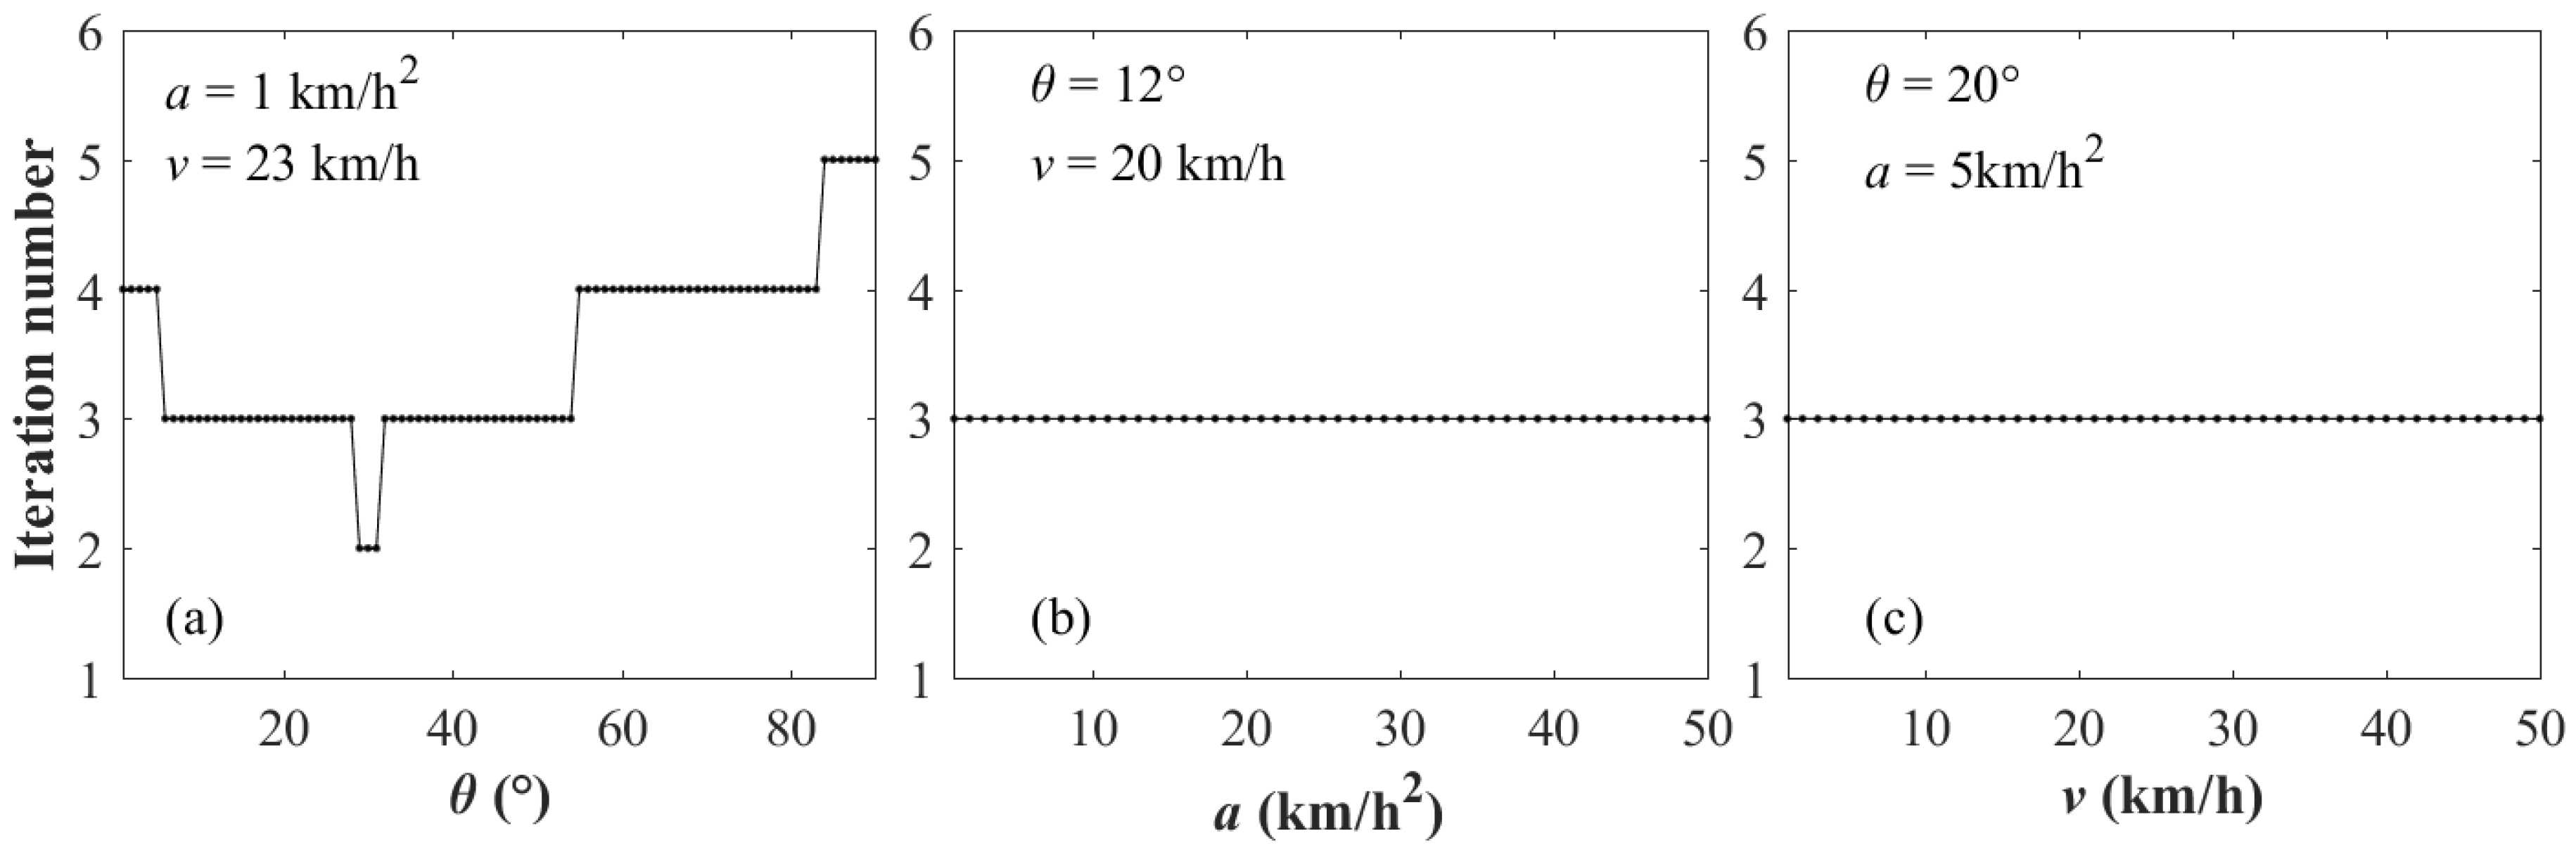
4.2.2. Simulated Experimental Analysis of Typhoon Monitoring Considering the Acceleration

A typhoon-monitoring method that considered the velocity and acceleration of typhoon movement was proposed using the PWV with a high temporal resolution. Unfortunately, the highest temporal resolution of ERA5 is one hour, which is not sufficient for the validation of the proposed method in this section. Although GNSS-derived PWV has a high temporal resolution of 30 s, the corresponding GNSS observations were not obtained because of the restrictions of data confidentiality in China. Therefore, only simulated experiments were performed in this section to validate the reliability and feasibility of the proposed method. Ten stations were selected randomly in the area the typhoon passed through (Figure 11). Their specific locations were calculated in the independent plane rectangular coordinate system based on the given velocity, direction, and acceleration of the typhoon movement. Hence, the epochs that corresponded to the maximum value of PWV for each station were determined during the typhoon period.
The effects of the different numbers of stations and typhoon locations on the result were evaluated. Table 3 gives the simulated results of the estimated velocity, direction, and acceleration of the typhoon’s movement under the cases of using different numbers of stations and selecting various typhoon locations. The calculated values of the velocity, direction, and acceleration of the typhoon’s movement were almost the same as that from the real values under different cases, which proved the reliability and feasibility of the proposed method in theory. Another simulated experiment was performed to further verify the influence of the given initial values of velocity, direction, and acceleration on the number of iterative times. In this experiment, the direction, velocity, and acceleration were given from 0° to 90°, 0 to 50 km/h, and 0 to 50 km/h2, respectively. Figure 12 shows the relationship between the given initial values of direction, velocity, acceleration, and iteration times. It can be concluded from Figure 12 that the given initial values of velocity and acceleration appeared to have no effect on the iteration times, while the direction of the typhoon movement had a slight effect on the iteration times. However, a good result can be calculated after five iterations in any case. The above results show that when the typhoon was close to the intensive monitoring stations, the direction, velocity, and acceleration of the typhoon’s movement could be calculated quickly.

5. Conclusions

A typhoon-monitoring method using PWV in which the velocity and acceleration of a typhoon’s movement can be estimated was proposed in this paper. The ERA5-derived PWV was first validated using the GNSS-/radiosonde-derived PWV values. The result shows that the ERA5-derived PWV with RMS values of approximately 2 mm had a good performance. The anomalous variations of the PWV with atmospheric parameters, such as precipitation, pressure, and wind, during the four typhoon events were then analyzed. The analyzed results show that the maximum local value of the PWV appeared when the typhoon moved. Therefore, a typhoon-monitoring method based on the various characteristics of the PWV was proposed in this paper. The velocity monitoring of a typhoon’s movement was first validated using the ERA5-derived PWV during Typhoon Hato period. The observed results revealed that the maximum difference between the real and calculated mean velocities of the typhoon’s movement was less than 3 km/h. Such a result verified the capability of the proposed method in monitoring typhoons using PWV data. Then, an improved typhoon monitoring method that used PWV data with the high temporal resolution was proposed to further estimate the velocity and acceleration of the typhoon’s movement. Due to the limitations posed by the inability to obtain PWV data with a high temporal resolution, only simulated experiments were performed. The simulated experiment revealed that the feasibility and reliability of the proposed method for typhoon monitoring, and the velocity, acceleration, and direction of the typhoon’s movement, could be estimated after 3–6 iterations.
Although obtaining PWV data with a high temporal resolution is difficult, retrieval of such data is becoming more and more mature with the continuous development of GNSS. Therefore, the method proposed in this paper has a great potential application for typhoon monitoring. In addition, we are trying to add new typhoon movement parameters (such as angular velocity and angular acceleration) to the typhoon monitoring method proposed in this paper, which is of great significance for using a high-density GNSS monitoring network to monitor and predict typhoon movement trajectories.

Author Contributions

Q.Z. and X.M. participated in the design of this study, and they both performed the statistical analysis. Q.Z. and X.M. carried out the study and collected important background information. All authors read and approved the final manuscript. Q.Z. and W.Y. carried out the concepts, design, definition of intellectual content, literature search, data acquisition, data analysis and manuscript preparation. Q.Z., X.M. and Y.Y. carried out literature search, data acquisition and manuscript editing. Q.Z. performed manuscript review. All authors have read and approved the content of the manuscript.

Funding

This research was supported by the National Natural Science Foundation of China (41904036), the Scientific Research Program of Shaanxi Provincial Education Department (18JK0508), and the Excellent Youth Science and Technology Fund Project of Xi’an University of Science and Technology (2018YQ3-12).

Acknowledgments

The author would like to thank ECMWF for providing access to grid-based meteorological data.

Conflicts of Interest

The authors declare that they have no conflict of interest.

References

  1. Munich, R. Topics 2000: Natural Catastrophes-the Current Position; Munich RE: Munich, Germany, 1999. [Google Scholar]
  2. Wang, R.; Jiang, T.; Lorenz, K.; Marco, G.; Anja, H. Review on global natural catastrophes in the 20th century. J. Nat. Disasters 2000, 9, 9–15. [Google Scholar]
  3. Bender, M.A.; Knutson, T.R.; Tuleya, R.E.; Sirutis, J.J.; Vecchi, G.A.; Garner, S.T.; Held, I.M. Modeled impact of anthropogenic warming on the frequency of intense Atlantic hurricanes. Science 2010, 327, 454–458. [Google Scholar] [CrossRef] [PubMed]
  4. Liu, D.; Pang, L.; Xie, B. Typhoon disaster in China: Prediction, prevention, and mitigation. Nat. Hazards 2009, 49, 421–436. [Google Scholar] [CrossRef]
  5. Field, C.B. (Ed.) Climate Change 2014–Impacts, Adaptation and Vulnerability: Regional Aspects; Cambridge University Press: Cambridge, UK, 2014. [Google Scholar]
  6. Zhao, Q.; Yao, Y.; Yao, W. GPS-based PWV for precipitation forecasting and its application to a typhoon event. J. Atmos. Sol. Terr. Phys. 2018, 167, 124–133. [Google Scholar] [CrossRef]
  7. Lu, J.; Feng, T.; Li, J.; Cai, Z.; Xu, X.; Li, L.; Li, J. Impact of assimilating himawari-8-derived layered precipitable water with varying cumulus and microphysics parameterization schemes on the simulation of typhoon hato. J. Geophys. Res. Atmos. 2019, 124, 3050–3071. [Google Scholar] [CrossRef]
  8. Fontaine, B.; Roucou, P.; Trzaska, S. Atmospheric water cycle and moisture fluxes in the West African monsoon: Mean annual cycles and relationship using NCEP/NCAR reanalysis. Geophys. Res. Lett. 2003, 30, 1117. [Google Scholar] [CrossRef]
  9. Gilford, D.; Randel, W.J. Analyzing nearly four decades of historical radiosonde observations of tropical tropopause layer and cold-point temperatures. In AGU Fall Meeting Abstracts; American Geophysical Union: Washington, DC, USA, 2017. [Google Scholar]
  10. Schmid, B.; Hegg, D.A.; Wang, J.; Bates, D.; Redemann, J.; Russell, P.B.; Flagan, R.C. Column closure studies of lower tropospheric aerosol and water vapor during ACE-Asia using airborne Sun photometer and airborne in situ and ship-based lidar measurements. J. Geophys. Res. Atmos. 2003, 108, ACE 24-1–ACE 24-22. [Google Scholar] [CrossRef]
  11. Boone, C.D.; Walker, K.A.; Bernath, P.F. Speed-dependent voigt profile for water vapor in infrared remote sensing applications. J. Quant. Spectrosc. Radiat. Transf. 2007, 105, 525–532. [Google Scholar] [CrossRef]
  12. Pérez-Ramírez, D.; Navas-Guzmán, F.; Lyamani, H.; Fernández-Gálvez, J.; Olmo, F.J.; Alados-Arboledas, L. Retrievals of precipitable water vapor using star photometry: Assessment with Raman lidar and link to sun photometry. J. Geophys. Res. Atmos. 2012, 117. [Google Scholar] [CrossRef]
  13. Chen, B.; Liu, Z. Analysis of precipitable water vapor (PWV) data derived from multiple techniques: GPS, WVR, radiosonde and NHM in Hong Kong. In China Satellite Navigation Conference (CSNC) 2014 Proceedings: Volume I; Springer: Berlin/Heidelberg, Germany, 2014; pp. 159–175. [Google Scholar]
  14. Bevis, M.; Businger, S.; Herring, T.A.; Rocken, C.; Anthes, R.A.; Ware, R.H. GPS meteorology: Remote sensing of atmospheric water vapor using the Global Positioning System. J. Geophys. Res. Atmos. 1992, 97, 15787–15801. [Google Scholar] [CrossRef]
  15. Lee, S.W.; Kouba, J.; Schutz, B.; Kim, D.H.; Lee, Y.J. Monitoring precipitable water vapor in real-time using global navigation satellite systems. J. Geod. 2013, 87, 923–934. [Google Scholar] [CrossRef]
  16. Shoji, Y.; Sato, K.; Yabuki, M.; Tsuda, T. Comparison of shipborne GNSS-derived precipitable water vapor with radiosonde in the western North Pacific and in the seas adjacent to Japan. Earth Planets Space 2017, 69, 153. [Google Scholar] [CrossRef]
  17. Zhang, W.; Lou, Y.; Huang, J.; Zheng, F.; Cao, Y.; Liang, H.; Liu, J. Multiscale variations of precipitable water over China based on 1999–2015 ground-based GPS observations and evaluations of reanalysis products. J. Clim. 2018, 31, 945–962. [Google Scholar] [CrossRef]
  18. Yao, Y.; Shan, L.; Zhao, Q. Establishing a method of short-term rainfall forecasting based on GNSS-derived PWV and its application. Sci. Rep. 2017, 7, 12465. [Google Scholar] [CrossRef] [PubMed]
  19. Choy, S.; Wang, C.; Zhang, K.; Kuleshov, Y. GPS sensing of precipitable water vapour during the March 2010 Melbourne storm. Adv. Space Res. 2013, 52, 1688–1699. [Google Scholar] [CrossRef]
  20. Tang, X.; Hancock, C.; Xiang, Z.; Kong, Y.; Ligt, H.; Shi, H.; Quaye-Ballard, J. Precipitable water vapour retrieval from GPS precise point positioning and NCEP CFSv2 dataset during typhoon events. Sensors 2018, 18, 3831. [Google Scholar] [CrossRef]
  21. Nykiel, G.; Figurski, M.; Baldysz, Z. Analysis of GNSS sensed precipitable water vapour and tropospheric gradients during the derecho event in Poland of 11th August 2017. J. Atmos. Sol. Terr. Phys. 2019, 193, 105082. [Google Scholar] [CrossRef]
  22. Olauson, J. ERA5: The new champion of wind power modelling? Renew. Energy 2018, 126, 322–331. [Google Scholar] [CrossRef]
  23. Zhang, W.; Lou, Y.; Haase, J.S.; Zhang, R.; Zheng, G.; Huang, J.; Liu, J. The use of ground-based GPS precipitable water measurements over China to assess radiosonde and ERA-Interim moisture trends and errors from 1999 to 2015. J. Clim. 2017, 30, 7643–7667. [Google Scholar] [CrossRef]
  24. Xiao, Y.F.; Duan, Z.D.; Xiao, Y.Q.; Ou, J.P.; Chang, L.; Li, Q.S. Typhoon wind hazard analysis for southeast China coastal regions. Struct. Saf. 2011, 33, 286–295. [Google Scholar] [CrossRef]
  25. Wei, L.; Li, J.; Yang, X. ExpErimEnts on impact-basEd ForEcasting and risk-basEd Warning of typhoon in China. Trop. Cyclone Res. Rev. 2018, 7, 31–36. [Google Scholar]
  26. Ying, M.; Zhang, W.; Yu, H.; Lu, X.; Feng, J.; Fan, Y.; Chen, D. An overview of the China meteorological administration tropical cyclone database. J. Atmos. Ocean. Technol. 2014, 31, 287–301. [Google Scholar] [CrossRef]
  27. Dee, D.P.; Uppala, S.M.; Simmons, A.J.; Berrisford, P.; Poli, P.; Kobayashi, S.; Bechtold, P. The ERA-Interim reanalysis: Configuration and performance of the data assimilation system. Q. J. R. Meteorol. Soc. 2011, 137, 553–597. [Google Scholar] [CrossRef]
  28. Zhao, Q.; Yao, Y.; Yao, W.; Zhang, S. GNSS-derived PWV and comparison with radiosonde and ECMWF ERA-Interim data over mainland China. J. Atmos. Sol. Terr. Phys. 2019, 182, 85–92. [Google Scholar] [CrossRef]
  29. Yuan, Y.; Zhang, K.; Rohm, W.; Choy, S.; Norman, R.; Wang, C.S. Real-time retrieval of precipitable water vapor from GPS precise point positioning. J. Geophys. Res. Atmos. 2014, 119, 10044–10057. [Google Scholar] [CrossRef]
  30. Rybin, E.N.; Valyukhov, V.P.; Kuptsov, V.D. Thermodynamics of supersaturated vapor nucleation on molecular condensation nuclei. Tech. Phys. 2012, 57, 1062–1067. [Google Scholar] [CrossRef]
  31. Jiao, J.; Su, D.; Wang, Y. Dynamics of water vapor content around isolated sprinklers: Description and validation of model. Water 2017, 9, 307. [Google Scholar] [CrossRef]
  32. Campbell, S.L.; Kunkel, P.; Bobinyec, K. A minimal norm corrected underdetermined Gauß—Newton procedure. Appl. Numer. Math. 2012, 62, 592–605. [Google Scholar] [CrossRef]
Figure 1. Tracks of typhoons that landed in China over the period of 1951–2016.
Remotesensing 11 02845 g001
Figure 2. Number and types of tropical cyclones landing in China over the period of 1951–2017.
Remotesensing 11 02845 g002
Figure 3. (a) RMS and (b) bias distributions of the PWV difference between GNSS/radiosonde and ERA5 data from various stations over the period of 2005–2016, where the triangle and circle represent the GNSS and radiosonde stations, respectively.
Remotesensing 11 02845 g003
Figure 4. Tracks of selected typhoon events and their intensity.
Remotesensing 11 02845 g004
Figure 5. Time-series variations of hourly PWV and precipitation during the landing period of typhoons (a) Merbok, (b) Nesat, (c) Hato, and (d) Khanun.
Remotesensing 11 02845 g005
Figure 6. Time series variations of hourly PWV and pressure during the landing period of typhoons (a) Merbok, (b) Nesat, (c) Hato, and (d) Khanun.
Remotesensing 11 02845 g006
Figure 7. Time-series variations of hourly PWV and wind during the landing period of typhoons (a) Merbok, (b) Nesat, (c) Hato, and (d) Khanun, respectively.
Remotesensing 11 02845 g007
Figure 8. Variation of the PWV during Typhoon Hato over the period of local time 18:00 on 19 August to 19:00 on 24 August 2017.
Remotesensing 11 02845 g008
Figure 9. Schematic diagram of the typhoon velocity determination, where the orange circle refers to the typhoon wind circle.
Remotesensing 11 02845 g009
Figure 10. PWV time series of selected nine stations during Typhoon Hato.
Remotesensing 11 02845 g010
Figure 11. Schematic diagram of the velocity and acceleration monitoring of typhoon movement, where the left side of the figure is the complete typhoon track and the right side of the figure is an enlargement of one of the typhoon tracks.
Remotesensing 11 02845 g011
Figure 12. Relationship between the given initial values of direction, velocity, acceleration, and iteration times.
Remotesensing 11 02845 g012
Table 1. Classification of tropical cyclone intensity.
IntensityDescription
TDTropical depression (10.8–17.1 m/s, Beaufort wind magnitude 6–7)
TSTropical storm (17.2–24.4 m/s, Beaufort force 8–9)
STSSevere tropical storm (24.5–32.6 m/s, Beaufort force 10–11)
TYTyphoon (32.7–41.4 m/s, Beaufort force 12–13)
STYStrong typhoon (41.5–50.9 m/s, Beaufort category 14–15)
SuperTYSuper typhoon (greater than or equal to 51.0 m/s, Beaufort wind level ≥16)
Table 2. Statistical result of typhoon velocity for Hato.
YearMonthDayHourΔtiTyphoon v (km/h)Mean v (km/h)Estimated v (km/h)
20178235030
20178236 2729.5731.36
7 30
8 30
9 30
10 30
11630
201782312 2627.7530
13 25
14930
201782315 3026.426.39
16 30
17 25
18 25
19 20
20 28
21 25
22 23
231828
20178240 262627.16
1 23
2 25
3 25
4 25
5 29
62527
20178247 272726.68
8 27
9 27
102927
201782411 2726.425.48
12 27
13 27
14 24
1534*
2017825851**21.44
20178251255**15.49
* refers to a typhoon velocity that is not given in the China Meteorological Observatory Typhoon Network data.
Table 3. Simulated results of the estimated velocity, direction, and acceleration of the typhoon’s movement under different numbers of stations and typhoon locations.
Number of StationsTyphoon LocationParameter Remained EstimatedReal ValuesEstimated Values
12x: 20
y: 15
θ (°)36.8736.87
a (km/h2)10.009.60
v (km/h)20.0019.63
8x: 22.5
y: 13
θ (°)30.0230.02
a (km/h2)3.973.97
v (km/h)24.0024.00
8x: 18
y: 26
θ (°)55.3055.30
a (km/h2)16.2516.25
v (km/h)23.5023.50
10x: 22
y: 22
θ (°)45.0045.00
a (km/h2)2.232.23
v (km/h)30.0030.00
7x: 20
y: 15
θ (°)40.7340.73
a (km/h2)5.515.51
v (km/h)21.0021.00

