Article

Mobile Laser Scanning for Estimating Tree Stem Diameter Using Segmentation and Tree Spine Calibration

1
Department of Forest Resource Management, Swedish University of Agricultural Sciences, SE-901 83 Umeå, Sweden
2
Electrooptical Systems and Sensor Informatics, Swedish Defence Research Agency, SE-581 11 Linköping, Sweden
3
The Forestry Research Institute of Sweden, SE - 751 83 Uppsala, Sweden
*
Author to whom correspondence should be addressed.
Remote Sens. 2019, 11(23), 2781; https://doi.org/10.3390/rs11232781
Submission received: 21 October 2019 / Revised: 19 November 2019 / Accepted: 22 November 2019 / Published: 26 November 2019
(This article belongs to the Special Issue 3D Point Clouds in Forest Remote Sensing)

Abstract

:
Mobile laser scanning (MLS) could make forest inventories more efficient, by using algorithms that automatically derive tree stem center positions and stem diameters. In this work we present a novel method for calibration of the position for laser returns based on tree spines derived from laser data. A first calibration of positions was made for sequential laser scans and further calibrations of laser returns were possible after segmentation, in which laser returns were associated to individual tree stems. The segmentation made it possible to model tree stem spines (i.e., center line of tree stems). Assumptions of coherent tree spine positions were used for correcting laser return positions on the tree stems, thereby improving estimation of stem profiles (i.e., stem diameters at different heights from the ground level). The method was validated on six 20-m radius field plots. Stem diameters were estimated with a Root-Mean-Square-Error (RMSE) of 1 cm for safely linked trees (maximum link distance of 0.5 m) and with a restriction of a minimum amount of data from height intervals for supporting circle estimates. The accuracy was high for plot level estimates of basal area-weighted mean stem diameter (relative RMSE 3.4%) and basal area (relative RMSE 8.5%) because of little influence of small trees (i.e., aggregation of individual trees). The spine calibration made it possible to derive 3D stem profiles also from 3D laser data calculated from sensor positions with large errors because of disturbed below canopy signals from global navigation satellite systems.

Graphical Abstract

1. Introduction

Forest inventory methods used today which deliver objective estimates are based on manual measurements of tree stem diameters on sample plots. However, ground-based laser scanning, which is able to measure the 3D surrounding environment, could be used for automation of forest inventories. Stationary laser scanning with a sensor placed on a tripod and with a scanning mechanism used to measure distances in almost every direction is usually referred to as Terrestrial Laser Scanning (TLS). Measurements with TLS from one view-point (single scan) will produce a high-density 3D point cloud because of a long observation time. The absence of position errors caused by scanner movements will produce high-precision 3D point clouds. The produced 3D data are useful for tree stem modelling [1]. Mobile laser scanning (MLS) devices used for tree measurements have several advantages compared with TLS. The trajectory of view-points will increase the probability of tree detection close to the scanner because other trees will rarely be in the line of sight from all view-points of the scanner. Also, measurements are not restricted to sample plots because data are collected continuously [2]. One challenge is estimation of the sensor trajectory that is needed for calculation of the 3D point cloud. For open areas the position can be derived with an Inertial Navigation System (INS) using a combination of a Global Navigation Satellite System (GNSS) and an Inertial Measurement Unit (IMU), but this method would not work properly in areas where satellite signals are blocked or disturbed. Simultaneous Localization And Mapping (SLAM) algorithms can be used in areas with poor satellite signals. These algorithms are usually efficient for indoor applications thanks to well-defined planar surfaces in many directions, but the problem becomes more difficult in outdoor environments with more complex geometry. For outdoor environments, SLAM algorithms have been developed that use the geometry of the traversed surroundings without needing high-precision inertial measurements [3,4].
Position calibration algorithms have also been tailored for forest environments. In Finland, laser data from trees were used as reference for a SLAM algorithm and, in combination with attitude data from a survey grade IMU, a position error of 0.32 m was produced, which was 38% better than only using IMU combined with GNSS data. However, the use of SLAM was not successful in open areas with few trees [5]. This study was followed by a validation of a SLAM method based on laser scanner data from trees that was aided by heading and velocity data from GNSS/INS, which reduced the total position error of the trajectory to 6 cm [6].
In another study in Finland, graph SLAM calibration of an initial trajectory from GNSS and IMU data was applied using tree stems as features, which produced an internal conformity of laser data with a standard deviation less than 1 cm and with position accuracy better than 6 cm [7]. The same system was used for estimation of tree stem attributes on 23 field plots. Individual tree stems that were scanned from different positions were estimated separately, and the version with the longest estimated stem profile was chosen as the estimation result [8].
In Norway, a laser scanner with 16 lasers, scanning 360° around the vertical axis, and with ±15° vertical field-of-view, was used for estimation of tree positions and stem diameter. The estimations were validated on a 250-m2 field plot, and the results were compared with manual measurements for 14 detected trees out of 18 trees. Tree stem position center and stem radius were estimated with circle fits from individual scan revolutions. Positions of tree centers were corrected using an iterative closest point algorithm. Stem diameters at a standard height (1.3 m) were estimated using clustered circle fit estimates, together with an assumption of a constant decrease of diameter along tree stems and with height normalization of laser data from the laser scanner system using a digital elevation model obtained from airborne laser scanner data [9].
In another study in Norway, similar algorithms were used but two laser scanners were mounted on a backpack, one horizontal for tree measurements and another vertical for ground elevation measurements. The estimations of tree stem diameters were validated using manual measurements of individual trees on seven 500-m2 field plots. The backpack-mounted laser scanners produced lower stem diameter estimation errors compared with using single-scan TLS data and a handheld laser scanner [10].
The system presented in this study consists of (1) a positioning system providing an initial estimate of the sensor trajectory, (2) a laser scanner operated with multiple lasers, each separated with different angles in relation to the horizontal plane of the scanner, (3) algorithms for calibration of the initial sensor trajectory using laser measurements of surrounding objects, and (4) algorithms for estimation of tree positions and stem diameters. In earlier work the same system was tested but tree stem positions and tree stem diameter could be estimated with a combination of a low-cost IMU, a stereo camera, and a laser scanner [11]. In this article the algorithms are described in more detail, further improvements of the method using tree spines are presented, and the initial trajectory was estimated without a stereo camera. A different test area with more complex forest was used for validation. The objectives were (1) to develop algorithms for calibration of mobile laser scanner data that will also work in difficult forest environments, (2) to develop algorithms for stem diameter estimation, and (3) to validate these algorithms on forest plots in northern Sweden.

2. Material

2.1. Laser Scanner

The laser scanner was a Velodyne VLP-16. The scanner contains 16 lasers that rotate 360° around the vertical axis of the scanner with 10 revolutions per second. Adjacent lasers are separated by 2° to cover a ±15-degree sector relative to the horizontal level of the scanner. The laser scanner emits approximately 300,000 pulses per second. The beam divergence was 0.18°. The scanner was tilted 28° backwards, relative to the horizontal level, to also receive laser returns on the ground near the scanner.

2.2. Inertial Navigation System

An Inertial Navigation System (INS) was used to estimate an initial sensor trajectory and geo-reference laser scanner data. The INS was a NovAtel SPAN-IGM-S1 equipped with a GPS-702-GG antenna. The INS data were processed using the software NovAtel Intertial Explorer, which includes filtering of the sensor trajectory and subsequent calibration of GNSS data using data from the Swedish national reference system SWEPOS.

2.3. Data Logging and Time Synchronization

The laser scanner sent 10 Hz User Datagram Protocol (UDP) data to a computer, and these packets contained point data including time stamps, range, intensity, rotation, and elevation. INS data were logged at 125 Hz using a Python script. The laser scanner has an internal clock which can be used to time stamp laser data, but this clock should be synchronized with the GNSS time used by the INS system. Therefore, messages containing time were sent from the INS to the laser scanner. The synchronization made it possible to obtain GNSS time stamps in the UDP packages that were sent from the laser scanner to the computer. The time stamps could be used to connect laser ranges from the scanner with position and orientation estimates of the scanner from the INS, enabling calculation of a 3D point cloud in a global coordinate system.

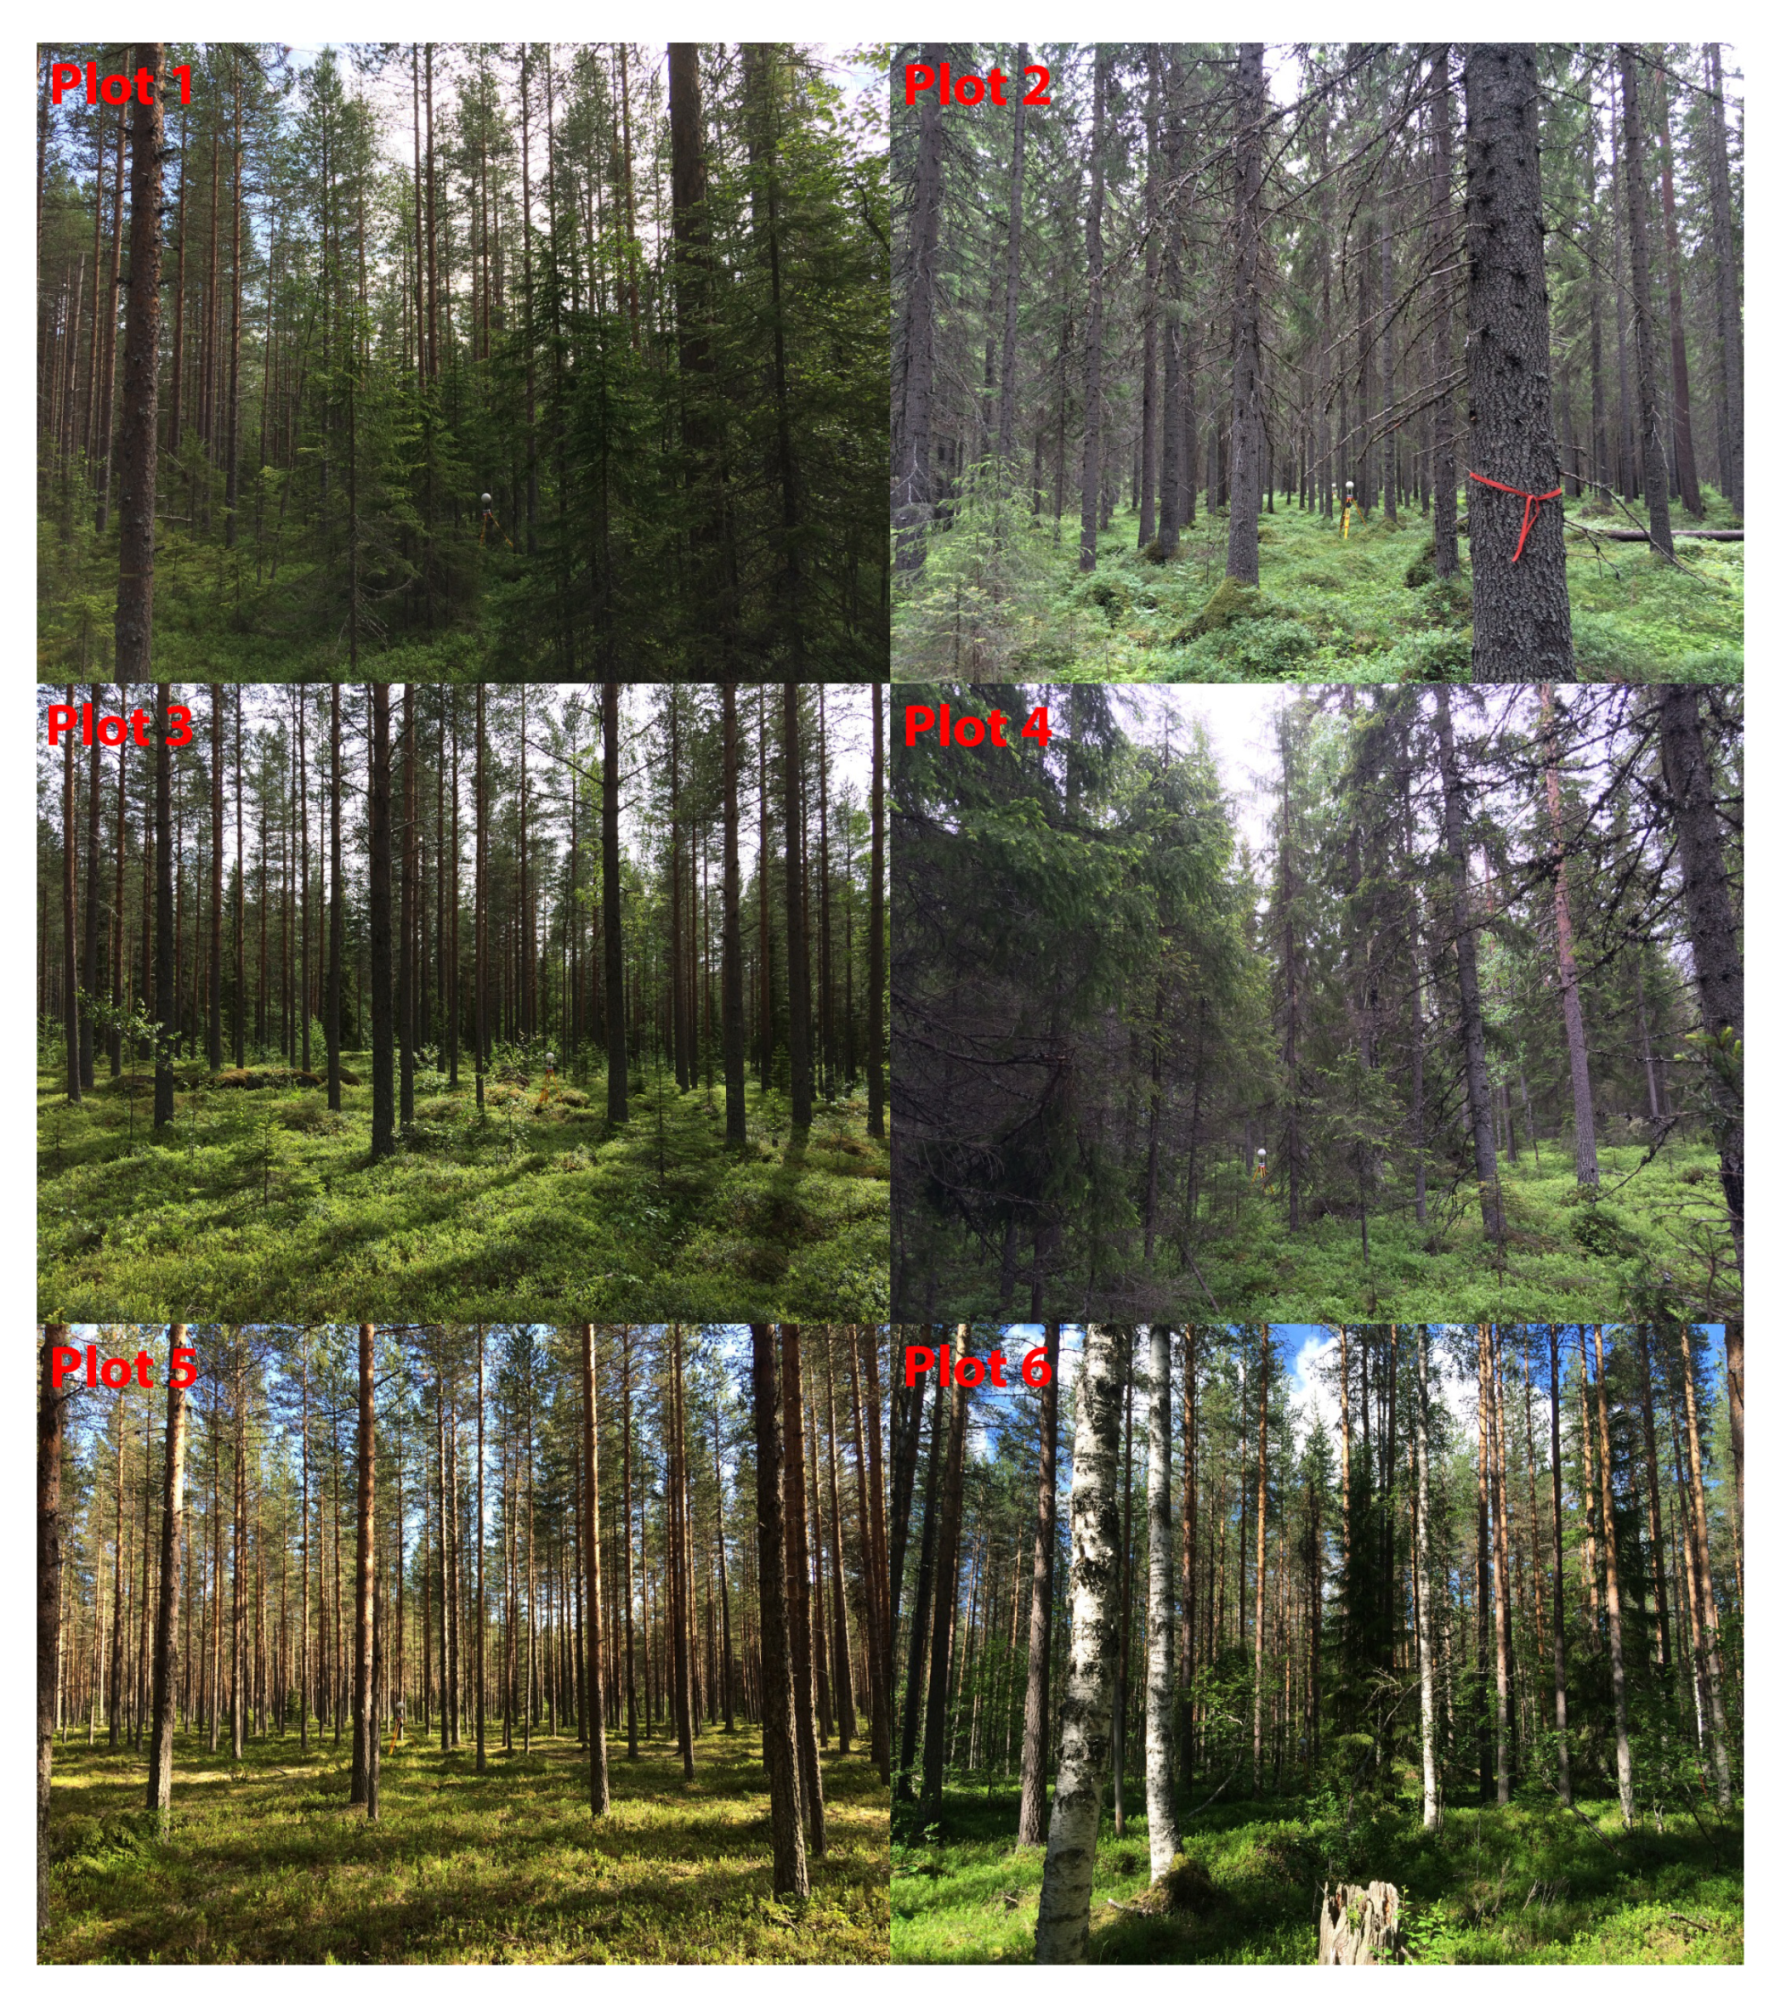
2.4. Validation Data
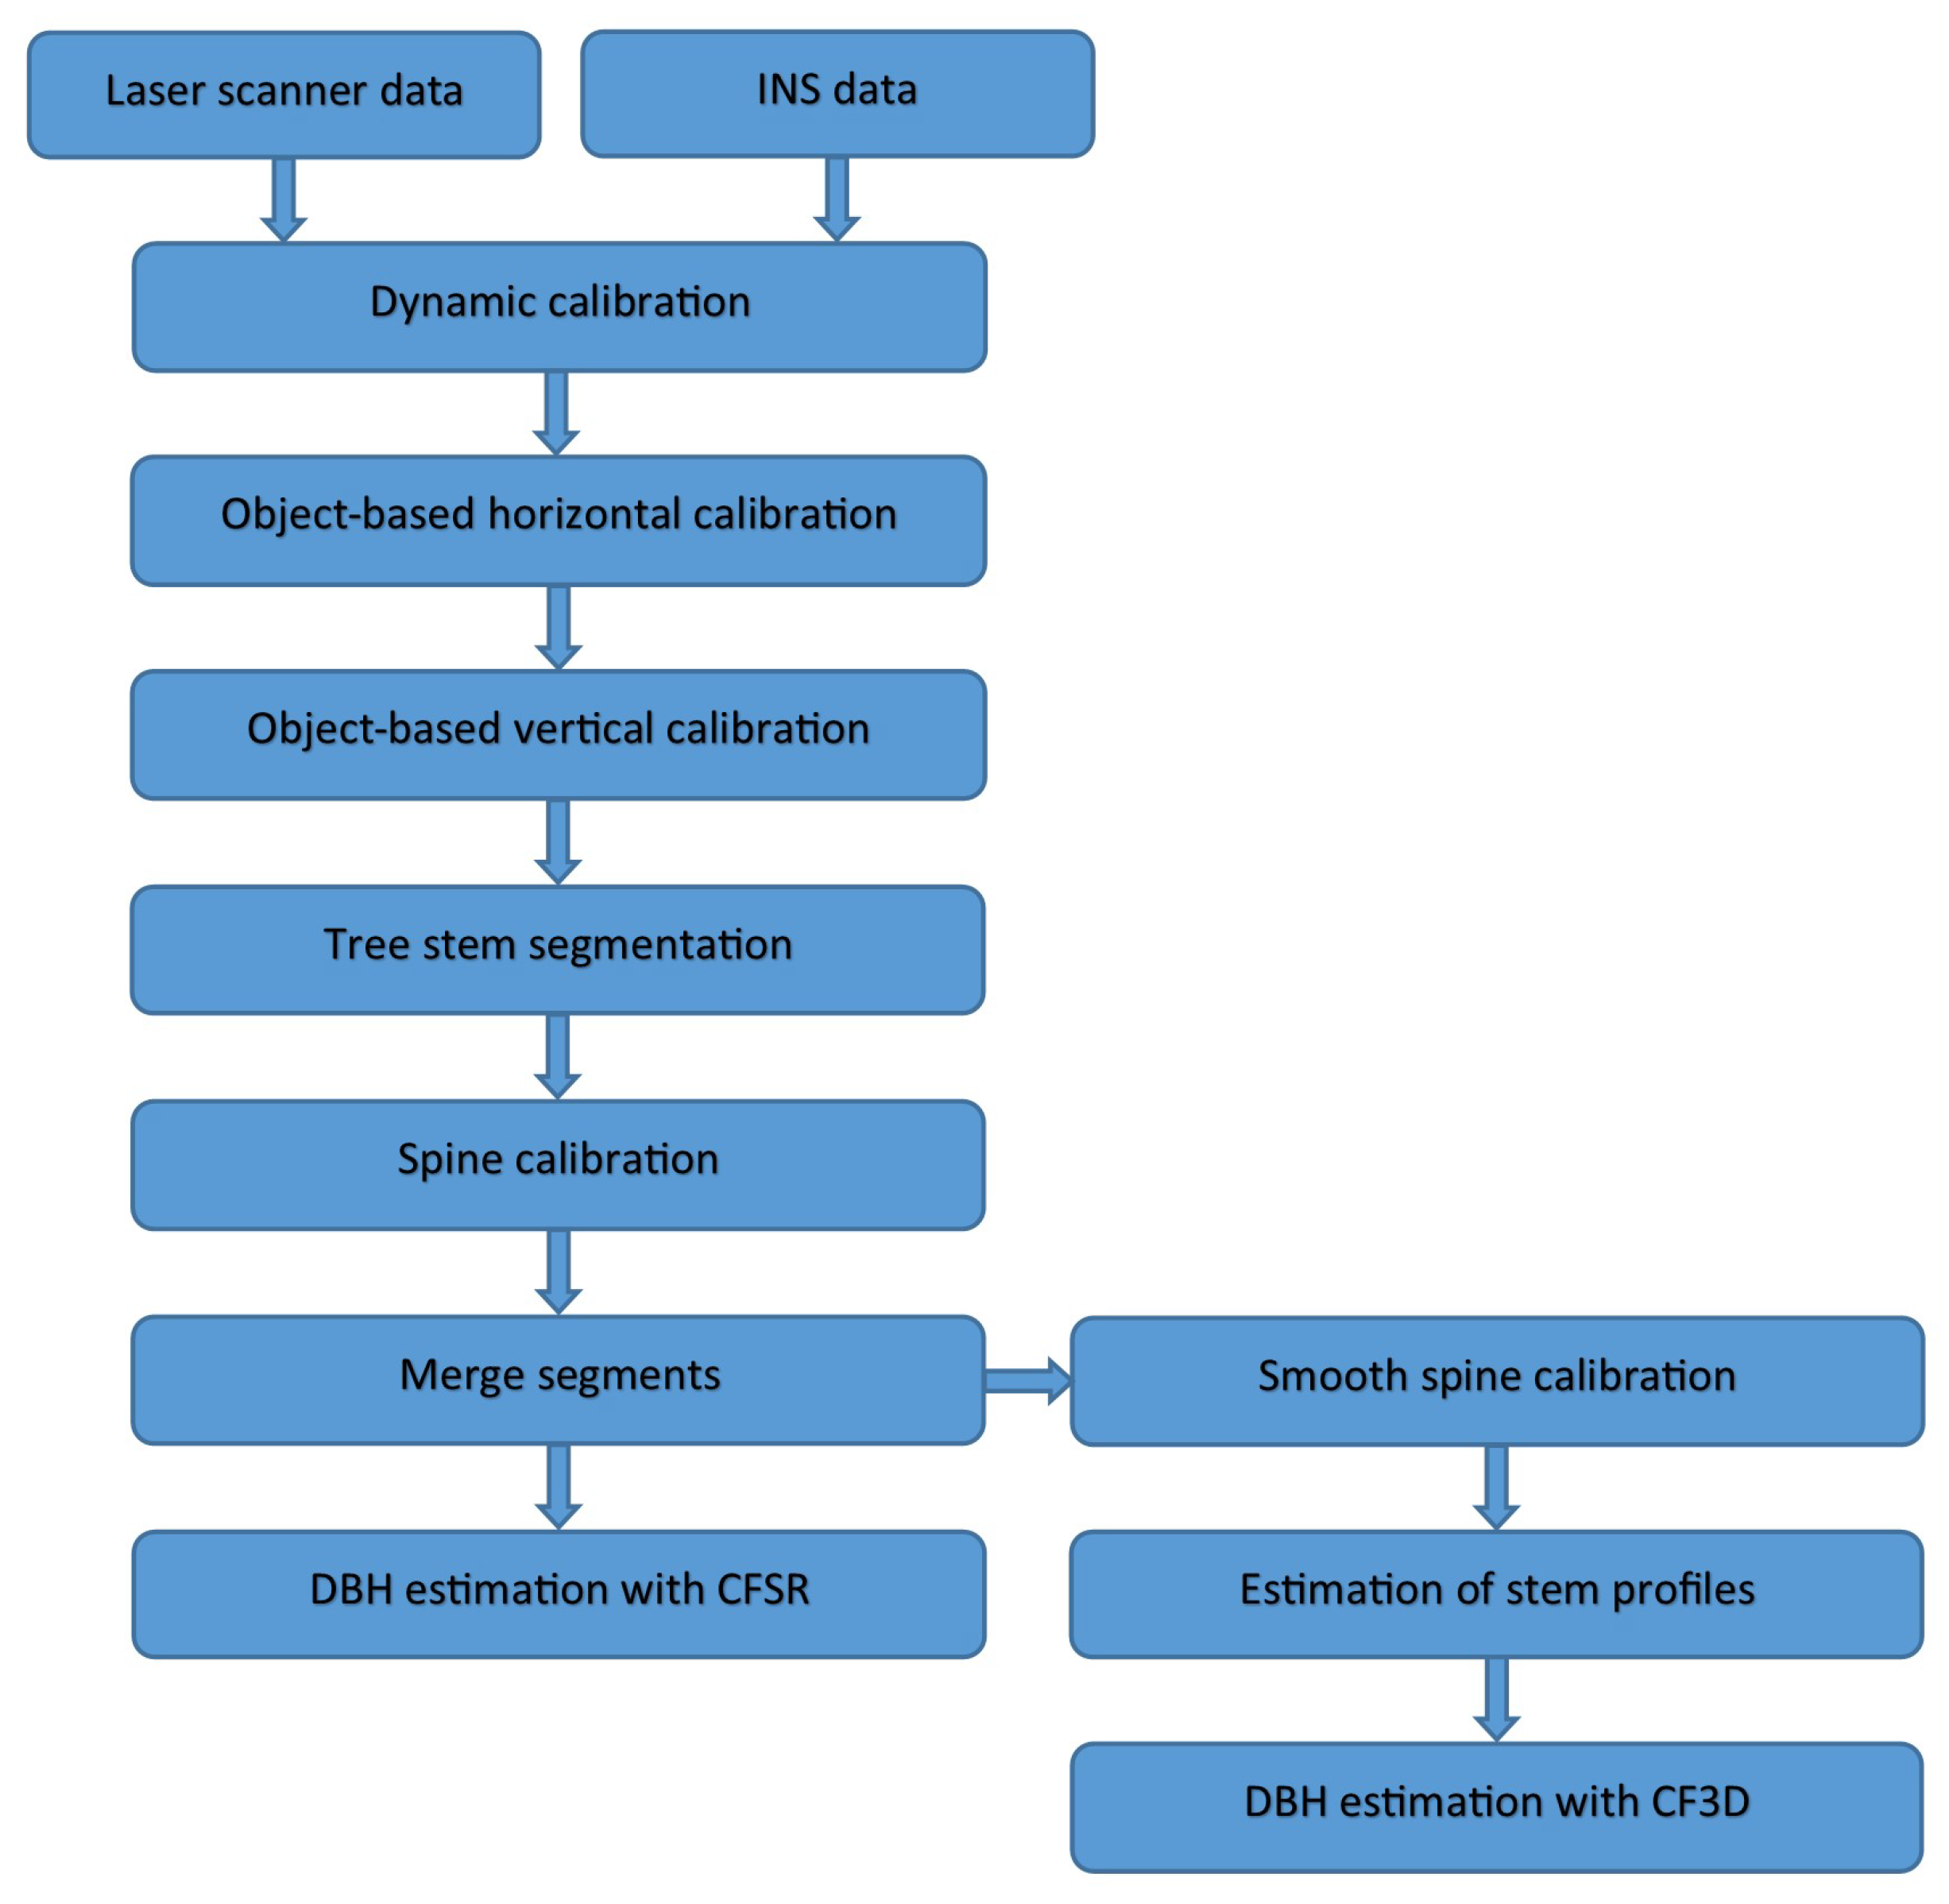
The system was validated at a test site in northern Sweden located in the Krycklan river catchment area (lat. 64°14 N, long. 19°46 E). Field plots with a size of 80 m by 80 m had been set up in other projects. The position of trees and stem diameter at breast height 1.3 m above ground level (DBH) were measured on these plots using a combination of static Terrestrial Laser Scanning (TLS, Trimble TX8) and manual diameter measurements with caliper for trees with a DBH ≥ 4 cm. Each 80 m by 80 m plot was measured with TLS from 4 by 4 scan stations, placed on a grid with approximately 20 m between each grid node. Individual point clouds from scan stations were merged with co-registration using spheres placed on adjacent scan station, and GNSS measurements from each scan station made it possible to transform TLS coordinates to global coordinates. Trees were detected and stem diameters were estimated from TLS data using a previously developed algorithm [12]. DBH was measured manually with a digital caliper integrated with an ultrasonic trilateration system (DP POSTEX, Haglöf Sweden AB). The ultrasonic trilateration system measures tree positions in relation to a plot center, but the accuracy is only sufficient for short ranges. Therefore, 4 by 4 sub-plots were used, each placed with the center close to a scan station. The manual measurements of tree positions and DBH were then automatically linked to the spatial pattern of tree positions from TLS measurements, using an earlier developed matching algorithm [13] to obtain global coordinates also for manual measurements.
Estimations of tree positions and DBH from the MLS system were validated in this study using six of the field plots selected, in order to have a variation in terms of the amount of small trees and tree species composition. The MLS system was validated within a circle with 20-m radius located near the center of the large field plot. The following trajectory was used: (1) first walking along the border of a half circle, (2) crossing the circle on the side of the mid-line closest to the first measured half circle, returning back near the place where the circle was first entered, (3) crossing the half circle parallel to the last crossing line but on the other side of the mid-line of the circle, and (4) finally, walking along the border of the second half circle until arriving at the first point of entry to the circle (Figure 1). In this way, the same place was measured from different directions without a big time difference. The manual measurements were performed in 2016 and the MLS measurements were performed in 2017. Field plot 1 consisted of Scots pine (Pinus sylvestris) with a layer of smaller Norway spruce trees (Picea abies), field plot 2 consisted of tall Norway spruce trees, field plot 3 consisted of Scots pine with sparse low vegetation, field plot 4 contained a mixture of Scots pine and Norway spruce with dense areas of small Norway spruce trees, field plot 5 was a flat area with Scots pine and almost no low vegetation, and field plot 6 contained a mixture of Scots pine, Norway spruce, and deciduous trees (Figure 2).

3. Methods

The positions of laser returns were first corrected using dynamic calibration with sensor pose registration for each sweep, using data from previous sensor sweeps with support of features extracted from both trees and the ground. For each sweep, circle fits were derived from laser returns on tree stems. The center locations of circle fits (stem sections) were used for segmentation of the data for association of stem sections to individual trees by searching for linear objects (i.e., linear formations of stem centers). The associations of stem sections to one tree stem were then used for tree spine calibration in order to fine-tune the position of laser returns needed for estimating stem profiles. In this study, a tree spine was defined as the center of a tree stem with a continuation from ground level and upwards. The stem diameter was estimated in two ways, using diameter-height functions: (1) fitting a function to circle fits of individual scan revolutions, and (2) using circle fits from the stem profiles with 3D data from several scan revolutions, thereby including the sensor position errors. The method for calibration of laser data and estimation of tree stem attributes are outlined Figure 3 and is described in the following subsections. The algorithms of the left-hand-side of the flowchart has earlier been described briefly [11], except dynamic calibration, horizontal object-based calibration, and vertical object-based calibration, which were also recently described with more details [14].

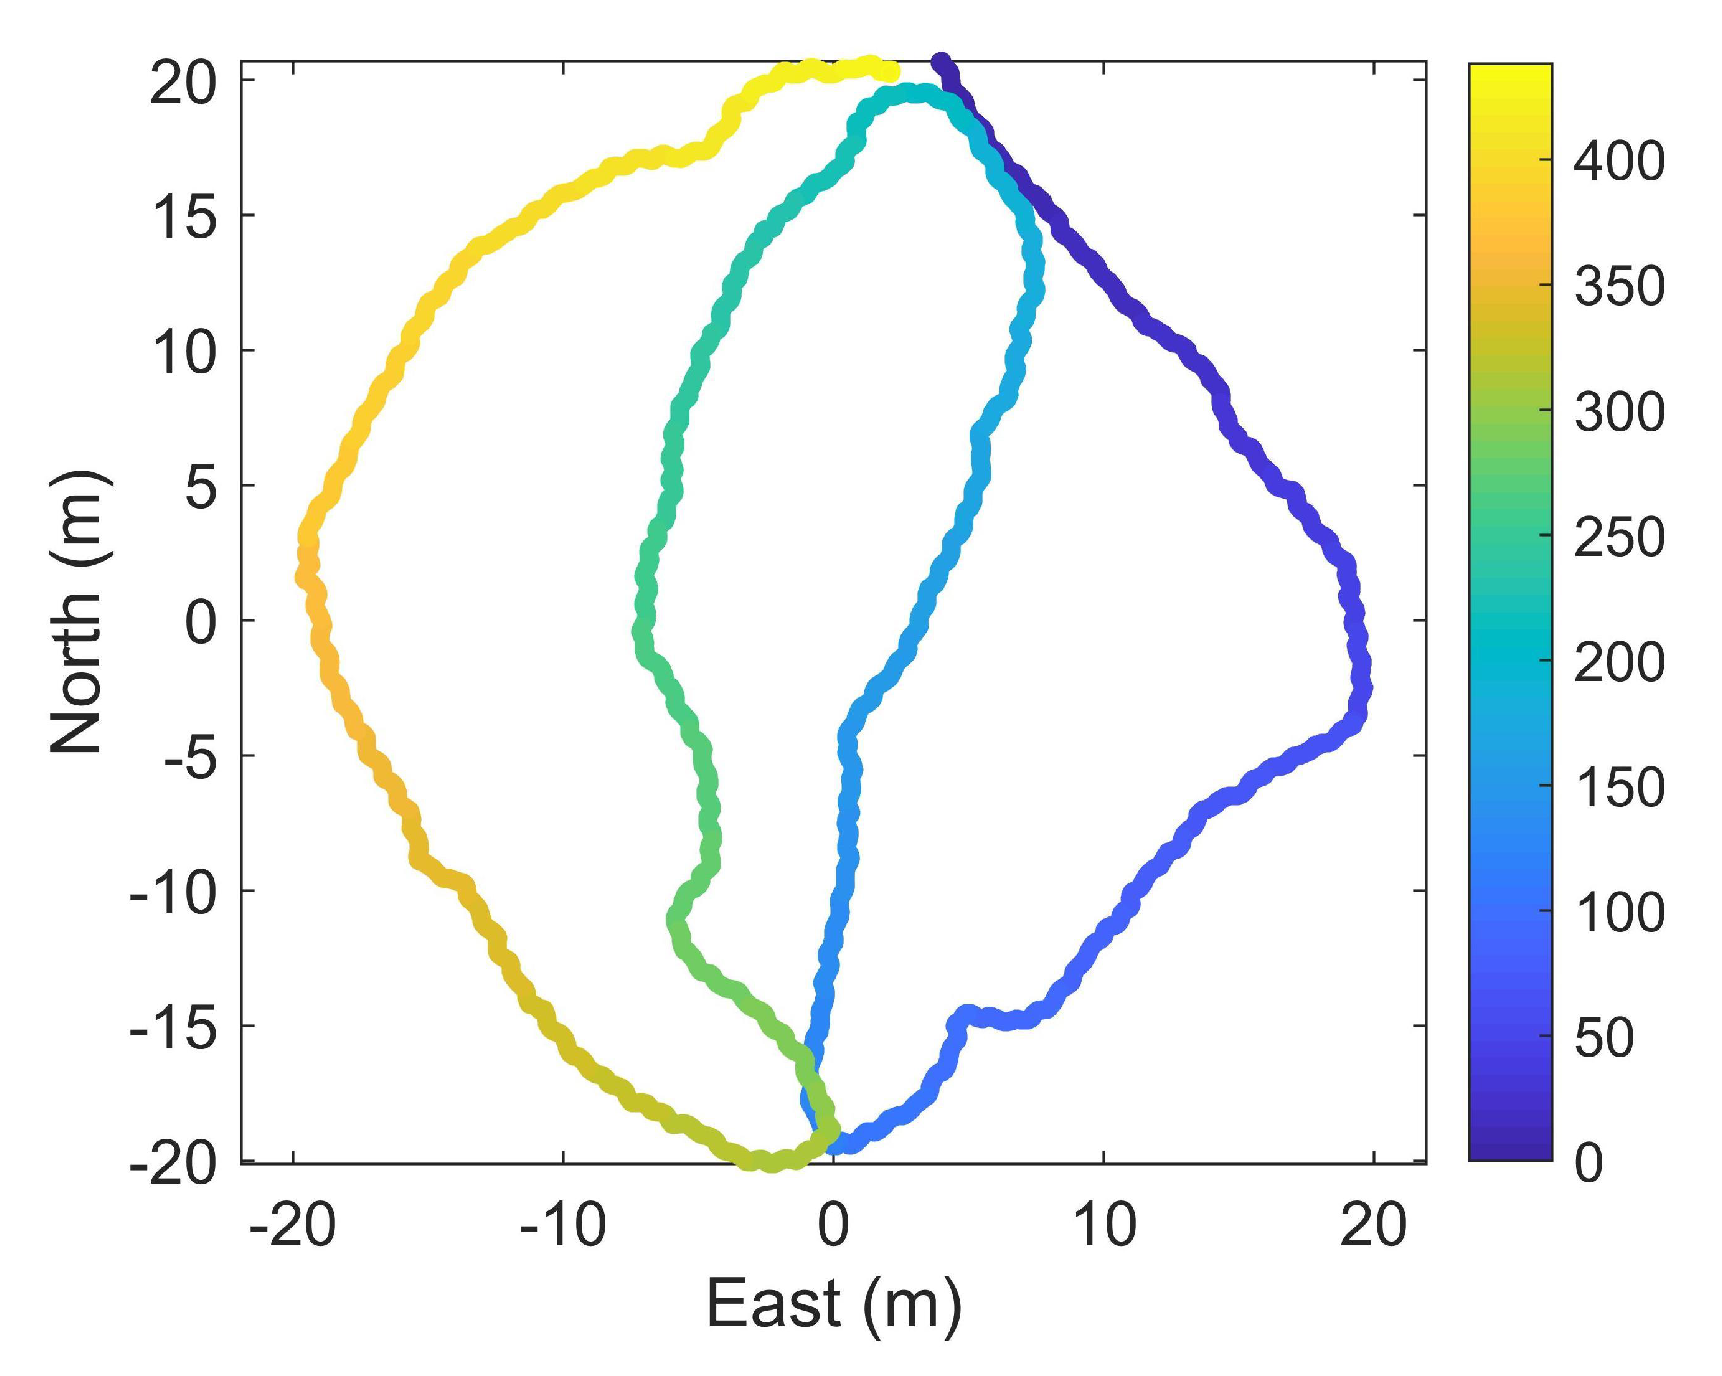
3.1. Dynamic Calibration

In this calibration step, a six degrees of freedom (6 DOF: x, y, z, roll, pitch, yaw) calibration was performed on individual scan revolutions. The dynamic calibration builds on previous developments where the laser scanner was mounted on a small Unmanned Aerial Vehicle (UAV)  [15,16], and the algorithm was later adapted for person carried sensor acquisitions inside forests [14]. The sensor pose data from the initial estimate, given by the INS, was adjusted based on comparison of laser data from one scan revolution (each 0.1 s) with laser data from earlier scan revolutions. For the dynamic calibration, and also for subsequent steps, features were extracted from the laser data. Two feature types were used: tree stem sections and flats. Stem sections correspond to 3D laser data returned from the stem part of the trees. Flats correspond to 3D laser data returned from flat surfaces, which mainly comprise parts of the ground in a forest.
As a first step, the 3D points were put on a mesh to evaluate smoothness, where rows represent scanner evolution and columns represent rotational angle. The local smoothness evaluation was inspired by the method proposed by Zhang and Singh [4]. Our modification of the smoothness calculation is that different shape and size of the region which defines the neighbors are used, depending on which type of feature is extracted. The smoothness value c was computed with Equation (1) for each row i and column j of this mesh image, using a region with height ( 2 ( m + 1 ) ) and width ( 2 ( n + 1 ) ). For detection of stem sections a region was used which corresponds to an elongated rectangle when projected onto objects, with a height of 3 rows and a width of 5 columns (4° elevation by 1° azimuth). For detection of flats on the ground a region was used which approximately corresponds to a square, with a height of 5 rows and a width of 41 columns (8° elevation by 8° azimuth). To safely obtain features from several directions, four sectors of the scanner rotational angles were defined: forward (315° to 45°), left (225° to 315°), right (45° to 135°), and backward (135° to 225°). In each sector, the 30 points with lowest c were selected for further processing.
Several filters were then applied with the aim to only select tree feature points located on tree stems for further processing. For a tree feature point, a region of interest was used with the half azimuth width equal to the maximum expected stem radius (0.3 m). For each region of interest three sets of points ( P 1 , P 2 , and P 3 ) were selected from the upper ( r = i + 1 ), middle ( r = i ), and lower adjacent ( r = i 1 ) elevation levels (rows). In P 1 , P 2 , and P 3 , the distances were compared in each column and points were removed if the absolute difference was above a distance threshold (>0.2 m). In the next step, ground points were rejected by requiring a minimum altitude difference between the point data on rows r = i 1 and r = i + 1 . The points from P r respectively were then fitted to three circles in the horizontal plane ( x , y ) using an analytic method obtaining stem-section centers ( x , y ), stem radius, and Root-Mean-Square of the residuals ( R M S ). To remove points from, e.g., branches, a threshold of R M S was applied (1.5 cm). If the R M S was above this threshold, the outer points on both sides in the azimuth direction were removed and the reduced data were fitted once more to a circle and either accepted or rejected based on the new R M S -value. This removal procedure of stem sections was the first method to remove stem sections that potentially contained points from branches. However, if there were too few stem sections in one scanner rotation, a second routine was applied, which stepwise removes a point with the highest residual and in each step fits the remaining points to a circle until R M S is below 1.5 cm or too few points (<5) remain.
The extracted and filtered features from a scan revolution were used to calibrate the sensor pose (Equation (2)) versus the features obtained from earlier scan revolutions (Equation (3)), where I N S denotes the INS values used to obtain an initial pose and D dynamic calibration. Two different distance metrics were used for optimization of the best pose in 6 DOF: for flats, the point-to-plane distances, and for stem sections both point-to-plane (to the stem surface) distances and the point-to-line distances (to the estimated stem center position). Values of the K matrix were found by minimizing an objective function (Equation (4)) generated through a combination of distances between stem sections ( s s ), stem section points ( s s p ), and flats (f). In the equation, the weights w s s , w s s p , and w f were set to 1.0, 0.8, and 0.6, respectively. Different weighted averages of distances were used to also weight features of one type within a scan revolution (Equation (5)). The distance ( D u , v ) between a feature from a current time point (u) and already calibrated features from earlier time periods (v) were weighted with the standard deviation ( w σ , u ) of the circle fit estimate inserted into a bisquare function, to obtain high weights for low standard deviations, and with the stem vector projected distance inserted into a bisquare function, to obtain high weights for small vertical differences on vertical tree stems. The distances derived between stem section points and between flats were weighted in a similar way. For optimization of the sensor pose, the modified steepest gradient method [17] was applied.
c i , j = | | r = i m i + m k = j n j + n ( D i , j D r , k ) | | ( 2 m + 1 ) ( 2 n + 1 ) D i , j
K t = [ r o l l , p i t c h , y a w , x , y , z ]
K t = i D = K t = i I N S + K t = ( i 1 ) D
O = w s s O s s + w s s p O s s p + w f O f
O s s = u = 1 n ( w σ , u w D , u , v D u , v ) u = 1 n ( w σ , u w D , u , v )

3.2. Horizontal Object-Based Calibration

The previous dynamic calibration step was used to reduce short-time errors of the initial sensor trajectory. However, small drifts also become a problem if the same location is measured after some time because multiple estimates are observed for each tree. The solution was to aggregate stem sections for longer time intervals to form initial tree position estimates (simple trees). In this calibration step, adjustments were performed only in the plane (x, y) using average tree position estimates within time intervals. The reason for starting with adjustment in the horizontal plane was that tree centers are distributed in a vertical direction, which makes it possible to first simplify to a 2D adjustment problem. These simple trees were processed in time sequential order. To account for small residual position errors, the stem sections from 10 scan revolutions (1 s of data acquisition) were aggregated, and the sensor position was further corrected to reduce accumulated errors over longer time intervals. In this step, more stem sections were available compared with number of stem sections available for each scanner revolution in the dynamic calibration step, and these stem sections were used to adjust the position in relation to the already adjusted simple trees from previous scan revolutions.
A search was done for neighbors from previous scan revolutions within a search distance in the horizontal plane (1 m). A weighted average of coordinates in the horizontal plane ( x , y ) with individual weights selected to measure importance of correspondence was calculated, using all available reference neighbor stem sections within the search distance. The weights were calculated with differences in z (height), R M S of circle fits, and differences in stem radius as input to bisquare functions together with time difference (age) as input to a power function ( 1.5 ) with a cut off. The pairs with position and weighted averages of neighbor position values (reference) were used to estimate a rigid body transformation in the horizontal plane for each (1 s) time interval relative to the previous time interval. The transformation was applied for all stem sections within the time interval. The algorithm has been described earlier [14].

3.3. Vertical Object-Based Calibration

The accumulated errors will cause problems for generation of a ground elevation model because multiple ground levels will appear when the same area is measured after some period of time if returning to the same place. Therefore, a vertical calibration using flats was performed for each time interval, after calibration in the horizontal plane. For each flat in the current time interval, a search was done within a horizontal search radius of 8 m for reference flats in previous time intervals, and a reference z-value was computed using a weighted average of z-values for reference flats within the search radius, where the weight was the inverse squared distance. In this way, a reference z-value could be computed in areas with low density of flats. Also, individual flats at long distances had little influence on the average of z-values within areas with a high density of reference flats. A weighted average of age (i.e., the time difference between the current flat and reference flat) was also computed using the same distance weight of the ages for reference flats. The pairs of flats, with a pair consisting of the current time interval and the corresponding reference z-value from previous time intervals, were then used in order to compute a z-calibration. The calibration was a weighted average of z-differences of pairs, between a flat in the current time interval and previous time intervals, where the weight was age (i.e., time difference between the time of the current flat and the weighted average time for reference flats). The use of age made it possible to adjust to a previous ground level if the laser scanner returned to an previously visited place. The algorithm has been described earlier [14].

3.4. Tree Stem Segmentation

The stem sections from the dynamic calibration were derived from circle fits from individual scanner sweeps, and consisted of a center coordinate (x, y, z) and a circle radius. The aim of the segmentation was to associate several stem sections to a tree stem to form clusters (R). A direction vector ( V s ) for each stem section (i.e., a 3D line) was first estimated using other stem sections within a 0.5-m horizontal search distance threshold ( d t h ), using Principal Component Analysis (PCA) and the center coordinates ( x , y , z ) of the stem sections (i.e., circle fit centers) as input. The stem sections were sorted in a list according to the root-mean-square-error (RMSE) of the 3D linear estimation, starting with the most linear description of the tree center distribution. Another stem section was included in the segment if the associated circle included the 3D linear vector. This procedure was repeated until no more stem sections could be added to the current start segment. A stem section that was added to a stem segment was also removed from the list of available stem sections. A new segment was then formed, starting with the next available stem section from the list. This procedure was repeated until all stem sections had been added to a stem segment (R). This algorithm has earlier been described only briefly [11]. See Algorithm 1 for an overview.
Algorithm 1 Segmentation
 1:
for i = 1 to size { S } do
 2:
        Find neighbors to S i within a horizontal distance ( d t h ) { S i n }
 3:
        Use { S i n } as input to Principal Component Analysis → first vector ( V s )
 4:
        Calculate RMSE with residuals from V i E i
 5:
end for
 6:
Initialize: Region List { R } , Available stem sections { A } { S }
 7:
while {A} is not empty do
 8:
        Item with smallest E in A S m i n
 9:
        Remove item with smallest E from { A }
10:
         S m i n → current region list ( R c )
11:
         S m i n → current seed list ( S c )
12:
        while { S c } is not empty do
13:
                for j = 1 to size { S c } do
14:
                   Find the n closest 3D points from S c j in {A} { B c j }
15:
                   for k = 1 to size { B c j } do
16:
                           if circle of B k include vector intersection of circle S c then
17:
                                    B k { R c }
18:
                                    B k { S c }
19:
                                   Remove B k from {A}
20:
                           end if
21:
                   end for
22:
                end for
23:
        end while
24:
end while

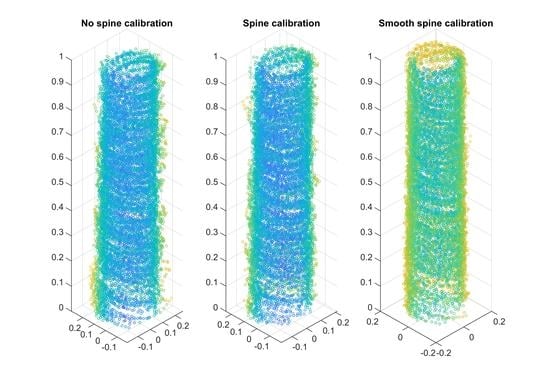
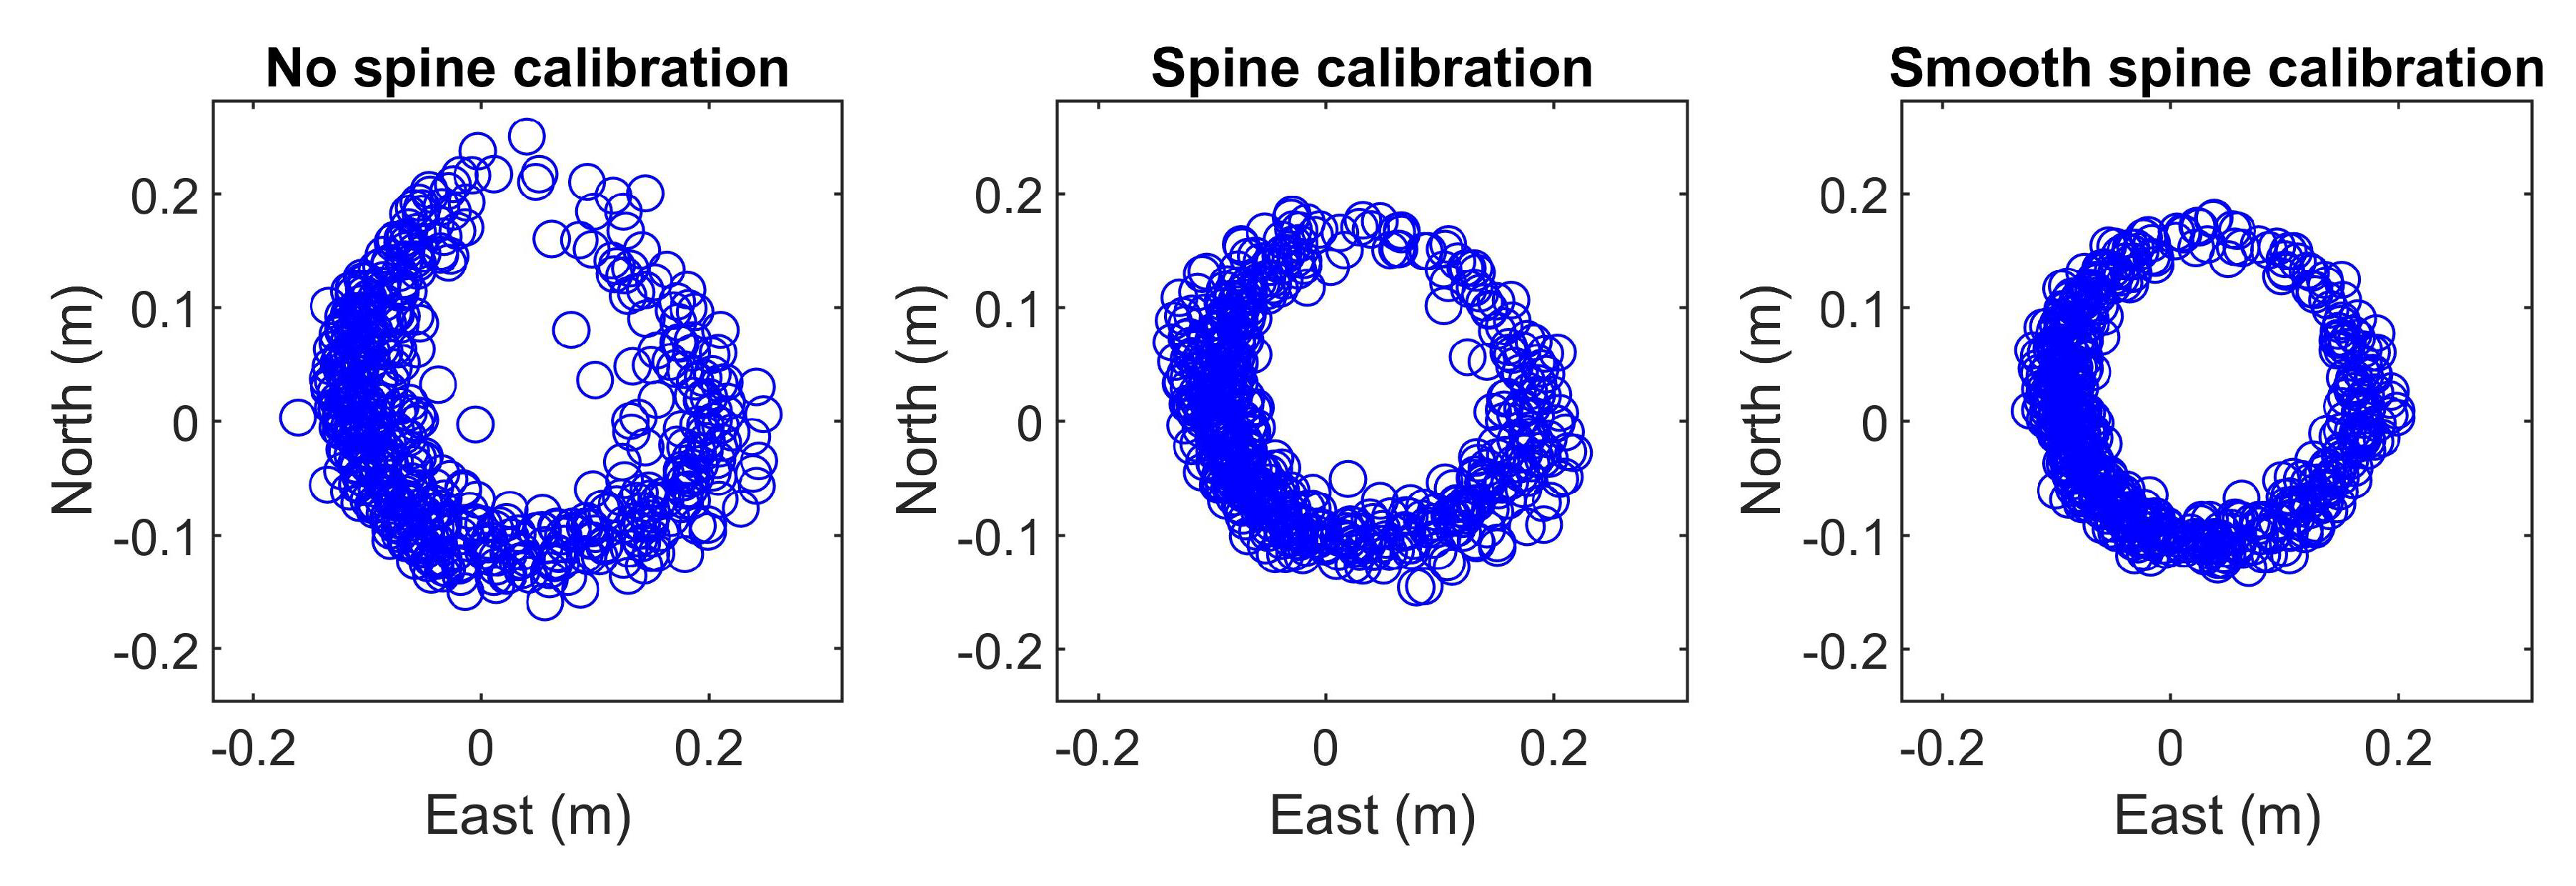
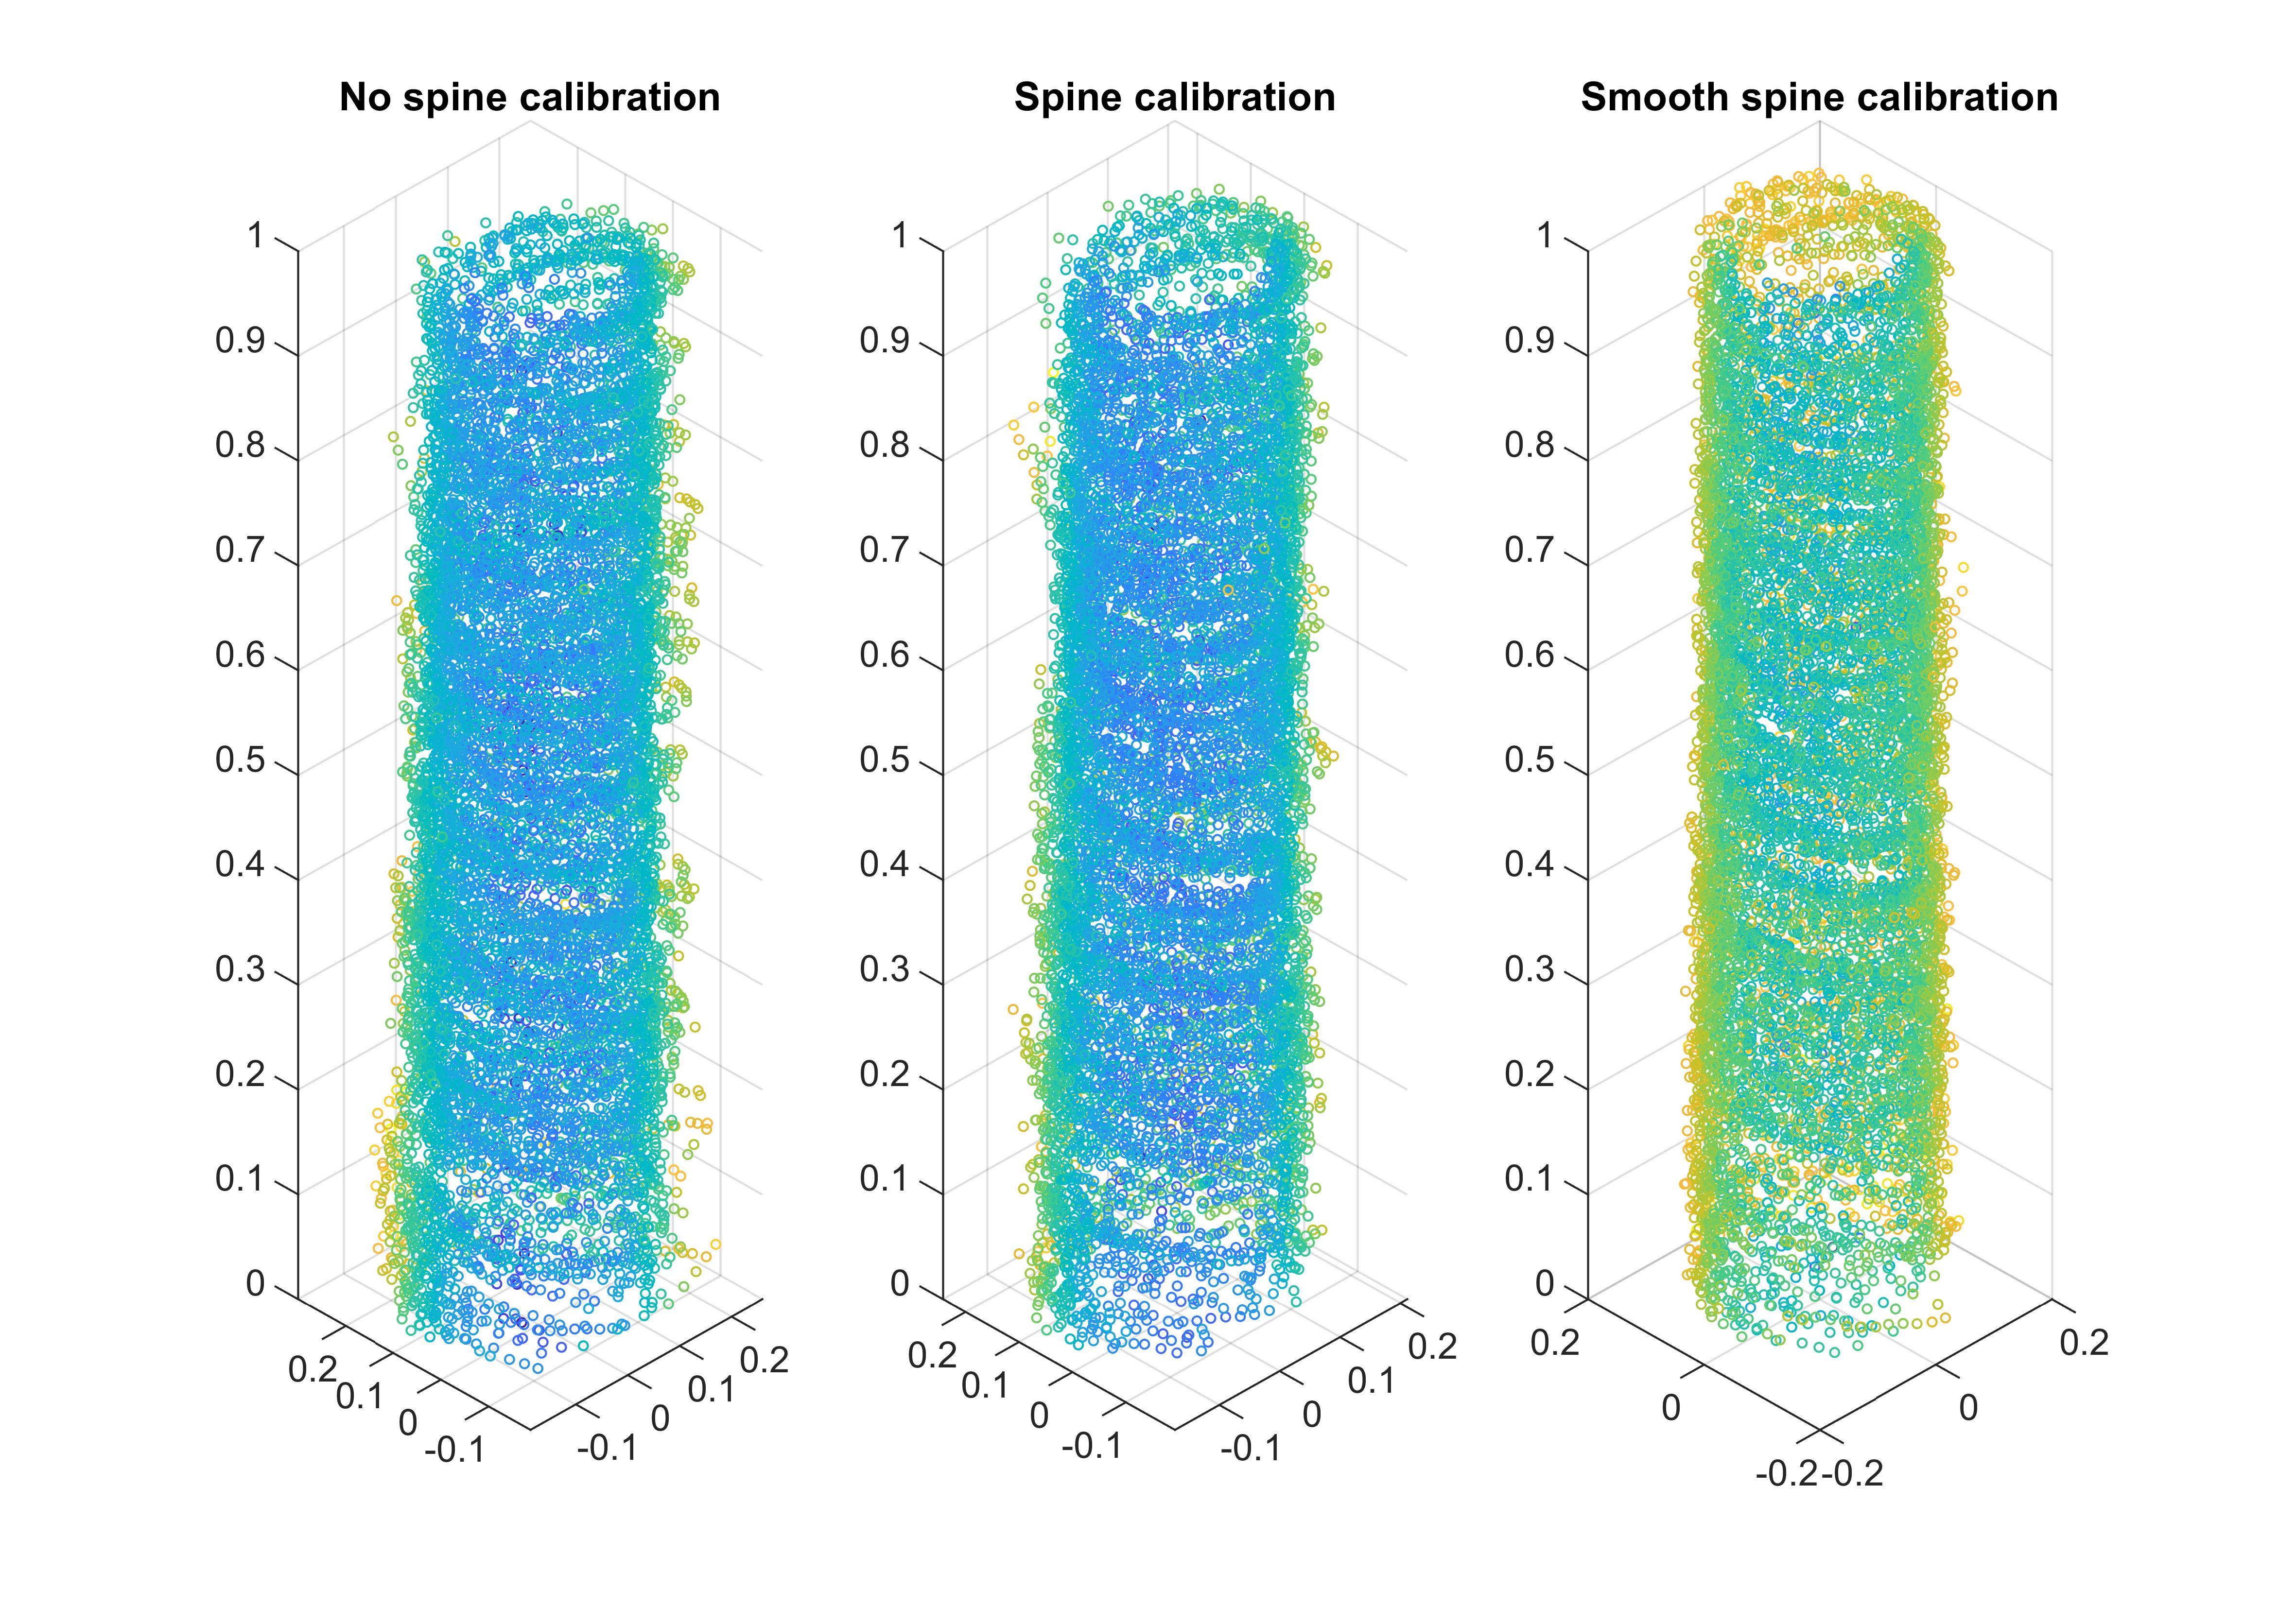
3.5. Spine Calibration

In this calibration step, a tree spine was assumed to be a 3D-line. The horizontal position estimates of section centers were adjusted to remove systematic errors, based on the assumption that stem sections belong to specific stems according to the stem segmentation. For each stem segment, a 3D-line was estimated from the stem section centers using PCA. This made it possible to calculate pairs of x , y -coordinates for each stem section based on these two positions: (1) the original stem section center position ( x c , y c ) and (2) the position where the 3D-line intersected a horizontal plane in which the original stem section center position was included ( x s , y s ). The stem sections were then sorted in time order. Starting from the beginning of the data acquisition, a time interval was formed just large enough to include stem sections from at least three different stem segments. A rigid body transformation in the horizontal plane was done by minimizing the horizontal Euclidian squared distances between coordinate pairs of stem section centers X p ( x c , y c ) and line-plane intersections within the time interval Y p ( x s , y s ). The found transformation (rotation matrix, translation vector) was used to correct the stem points associated to the stem sections in the specific time interval. This was repeated for sequential time intervals from start to stop of the laser acquisition. This algorithm has earlier been described only briefly [11]. See Algorithm 2 for an overview.
Algorithm 2 Spine calibration
 1:
for i = 1 to size { S S C } do
 2:
        Stem centers ( x , y , z ) of S S C i { S C i }
 3:
        PCA function: { S C i } direction vector ( V i )
 4:
        z coordinate (height) of S C i z
 5:
        Find x, y coordinates for V i at z (height) Y i
 6:
        x, y coordinates of S S C i X i
 7:
end for
 8:
Sort { S S C } by time in ascending order { S C T }
 9:
while { S C T } is not empty do
10:
        Stem sections in time period { P }
11:
         n 0
12:
        while n < 3 do
13:
                Number of unique stem segments in { P } n
14:
                Move next SSC from { S C T } { P }
15:
        end while
16:
         { P } { X p , Y p }
17:
        Rigid body transformation { X p , Y p } Y ^ p
18:
         Y ^ p new horizontal positions of { P }
19:
end while

3.6. Merge Segments

Several stem segments could belong to the same tree after the initial segmentation, for example because of shaded areas caused by branches. Stem segments were therefore merged, based on the main direction of each segment. The PCA was calculated using all stem section points within a segment to find the main direction, and the deviation from the direction vector was calculated. All stem segments were compared with each other. The direction vector of the longest tree stem segment in the z-direction was used. The intersection of the direction vector and the horizontal plane defined by the mean z-value for the shorter tree stem segment was calculated. The two segments were merged into one if the intersection point was within a shorter range to the mean horizontal coordinates (x, y) of the smaller segment points than the sum of the mean values of the radius from the two stem segments. This algorithm has earlier been described only briefly [11].

3.7. Smooth Spine Calibration

The positions of the laser returns on the tree stems were further calibrated using the assumption that spines are smooth curves (i.e., similar direction of one part and adjacent parts along a tree stem). A Kalman filter was therefore applied from the lowest to the highest measured part of a tree stem to estimate a smooth tree stem spine. The initial estimate of the filter was a vector pointing vertically and a specific error for the measurements. The Kalman filter produced a smoothed curved spine describing the location of tree stem centers for all heights (z-values) of the measurement interval. The horizontal distance between the stem section center and the estimated spine centers for the same height (z-value) as a stem section was determined ( d x , d y ). This distance was then used to correct the position of all stem laser returns associated to a specific stem section. The horizontal positions ( x , y ) of laser returns associated to a stem section were corrected by subtraction with the distance ( d x , d y ). This procedure was repeated for all stem sections and associated laser returns from the tree stems. The calibration should remove systematic errors if the spine location could be estimated with no errors. See Algorithm 3 for an overview of the algorithm where { T } is a list of items with tree data and each item contains stem sections and stem points associated to a tree. The smoothed spine is created on lines 16 to 23 and the calibration is done on lines 24 to 28. The output is a list of stem points { S P } with updated horizontal positions ( x , y ).
Algorithm 3 Smooth spine calibration
 1:
for i = 1 to size { T } do
 2:
        Stem sections in { T i } > { S T }
 3:
        Sort { S T } by height (z-value) in ascending order { S T H }
 4:
        Measurement vector Z horizontal location of { S T H }
 5:
        Previous state vector X P [ S T H 1 , 0 ]
 6:
        Diagonal elements of motion model matrix ϕ 1
 7:
         ϕ [ 1 , 2 ] d h (height step)
 8:
         ϕ [ 2 , 1 ] 0
 9:
         σ m 0.1
10:
        Diagonal elements of error matrix P σ m 2
11:
        First part (i.e., location) of measurement matrix M 1
12:
        Second part (i.e., change) of measurement matrix M 0
13:
         σ z 0.1
14:
        Measurement noise covariance R σ z 2
15:
        Process noise matrix Q 0
16:
        for j = 1 to size { S T H } do
17:
                 P ϕ P ϕ T + Q
18:
                 S M P M T + R
19:
                 K P M S 1
20:
                 P P K M P
21:
                 X i P X P + K ( Z M P X P )
22:
                 X P X i
23:
        end for
24:
        for j = 1 to size { S T H } do
25:
                 D j Z j X j
26:
                Horizontal position of stem points linked to S T H j S P j
27:
                 S P j S P j D j
28:
        end for
29:
end for

3.8. Estimation of Stem Profiles

The calibration of a position for a stem section in earlier steps was used to derive a new position for the laser returns that were included in the same stem section. A Profile of the stem diameter for different heights was then estimated based on the corrected 3D point data (laser returns). The stem diameter was estimated for 0.1-m height sections along the tree stems using circle fit estimates. One estimate was done if a height section contained at least a minimum number of laser returns (>30 measurements). In order to estimate stem diameters for parts of a tree stem with sparse measurements, laser returns from several adjacent height intervals were accumulated from above and with 0.1-m steps downwards until the minimum number of laser returns was obtained. The positions of laser returns were adjusted to reduce errors caused by tree stems that were not vertical: (1) mean value of the stem center calculated in the smooth spine calibration step was calculated for all laser returns that were used for a circle fit, and (2) the differences between this mean value and individual stem centers were then used for horizontal calibration of individual laser returns. The stem profile, consisting of circle fits for height sections, was then smoothed using a Kalman filter. The starting point was selected at the median height value of the estimated circle fits. The median height was chosen as the starting point because circle fits at the lower and upper parts of the measured tree stem were judged to have highest errors due to branches further up on the stem, non-circle stem shape near the ground, and less data in both ends compared to middle parts of the measured tree stem. The mean absolute difference between a height section and the adjacent height sections was derived and used as an estimate of the circle fit error in the Kalman filter in order to apply individual weights of height sections. The stem diameter estimate at the starting point was then smoothed using the average of above and below estimates to obtain a smooth transition between the lower and upper filtered estimates.

3.9. Ground Elevation Model

A Digital Elevation Model (DEM) of the ground was created using flats that had been used for dynamic calibration, and after calibration described in Section 3.3. These points were usually located on the ground but could sometimes also be located above the ground. Only flats with standard deviation less than 0.1 m and with a distance to the sensor less than 10 m were used for creating the DEM. A ground height value was estimated for each raster cell by first selecting points within a radius of 8 m. The ground height value was then estimated with inverse squared distance weighting using the heights (z-values) of the selected points. In a second step, values were then set to raster cells without values. For a raster cell without value, the lowest required number of steps to the side (rows, columns) was used to obtain a window that contained at least one ground height value. Inverse distance weighting was used if there was more than one raster cell with a ground height value within the window. This process was repeated for every raster cell to generate a DEM without raster cells with missing values. In a final step, values above the ground were removed using an active contour surface [18]. The elastic surface was pushed up from below and could not reach high values judged to be unrealistic when compared to neighbor values. This algorithm, with exception of the final step, was also used in an earlier study [11].

3.10. Circle Fit Within Scan Revolutions (CFSR)

All stem sections within a tree segment were used to estimate stem diameter at breast height (DBH, 1.3 m above ground level). A curve was fitted by estimating the parameters ( p 1 , p 2 , p 3 , p 4 ) of a third-degree polynomial, with stem diameter from stem sections (d) as response variable and distance from the ground (h) as the explanatory variable (Equation (6)). Circle fits from individual scan revolutions could therefore be combined to form more reliable DBH estimates despite sensor position errors. This estimation method was validated also in an earlier study [11].

3.11. Circle Fit of 3D Point Cloud (CF3D)

The stem profiles could be used to estimate stem diameters along the tree stems. The heights of the stem profiles were first normalized by subtracting the height of the ground elevation model at the estimated tree position. A curve was fitted by estimating the parameters ( p 1 , p 2 , p 3 , p 4 ) of a third-degree polynomial, with stem diameters from stem profiles (d) as response variable and distance from the ground (h) as the explanatory variable (Equation (6)). Circle fits from 3D point data of several height intervals could therefore be combined to form more reliable DBH estimates.
d ( h ) = p 1 h 3 + p 2 h 2 + p 3 h + p 4

3.12. Validation

Trees detected in MLS data were linked to manually measured trees using an earlier developed algorithm [13]. Root-Mean-Square-Error (RMSE) was calculated with Equation (7) and the relative RMSE (Rel.RMSE) was calculated with Equation (8). Bias was calculated with Equation (9) and relative bias (Rel.Bias) with Equation (10). The variable Y ^ is measurement from laser scanning, Y is measurement from manual inventory, Y ¯ is the mean of manual measurements, and n is number of observations.
R M S E = i = 1 n ( Y ^ i Y i ) 2 n
R e l . R M S E = R M S E Y ¯
B i a s = i = 1 n ( Y ^ i Y i ) n
R e l . B i a s = B i a s Y ¯

4. Results

The vertical object-based calibration made it possible to obtain a ground elevation model, without multiple ground levels for the same area, scanned multiple times with a long time separation. Also, the horizontal object-based calibration applied after the dynamic calibration of individual scan revolutions made it possible to avoid multiple stem segments if the sensor returned to the same place after some time. The point cloud was fine-tuned using spine calibration and the precision was further improved after smooth spine calibration (Figure 4 and Figure 5).
The MLS-measured DBH using CFSR was similar to manually measured DBH when comparing trees with a link distance <0.5 m, to avoid incorrect linking, and with >50 circle fits (Figure 6). The RMSE was 11 mm and the bias was 4 mm with these restrictions. For only trees with a link distance <0.5 m but without the >50 circle fits restriction, the RMSE was 19 mm and bias was 6 mm. For trees linked with 1.5 m linking distance used by the matching algorithm, with a high risk of link errors, the RMSE was 28 mm and the bias 7 mm.
The MLS that measured DBH using CF3D was even more similar to manually measured DBH when comparing trees with a link distance <0.5 m and with >20 height intervals for the circle fits (Figure 7). Note that this corresponds to a >2 m measured part of a tree stem with a default height interval of 0.1 m. The RMSE was 10 mm and bias was 0 mm with these restrictions. For only trees with a link distance <0.5 m but without the >20 height intervals restriction, the RMSE was 29 mm and bias 6 mm. For trees linked with 1.5 m linking distance used by the matching algorithm, the RMSE was 33 mm and the bias 7 mm.
The RMSE and bias for both CFSR and CF3D estimates on tree level in the different plots are presented in Table 1 with both link distance restriction and minimum number restrictions, and in Table 2 with only link distance restriction. The proportions of linked trees on plots with different restrictions are presented in Table 3.
A high proportion of trees were detected on plot 2, plot 3, and plot 5. Plot 2 contained tall spruce trees with little understory vegetation. Plot 3 and Plot 5 contained pine trees with few low branches and little understory vegetation (Figure 2). A high proportion of small trees (DBH < 100 mm) were not detected on plot 1, plot 4, and plot 6 (Table 3, Figure 8). The number of MLS trees from the CFSR method as a proportion of manually measured trees were for the stem diameter intervals <50 mm, 50–100 mm, 100–150 mm, 150–200 mm, >200 mm: 0%, 30%, 86%, 91%, and 108%, respectively. The number of MLS trees from the CF3D method as a proportion of manually measured trees were for the stem diameter intervals <50 mm, 50–100 mm, 100–150 mm, 150–200 mm, >200 mm: 0%, 23%, 89%, 93%, and 109%, respectively. Plot level results (mean DBH and basal area) were calculated using all and not only linked trees on the plots. The plot level results were based on CFSR estimations because of higher proportion of detected small trees. The basal area was defined as the cross-section area of tree stems 1.3 m above ground level, which can be presented for each tree or for all trees within a polygon. Basal area-weighted mean DBH was estimated with a relative RMSE of 3.4% on plot level. Basal area was estimated with a relative RMSE of 8.5% on plot level.

5. Discussion

The calibration of the initial 3D positions of laser returns derived from an initial trajectory, estimated with a medium precision INS during long time measurements in forest with disturbed GNSS signals, made the used MLS system suitable for the estimation of tree positions and stem diameters. The estimates of stem diameters were validated on plots with different amounts of low vegetation to understand the limitations of the system. The highest accuracies for stem diameter estimates were obtained for two plots with sparse understory vegetation and with few branches near the ground (field plots 3 and 5).
Stem diameters could be overestimated if laser returns from branches are included in the circle fit. Also, a large beam width (footprint) could cause overestimations, according to a simulation study, because the system could report the location of a return to be in front of the tree stem surface if the beam hits near the edge of the tree stem [19]. In this study, laser returns near the stem edges were removed if a poor circle estimate was obtained and a circle was estimated a second time. The accuracy was higher for the subset of trees with many circle fits probably because more observations will result in more stable estimates from the third degree polynomial function (Equation (6)).
Two different methods for estimation of DBH were validated in this study: CFSR and CF3D. The combined use of circle fits from individual scan revolutions (CFSR) has the advantage that DBH can be estimated without influence of sensor position errors. In an earlier study, where sensor trajectories from a visual SLAM system were used, the DBH estimates could be improved using individual scan revolutions [20]. Several circle fits can be used from a tree stem, combining these with the assumption of similar taper on both sides of a certain height or using a taper function. In this way, the positioning system only needs to deliver position estimates with enough precision to associate laser data from individual scan revolutions to a certain tree stem. The circle fit of 3D data from several scan revolutions within height intervals (CF3D) has the advantage that data from all sides of a tree stem can be used if a tree has been viewed from several directions, which should make high-accuracy circle radius estimates possible also with noise due to branches, etc. A comparison of the scatter plots (Figure 6 and Figure 7) indicates this situation.
However, the CF3D method produced estimates with lower accuracy if tree stems with few data points were also included. It is possible that tree stems with few data points were only viewed from one side, so it was not possible to use the advantage of multiple views. The smooth spine calibration of the stem points made it possible to use circle fits with the 3D point cloud and obtain similar DBH estimation accuracies to DBH estimates that are based on individual scan revolutions. The calibration of the 3D point cloud can also be used to produce 3D models of tree stems, for example estimation of stem profiles and not only DBH. The accuracies of the DBH estimates on the validation plots in this study were similar to accuracies obtained from studies in which high-grade positioning systems and laser scanners were used. For example, the ROAMER system with a tactical grade IMU and a FARO Photon 120 terrestrial laser scanner on a six-wheeled all-terrain vehicle was used for the estimation of DBH on a rectangular plot with sides of 74 m and 50 m in Finland. DBH was estimated with a RMSE of 24 mm [21]. Also in Finland, a MLS system (AKHKA R2) carried by a person with a tactical grade fiber optical IMU and FARO Focus 3D scanner was used on a rectangular plot with the sides 40 m and 50 m. The trees were mapped using three walking paths and DBH was estimated with a RMSE of 51 mm [2]. In another study in Finland, 23 square plots with 34-m side length were used for validation of a mobile system. The proportion of detected trees varied between 60% and 90%, depending on site conditions. The DBH was estimated with relative RMSE 11%, 23%, and 35 % for easy, medium, and difficult plots. The categories were defined based on stem visibility, spatial stem density, and stem diameter distribution. The trajectory on each plot depended on the accessibility, e.g., ruggedness of terrain, tree density and low vegetation [8].
The same type of laser scanner as used in this study was also used in Norway. The system first included one horizontal- mounted Velodyne VLP-16 laser scanner with no laser returns on the ground near the scanner, which required an external ground elevation model from airborne laser scanning [9]. The system was then improved and included two Velodyne VLP-16 scanners, one horizontal-mounted scanner and one vertical-mounted scanner, for improved coverage of both the ground and tree stems. The automatic estimation of stem diameters were validated using manual measurements on seven 500-m2 field plots with a RMSE for all detected trees of 2.2 cm [10].
In this study, only one VLP-16 laser scanner was used but with an oblique view backwards, and similar stem diameter estimation results were obtained for similar forest conditions (e.g., number of stems per area unit). One reason for the low proportions of detected trees observed for small trees in this study (DBH < 100 mm) could be the applied circle fit using individual scan revolutions combined with horizontal resolution of the scanner and errors of distance measurements. High omission errors for trees with small stem diameters (DBH < 100 mm) were also observed on the seven field plots in Norway [10]. The smallest detectable tree stem using a circle fit for which at least three points are needed was calculated with trigonometry, using the scan frequency, pulse repetition, number of lasers, and distance to the scanner [9]. With these parameters, the laser scanning parameters used in this study should give a smallest detectable stem diameter of 67 mm with a 10-m distance to the scanner. In this study, laser returns near the stem edges were removed if a residual target was not reached, which also increased the size of the smallest detectable tree. Circle fits to laser returns on small trees (DBH < 100 mm) should be difficult at 10-m distance from the scanner, which was the approximate maximum distance to trees on the plots with the used sensor trajectory (i.e., circle with 20 m radius was passed on the edge and along the center line). Therefore, a laser scanner emitting more pulses per second or using a lower scan frequency, but also lasers with lower beam divergences, could improve the detection of small trees. Sensor development is moving towards more measurements (i.e., higher resolution) for each scan sweep, which makes high-precision stem diameter estimates easier to obtain even with poor initial estimates of the sensor position.

6. Conclusions

A method for the calibration of laser return positions from a person-carried MLS was developed and used on field plots in northern Sweden, including forest with low vegetation (e.g., small spruce trees with dense foliage), to estimate tree stem diameters. Tree stem section centers were assumed to belong to the same tree stem and form a tree spine. Tree stem diameter estimates from circle fits of the corrected 3D data were compared with tree stem diameter estimates obtained from a combined use of circle fits from individual scan revolutions, used in a function with distance from the ground as the explanatory variable. Similar estimates were obtained from the two estimation methods, which indicate the success of the method that was used to calibrate 3D point cloud data, also using sensor trajectories that have high position errors due to disturbed signals of global navigation satellite systems below forest canopies.

Author Contributions

J.H. developed algorithms for segmentation, spine calibration, and stem diameter estimations, designed the experiment, analyzed the results, and wrote most of the article. M.T. developed algorithms for dynamic calibration, horizontal object-based calibration, vertical object-based calibration, and extraction of features that were also used for the subsequent processing steps. J.N. made the code for time synchronization and assembled the hardware. M.T., E.W., and H.O. contributed with writing of the article.

Funding

The work reported in this article was financed by Hildur and Sven Wingquist’s Foundation for Forest Science Research, Brattås Foundation for Forest Science Research, Carl Trygger’s Foundation for Science Research, Bo Rydin’s Foundation for Science Research, Formas (The Swedish Research Council for Environment, Agricultural Sciences and Spatial Planning), and Mistra (The Swedish Foundation for Strategic Environmental Research).

Acknowledgments

Mattias Tjernqvist assembled the laser scanner system with support from J.N. and performed the laser scanning. Kenneth Olofsson developed the field plot matching and linking algorithm used for the validation method in this study.

Conflicts of Interest

The authors declare no conflict of interest. The founding sponsors had no role in the design of the study, in the collection, analyses, or interpretation of data, in the writing of the manuscript, and in the decision to publish the results.

References

  1. Thies, M.; Pfeifer, N.; Winterhalder, D.; Gorte, B.G.H. Three-dimensional reconstruction of stems for assessment of taper, sweep and lean based on laser scanning of standing trees. Scand. J. For. Res. 2004, 19, 571–581. [Google Scholar] [CrossRef]
  2. Liang, X.; Kukko, A.; Kaartinen, H.; Hyyppä, J.; Yu, X.; Jaakkola, A.; Wang, Y. Possibilities of a Personal Laser Scanning System for Forest Mapping and Ecosystem Services. Sensors 2014, 14, 1228–1248. [Google Scholar] [CrossRef]
  3. Bosse, M.; Zlot, R.; Flick, P. Zebedee: Design of a spring-mounted 3-d range sensor with application to mobile mapping. IEEE Trans. Robot. 2012, 28, 1104–1119. [Google Scholar] [CrossRef]
  4. Zhang, J.; Singh, S. LOAM: Lidar Odometry and Mapping in Real-time. In Robotics: Science and Systems; Citeseer: Princeton, NJ, USA, 2014; Volume 2. [Google Scholar]
  5. Tang, J.; Chen, Y.; Kukko, A.; Kaartinen, H.; Jaakkola, A.; Khoramshahi, E.; Hakala, T.; Hyyppä, J.; Holopainen, M.; Hyyppä, H. SLAM-aided stem mapping for forest inventory with small-footprint mobile LiDAR. Forests 2015, 6, 4588–4606. [Google Scholar] [CrossRef]
  6. Qian, C.; Liu, H.; Tang, J.; Chen, Y.; Kaartinen, H.; Kukko, A.; Zhu, L.; Liang, X.; Chen, L.; Hyyppä, J. An integrated GNSS/INS/LiDAR-SLAM positioning method for highly accurate forest stem mapping. Remote Sens. 2016, 9, 3. [Google Scholar] [CrossRef]
  7. Kukko, A.; Kaijaluoto, R.; Kaartinen, H.; Lehtola, V.V.; Jaakkola, A.; Hyyppä, J. Graph SLAM correction for single scanner MLS forest data under boreal forest canopy. ISPRS J. Photogramm. Remote Sens. 2017, 132, 199–209. [Google Scholar] [CrossRef]
  8. Liang, X.; Kukko, A.; Hyyppä, J.; Lehtomäki, M.; Pyörälä, J.; Yu, X.; Kaartinen, H.; Jaakkola, A.; Wang, Y. In-situ measurements from mobile platforms: An emerging approach to address the old challenges associated with forest inventories. ISPRS J. Photogramm. Remote Sens. 2018, 143, 97–107. [Google Scholar] [CrossRef]
  9. Oveland, I.; Hauglin, M.; Gobakken, T.; Næsset, E.; Maalen-Johansen, I. Automatic estimation of tree position and stem diameter using a moving terrestrial laser scanner. Remote Sens. 2017, 9, 350. [Google Scholar] [CrossRef]
  10. Oveland, I.; Hauglin, M.; Giannetti, F.; Schipper Kjørsvik, N.; Gobakken, T. Comparing three different ground based laser scanning methods for tree stem detection. Remote Sens. 2018, 10, 538. [Google Scholar] [CrossRef]
  11. Holmgren, J.; Tulldahl, H.M.; Nordlöf, J.; Nyström, M.; Olofsson, K.; Rydell, J.; Willén, E. Estimation of tree position and stem diameter using simultaneous localization and mapping with data from a backpack-mounted laser scanner. Int. Arch. Photogramm. Remote Sens. Spat. Inf. Sci. 2017, XLII-3/W3, 59–63. [Google Scholar] [CrossRef]
  12. Olofsson, K.; Holmgren, J. Single Tree Stem Profile Detection Using Terrestrial Laser Scanner Data, Flatness Saliency Features and Curvature Properties. Forests 2016, 7, 207. [Google Scholar] [CrossRef]
  13. Olofsson, K.; Lindberg, E.; Holmgren, J. A method for linking field-surveyed and aerial-detected single trees using cross correlation of position images and the optimization of weighted tree list graphs. In Proceedings of the SilviLaser 2008, 8th International Conference on LiDAR Applications in Forest Assessment and Inventory, Edinburgh, UK, 17–19 September 2008; Hill, R., Rosette, J., Suarez, J., Eds.; pp. 95–104. [Google Scholar]
  14. Tulldahl, M.; Rydell, J.; Holmgren, J.; Nordlöf, J.; Willén, E. Lidar-based positioning in forest environments. In Proceedings of the Electro-Optical Remote Sensing XIII, Strasbourg, France, 9–12 September 2019; Kamerman, G., Steinvall, O., Eds.; International Society for Optics and Photonics, SPIE: Bellingham, WA, USA, 2019; Volume 11160, pp. 32–47. [Google Scholar] [CrossRef]
  15. Tulldahl, H.M.; Larsson, H. Lidar on small UAV for 3D mapping. In Proceedings of the SPIE Security+ Defence, Amsterdam, The Netherlands, 22–25 September 2014; International Society for Optics and Photonics: Bellingham, WA, USA, 2014; pp. 925009-1–925009–14. [Google Scholar]
  16. Tulldahl, H.M.; Bissmarck, F.; Larsson, H.; Grönwall, C.; Tolt, G. Accuracy evaluation of 3D lidar data from small UAV. In Proceedings of the SPIE Security+ Defence, Toulouse, France, 21–24 September 2015; International Society for Optics and Photonics: Bellingham, WA, USA, 2015; pp. 964903-1–964903–11. [Google Scholar]
  17. Armijo, L. Minimization of functions having Lipschitz continuous first partial derivatives. Pac. J. Math. 1966, 16, 1–3. [Google Scholar] [CrossRef]
  18. Elmqvist, M.; Jungert, E.; Lantz, F.; Persson, Å.; Söderman, U. Terrain modelling and analysis using laser scanner data. Int. Arch. Photogramm. Remote Sens. Spat. Inf. Sci. 2001, 34, 219–226. [Google Scholar]
  19. Forsman, M.; Börlin, N.; Olofsson, K.; Reese, H.; Holmgren, J. Bias of cylinder diameter estimation from ground-based laser scanners with different beam widths: A simulation study. ISPRS J. Photogramm. Remote Sens. 2018, 135, 84–92. [Google Scholar] [CrossRef]
  20. Forsman, M.; Holmgren, J.; Olofsson, K. Tree Stem Diameter Estimation from Mobile Laser Scanning Using Line-Wise Intensity-Based Clustering. Forests 2016, 7, 206. [Google Scholar] [CrossRef]
  21. Liang, X.; Hyyppä, J.; Kukko, A.; Kaartinen, H.; Jaakkola, A.; Yu, X. The Use of a Mobile Laser Scanning System for Mapping Large Forest Plots. IEEE Geosci. Remote Sens. Lett. 2014, 11, 1504–1508. [Google Scholar] [CrossRef]
Figure 1. Sensor trajectory on one field plot. The colour code represents time (seconds).
Remotesensing 11 02781 g001
Figure 2. Images of field plots used for validation.
Remotesensing 11 02781 g002
Figure 3. Flowchart of the method.
Remotesensing 11 02781 g003
Figure 4. One decimeter height interval of a tree stem viewed from above before spine calibration, after spine calibration, and after smooth spine calibration.
Remotesensing 11 02781 g004
Figure 5. Tree stem points from one meter height interval viewed from the side in 3D (m) before spine calibration, after spine calibration, and after smooth spine calibration. The colours represent horizontal distance from center (mean value).
Remotesensing 11 02781 g005
Figure 6. DBH estimates based on stem sections (CFSR, i.e., circle fits of laser data within scan revolutions) with a link distance < 0.5 m and > 50 circle fits. The colour code represents link distance (m).
Remotesensing 11 02781 g006
Figure 7. DBH estimates based on stem profiles (CF3D, i.e., circle fits of laser data of the composed 3D point cloud) with a link distance < 0.5 m and > 20 height intervals with circle fits. The colour code represents link distance (m).
Remotesensing 11 02781 g007
Figure 8. Field plots used for validation with filled blue circles for detected tree and not filled red circles for not detected tree, the size of circles are proportional to stem diameter.
Remotesensing 11 02781 g008
Table 1. DBH estimates using restrictions for linking: for CFSR link distance <0.5 m and number of circle fits >50, for CF3D link distance <0.5 m and number of height intervals for circle fits >20.
PLOTRMSE (mm)Rel. RMSE (%)Bias (mm)Rel. Bias (%)
CFSRCF3DCFSRCF3DCFSRCF3DCFSRCF3D
11710956131
21515558−23−1
389344−32−1
41212654020
577444322
69954−1−4−1−2
Table 2. DBH estimates using restrictions for linking: link distance <0.5 m.
PLOTRMSE (mm)Rel. RMSE (%)Bias (mm)Rel. Bias (%)
CFSRCF3DCFSRCF3DCFSRCF3DCFSRCF3D
1181910107543
21515558−130
389344−32−1
428451422111959
577444322
6244114233724
Table 3. Proportion of linked trees using restrictions for linking: (A) for CFSR only link distance <0.5 m and number of circle fits >50 and for CF3D link distance <0.5 m and number of height intervals for circle fit >20, (B) link distance <0.5 m, (C) link distance 1.5 m used for tree-to-tree association. Also, number of manually measured trees (stem density) and proportion of not linked laser detected trees (commission).
PLOTLink A (%)Link B (%)Link C (%)Commission (%)Manual
CFSRCF3DCFSRCF3DCFSRCF3DCFSRCF3D
150465251595967171
27976797995953363
3939393931001002359
446336262686844132
589868989989822122
662497373797955169

